
Submitted:
23 May 2025
Posted:
23 May 2025
You are already at the latest version
Abstract
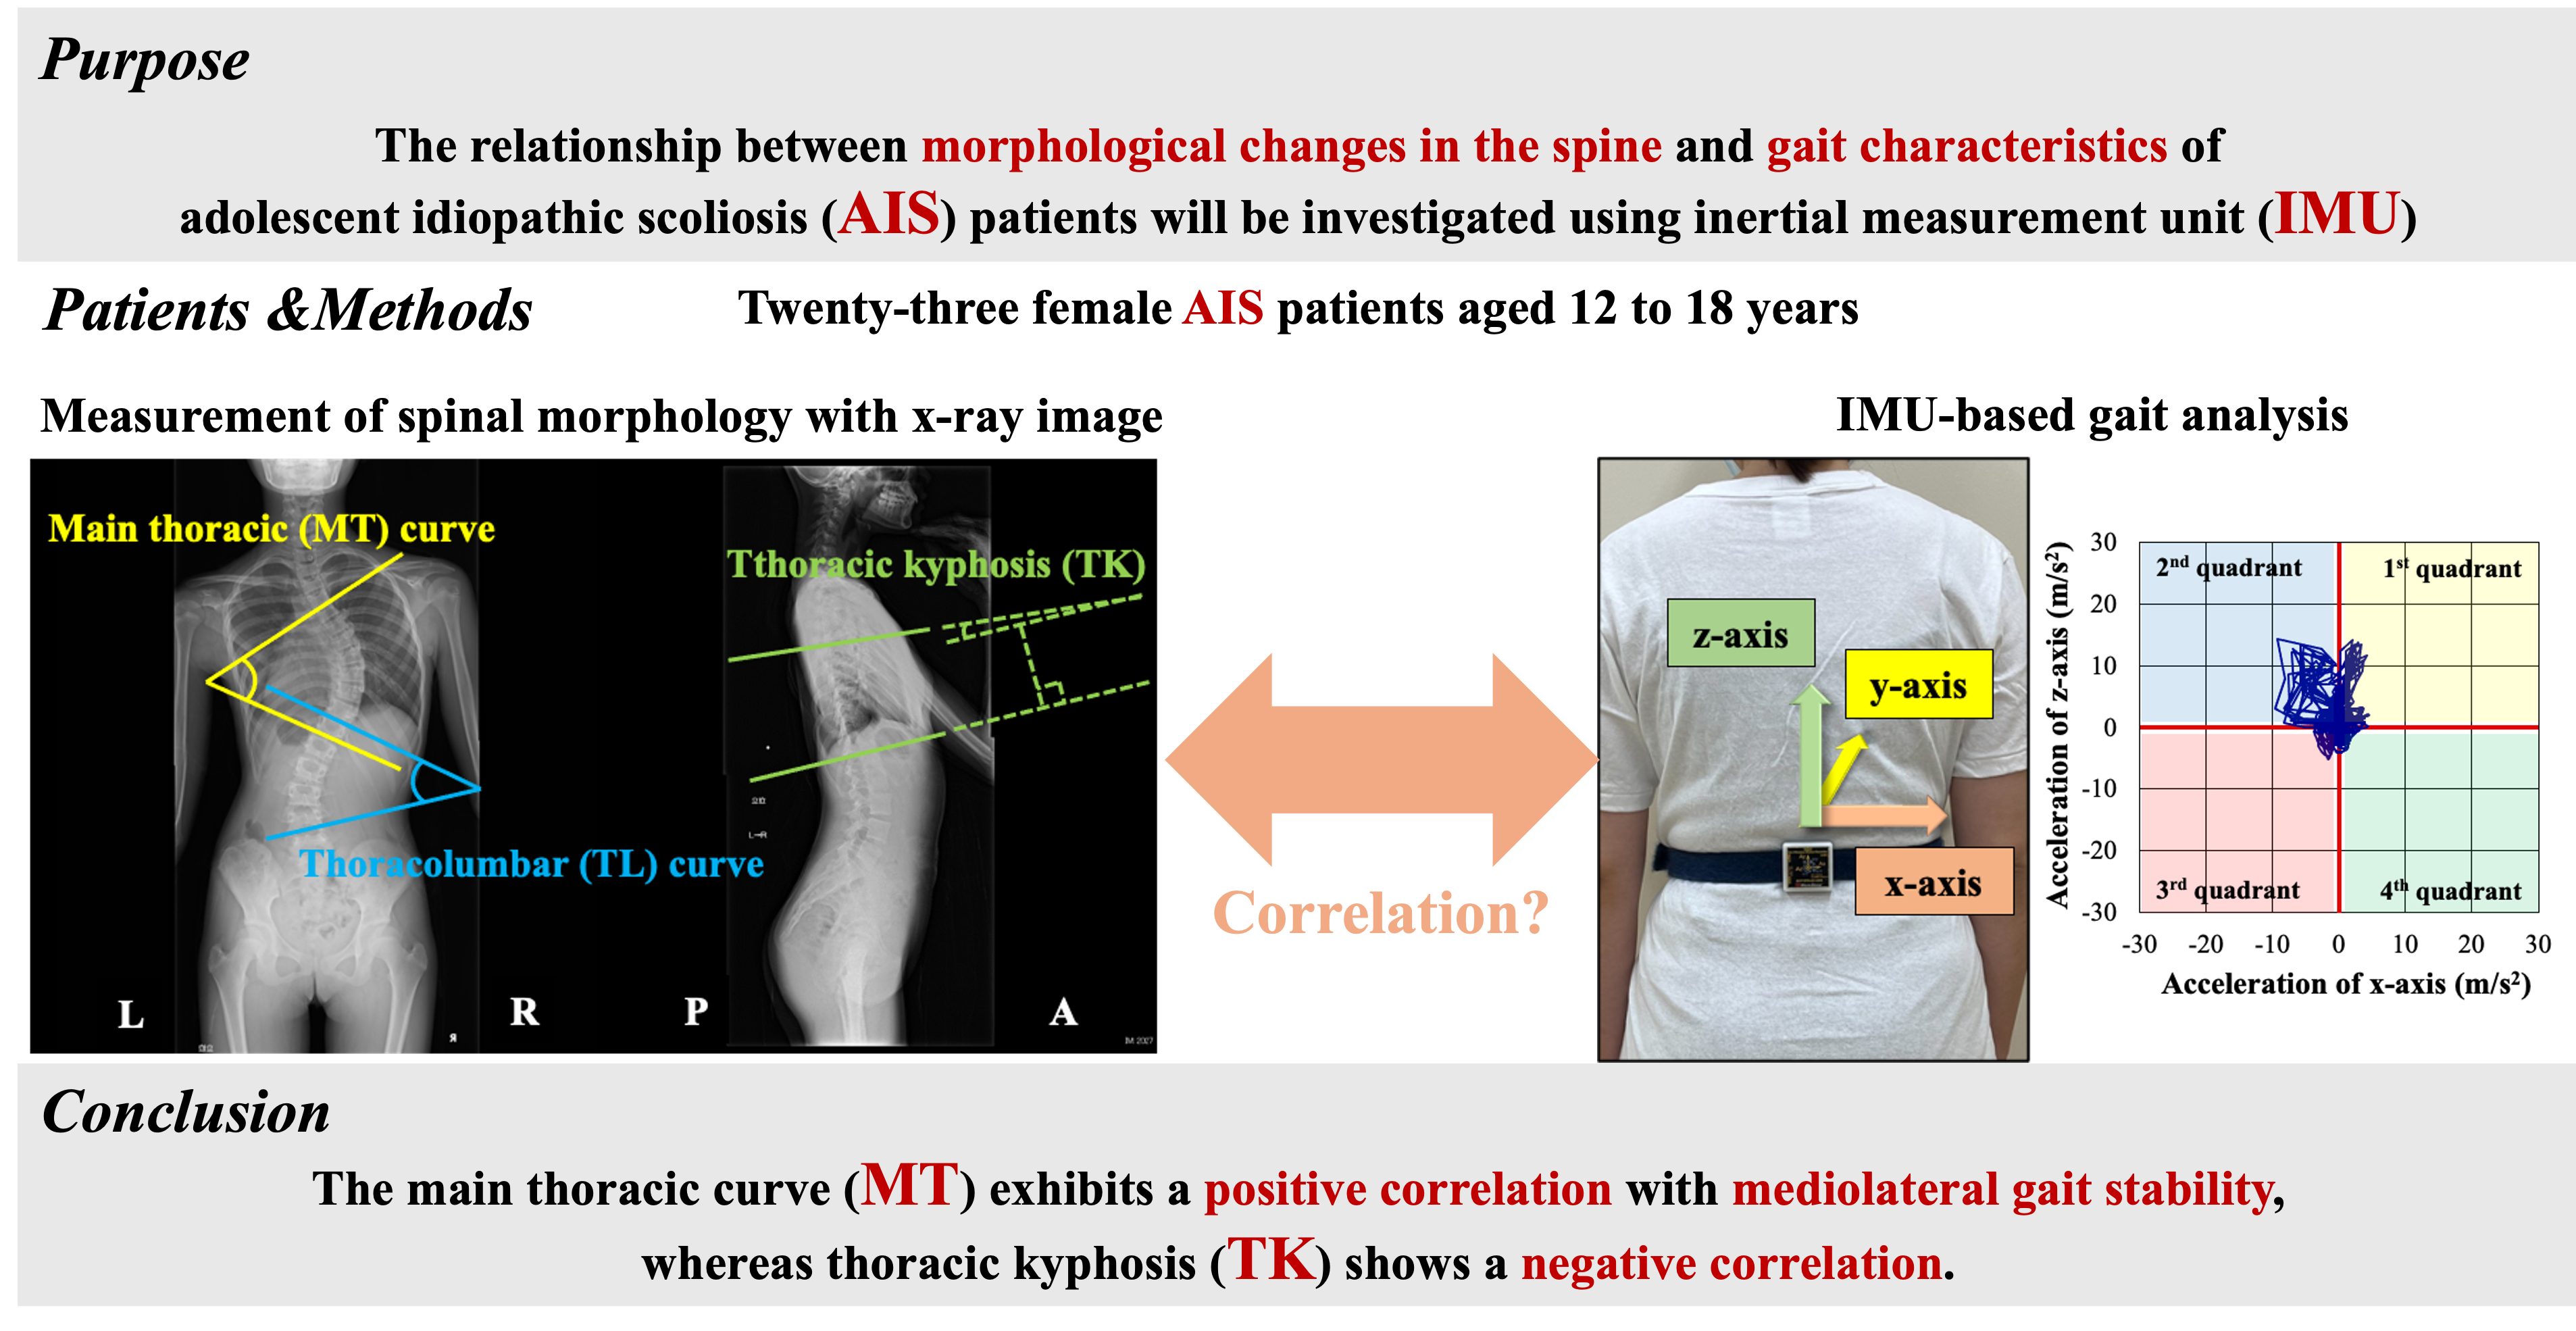
This study investigated the relationship between morphological changes in the spine and gait characteristics in patients with adolescent idiopathic scoliosis (AIS) through inertial measurement unit (IMU) analysis. Twenty-three female patients with AIS scheduled for scoliosis surgery underwent preoperative gait analysis with an IMU attached at the third lumbar vertebra. Gait stability indicators including root mean square (RMS) values for the mediolateral (RMSx), anteroposterior, and vertical components were calculated. The peak mediolateral components in the four coronal plane quadrants were also analyzed. Relationships with the main thoracic (MT) curve, thoracolumbar curve, and thoracic kyphosis (TK) were assessed using Spearman’s rank correlation. The MT curve positively correlated with RMSx, whereas TK exhibited a negative correlation. Gait symmetry analysis revealed a positive correlation between the MT curve and peak mediolateral trunk acceleration in the second (left-upper) quadrant and negative correlations for TK in the first (right-upper) and fourth (right-lower) quadrants. Patients with AIS with right-convex MT curves shifted their center of gravity leftward, but reduced TK restricted this compensation. These findings may be useful in developing the rehabilitation strategies for AIS.
Keywords:
adolescent idiopathic scoliosis
; spinal morphology
; gait analysis
; inertial measurement unit
1. Introduction
Adolescent idiopathic scoliosis (AIS) is characterized by a lateral spinal curvature that develops during growth, most commonly affecting adolescents aged 12–18 years. AIS is also marked by a lateral deviation of the spine, often accompanied with rotational deformities. It is particularly prevalent among females, and early diagnosis along with timely intervention is crucial because progressive AIS can lead to postural asymmetries and pain and even compromise cardiopulmonary function [1]. Its etiology remains largely unclear, although genetic predisposition, neurodevelopmental abnormalities, and hormonal influences are its contributing factors [2]. Asymmetrical bone growth and muscular imbalances during spinal development may play a role in scoliosis progression [3].
Conservative management through regular observation is typically recommended for mild scoliosis. As for more severe cases, orthotic intervention and surgical correction are considered. Surgical treatment primarily involves spinal correction and fixation, with corrective procedures being widely implemented [4]. Additionally, the efficacy of exercise-based interventions, such as the Schroth method and other conditioning approaches, tailored to individual patient needs have been increasingly investigated [5,6]. These therapeutic programs aim to enhance spinal flexibility, promote muscular balance, and improve trunk stability, effectively preventing scoliosis progression [7]. Early detection and intervention are particularly emphasized to reduce the likelihood of surgical intervention [8]. However, for exercise therapy to be optimally effective, individualized programs must be carefully designed according to the comprehensive assessment of spinal morphology and an in-depth understanding of the associated motor functions and movement patterns.
Center-of-gravity sway was reported to be increased in individuals with AIS compared with that in healthy controls, with a notable correlation between postural instability and the progression of thoracic spinal curvature [9,10]. Conversely, treatment strategies that aimed at improving gait patterns in patients with AIS have been explored, although the specific effects of physiotherapy, orthotic interventions, and surgical correction on gait mechanics remain controversial [11].
The inertial measurement unit (IMU) has been increasingly used in clinical physiotherapy for the quantitative and qualitative assessment of motor function [12]. The IMU offers minimal environmental constraints and is user-friendly, imposing a negligible physical or psychological burden on patients. Consequently, it facilitates longitudinal assessments at consistent intervals, providing valuable insights into the qualitative changes in motor function over time.
This study aimed to investigate the relationships between spinal morphological changes and gait characteristics in AIS using IMU and to evaluate their clinical applicability. The findings in this study may contribute to the expansion of treatment strategies and facilitate in the development of tailored rehabilitation programs based on disease severity, ultimately enhancing patient outcomes.
2. Subjects and Methods
2.1. Study Design and Participants
This single-center retrospective observational study was approved by the Ethics Committee of Oita University Faculty of Medicine (Approval No.: 2889). It included female patients with AIS aged 12–18 years who were hospitalized at the Department of Orthopedic Surgery, Oita University Hospital, for scoliosis correction surgery between August 2019 and May 2024. The exclusion criteria included the following: (1) presence of neurological symptoms caused by AIS that could affect motor function or quality of life (QOL); (2) presence of other orthopedic conditions that would likely impact motor function or QOL; and (3) a history or current diagnosis of central nervous system disorders. As a result, 23 cases were included, with a mean age of 14.1 ± 1.14 years (Table 1).
2.2. Spinal Morphometry Using X-ray Imaging
X-ray images of the standing position in the coronal and sagittal planes were used to classify the curve patterns according to the Lenke classification. As defined by the Scoliosis Research Society, the Lenke classification categorizes scoliosis into six curve types (Types 1–6) and incorporates lumbar modifiers (Types A, B, C) and sagittal thoracic modifiers (−, N, +) [13,14]. Additionally, three parameters indicative of spinal morphology were measured: the main thoracic (MT) curve, the thoracolumbar (TL) curve, and thoracic kyphosis (TK). These parameters were determined by calculating the angles formed at the intersection of two lines (Figure 1). In MT curve, the angle is formed by two tangential lines extending along the superior endplate of the uppermost vertebra and the inferior endplate of the lowermost vertebra within the thoracic region on the coronal plane [15]. The angle for the TL curve is formed by two tangential lines extending along the superior endplate of the uppermost vertebra and the inferior endplate of the lowermost vertebra in the thoracolumbar region on the coronal plane [15]. As for the TK, the angle is measured between two tangential lines extending along the superior endplate of the fifth thoracic vertebra and the inferior endplate of the 12th thoracic vertebra [16].
2.3. IMU Using Gait Analysis
An IMU (MVP-RF8-GC-2000, MicroStone, Japan) was attached at the third lumbar spinous process and the right calcaneal tuberosity. Participants were barefoot during the measurements. They walked at a comfortable speed along a 20 m walkway, which included a 5 m acceleration phase and a 5 m deceleration phase. Data were recorded at a sampling frequency of 200 Hz and transmitted in real-time to a personal computer via Bluetooth wireless technology. The IMU’s proper functioning was visually verified. After two trials, we used the data from the second trial for the analysis. Acceleration data from the trunk and right foot were extracted over 10 gait cycles.
The following gait parameters were computed using Microsoft Excel: stride-to-stride time variability (STV) from the acceleration data at the right calcaneal tuberosity to assess gait cycle variability, root mean square (RMS) from trunk acceleration data to evaluate gait stability, and the Lissajous index (LI) to quantify gait symmetry [12,17,18,19]. We computed the RMS separately for the mediolateral (RMSx), anteroposterior (RMSy), and vertical (RMSz) components. The overall gait instability was quantified by calculating the composite RMS (RMSt). Given that RMS is proportional to the square of the walking speed, it was adjusted by normalizing it to the squared walking speed, in line with previous studies [12,20]. Moreover, LI was computed in two planes: the coronal plane (LIcor) and the transverse plane (LItra). During Licor computation, we extracted the peak values of the mediolateral acceleration components in the first to fourth quadrants of the coronal plane (first: right-upper, second: left-upper, third: left-lower, fourth: right-lower), as observed from the posterior view (Figure 2). The computation methods are detailed below.
RMS
a(t): Acceleration signal; x: Mediolateral direction; y: Anteroposterior direction; z: Vertical direction; t: Total acceleration.
LI
R: rectangle area
STV
Mean: mean gait cycle duration; SD: standard deviation of the gait cycle duration.
2.4. Statistical Analyses
Statistical data were analyzed using GraphPad Prism version 9.3. The normality of the data was assessed using the Shapiro–Wilk test, which revealed that some data were not normally distributed. Therefore, the correlations between the three spinal morphological parameters (MT curve, TL curve, and TK) and the gait characteristics obtained from the IMU-based gait analysis were examined using Spearman’s rank correlation coefficient. The significance level was set at below 5%.
3. Results
3.1. Lenke Classification and Spinal Morphometry
Regarding the Lenke classification, types 1, 2, 3, 4, and 5 had 11 (A−: 1, AN: 3, B−: 2, BN: 4, CN: 1), 1 (BN: 1), 2 (B−: 1, CN: 1), 0, 5 (C−: 1, CN: 4), and 4 (C−: 2, CN: 2) cases, respectively (Table 2).
3.2. Gait Analysis
The gait speed during the IMU-based gait analysis (comfortable walking speed) was 1.21 ± 0.10 m/s (Table 2). The STV was 2.32% ± 1.14%. Measures of gait stability included RMSx at 0.89 ± 0.16 m/s², RMSy at 1.54 ± 0.25 m/s², RMSz at 1.58 ± 0.25 m/s², and RMSt at 2.39 ± 0.27 m/s². Additionally, the indices representing the symmetry of the center-of-mass displacement during gait were 16.1% ± 12.9% for LIcor and 17.8% ± 17.0% for LItra. Regarding the peak values of lateral acceleration in the frontal plane, the first, second, third, and fourth peaks were 5.06 ± 2.25, 5.32 ± 1.98, 3.47 ± 1.70, and 3.36 ± 1.12 m/s², respectively.
3.3. Correlation Between Spinal Morphometry and Gait Analysis
Table 3 lists the correlation coefficients and p-values for each pair of parameters obtained from the spinal morphometry and gait analysis. For the MT curve, RMSx (r =.536, p =.008) demonstrated significant positive correlations with the second peak (r =.463, p =.026) (Figure 3). For TK, RMSx (r = −.550, p =.007) showed significant negative correlations with the first peak (r = −.478, p =.021) and the fourth peak (r = −.517, p =.012) (Figure 4). Conversely, the TL curve exhibited no significant correlations with the gait analysis parameters.
4. Discussion
Regarding gait characteristics in patients with AIS, most of the previous studies primarily examined gait parameters such as speed and cadence but insufficiently explored the correlation of these parameters with spinal morphological changes. Accordingly, the present study constitutes one of the few kinematic analyses utilizing IMU to investigate the interplay between spinal morphology and gait characteristics in patients with AIS.
Gait instability analysis demonstrated that the MT curve had a significant positive correlation with both RMSx and the second peak value. Various factors, including aging and sensory impairments, contribute to heightened lateral instability during gait [21,22]. Additionally, impaired plantar sensory function, as observed in conditions such as stroke, exacerbates lateral sway during walking [23]. Given that this study examined young female subjects with AIS and no neurological impairments, spinal morphological changes could directly influence gait characteristics. In AIS, spinal deformities are characterized by frontal plane deviations, particularly in the MT and TL curves. Consequently, the center of mass (CoM) in the static posture may be displaced laterally, subsequently influencing CoM dynamics during movement. Notably, all of our participants presented with a right-convex MT curve, indicating a potential rightward CoM deviation. During gait, a pronounced MT curve may require greater compensatory lateral CoM shifts to maintain balance. The positive correlation between the MT curve and RMSx likely reflects this compensatory mechanism. The significant positive correlation between the MT curve and the second peak also supports this interpretation. Biomechanically, during the left stance phase of gait, the CoM must reposition within or near the base of support established by the left foot for balance maintenance. In a pronounced MT curve, a rightward-displaced CoM necessitates an amplified leftward shift during this phase, thereby elevating the second peak value. Patients with AIS reportedly have a reduced stance phase duration, further implying restrictions in the frontal plane CoM [24].
Conversely, the TL curve did not significantly correlate with gait instability. Meta-analyses and literature reviews on the gait characteristics of AIS indicate that pelvic and hip movements in the frontal plane during gait are diminished compared with those observed in healthy individuals [24,25]. Thus, the CoM displacement in AIS may be primarily compensated by the upper trunk, particularly the thoracic spine, rather than by the lower trunk, including the lumbar spine and pelvis. Therefore, the TL curve may have no direct influence on gait instability.
TK, which reflects morphological alterations in the sagittal plane, demonstrated a significant negative correlation with RMSx, the first peak value, and the fourth peak value. The relationship between sagittal plane alignment and gait characteristics in patients with AIS remains poorly explored compared with pelvic and hip alignment and their respective kinematics. Consequently, the present findings, which elucidate the association between TK and gait dynamics, provide valuable insights into this underexplored domain. Irrespective of AIS, kyphosis is the most prevalent abnormality of sagittal plane alignment. Kyphotic postural alterations, which are frequently linked to aging and osteoporosis, have been implicated in dynamic standing balance deteriorations, heightened postural sway, and gait instability [26,27]. Hence, sagittal plane alignment may play a pivotal role in gait disturbances. However, our study identified an association between reduced TK and increased lateral sway, possibly attributed to the diminished spinal mobility accompanying TK decrease. While direct evidence linking TK reduction to spinal mobility decline remains scarce, prior research supports this association. For instance, a study examined the interplay between spinal morphology and respiratory function in adult patients with AIS and identified MT curve flexibility—quantified as [(standing MT curve – lateral bending MT curve) ÷ standing MT curve × 100 (%)]—and TK as independent predictors of percent-predicted forced vital capacity (%FVC) and expiratory volume in 1 s (%FEV1.0) [28]. The correlation coefficients between TK and %FVC (r = 0.512, p < 0.001) and between TK and %FEV1.0 (r = 0.509, p < 0.001) indicate that TK reduction contributes to the diminished mobility of both the thoracic cage and the spine. Given the interrelationship between the MT curve, RMSx, and the second peak value, the lateral displacement of the CoM in patients with AIS is counterbalanced by the upper trunk movement. However, TK reduction, coupled with diminished mobility of the spine and thoracic cage, may impede compensatory mechanisms in the upper trunk. Consequently, the RMSx increases, and more specifically, the first and fourth peak values are augmented rather than the second peak, which typically serves as the primary compensatory direction.
This study has several limitations. First, the participants were patients hospitalized for surgical treatment; hence, they may have exhibited relatively severe morphological changes in the spine. Conversely, individuals with AIS who qualify for conservative management, such as exercise therapy, are typically in the early disease stage, presenting with only mild morphological alterations. Therefore, future research should include patients with milder cases who do not require surgical intervention. Furthermore, the present gait analysis derived an overall index for a single gait cycle without differentiating or analyzing its individual phases. To assess the effects of CoM deviations more comprehensively, future studies should incorporate phase-specific analyses of the gait cycle.
5. Conclusions
Given that the majority of MT curves in patients with AIS exhibit right convexity, our study findings suggest that gait is preserved through compensatory mechanisms, characterized by a pronounced leftward shift of the CoM, which is initially displaced to the right. TK reduction may constrain these compensatory mechanisms by reducing the spinal mobility. Although IMU-based clinical assessments proved beneficial, they inadequately captured detailed gait characteristics. These findings may be helpful in advancing movement guidance strategies and rehabilitation protocols for patients with AIS.
Author Contributions
Conceptualization, K.T. and Y. Tsubouchi; Methodology, K.T., Y. Takeo and Y. Tsubouchi; Gait Analysis, Y. Takeo and Y. Tsubouchi; X-ray Imaging evaluation, T.A., N.S. and M.M.; Data Measurement and Compilation, K.T., Y.Takeo, M.I., T.K., K.I. and Y. Tsubouchi; Writing – Original Draft Preparation, K.T.; Writing – Review & Editing, Y.T. and M.M.; Supervision, M.M.; Project Administration, N.K. All authors have read and agreed to the published version of the manuscript.
Funding
This research received no external funding.
Institutional Review Board Statement
The study was conducted according to the guidelines of the Declaration of Helsinki and was approved by the Ethics Committee of Oita University Faculty of Medicine (Approval No. 2889).
Informed Consent Statement
Written informed consent was obtained from the patients for the publication of this study. In cases where written consent could not be obtained, an opt-out method was used by disclosing information about the study on a publicly accessible website, thereby providing subjects with an opportunity to refuse participation.
Data Availability Statement
Data available on request due to restrictions (e.g., privacy, legal or ethical reasons)
Acknowledgments
We sincerely appreciate the invaluable cooperation of the staff at the Oita University Hospital Rehabilitation Center in facilitating the gait analysis and other data measurements for this study.
Conflicts of Interest
The authors declare no conflict of interest.
References
- Weinstein, S.L.; Dolan, L.A.; Cheng, J.C.; Danielsson, A.; Morcuende, J.A. Adolescent idiopathic scoliosis. Lancet 2008, 371, 1527–1537. [Google Scholar] [CrossRef]
- Grauers, A.; Einarsdottir, E.; Gerdhem, P. Genetics and pathogenesis of idiopathic scoliosis. Scoliosis Spinal Disord. 2016, 11, 45. [Google Scholar] [CrossRef]
- Horne, J.P.; Flannery, R.; Usman, S. Adolescent Idiopathic scoliosis: Diagnosis and management. Am. Fam. Physician 2014, 89, 193–198. [Google Scholar]
- Yang, H.; Jia, X.; Hai, Y. Posterior minimally invasive scoliosis surgery versus the standard posterior approach for the management of adolescent idiopathic scoliosis: An updated meta-analysis. J. Orthop. Surg. Res. 2022, 17, 58. [Google Scholar] [CrossRef]
- Seleviciene, V.; Cesnaviciute, A.; Strukcinskiene, B.; Marcinowicz, L.; Strazdiene, N.; Genowska, A. Physiotherapeutic scoliosis-specific exercise methodologies used for conservative treatment of adolescent idiopathic scoliosis, and their effectiveness: An extended literature review of current research and practice. Int. J. Environ. Res. Public Health 2022, 19, 9240. [Google Scholar] [CrossRef]
- Oba, H.; Watanabe, K.; Asada, T.; Matsumura, A.; Sugawara, R.; Takahashi, S.; Ueda, H.; Suzuki, S.; Doi, T.; Takeuchi, T. Effects of physiotherapeutic scoliosis-specific exercise for adolescent idiopathic scoliosis cobb angle: A systematic review. Spine Surg. Relat. Res. 2024, 9, 120–129. [Google Scholar] [CrossRef]
- Weiss, H.-R.; Moramarco, M.M.; Borysov, M.; Ng, S.Y.; Lee, S.G.; Nan, X.; Moramarco, K.A. Postural rehabilitation for adolescent idiopathic scoliosis during growth. Asian Spine J. 2016, 10, 570–581. [Google Scholar] [CrossRef]
- Negrini, S.; Donzelli, S.; Aulisa, A.G.; Czaprowski, D.; Schreiber, S.; de Mauroy, J.C.; Diers, H.; Grivas, T.B.; Knott, P.; Kotwicki, T. 2016 SOSORT guidelines: Orthopaedic and rehabilitation treatment of idiopathic scoliosis during growth. Scoliosis Spinal Disord. 2016, 13, 3. [Google Scholar] [CrossRef]
- Higuchi, J.; Tajima, N.; Hirakawa, S.; Satoh, K. Gravity sway in idiopathic scoliosis [tokuhatsusei sokuwan-shō ni okeru heikō kinō no kaiseki]. Seikei Geka to Saigai Geka 1993, 42, 1487–1489. [Google Scholar] [CrossRef]
- Nault, M.-L.; Allard, P.; Hinse, S.; Le Blanc, R.; Caron, O.; Labelle, H.; Sadeghi, H. Relations between standing stability and body posture parameters in adolescent idiopathic scoliosis. Spine 2002, 27, 1911–1917. [Google Scholar] [CrossRef]
- Paul, J.C.; Patel, A.; Bianco, K.; Godwin, E.; Naziri, Q.; Maier, S.; Lafage, V.; Paulino, C.; Errico, T.J. Gait stability improvement after fusion surgery for adolescent idiopathic scoliosis is influenced by corrective measures in coronal and sagittal planes. Gait Posture 2014, 40, 510–515. [Google Scholar] [CrossRef] [PubMed]
- Moe-Nilssen, R. Test-retest reliability of trunk accelerometry during standing and walking. Arch. Phys. Med. Rehab. 1998, 79, 1377–1385. [Google Scholar] [CrossRef] [PubMed]
- Lenke, L.G.; Betz, R.R.; Harms, J.; Bridwell, K.H.; Clements, D.H.; Lowe, T.G.; Blanke, K. Adolescent idiopathic scoliosis: A new classification to determine extent of spinal arthrodesis. JBJS 2001, 83, 1169–1181. [Google Scholar] [CrossRef]
- Slattery, C.; Verma, K. Classifications in brief: The lenke classification for adolescent idiopathic scoliosis. Clin. Orthop. Relat. Res. 2018, 476, 2271–2276. [Google Scholar] [CrossRef]
- Malfair, D.; Flemming, A.K.; Dvorak, M.F.; Munk, P.L.; Vertinsky, A.T.; Heran, M.K.; Graeb, D.A. Radiographic evaluation of scoliosis: Review. Am. J. Roentgenol. 2010, 194, S8–S22. [Google Scholar] [CrossRef]
- Severijns, P.; Moke, L.; Overbergh, T.; Beaucage-Gauvreau, E.; Ackermans, T.; Desloovere, K.; Scheys, L. Dynamic sagittal alignment and compensation strategies in adult spinal deformity during walking. Spine J. 2021, 21, 1059–1071. [Google Scholar] [CrossRef]
- Menz, H.B. Age-related differences in walking stability. Age Ageing 2003, 32, 137–142. [Google Scholar] [CrossRef]
- Hausdorff, J.M.; Rios, D.A.; Edelberg, H.K. Gait variability and fall risk in community-living older adults: A 1-year prospective study. Arch. Phys. Med. Rehab. 2001, 82, 1050–1056. [Google Scholar] [CrossRef]
- Yamaguchi, R.; Hirata, S.; Doi, T.; Asai, T.; Inoue, J.; Makiura, D.; Ando, H.; Kurosaka, M.; Miura, Y. The usefulness of a new gait symmetry parameter derived from lissajous figures of tri-axial acceleration signals of the trunk. J. Phys. Ther. Sci. 2012, 24, 405–408. [Google Scholar] [CrossRef]
- Sekine, M.; Tamura, T.; Yoshida, M.; Suda, Y.; Kimura, Y.; Miyoshi, H.; Kijima, Y.; Higashi, Y.; Fujimoto, T. A gait abnormality measure based on root mean square of trunk acceleration. J. Neuroeng. Rehabil. 2013, 10, 118. [Google Scholar] [CrossRef]
- Dean, J.C.; Alexander, N.B.; Kuo, A.D. The effect of lateral stabilization on walking in young and old adults. IEEE Trans. Biomed. Eng. 2007, 54, 1919–1926. [Google Scholar] [CrossRef] [PubMed]
- Allum, J.H.J.; Oude Nijhuis, L.B.; Carpenter, M.G. Differences in coding provided by proprioceptive and vestibular sensory signals may contribute to lateral instability in vestibular loss subjects. Exp. Brain Res. 2008, 184, 391–410. [Google Scholar] [CrossRef]
- Yamamoto, S. Gait analysis of patients with cerebrovascular disease [Nōkekkan shōgai no hokō bunseki]. Rigakuryoho Kagaku 2002, 17, 3–10. [Google Scholar] [CrossRef]
- Kim, D.S.; Park, S.H.; Goh, T.S.; Son, S.M.; Lee, J.S. A meta-analysis of gait in adolescent idiopathic scoliosis. J. Clin. Neurosci. 2020, 81, 196–200. [Google Scholar] [CrossRef]
- Daryabor, A.; Arazpour, M.; Sharifi, G.; Bani, M.A.; Aboutorabi, A.; Golchin, N. Gait and energy consumption in adolescent idiopathic scoliosis: A literature review. Ann. Phys. Rehabil. Med. 2017, 60, 107–116. [Google Scholar] [CrossRef]
- Narita, M.; Okada, S.; Koizumi, D.; Kitabayashii, Y.; Kato, Y.; Takeshima, N. Comparison of static and dynamic balance between middle-aged and elderly women [Seiteki oyobi dōteki baransu nō no karei ni yoru eikyō: Chūnen to kōnen josei no hikaku kara]. Rigakuryoho Kagaku 2015, 30, 627–633. [Google Scholar] [CrossRef]
- Morifuji, T.; Shimada, T.; Sakamoto, R.; Ogura, A.; Ueno, T.; Kanazawa, A. Relationship of spinal mobility in extension with balance and walking ability in patients with kyphosis [Sekichū kōwan henkei kanja ni okeru sekichū shinten kadōsei to baransu, hokō nōryoku to no kankei]. Rigakuryoho Kagaku 2010, 25, 735–739. [Google Scholar] [CrossRef]
- Ohashi, M.; Watanabe, K.; Hirano, T.; Hasegawa, K.; Katsumi, K.; Shoji, H.; Mizouchi, T.; Endo, N. Flexibility of the thoracic curve and three-dimensional thoracic kyphosis can predict pulmonary function in nonoperatively treated adult patients with adolescent idiopathic scoliosis. J. Orthop. Sci. 2020, 25, 551–556. [Google Scholar] [CrossRef]
Figure 1.
Measurement of spinal morphology with an X-ray image. In a standing posterior-anterior radiograph, the angle consists of two intersecting lines: the upper endplate of the main thoracic (MT) curve upper vertebra and the lower endplate of the MT curve lower vertebra. The thoracolumbar (TL) curve is also measured in the lumbar spine in the same way as the MT curve. In the sagittal plane, thoracic kyphosis (TK) covers T5 to T12. In a standing X-ray lateral image, the angle includes two perpendicular lines: the upper endplate of the T5 vertebra and the lower endplate of T12.
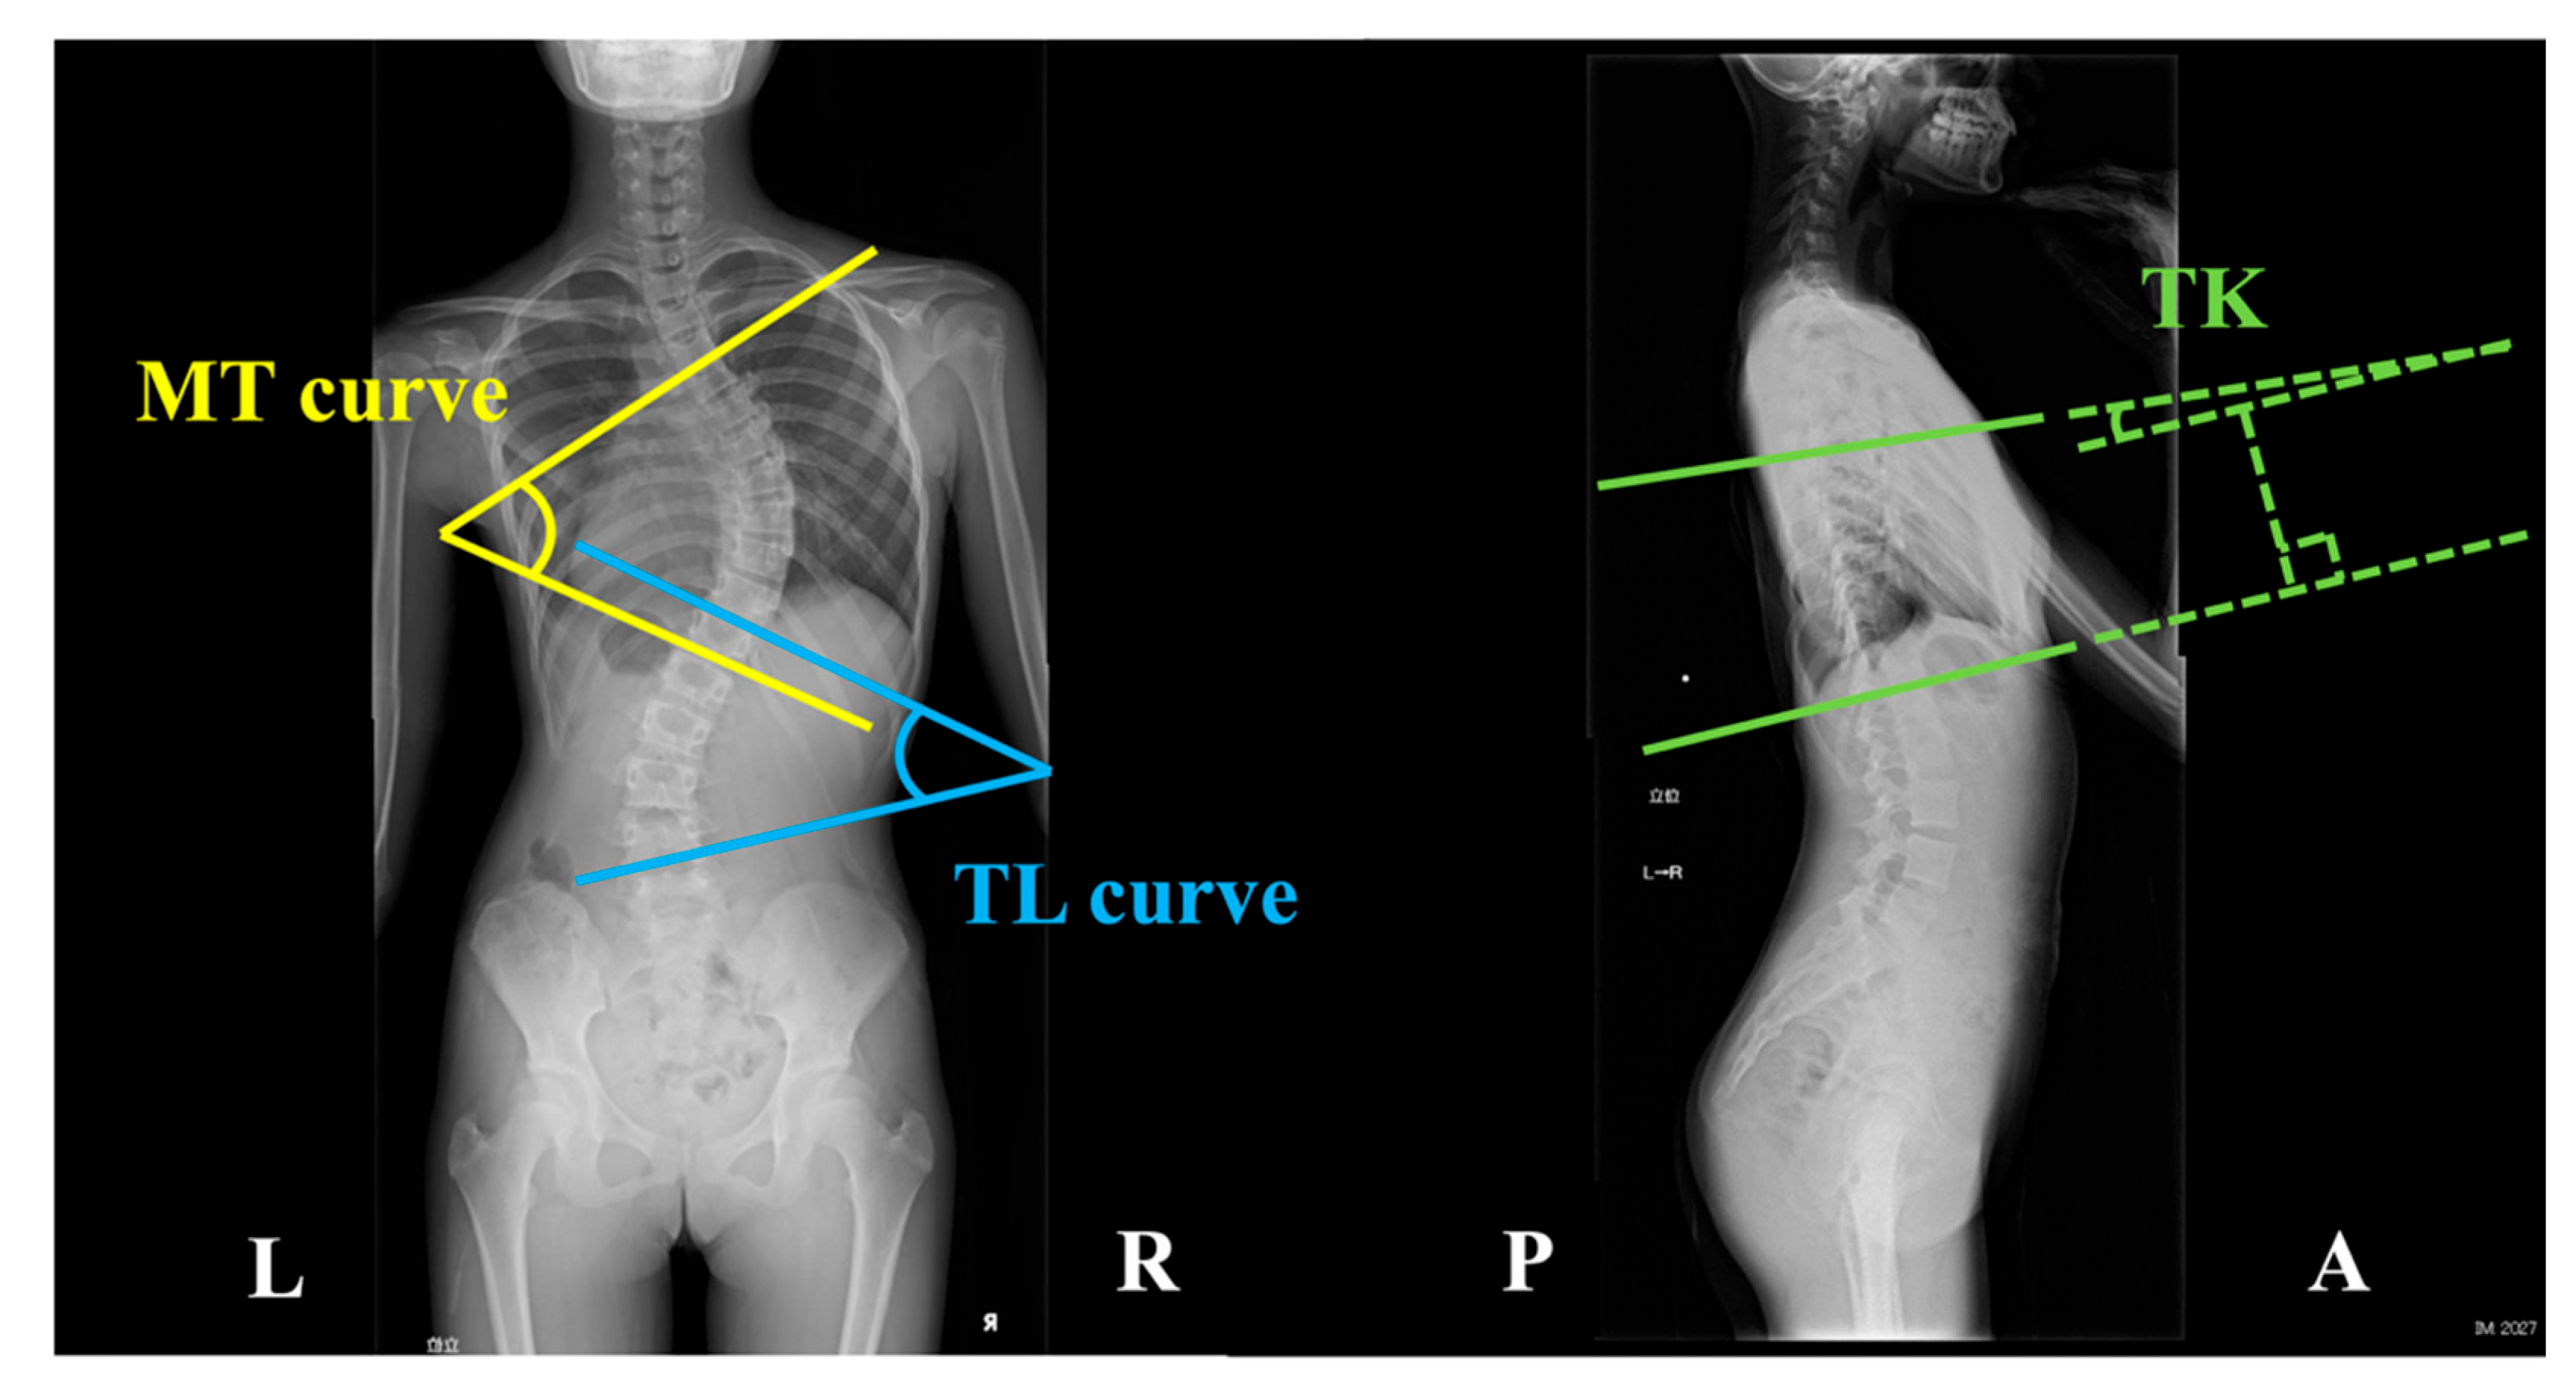
Figure 2.
Attachment of IMU and four quadrants with the frontal plane observed from the back. The x-axis represents the mediolateral direction, the y-axis denotes the anteroposterior direction, and the z-axis signifies the vertical direction (A). When observing the coronal plane from the back, it delineates as per the Cartesian coordinate system (B). IMU: inertial measurement unit.

Figure 3.
Correlation between the MT curve and RMS, as well as peak acceleration in the mediolateral direction relative to the frontal plane. A positive correlation was observed between the MT curve and RMSx (A). Similarly, a positive correlation with peak acceleration in the mediolateral direction in the second quadrant relative to the frontal plane was observed (B). MT curve: main thoracic curve, RMS: root mean square, x: mediolateral direction.

Figure 4.
Correlation between the MT curve and RMS, as well as peak acceleration in the mediolateral direction relative to the frontal plane. A negative correlation was observed between the MT curve and RMSx (A). Similarly, a negative correlation with peak acceleration in the mediolateral direction in the first and fourth quadrants relative to the frontal plane was observed (B). TK: thoracic kyphosis, RMS: root mean square, x: mediolateral direction.
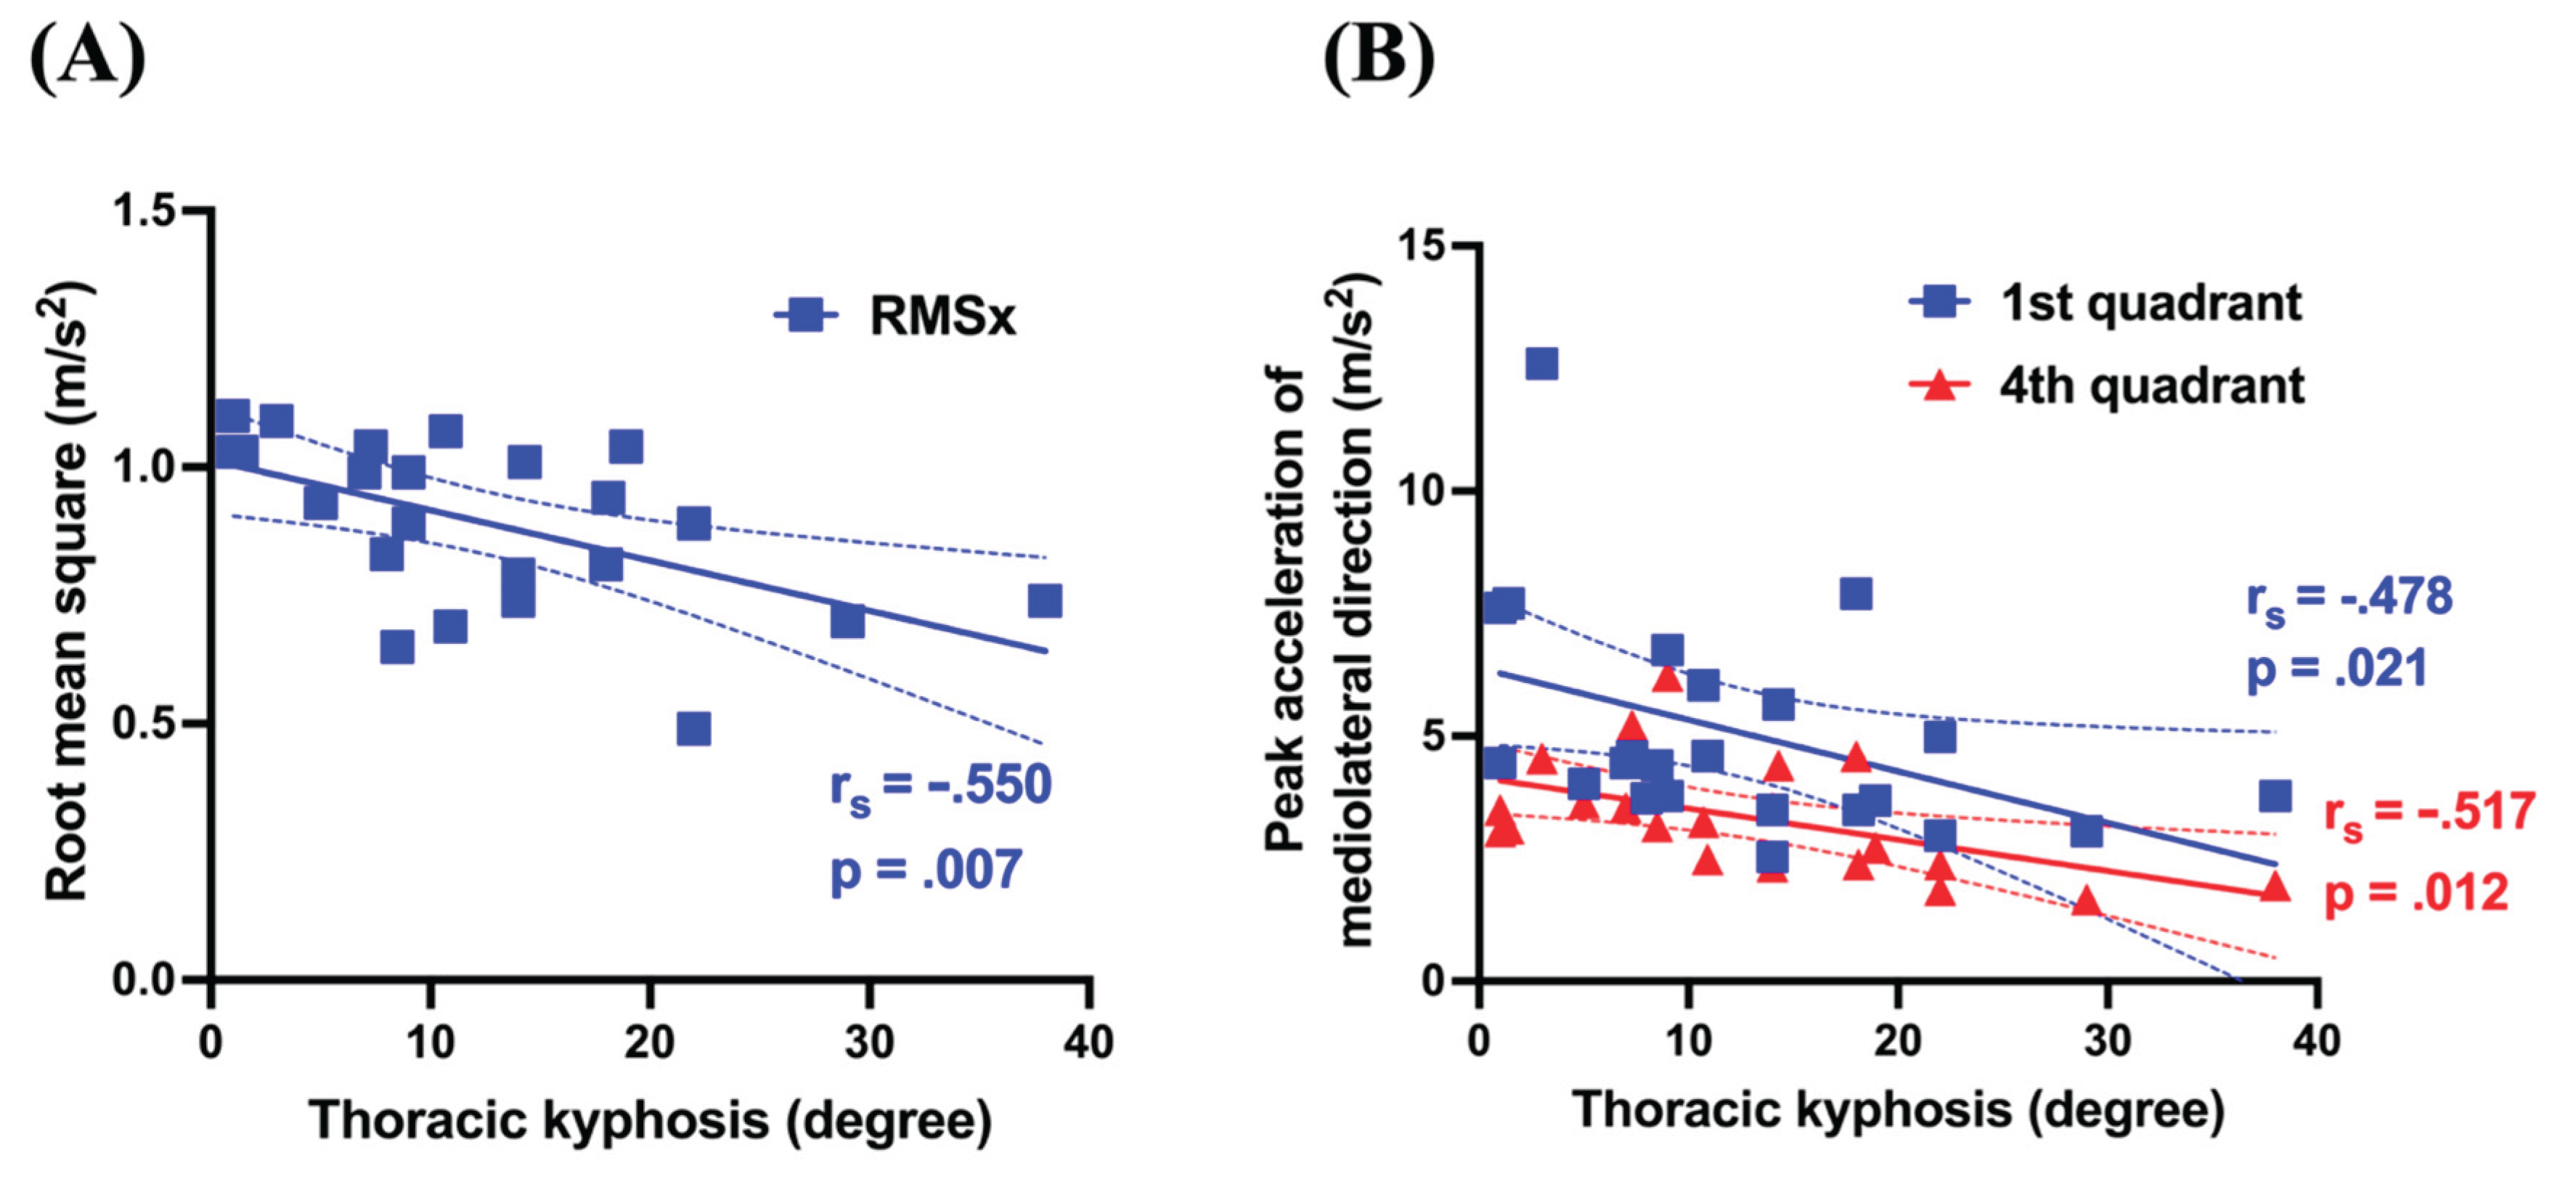

Table 1.
Participant characteristics.
| n | 23 |
|---|---|
| Sex (Male : Female) | 0 : 23 |
| Age (years) | 14.1 ± 1.14 |
| High (m) | 1.54 ± 0.09 |
| Weight (kg) | 43.7 ± 6.38 |
| BMI (kg/m2) | 18.4 ± 1.72 |
BMI: Body mass index. Average ± standard deviation.
Table 2.
Results of radiological parameters and gait analysis using IMU.
| Lenke classification | |
|---|---|
| Type 1 (A- : AN : B- : BN : CN) | 11 (1 : 3 : 2 : 4 : 1) |
| Type 2 (BN) | 1 (1) |
| Type 3 (B- : CN) | 2 (1 : 1) |
| Type 4 | 0 |
| Type 5 (C- : CN) | 5 (1 : 4) |
| Type 6 (C- : CN) | 4 (2 : 2) |
| Spinal morphological alterations | |
| Main thoracic curve (degree) | 39.1 ± 10.1 |
| Thoracolumbar curve (degree) | 33.8 ± 10.7 |
| Thoracic kyphosis (degree) | 12.6 ± 9.2 |
| Comfortable gait speed (m/s) | 1.21 ± 0.10 |
| Stride-to-stride Time Variability (%) | 2.32 ± 1.14 |
| Root mean square (RMS) | |
| x: Mediolateral direction (m/s2) | 0.89 ± 0.16 |
| y: Anteroposterior direction (m/s2) | 1.54 ± 0.25 |
| z: Vertical direction (m/s2) | 1.58 ± 0.25 |
| t: RMS vector magnitude of three direction (m/s2) | 2.39 ± 0.27 |
| Lissajous index | |
| Coronal (%) | 16.1 ± 12.9 |
| Transversal (%) | 17.8 ± 17.0 |
| Peak acceleration of mediolateral direction with the frontal plane#1 | |
| 1st quadrant (m/s2) | 5.06 ± 2.25 |
| 2nd quadrant (m/s2) | 5.32 ± 1.98 |
| 3rd quadrant (m/s2) | 3.47 ± 1.70 |
| 4th quadrant (m/s2) | 3.36 ± 1.12 |
Average ± standard deviation. #1: The four quadrants are divided by the frontal plane observed from back. IMU: inertial measurement unit. Spinal morphometric analysis revealed that the MT curve was 39.1° ± 10.1°, the TL curve was 33.8° ± 10.7°, and TK was 12.6° ± 9.2°.
Table 3.
Correlation coefficients between radiological parameters and gait analysis using IMU.
| MT | TL | TK | |
|---|---|---|---|
| Comfortable gait speed | .300 (.164) | -.190 (.386) | .166 (.451) |
| Stride-to-stride Time Variability | .046 (.835) | -.023 (.915) | -.108 (.625) |
| Root mean square (RMS) | |||
| x: Mediolateral direction | .536 (.008) | -.288 (.183) | -.550 (.007) |
| y: Anteroposterior direction | .349 (.103) | -.109 (.622) | .019 (.930) |
| z: Vertical direction | -.056 (.800) | .062 (.778) | .121 (.582) |
| t: RMS vector magnitude of three direction | .294 (.173) | -.134 (.543) | -.075 (.733) |
| Lissajous index | |||
| Coronal | .223 (.305) | -.065 (.769) | -.167 (.446) |
| Transversal | .367 (.085) | -.052 (.814) | -.017 (.939) |
| Peak acceleration of mediolateral direction with the frontal plane#1 | |||
| 1st quadrant | .377 (.076) | -.283 (.190) | -.478 (.021) |
| 2nd quadrant | .463 (.026) | -.125 (.570) | -.187 (.393) |
| 3rd quadrant | .387 (.068) | -.254 (.243) | -.288 (.182) |
| 4th quadrant | .361 (.090) | -.048 (.829) | -.517 (.012) |
Spearman's rank correlation explored relationships. Figures in brackets indicate p-value. #1: The four quadrants are divided by the frontal plane observed from back. IMU: inertial measurement unit, MT: Main thoracic curve, TL: Thoracolumbar curve, TK: Thoracic kyphosis.
Disclaimer/Publisher’s Note: The statements, opinions and data contained in all publications are solely those of the individual author(s) and contributor(s) and not of MDPI and/or the editor(s). MDPI and/or the editor(s) disclaim responsibility for any injury to people or property resulting from any ideas, methods, instructions or products referred to in the content. |
© 2025 by the authors. Licensee MDPI, Basel, Switzerland. This article is an open access article distributed under the terms and conditions of the Creative Commons Attribution (CC BY) license (http://creativecommons.org/licenses/by/4.0/).
Copyright: This open access article is published under a Creative Commons CC BY 4.0 license, which permit the free download, distribution, and reuse, provided that the author and preprint are cited in any reuse.


