
Submitted:
21 May 2025
Posted:
26 May 2025
You are already at the latest version
Preprints on COVID-19 and SARS-CoV-2
Abstract
Aim: The aim of the present study was to analyze a panel of immune-related miRNAs found in the respiratory tract among patients with symptomatic COVID-19. Method: This is a cross-sectional analysis on the total levels of selected miRNAs assessed from peripheral blood mononuclear cells of 33 male and female patients split according to a mild/moderate (n = 9) or a severe/critical phenotype (n = 24). Low molecular weight RNA was obtained the 10 miRNAs (miR-1-2, miR-10a, miR-92a, miR-100, miR-145, miR-146a, miR-155, miR-181a, miR-200a, miR-221) were quantified using specific TaqMan® RT-qPCR assays. Results: The main results indicate a negative correlation for miR-92a expression levels with oxygen saturation scores. In a direct comparison, there was a significant difference in concentrations of log-transformed levels of miR-92a (p=0.046) between groups, with higher values shown by the mild/moderate group. Conclusions: These findings revealed that the severity of COVID-19 is associated with differences in the expression of miR-92a, possibly due to an anti-inflammatory regimen that, despite being clinically useful, may yield this adverse outcome of oxygen deprivation.
Keywords:
COVID-19
; SARS-CoV-2
; MicroRNAs
; inflammation
; treatment
; dexamethasone
Highlights What are the main findings?
- Individuals with severity of COVID-19 is associated with differences in the expression of miR-92a.
What is the implication of the main finding?
- It is important to study the role of circulating miRNAs as agents or markers of severe immune/thrombotic dysfunction and clinical response to SARS-CoV-2 infection.
Introduction
The severe acute respiratory syndrome coronavirus 2 (SARS-CoV-2) was responsible for over 71 million cases coronavirus 2019 infection (COVID-19) and for more than 6,6 million deaths in 2023 and infection more than 651 million [1,2,3,4]. SARS-CoV-2 is a single-stranded enveloped RNA pathogen belonging to beta Coronaviridae family [5,6].
Early symptoms associated to SARS-Cov-2 infection (fever, dry cough, headache and fatigue) as well as symptoms with late onset (sore throat, myalgia, olfactory changes and dyspnea) tend to be similar to those from influenza or other respiratory infections, making the differential diagnosis difficult [1].
During the initial phase of disease, the virus kills T lymphocytes and decrease the body's immune response. Later, damage to pulmonary cells is produced by in situ overstimulation of subsets of T lymphocytes, leading to a systemic decrease in oxygen diffusion capacity and consequent decrease in oxygen uptake that can result in death [7,8].
Since the onset of the pandemic, research groups try to understand the biological and molecular mechanisms that take place within cells during an infection by SARS-CoV-2, so to unveil the pathophysiology of the disease and identify virulence factors [9]. Possible biomarkers of fundamental importance may arise as predictors or therapeutic targets [9]. MicroRNAs (miRNAs) emerge as candidates for functional biomarkers due to their regulatory role on several gene targets, including immunity-related genes and elements on other functions [10]. Apart from the usual role as suppressor of protein production by silencing or degradation of messenger RNAs [11], dysregulated availability of these small non-coding RNAs is also directly associated with pathological development of several chronic diseases and also with viral infections [12,13].
In general, the role of miRNAs in the pathophysiology of most viral diseases is still poorly understood. Recent reports show a possible antiviral action of miRNAs by inhibiting translation as well as preventing replication of viral genome as a direct response to dysregulation of certain miRNAs [14]. Evidence shows that miRNAs can trigger this antiviral function by directly binding to the viral genome, to viral transcripts and/or to host transcripts [15] as mechanisms that promote a host antiviral response [16].
Since COVID-19 tends to remain as a major public health threat worldwide, it is of fundamental importance that miRNAs are studied as they can play an important role in regulation and treatment of viral infections [16]. Thus, the main objective of present study was to analyze the total levels of selected miRNAs among symptomatic patients infected with SARS-CoV-2 in midwestern Brazil.
Methods
Experimental Design and Sample
The trial’s general description is described elsewhere [17]. Briefly, this is a cross-sectional analyses that employed samples from patients admitted at the Hospital of the University of Brasília, in the Brazilian Federal District, between April and October of 2020, during the first peak of the COVID-19 in the Midwest of Brazil A sample of 33 male and female symptomatic patients diagnosed with COVID-19 that donated circulating mononuclear cells (source of miRNAs) were split according to a mild/moderate (n = 9) or a severe/critical phenotype (n = 24). All patients were monitored in-hospital for 18 days and released after clinical discharge.
PBMCs Extraction
Peripheral blood mononuclear cells (PBMCs) were isolated using Ficoll® Paque Plus (GE Healthcare Bio Sciences AB, Uppsala, Sweden) by a gradient centrifugation method, with whole blood samples processed by centrifugation (1,900 g for 10 minutes at 22°C) and then processed immediately following routine procedures as described elsewhere [18]. Cryopreservation of 104-105 cells/ml occurred at -80°C immediately after obtention for posterior microRNA extraction [19].
Extraction of Low Molecular Weight RNA
Low molecular weight RNA was purified using the mirVANA Paris Kit (Thermo Fisher Scientific, Waltham, MA, USA) following the manufacturer's protocol with the modification of using multiple (2 or 3) consecutive partitions of the lysate with phenol-chloroform (Invitrogen, USA), as necessary. 700 µL aliquots of PBMC were slowly thawed in ice bath for cell disruption and subsequent processing. After purification, RNA was quantified using a spectrophotometer (NanoDrop 2000/2000c, Thermo Fisher Scientific) and quality control was assessed by an 260/280 nm OD ration. Samples were stored at -20°C until final usage.
MicroRNA Selection
To select the set of miRNAs to be investigated, we used an approach based on bioinformatics. Initially, the DIANA Tools (TarBase v8.0) was searched for miRNAs experimentally validated as interacting with target genes linked to the immune responses in the lower respiratory tract, focusing on genes encoding key signaling proteins as interleukin(IL)-1β IL-2, IL-3, IL-4, IL 6, IL-8, IL-10, IL-12, interferon-gamma (IFN-γ) and tumor necrosis factor (TNF).
A manual search was performed by entering each gene name individually, and human(hsa)-miRNAs were eligible for study if the database reported an association (positive result) and had the lung specified as source tissue. From the list of miRNAs yielded, a subsequent Kyoto Encyclopedia of Genes and Genomes (KEGG) analysis allowed narrowing the selection to 10 miRNAs (miR-1-2, miR-10a, miR-92a, miR-100, miR-145, miR-146a, miR-155, miR-181a, miR-200a, miR-221) based on the selection of pathways implicated with the Immune system.
Relative Quantification of MiRNAs by qPCR Analysis
First, all samples were set at 25 ng/µL. cDNA was prepared using the microRNA Reverse Transcription (RT) kit (Thermo Fisher Scientific), following the manufacturer's protocol. The miRNAs studied, were quantified using commercially available stem-loop TaqMan® RT-qPCR miRNA assays (Thermo Fisher Scientific, Foster City, CA, USA) on a QuantStudio 1 thermocycler and the software QuantStudio™ design Analysis v 1.5.1 according the manufacturer’s protocol. Reactions were performed with denaturation at 50°C for 2 min and at 95°C for 10 min followed by cycling at 95°C for 15 s and at 60°C for 1 min for 50 cycles. Relative quantification was calculated by the 2−ΔΔCt method [20] using an specific assay for the RNU48 as endogenous control, eligible based on current use of this family of small RNAs to normalize miRNA expression in blood samples [21], with titers assessed for stability across samples by comparing cycle thresholds (ΔCt). All assessments were performed as single reactions.
Statistical Analyses
Initially, the Shapiro-Wilk test was performed to verify data distribution. To verify how clinical traits varied across the subjects grouped according to the severity of the SARS-CoV-2 infection, the Student’s t test was used to compare normally distributed data whereas the Mann-Whitney test and the Chi-square test were used for the non-normal and the categorical data, respectively.
Concerning the miR expression, the association between continuous, normally distributed variables was evaluated using the Pearson’s correlation test, whereas the involvement of a least one categorical or non-normally distributed continuous variable was dealt using the Spearman correlation test. For categorical traits, absence or presence of a given feature was represented by 0 or 1, respectively. Whenever a possibility of interaction was noticed, correlation analyses were run using adjustment for variable(s) or condition(s) found unequal across groups.
Finally, a logarithmic transformation of miRs concentrations and comparisons between groups through with t-test for independent samples were performed. Normal data were expressed as mean and standard deviation whereas non-normal data were expressed as median and interquartile range and categorical traits as proportions. Data were analyzed using the Statistical Package for the Social Sciences (SPSS) software version 23 with a two-tailed P value set at ≤ 0.05 as significance threshold.
Results
For the purpose of analyzes, the final sample consisted of 33 patients. Table 1 describes the clinical conditions of investigated patients. There were significant differences between groups, with patients that evolved into a severe/critical condition being more than 10 years older in average. As expected, oxygen saturation (SpO2) scores reached lower mean levels whereas the absolute count of symptoms was higher for the severe/critical group.
There was an important difference in the amount and in the profile of medication intake across groups, being worth mentioning that patients with severe/critical COVID-19 almost unanimously (n = 23) adhered to a drug regimen that combined dexamethasone, azithromycin and oseltamivir, while patients with mild/moderate symptoms were mostly users of ivermectin and/or dipyrone. Also, a greater frequency of chronic conditions among severe/critical patients was noteworthy, including the significantly higher prevalence of T2DM. There was no statistical difference in terms of deaths across groups, even though 3 deaths (12,5%) occurred in the severe/critical group whereas no cases of death were reported among the patients with mild to moderate symptoms.
From our survey, a set of 10 miRNAs was selected based on the criteria of having shown prior evidence for an association with any aspect of pulmonary immune response [6,22,23,24,25,26,27,28,29,30,31], as in Methods. Table 2 shows the correlation of circulating, PBMC-borne levels of miRs with the clinical characteristics of patients. There was a negative correlation for miR-92a with oxygen saturation. For the other miRs, there were no other significant relationships. In Figure 1, we present an additional analysis based on a log transformed comparison of miR-92a levels across groups of patients, that confirms higher mean levels of miR-92a levels among patients rated with mild/moderate Covid-19.
Discussion
The present study aimed to analyze the association of a panel of miRNAs with the clinical profile of patients segregated according to the severity of the SARS-CoV-2 infection. Initially, the exploratory analysis showed a greater prevalence of comorbidities, of disease-related symptoms and of drugs used among the severe/critical group compared to patients with a milder phenotype. On what concerns the 10 miRNAs explored, correlation analyzes showed a negative correlation only for miR-92a with oxygen saturation. Finally, comparison of log-transformed concentrations of miRNAs between groups showed significant difference in miR-92a expression levels, with higher concentration for the moderate group.
Clinically, oxygen saturation (SpO2) is the percentage of molecular oxygen that can bind to hemoglobin in the bloodstream, with normal values ranging between 95-100% [32]. The SARS-CoV-2 infection stimulates an overexpression of the angiotensin-converting enzyme 2 (ACE2) in the respiratory tract that, in turn, generates inflammation and alveoli damage that impairs gas exchange and reduces blood oxygen saturation [32]. The miR-92a appears to be directly related to the mechanisms of cellular respiration [33]. Findings demonstrated that blocking miR-92a in brown adipocyte cells results in increased mitochondrial content and, consequently, in increased oxygen consumption by these cells [33].
In line with our finding, the miR-92a was found with increased levels of expression among SARS-CoV-2 infected patients bearing mild/moderate symptoms compared to severe cases, being associated with an impaired innate antiviral response [34]. Additionally, miR-92a showed a negative correlation with age in the same report [34]. Even though this correlation with age was not paralleled by our own findings, we believe that our analyses were not based by age strata given that correlation analyses were controlled for possible confounding variables, including age.
Also, current literature shows that the miR-92a is strongly associated with acute respiratory syndrome [35], with overexpression of the miR impairing de novo formation of new blood vessel (neovascularization), thus optimizing repair mechanisms of injured, pre-existing blood vessels (angiogenesis) at the respiratory tract [36]. Inconsistencies between our findings and those observed elsewhere can possibly be explained by the drug regimen used to treat SARS-CoV-2 infection. Drugs can act as epigenetic modulators of the expression of several miRNAs [37]. In our scenario, the main drug used to treat the critical group consisted of dexamethasone, while only one patient with mild/moderate Covid-19 was found using this drug. Dexamethasone treatment was reported elsewhere as capable of reducing the expression of mir-92a [38,39], and the finding presented herein corroborates this assumption.
It is evident that use of this drug can clinically improve the effects of COVID-19, possibly by compensating the disease-related endothelial disfunction and by attenuating the inflammatory storm [40]. Even being so, it is possible that a harsh, drug-induced reduction in miR-92a expression might not be entirely beneficial since it could result in an oxygen-deprived state, possibly due to greater oxygen consumption and/or to lower repair rates of pre-existing blood vessels. Therefore, forthcoming clinical trials on how these miRNAs act in cells and influence physiological responses should be welcome, making further research necessary, especially to allow advances on drug adjustment measures, if necessary.
Our study has several limitations, mostly concerning that no sample size calculations were performed, and the fact recruitment considered patients admitted to one single tertiary health service. Even so, the authors concluded as beneficial to disclose our results amidst the yet evolving area that assess circulating miRNAs as players in or markers of severe immune/ thrombosis dysfunction and of clinical response to SARS-CoV-2 infection.
Conclusions
In conclusion, expression levels of the PBMC-borne miR-92a were associated with the severity of the clinical condition exhibited by patients with SARS-CoV-2 infection, mainly with oxygen saturation titers, with patients rated with mild/moderate or severe/critical phenotypes of Covid-19 showing differences in the expression of miR-92a but not of other microRNAs that had as well been previous associated by bioinformatics with inflammatory processes in the respiratory milieu.
Funding
Research supported by CAPES, Brazil (Finance Code #001) by means of stipends to G.S.M-J., G.P.J-S., S.R.C and H.L.S. O.T.N. and C.M.G. received fellowships for productivity in research. None of the funding agencies have interfered or advised on the analyses conducted.
Institutional Review Board Statement
The study was approved by local institutional review boards under accession number CAAE 30846920.7.0000.0008.
Data Availability Statement
Data can be made available upon reasonable request.
Conflicts of Interest
No conflict of interest.
References
- da Silva, S.J.R.; do Nascimento, J.C.F.; Germano Mendes, R.P.; Guarines, K.M.; Targino Alves da Silva, C.; da Silva, P.G.; et al. Two Years into the COVID-19 Pandemic: Lessons Learned. ACS Infect Dis. 2022, 8, 1758–1814. [Google Scholar] [CrossRef]
- Yadav, T.; Kumar, S.; Mishra, G.; Saxena, S.K. Tracking the COVID-19 vaccines: The global landscape. Hum Vaccin Immunother. 2023, 19, 2191577. [Google Scholar] [CrossRef]
- Zhang, S.; Amahong, K.; Sun, X.; Lian, X.; Liu, J.; Sun, H.; et al. The miRNA: a small but powerful RNA for COVID-19. Brief Bioinform. 2021, 22, 1137–1149. [Google Scholar] [CrossRef] [PubMed]
- Zhou, P.; Yang, X.L.; Wang, X.G.; Hu, B.; Zhang, L.; Zhang, W.; et al. A pneumonia outbreak associated with a new coronavirus of probable bat origin. Nature. 2020, 579, 270–273. [Google Scholar] [CrossRef]
- Chan, J.F.; Yuan, S.; Kok, K.H.; To, K.K.; Chu, H.; Yang, J.; et al. A familial cluster of pneumonia associated with the 2019 novel coronavirus indicating person-to-person transmission: a study of a family cluster. Lancet. 2020, 395, 514–523. [Google Scholar] [CrossRef] [PubMed]
- Mirzaei, R.; Goodarzi, P.; Asadi, M.; Soltani, A.; Aljanabi, H.A.A.; Jeda, A.S.; et al. Bacterial co-infections with SARS-CoV-2. IUBMB Life. 2020, 72, 2097–2111. [Google Scholar] [CrossRef] [PubMed]
- Canatan, D.; De Sanctis, V. The impact of MicroRNAs (miRNAs) on the genotype of coronaviruses. Acta Biomed. 2020, 91, 195–198. [Google Scholar]
- Sharma, A.; Tiwari, S.; Deb, M.K.; Marty, J.L. Severe acute respiratory syndrome coronavirus-2 (SARS-CoV-2): a global pandemic and treatment strategies. Int J Antimicrob Agents. 2020, 56, 106054. [Google Scholar] [CrossRef]
- Hosseini Rad Sm, A.; McLellan, A.D. Implications of SARS-CoV-2 Mutations for Genomic RNA Structure and Host microRNA Targeting. Int J Mol Sci. 2020, 21. [Google Scholar] [CrossRef]
- Saliminejad, K.; Khorram Khorshid, H.R.; Soleymani Fard, S.; Ghaffari, S.H. An overview of microRNAs: Biology, functions, therapeutics, and analysis methods. J Cell Physiol. 2019, 234, 5451–5465. [Google Scholar] [CrossRef]
- Endo, k.; Weng, H.; Naito, Y.; Sasaoka, T.; Takahashi, A.; Fukushima, Y.; et al. Classification of various muscular tissues using miRNA profiling. Biomedical Research. 2013, 34, 289–299. [Google Scholar] [CrossRef]
- Bernier, A.; Sagan, S.M. The Diverse Roles of microRNAs at the Host(-)Virus Interface. Viruses. 2018, 10. [Google Scholar] [CrossRef]
- Girardi, E.; Lopez, P.; Pfeffer, S. On the Importance of Host MicroRNAs During Viral Infection. Front Genet. 2018, 9, 439. [Google Scholar] [CrossRef]
- Barbu, M.G.; Condrat, C.E.; Thompson, D.C.; Bugnar, O.L.; Cretoiu, D.; Toader, O.D.; et al. MicroRNA Involvement in Signaling Pathways During Viral Infection. Front Cell Dev Biol. 2020, 8, 143. [Google Scholar] [CrossRef]
- Jafarinejad-Farsangi, S.; Jazi, M.M.; Rostamzadeh, F.; Hadizadeh, M. High affinity of host human microRNAs to SARS-CoV-2 genome: An in silico analysis. Noncoding RNA Res. 2020, 5, 222–231. [Google Scholar] [CrossRef]
- Mohammadi-Dehcheshmeh, M.; Moghbeli, S.M.; Rahimirad, S.; Alanazi, I.O.; Shehri, Z.S.A.; Ebrahimie, E. A Transcription Regulatory Sequence in the 5' Untranslated Region of SARS-CoV-2 Is Vital for Virus Replication with an Altered Evolutionary Pattern against Human Inhibitory MicroRNAs. Cells. 2021, 10. [Google Scholar] [CrossRef] [PubMed]
- Kurizky, P.; Nobrega, O.T.; Soares, A.; Aires, R.B.; Albuquerque, C.P.; Nicola, A.M.; et al. Molecular and Cellular Biomarkers of COVID-19 Prognosis: Protocol for the Prospective Cohort TARGET Study. JMIR Res Protoc. 2021, 10, e24211. [Google Scholar] [CrossRef] [PubMed]
- Rodriguez, A.; Duyvejonck, H.; Van Belleghem, J.D.; Gryp, T.; Van Simaey, L.; Vermeulen, S.; et al. Comparison of procedures for RNA-extraction from peripheral blood mononuclear cells. PLoS One. 2020, 15, e0229423. [Google Scholar] [CrossRef]
- Fuss, I.J.; Kanof, M.E.; Smith, P.D.; Zola, H. Isolation of whole mononuclear cells from peripheral blood and cord blood. Curr Protoc Immunol. 2009, 85. [Google Scholar] [CrossRef]
- Livak, K.J.; Schmittgen, T.D. Analysis of relative gene expression data using real-time quantitative PCR and the 2(-Delta Delta C(T)) Method. Methods. 2001, 25, 402–408. [Google Scholar] [CrossRef] [PubMed]
- Souza, V.C.; Morais, G.S., Jr.; Henriques, A.D.; Machado-Silva, W.; Perez, D.I.V.; Brito, C.J.; et al. Whole-Blood Levels of MicroRNA-9 Are Decreased in Patients With Late-Onset Alzheimer Disease. Am J Alzheimers Dis Other Demen. 2020, 35, 1533317520911573. [Google Scholar] [CrossRef]
- Chow, J.T.; Salmena, L. Prediction and Analysis of SARS-CoV-2-Targeting MicroRNA in Human Lung Epithelium. Genes (Basel). 2020, 11. [Google Scholar] [CrossRef]
- de Gonzalo-Calvo, D.; Benitez, I.D.; Pinilla, L.; Carratala, A.; Moncusi-Moix, A.; Gort-Paniello, C.; et al. Circulating microRNA profiles predict the severity of COVID-19 in hospitalized patients. Transl Res. 2021, 236, 147–159. [Google Scholar] [CrossRef]
- Garg, A.; Seeliger, B.; Derda, A.A.; Xiao, K.; Gietz, A.; Scherf, K.; et al. Circulating cardiovascular microRNAs in critically ill COVID-19 patients. Eur J Heart Fail. 2021, 23, 468–475. [Google Scholar] [CrossRef]
- Greco, S.; Made, A.; Gaetano, C.; Devaux, Y.; Emanueli, C.; Martelli, F. Noncoding RNAs implication in cardiovascular diseases in the COVID-19 era. J Transl Med. 2020, 18, 408. [Google Scholar] [CrossRef]
- Guo, X.K.; Zhang, Q.; Gao, L.; Li, N.; Chen, X.X.; Feng, W.H. Increasing expression of microRNA 181 inhibits porcine reproductive and respiratory syndrome virus replication and has implications for controlling virus infection. J Virol. 2013, 87, 1159–1171. [Google Scholar] [CrossRef]
- Henzinger, H.; Barth, D.A.; Klec, C.; Pichler, M. Non-Coding RNAs and SARS-Related Coronaviruses. Viruses. 2020, 12. [Google Scholar] [CrossRef]
- Liu, Q.; Du, J.; Yu, X.; Xu, J.; Huang, F.; Li, X.; et al. miRNA-200c-3p is crucial in acute respiratory distress syndrome. Cell Discov. 2017, 3, 17021. [Google Scholar] [CrossRef]
- Ramaiah, M.J. mTOR inhibition and p53 activation, microRNAs: The possible therapy against pandemic COVID-19. Gene Rep. 2020, 20, 100765. [Google Scholar] [CrossRef]
- Sabbatinelli, J.; Giuliani, A.; Matacchione, G.; Latini, S.; Laprovitera, N.; Pomponio, G.; et al. Decreased serum levels of the inflammaging marker miR-146a are associated with clinical non-response to tocilizumab in COVID-19 patients. Mech Ageing Dev. 2021, 193, 111413. [Google Scholar] [CrossRef]
- Tang, H.; Gao, Y.; Li, Z.; Miao, Y.; Huang, Z.; Liu, X.; et al. The noncoding and coding transcriptional landscape of the peripheral immune response in patients with COVID-19. Clin Transl Med. 2020, 10, e200. [Google Scholar] [CrossRef]
- Fata, U.H.; Febriana, L. Oxygen Saturation (SPO2) in Covid-19 Patients. Jurnal Ners dan Kebidanan (Journal of Ners and Midwifery). 2021, 8, 290–294. [Google Scholar] [CrossRef]
- Zhang, Z.; Jiang, H.; Li, X.; Chen, X.; Huang, Y. MiR-92a regulates brown adipocytes differentiation, mitochondrial oxidative respiration, and heat generation by targeting SMAD7. J Cell Biochem. 2020, 121, 3825–3836. [Google Scholar] [CrossRef]
- Giannella, A.; Riccetti, S.; Sinigaglia, A.; Piubelli, C.; Razzaboni, E.; Di Battista, P.; et al. Circulating microRNA signatures associated with disease severity and outcome in COVID-19 patients. Front Immunol. 2022, 13, 968991. [Google Scholar] [CrossRef]
- Zhu, Z.; Liang, L.; Zhang, R.; Wei, Y.; Su, L.; Tejera, P.; et al. Whole blood microRNA markers are associated with acute respiratory distress syndrome. Intensive Care Med Exp. 2017, 5, 38. [Google Scholar] [CrossRef]
- Loyer, X.; Potteaux, S.; Vion, A.C.; Guerin, C.L.; Boulkroun, S.; Rautou, P.E.; et al. Inhibition of microRNA-92a prevents endothelial dysfunction and atherosclerosis in mice. Circ Res. 2014, 114, 434–443. [Google Scholar] [CrossRef]
- He, Y.; Chevillet, J.R.; Liu, G.; Kim, T.K.; Wang, K. The effects of microRNA on the absorption, distribution, metabolism and excretion of drugs. British Journal of Pharmacology. 2015, 172. [Google Scholar] [CrossRef]
- Molitoris, J.K.; McColl, K.S.; Distelhorst, C.W. Glucocorticoid-mediated repression of the oncogenic microRNA cluster miR-17~92 contributes to the induction of Bim and initiation of apoptosis. Mol Endocrinol. 2011, 25, 409–420. [Google Scholar] [CrossRef]
- Tie, K.; Zhao, Z.; Wu, Z.; Qin, J.; Zhang, J.; Pei, L.; et al. Low miR-92a-3p in oocytes mediates the multigenerational and transgenerational inheritance of poor cartilage quality in rat induced by prenatal dexamethasone exposure. Biochem Pharmacol. 2022, 203, 115196. [Google Scholar] [CrossRef]
- Kim, W.Y.; Kweon, O.J.; Cha, M.J.; Baek, M.S.; Choi, S.H. Dexamethasone may improve severe COVID-19 via ameliorating endothelial injury and inflammation: A preliminary pilot study. PLoS One. 2021, 16, e0254167. [Google Scholar] [CrossRef]
Figure 1.
Comparison between groups of miR-92a transformed log values. *p=0.046.
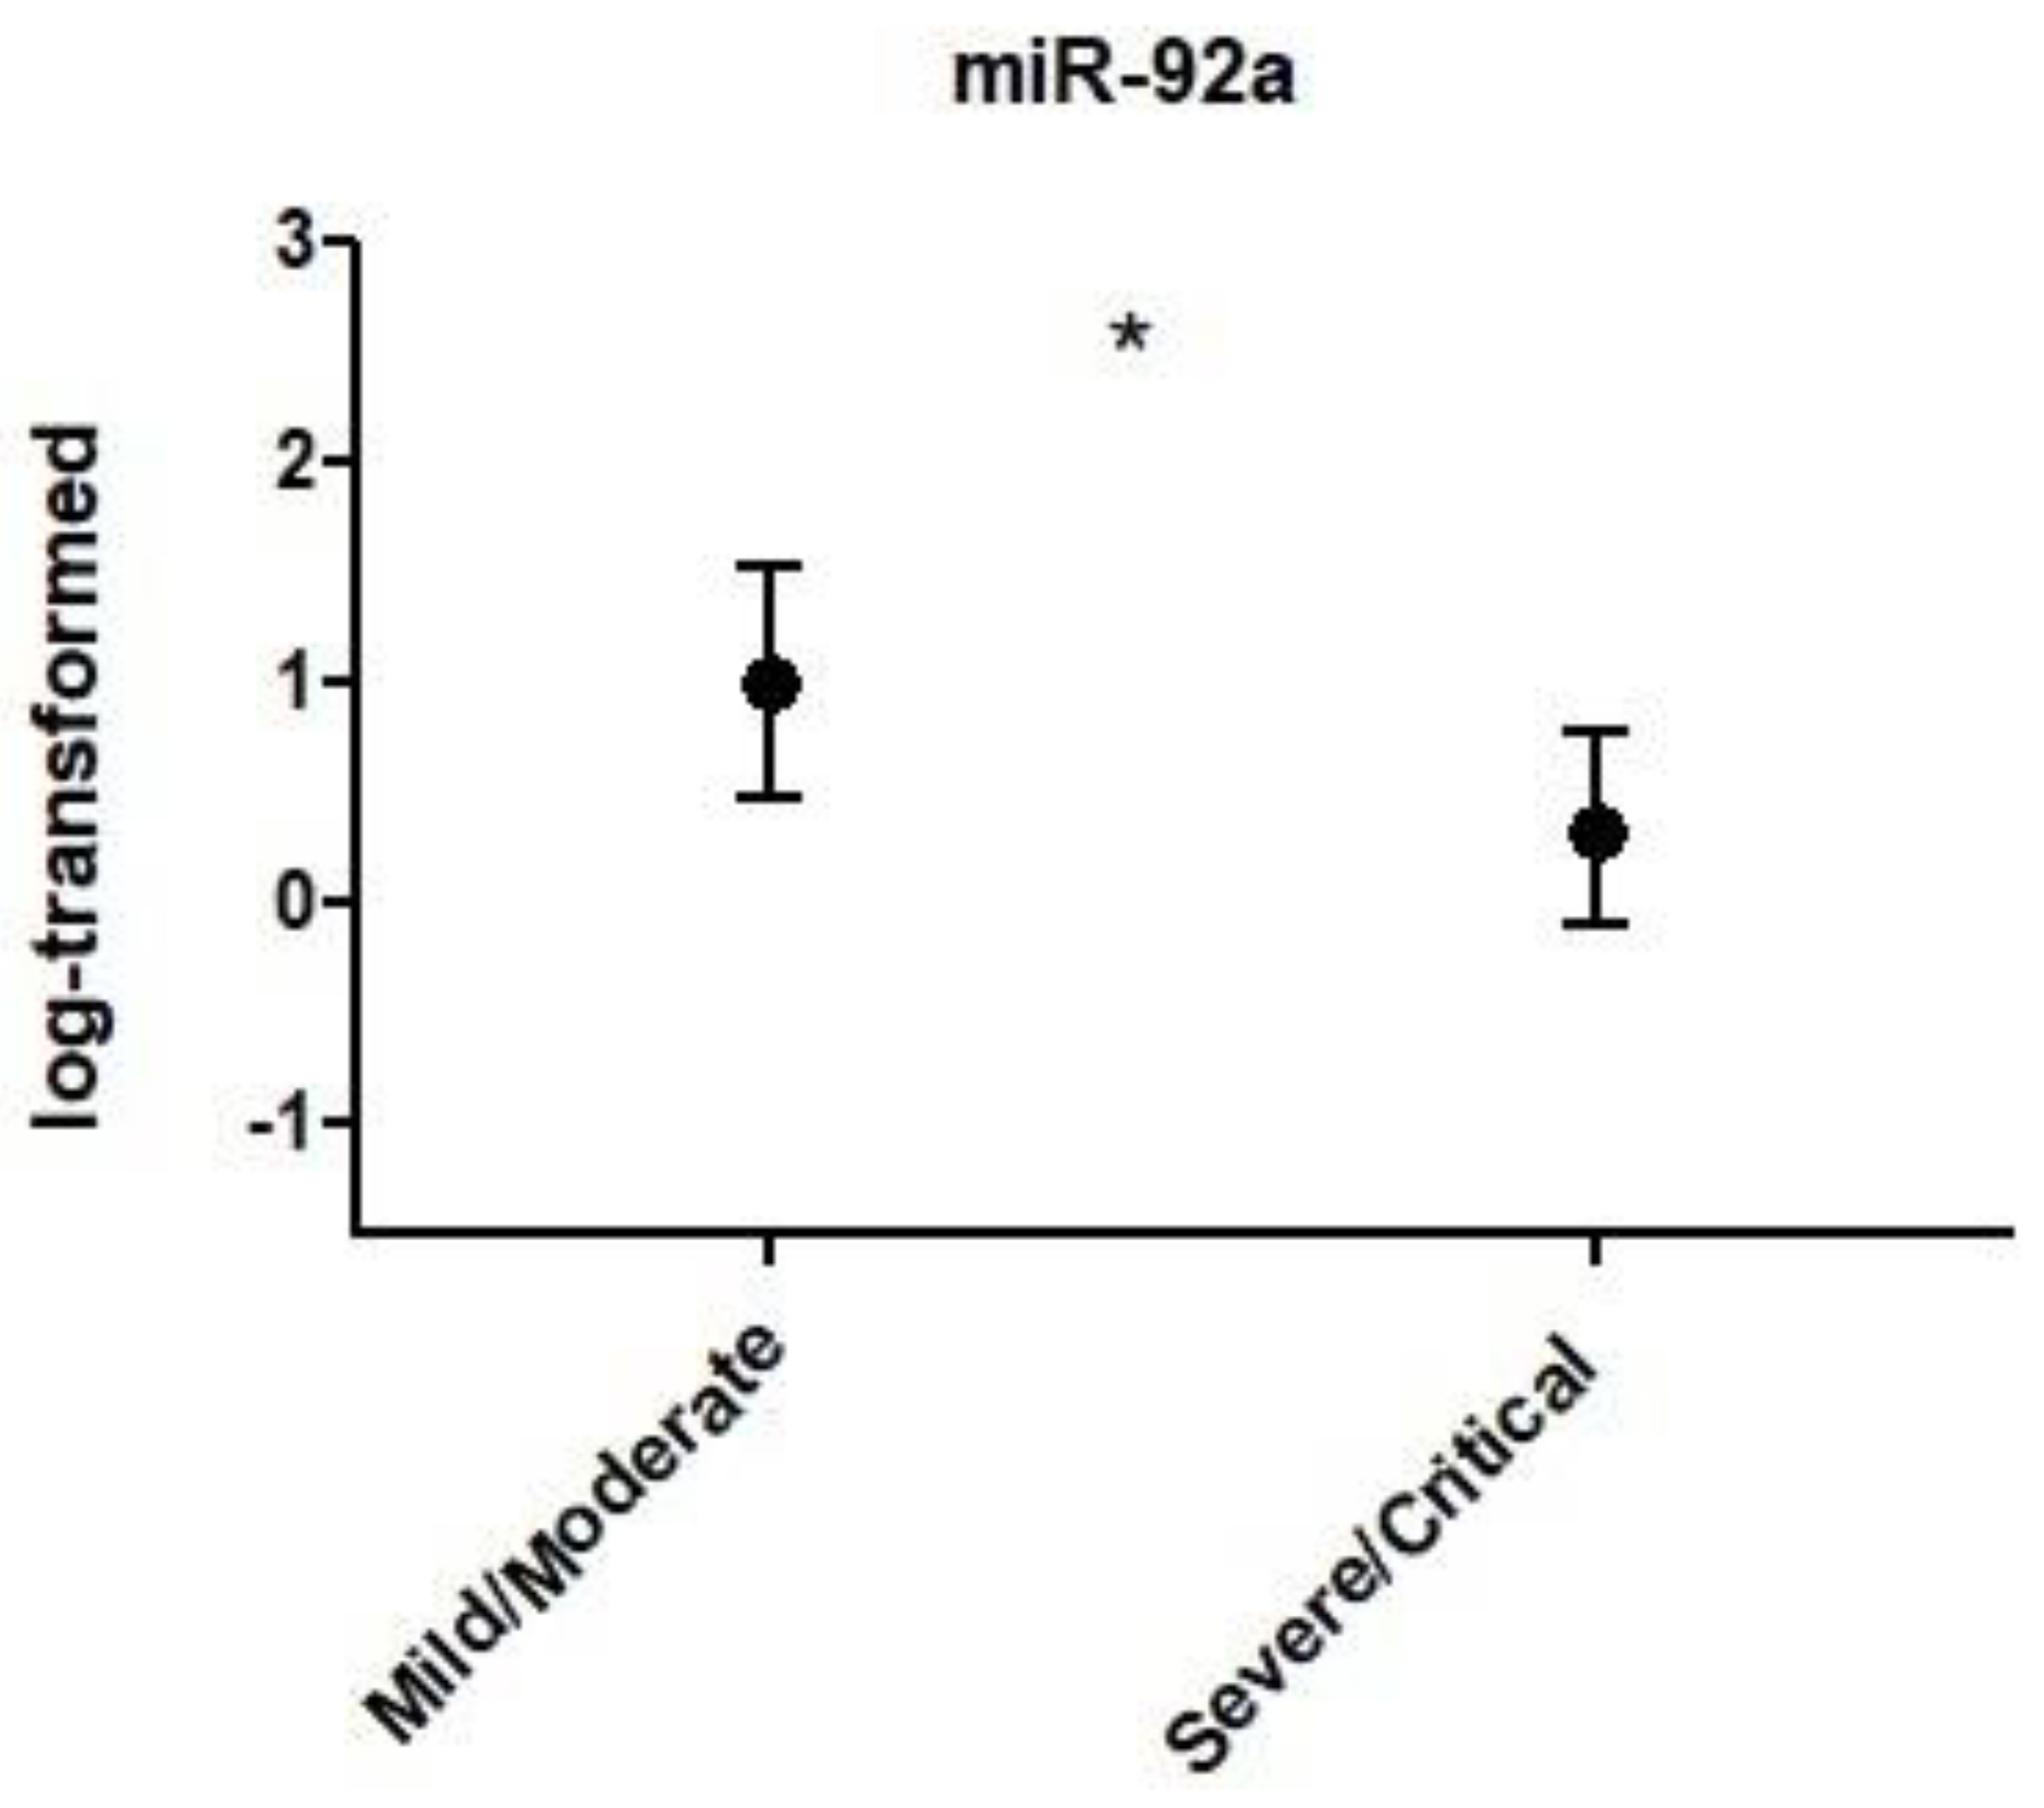

Table 1.
Clinical features of the Covid-19 patients.
|
Mild/Moderate (n = 9) |
Severe/Critical (n = 24) |
P | |
|---|---|---|---|
| Age (years)* | 39.1 ± 17.8 | 51.8 ± 14.7 | 0.044 |
| DS (Days)* | 20.7 ± 5.7 | 17.4 ± 6.5 | 0.205 |
| AS** | 3.0 (3.0 - 3.7) | 4.5 (3.6 - 5.7) | 0.024 |
| SpO2 (%)* | 95.0 ± 2.5 | 88.5 ± 4.7 | 0.001 |
| AD (qty)** | 3.0 (1.0 - 4.0) | 5.0 (3.0 - 5.0) | 0.045 |
| MV (%)† | 0.0 | 16.7 | 0.191 |
| Current SAH (%)† | 11.1 | 45.8 | 0.065 |
| Current T2DM (%)† | 0.0 | 6.5 | 0.031 |
| Current Asthma (%)† | 0.0 | 4.2 | 0.534 |
| Hystory of Cancer (%)† | 0.0 | 4.2 | 0.534 |
| Current Depression (%)† | 0.0 | 4.2 | 0.534 |
| Deaths (%)† | 0.0 | 12.5 | 0.266 |
Data expressed as mean ± standard deviation, proportion or median (and interquartile range). AD = Amount of drugs; AS = Amount of Symptoms; DS = Duration of Symptoms; MV = Mechanical Ventilation; SAH = systemic arterial hypertension; SpO2 = Saturation of O2; T2DM = type 2 diabetes mellitus. ∗t-test for independent samples, data as mean and standard deviation. ∗∗Nonparametric test of Mann–Whitney, data as median and interquartile range. †Chi-square test, data as within-group proportions.
Table 2.
Correlation analyses between expression levels of PBMC-borne miRs and clinical features of the Covid-19 patients investigated.
Table 2.
Correlation analyses between expression levels of PBMC-borne miRs and clinical features of the Covid-19 patients investigated.
| miR-1-2 | miR-10a | miR-92a | miR-100 | miR-145 | miR-146a | miR-155 | miR-181a | miR-200a | miR-221 | |
|---|---|---|---|---|---|---|---|---|---|---|
| Age | -.049; .868 | .179; .579 | .084; .648 | -.453; .120 | -.368; .101 | -.312; .082 | .101; .576 | -.356; .088 | -.441; .174 | .038; .834 |
| T2DM | -.235; .418 | -.169; ,581 | -.102; .580 | .165; .590 | .154; .505 | .200; .274 | .129; .476 | .147; .493 | .150; .660 | .079; .664 |
| Sex§ | .072; .808 | .042; .891 | .091; .908 | .082; .789 | .008; .972 | -.075; .684 | .034; .852 | -.057; .790 | .231; .493 | -.061; .737 |
| DS§ | -.388; .239 | -.297; .404 | -.179; .363 | .243; .499 | .262; .310 | .252; .196 | .007; .971 | .265; .259 | .224; .594 | .025; .899 |
| AS§ | -314; .296 | -.169; .599 | -.072; .699 | -.360; .250 | -.217; .357 | -.127; .495 | .060; .746 | -.168; .443 | -.362; .303 | .151; .411 |
| SpO2§ | .174; .570 | -.543; .068 | -.377; .048* | .220; .493 | .102; .668 | .098; .619 | -.080; .679 | .089; .687 | .290; .416 | .002; .990 |
| MV§ | -.513; .073 | -.139; .666 | .135; .471 | -.251; .432 | .255; .278 | -.097; .604 | .225; .215 | .097; 659 | -.393; .261 | .092; .616 |
| AD§ | .239; .455 | .357; .281 | .181; .348 | .121; .723 | .082; .739 | .031; .873 | .292; .118 | .047; .836 | .197; .612 | .055; .774 |
| SAH§ | .251; .387 | -.042; .891 | .042; 820 | .041; .894 | -.056; .811 | .231; .204 | .218; .222 | -.036; .866 | -.120; .726 | .225; .208 |
The Pearson and Spearman correlation tests were used, with adjustment§ to age and to T2DM. Data are expressed in correlation index and significance level (r; P). *the correlation is significant in the level of 0.05. AD = Amount of drugs; AS = Amount of Symptoms; DS = Duration of Symptoms; MV = Mechanical Ventilation; SAH = systemic arterial hypertension; SpO2 = Saturation of O2; T2DM = type 2 diabetes mellitus.
Disclaimer/Publisher’s Note: The statements, opinions and data contained in all publications are solely those of the individual author(s) and contributor(s) and not of MDPI and/or the editor(s). MDPI and/or the editor(s) disclaim responsibility for any injury to people or property resulting from any ideas, methods, instructions or products referred to in the content. |
© 2025 by the authors. Licensee MDPI, Basel, Switzerland. This article is an open access article distributed under the terms and conditions of the Creative Commons Attribution (CC BY) license (http://creativecommons.org/licenses/by/4.0/).
Copyright: This open access article is published under a Creative Commons CC BY 4.0 license, which permit the free download, distribution, and reuse, provided that the author and preprint are cited in any reuse.


