Submitted:
22 May 2025
Posted:
23 May 2025
You are already at the latest version
Abstract
Understanding urban visual perception plays a vital role in modeling how people cognitively and emotionally respond to the built environment. However, conventional survey-based methods are limited in scalability and spatial generalization. To address this, we present a transparent and interpretable framework that leverages recent advances in Visual Foundation Models (VFMs) and concept-based reasoning. Our approach, UP-CBM, constructs a task-specific concept vocabulary using GPT-4o and processes urban scene images via a multi-scale visual prompting strategy. This strategy generates CLIP-based similarity maps that supervise the learning of an interpretable bottleneck layer, enabling transparent reasoning between raw visual inputs and perceptual outcomes. Through comprehensive experiments on Place Pulse 2.0 (+0.041 in comparison accuracy, +0.029 in R2) and VRVWPR (+0.018 in classification accuracy), UP-CBM demonstrates superior predictive performance and transparency. These results underscore the value of combining VFMs with structured concept pipelines for robust and scalable urban visual data processing.
Keywords:
Deep Learning
; Urban Perception
; Visual Concept
; Explainable AI
; Visual Prompt
1. Introduction
Understanding people’s emotional and cognitive responses to the built environment increasingly relies on insights into the visual perception of the city. Rather than relying solely on objective indicators, it emphasizes the subjective impressions people form when observing urban spaces [1]. Traditional methods of measuring such perceptions typically include interviews, field surveys, and structured questionnaires [2,3,4]. While these methods can provide depth, they are often labor intensive, time consuming, and geographically limited.
The rise of computer vision has opened up new avenues for large-scale, cost-effective urban perceptual analysis. Automated image processing techniques have enabled researchers to extract perceptual signals from massive amounts of street view imagery (SVI), enabling evaluation across different temporal and environmental contexts [5,6]. These techniques reduce the reliance on manual labor while maintaining spatial and temporal comprehensiveness compared to traditional methods. Recent advances have focused on mining the hidden attributes of cities through SVI, with a particular focus on quantifying urban visual perception on a citywide scale [7,8]. However, given the subjective nature of visual perception, a major hurdle is how to generate reliable and realistic annotations to train machine learning models [9]. The MIT “Pulse of Place” project [10] tackled this challenge by introducing an innovative online crowdsourcing methodology: participants evaluated pairs of images in terms of perceptual dimensions such as wealth, vigor, and visual appeal. The resulting dataset “Pulse of Place 2.0 [11]” significantly improves the scalability of urban perception research.
In addition to these advances, visual foundation models (VFMs) [12,13,14] have become powerful tools for learning generalizable visual representations across domains. models such as CLIP [13] and DINOv2 [14] models have been pre-trained based on massive graphic pairs and are able to encode semantically rich features that can be easily applied to downstream urban perception tasks. Their ability to capture high-level visual concepts makes them particularly suitable for modeling the fine-grained subjective dimensions of how people perceive urban environments. Unlike task-specific convolutional networks, which often act as opaque black boxes, VFMs enable more explanatory predictions by matching image features with human-understandable concepts. For example, visual cues or textual embeddings associated with terms such as “building”, ‘green’, or “old” can be directly associated with model outputs to reveal factors that influence perceptual scores. This fit between semantic space and visual representations offers a promising avenue for interpretable deep learning in urban research.
In addition, combining concept-based interpretability frameworks [15,16] (e.g., prototyping networks [17] or conceptual bottleneck models [15]) with VFMs can improve transparency. These models allow one to trace perceptual scores back to visual concepts, i.e., interpretable elements of the environment, enabling a more responsible deployment of AI in urban planning environments.As cities become increasingly complex, the need for scalable, interpretable, and human-computer-interactive visual analytics tools will only grow.VFM, with its generalization capabilities and semantic underpinnings, is well-positioned to meet this need and redefine how we understand and quantify urban visual perception. Recently, visual cue engineering has been shown to enhance the visual conceptual alignment of CLIP models. For example, the inclusion of a simple red circle as a visual cue can significantly improve the ability of CLIP to recognize target concepts [18,19]. Based on this idea, we evaluated the alignment performance of CLIP for city-related concepts in street view images. As shown in Figure 1 (we use different colored circles to better present the concepts), the results show that the circle-based visual cues can help CLIP to correctly align urban visual concepts.
In this paper, we introduce a novel conceptual bottleneck model (UP-CBM) tailored for urban perception tasks. The model first uses GPT-4o [20] to generate a compact, human-understandable vocabulary of urban visual concepts. With carefully designed cues, the language model [21,22,23] recognizes semantically meaningful visual elements that affect perception in different perceptual dimensions, such as "clean roads “, ‘car’ or ”colorful façade". These concepts act as an interpretable intermediate space between the original pixel and the perceptual score. We then designed a multi-scale visual cueing strategy [19] for detecting spatial concept activation at different image resolutions. By applying synthetic perturbations (e.g., red circles) on the image grid, we use CLIP to compute fine-grained similarity maps between image regions and textual concepts. These maps act as weak pseudo-labels that guide the learning of the Conceptual Bottleneck Layer (CBL), which extracts interpretable conceptual activations from the frozen backbone features of a CNN or ViT. Finally, we aggregate the spatial concept map into a global concept vector and pass it to a shallow predictor for regression or classification depending on the dataset.
The entire process provides transparency on multiple levels: it bases predictions on visual concepts, localizes these concepts spatially, and supports quantitative evaluation using pairwise comparison accuracy and regression coefficients . We also validate our approach on two perceptual datasets: the Place Pulse 2.0 [10] and the VRVWPR [24]. The experimental results show that our interpretable model achieves better perceptual performance (0.041 average improvement in accuracy, 0.029 improvement in for Place Pulse 2.0, and 0.018 improvement in accuracy for VRVWPR), as well as significant advantages in transparency and human-centered understanding of urban visual perception.
Our contributions are as follows:
- A interpretable urban perception pipeline that explicitly models perceptual reasoning through human-understandable visual concepts is proposed. Our approach introduces a concept bottleneck layer aligned with CLIP-derived similarity maps, enabling transparent and controllable perception prediction.
- We design a class-free concept discovery mechanism using GPT-4o, generating task-specific visual concepts without relying on predefined categories. This allows the model to flexibly adapt to perception tasks with subjective or continuous labels, such as safety or walkability.
- A multi-scale prompting strategy to spatially probe and localize perceptual concepts in street view images is designed for better concept extraction, achieving both accurate and interpretable predictions across multiple datasets.
2. Related work
2.1. Visual Foundation Models
Recent advancements in VFMs have been significantly influenced by the success of large language models (LLMs) in natural language processing [21,25,26,27,28], which demonstrate remarkable generalization across diverse tasks. Inspired by this, models such as CLIP [13] have emerged to bridge vision and language by aligning their respective feature spaces using contrastive learning on extensive image-text pair datasets. This alignment strategy has enabled CLIP to exhibit exceptional zero-shot performance in downstream visual understanding tasks [29,30].
A particularly notable line of progress in vision is segmentation with promptable models. The Segment Anything Model (SAM) represents a breakthrough in this direction, having been trained on over a billion masks using both sparse (e.g., points, bounding boxes, textual cues) and dense (e.g., full masks) prompts. This versatile prompting mechanism empowers SAM to adapt to a broad spectrum of downstream tasks, such as visual object tracking [29,31,32,33,34], 2D image segmentation [6,35,36,37,38,39,40], and even 3D scene reconstruction [41]. Beyond promptable segmentation, recent VFMs such as DINOv2 [14], Masked Autoencoders (MAE) [42], and CLIP are capable of learning robust object-centric and dense semantic features. These models capture rich visual cues that enable detailed representation of object attributes across complex real-world environments.
Recent work has shown that visual prompt engineering [43] can enhance the visual alignment capabilities of CLIP models. For example, adding a simple red circle as a visual cue significantly improves CLIP’s ability to recognize target concepts [18]. By deliberately designing visual elements such as background, positioning, and composition, images can be tailored to better ’prompt’ the model. Building on this idea, we assess CLIP’s alignment performance for urban-related concepts in street view imagery. As shown in Figure 1, our findings reveal that circle-based visual prompts markedly improve CLIP’s alignment with urban visual concepts. For visualization purposes, we use different circle colors to distinguish between concepts, although all circles are rendered in red during actual implementation.
2.2. Quantifying Urban Perception via Foundation Models
In the domain of urban image analysis, the increasing availability of remote sensing and street view imagery has facilitated the development of multimodal models for urban perception. UrbanCLIP [44], for example, employs cross-modal alignment techniques to infer urban indicators from images using textual guidance. UrbanVLP [45] further integrates automatically generated textual descriptions with macro-level (satellite) and micro-level (street view) imagery, enhancing semantic understanding and descriptive capability. Meanwhile, benchmarks like V-IRL [46] have provided standardized evaluations for Large Language Models (LLMs) on tasks such as localization and scene recognition in urban imagery. Urban planners and sociologists have long emphasized the influence of visual and physical urban characteristics on human cognition and behavior. Nasar et al. argue that a city’s appearance significantly impacts residents’ emotional responses [8], while scholars like Keizer and Kelling highlight the associations between visual disorder and social issues such as crime and declining educational outcomes [3,4].
To quantify subjective perceptions of the urban visual environment, researchers have increasingly turned to street view imagery (SVI) as an objective medium to reflect urban appearance. Projects like Place Pulse gathered public ratings on attributes like "safety" or "cleanliness" through large-scale image pair comparisons, resulting in the Place Pulse 1.0 dataset [11]. Building on this, Naik et al. developed the Streetscore algorithm using image features and support vector regression to predict perceived street safety across 21 U.S. cities [47,48]. However, due to its training bias toward New York and Boston images, its global generalizability remains limited.
In addition to crowdsourcing-based approaches, Griew et al. introduced the FASTVIEW tool, which combines expert audits and crowd ratings based on Google SVI to assess factors such as pavement quality, lighting, and safety in relation to physical activity [49]. Despite these innovations, traditional data collection methods-such as interviews and surveys-still suffer from small sample sizes and subjectivity, limiting their scalability and reliability [50]. Overall, the integration of street-level visual features with semantically rich LLM outputs offers a promising new paradigm for urban perception research. This fusion of visual and semantic cues not only enhances the accuracy of city-scale variable predictions but also enables more interpretable, scalable, and fine-grained modeling of how urban environments are perceived and experienced.
2.3. Concept-Based Explanation
Recent advancements in concept-based interpretability frameworks have highlighted their importance in improving the transparency and human-understandability of deep learning models. These frameworks map the internal representations of models to mid-level, semantically meaningful units known as concepts, which are nameable and perceptually accessible to humans [15,51]. Inspired by cognitive science, this approach emphasizes that human decision-making often relies more on abstract semantic concepts than on raw inputs or pixel-level features, offering interpretability that is both more intuitive and more transferable across domains.
A core component of these frameworks lies in the construction of a high-quality concept set that captures essential structures or semantic patterns in the data. Concepts can either be manually defined using expert knowledge-for instance, disease types in medical imaging or syntactic tags in language [52,53]-or be automatically discovered through data-driven techniques like clustering, sparse factorization, or contrastive learning [54,55]. Once established, model predictions can be re-expressed as concept activation patterns, allowing users to trace the decision path through semantically meaningful nodes. One of the most prominent structures embodying this idea is the Concept Bottleneck Model (CBM) [15]. It inserts an intermediate bottleneck layer representing concepts and forces the model to make predictions solely based on them. The architecture is typically split into two stages: a concept predictor, and a classifier operating on predicted concepts. This modular design enhances traceability and interventionability-users can tweak concept activations to directly observe changes in predictions. Variants of CBM have been successfully applied across tasks in vision for classification or captioning.
Notably, SALF-CBM [19] transforms deep networks into spatially and semantically interpretable models without sacrificing performance. It excels in zero-shot segmentation, offering interactive functionalities beneficial for high-stakes domains such as medical imaging and autonomous driving. Despite the promise of this paradigm, one of its central challenges remains: the construction of concept sets that are not only discriminative but also semantically coherent and nameable. Automatically discovered concepts may lack semantic clarity or deviate from human understanding [56,57]. To bridge this semantic gap, recent works propose hybrid approaches that combine a small number of expert-defined concepts with a larger set of machine-discovered ones, aiming for a better balance between performance and interpretability [16]. In this paper, we adopt the concept method for transparent urban perception assessment.
3. Method
As shown in Figure 2, we propose an interpretable framework for urban perception modeling (UP-CBL). First, task-specific visual concepts are generated by prompting a large language model and refined by expert filtering. Then, multi-scale visual prompting and CLIP embeddings are used to compute fine-grained image-concept similarities. A Concept Bottleneck Layer (CBL) aligns backbone features with these concept cues, enabling interpretable activations. Finally, global concept vectors are aggregated for perception prediction, jointly optimized with a concept alignment loss to enhance transparency and accuracy.
3.1. Concept Generation
Unlike general classification tasks where discrete class labels are available for specific categories (e.g., cat, dog), the dataset we used consists of urban scene images annotated with continuous perception scores (e.g., safety, vibrancy), making the task more aligned with regression or soft classification rather than strict categorization. This inherent difference motivates the need for a concept generation process that does not rely on pre-defined class labels but instead dynamically constructs semantically meaningful and perceptually relevant concepts that reflect the subjective nature of human urban perception.
To address this, we propose a class-free, context-driven concept generation strategy that leverages the power of large-scale language models to bootstrap a task-specific visual concept space. The goal is to identify a comprehensive yet compact set of visual concepts that can be used for both interpretability and downstream reasoning.
We begin by designing a set of task-level prompts that encapsulate the core objective of perception modeling. Specifically, we employ a state-of-the-art language model GPT-4o to respond to the following queries (three designed prompts) as Table 1.
Note that “{requirement}" can be changed to different words according to the different dataset requirements. The model’s responses are concatenated and aggregated to form a raw concept pool:
Since the raw list often contains noisy or redundant terms, we apply a filtering step to ensure interpretability and visual relevance. Specifically, we remove (by city experts):
- Overly long or ambiguous descriptions (e.g., “a sense of openness and connectedness”),
- Semantically overlapping entries (e.g., “car” and “vehicle”),
- Items that are not visually grounded in the dataset (e.g., abstract concepts like “justice”).
The resulting refined list represents the task-specific concept vocabulary, which is then used to anchor our interpretability framework. These concepts serve as an intermediate bottleneck representation between the raw visual features and the high-level perception prediction, enabling more transparent and controllable decision-making. In Table 2, we also show the number of concepts and some samples for two dataset used in this paper.
3.2. Fine-Grained Image-Concept Similarities
To interpret the perception-relevant visual concepts at fine-grained spatial levels, we adopt a multi-scale visual prompting strategy. This allows us to probe and localize semantically meaningful regions within an image that align with human-understandable concepts.
Given an input image , we generate multiple variants of the image by applying synthetic prompts at different spatial resolutions (shown in Figure 2). These prompts function as perturbations (e.g., circles or masks) to softly highlight potential regions of interest. Formally, for each scale , we define a prompting function such that:
where denotes a grid of positions over the image space, determining where prompts are applied. The grid is generated such that the strides between positions ensure spatial coverage, computed as:
where denotes the number of prompt positions at scale s. At each grid location , we apply a visual prompt (e.g., a red circle of radius ), resulting in a perturbed version of the image:
These prompted images are fed into a CLIP image encoder to obtain local visual embeddings . In parallel, each concept from the generated concept list is embedded using the CLIP text encoder to obtain . We then compute cosine similarity between visual and textual embeddings to quantify the alignment at each position:
This yields a stack of fine-grained spatial similarity maps, indexed by concept n, location , and scale s. These maps serve as weak pseudo-labels for guiding interpretable concept extraction.
3.3. Bottleneck Layer for Concept Alignment
To embed these spatial concept cues into the visual backbone, we propose a Concept Bottleneck Layer (CBL), a simple yet effective mechanism to distill interpretable concept activations from latent feature representations.
Let be the frozen deep feature extracted from a backbone model (CNNs or ViT), where . These features capture rich semantic information but are typically entangled and not easily interpretable. To bridge the gap, we use a single convolutional layer to project f onto a concept space:
Stacking the N concept channels gives the bottleneck output tensor:
Each is intended to reflect the spatial activation of concept k across the image. However, to ensure semantic fidelity, we align these activations with the fine-grained CLIP-based similarity maps. First, we rescale and merge the multi-scale maps to match the resolution of the concept bottleneck outputs:
We then introduce an alignment loss to encourage consistency between the predicted concept activations and the CLIP-derived pseudo-ground-truth:
This Mean Squared Error (MSE) loss promotes the emergence of dedicated concept channels, each responsible for detecting a human-understandable visual factor, enabling semantic interpretability throughout the network.
3.4. Downstream Prediction Using Concepts
Once the spatial concept maps M are learned and aligned, we aggregate them into a global concept vector via spatial average pooling:
This interpretable vector c serves as a semantic summary of the image, quantifying the presence and intensity of each concept. It is passed into a shallow classifier to produce the final perception prediction :
Depending on the nature of the dataset, this classifier can be either a regression model or a discrete classification model. A corresponding loss term, denoted as , is computed with respect to the ground-truth label y. Accordingly, the overall training objective is defined as:
where control the weight of CBL loss.
In this way, the entire pipeline-from multi-scale spatial prompting, to concept-aligned bottleneck representation, to final prediction-forms a transparent, interpretable framework grounded in human-recognizable visual elements. It not only improves model interpretability but also enhances trust and controllability in perception modeling.
3.5. Evaluation Metrics
We evaluate our model using two widely used complementary metrics: Accuracy and the coefficient of determination ().
Accuracy measures the proportion of correctly predicted pairwise comparisons between images. Given a set of image pairs with ground-truth comparison labels , and model predicted comparison , accuracy is defined as:
where N is the total number of image pairs, and is the indicator function that returns 1 if the condition is true, and 0 otherwise. We randomly sampled images from test set 10,000 times for this calculation.
Coefficient of Determination evaluates how well the predicted perceptual scores match the ground-truth ratings for individual images. Let denote the ground-truth score for image i, and the predicted score. Then is defined as:
where is the mean of the ground-truth scores. An value of 1 indicates perfect prediction, 0 indicates that the model performs no better than predicting the mean, and negative values indicate worse-than-baseline performance.
4. Experiment
4.1. Datasets
We use two city perception datasets in our experiments for both regression and classification tasks.
Place Pulse 2.0 [10] is a dataset developed by the MIT Media Lab to collect human perceptions of urban environments through visual imagery. Using an online platform, participants compare pairs of street-level images and rate them based on six perceptual dimensions: safety, beauty, depression, liveliness, wealth, and boredom. The dataset contains 110,988 street view images from 56 cities worldwide, with approximately 1.16 million pairwise comparisons contributed by 81,630 participants. Each image is assigned perception scores derived from these comparisons, and the dataset has been rigorously evaluated for consistency and bias. Place Pulse 2.0 provides a large-scale, structured foundation for studying the relationship between urban appearance, human perception, and urban design.
VRVWPR [24] is a panoramic street view image dataset designed to quantify Visual Walkability Perception (VWP). The dataset contains 2,642 panoramic images collected from seven major cities in the United States, the United Kingdom, France, Germany, and Japan. Images were evaluated through immersive VR-based pairwise comparisons across six dimensions: walkability, feasibility, accessibility, safety, comfort, and pleasurability. Each image received perception scores ranging from 0 to 10 for each of the six dimensions and was further categorized into high, medium, or low levels for training deep learning models. Thus, different to Place Pulse 2.0, we applied this dataset for classification task only. Accuracy for classification is applied for quantifying the performance.
4.2. Implementation Details
We conducted experiments on the Place Pulse 2.0 and VRVWPR datasets. For Place Pulse 2.0, 80% of the data was used for training, 10% for validation, and 10% for testing. For VRVWPR, 60% of the data was used for training, 10% for validation, and 30% for testing. All backbone networks, including ResNet and ViT variants, were initialized with CLIP pretrained weights. We use UrbanCLIP [44] for concept alignment. We adopted the AdamW optimizer [58] for model training. In the first stage, we froze the backbone parameters and trained the additional layers for 10 epochs with a learning rate of 0.0001. In the second stage, we unfroze the backbone and continued training the entire model for another 15 epochs with the same learning rate. For the CBL loss, the weight was set to 1 by default. Regarding the scale configurations, we used two scales: 2x2 and 7x7. All experiments were conducted using four NVIDIA GeForce RTX A6000 GPUs.
4.3. Comparison to Existing Methods
We compare the performance of our approach against five recent regression methods, each representing a distinct modeling paradigm. Streetscore [47] is a classification-based approach that integrates multiple visual features. RESupCon [59] applies supervised contrastive learning to enhance regression accuracy. Adaptive Contrast [60] is a contrastive learning technique tailored for medical image regression tasks, while UCVME [61] employs a semi-supervised learning framework to improve performance with limited labeled data. CLIP+KNN [62] is a clustering method which uses CLIP feature for image score aggregation. We evaluate these methods using metrics of R2 and comparison accuracy.
Table 3 presents a detailed comparison across six perceptual dimensions from Place Pulse 2.0 and several trends can be observed. Among baseline methods, CLIP+KNN achieves the best performance, consistently outperforming traditional CNN-based methods (Streetscore, Adaptive Contrast, RESupCon) in both accuracy and across all dimensions. This highlights the strong generalization ability of CLIP features for visual perception tasks. Additionally, compared to all baselines, our proposed UP-CBM approach achieves new state-of-the-art results. UP-CBM with RN-101 backbone already surpasses CLIP+KNN by notable margins in most categories. UP-CBM with ViT-B backbone further improves the performance, achieving the best results across all six dimensions. Specifically, it boosts the Safe dimension accuracy to 0.9352 and the Beautiful dimension to 0.6174, representing substantial improvements.
There is also a clear trend is observed that ViT-based models (ViT-S, ViT-B) generally outperform ResNet-based models (RN-50, RN-101), reflecting the advantages of transformer architectures in modeling complex visual semantics for perceptual regression. The most important discovery is that, our method not only improves the comparison accuracy but also significantly raises the scores, indicating better regression quality and consistency with human perceptual judgments. These results demonstrate the effectiveness of our UP-CBM framework in capturing perceptual cues and improving generalization across diverse urban perception dimensions.
We further evaluate the performance of different concept-based classification methods on the VRVWPR dataset, which contains six perceptual dimensions: Walkability, Feasibility, Accessibility, Safety, Comfort, and Pleasurability. SENN [65] and ProtoPNet [17] are pioneering works that introduce interpretable prototypes or relevance scores for enhancing model explainability. BotCL [16] improves concept learning by combining bottleneck constraints with contrastive learning, while P-CBM [66] proposes a post-hoc concept bottleneck model for flexible concept supervision. LF-CBM [67] refines concept bottlenecks by leveraging label factorization to disentangle concept dependencies. We also include standard deep models (ResNet50, ViT-Base) as baselines for comparison.
As shown in Table 4, UP-CBM consistently achieves superior performance across all dimensions. Our UP-CBM model based on RN50 already matches or exceeds the strongest prior methods, while UP-CBM with ViT-B backbone further boosts the accuracy to new state-of-the-art levels. Specifically, it achieves an overall accuracy of 0.8835, outperforming the previous best method LF-CBM (0.8647) by a notable margin. Across individual dimensions, UP-CBM ViT-B achieves the highest accuracy on all six perceptual categories. For example, it improves Walkability to 0.9021, Feasibility to 0.9405, and Comfort to 0.9253, demonstrating that our framework can more effectively capture nuanced perceptual concepts compared to previous approaches. In addition, transformer-based models (ViT-B) consistently outperform convolutional networks (ResNet50) within both baseline and UP-CBM settings, highlighting the advantage of transformer architectures for concept-aware visual perception modeling. These results validate the effectiveness of our UP-CBM framework in enhancing both interpretability and prediction accuracy on perceptual classification tasks.

Table 4.
Performance comparison of different concept-based classification methods. We evaluate six perceptual dimensions from the VRVWPR dataset using classification accuracy.
Table 4.
Performance comparison of different concept-based classification methods. We evaluate six perceptual dimensions from the VRVWPR dataset using classification accuracy.
| Models | Walkability | Feasibility | Accessibility | Safety | Comfort | Pleasurability | Overall |
| ResNet50 [63] | .8652 | .9084 | .7561 | .7984 | .8950 | .8549 | .8497 |
| ViT-Base [64] | .8915 | .9321 | .7894 | .8361 | .9173 | .8805 | .8728 |
| ProtoPNet [17] | .8601 | .9001 | .7550 | .8002 | .8925 | .8508 | .8440 |
| SENN [65] | .8530 | .9019 | .7423 | .7820 | .8861 | .8427 | .8346 |
| P-CBM [66] | .8794 | .9206 | .7722 | .8189 | .9080 | .8655 | .8608 |
| BotCL [16] | .8743 | .9198 | .7705 | .8127 | .9042 | .8630 | .8574 |
| LF-CBM [67] | .8880 | .9297 | .7846 | .8295 | .9150 | .8780 | .8647 |
| UP-CBM RN50 (Ours) | .8825 | .9260 | .7790 | .8242 | .9192 | .8701 | .8655 |
| UP-CBM ViT-B (Ours) | .9021 | .9405 | .7980 | .8452 | .9253 | .8899 | .8835 |
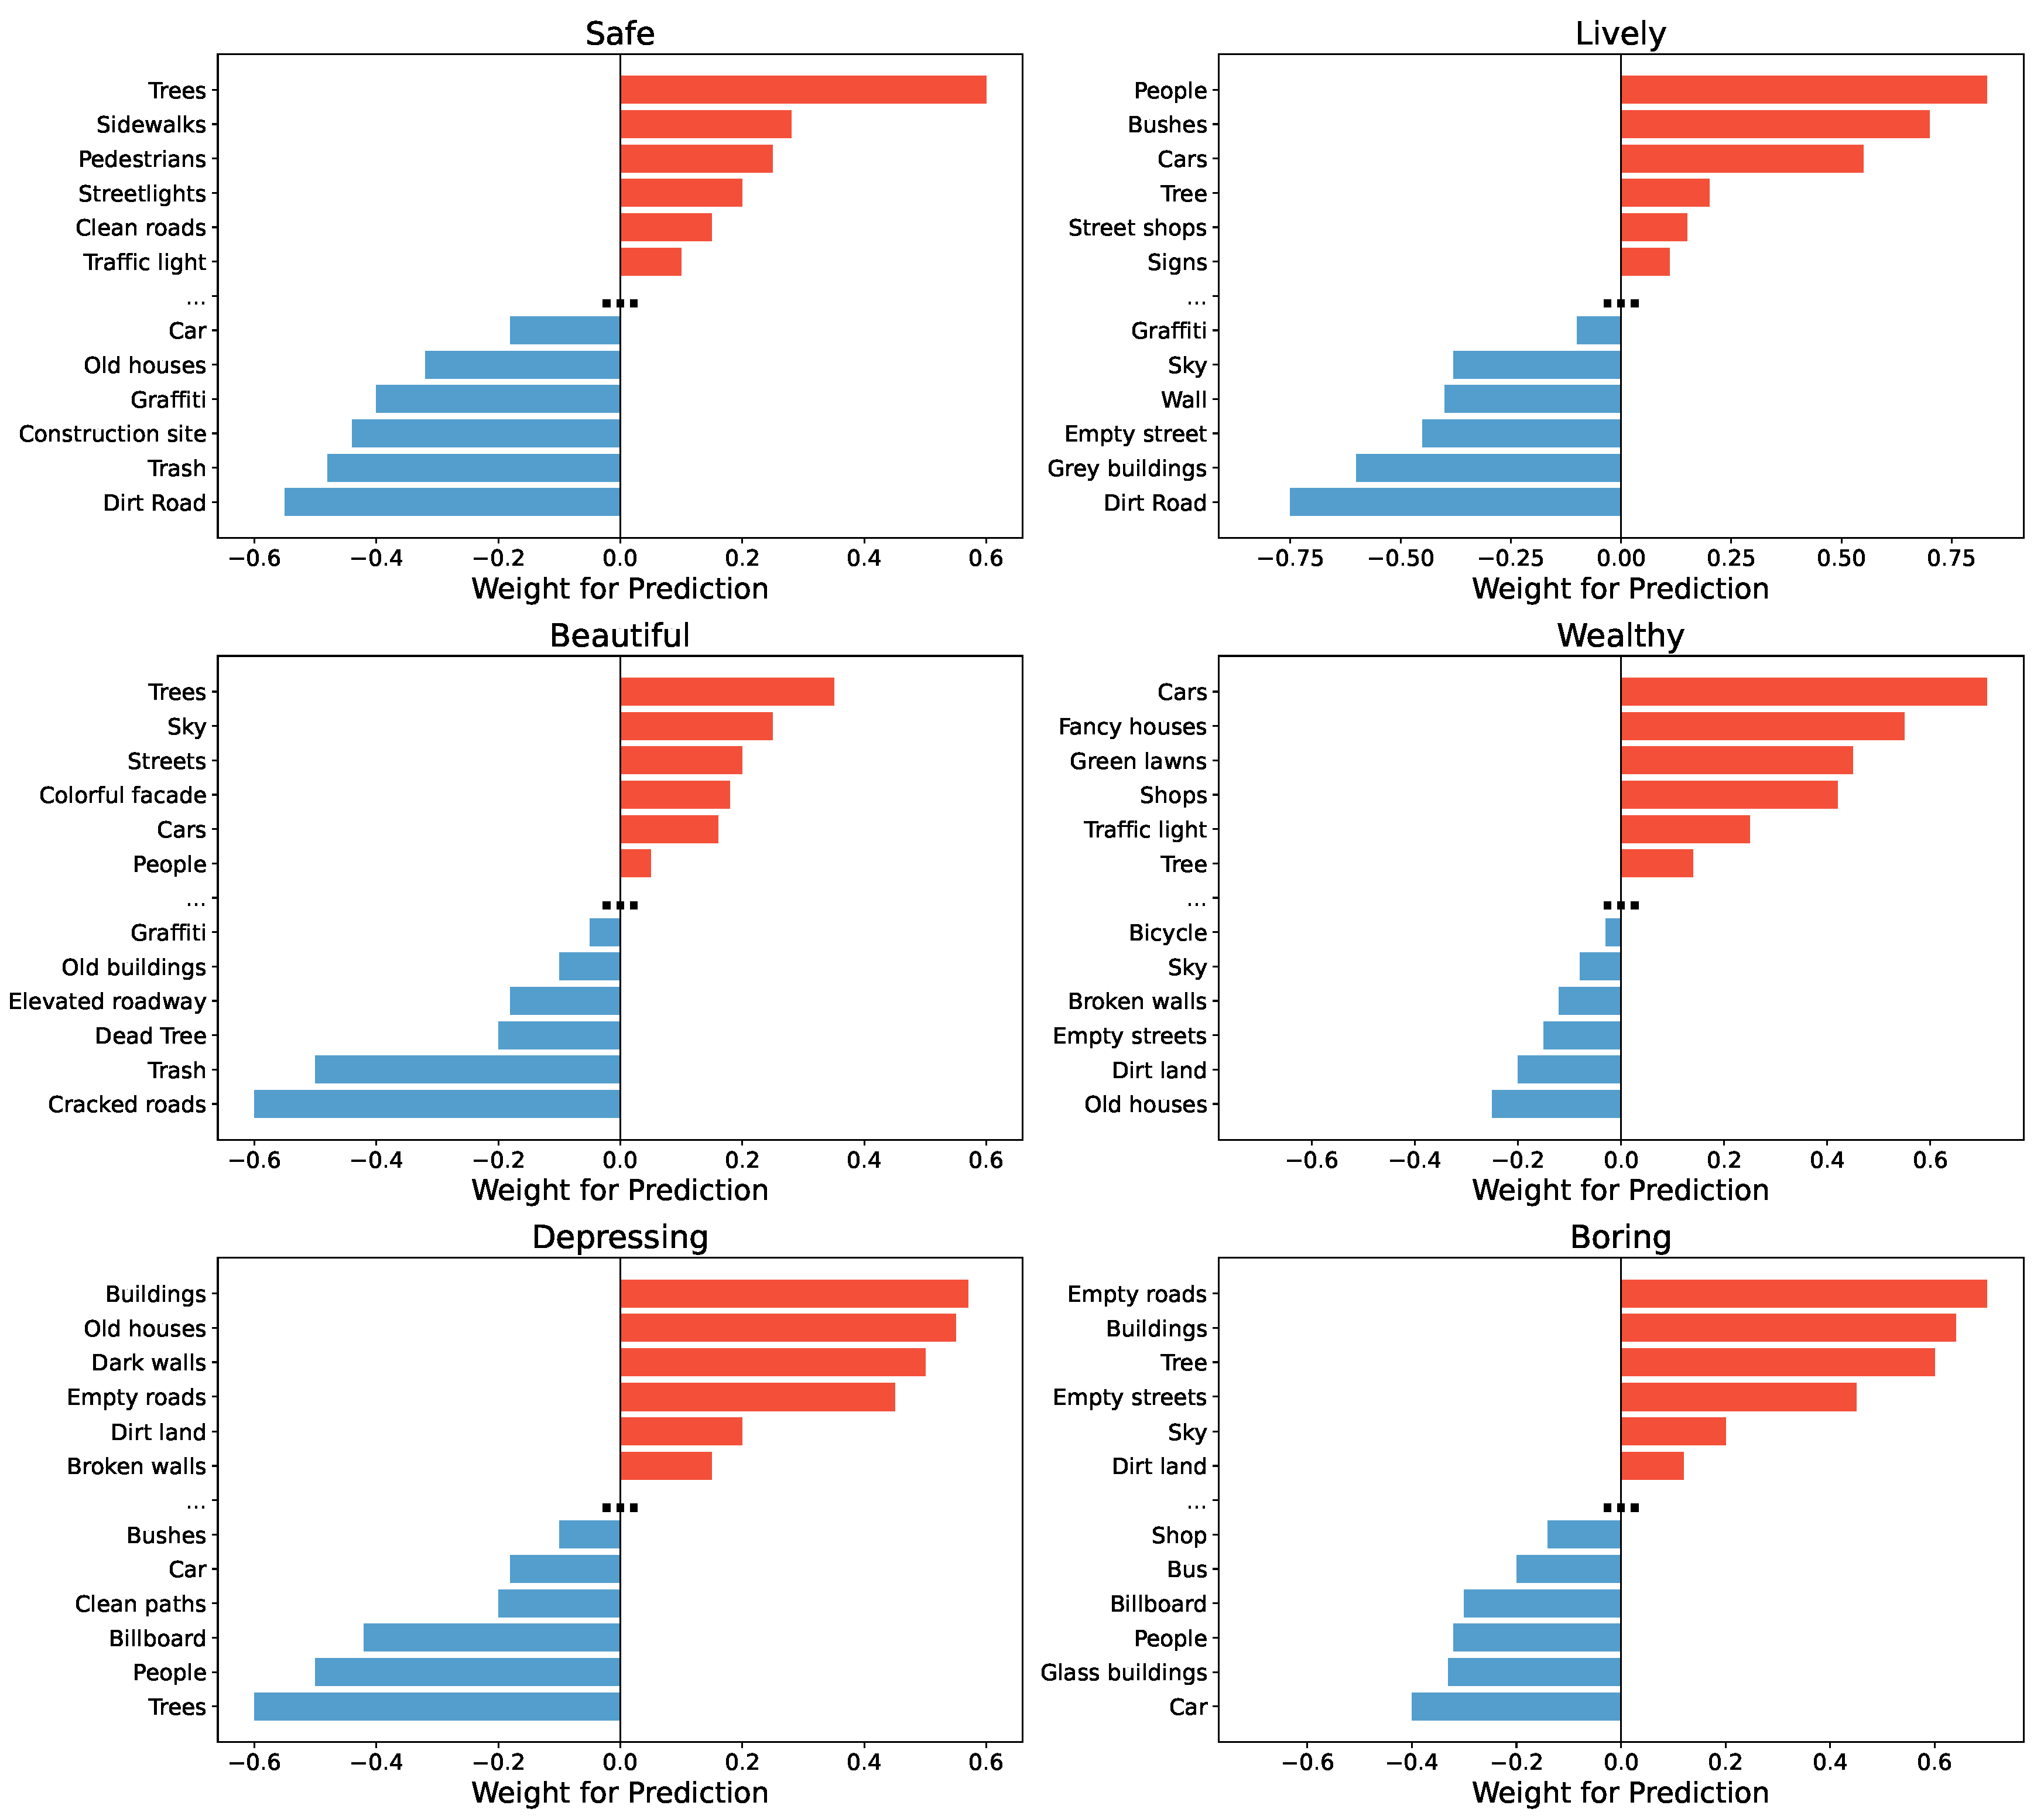
Figure 3.
The analysis of concept contribution for six dimensions. We show top 6 positive and negative concepts for the final prediction via classifier’s weight and concept activation statistic. Calculation is implemented across the whole test set.
Figure 3.
The analysis of concept contribution for six dimensions. We show top 6 positive and negative concepts for the final prediction via classifier’s weight and concept activation statistic. Calculation is implemented across the whole test set.
4.4. Concept Analysis
The objective of this experiment is to investigate the influence of various visual concepts on the prediction of urban perception dimensions. For each concept, we compute the product of its activation value and the corresponding weight from the fully connected classifier, and normalize the result to the range of (implemented across whole test set). A higher normalized value (closer to 1) indicates a positive contribution to the perception prediction, while a lower value (closer to -1) indicates a negative impact. To intuitively illustrate the role of different concepts, we plotted bar charts for each perception dimension. Positive concepts are shown in red, negative concepts are shown in blue, and a bold ellipsis visually separates positive and negative concepts (top 6 positive and negative concepts are demonstrated).
Across the different perception dimensions, we observe distinct patterns: For Safe, natural and pedestrian-friendly elements such as "Trees", "Sidewalks", and "Pedestrians" make strong positive contributions, highlighting the importance of greenery and pedestrian infrastructure for perceived safety. Conversely, elements indicative of environmental deterioration, such as "Trash", "Construction site", and "Graffiti", negatively affect safety perception. For Lively, the presence of "People", "Bushes", and "Cars" strongly enhances the sense of liveliness, emphasizing the role of human activity and transportation in shaping urban vibrancy. In contrast, empty streets ("Streets") and monotonous structures ("Grey buildings") significantly diminish the feeling of liveliness. For Beautiful, natural scenery elements such as "Trees" and "Sky", as well as colorful architectural features ("Colorful facade"), positively influence beauty perception. On the other hand, environmental damage such as "Cracked roads" and "Trash" substantially lowers perceived beauty, demonstrating the critical role of cleanliness and natural elements. For Wealthy, indicators of affluence, including "Fancy houses", "Shops", and "Green lawns", contribute strongly to the sense of wealth. Meanwhile, dilapidated elements like "Old houses" and "Cracked roads" exert a negative impact, suggesting that visual cues of maintenance and prosperity are closely tied to wealth perception. For Depressing, old and deteriorated structures like "Old houses", "Dark walls", and "Empty roads" are the major contributors, while the presence of "Trees" and "People" alleviates the depressing feeling. For Boring, monotony-related features such as "Empty roads", "Buildings", and "Empty streets" increase boredom, whereas "People" and "Shop" mitigate it by introducing diversity and activity.
Overall, these results demonstrate that specific visual elements have consistent and interpretable influences on different dimensions of urban perception, providing valuable insights for urban design and planning.
Figure 4 illustrates the concept-based interpretation process for the "Safe" score prediction during inference. The input street-view image is first processed by a backbone model to extract high-level visual features. These features are then passed through a bottleneck layer that generates a set of semantically meaningful concept maps, each highlighting the spatial regions associated with specific urban concepts. For each concept, a scalar contribution score is calculated, reflecting its influence on the final "Safe" score. Positive contributions indicate concepts that enhance the perceived safety, while negative contributions represent factors that detract from it.
In this example, "Tree" exhibits the highest positive contribution (0.582), suggesting that the presence of trees strongly promotes the perception of safety. "Clean Road" also positively contributes (0.201), reinforcing the intuition that well-maintained infrastructure improves safety perceptions. Other positive but smaller contributions are made by "House" (0.093), "People" (0.044), and "Sky" (0.031). Conversely, the presence of a "Car" negatively impacts the safety score (-0.171), implying that visible vehicles in this context are associated with lower perceived safety. "Dirt Land" shows a minor negative effect (-0.002). By aggregating these weighted contributions across concepts, the model produces a final "Safe" prediction score of 5.921. This decomposition provides an interpretable pathway from low-level visual features to high-level safety assessments, offering transparency and explainability for the model’s decision-making process.
Similarly, the concept-based analysis for the "Wealthy" score prediction (Figure 5) shows that "Dirt Land" makes the largest negative contribution (0.601). "Tree" (0.034) and "Shop" (0.013) also have minor positive effects. In contrast, "Sky" (-0.058) and "Old House" (-0.031) negatively impact the wealth prediction. "People" (0.007) and "Car" (0.001) contribute minimally. These aggregated concept contributions result in a final "Wealthy" score of 2.417.
4.5. Ablation Analysis
In this section, we analyze the impact of different module and hyperparameter settings.
As shown in Table 5, the results demonstrate the effectiveness of employing multi-scale visual prompts. When both 2x2 and 7x7 prompts are used together, the model achieves the best performance across both datasets, with an accuracy of 0.8567 and an of 0.5191 on Place Pulse 2.0, and a classification accuracy of 0.8835 on VRVWPR. Using only the 2x2 prompts leads to a notable performance drop of approximately 7-8 percentage points, indicating that coarse-scale features alone are insufficient for optimal perception modeling. In contrast, using only the 7x7 prompts results in a much smaller decrease (around 1-2 points), suggesting that fine-grained visual information contributes more significantly to performance. These results highlight the importance of integrating multiple spatial resolutions to capture complementary information for perception tasks.
In Figure 6, we analyze the impact of the CBL coefficient () on model performance across Place Pulse 2.0 and VRVWPR. When , the absence of CBL leads to notable performance degradation: the accuracy of Place Pulse 2.0 drops to 0.7367 () and falls to 0.3691 (), while VRVWPR accuracy decreases to 0.7635 (). As increases to 0.1 and 0.2, the performance improves but remains below baseline, with Place Pulse 2.0 accuracy reaching 0.7867 and 0.8167, respectively. At , the results become much closer to baseline levels, with Place Pulse 2.0 accuracy at 0.8467, at 0.4791, and VRVWPR accuracy at 0.8785. Further increasing to 0.8 and 1.0 leads to stabilization, where both accuracy and nearly match or slightly exceed baseline values. Beyond , although minor fluctuations occur (e.g., slight gains in accuracy and small decreases in ), no substantial improvement is observed. These results indicate that applying a moderate CBL coefficient ( between 0.5 and 1.0) effectively enhances model generalization, while larger values yield diminishing returns.
5. Discussion
5.1. Advantages and Potential Application of the Proposed Method
Our proposed UP-CBM framework presents several significant advantages for interpretable urban perception modeling. First, by constructing a task-specific visual concept vocabulary through GPT-4o and expert filtering, we address the challenge of subjective and continuous urban perception tasks without relying on rigid class labels. Second, the multi-scale visual prompting strategy enables fine-grained spatial probing of concept activations, bridging the gap between semantic-level concepts and spatial image features. Third, the integration of a CBL aligns model predictions with human-understandable visual elements, substantially enhancing interpretability without sacrificing predictive performance. Extensive experiments demonstrate that UP-CBM achieves state-of-the-art results on both Place Pulse 2.0 and VRVWPR datasets, validating the effectiveness of our transparent and scalable approach.
The transparent and interpretable nature of UP-CBM opens avenues for several practical applications. In urban planning, our framework can help policymakers and designers identify specific visual factors-such as greenery, street cleanliness, or architectural style-that positively or negatively influence public perception. This enables targeted interventions to enhance city livability and safety. Furthermore, in real estate, our method can be used to quantitatively assess and visualize neighborhood attractiveness, supporting value prediction and marketing strategies. Another promising application is in autonomous navigation and robotic urban exploration, where understanding human-centered perception dimensions could contribute to safer and more socially aware behavior planning for robots and vehicles operating in urban environments.
5.2. Limitations and Future Work
Despite its advantages, our framework still has several limitations. The concept generation process, although aided by large language models and expert filtering, remains somewhat dependent on the initial prompt design and may introduce biases toward certain visual features. Additionally, our reliance on pre-trained vision-language models like CLIP could limit the adaptability of UP-CBM to highly localized cultural contexts, where visual semantics differ across regions. While multi-scale prompting improves spatial grounding, the synthetic nature of the prompts (e.g., circles) might introduce artifacts or subtle domain shifts. Future work could explore dynamic, learned prompting strategies and adapt the concept vocabulary more flexibly across different cultural or environmental settings. Additionally, extending the framework to support multi-modal inputs (e.g., textual or geographic metadata) may further enrich the perception modeling and interpretability capabilities.
6. Conclusion
In this paper, we propose UP-CBM, a concept-based interpretable framework for urban perception modeling. By constructing a task-specific visual concept vocabulary through GPT-4o prompting, and integrating multi-scale visual prompting with a CBL aligned with CLIP similarity maps, our method achieves a transparent and scalable modeling pipeline. UP-CBM not only improves predictive performance on benchmark datasets such as Place Pulse 2.0 and VRVWPR but also enhances model interpretability by grounding perceptual predictions in human-understandable concepts. Extensive experiments demonstrate that UP-CBM consistently outperforms strong baselines across multiple urban perception dimensions, offering clear advantages in both regression and classification settings. Furthermore, the spatial localization of concepts and the analysis of their contributions provide valuable insights for understanding and improving urban environments. We believe that the integration of VFMs and concept-based reasoning holds great potential for advancing human-centered and transparent urban analysis. Future work will focus on addressing cultural generalization, dynamically adapting concept vocabularies, and extending the framework to multi-modal urban perception tasks.
Author Contributions
Conceptualization, Y.Y., B.W., and J.Z.; Methodology, Y.Y., B.W., and J.Z.; Software, Z.Y. and B.W.; Validation, J.Z., and R.W.; Formal analysis, Y.Y. and B.W.; Investigation, Y.Y.; Resources, J.Z.; Data curation, Z.Y.; Writing—original draft preparation, Y.Y., J.Z. and Z.Y.; Writing—review and editing, Y.Y., B.W., and J.Z.; Visualization, B.W. and Z.Y.; Supervision, J.Z.; Project administration, J.Z.; Funding acquisition, J.Z. All authors have read and agreed to the published version of the manuscript.
Funding
This research was supported by Jiangxi Provincial Department of Science and Technology Natural Science Foundation, Grant No. 20242BAB20223.
Institutional Review Board Statement
Not applicable.
Informed Consent Statement
Not applicable.
Data Availability Statement
Data and source code are available by contacting corresponding author.
Acknowledgments
Not applicable.
Conflicts of Interest
The authors declare no conflicts of interest.
References
- Qiu, W.; Li, W.; Liu, X.; Zhang, Z.; Li, X.; Huang, X. Subjective and objective measures of streetscape perceptions: Relationships with property value in Shanghai. Cities 2023, 132, 104037. [Google Scholar] [CrossRef]
- Wang, L.; Han, X.; He, J.; Jung, T. Measuring residents’ perceptions of city streets to inform better street planning through deep learning and space syntax. ISPRS Journal of Photogrammetry and Remote Sensing 2022, 190, 215–230. [Google Scholar] [CrossRef]
- Keizer, K.; Lindenberg, S.; Steg, L. The spreading of disorder. science 2008, 322, 1681–1685. [Google Scholar] [CrossRef]
- Kelling, G.L.; Wilson, J.Q.; et al. Broken windows. Atlantic monthly 1982, 249, 29–38. [Google Scholar]
- Xue, Y.; Li, C. Extracting Chinese geographic data from Baidu map API. The Stata Journal 2020, 20, 805–811. [Google Scholar] [CrossRef]
- Wang, B.; Zhang, J.; Zhang, R.; Li, Y.; Li, L.; Nakashima, Y. Improving facade parsing with vision transformers and line integration. Advanced Engineering Informatics 2024, 60, 102463. [Google Scholar] [CrossRef]
- Fan, Z.; Zhang, F.; Loo, B.P.; Ratti, C. Urban visual intelligence: Uncovering hidden city profiles with street view images. Proceedings of the National Academy of Sciences 2023, 120, e2220417120. [Google Scholar] [CrossRef] [PubMed]
- Nasar, J.L. The evaluative image of the city. Journal of the American Planning Association 1990, 56, 41–53. [Google Scholar] [CrossRef]
- Yao, Y.; Liang, Z.; Yuan, Z.; Liu, P.; Bie, Y.; Zhang, J.; Wang, R.; Wang, J.; Guan, Q. A human-machine adversarial scoring framework for urban perception assessment using street-view images. International Journal of Geographical Information Science 2019, 33, 2363–2384. [Google Scholar] [CrossRef]
- Salesses, M.P. Place Pulse: Measuring the Collaborative Image of the City. Masters thesis, Massachusetts Institute of Technology, Cambridge, MA, 2012.
- Salesses, P.; Schechtner, K.; Hidalgo, C.A. The collaborative image of the city: mapping the inequality of urban perception. PloS one 2013, 8, e68400. [Google Scholar] [CrossRef]
- Awais, M.; Naseer, M.; Khan, S.; Anwer, R.M.; Cholakkal, H.; Shah, M.; Yang, M.H.; Khan, F.S. Foundation Models Defining a New Era in Vision: a Survey and Outlook. IEEE Transactions on Pattern Analysis and Machine Intelligence 2025. [Google Scholar] [CrossRef] [PubMed]
- Radford, A.; Kim, J.W.; Hallacy, C.; Ramesh, A.; Goh, G.; Agarwal, S.; Sastry, G.; Askell, A.; Mishkin, P.; Clark, J.; et al. Learning transferable visual models from natural language supervision. In Proceedings of the International conference on machine learning. PMLR; 2021; pp. 8748–8763. [Google Scholar]
- Oquab, M.; Darcet, T.; Moutakanni, T.; Vo, H.; Szafraniec, M.; Khalidov, V.; Fernandez, P.; Haziza, D.; Massa, F.; El-Nouby, A.; et al. Dinov2: Learning robust visual features without supervision. arXiv preprint arXiv:2304.07193 2023.
- Koh, P.W.; Nguyen, T.; Pierson, E.; et al. Concept Bottleneck Models. ICML 2020.
- Wang, B.; Li, L.; Nakashima, Y.; Nagahara, H. Learning Bottleneck Concepts in Image Classification. In Proceedings of the IEEE Conference on Computer Vision and Pattern Recognition (CVPR), 2023.
- Chen, C.; Li, O.; Tao, D.; Barnett, A.; Rudin, C.; Su, J.K. This looks like that: deep learning for interpretable image recognition. Advances in neural information processing systems 2019, 32. [Google Scholar]
- Shtedritski, A.; Rupprecht, C.; Vedaldi, A. What does clip know about a red circle? visual prompt engineering for vlms. In Proceedings of the Proceedings of the IEEE/CVF International Conference on Computer Vision, 2023, pp. 11987–11997.
- Benou, N.; Chen, L.; Gao, X. SALF-CBM: Spatially-Aware and Label-Free Concept Bottleneck Models. ICLR 2025. [Google Scholar]
- Achiam, J.; Adler, S.; Agarwal, S.; Ahmad, L.; Akkaya, I.; Aleman, F.L.; Almeida, D.; Altenschmidt, J.; Altman, S.; Anadkat, S.; et al. GPT-4 technical report. arXiv preprint arXiv:2303.08774 2023.
- Devlin, J. Bert: Pre-training of deep bidirectional transformers for language understanding. arXiv preprint arXiv:1810.04805 2018.
- Zhong, N.; Jiang, X.; Yao, Y. From Detection to Explanation: Integrating Temporal and Spatial Features for Rumor Detection and Explaining Results Using LLMs. Computers, Materials & Continua 2025, 82. [Google Scholar]
- Sun, W.J.; Liu, X.F. Learning Temporal User Features for Repost Prediction with Large Language Models. Computers, Materials & Continua 2025, 82. [Google Scholar]
- Li, Y.; Yabuki, N.; Fukuda, T. Measuring visual walkability perception using panoramic street view images, virtual reality, and deep learning. Sustainable Cities and Society 2022, 86, 104140. [Google Scholar] [CrossRef]
- Wang, B.; Chang, J.; Qian, Y.; Chen, G.; Chen, J.; Jiang, Z.; Zhang, J.; Nakashima, Y.; Nagahara, H. DiReCT: Diagnostic Reasoning for Clinical Notes via Large Language Models. In Proceedings of the Advances in Neural Information Processing Systems, 2024, Vol. 37, pp. 74999–75011.
- Brown, T.B. Language models are few-shot learners. arXiv preprint arXiv:2005.14165 2020.
- Chen, J.; Wang, B.; Jiang, Z.; Nakashima, Y. Putting People in LLMs’ Shoes: Generating Better Answers via Question Rewriter. In Proceedings of the Proceedings of the AAAI Conference on Artificial Intelligence, 2025, Vol. 39, pp. 23577–23585.
- Liu, J.; Li, L.; Xiang, T.; Wang, B.; Qian, Y. Tcra-llm: Token compression retrieval augmented large language model for inference cost reduction. arXiv preprint arXiv:2310.15556 2023.
- Cheng, Y.; Li, L.; Xu, Y.; Li, X.; Yang, Z.; Wang, W.; Yang, Y. Segment and track anything. arXiv preprint arXiv:2305.06558 2023.
- Andriiashen, V.; van Liere, R.; van Leeuwen, T.; Batenburg, K.J. Unsupervised foreign object detection based on dual-energy absorptiometry in the food industry. Journal of Imaging 2021, 7, 104. [Google Scholar] [CrossRef]
- Yang, J.; Gao, M.; Li, Z.; Gao, S.; Wang, F.; Zheng, F. Track anything: Segment anything meets videos. arXiv preprint arXiv:2304.11968 2023.
- Zhu, J.; Chen, Z.; Hao, Z.; Chang, S.; Zhang, L.; Wang, D.; Lu, H.; Luo, B.; He, J.Y.; Lan, J.P.; et al. Tracking anything in high quality. arXiv preprint arXiv:2307.13974 2023.
- Park, W.; Choi, Y.; Mekala, M.S.; SangChoi, G.; Yoo, K.Y.; Jung, H.y. A latency-efficient integration of channel attention for ConvNets. Computers, materials and continua 2025, 82. [Google Scholar] [CrossRef]
- Wang, H.; Zhang, Y.; Zhu, C. YOLO-LFD: A Lightweight and Fast Model for Forest Fire Detection. Computers, Materials & Continua 2025, 82. [Google Scholar]
- Zhang, K.; Liu, D. Customized segment anything model for medical image segmentation. arXiv preprint arXiv:2304.13785 2023.
- Chen, T.; Mai, Z.; Li, R.; Chao, W.l. Segment anything model (sam) enhanced pseudo labels for weakly supervised semantic segmentation. arXiv preprint arXiv:2305.05803 2023.
- Myers, J.; Najafian, K.; Maleki, F.; Ovens, K. Efficient Wheat Head Segmentation with Minimal Annotation: A Generative Approach. Journal of Imaging 2024, 10. [Google Scholar] [CrossRef]
- Boston, T.; Van Dijk, A.; Thackway, R. U-Net Convolutional Neural Network for Mapping Natural Vegetation and Forest Types from Landsat Imagery in Southeastern Australia. Journal of Imaging 2024, 10, 143. [Google Scholar] [CrossRef]
- Kwenda, C.; Gwetu, M.; Fonou-Dombeu, J.V. Hybridizing Deep Neural Networks and Machine Learning Models for Aerial Satellite Forest Image Segmentation. Journal of Imaging 2024, 10, 132. [Google Scholar] [CrossRef] [PubMed]
- Jung, H.; Park, H.; Jung, H.S.; Lee, K. Enhancing Building Facade Image Segmentation via Object-Wise Processing and Cascade U-Net. Computers, Materials & Continua 2024, 81. [Google Scholar]
- Shen, Q.; Yang, X.; Wang, X. Anything-3d: Towards single-view anything reconstruction in the wild. arXiv preprint arXiv:2304.10261 2023.
- He, K.; Chen, X.; Xie, S.; Li, Y.; Dollár, P.; Girshick, R. Masked autoencoders are scalable vision learners. In Proceedings of the Proceedings of the IEEE/CVF conference on computer vision and pattern recognition, 2022, pp. 16000–16009.
- Zhang, J.; Wang, B.; Li, L.; Nakashima, Y.; Nagahara, H. Instruct me more! random prompting for visual in-context learning. In Proceedings of the Proceedings of the IEEE/CVF Winter Conference on Applications of Computer Vision, 2024, pp. 2597–2606.
- Yan, Y.; Wen, H.; Zhong, S.; Chen, W.; Chen, H.; Wen, Q.; Zimmermann, R.; Liang, Y. Urbanclip: Learning text-enhanced urban region profiling with contrastive language-image pretraining from the web. In Proceedings of the Proceedings of the ACM Web Conference 2024, 2024, pp. 4006–4017. [Google Scholar]
- Hao, X.; Chen, W.; Yan, Y.; Zhong, S.; Wang, K.; Wen, Q.; Liang, Y. UrbanVLP: Multi-granularity vision-language pretraining for urban socioeconomic indicator prediction. In Proceedings of the Proceedings of the AAAI Conference on Artificial Intelligence, 2025, Vol. 39, pp. 28061–28069.
- Yang, J.; Ding, R.; Brown, E.; Qi, X.; Xie, S. V-irl: Grounding virtual intelligence in real life. In Proceedings of the European Conference on Computer Vision. Springer, 2024, pp. 36–55.
- Naik, N.; Philipoom, J.; Raskar, R.; Hidalgo, C. Streetscore-predicting the perceived safety of one million streetscapes. In Proceedings of the Proceedings of the IEEE conference on computer vision and pattern recognition workshops, 2014, pp. 779–785.
- Naik, N.; Raskar, R.; Hidalgo, C.A. Cities are physical too: Using computer vision to measure the quality and impact of urban appearance. American Economic Review 2016, 106, 128–132. [Google Scholar] [CrossRef]
- Griew, P.; Hillsdon, M.; Foster, C.; Coombes, E.; Jones, A.; Wilkinson, P. Developing and testing a street audit tool using Google Street View to measure environmental supportiveness for physical activity. International Journal of Behavioral Nutrition and Physical Activity 2013, 10, 1–7. [Google Scholar] [CrossRef] [PubMed]
- Halpern, D. Mental health and the built environment: more than bricks and mortar?; Routledge, 2014.
- Wang, B.; Li, L.; Verma, M.; Nakashima, Y.; Kawasaki, R.; Nagahara, H. Match them up: visually explainable few-shot image classification. Applied Intelligence 2023, 53, 10956–10977. [Google Scholar] [CrossRef]
- Alvarez-Melis, D.; Jaakkola, T. Robust and interpretable models via probabilistic modeling of sparse structures. In Proceedings of the ICML, 2018.
- Ghorbani, A.; Wexler, J.; Zou, J.; Kim, B. Towards Automatic Concept-based Explanations. In Proceedings of the NeurIPS; 2019. [Google Scholar]
- Ge, S.; Zhang, L.; Liu, Q. Robust Concept-based Interpretability with Variational Concept Embedding. NeurIPS 2021. [Google Scholar]
- Wang, B.; Li, L.; Verma, M.; Nakashima, Y.; Kawasaki, R.; Nagahara, H. MTUNet: Few-shot Image Classification with Visual Explanations. In Proceedings of the IEEE/CVF Conference on Computer Vision and Pattern Recognition Workshop, 2021.
- Laugel, T.; Lesot, M.J.; Marsala, C.; et al. The Dangers of Post-hoc Interpretability: Unjustified Counterfactual Explanations. In Proceedings of the IJCAI, 2019.
- Zhang, Q.; Zhu, Y.N. Visual Interpretability for Deep Learning: A Survey. In Proceedings of the Frontiers of Information Technology & Electronic Engineering; 2018. [Google Scholar]
- Loshchilov, I.; Hutter, F. Decoupled weight decay regularization. arXiv preprint arXiv:1711.05101 2017.
- Zhou, Z.; Zhao, Y.; Zuo, H.; Chen, W. Ranking Enhanced Supervised Contrastive Learning for Regression. In Proceedings of the Advances in Knowledge Discovery and Data Mining; 2024; pp. 15–27. [Google Scholar]
- Dai, W.; Li, X.; Chiu, W.H.K.; Kuo, M.D.; Cheng, K.T. Adaptive contrast for image regression in computer-aided disease assessment. IEEE Transactions on Medical Imaging 2021, 41, 1255–1268. [Google Scholar] [CrossRef]
- Dai, W.; Li, X.; Cheng, K.T. Semi-supervised deep regression with uncertainty consistency and variational model ensembling via bayesian neural networks. In Proceedings of the Proceedings of the AAAI Conference on Artificial Intelligence, 2023, Vol. 37, pp. 7304–7313.
- Zhang, J.; Li, Y.; Fukuda, T.; Wang, B. Revolutionizing urban safety perception assessments: Integrating multimodal large language models with street view images. arXiv preprint arXiv:2407.19719 2024.
- He, K.; Zhang, X.; Ren, S.; Sun, J. Deep residual learning for image recognition. In Proceedings of the Proceedings of the IEEE conference on computer vision and pattern recognition, 2016, pp. 770–778.
- Dosovitskiy, A.; Beyer, L.; Kolesnikov, A.; Weissenborn, D.; Zhai, X.; Unterthiner, T.; Dehghani, M.; Minderer, M.; Heigold, G.; Gelly, S.; et al. An image is worth 16x16 words: Transformers for image recognition at scale. In Proceedings of the International Conference on Learning Representations, 2021.
- Alvarez Melis, D.; Jaakkola, T. Towards robust interpretability with self-explaining neural networks. Advances in neural information processing systems 2018, 31. [Google Scholar]
- Yuksekgonul, M.; Wang, M.; Zou, J. Post-hoc concept bottleneck models. arXiv preprint arXiv:2205.15480 2022.
- Oikarinen, T.; Das, S.; Nguyen, L.M.; Weng, T.W. Label-free concept bottleneck models. arXiv preprint arXiv:2304.06129 2023.
Figure 1.
Using circles to pin-point urban concepts in street view images via a VLM model CLIP.
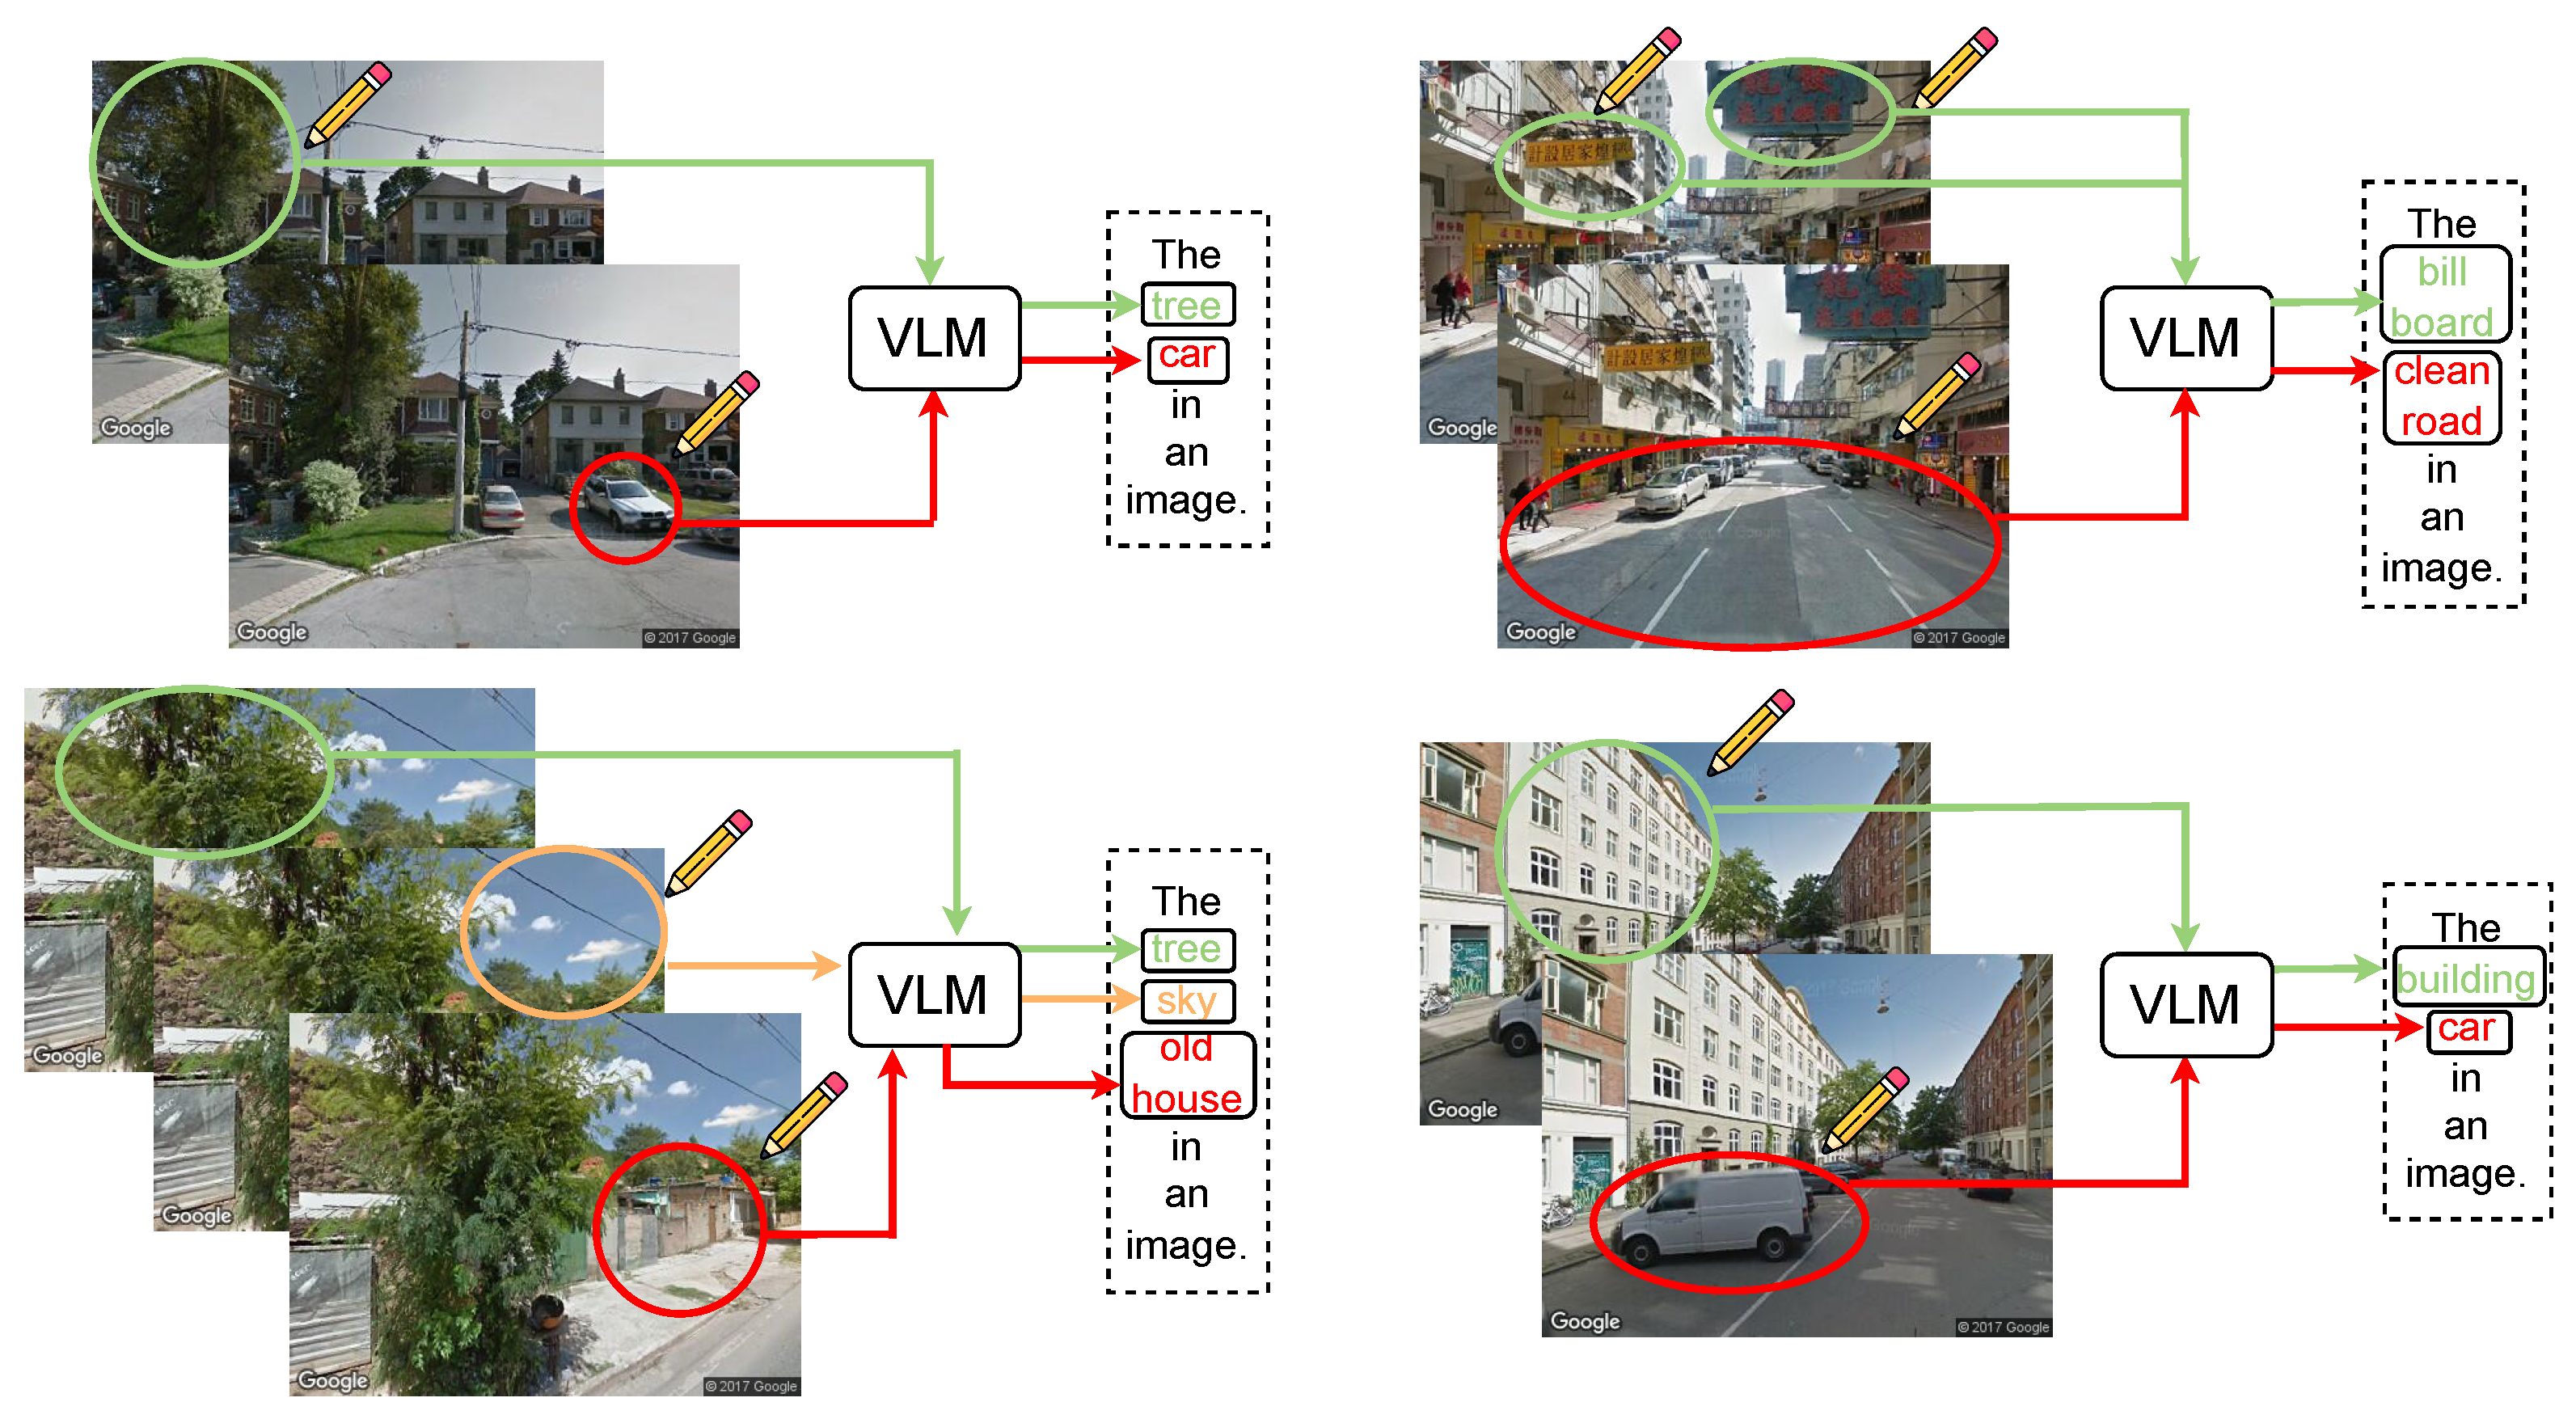
Figure 2.
The overall pipeline of our proposed concept-based interpretable urban perception model.
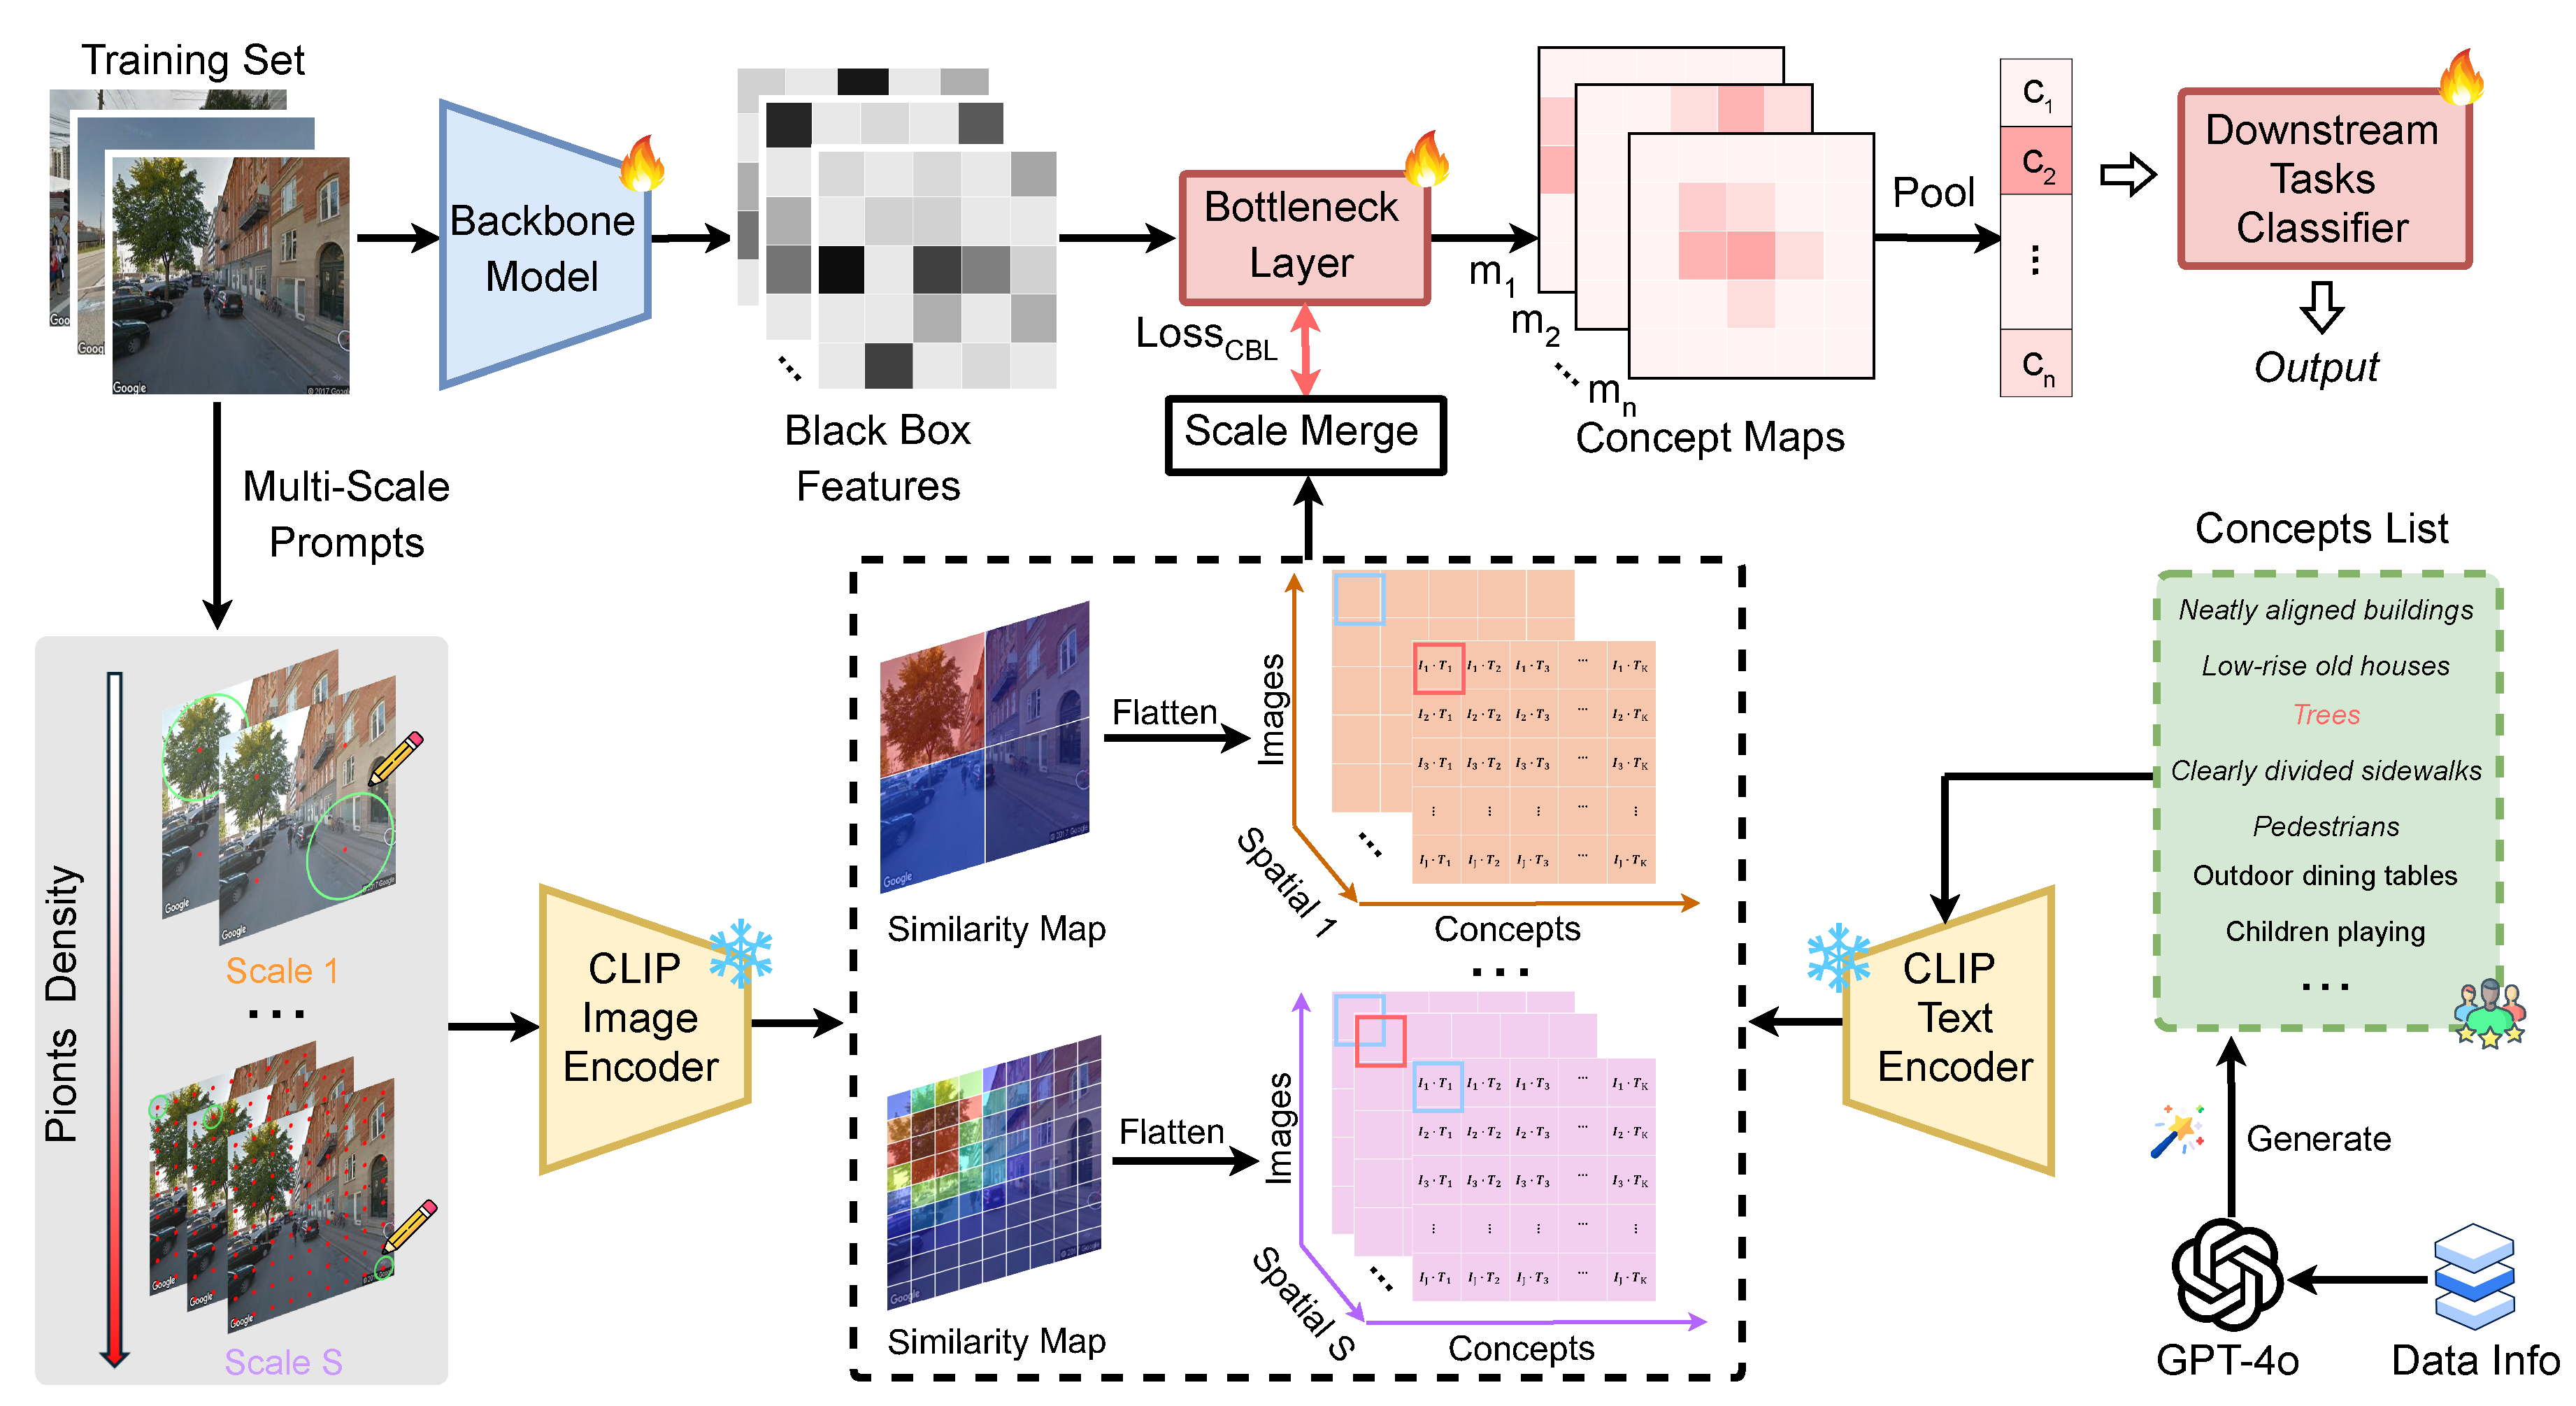
Figure 4.
Concepts analysis for "Safe" score prediction during inference phase.
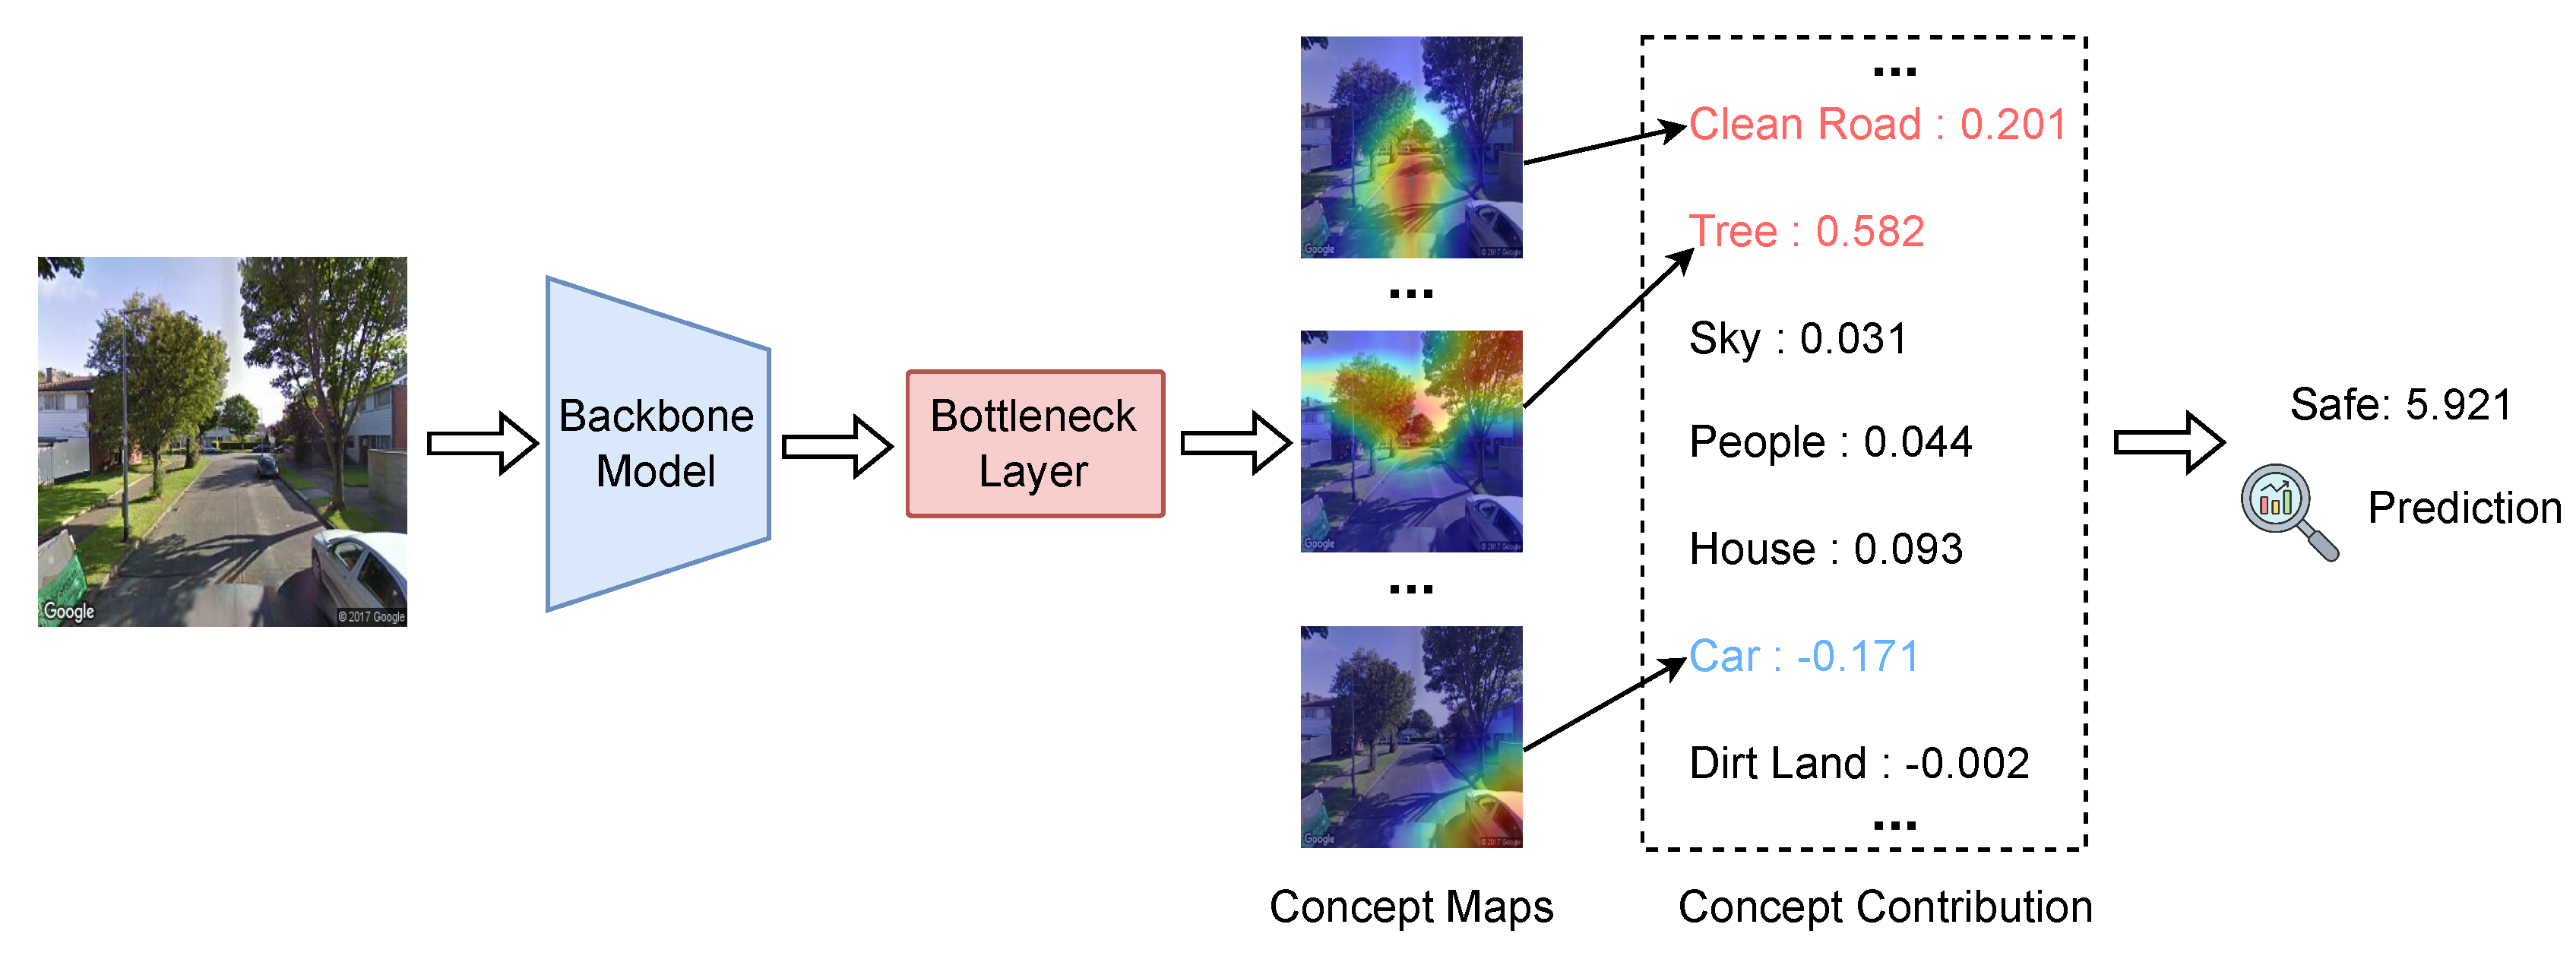
Figure 5.
Concepts analysis for "Wealthy" score prediction during inference phase.
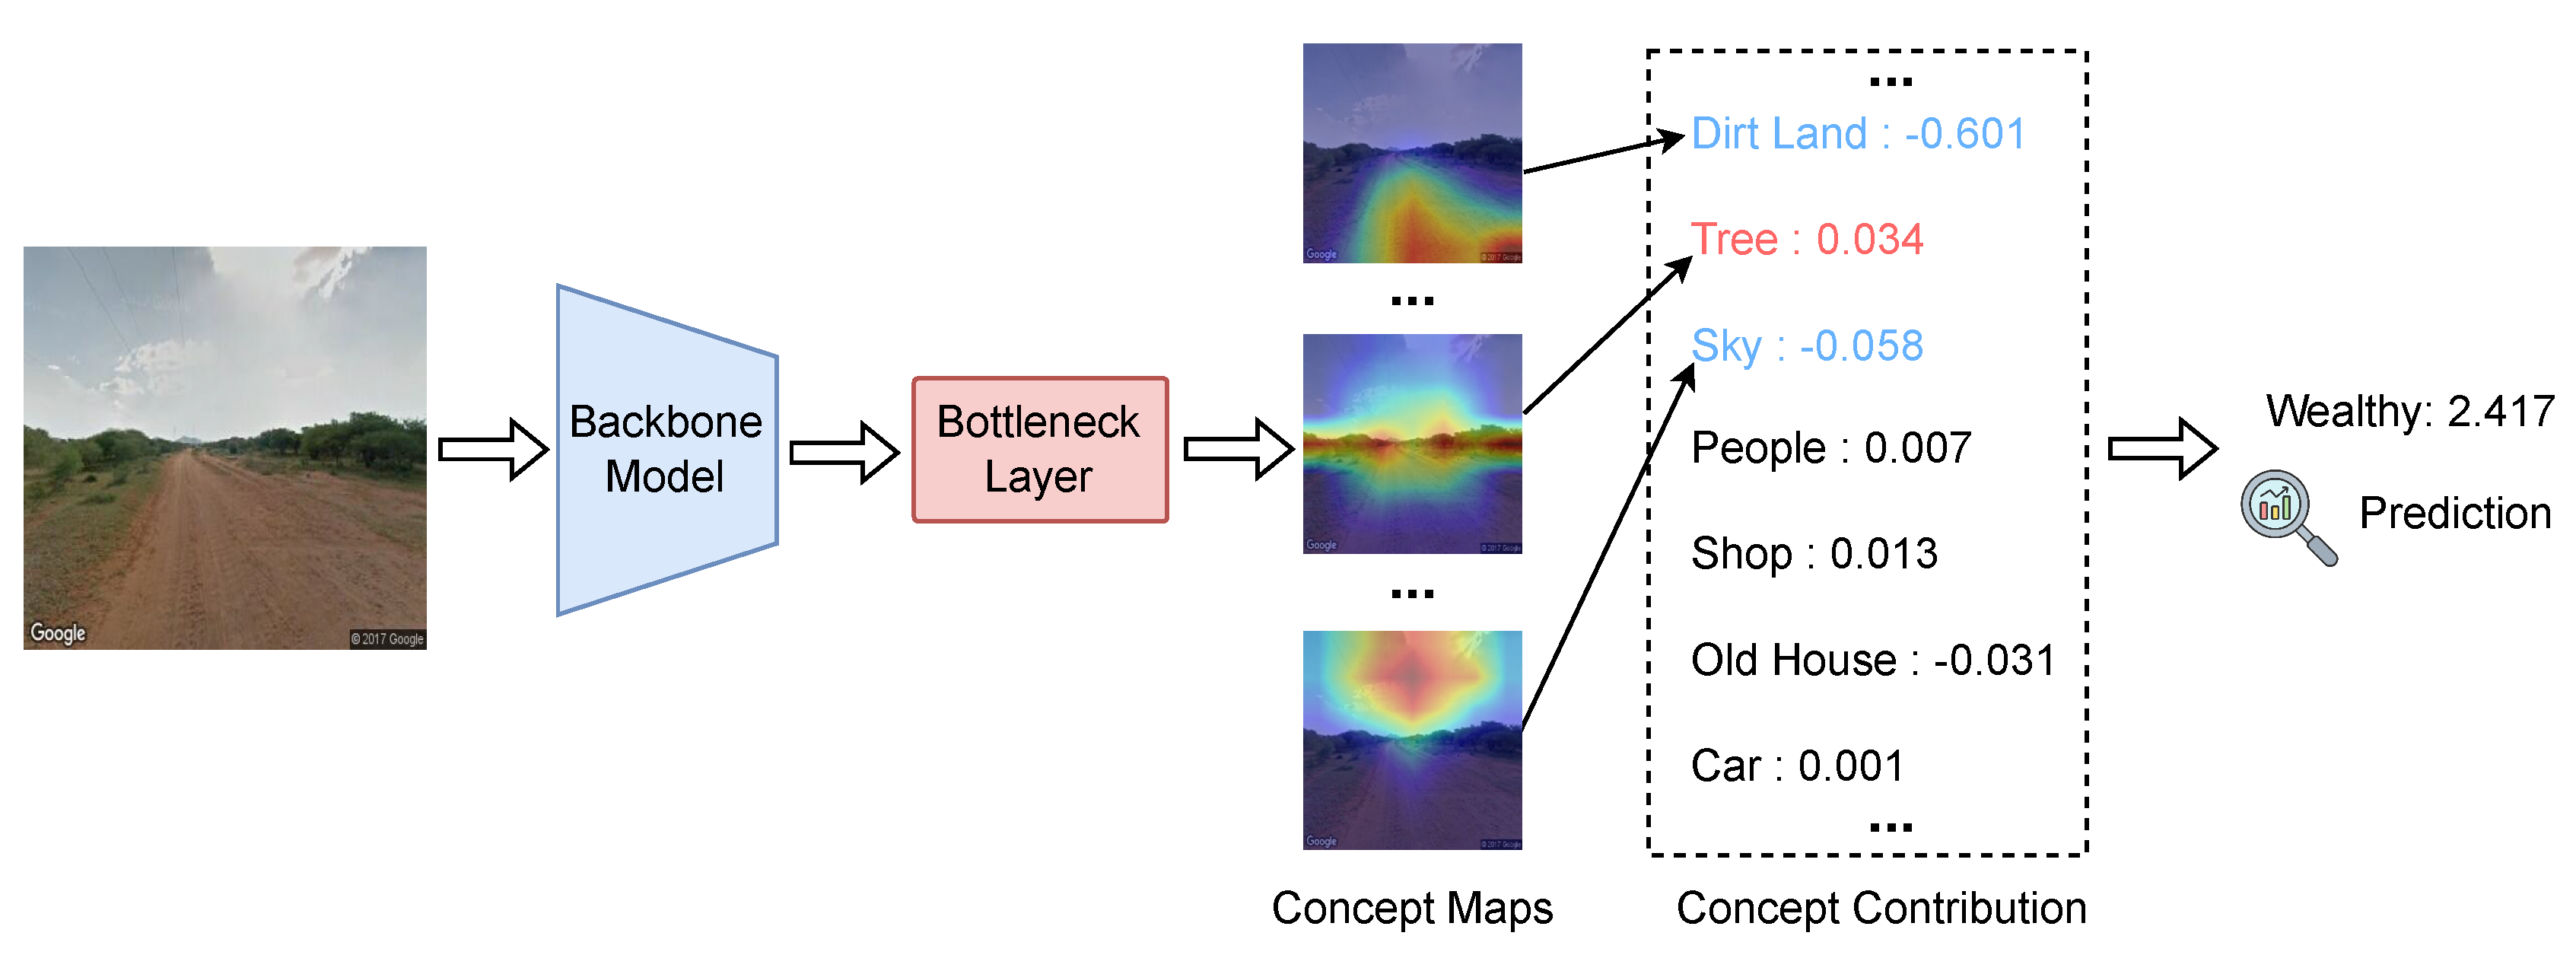
Figure 6.
Effect of CBL Coefficient () on Performance. All Experiments use ViT-B as the backbone model.
Figure 6.
Effect of CBL Coefficient () on Performance. All Experiments use ViT-B as the backbone model.
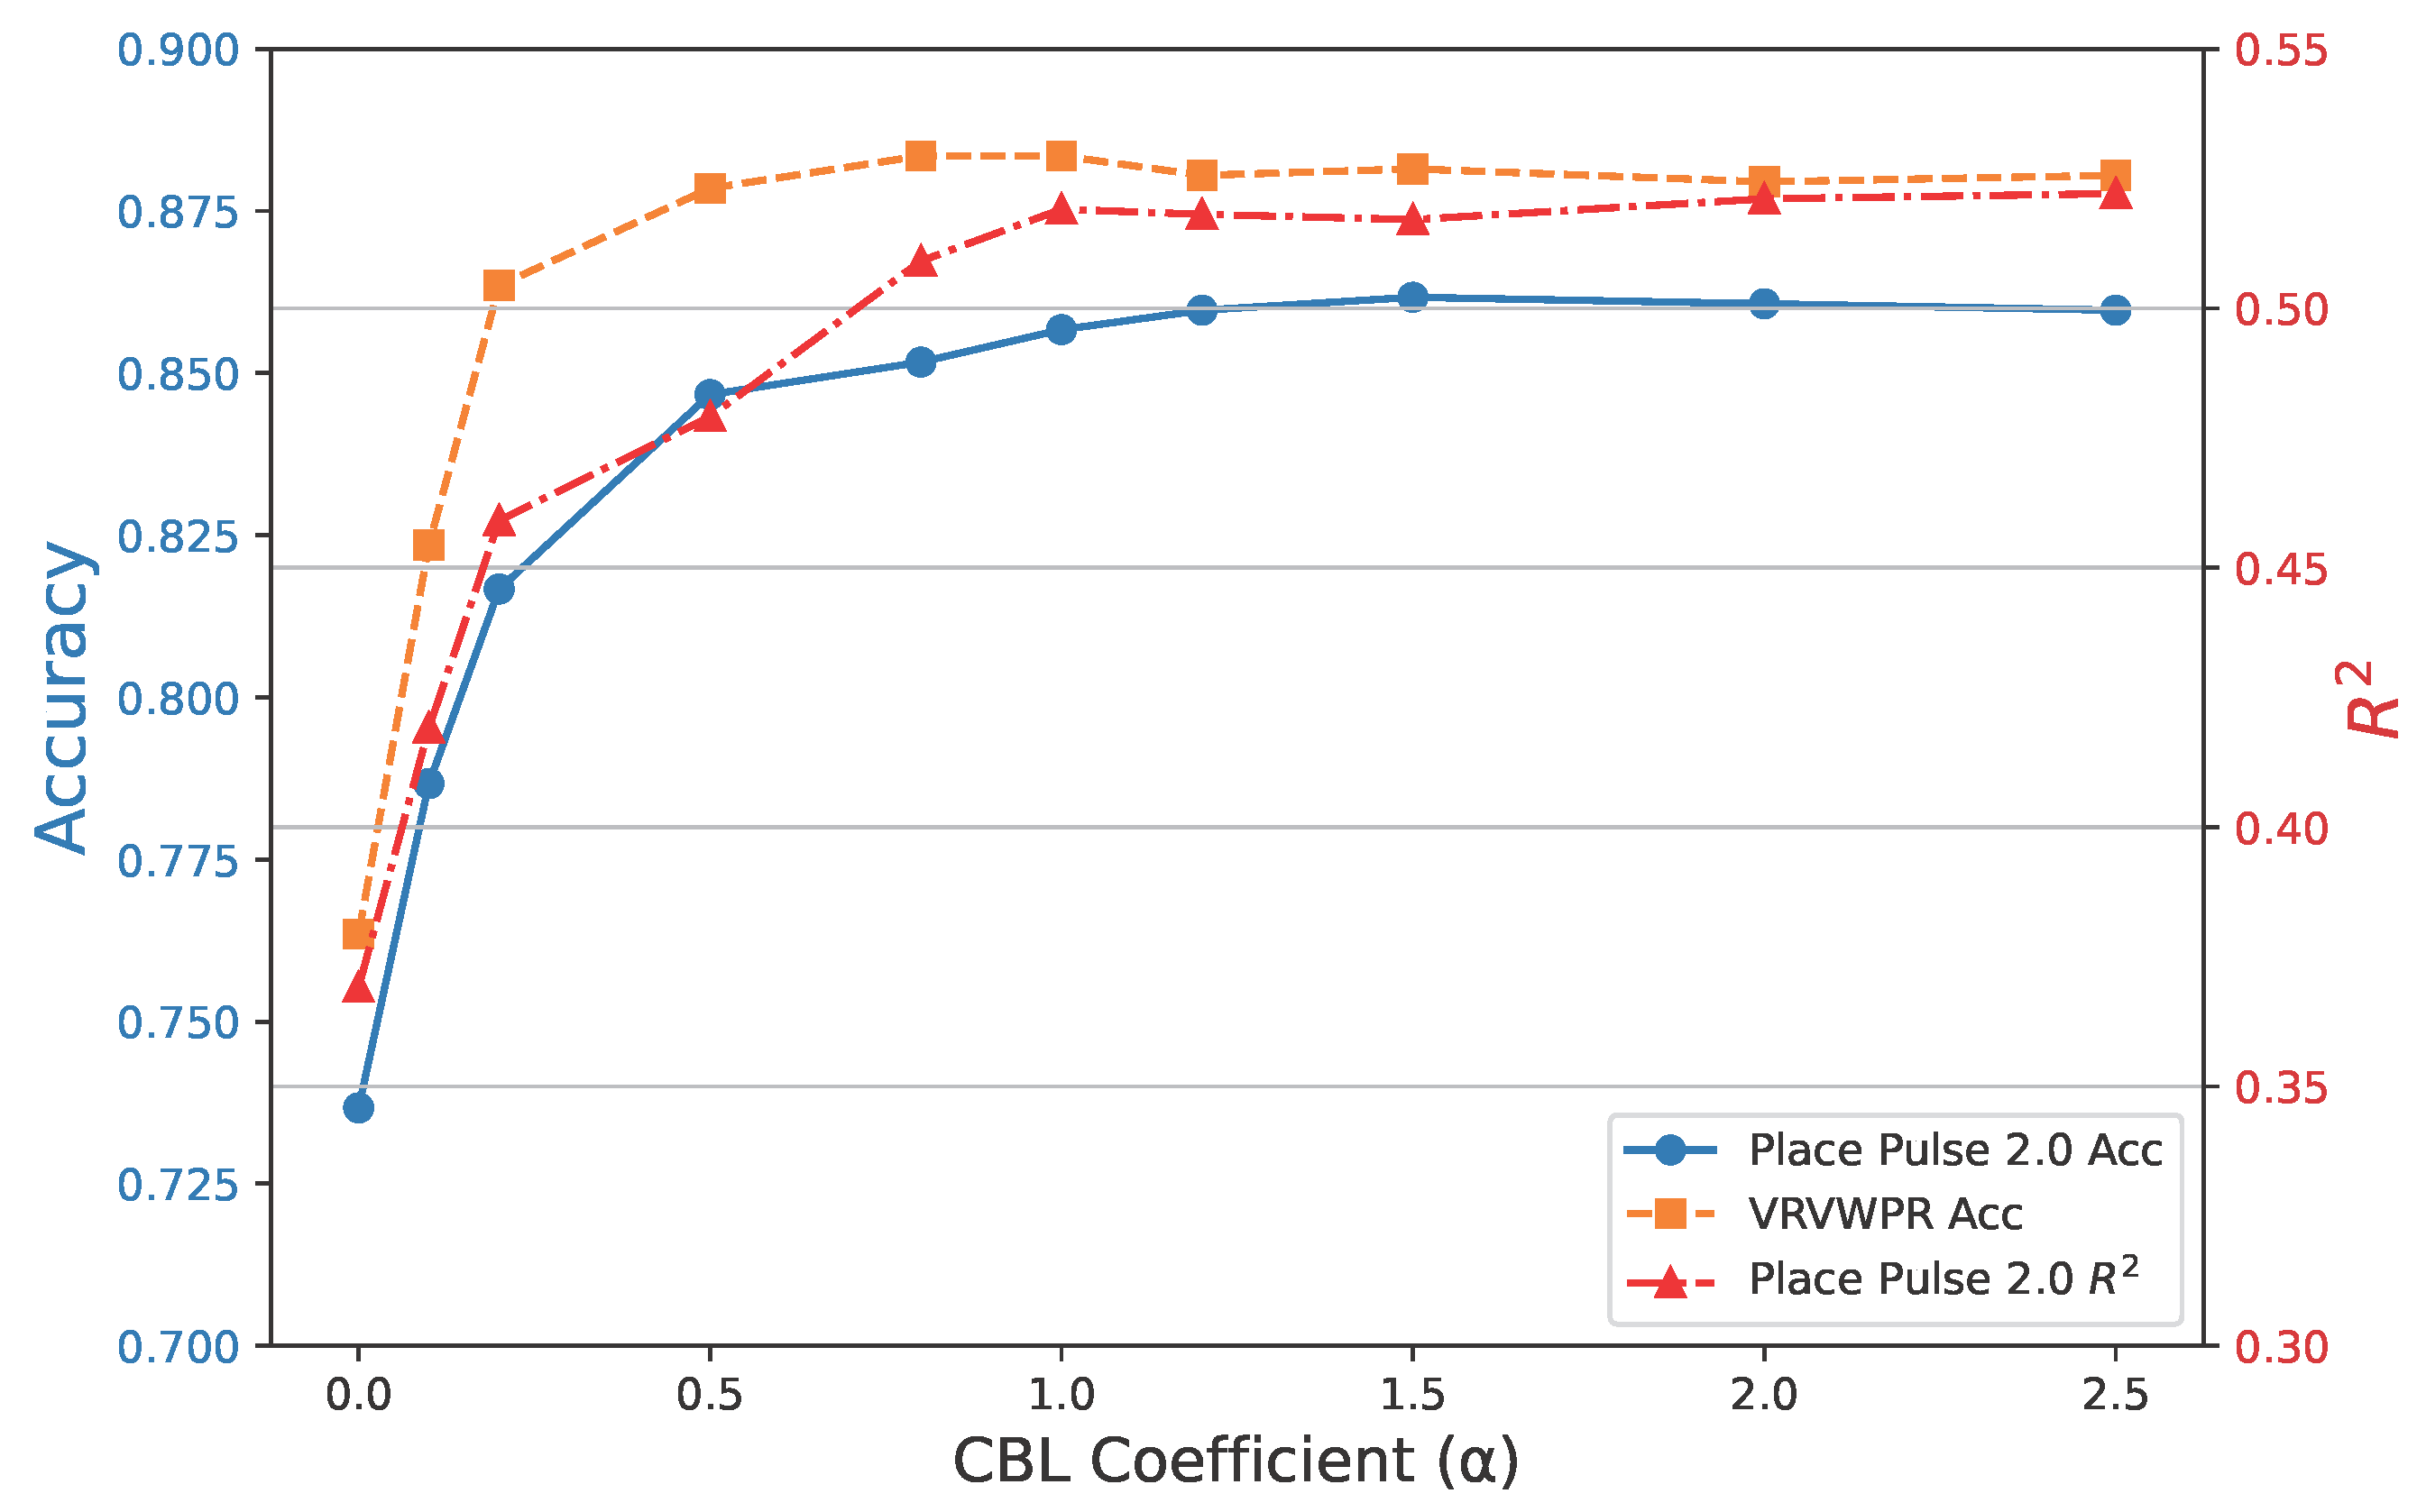
Table 1.
Prompts for visual concepts generation.
| Prompt | Content |
|---|---|
| Prompt 1 | List the most important visual features that influence a person’s perception of urban {requirement} in street view images. |
| Prompt 2 | What visual elements in a city scene make people feel {requirement}? |
| Prompt 3 | List common objects, layouts, or attributes visible in urban street-view images that could impact how people feel about the place. |
Table 2.
Statistics of Visual Concepts Generated for Each Dataset.
| Dataset | Number of Concepts | Example Concepts |
|---|---|---|
| Place Pulse 2.0 [10] | 317 | Trees, Sidewalks, Pedestrians, Streetlights, Clean roads, Car, |
| Trash, Construction site, Graffiti, Old houses, Road, ... | ||
| VRVWPR [24] | 195 | People, Bicycles, Crosswalk, Bike Lane, Traffic Light, Shop, |
| Empty roads, Dirt land, Wall, Billboard, Bus, ... |
Table 3.
Performance comparison of different regression-based method. We evaluation six perceptual dimensions from Place Pulse 2.0 using comparison accuracy (Acc.) and scores.
Table 3.
Performance comparison of different regression-based method. We evaluation six perceptual dimensions from Place Pulse 2.0 using comparison accuracy (Acc.) and scores.
| Method | Safe | Lively | Beautiful | Wealthy | Boring | Depressing | ||||||
| Acc. | Acc. | Acc. | Acc. | Acc. | Acc. | |||||||
| RN-50 [63] | .8120 | .4551 | .7289 | .3522 | .8443 | .5090 | .6937 | .3227 | .6451 | .2789 | .6720 | .3136 |
| RN-101 [63] | .8605 | .5182 | .7778 | .4174 | .8912 | .5783 | .7482 | .3921 | .6958 | .3386 | .7225 | .3784 |
| ViT-S [64] | .8473 | .4989 | .7831 | .4292 | .8576 | .5374 | .7344 | .3740 | .7042 | .3417 | .7103 | .3599 |
| ViT-B [64] | .8695 | .5381 | .7967 | .4352 | .8732 | .5479 | .7521 | .3996 | .7603 | .4113 | .7294 | .3832 |
| Streetscore [47] | .8120 | .4510 | .7290 | .3510 | .8430 | .5010 | .6920 | .3240 | .6440 | .2770 | .6700 | .3120 |
| UCVME [61] | .8450 | .4920 | .7750 | .4210 | .8590 | .5390 | .7370 | .3760 | .7030 | .3390 | .7090 | .3580 |
| Adaptive Contrast [60] | .7980 | .4420 | .7150 | .3390 | .8320 | .4950 | .6810 | .3080 | .6330 | .2650 | .6600 | .3020 |
| CLIP+KNN [62] | .9060 | .5791 | .8415 | .4796 | .9012 | .5741 | .7867 | .4412 | .7951 | .4456 | .7475 | .4008 |
| RESupCon [59] | .8842 | .5583 | .8155 | .4546 | .8831 | .5580 | .7649 | .4180 | .7724 | .4193 | .7381 | .3939 |
| UP-CBM RN-101 (Ours) | .9150 | .5852 | .8480 | .5012 | .9154 | .5823 | .7845 | .4401 | .8052 | .4587 | .7550 | .4170 |
| UP-CBM ViT-B (Ours) | .9352 | .6038 | .8661 | .5239 | .9487 | .6174 | .7893 | .4483 | .8294 | .4827 | .7718 | .4385 |
Disclaimer/Publisher’s Note: The statements, opinions and data contained in all publications are solely those of the individual author(s) and contributor(s) and not of MDPI and/or the editor(s). MDPI and/or the editor(s) disclaim responsibility for any injury to people or property resulting from any ideas, methods, instructions or products referred to in the content. |
© 2025 by the authors. Licensee MDPI, Basel, Switzerland. This article is an open access article distributed under the terms and conditions of the Creative Commons Attribution (CC BY) license (http://creativecommons.org/licenses/by/4.0/).
Copyright: This open access article is published under a Creative Commons CC BY 4.0 license, which permit the free download, distribution, and reuse, provided that the author and preprint are cited in any reuse.


