

Submitted:
20 May 2025
Posted:
23 May 2025
You are already at the latest version
Abstract
In a previous article, an estimation procedure for calculating the liquidus and solidus lines of binary equilibrium phase diagrams was presented. In this article, keeping the thermodynamic basics, the estimation method for the approximate calculation of the liquidus and solidus surfaces of ternary phase diagrams was further developed. It is shown that the procedure has a hierarchical structure, and the ternary functions contain the binary functions. The applicability of the method is checked by calculating the liquidus and solidus surfaces of the Ag-Au-Pd isomorphous ternary equilibrium phase diagram. The application of each level of the developed four-level procedure depends on the data available and the aim. It is shown that in the case of a concentration range close to the base alloy pure element, the liquidus and solidus surfaces of the ternary equilibrium phase diagram can be calculated from the liquidus and solidus functions of the binary equilibrium phase diagrams with a few K errors, which is 0.2 at% at 10 K/at% slope. The equilibrium phase diagrams were available in graphical form, so the data obtained by digitalisation the diagrams for the calculations was used. The functions describe the slope of the surfaces, and the approximate method developed for the calculation of the partition ratios is also shown.
Keywords:
binary and ternary isomorphous equilibrium phase diagram
; liquidus
; solidus
; liquidus solidus slopes
; partition ratios
1. Introduction
In the foundry practice (mould casting, continuous steel, aluminium, copper casting), simulation software working with finite element processes plays an increasingly important role in the design of technologies (like MAGMA, Inspire Cast, ProCast and so on). Even in simple cases, dividing the cast into thousands of finite elements, the solid phase fraction, the temperature, and, in many cases, the flow of the melt is calculated as a function of time. The number of time steps is also very large. To perform the calculations, it is necessary to know the equilibrium concentrations of the phases. The most accurate procedure is to use a CALPHAD-type software as a subroutine to calculate the concentrations [1,2]. This procedure can be used if the data for the calculation of the given equilibrium phase diagram is contained in the database [someone has already calculated it]. So, some of the latter works used the CALPHAD calculation of the thermodynamic data [3,4,5,6,7,8,9,10]. Several authors have found that this method is not very efficient because, especially in the case of three- or multi-component alloys, the time required for CALPHAD-type calculation is very long, and the concentrations of each finite element must be calculated several times in one time step. [4,11,12,13].
In addition, there may be several studies for which the required equilibrium phase diagrams are only available in graphical form.
The solution to the problem is to create a temperature ~ concentrations map with CALPHAD-type software, if the necessary database is available, or by digitizing the graphical diagram. If anybody wants to use the maps directly, they need to create a large map [containing a lot of data, e.g. with a resolution of 0.00001% for each alloying element] for good enough calculation accuracy, the size of which may exceed the size of the computer's memory. There are two ways to reduce the resolution and then the size of the map:
- (i)
- (ii)
In [14], the authors compared the results of three different procedures (direct coupling, mapping method, and regression function) in the simulation of the solidification of a two-dimensional blade-like casting. The total mesh number for half of the casting domain was 1680. The alloy was Al-10.5Cu -7.5Si. They have shown that the calculated solidification path was practically the same. They found that the calculation results of the three different methods are almost identical, but the computational efficiency is rather different. The computation time of the direct coupling method, the mapping method and the regression functions was 13163 s, 226 s and 147 s, respectively. So, the simulation method of direct coupling is much more inefficient than the other two methods, and the calculation time of the regression method was ~65% of the mapping method.
The regression function for calculating the liquidus temperature and the partition coefficients is a simple polynomial without any thermodynamic background.
In an earlier paper [18], we have shown a new thermodynamically based method to calculate the liquidus and solidus temperatures, the partition ratio, and the slope of the liquidus as a function of the concentration of the alloying element by polynomial [regression] functions. The aim of that work was to develop a simple and fast method usable during the simulation of the solidification processes and shorten the CPU time of the simulation. The method's usability was demonstrated in the cases of isomorphous type Ge-Si and eutectic type Al-Mg, Al-Si binary alloys. The constants of the polynomials were determined by the digitalisation of the Ge-Si and by the ThermoCalc database of Al-Mg and Al-Si equilibrium phase diagrams.
The alloys used in practice usually contain more than two components. (i.e., steels, Al, and Cu alloys). The developed method can be extended easily to multicomponent alloys. This paper shows the extension in the ternary alloy system. The method's usability is demonstrated in the cases of isomorphous type Ag-Au-Pd ternary alloy systems.
2. The Thermodynamic Basis of the ESTPHAD Formalism in the Case of Ternary Alloy
Similarly to the binary system [18], the free energy of an ideal ternary liquid or solid solution is:
The partial molar free enthalpies are:
In equilibrium
3. Determination of the Liquidus (TL) and Solidus (Ts) Temperature
3.1. Liquidus Temperature
Based on Eq. 3, it can be written as:
Used that
Using Eq.5 and Eq.6, it can be written as follows:
Considers that:
Used the Taylor series instead of the ln function:
Where:
came from the A-B and A-C BEPD.
And:
came from the A-B-C TEPD.
Finally:
Where:
3.2. Solidus Temperature
Where:
came from the binary A-B and A-C BEPD.
And:
came from the ternary A-B-C TEPD.
Finally:
Where:
The constants of Eqs. 16,17,18 and 24, 25, 26 are calculatable if the alloy is ideal, and the partition ratios kB and kC are known as a function of the TL and Ts temperatures, or those are constant. In the other cases, the kB and kC obtained from the binary equilibrium phase diagram can be used as the initial data for the iteration.
In the practical case, the constants can be determined from the and dataset is given by a Calphad-type calculation or digitalization of the liquidus and solidus surfaces.
4. Determination of the Partition Ratios
4.1. as a Function of Liquidus Concentrations
Using Eq. 15. and considering that:
Where:
If XB=XC=0
Finally:
Where:
And
4.2. as a Function of Solidus Concentrations
Where:
And
The structure of the constants is the same as for the (see Table IV).
4.3. as a Function of Liquidus Concentration
Where:
4.4. as a Function of Solidus Concentration
Where:
Similarly to the liquidus and solidus temperature, in the case of ideal alloy, the lnk functions are calculatable if the FAB, FAC, and ΔFABC functions are known. In the practical case, the constants can be determined from the and dataset is given by a Calphad-type calculation or digitalization of the liquidus and solidus surfaces.
5. Determination of the Constants of Liquidus Slopes
In this case, two independent slopes exist:
In the case of binary EPD:
6. Calculation Methods of the Constants
6.1. Calculation of the Constants of Liquidus and Solidus Functions
To calculate the constants, a data base from a CALPHAD type calculation or the digitization of the lines of BEPD and TEPD can be used.
6.1.1. First Estimation (Only the A-B and A-C BEPD Are Known)
Calculation of the and maps:
And
Used these two maps the constant of the and functions are calculatable by regression. Knowing the liquidus and solidus functions of binary EPDs, the liquidus and solidus temperatures of the ABC ternary alloys can be calculated, assuming that the effect of the two alloys in the liquid and solid phases negligible, i.e.
Then:
6.1.2. Second Estimation (the A-B, A-C and B-C BEPD Are Known)
If the third B-C BEPD, which does not contain the base element, is known, then its data can be used to calculate the constants of the function
6.1.3. Third estimation (the A-B and A-C BEPD and the data of the liquidus and solidus surfaces of the TEPD are known, the B-C BEPD is unknown)
If that the effect of the two alloys in the liquid and solid phases is not negligible, considering the temperature for all known concentrations in the ternary diagram, except for the B-C binary EPD data:
Since the liquidus and solidus temperature of the ternary EPD are also affected by binary EPDs (see First estimation), the effect resulting from the interaction of the two alloys are the difference of the two effects:
From these two maps the constants of the and functions can be determine by regression.
Finally:
6.1.4. Fourth estimation (the A-B, A-C, B-C BEPD and the data of the liquidus and solidus surface of the TEPD are known)
At the calculation of the constants of functions, we also take into account the data of the BC BEPD in order to calculate the liquidus and solidus temperatures of the BC BEPD as accurately as possible from the functions.
6.1.4. Determination of the liquidus and solidus isotherms by an iteration method
Keeping the concentration of one element constant (e.g., XB), the concentration of the other element (e.g., XC) was increased by 0.001 at% step until the temperature calculated with the two concentrations reached the temperature of the selected isotherm.
6.2. Calculation of the Constants of the Partition Ratio
There are two different possibilities: the tie lines known or unknown in the TEPD.
6.2.1. The tie lines (the liquidus and solidus concentration pairs) in TEPD are known from the CALPHAD type calculation.
First step
Calculation of the and maps from the calculated and maps by CALPHAD type software or digitalized binary equilibrium phase diagrams. From these maps the constants of the and functions can be determine by regression (see in [18]).
Second step
Calculation of and maps from and maps.
Third step
Calculation of and , maps from the ternary part of the liquidus and solidus concentration
Fourth step
Calculation from these four maps the constants of the and functions by regression.
Finally:
6.2.2. If the tie lines (liquidus and solidus concentration pairs) are unknown, the TL and Ts temperatures were determined at many concentrations by digitalisation of the liquidus and solidus isotherms, and another method must be followed.
First step
Calculation of the and maps from the calculated and maps calculated by digitalized binary equilibrium phase diagrams. From these maps the constants of the and functions can be determine by regression (see in [18]).
Second step:
Using these functions calculation of the solid phase concentrations () from the liquid phase concentrations along the calculated liquidus isotherms (first estimation)
Third step
Usually, the () concetrations are not on the same calculated solidus isotherm, with an iteration method has to search for the valid solid phase concentration () on the solidus isotherm (see the details in Appendex B).
Using the map of the valid solid phase concentrations () calculation of the
and maps from and maps.
Fourth step
Calculation of the , and , maps
and
Fifth step
From the above four maps calculation of the constants of the , and , functions.
Finally:
and
7. An Example for Calculating the Liquidus and Solidus Surfaces, Partition Coefficients, and the Slope of the Liquidus Surface of an Isomorphous Ternary Equilibrium Phase Diagram (TEPD)
There are several A-B-C TEPDs, in which case the binary A-B, B-C and A-C BEPDs are isomorphous, and then the A-B-C TEPDs are also isomorphous. α(A-B-C) is a solid solution phase of a ternary solid solution in which A, B and C are completely soluble in each other in both the molten and the solid state. In particular, there are many such ternary diagrams among alloys of so-called noble metals (including Cu and Ni) (e.g. Au-Ag-Pd, Au-Cu-Pd, Au-Ni-Pd, Au-Pd-Pt, Pd-Pt-Cu, Ni-Pd-Cu, Ni-Pt-Cu) and many others like Cr-Ti-V, Ti-Mo-Cr, Mo-Cr-V, Ti-Mo-V, and so on. The AuAgPd ternary alloy equilibrium phase diagram was chosen to demonstrate the possibility of using the calculation method.
The Ag-Au-Pd alloys have many important applications, like jewellery, as a catalyst in the chemical industries, and as a dental alloy because of their high corrosion resistance and biocompatibility [19,20,21].
7.1. Data for Calculation
As was shown in the theoretical part (Eqs. 15, 23), the ESTPHAD method has a hierarchical structure, using the functions of two-component equilibrium phase diagrams to calculate the liquidus and solidus surfaces of three-component equilibrium phase diagrams. To perform the calculations, the phase diagrams of both binary (Fig. 1) [22,23,24] and ternary (Fig. 2) [25] TEPDs were only available graphically, so the data were determined by digitalization. In the case of BEPDs, the concentration of the liquidus and solidus was determined at every 1 at% between the melting point of the two elements. The Ag and Au concentration data of the liquidus and solidus isotherms of the TEPD were determined step by step, changing the Pd concentration by ~1 at%. The isotherms were included in the diagrams in 50 K steps.
7.2. Calculation of the Liquidus and Solidus Temperatures, Liquidus Slopes and Partition Ratios of BEPDs
7.2.1. Calculation of the Functions of the Liquidus and Solidus of BEPDs
In the case of the TEPD, Ag, Au, and Pd can all be the "A" elements (see Eqs. 15,23). Therefore, for the binary diagrams of Ag-Au, Au-Ag, Ag-Pd, Pd-Ag and Pd-Au, Au-Pd, it is necessary to know the and functions. Using the data from the digitalized BEPDs, the constants of the functions were determined by regression analysis (Table 1,2 and Table 5,6). The detailed calculation method is shown in 6.1. Chapter (Eqs. 52, 53).
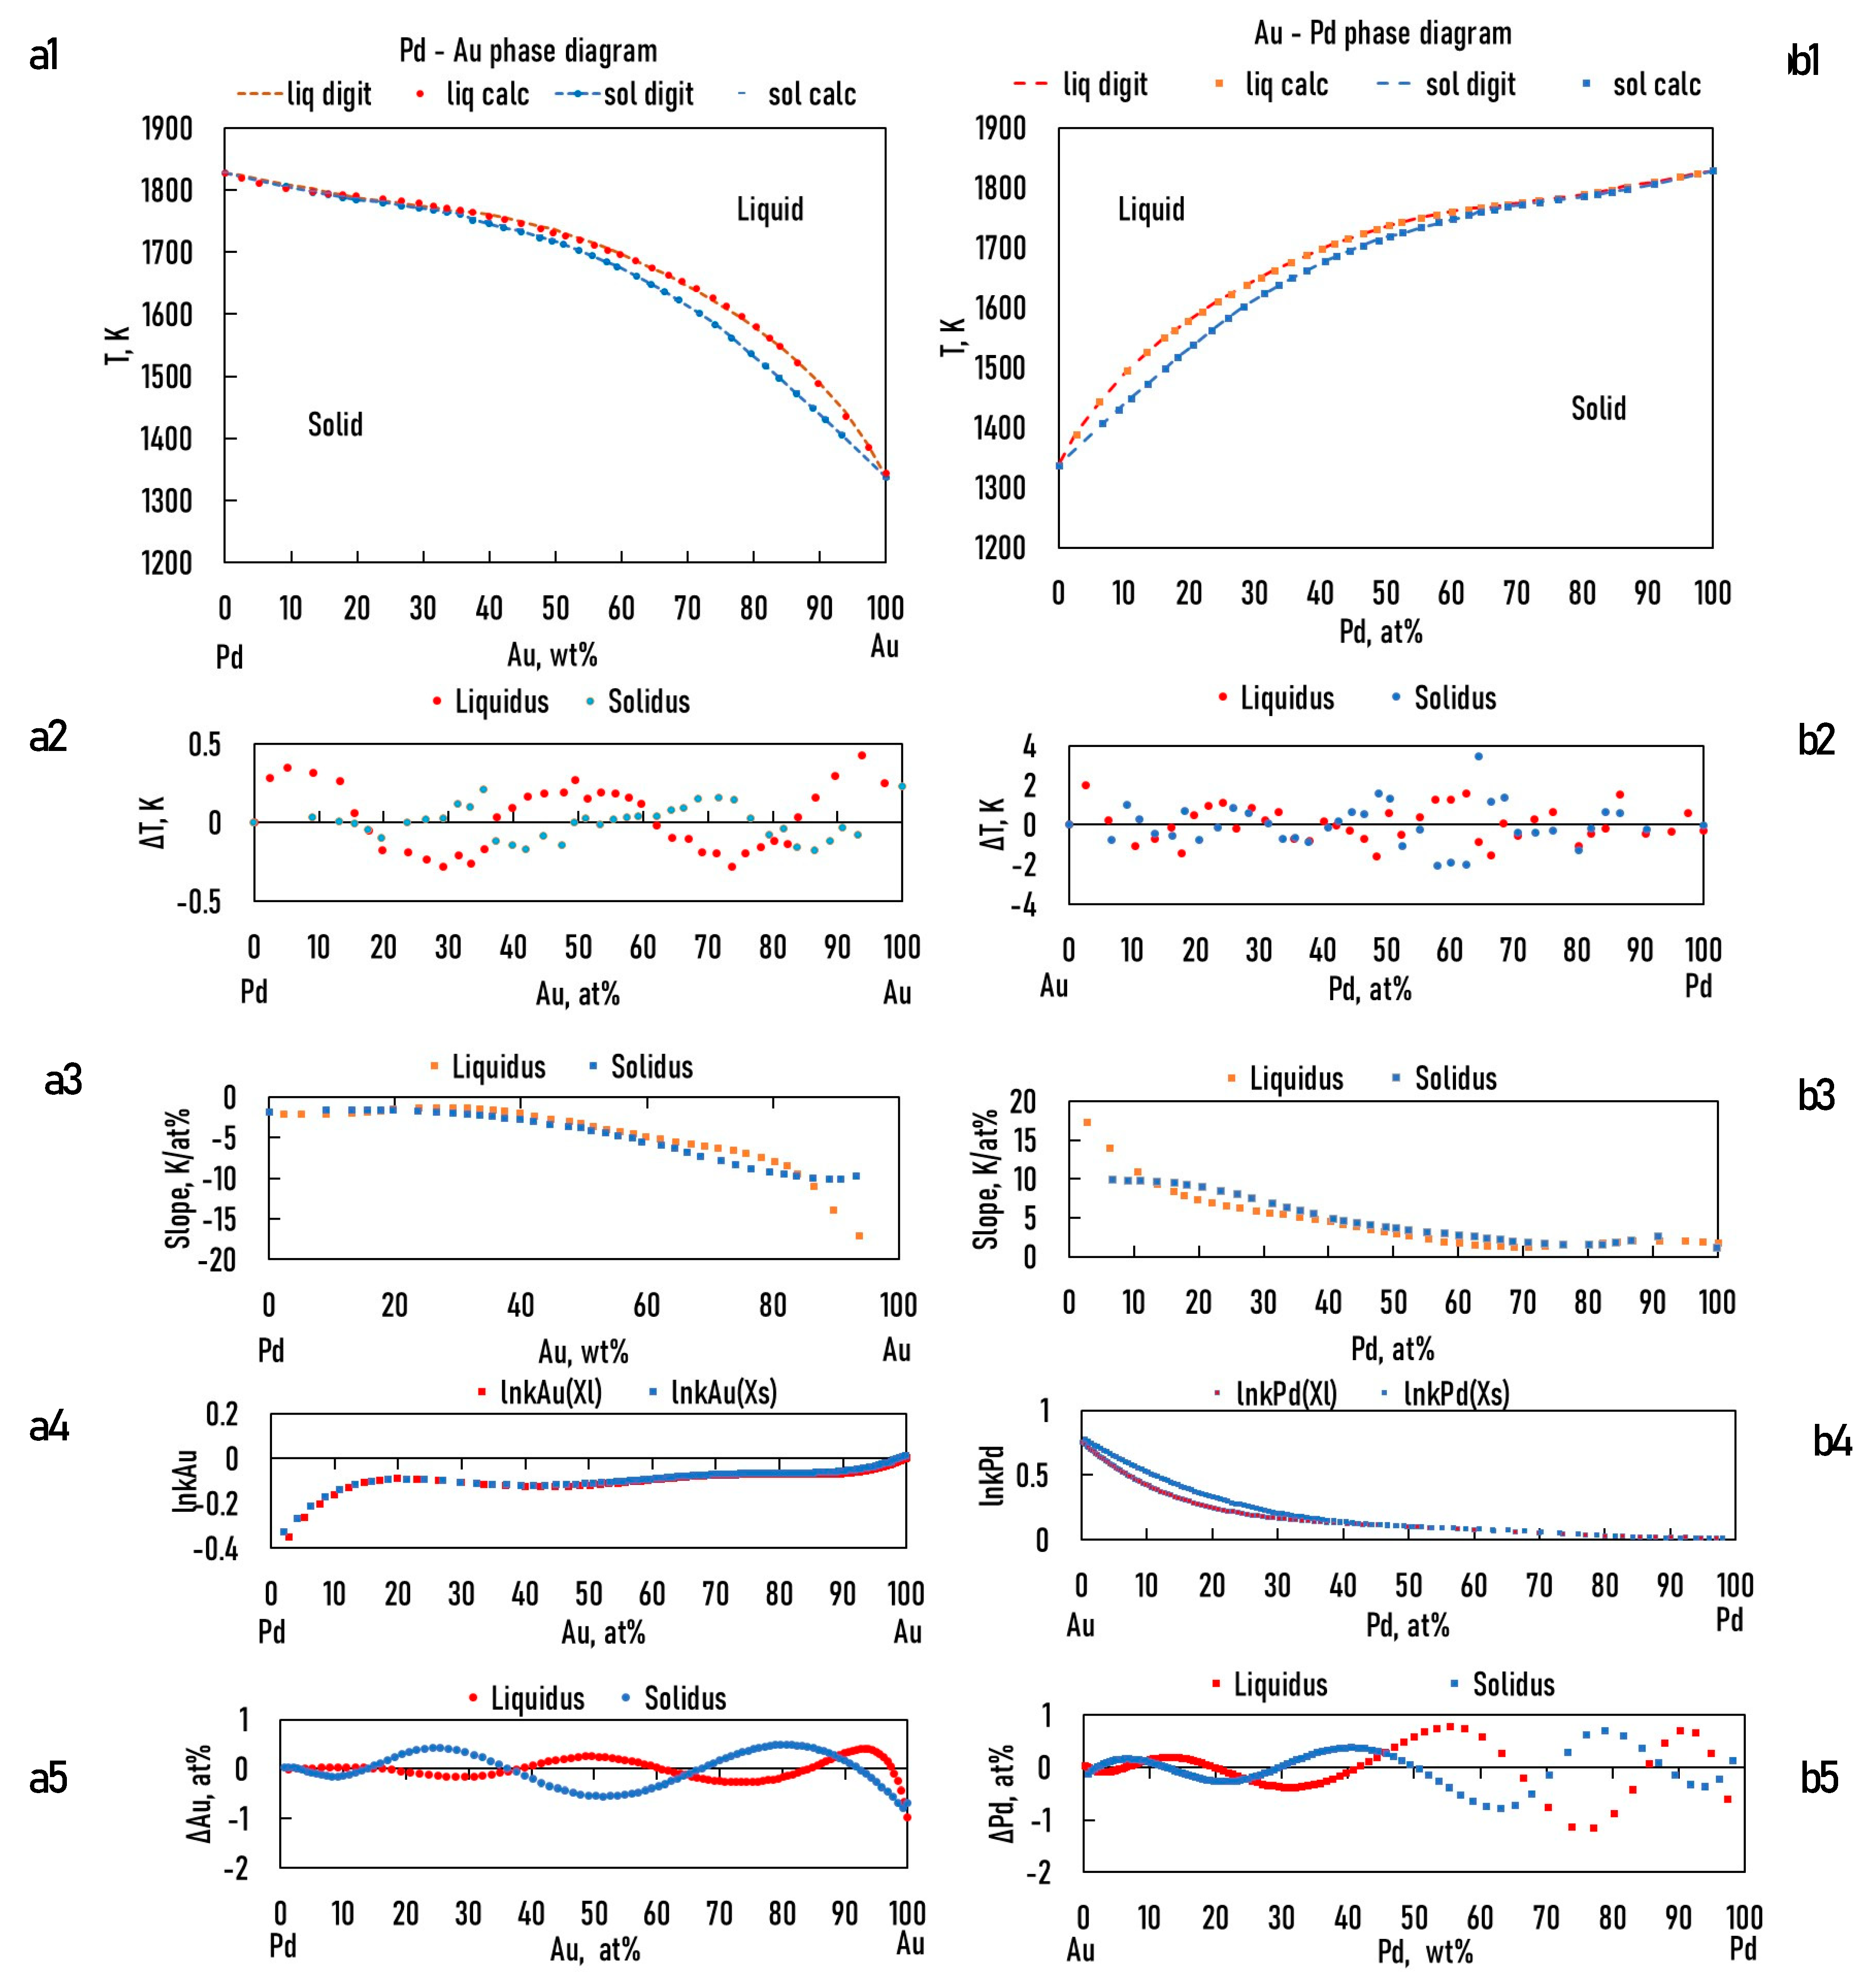
The calculated and the digitalized liquidus and solidus of the BEPDs are compared in Figs. 3.a1, b1, 4.a1, b1 and 5.a1, b1. In Figs. 3.a2, b2, 4.a2, b2, and 5.a2, b2, the difference between the digitalized and calculated liquidus and solidus temperatures as a function of the concentration of alloying elements are shown. The absolute average temperature differences are less than 1 K at all six BEPDs (Table 3.). Based on it can be stated that the accuracy of the calculation is acceptable. Do not forget that the accuracy of the thermocouples is not better than 0.1%, which is ~ ± 1.5 K at 1500 K.
Figs. 3.a3, b3, 4a3, b3 and 5.a3, b3 show the calculated slope of the liquidus and solidus of the BEPDs.

Table 1.
Constants of the liquidus of the binary EPDs (R2 > 0.98).
| Binary alloys | |||||||
| -0.001525122 | 9.83954E-06 | -2.21084E-08 | |||||
| 0.000275973 | 2.66952E-06 | 2.89592E-08 | |||||
| -0.009145785 | 0.000216506 | -5.02079E-06 | 7.36011E-08 | -5.53729E-10 | 1.62381E-12 | ||
| 0.002466234 | 1.93529E-05 | -1.71905E-06 | 5.15282E-08 | -5.63012E-10 | 2.23671E-12 | ||
| -0.015142951 | 0.0006576 | -2.04085E-05 | 3.81869E-07 | -4.01939E-09 | 2.1859E-11 | -4.77362E-14 | |
| 0.000887203 | 3.54004E-05 | -1.3818E-06 | -6.83248E-09 | 9.61336E-10 | -1.34325E-11 | 5.80735E-14 |
Table 2.
Constants of the solidus of the binary EPDs (R2 > 0.98).
| Binary alloys | ||||||||
| -0.001470912 | 9.08706E-06 | -2.02095E-08 | ||||||
| 0.000296244 | 3.02225E-06 | 2.30809E-08 | ||||||
| -0.005863031 | 5.10683E-05 | -1.02889E-06 | 2.45832E-08 | -2.57412E-10 | 8.95933E-13 | |||
| 0.00464592 | -1.95305E-05 | -1.43628E-06 | 4.45352E-08 | -4.12665E-10 | 1.32031E-12 | |||
| -0.008092053 | 0.000174313 | -1.0007E-05 | 4.35027E-07 | -9.88E-09 | 1.20349E-10 | -7.52722E-13 | 1.899E-15 | |
| 0.002002473 | -8.36957E-05 | 2.89768E-06 | -5.01666E-08 | 4.88935E-10 | 1.76718E-12 |
Table 3.
Absolute and average differences of the digitalized and calculated temperatures.
| Pd-Ag | Pd-Au | Ag-Au | Au-Ag | Ag-Pd | Au-Pd | |
| Abs. aver. ∆T, liq., K | 0.467 | 0.694 | 0.103 | 0.157 | 0.391 | 0.703 |
| Abs. aver. ∆T, sol., K | 0.283 | 0.905 | 0.094 | 0.12 | 0.283 | 0.792 |
7.2.2. Calculation of the Functions of the Slope of the Liquidus and Solidus of BEPDs
The slopes were calculated by Eq. 50. The constants of the part of the function are in Table 4.
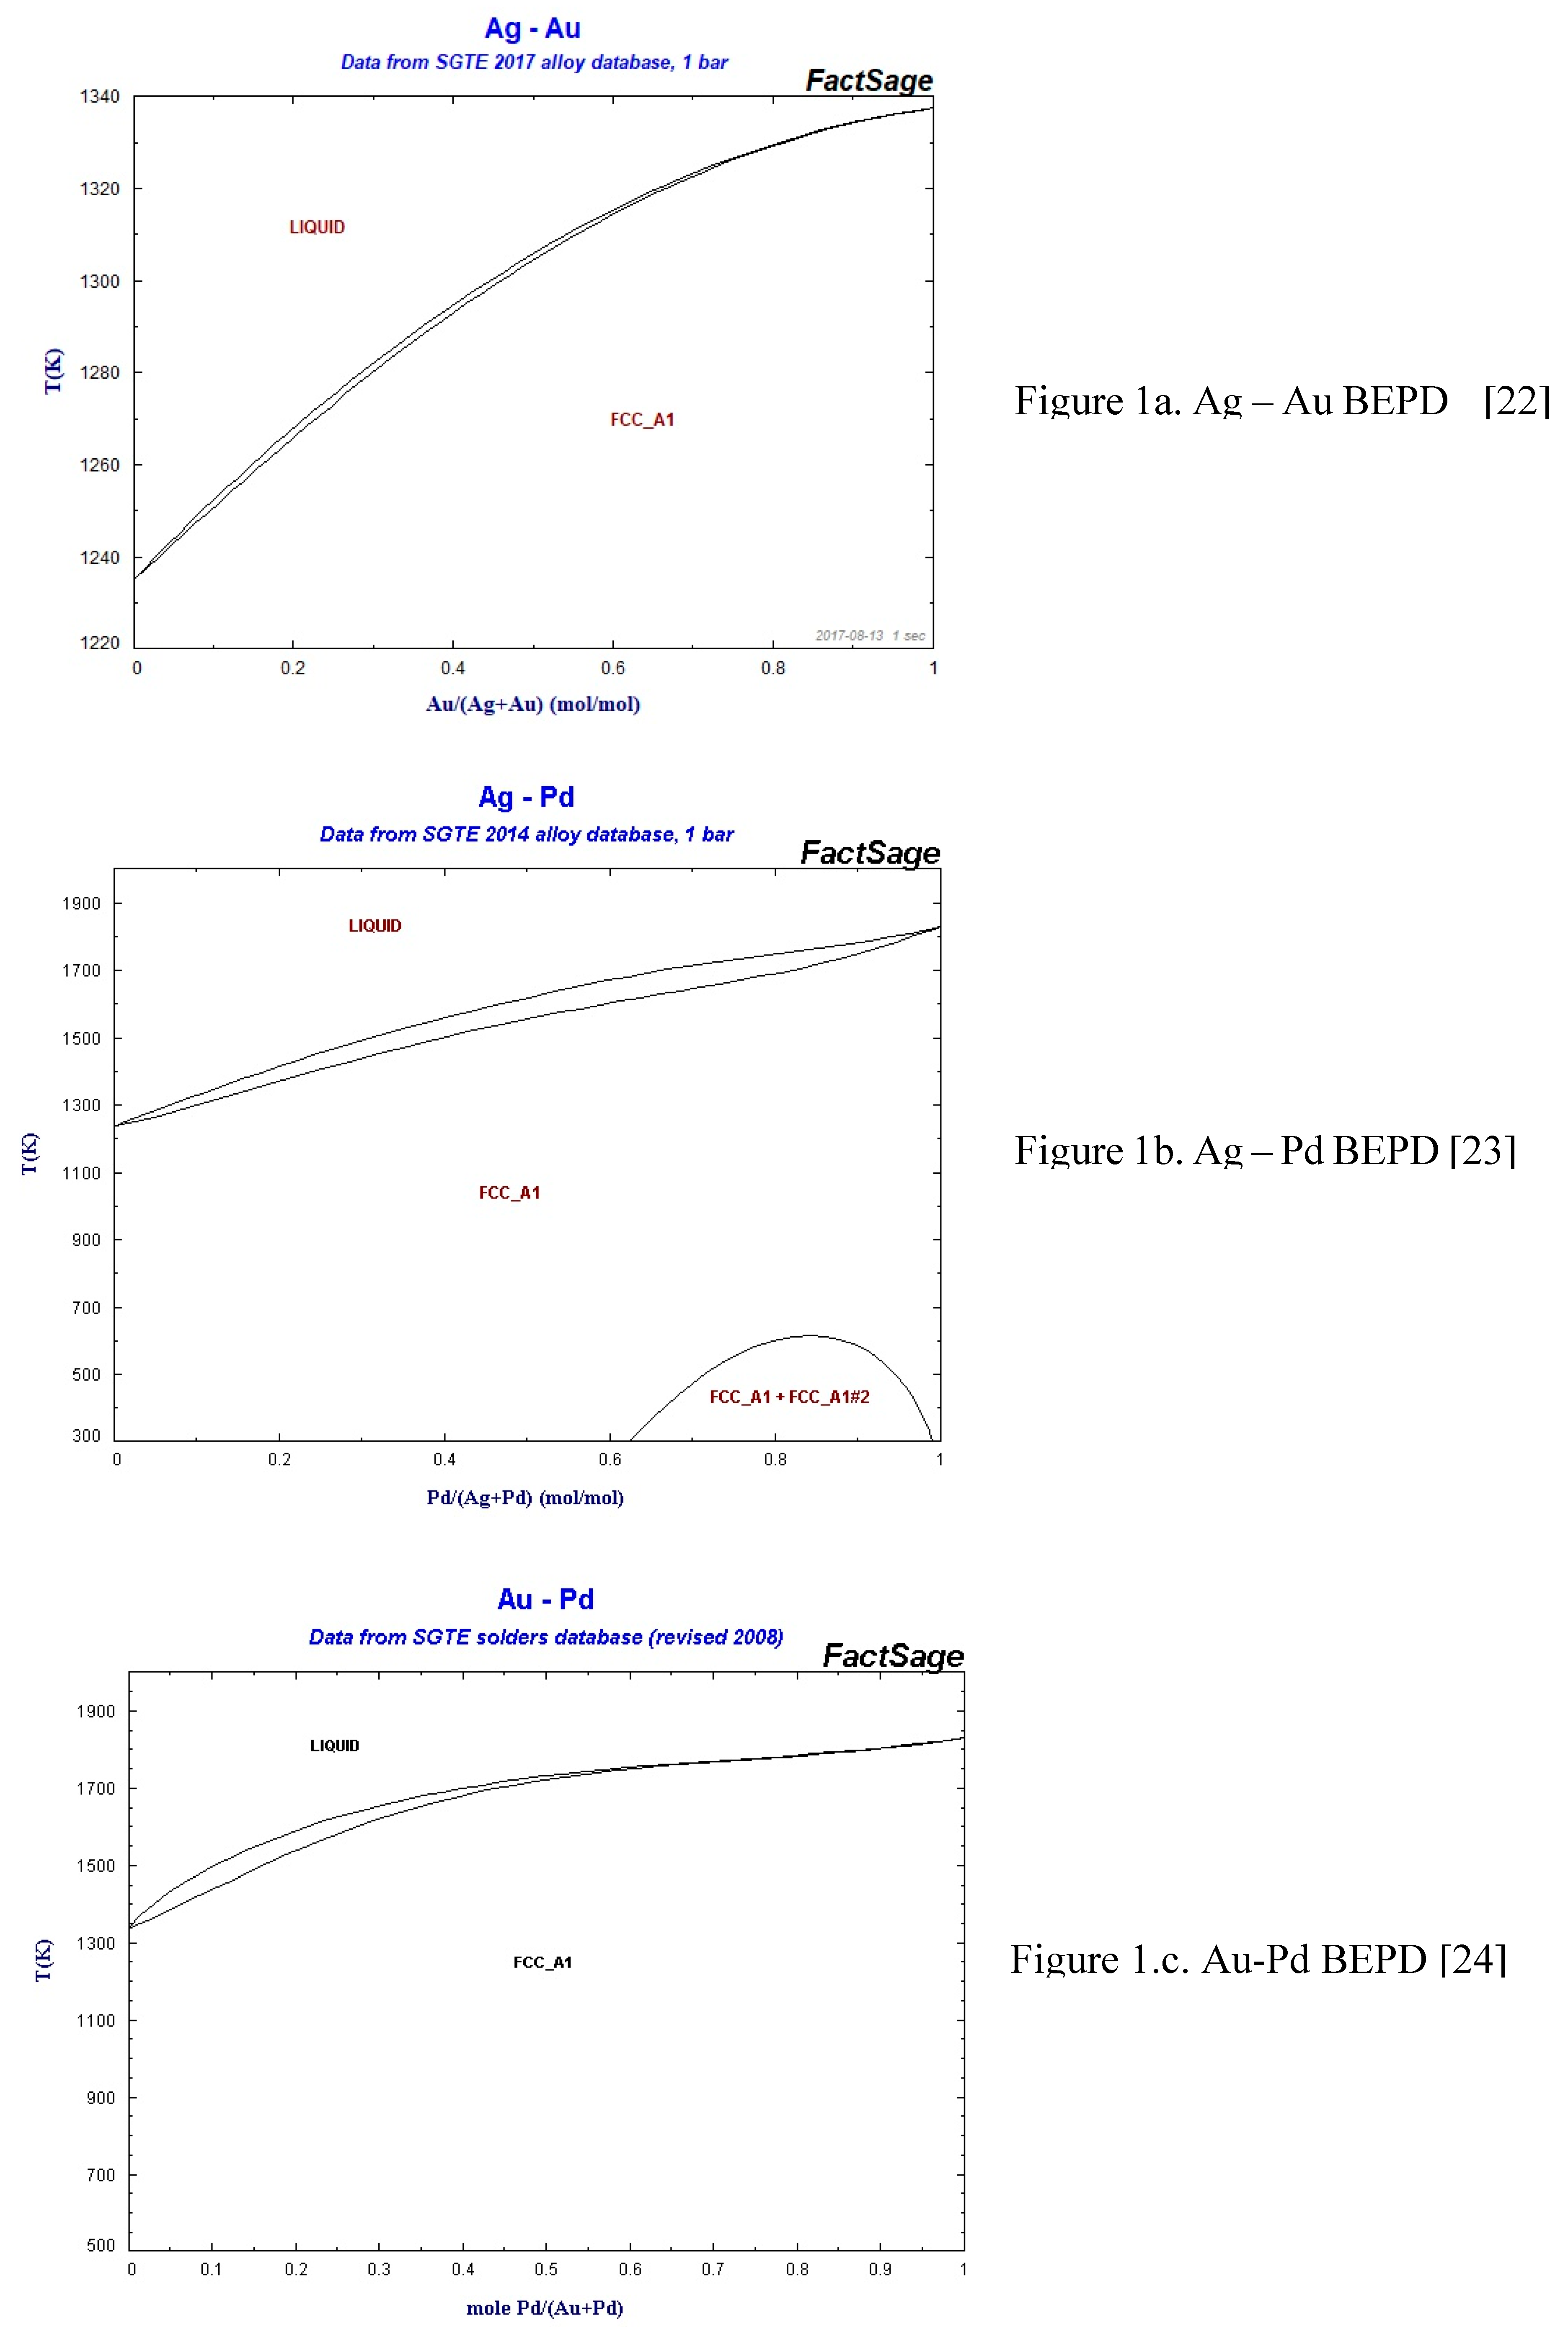
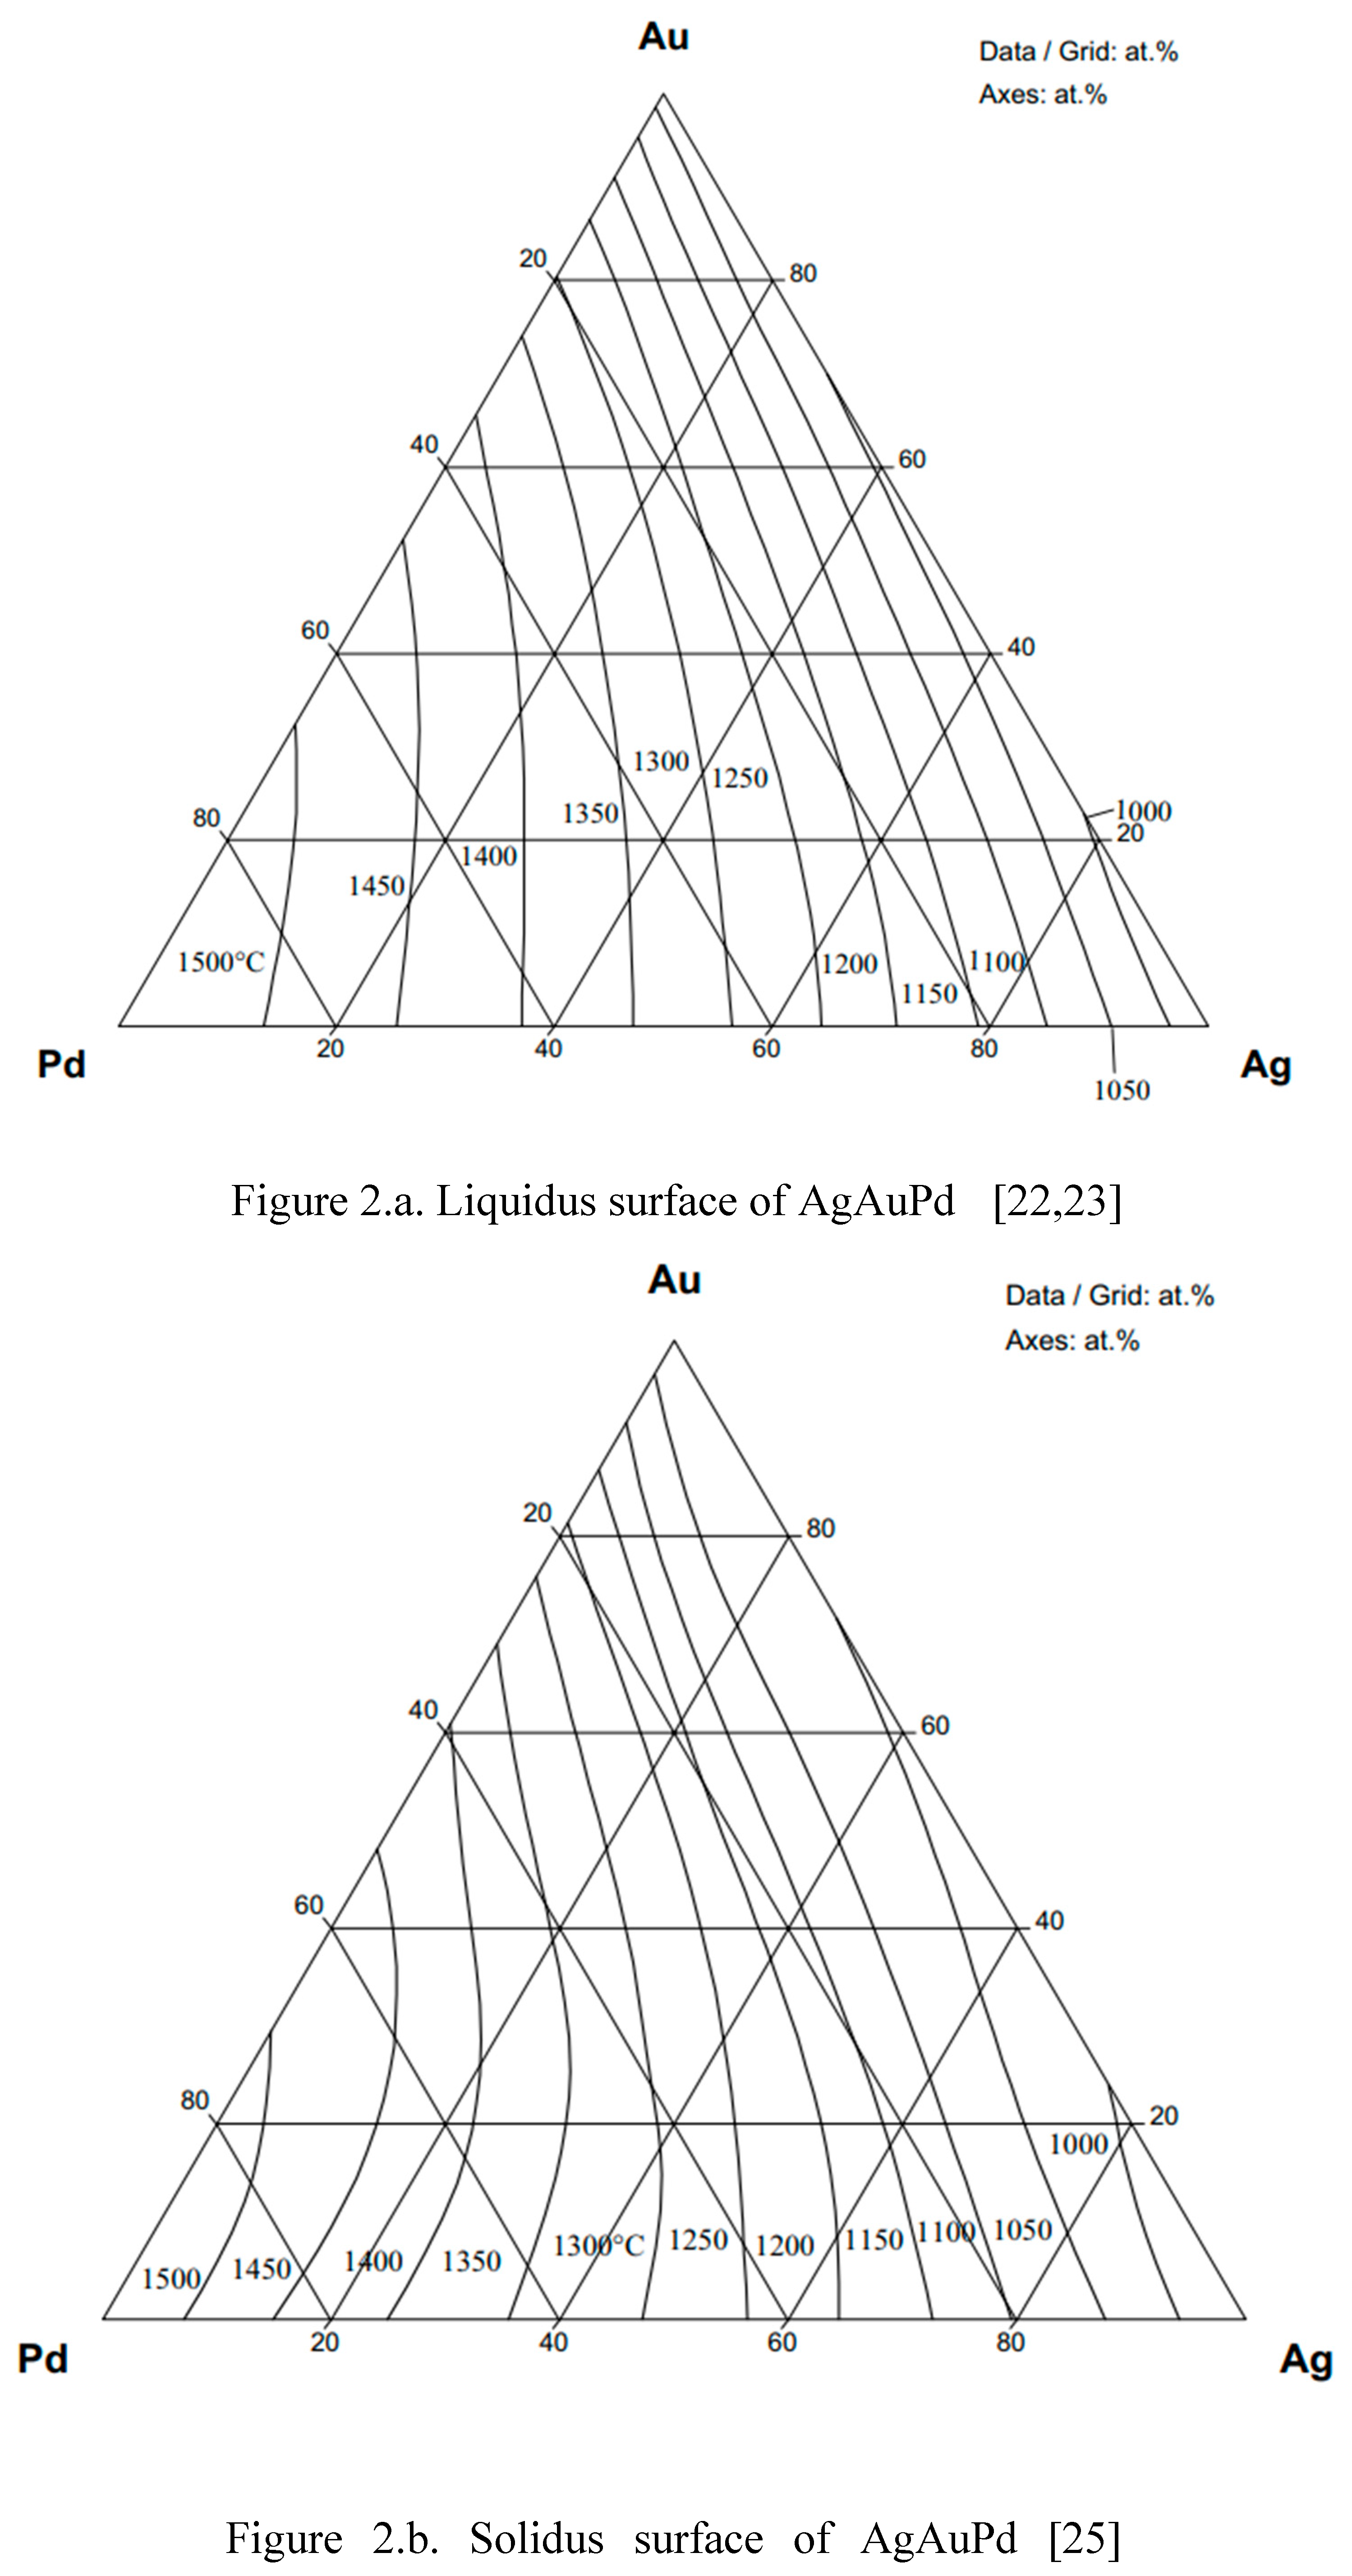
Figure 3.
a1, b1: digitalized and calculated Au – Ag, Ag -Au equilibrium phase diagrams; a2, b2: the difference between the digitalized and calculated liquidus and solidus temperature; a3, b3: the slope of the liquidus and solidus; a4, b4: lnkAg, lnkAu; a5,b5: the difference between the digitalized and calculated Ag, Au concentrations as a function of Ag/Au concentration.
Figure 3.
a1, b1: digitalized and calculated Au – Ag, Ag -Au equilibrium phase diagrams; a2, b2: the difference between the digitalized and calculated liquidus and solidus temperature; a3, b3: the slope of the liquidus and solidus; a4, b4: lnkAg, lnkAu; a5,b5: the difference between the digitalized and calculated Ag, Au concentrations as a function of Ag/Au concentration.
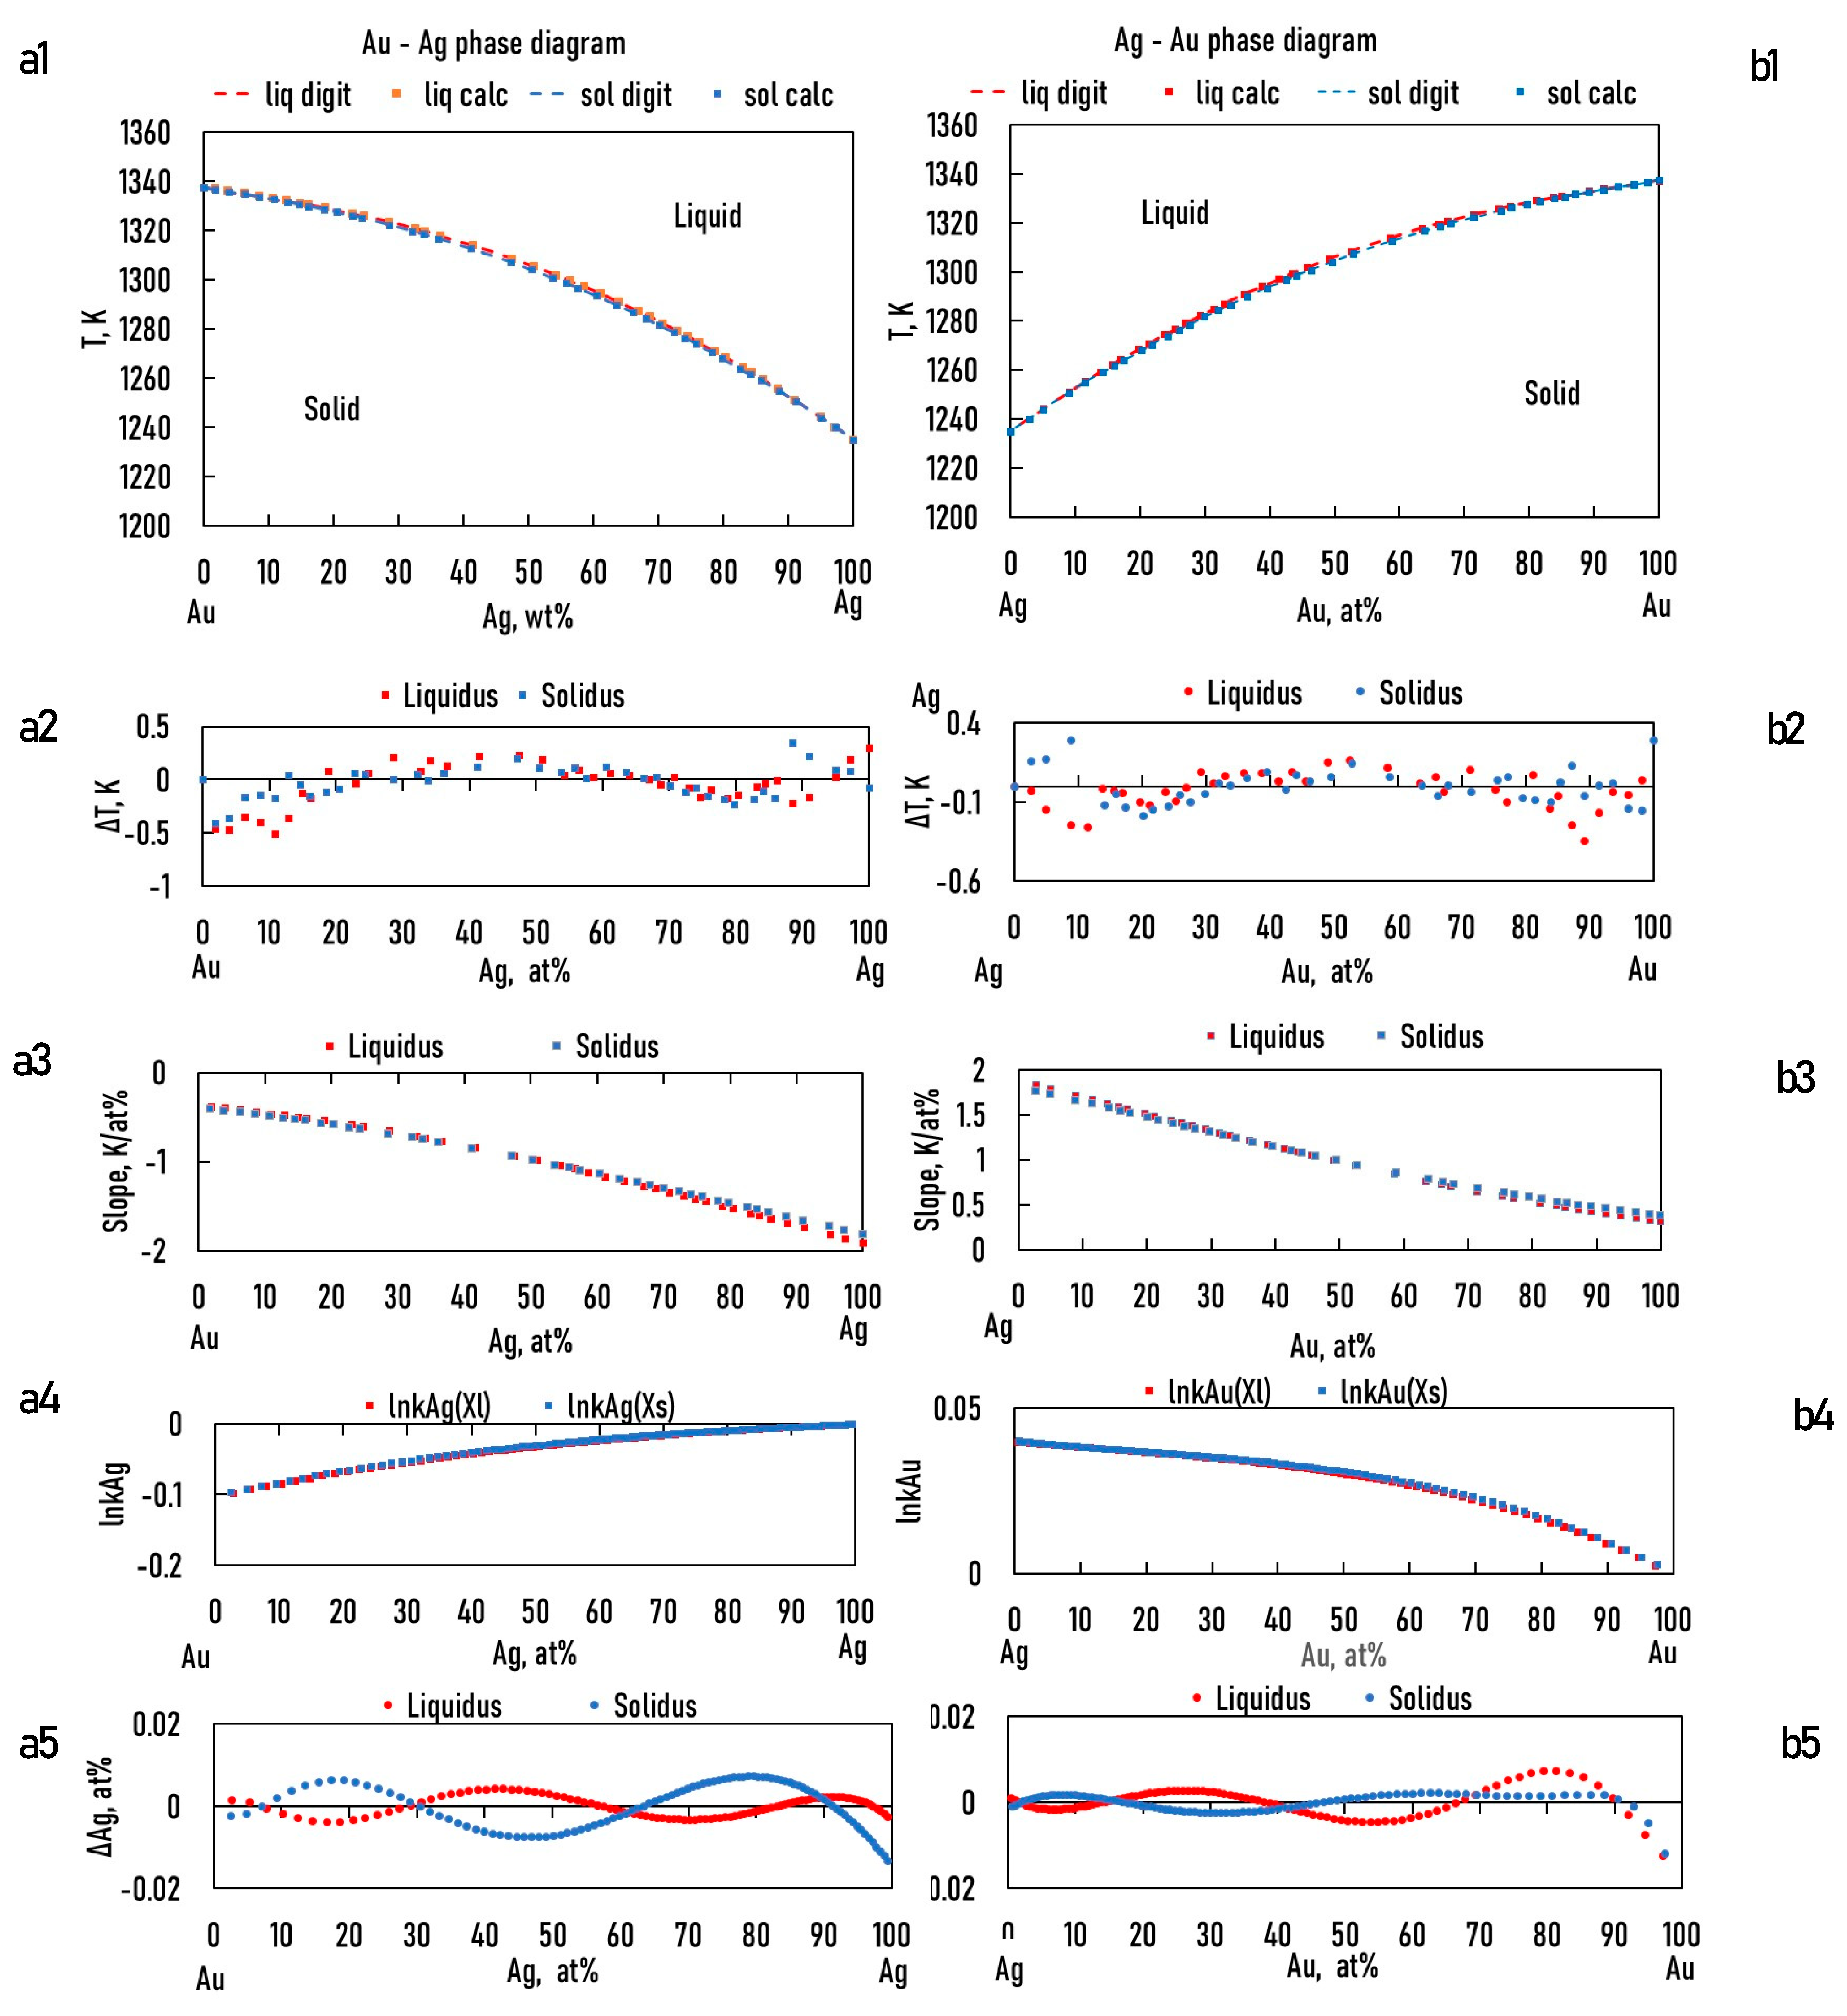
Figure 4.
a1, b1: digitalized and calculated Pd – Ag, Ag -Pd equilibrium phase diagrams; a2, b2: the differences between the digitalized and calculated liquidus and solidus temperature; a3, b3: the slope of the liquidus and solidus; a4, b4: lnkAg, lnkPd; a5,b5: the differences between the digitalized and calculated Ag, Au concentrations as a function of Ag/Pd concentration.
Figure 4.
a1, b1: digitalized and calculated Pd – Ag, Ag -Pd equilibrium phase diagrams; a2, b2: the differences between the digitalized and calculated liquidus and solidus temperature; a3, b3: the slope of the liquidus and solidus; a4, b4: lnkAg, lnkPd; a5,b5: the differences between the digitalized and calculated Ag, Au concentrations as a function of Ag/Pd concentration.
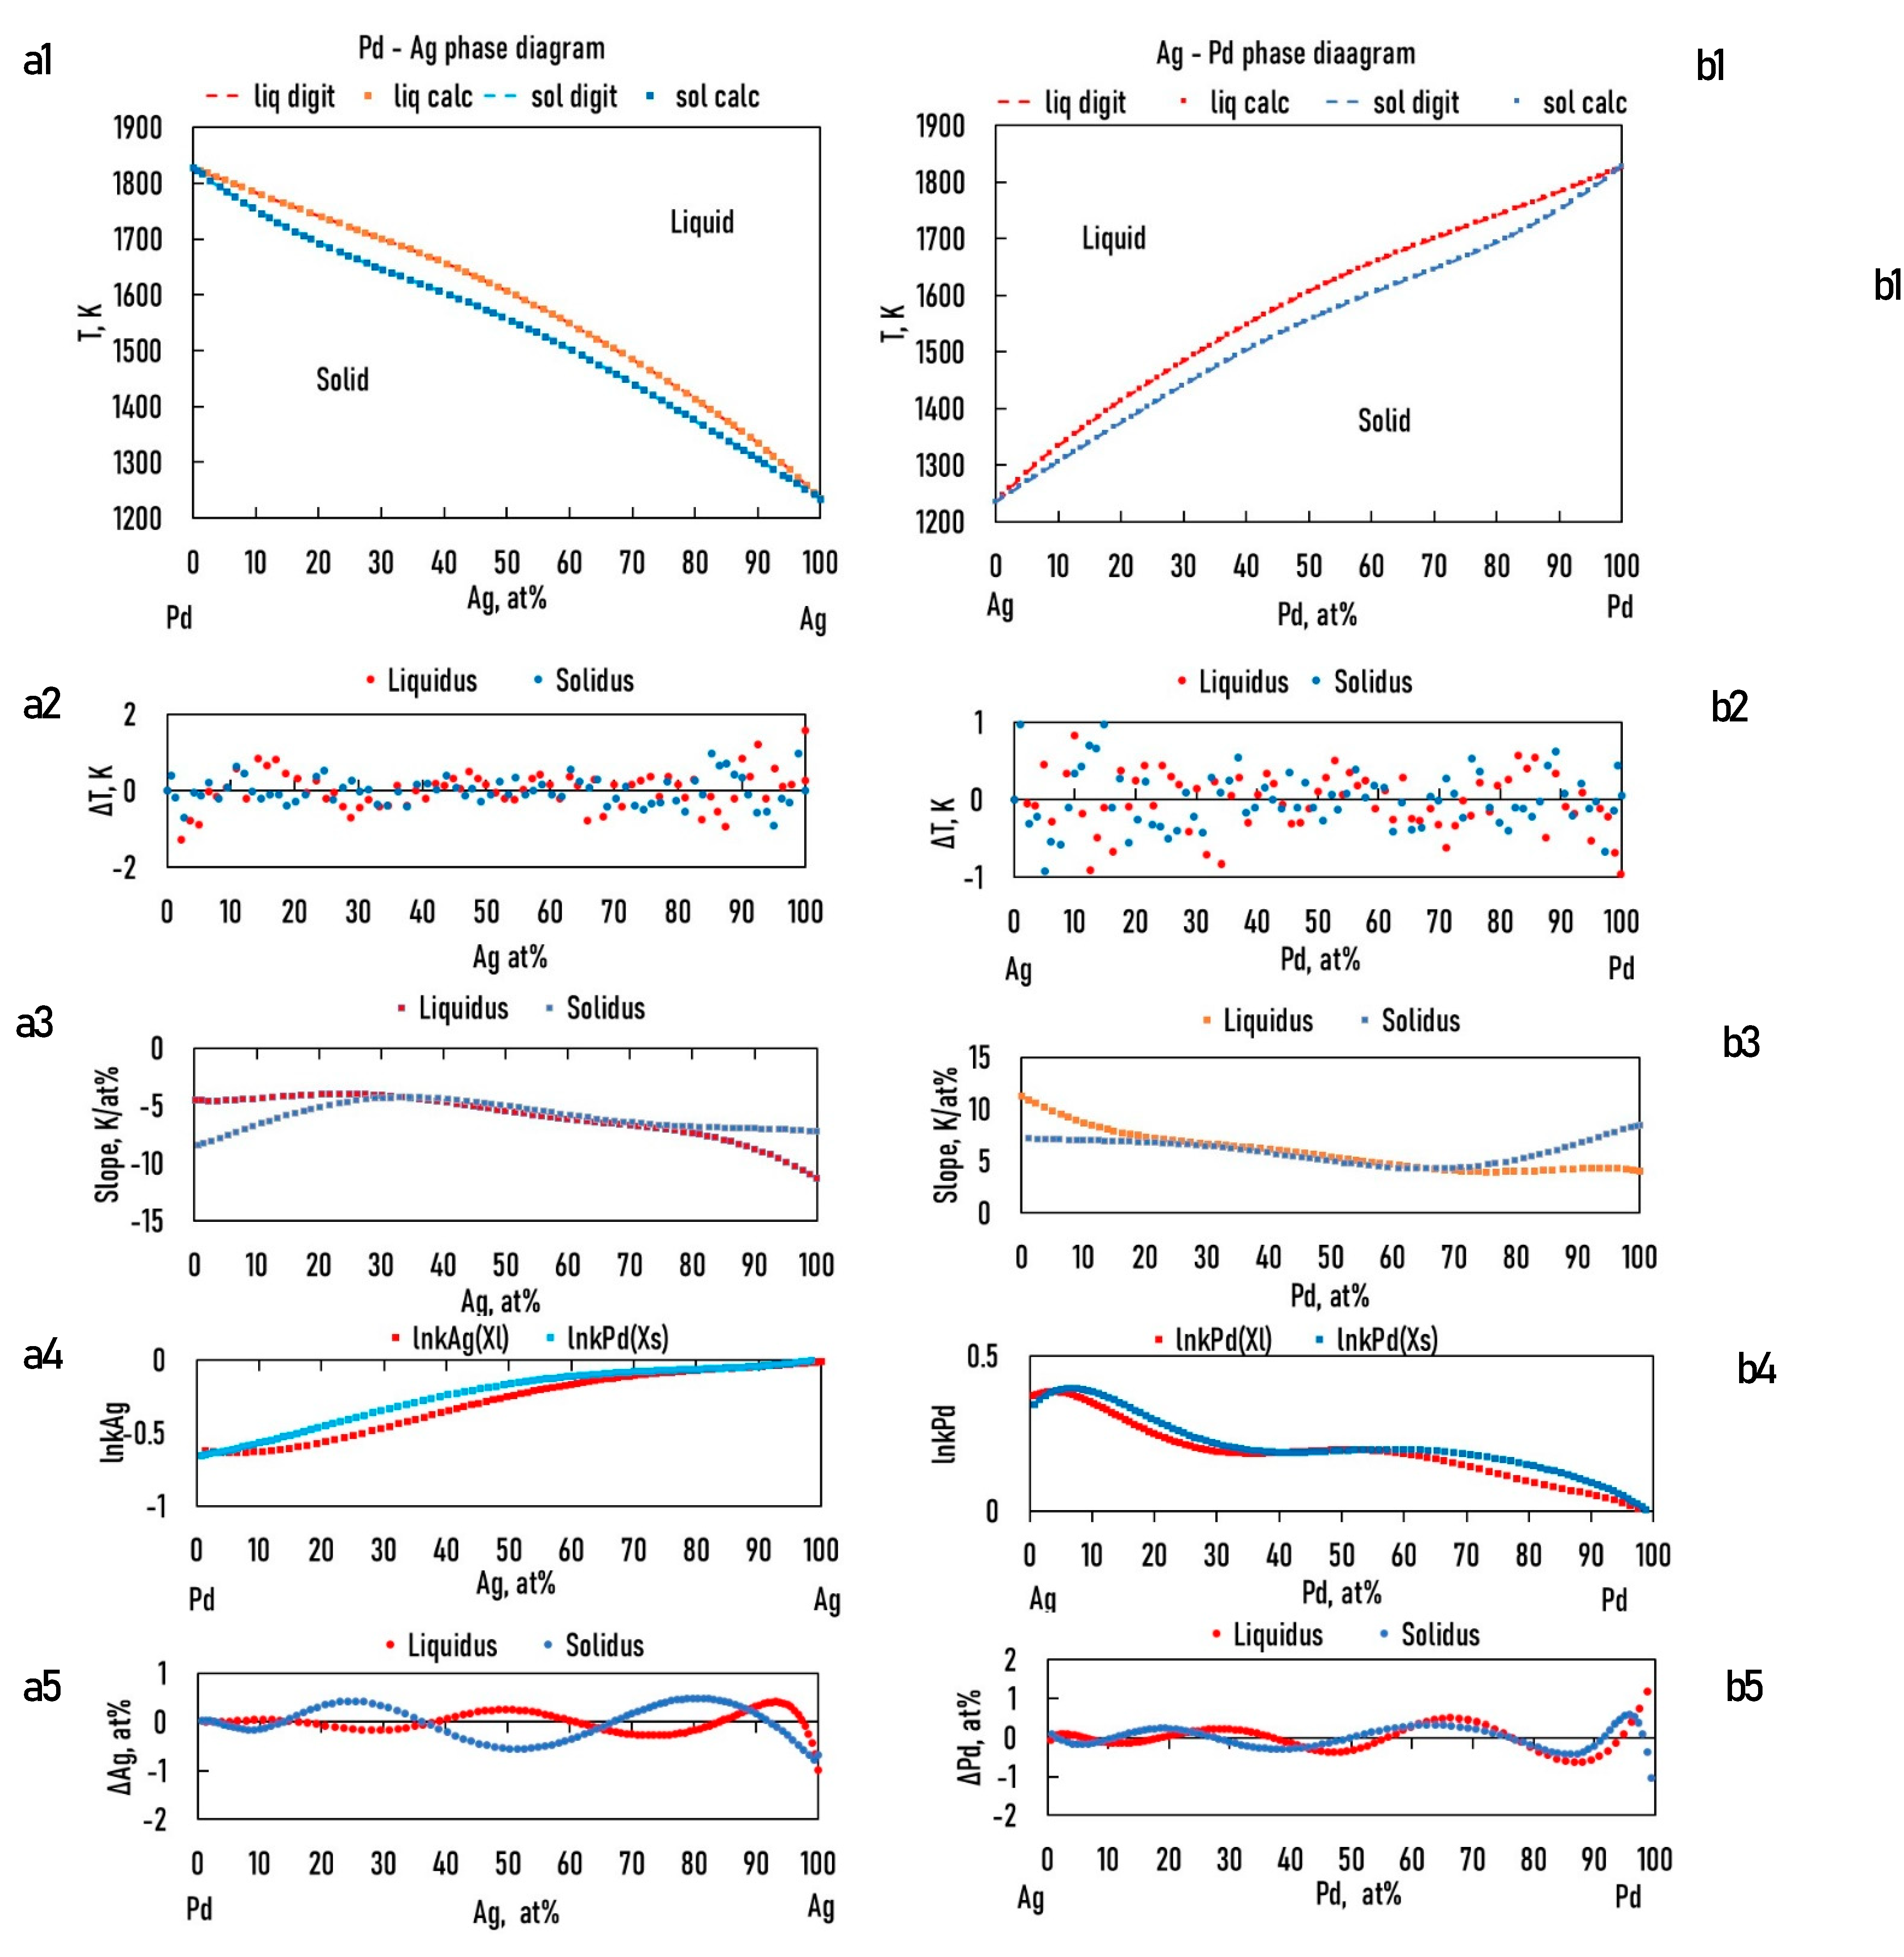
Figure 5.
a1, b1: digitalized and calculated Pd - Au, Au -Pd equilibrium phase diagrams; a2, b2: the differences between the digitalized and calculated liquidus and solidus temperature; a3, b3: the slope of the liquidus and solidus; a4, b4: lnkAu, lnkAPd; a5,b5: the differences between the digitalized and calculated Ag, Au concentrations as a function of Au/Pd concentration.
Figure 5.
a1, b1: digitalized and calculated Pd - Au, Au -Pd equilibrium phase diagrams; a2, b2: the differences between the digitalized and calculated liquidus and solidus temperature; a3, b3: the slope of the liquidus and solidus; a4, b4: lnkAu, lnkAPd; a5,b5: the differences between the digitalized and calculated Ag, Au concentrations as a function of Au/Pd concentration.
7.2.3. Calculation of the Partition Ratios of the BEPDs
It follows from the hierarchical structure of the ESTPHAD system that the functions of the partition coefficients (k) of TEPD contain the functions of the partition coefficients BEPDs. The partition coefficients were calculated as quotients of solid and liquid phase concentrations determined by digitization at a given temperature and were determined , functions for all six BEPDs (Figs.3.a4, b4, 4.a4, b4, and 5.a4, b4). The constants of the functions are shown in Table 5.
To check the accuracy of the , the solidus concentrations were calculated from the liquidus concentrations (Xs = k Xl). The differences between calculated and digitalized concentrations are shown in Figs. 6.a5, b5, 7a5, b5 and 8.a5, b5 and Table 6. The difference is, in most cases, a few 0.1 at%, which is sufficient accuracy for simulations.
7.3. Calculation of the Liquidus and Solidus Temperatures, Slope of the Liquidus Surface and Partition Ratios of Au and Pd in AgAuPd TEPD
The calculation of the liquidus, solidus temperature and partition ratios can be performed using the “A” elements, which would be all three Ag, Au, and Pd elements. The details of the calculations and the possibilities of the methods will be shown using Ag as the “A” element.
7.3.1. Calculation of the Liquidus and Solidus Temperatures
7.3.1.1. First Estimation
If the two BEPDs are known (Ag-Au and Ag-Pd), the third is not (Au-Pd), and it is also known that the TEPD is completely isomorphous, but the liquidus and the solidus isotherms aren’t known; the isotherm can be estimated as follows:
Assumed that
And
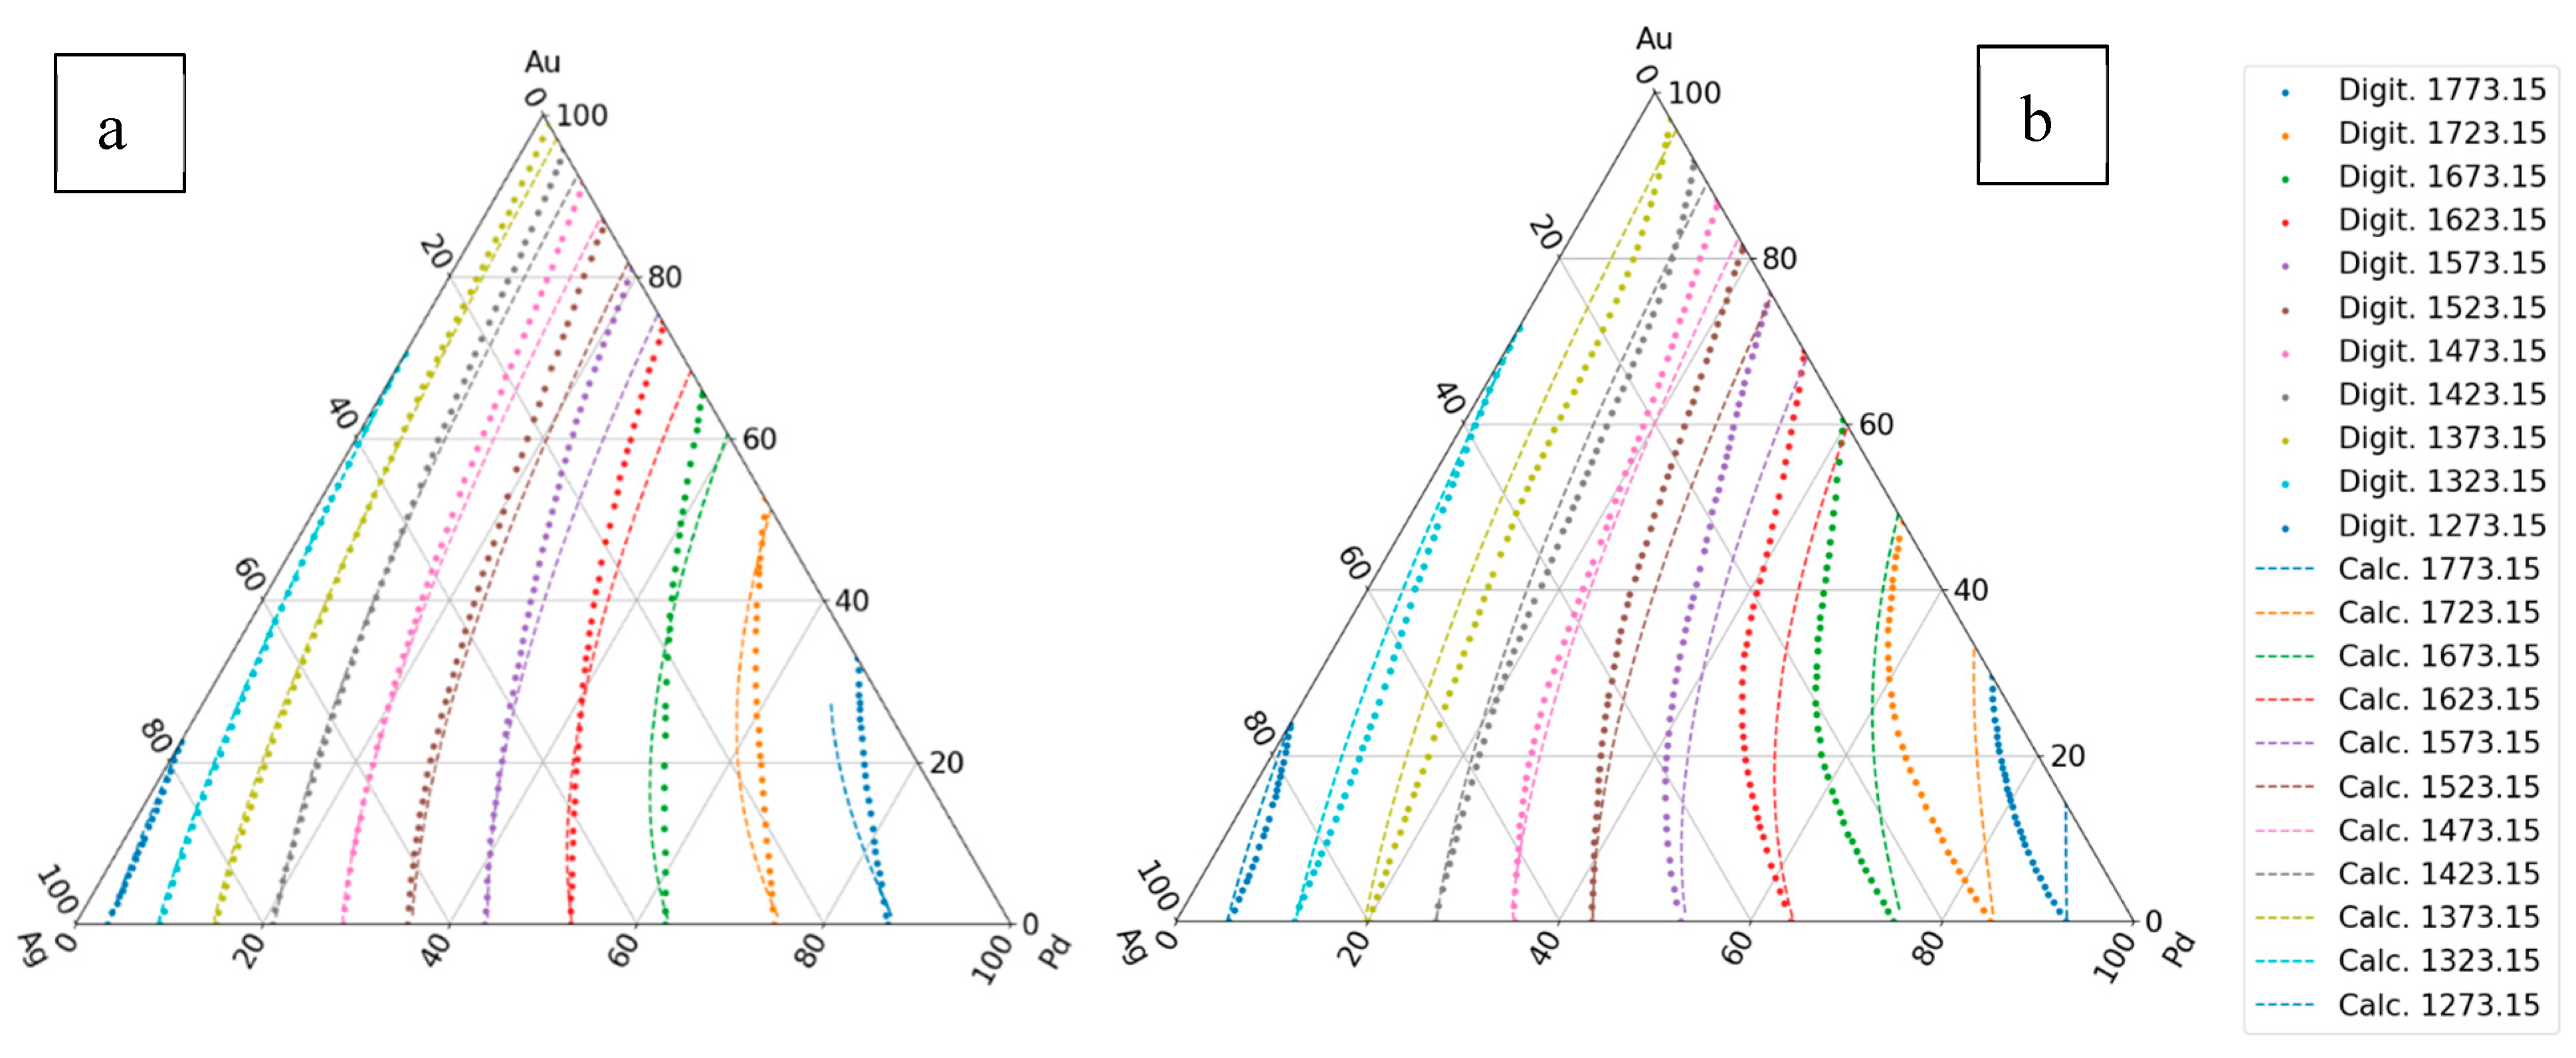
The calculated liquidus and solidus isotherms are compared with the known isotherms in Figs. 6. a and b. The constants of the and functions are in Tables 1,7, 8 (liquidus) and 2,9,10 (solidus).
Figure 6.
The first estimation of the liquidus and solidus isotherms is calculated from Ag-Au and Ag - Pd BEPDs. a: liquidus isotherms, b: solidus isotherms.
Figure 6.
The first estimation of the liquidus and solidus isotherms is calculated from Ag-Au and Ag - Pd BEPDs. a: liquidus isotherms, b: solidus isotherms.
3.1.1.2. Second Estimation
If it is known that the TEPD is isomorphous, and the third BEPD also known (in this case the Au-Pd BEPD), the data of liquidus and solidus of this BEPD can be used for the calculation of the maps and from those the functions .
The digitalized and the calculated liquidus and solidus isotherms can be seen in Figure 7.
7.3.1.3. Third Estimation
Considering the liquidus and solidus temperatures at all known concentrations (at the isotherms) in the TEPD (except for the Au-Pd BEPD data if it isn’t known,) from these data can calculate the and maps (Eq. 55), and than the and maps (Eqs. 56, 57) maps and than the and functions (Eqs. 58, 59). The constants of the functions are in the Table 9 (liquidus) and 11 (solidus). The digitalized and the calculated liquidus and solidus isotherms can be seen in Figure 8.
7.3.1.4. Fourth Estimation
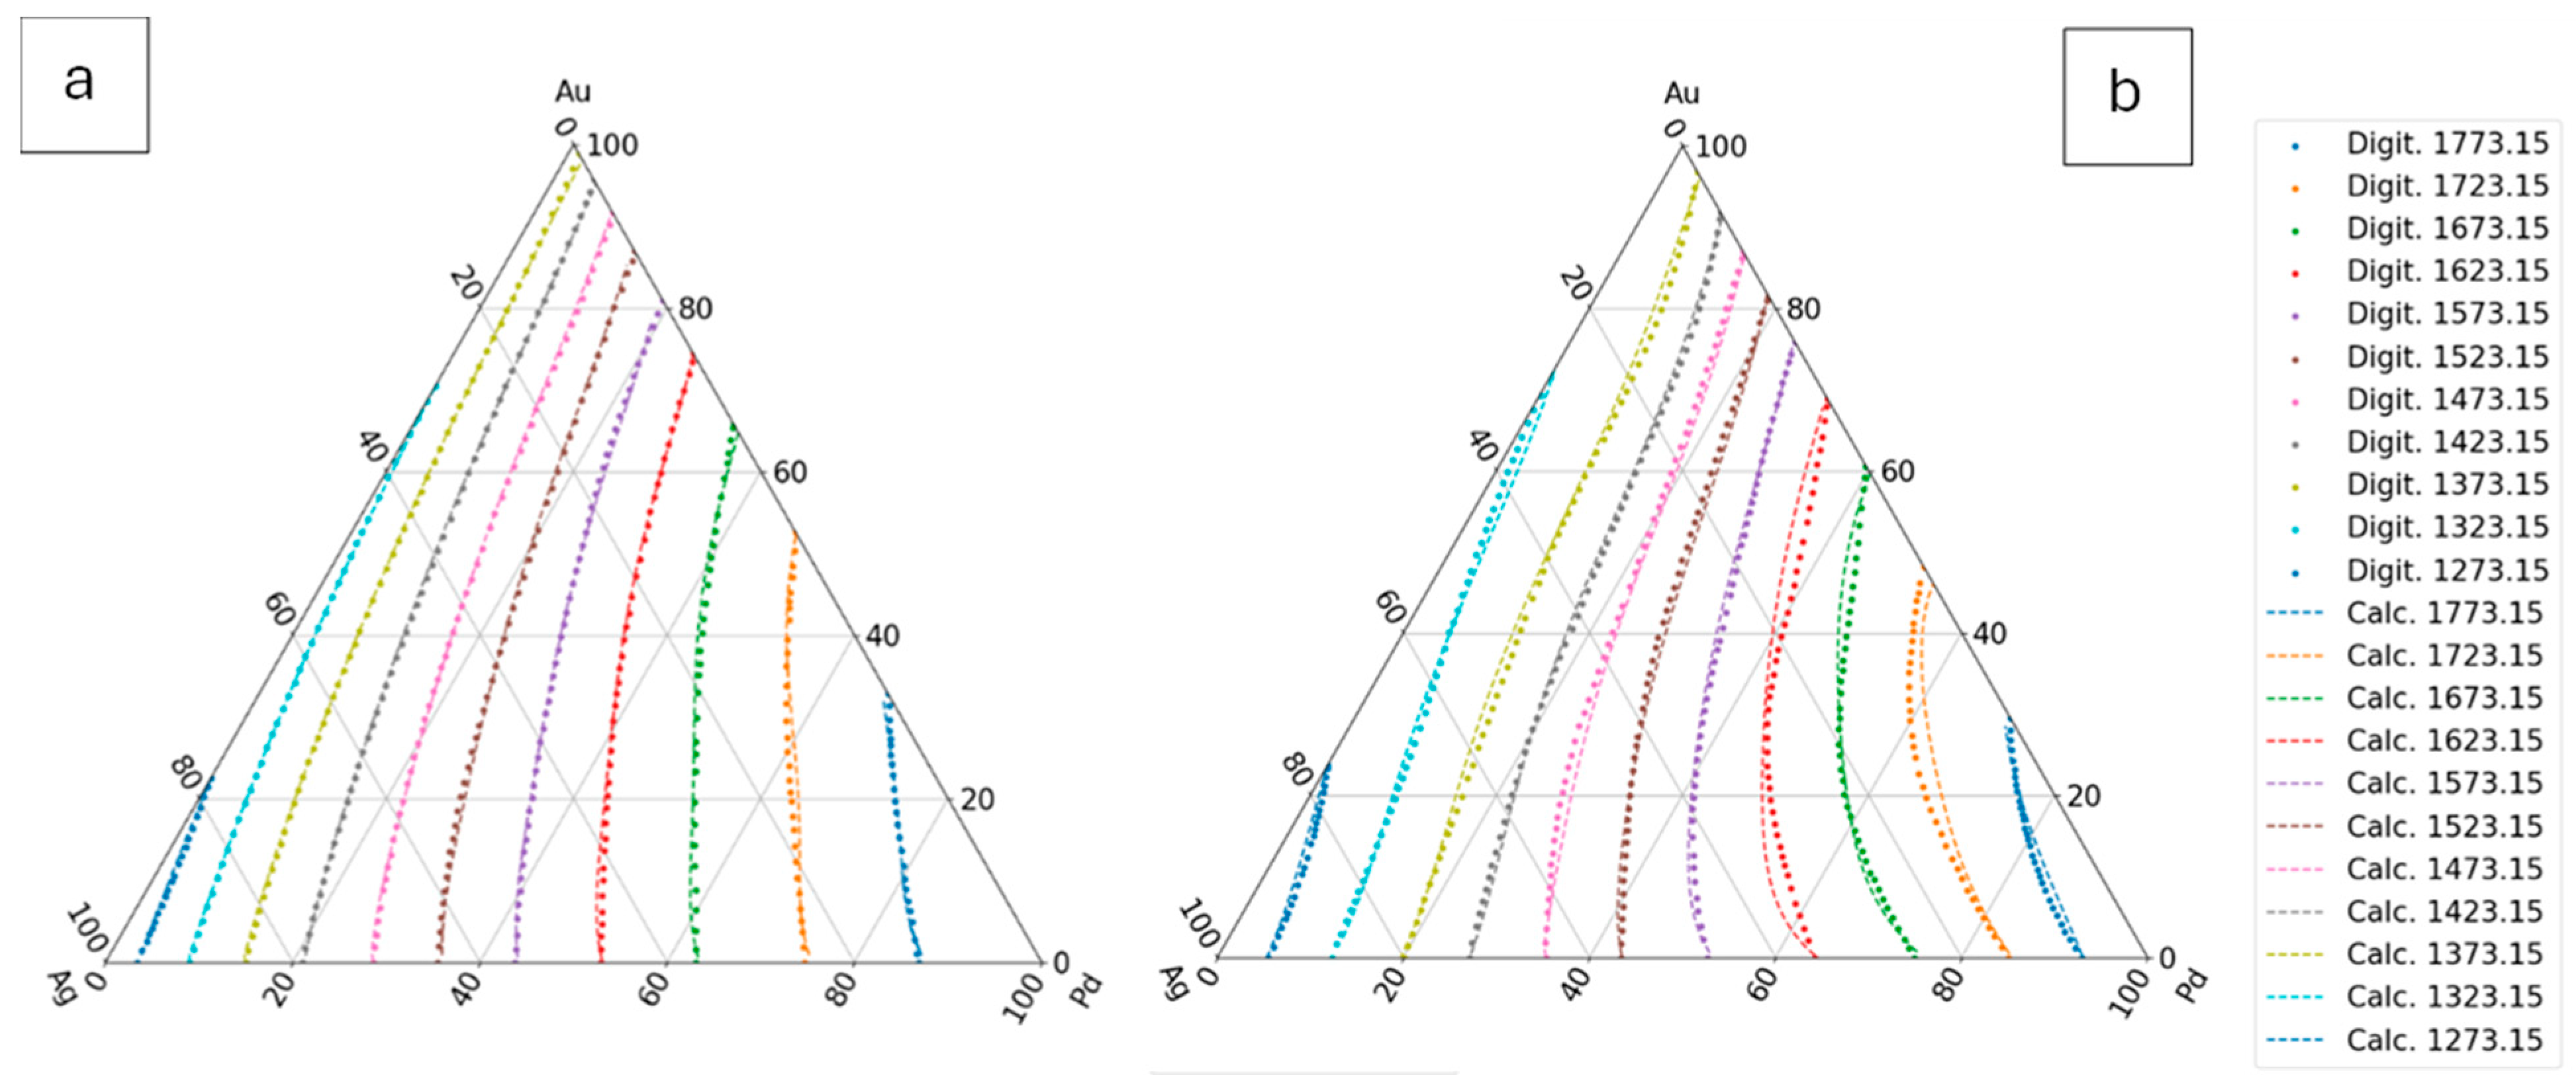
In this case, at the calculating of the constants of and functions, the data of the Au-Pd BEPD was take into account in order to calculate the liquidus and solidus temperatures of the Ag-Au-Pd TEPD as accurately as possible.
Figure 9.
The fourth estimation of the liquidus and solidus isotherms is calculated from Ag-Au, Ag-Pd-Pd and Au-Pd BEPD and the isotherms of the Ag-Au-Pd TEPD. a: liquidus isotherms, b: solidus isotherms.
Figure 9.
The fourth estimation of the liquidus and solidus isotherms is calculated from Ag-Au, Ag-Pd-Pd and Au-Pd BEPD and the isotherms of the Ag-Au-Pd TEPD. a: liquidus isotherms, b: solidus isotherms.
The constants of the functions are in Tables 10 (liquidus) and 12 (solidus).
Figure 10.
The differences between the digitalized and the calculated average liquidus temperatures as a function of the Ag concentration range. a: liquidus, between 100 and 20*n at%, b: between 20*n and 20*(n-1) at% Ag, c: solidus, between 100 and 20*n at%, d: between 20*n and 20*(n-1) at% Ag, where n is between 1 and 5.
Figure 10.
The differences between the digitalized and the calculated average liquidus temperatures as a function of the Ag concentration range. a: liquidus, between 100 and 20*n at%, b: between 20*n and 20*(n-1) at% Ag, c: solidus, between 100 and 20*n at%, d: between 20*n and 20*(n-1) at% Ag, where n is between 1 and 5.
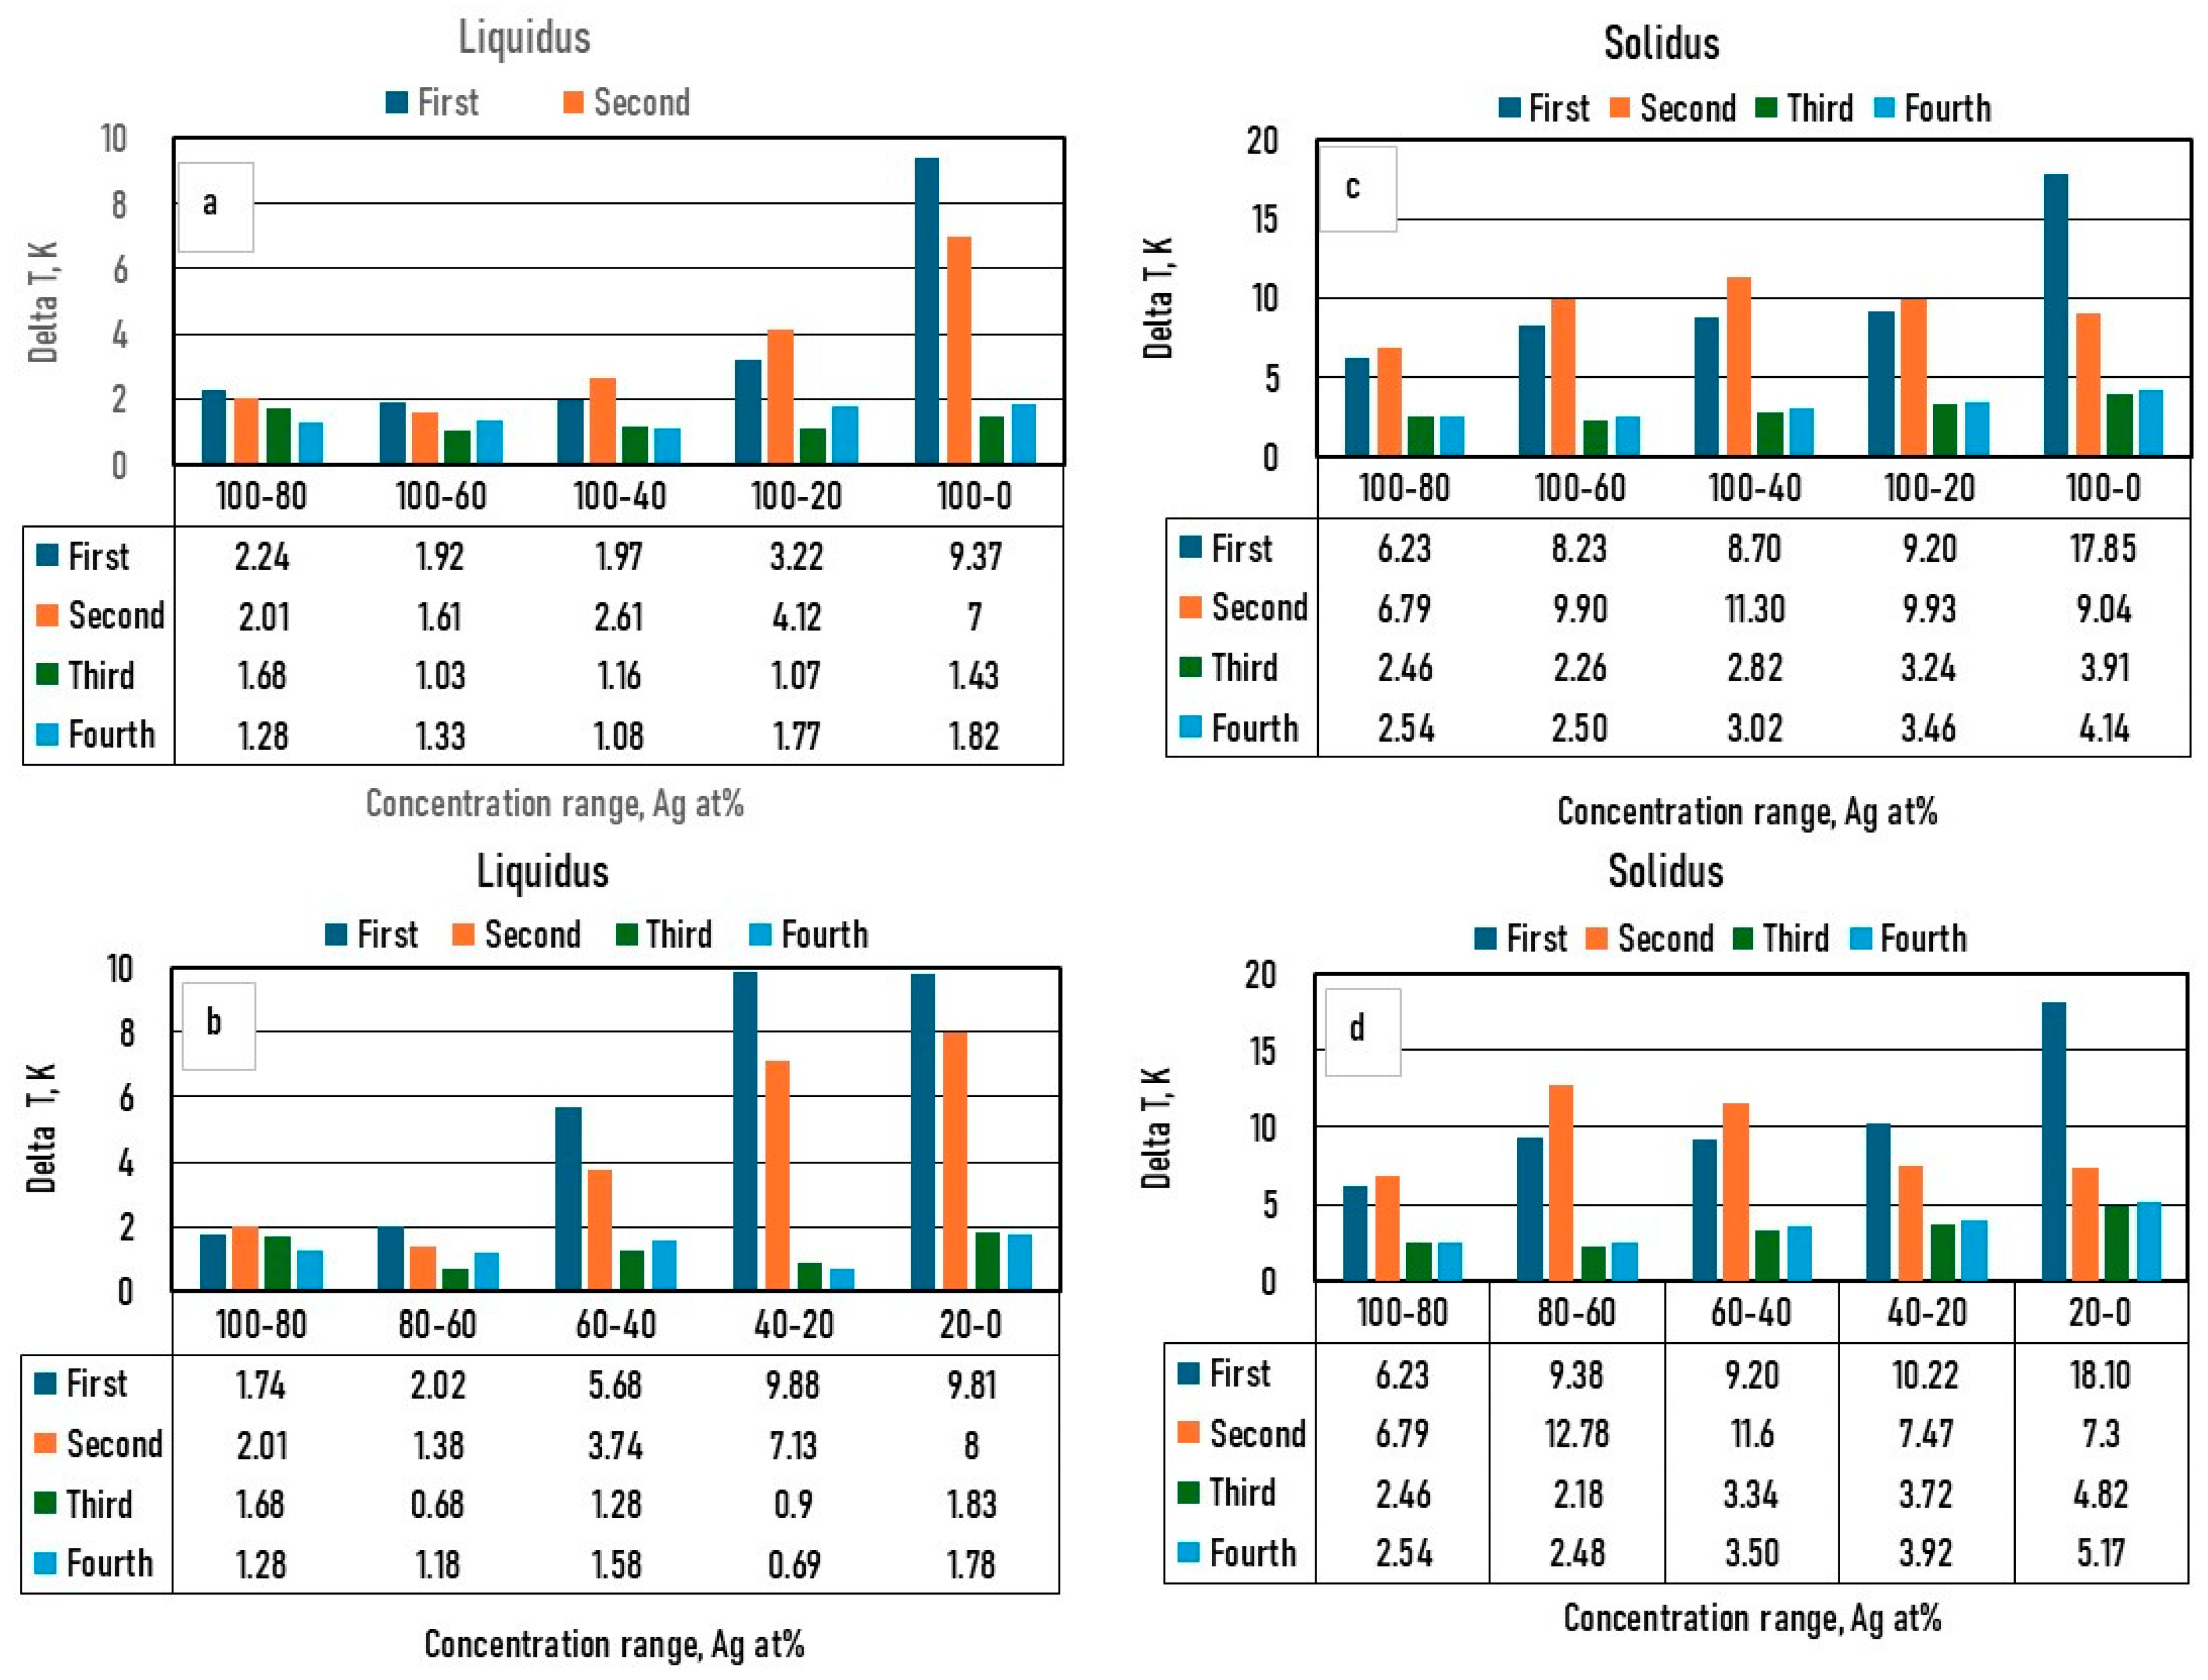
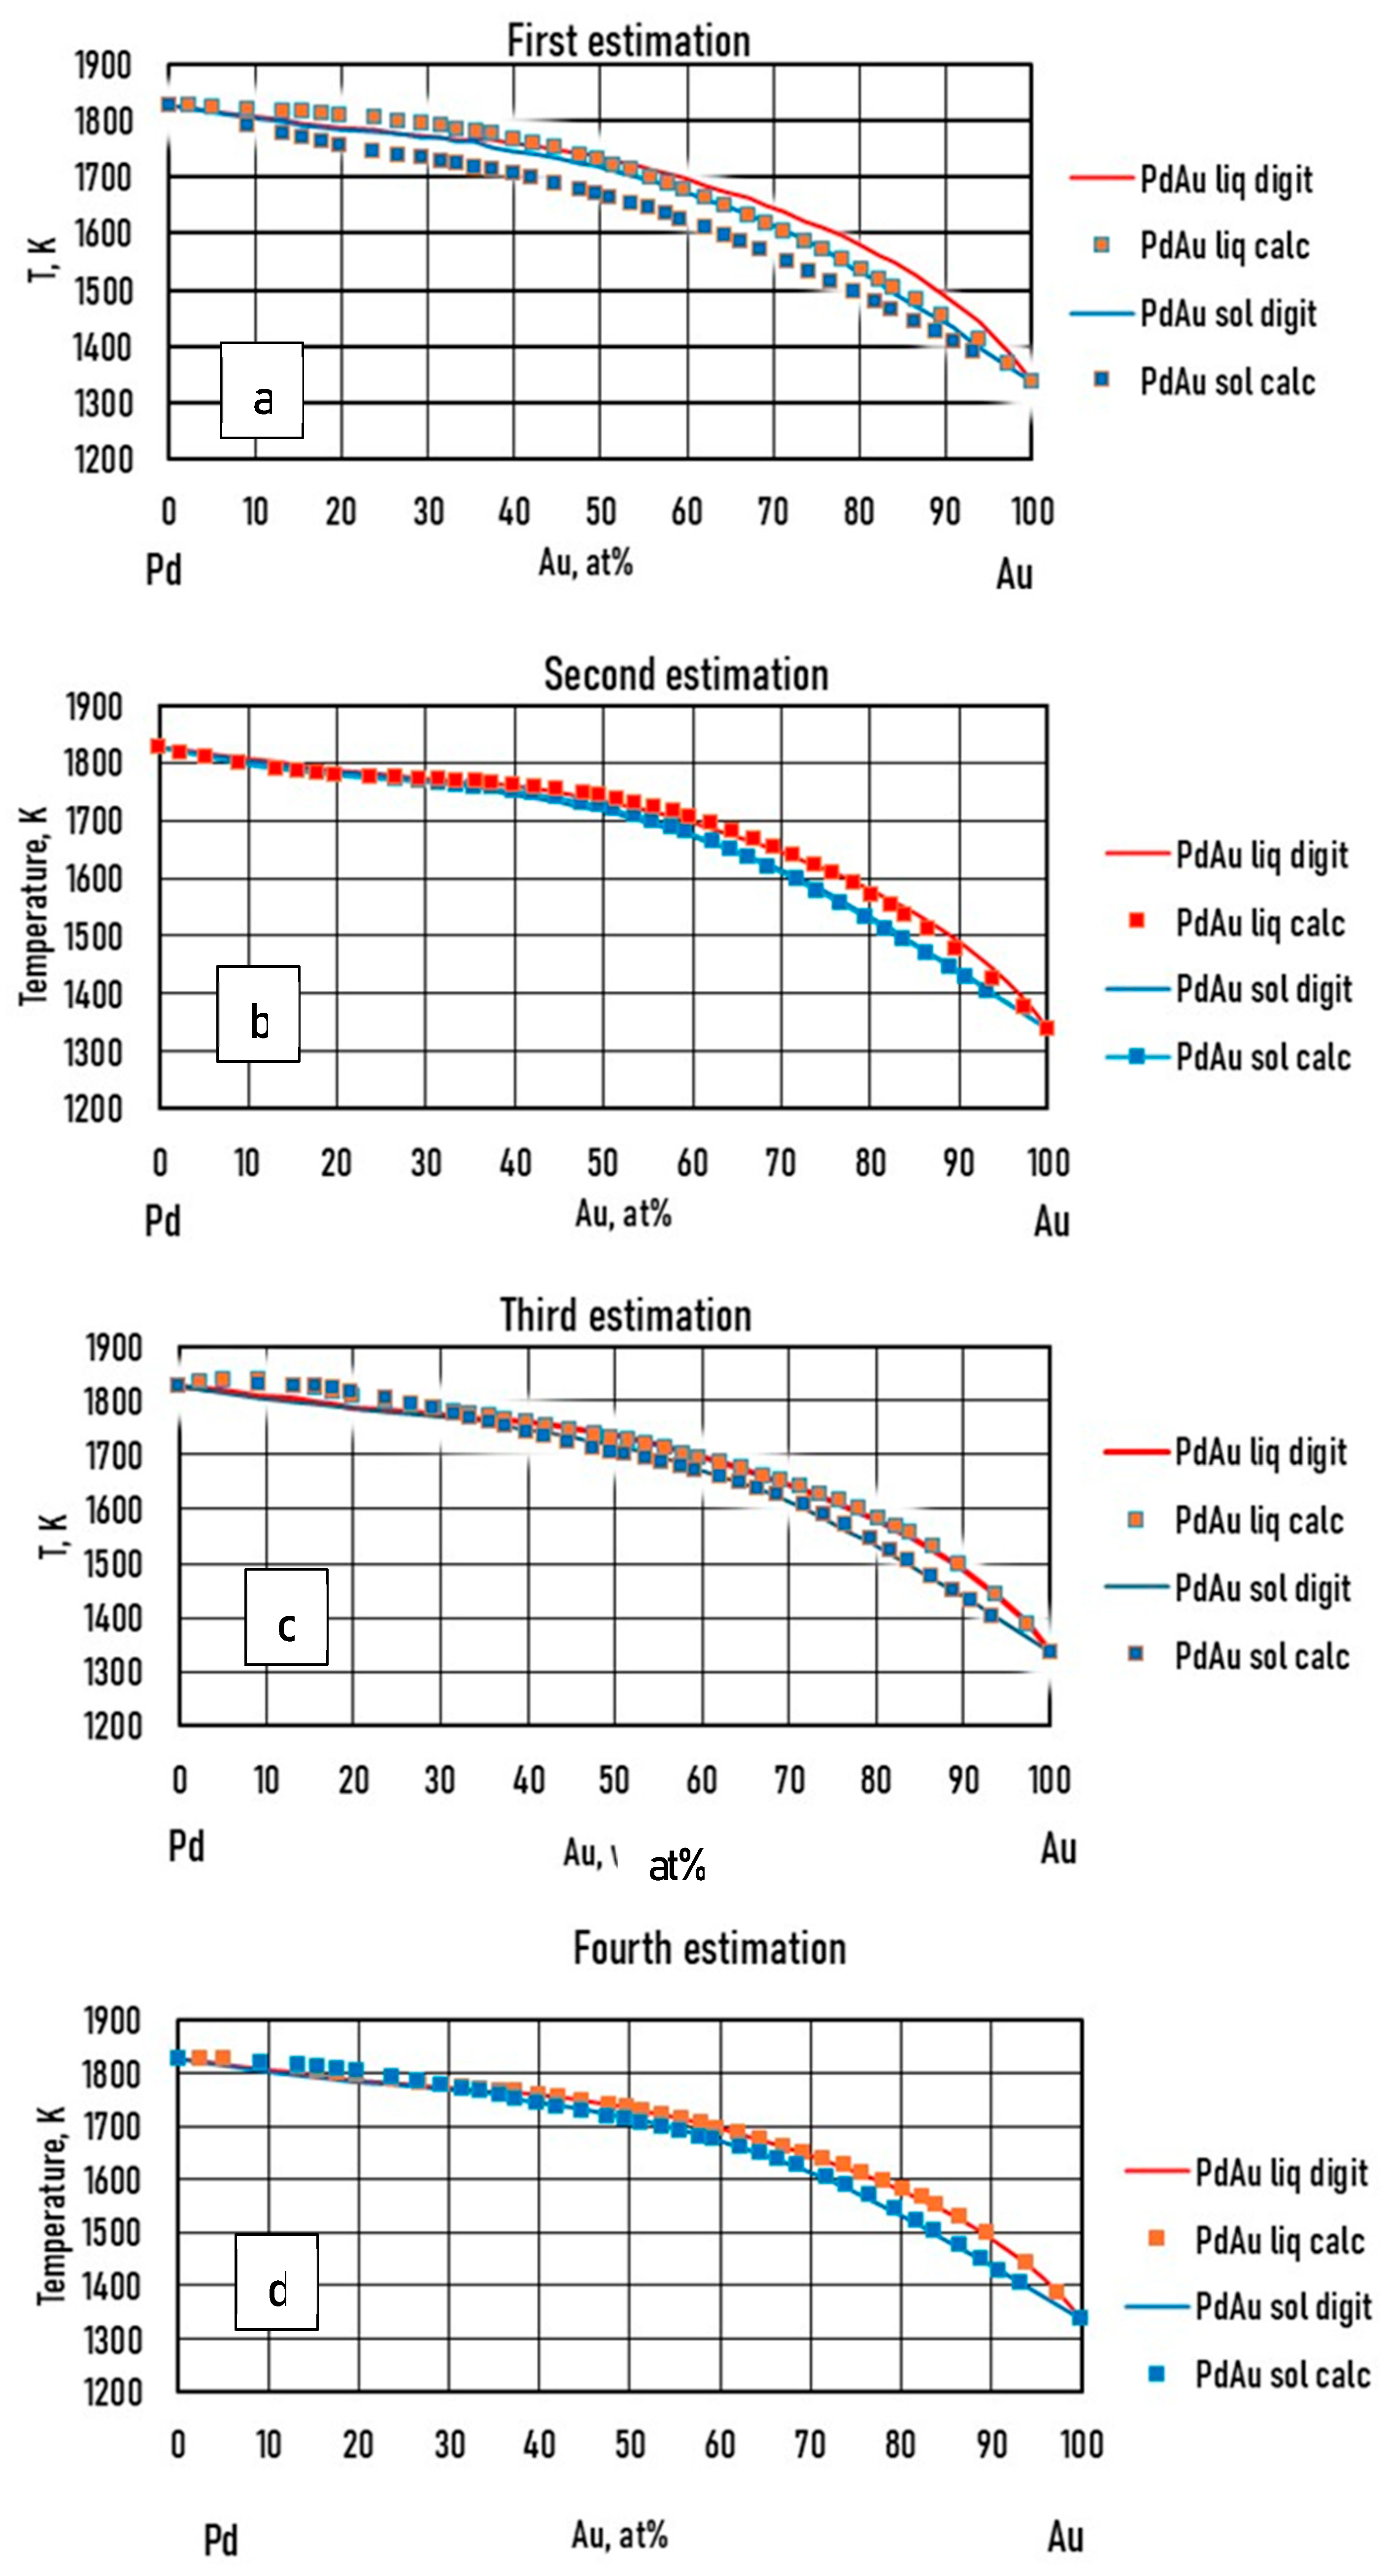
Figure 12.
The digitalized and the calculated Pd–Au BEPD. a: first estimation, b: second estimation, c: third estimation, d: fourth estimation.
Figure 12.
The digitalized and the calculated Pd–Au BEPD. a: first estimation, b: second estimation, c: third estimation, d: fourth estimation.
7.3.1.5. Validation by Experiments
Venudhar et al [26], Nemilov et al [27], Pauley [28] and Miane et al [29] measured the liquidus and the solidus temperatures at three sections of AgAuPd TEPD. Prince et al [25] analysed the measured data and calculated the liquidus and solidus of these sections (Digit in Fig. 13). The measured, digitalized and calculated by the fourth estimated functions are compared in Figure 13.
7.3.2. Calculation of the Liquidus and Solidus Slopes
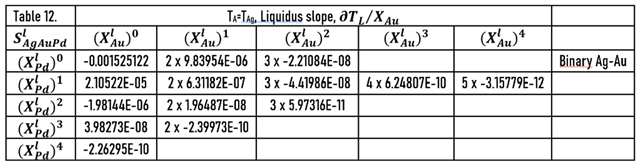
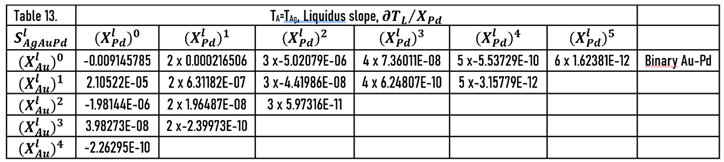
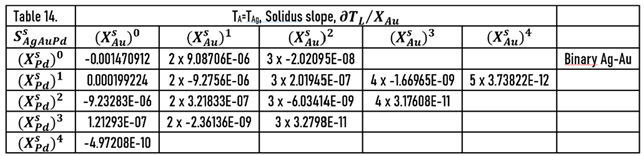
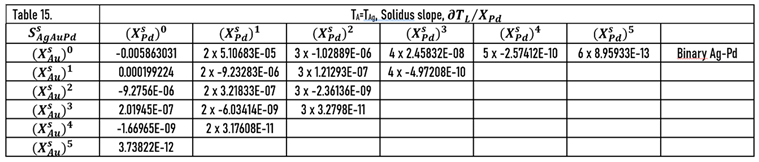
As it was shown earlier, the slopes of the liquidus surface can be calculated easily by the partial derivative of. the ) function (Eqs.49, 51). The constants of the numerator of the derivative functions (Sl) are contained in Tables 12 and 13; the slopes calculated along the isotherms are illustrated in Figure 14 and Figure 15. Of course, the slopes can be calculated at any arbitrary point on the liquidus and solidus surfaces. The slopes of the solidus surface can also be calculated by deriving the function, if necessary.
7.3.3. Calculation of the Partition Ratios of AgAuPd TEPD
The drawn ternary equilibrium phase diagram does not contain the tie lines, because experimentally determining the equilibrium concentrations of the liquidus and solidus phases is very complicated. Then, many concentrations were determined for the database by digitalization the liquidus and solidus isotherms which were not on a same tie line. Consequently, only estimated partition ratios can be calculated. The calculation method is shown in Chapter 6.2.2.
First step:
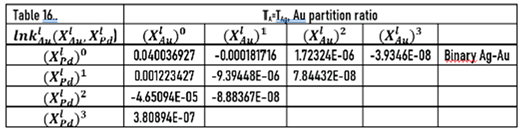
The calculation of the partition ratios of Au and Pd in the Ag-Au and Ag-Pd BEPD is shown in Chapter 7.2.3. The constants of the and functions are in Table 5.
Second step (first estimation).:
Using the and partition ratios functions, solidus concentrations maps were calculated from the fourth estimated liquidus concentrations of the isotherms. As we could not consider the effect of the Au and Pd interaction, the calculated solidus concentrations were not exactly on the same isotherms of the solidus.
With a special method, the solidus concentration was determined on the solidus isotherm. One example is shown in Fig. 16. Choosing the point on the isotherm (red line), using the and functions and were calculated. The point is on the isotherm (dotted line), . The tie line is between the two black point.
Third step (second estimation)
Assummed thet the slope of the tie line equal to the slope of the tie line in the TEPD, with the elongated tie line the isoterm (blue line) was cut, obtained the concentrations. Repeated this calculation at all liquidus isotherms at many liquidus concetrations and divided the obtained solidus concentrations with the liquidus concentrations, the and partition ratio maps were calculated. Using these maps the and maps were recalculated:
and
From the and maps the constants of the
and functions was calculated by regression
Finally:
The constants of these functions are in Tables 16 and 17.
Using these functions, the solidus concentrations (open circle in the Figure 16) maps was recalculated and from those, the solidus temperatures were recalculated again with the function (dotted green line in Fig. 16.). One example of the calculated tie lines are in Figure 17. The original and the recalculated solidus isotherm can be seen in Figure 18.
The differences between the original isotherms and the recalculated solidus temperature are shown in Figure 19.
We note, that the and functions were not determined, because most of the simulation of the solidification is not requiered. If those are needed for the simulation with the same method, they can be determined.
Figure 16.
The sketch of determining the partition ratios in TEP.
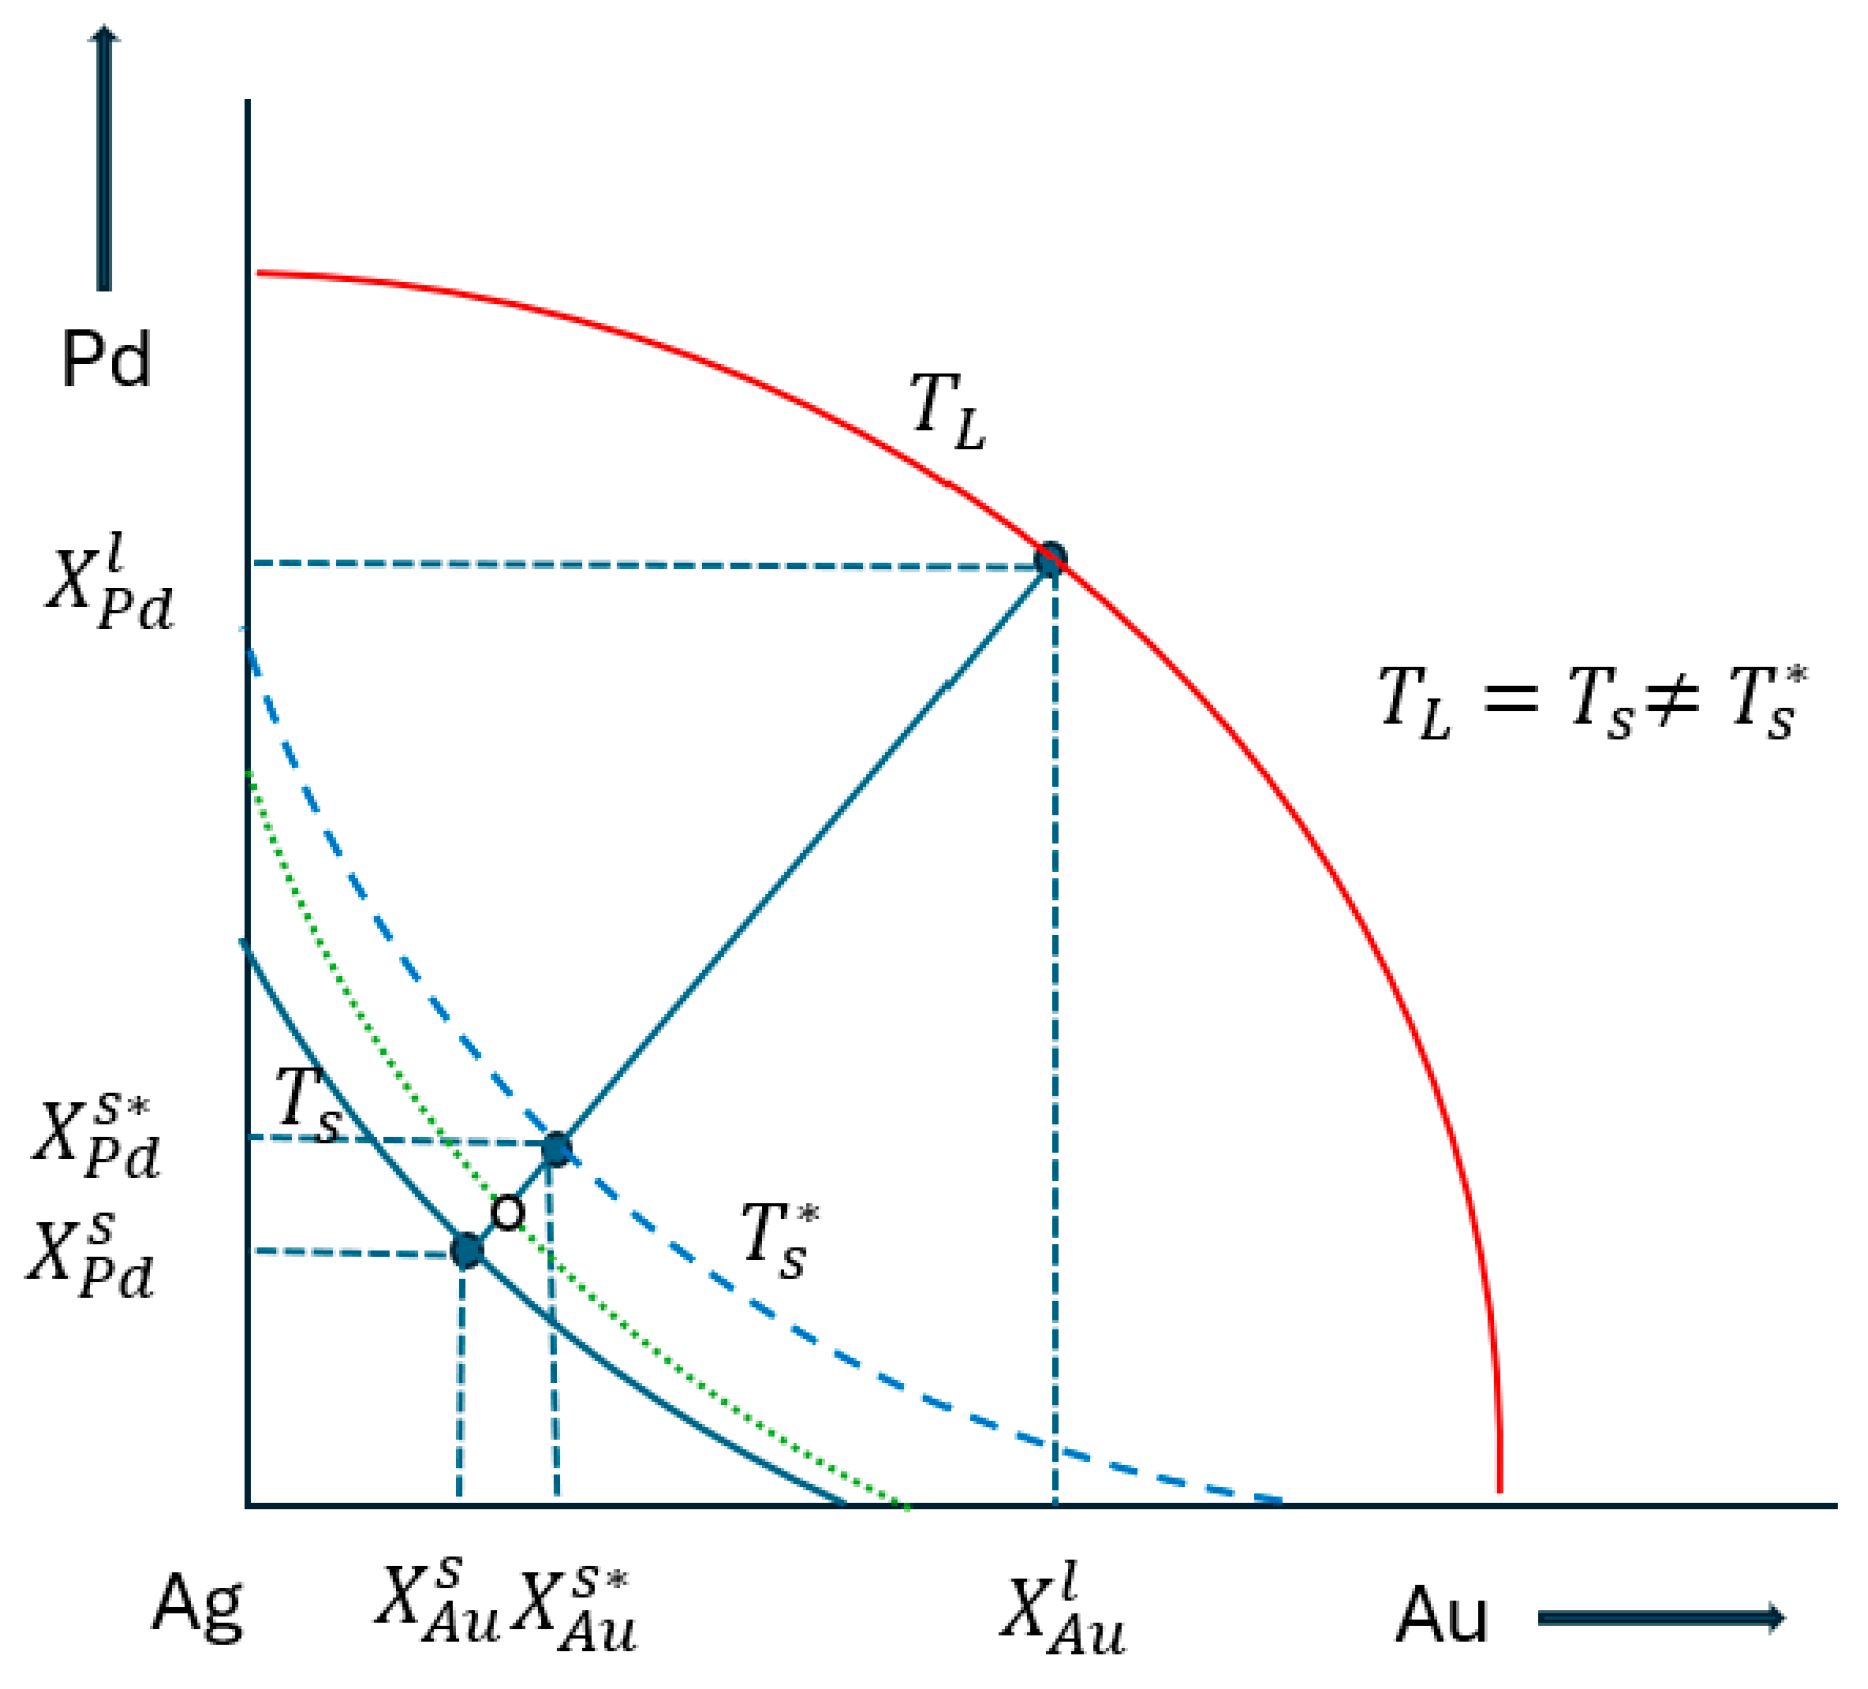
Figure 17.
Calculated tie lines, TA=TAg . Fourth estimation of liquidus and solidus.
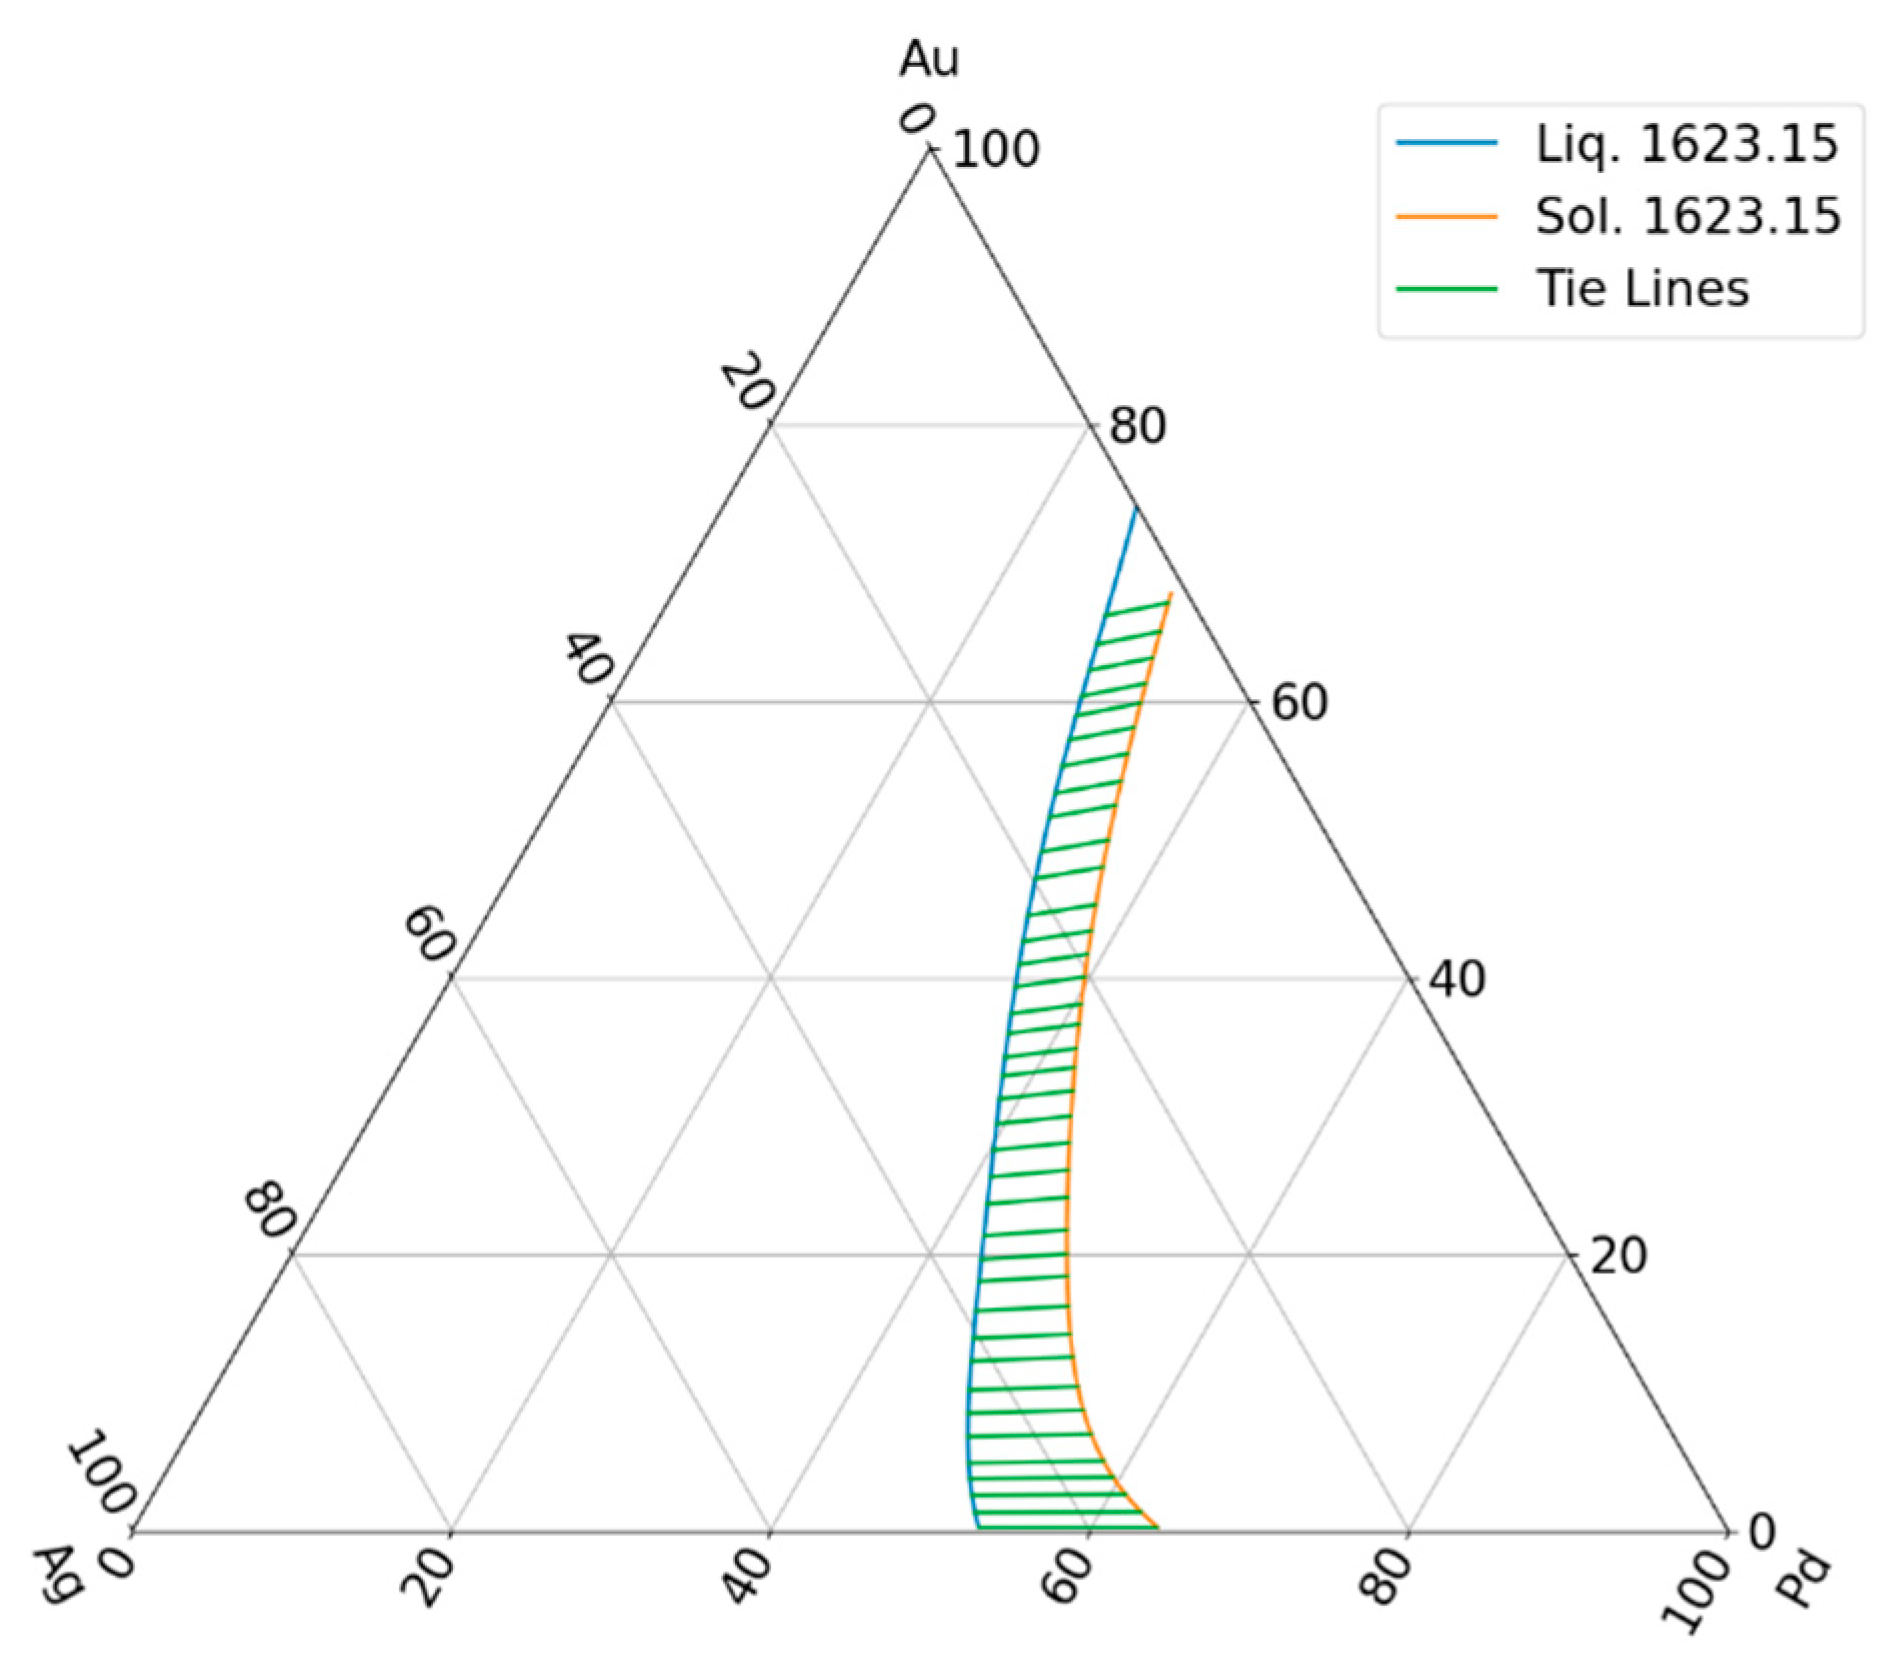
Figure 18.
Recalculated solidus isotherms by a: and functions, and b:
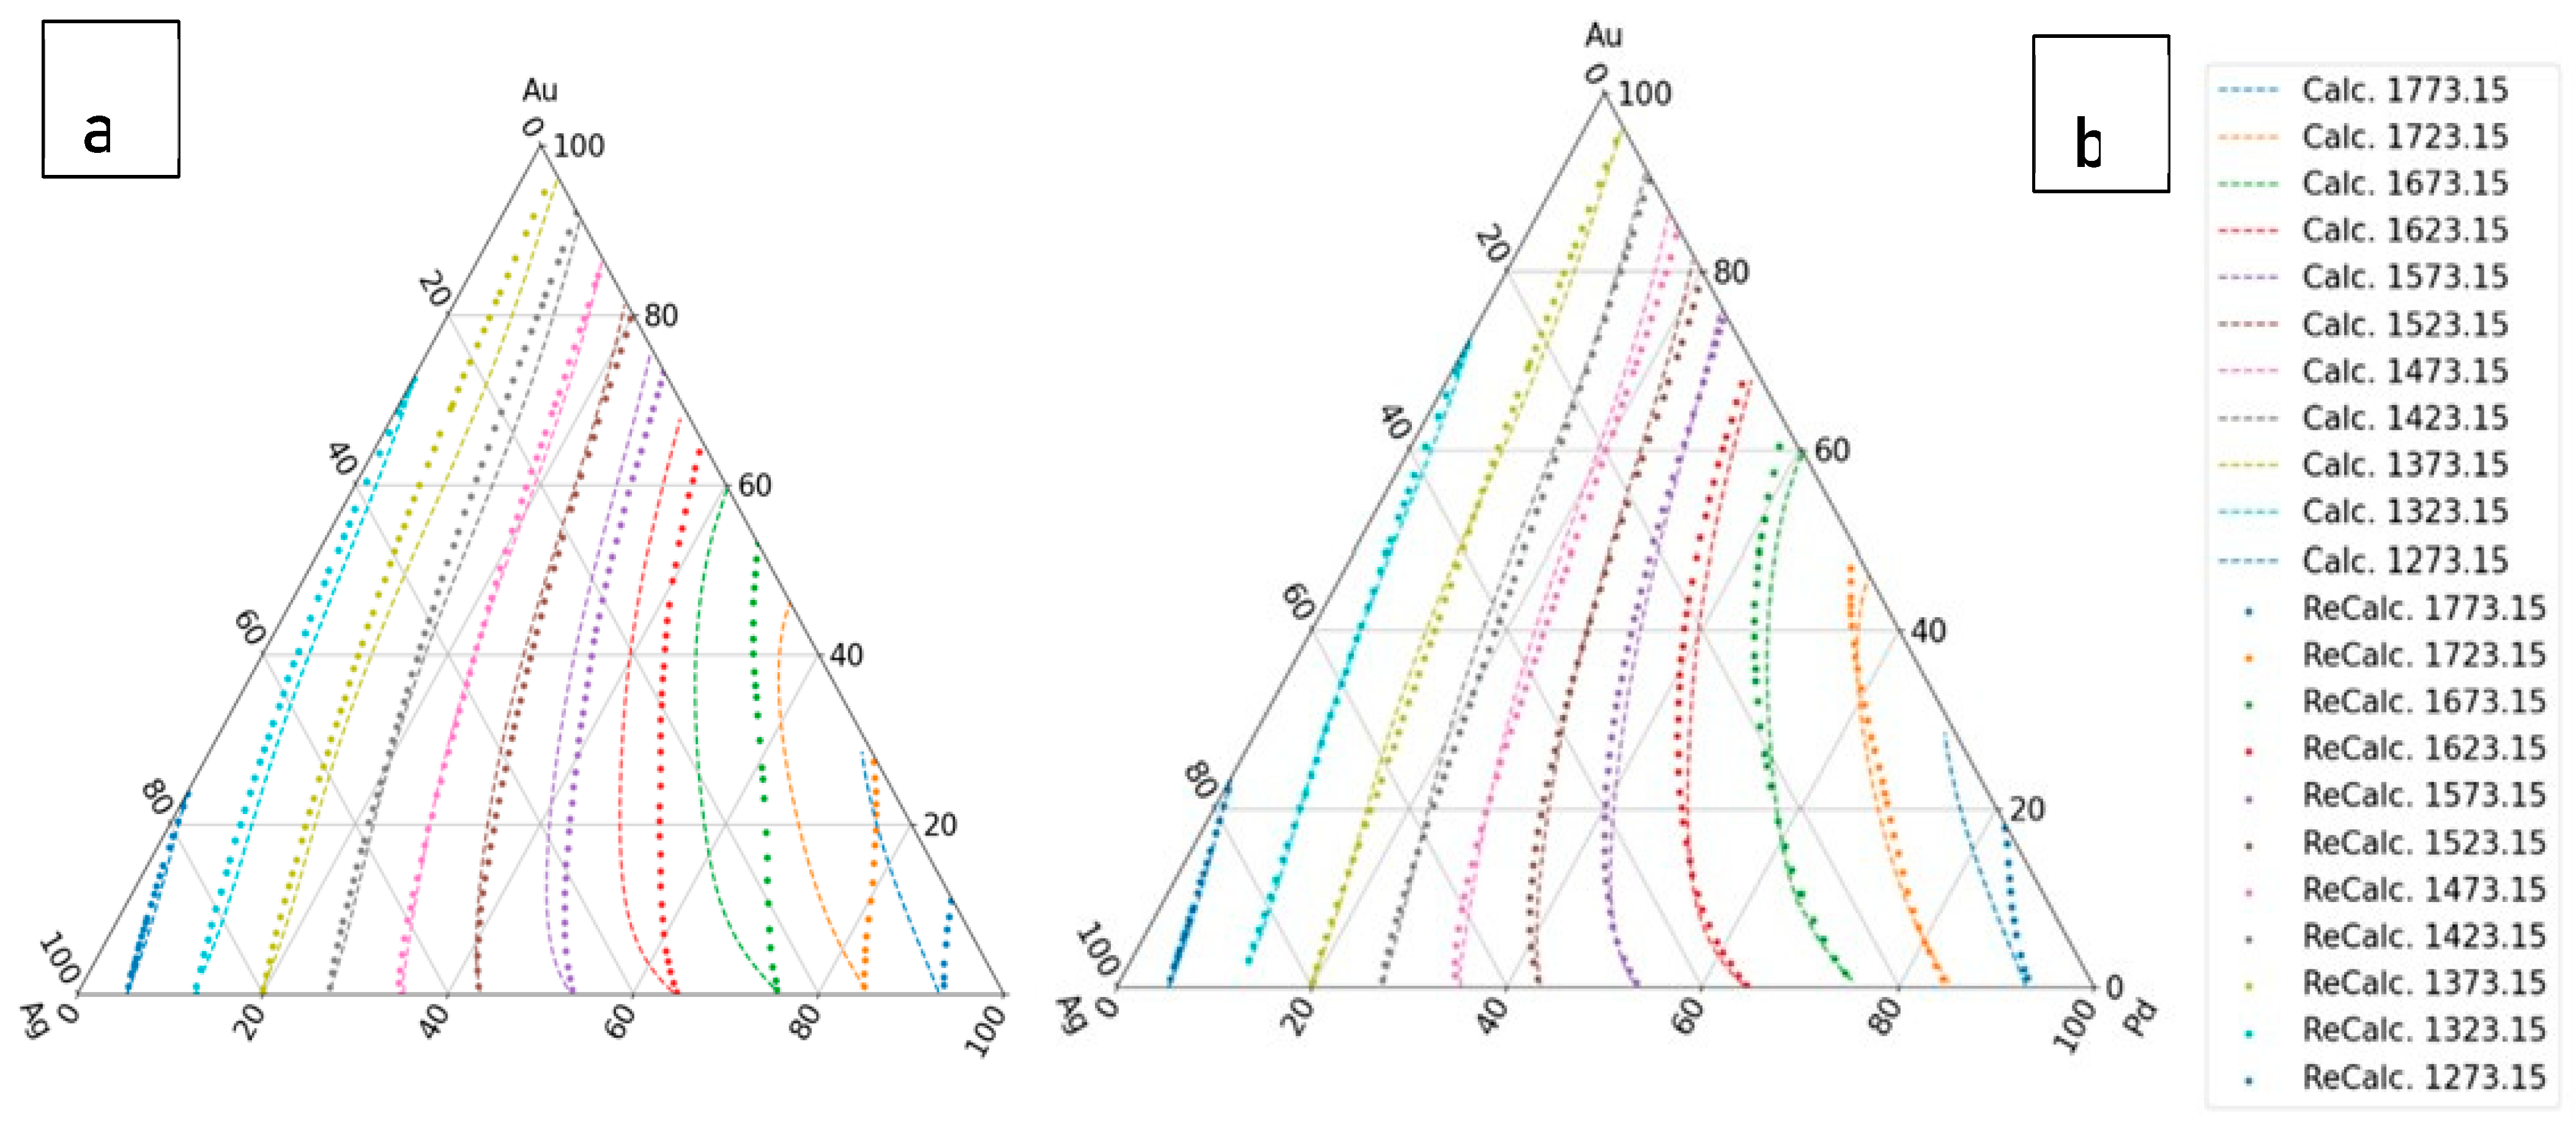
Figure 19.
Differences (Delta) between the solidus temperature calculated with the fourth estimation and the recalculated temperature calculated with the first and second estimation of the partition ratios.
Figure 19.
Differences (Delta) between the solidus temperature calculated with the fourth estimation and the recalculated temperature calculated with the first and second estimation of the partition ratios.
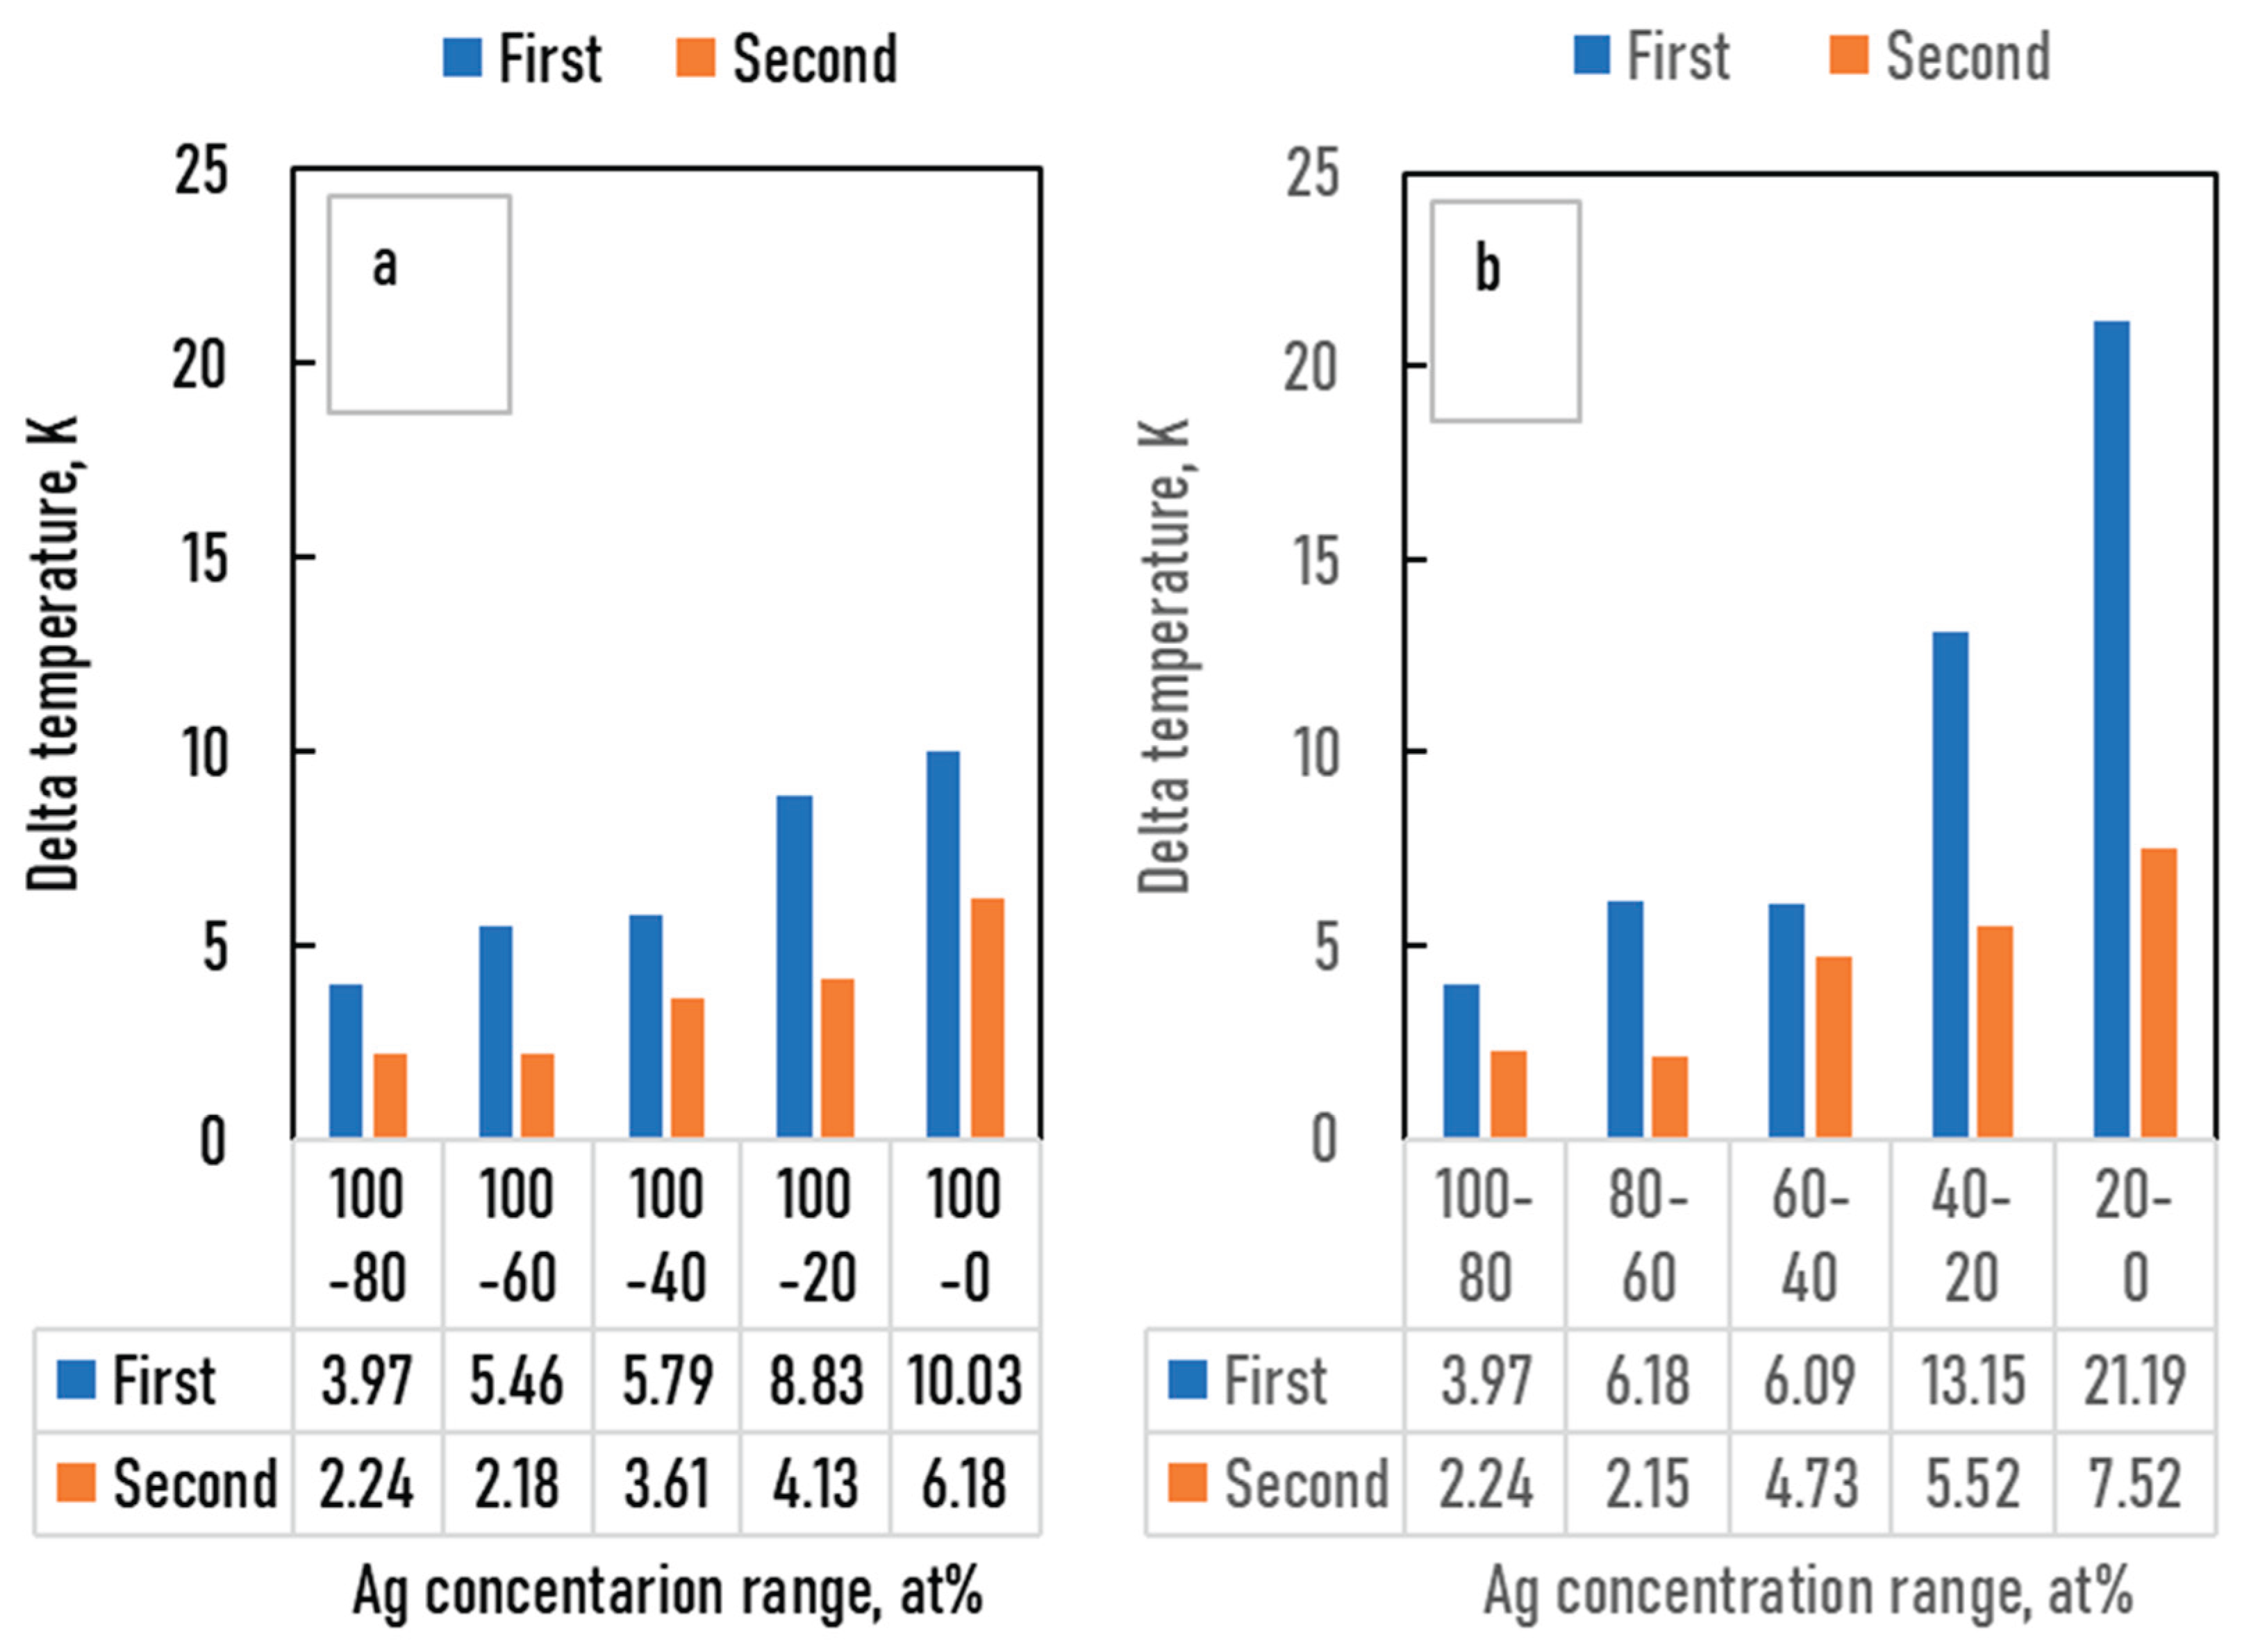
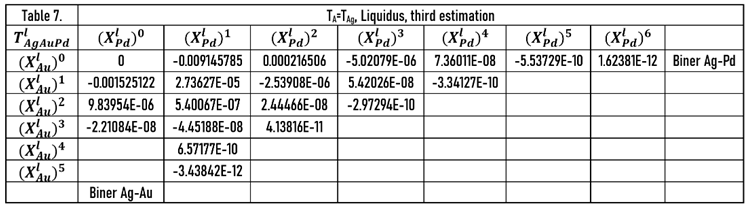
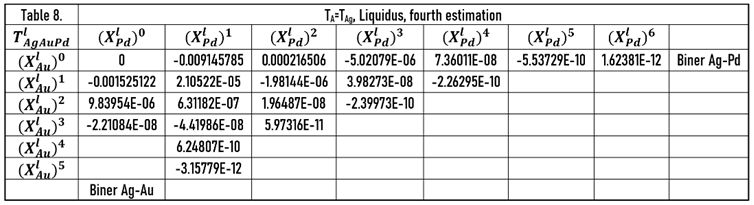
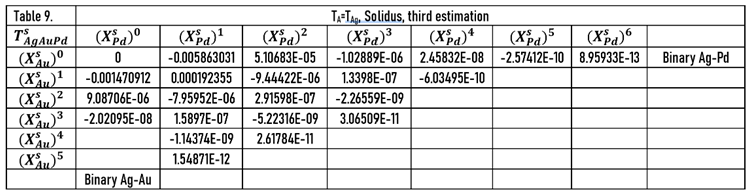
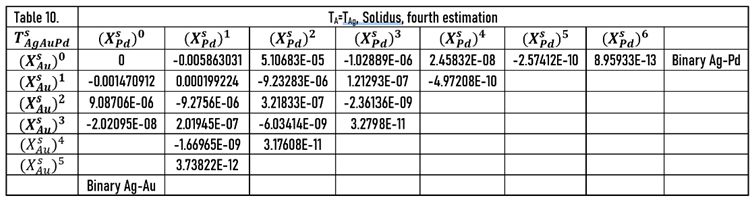
Table 11.
The differences between the digitalized liquidus and solidus temperature and the calculated one at the four estimations of Pd-Au BEPD.
Table 11.
The differences between the digitalized liquidus and solidus temperature and the calculated one at the four estimations of Pd-Au BEPD.
| Aver. Delta T Liq. K | Aver. Delta T Sol. K | |
| First est. | 20.72 | 37.7 |
| Second est. | 4.03 | 4.56 |
| Third est. | 10.14 | 7.37 |
| Forth est. | 2.98 | 5.64 |

8. Discussion About the Calculation of the Liquidus and Solidus Temperatures, the Liquidus Slopes and the Partition Ratios
The liquidus and solidus temperatures, liquidus slopes and the partition ratios of the binary Ag-Au, Ag-Pd, Au-Pd and ternary Ag-Au-Pd phase diagrams were calculated with a new thermodynamic-based method. In the case of the ternary Ag-Au-Pd phase diagram, four different methods were used in the calculation of the liquidus and the solidus temperatures. In the first method (first estimation), only the functions of Ag–Au and Ag-Pd BEPD were used in the calculation, while in the second method (second estimation), the Au-Pd BEPD was also used. In the third method, in addition to the two Ag–Au and Ag-Pd BEPD, the digitalized liquidus and solidus temperature data of the isotherms of Ag-Au-Pd TEPD were also taken into account (third estimation), while in the fourth method, the liquidus and solidus data of the Au–Pd BEPD were also used in the calculation. In all four methods, the liquidus and solidus isotherms were calculated. The digitalized and the calculated isotherms are shown in Figs. 6,7, 8 and 9. The digitalized and calculated liquidus and solidus temperatures were compared in two ways: firstly, the average differences were compared in 5 concentration ranges from 100 at% Ag to n*10 at% Ag, and secondly some concentration ranges between two neighbours 10% Ag (i.e from 40 to 20 at% Ag) which can be seen in Fig. 10 and 11. The slopes and the partition ratios were calculated only using the data of the liquidus and solidus calculated by the fourth method.
Based on these figures, it can be stated as follows:
- The absolute maximum and the average errors of the calculation of the liquidus and the solidus temperatures of the binary phase diagram are less than 2 K and 0.5 K, respectively (R2< 0.98). These are less than the error of the temperature measurement by the thermocouple in the temperature range of the investigated alloys. So, the calculation method is suitable for estimating the liquidus and solidus temperatures in the case of binary alloys. Using the derivative of the function, the liquidus slope can be calculated easily. As in this case the partition ratio can be determined from the phase diagram, the constants of the function are also calculatable.
- If the liquidus and the solidus isotherms of TEPD and the third BEPD (in this case the Au-Pd) are unknown but it is known or presumable that the TEPD is completely isomorphous, using only the functions of the Ag–Au and Ag–Pd BEPDS for the calculation (first estimation), the liquidus (liquidus isotherms) and solidus (solidus isotherms) temperatures can be estimated. In the 100 - 40 at% Ag range, the average error is less than 2 K for the liquidus (Fig. 10. a) and 10 K for the solidus (Fig. 11. a). Far from the Ag corner, the error increased, in the 20-0 at% Ag ranges, 10 K for the liquidus (Fig. 10. b), and 18,1 K for the solidus (Fig. 11. b). The whole range (100 – 0 at% Ag) it is 9.37 K and 17,85 K in the cases of liquidus and solidus, respectively. Consequently, the liquidus temperatures can be calculated with acceptable error near the Ag corner (100-40 at% Ag) because the error of the temperature measurement by the thermocouple is not better than 0.1 % (at 1500 K, it is 1.5 K), while in the case of solidus temperatures, the calculation can only give estimated data. With the first estimation, the liquidus and solidus temperatures of the Au-Pd phase diagram can be estimated with relatively high average error, 20.72 K and 37.7 K in the case of the liquidus and the solidus, respectively (Fig. 12.a, Table 11.). If the third BEPD is unknown, it would be a method to estimate this BEPD with ~ 2% relative error. But it can be better than nothing.
- If the third BEPD is known (in this case the Au-Pd) using functions of the Ag–Au and Ag–Pd BEPDS and the liquidus and solidus temperatures of the third BEPD the functions are calculatable. As a result of it, the error is similar to the error of the first estimation in the 100-80 at% Ag range in both cases. In the whole range (100-0 at% Ag), it decreased in both cases, because in the 20-0 at% range, the error decreased due to the effect of the data of the Au-Pd BEPD. The error of the liquidus and the solidus at Au-Pd BEPD drastically decreased (4.03 K and 4.56 K (Table 11). With this method, the estimation of the known third BEPD is significantly improved.
-
In the third method using the functions of the Ag–Au and Ag–Pd BEPDS and the temperature data given from the liquidus and solidus isotherms of Ag–Au–Pd TEPD (exept the data of the Au-Pd BEPD) to calculate the functions the average error of the liquidus temperature less than 2 K in whole Ag concentration range. The average error is 1.31 K in the whole range of the liquidus (100 – 0 at% Ag). The average error of the solidus temperatures is less than 3 K in the 100 - 40 at% Ag range (Fig. 10.a), which is less than 0.2 % of 1500 K. The average error of the solidus temperature in the whole range of the solidus (100 – 0 at% Ag, Fig.10. c) is 3.91 K, and only near the Au – Pd BEPD (in the 20 – 0 at%Ag range, Fig 10. d) increases to 4.82 K. Consequently, the error of the liquidus temperatures is better than the measurable one in the case of the liquidus in the whole concentration range, and than it is usable for the simulation, while at the error of the solidus temperatures are a little bit wronger, only in the 100 – 40 at% Ag range is suitable exactly.The error of the liquidus and solidus Au-Pd BEPD is greater than the error of the second estimations, because the data of this BEPD was not considered (Table 11).
- Using thefunctions and the temperature data given from the liquidus and solidus isotherms of Ag– Au– Pd TEPD and the data of the Au-Pd BEPD (fourth estimation) the error of the calculated liquidus and solidus temperatures is very similar to the error of the third estimation (Figs. 9. e, f, and Figs. 10. e, f) The aim of this version is to improove the calculation of the liquidus and solidus temperature of the Au – Pd BEP and so the error is acceptable calculating the liquidus and solidus by the fourh estimation (2.98 K and 5.64 K).
- Some authors [22,23,24] measured the liquidus and the solidus temperature at three sections of the Ag - Au - Pd TEPD: Ag – 50at%Au50at%Pd, Au – 50at%Ag50at%Pd, Pd – 50at%Ag50at%Au (Fig. 12). From these measured data liquidus and solidus curves were constructed by the authors for these sections. These curves were digitalized (dotted curves) and compared to the ESTPHAD calculations (fourth estimation, continuous curves). The difference between the digitalized and the calculated curves is negligible, and the estimation of the measured data by these curves is acceptable, considering that between 1300 and 1800 K is not too simple to measure the temperature.
- During the solidification simulations, the liquidus slopes are used many times. In Figs. 14,15, the liquidus and solidus slopes are shown, followed by the isotherms (Eq. 49, 51). These two figures demonstrate the capability of the ESTPHAD method.
- Since the temperature data are not derived from CALPHAD-type calculations, but from the digitalisation of the isotherms of the liquidus and solidus surfaces, there are no congruent liquidus and solidus concentrations, and tie lines are not known. Starting from the partition ratios from the BEPDs, we developed an estimation method in the TEPD to determine the partition ratios. In the first step, we used the BEPD partition ratios to calculate the concentrations of the solid phase (first estimation) in equilibrium with the concentrations of the liquid phase. In the range of 100-40 Ag at%, the error of the calculated temperature is less than 6 K, which, if there is nothing else, is acceptable as an estimate, but in the range of 40-0 Ag at% the error increases very significantly, and cannot be used as an estimate. With the method developed by us (second estimation), the error is around 2 K in the range of 100-60 Ag at%, which causes an error of 0.2 at% at a slope of 10 K/at%, and 0.4 at% at a slope of 5 K/at%, which is acceptable even in simulations. It should be noted, however, that since the procedure contains an approximation, namely that the slope of the tie lines in the TEPD is equal to the slope of the tie lines determined from the BEPD partition ratios. If this approximation is very different from reality (which is not very likely), then the error could have been much more significant.
9. Summary
On a thermodynamic basis, it has been proven that the method developed for the calculation of the liquidus and solidus lines of binary equilibrium phase diagrams can be extended to ternary systems. The functions have a hierarchical system; the functions developed for ternary systems contain the functions of the binary systems that make up the ternary system. The calculation of the liquidus and solidus surfaces of the isomorphic ternary phase diagram Ag-Au-Pd demonstrates the usability of the ESTPHAD. Since this ternary equilibrium phase diagram is only graphically known (CALPHAD-type calculation data are not available), the temperature-concentration data were determined by digitalization of liquidus and solidus isotherms. The liquidus surface's slopes were calculated with the derivatives of the liquidus functions. The functions of the partition ratios were determined using an approximate procedure.
The calculations could prove that:
(1) the liquidus and solidus surfaces of the ternary equilibrium phase diagram can be calculated even in a relatively significant alloying range using the liquidus and solidus functions of the two binary systems, which contain the base element, when the isotherms of the ternary equilibrium phase diagram are not known (first estimation),
(2) if the third binary equilibrium phase diagram is known, which does not contain the base element, it can be used to make the calculation more accurate, as in the first estimation, (second estimation,
(3) knowing the data of the liquid and solidus surfaces (isotherms) of the ternary equilibrium phase diagram, the functions can calculate the liquidus and solidus temperatures in the entire concentration range with the accuracy required for the simulations (third estimation),
(4) using the third binary equilibrium phase diagram, if it is known (similarly to the second estimation), the calculation can be further refined (fourth estimation),
(5) the slopes of the liquidus surface can be calculated by deriving the function of the liquid surface,
(6) in the case of graphically known ternary equilibrium phase diagrams, the partition ratios are not known, but by using the partition ratios of the binary equilibrium phase diagrams and an approximation method developed in this work, a good result can be obtained that can be used in a relatively large concentration range during the solidification simulation,
(7) The functions used for the calculation of liquidus, solidus temperature, liquidus slopes and partition ratios have a hierarchical structure, while in the case of TEPD, the functions used in the calculations contain the functions used in BEPD, completed by delta functions calculated from the TEPD data. As we will show later, this principle can be extended to the calculation of EPDs containing four, five, etc alloying elements.
10. Conclusion
In the case of graphically known ternary equilibrium phase diagrams with the ESTPHAD method, all the functions (liquidus, solidus, slope, partition ratios) that are necessary for the simulation of solidification can be determined. Functions are very easy to develop if the diagrams are known. The use of functions can significantly reduce the time required for simulations (by orders of magnitude).
Founding
This research was funded by the European Space Agency under the CETSOL/HUNGARY ESA PRODEX (No 4000131880/NL/SH) projects and the FWF-NKFIN(130946 ANN) joint project.
Author Contributions
For research articles with several authors, a short paragraph specifying their individual contributions must be provided. The following statements should be used “Conceptualization, R.A., software, calculation, discussion K.G.; data curation, M.T, R.A.; writing—original draft preparation, M.T, KG.; writing—review and editing RA. All authors have read and agreed to the published version of the manuscript.”.
Competing interests
Authors have declared that no competing interests exist.
Conflicts of Interest
Declare conflicts of interest or state “The authors declare no conflicts of interest.”.
Acronim
BEPD: binary equilibrium phase diagram
TEPD: ternary equilibrium phase diagram
Symbols
: free energy of alloy
chemical potential
: free energy of A, B, C element
: free energy of A, B, C elements in the liquid phase
: free energy of t A, B, C elements in the solid phase
: concentration of A, B, C element of the alloy
: concentration of A, B, C elements in the liquid phase
: concentrations of A, B, C elements in the solid phase
: partial molar free energy of A, B, C element in the liquid phase
: partial molar free energy of A, B, C element in solid phase
: free enthalpies change of A and B elements at solidification
T : absolute temperature
, : enthalpies change of A, B and C elements at solidification
: liquidus temperature of pure A ,B and C elements
: liquidus and solidus temperature of the A-B-C TEPD
: gas constant
: partition ratio of B and C elements in A-B and A-C alloy
, and : partition ratio of B and C elements in A-B-C alloy
: liquidus slope in A-B-C TEPD
: numerator in case of the slope calculation,
and : maps for the calculation of the), ) and ) , ) functions
, and :map for the calculation of the functions
and : constants of the ) and ) functions
and : constants of the ) and ) functions
(i) and constants of the functions
, and , : maps for the calculation of the , , functions
constants of the and functions
constants of the and functions
, and and : maps for the calculation of the , and and functions
(i) and: constants of the and functions
(i) and: constants of the and functions
Subscripts
m, i : number of constants
AB, AC and ABC : A-B, A-C and A-B-C alloys
Superscripts
l,s : liquid, solid
References
- L. Kaufman, H. Bernstein, Computer Calculation of Phase Diagrams, Academic Press, New York, 1970.
- X. Yan, S. Chen, F. Xie, Y.A. Chang, Computational and experimental investigation of microsegregation in an Al-rich Al–Cu–Mg–Si quaternary alloy, Acta. Mater. 50 2002, 2199-2207.
- I.L. Ferreira, A. Garcia, B. Nestler, On macrosegregation in ternary Al-Cu-Si alloys: numerical and experimental analysis, Scr. Mater. 50, 2004, p. 407-411. [CrossRef]
- Q. Du, D.G. Eskin, L. Katgerman, Modeling Macrosegregation during Direct-Chill Casting of Multicomponent Aluminium Alloys, Metal. Mater. Trans. A38 (2007) 180-189. [CrossRef]
- U. Kattner, The Thermodynamic Modelling of Multicomponent Phase Equilibria, JOM, 49 1997, p. 14-19. [CrossRef]
- K. Greven, A. Ludwig, T. Hofmeister, R.R. Sahm, in: A. Ludwig (Ed), Solidification of Metallic Melts in Research and Technology, Wiley VCH, Weinheim, 199, p.119.
- U. Grafe, B. Böttger, J. Tiaden, S.G Fries, Coupling of Multicomponent Thermodynamic Databases to a Phase Field Model: Application to Solidification and Solid State Transformations of Superalloys” Scr. Mater. 42, 2000, 1179-1186. [CrossRef]
- W.J. Boettinger, S.R. Coriell, A.L. Greer, A. Karma, W. Kurz, M. Rappaz, R. Trivedi, Solidification microstructures: recent developments, future directions. Acta Mater. 48, 2000, p. 43-70. [CrossRef]
- C. Zhang, J. Miap, S. Chen, F. Zhang, A. l. Luo, CALPHAD-Based Modelling and Experimental Validation of Microstructural Evaluation and Microsegregation in Magnesium Alloys During Solidification, J. Phase Equilib. Diffus. Online 16 May 2019. [CrossRef]
- P. Mikolajczak, A. Geanau, L. Ratke, Mushy Zone Calculation with Application of CALPHAD Technique, Metals, 2017, 7, p. 363. [CrossRef]
- X. Dore, H. Combeau, M. Rappaz, Modelling of microsegregation in ternary alloys: application to the solidification of Al–Mg–Si, Acta. Mater. 48, 2000, p. 3951-3962.
- Q. Du, D.G. Eskin, L. Katgerman, An efficient technique for describing a multi-component open system solidification path, Computer Coupling of Phase Diagram and Thermochemistry, 32, 2008, p. 478-484. [CrossRef]
- G. Zhao, D. Xu, H. Fu, Int. Mat. Res. 99, 2008, p. 680-688.
- G. Zhao, X. Z. Li, D. Xu, J. Guo, H. Fu, Y. Du, Y. He, Numerical Computations for Temperature, fraction of Solid Phase and Composition coupling in Ternary Alloy Solidification with Three Different Thermodynamic Data-acquisition Method, CALPHAD, 36, 2012, p. 155-162.
- K. Qiu, R. Wang, Ch. Peng, Mathematical model of Liquidus Temperature in Quaternary Aluminium Phase Diagram, Advanced Materials Research 1095, 2015, p. 545-548. [CrossRef]
- K. Qiu, R. Wang, Ch. Peng, X. lu, N. Wang, Polynomial regression and interpolation of thermodynamic data in Al-Si-Mg-Fe system, Computer Coupling of Phase Diagrams and Thermochemistry, 48, 2015, p. 175-183.
- M.B. Djurdjevic, A. Manasijevic, Z. Odonovic, N. Dolic, Calculation of Liquidus Temperature for Aluminium and Magnesium alloys Applying Method of Equivalency, Advances in Materials Science and Engineering, 2013, ID 170527, p. 8.
- G. Kőrösy, A. Roósz, T. Mende, The ESTPHAD Concept: An Optimised Set of Simplified equations to Estimate the Equilibrium Liquidus and Solidus Temperatures, Partition Ratio and Liquidus Slope for Quick Access to Equilibrium Data in Solidification Software], Part I: Binary equilibrium phase diagram, Metals, 2024.
- Drost E, Hausselt J (1992) Uses of gold in jewellery. Interdiscip Sci Rev 17:271–280.
- Kempf B, Hausselt J (1992) Gold, its alloys and their uses in dentistry. Interdiscip Sci Rev 17:251–260.
- Kempf B, Schmauder S (1998) Thermodynamic modelling of precious metals alloys. Gold Bull 31:51–57.
- https://www.crct.polymtl.ca/fact/phase_diagram.php?file=Ag-Au.jpg&dir=SGTE2017.
- https://www.crct.polymtl.ca/fact/phase_diagram.php?file=Ag-Pd.jpg&dir=SGsold.
- https://www.crct.polymtl.ca/fact/phase_diagram.php?file=Au-Pd.jpg&dir=SGsold.
- Alan Prince†, updated by Joachim Gröbner, Manga V. Rao, Viktor Kuznetsov, Landolt-Börnstein, New Series IV/11B, Ternary Alloy Systems -Silver – Gold – Palladium Phase Diagrams, Crystallographic and Thermodynamic Data, Vol. IV/11B: Noble Metal Systems, p.50-54, Silver – Gold – Palladium.
- Venudhar, Y.C., Iyengar, L., Leela, R., Krishna, K.V., “Isoparametric Curves and Vegard’s Law Plots for the Ternary System Palladium-Silver-Gold”, Current Sci., 47(19), 717-719 (1978) (Crys. Structure, Experimental, 9).
- Nemilov, V.A., Rudnitsky, A.A., Vidusova, T.A., “Investigation of the Au-Pd-Ag System”, Izvest. Sekt. Platiny, 20, 225-239 (1946) (Phase Relations, Experimental, 26).
- Pauley, C.L., “X-ray Study of the Stacking Fault Density near the Hardness Maximum of the Au-Ag-Pd System”, Masters thesis, Virginia Polytechnic Institute, USA (1967) (Crys. Structure, Experimental, 35).
- Miane, J.M., Gaune-Escard M., Bros, J.P., “Liquidus and Solidus Surface of the Ag-Au-Pd Equilibrium Phase Diagram”, High Temp. High Press., 9, 465-469 (1977) (Phase Diagram, Phase Relations, Experiment.
Figure 7.
The second estimation of the liquidus and solidus isotherms calculated from Ag-Au, Ag-Pd and Au-Pd BEPDs. a: liquidus isotherms, b: solidus isotherms.
Figure 7.
The second estimation of the liquidus and solidus isotherms calculated from Ag-Au, Ag-Pd and Au-Pd BEPDs. a: liquidus isotherms, b: solidus isotherms.
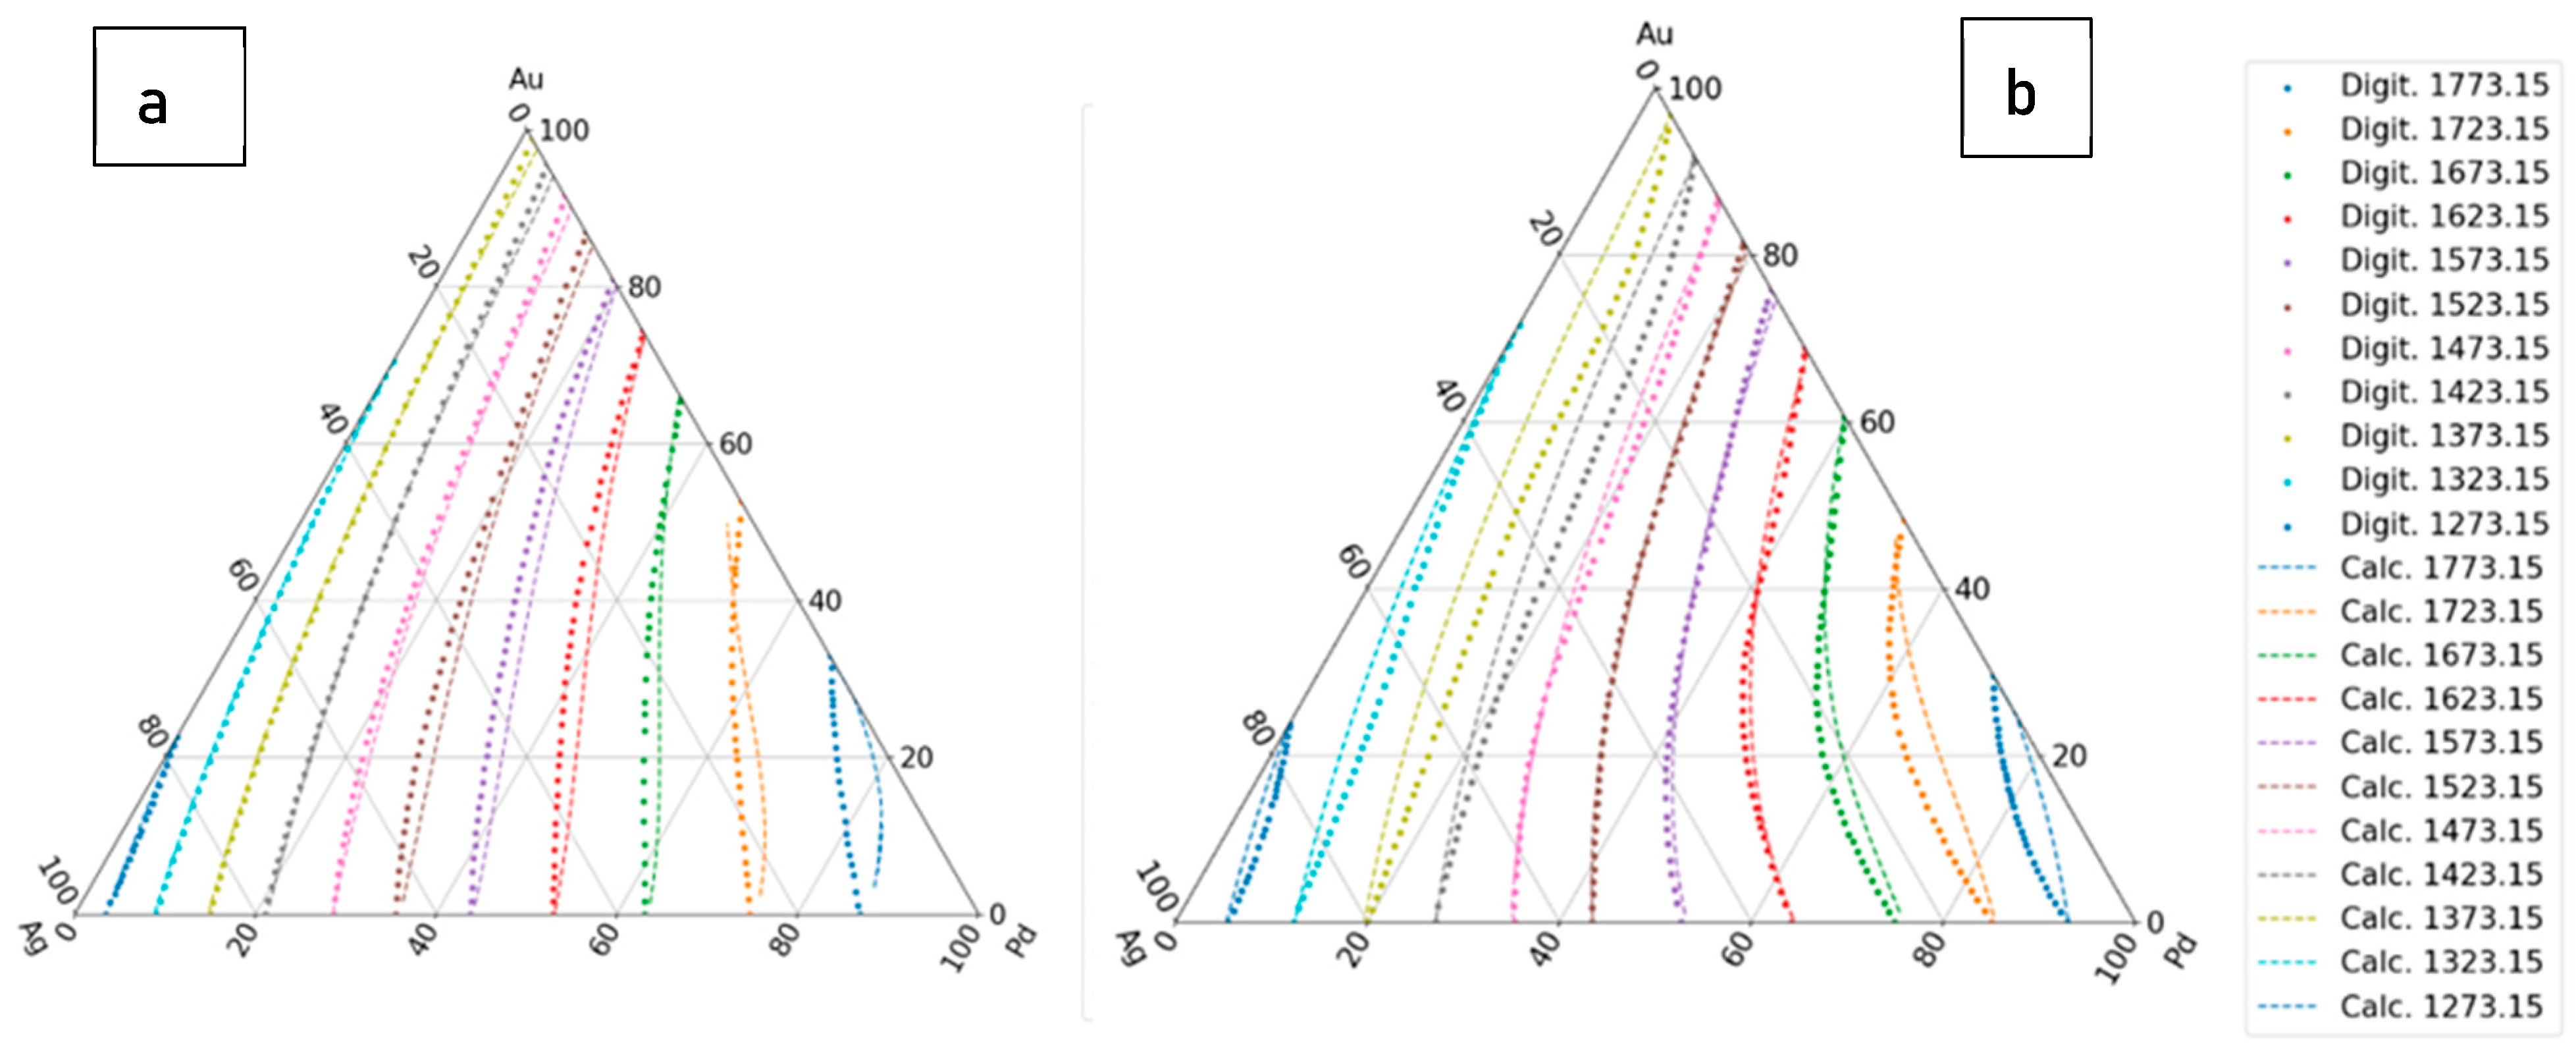
Figure 8.
The third estimation of the liquidus and solidus isotherms calculated from Ag-Au, Ag - Pd BEPDs and the data of isotherms of the TEPD. a: liquidus isotherms, b: solidus isotherms.
Figure 8.
The third estimation of the liquidus and solidus isotherms calculated from Ag-Au, Ag - Pd BEPDs and the data of isotherms of the TEPD. a: liquidus isotherms, b: solidus isotherms.
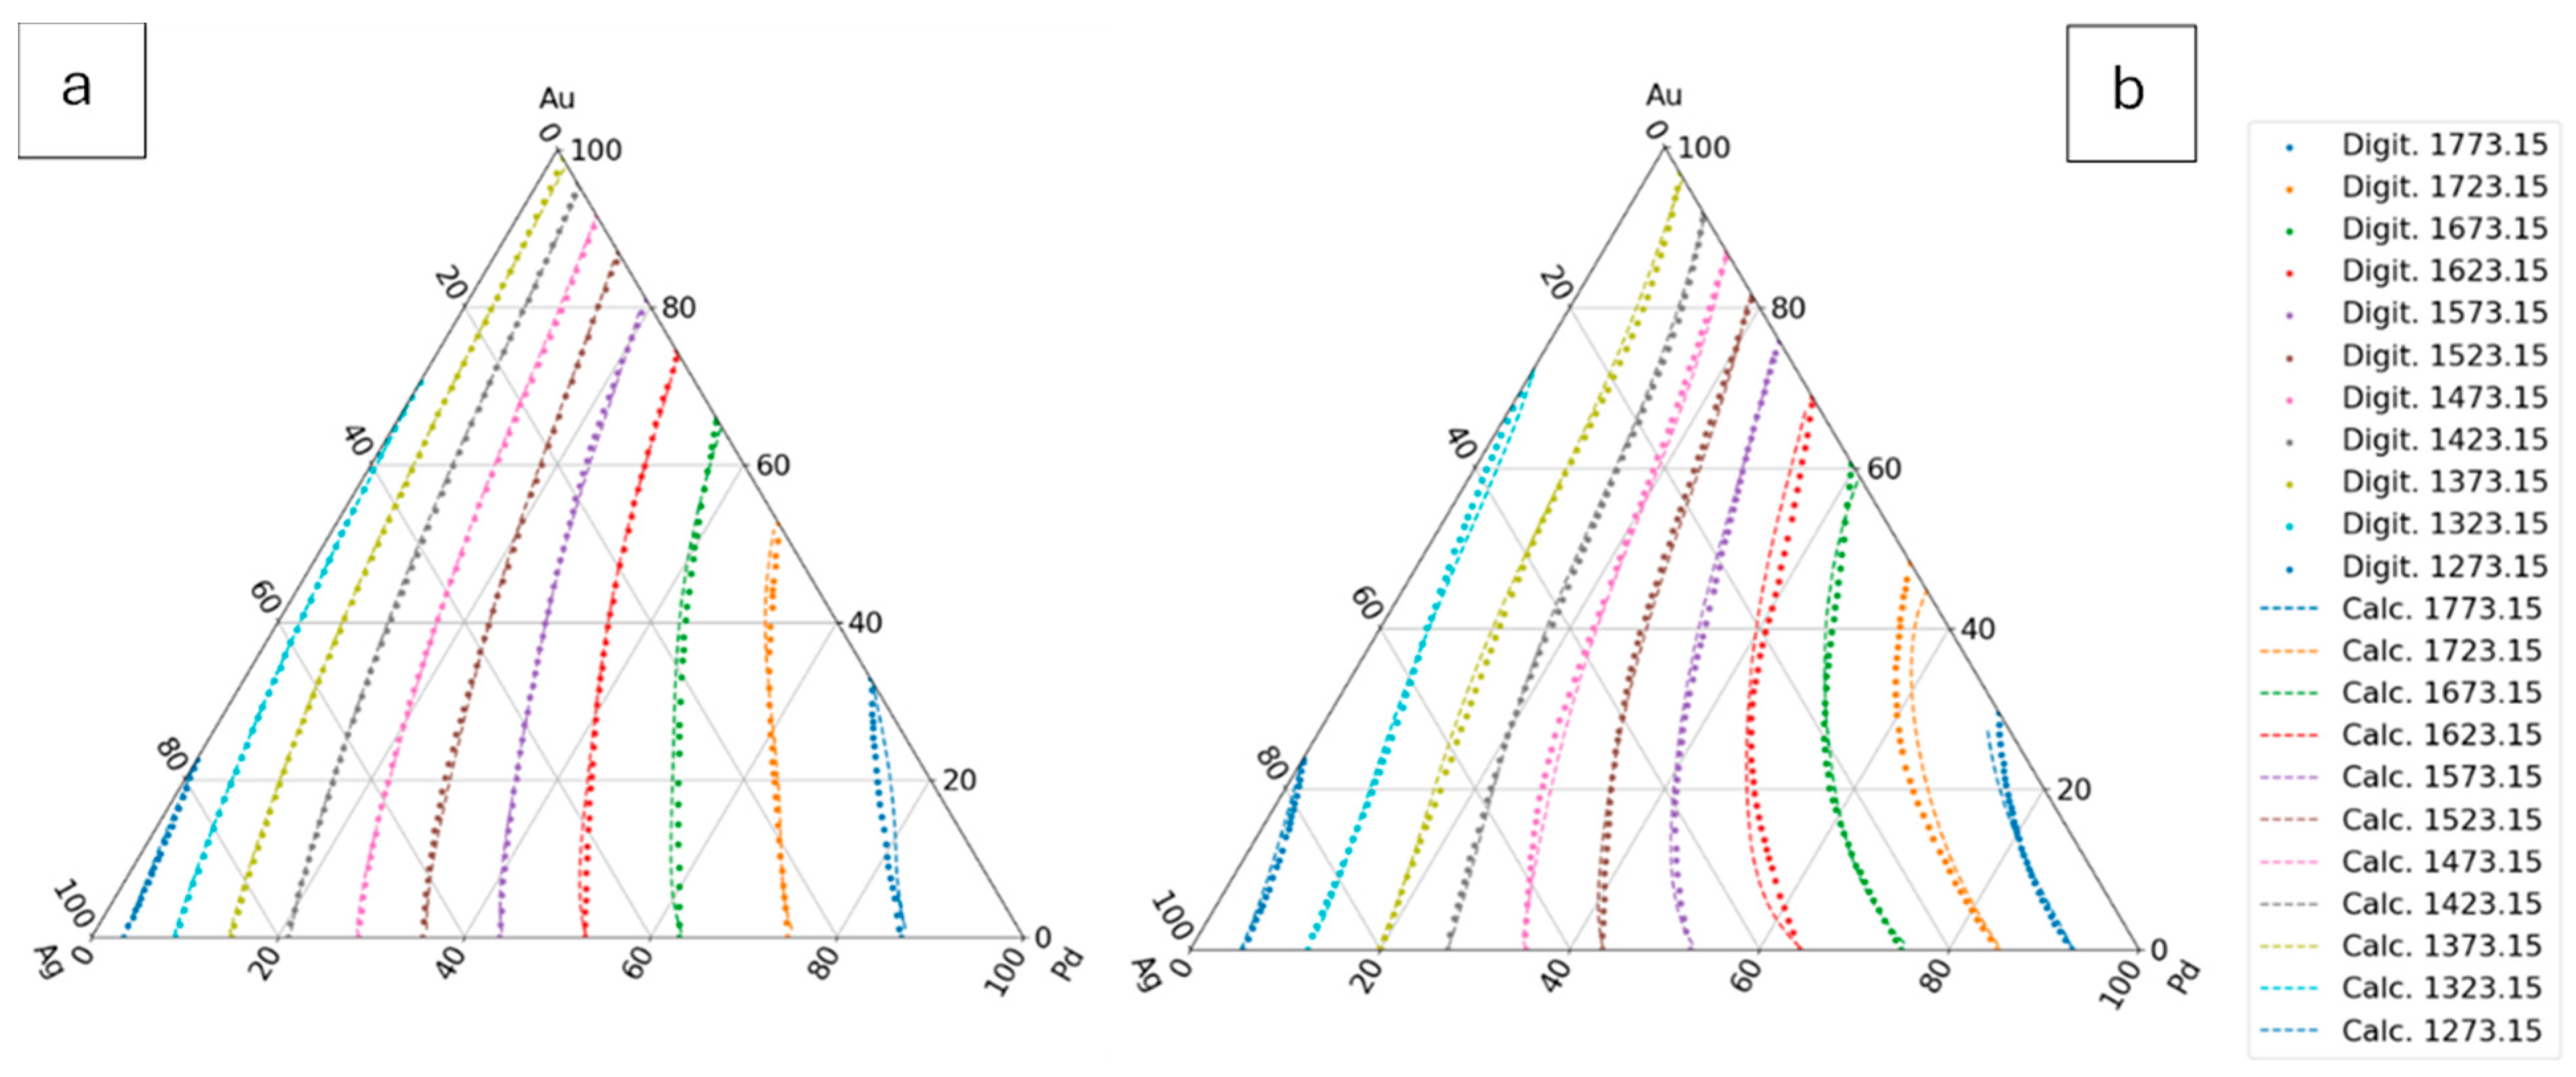
Figure 13.
Comparison of the measured, digitalized and calculated (third estimation) liquidus and solidus temperatures at three sections. a section: Ag – 50%Au50%Pd, b section: Au – 50%Ag50%Pd, c section: Pd – 50%Ag50%Au. In the figures: Nem [27], Pau [28] Pau amm [25,28] Mia [29].
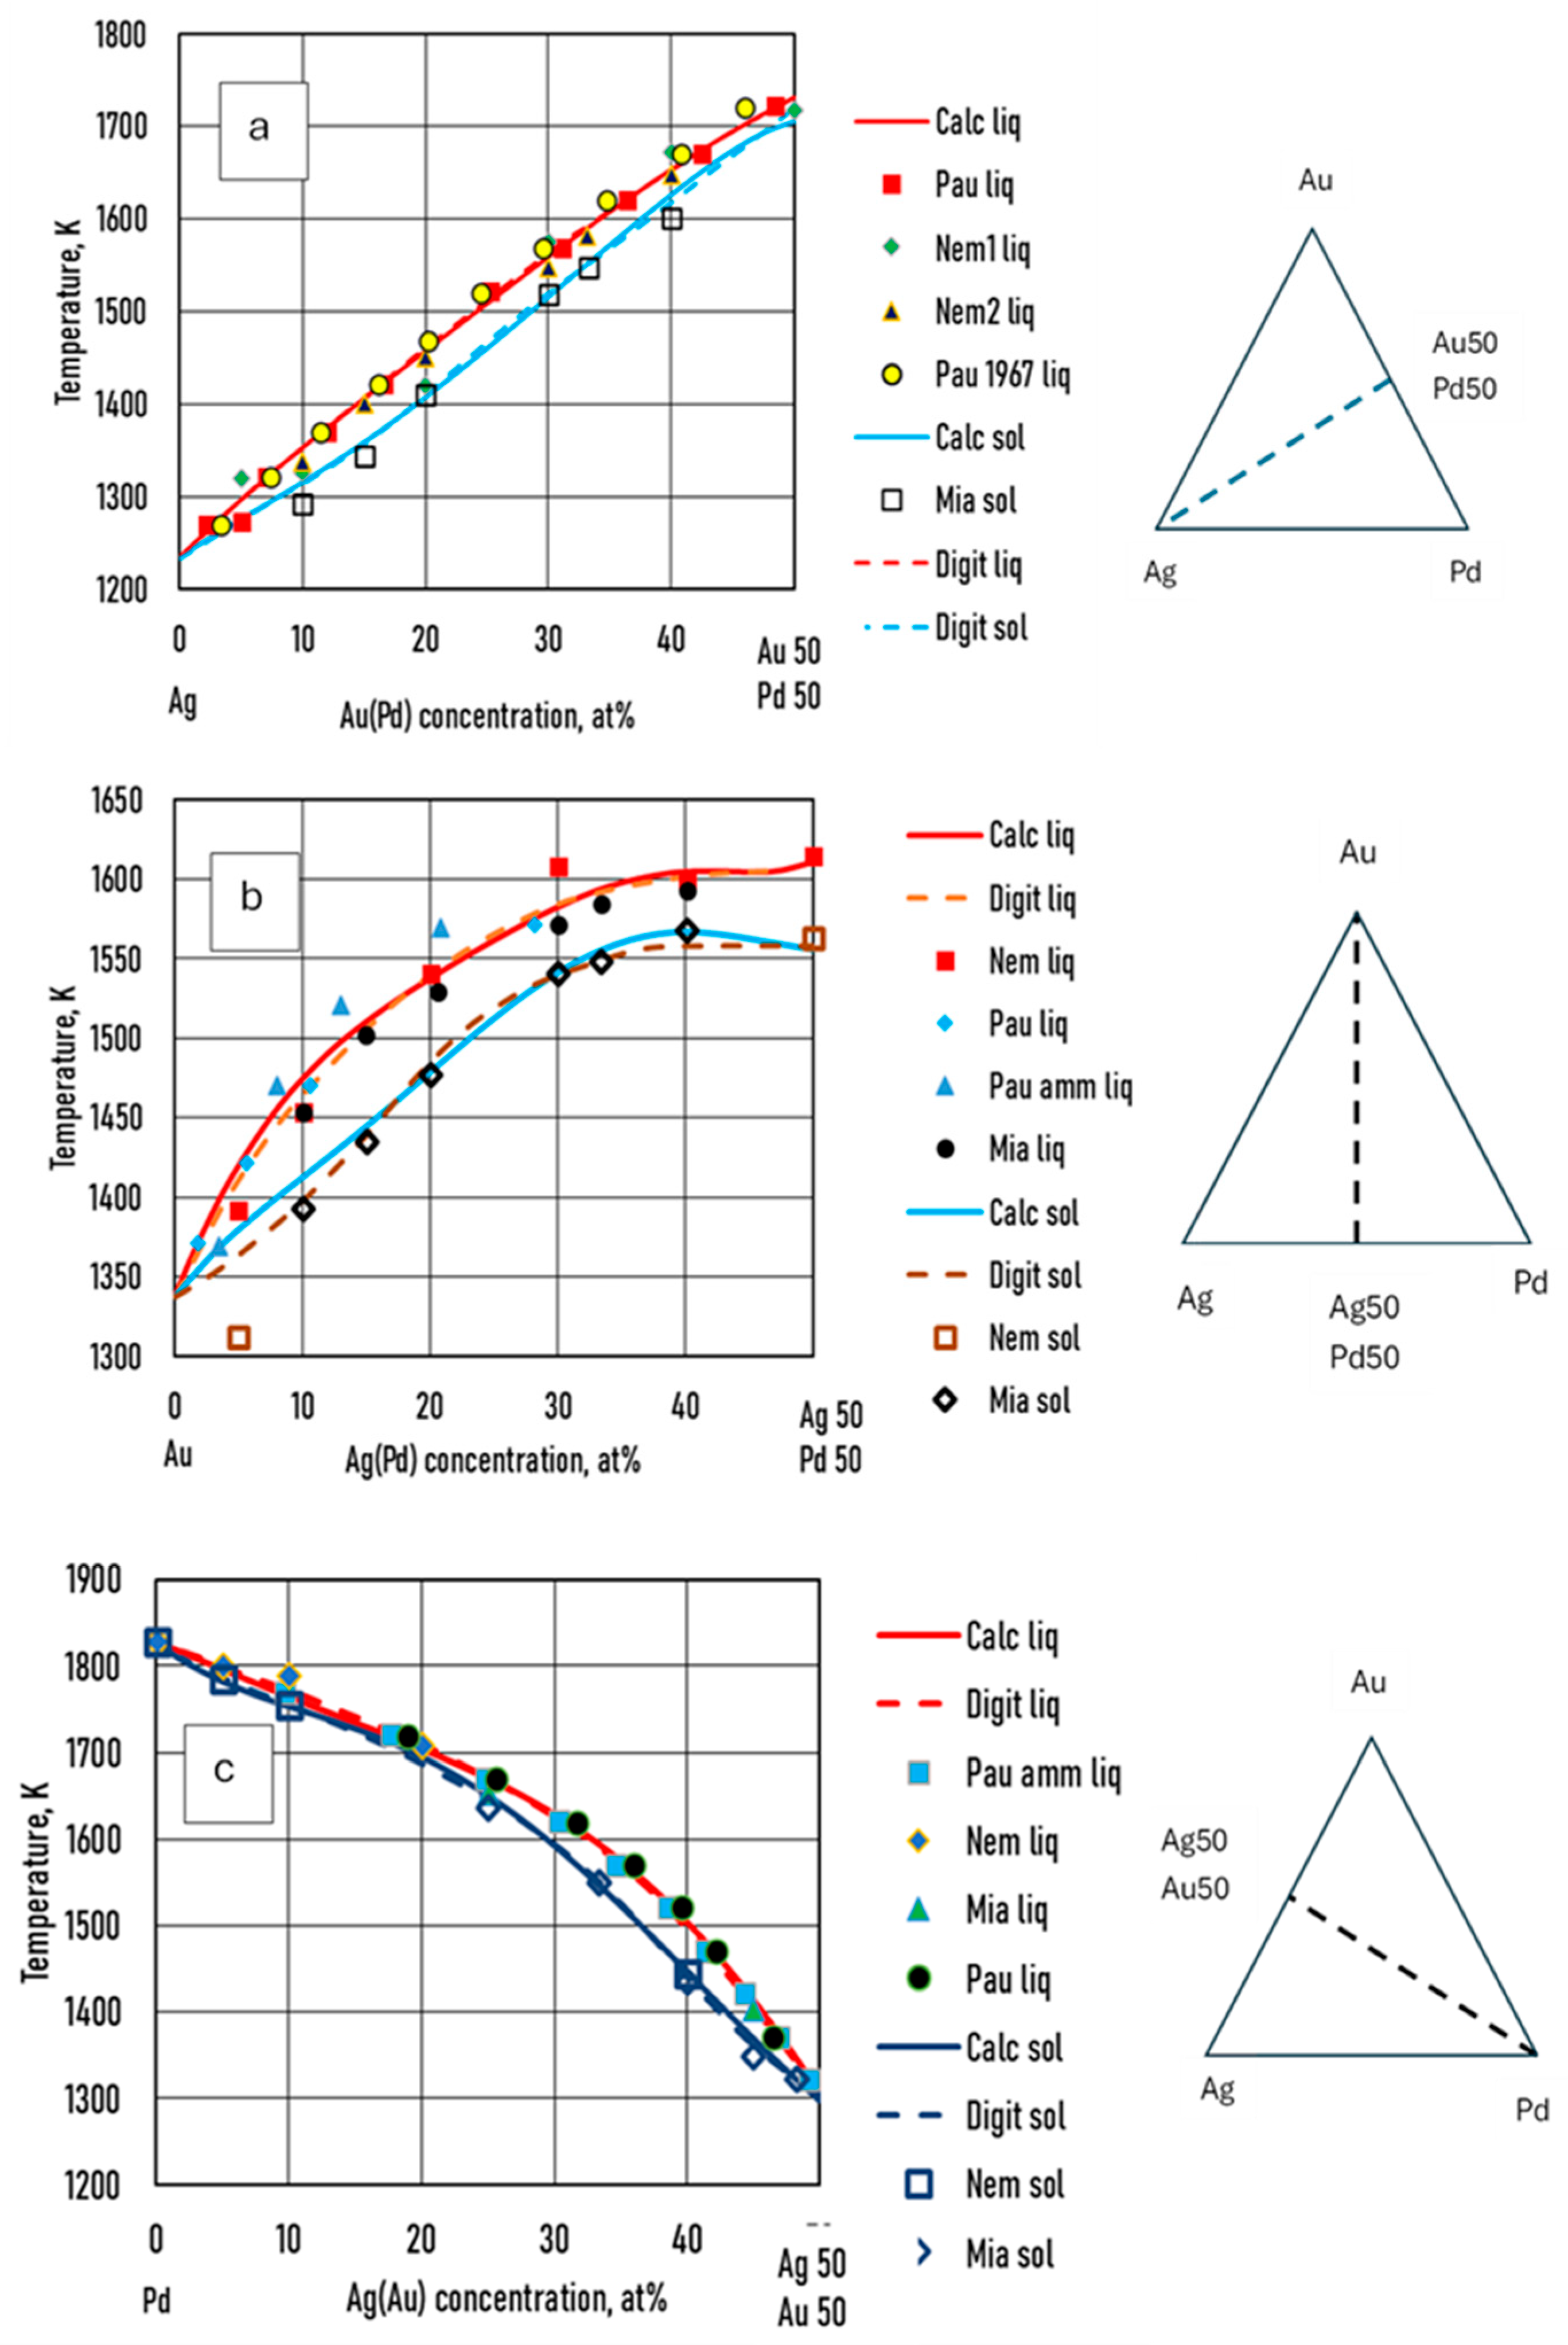
Figure 14.
liquidus slopes versus a: Pd and b: Au concentration along the isotherms.
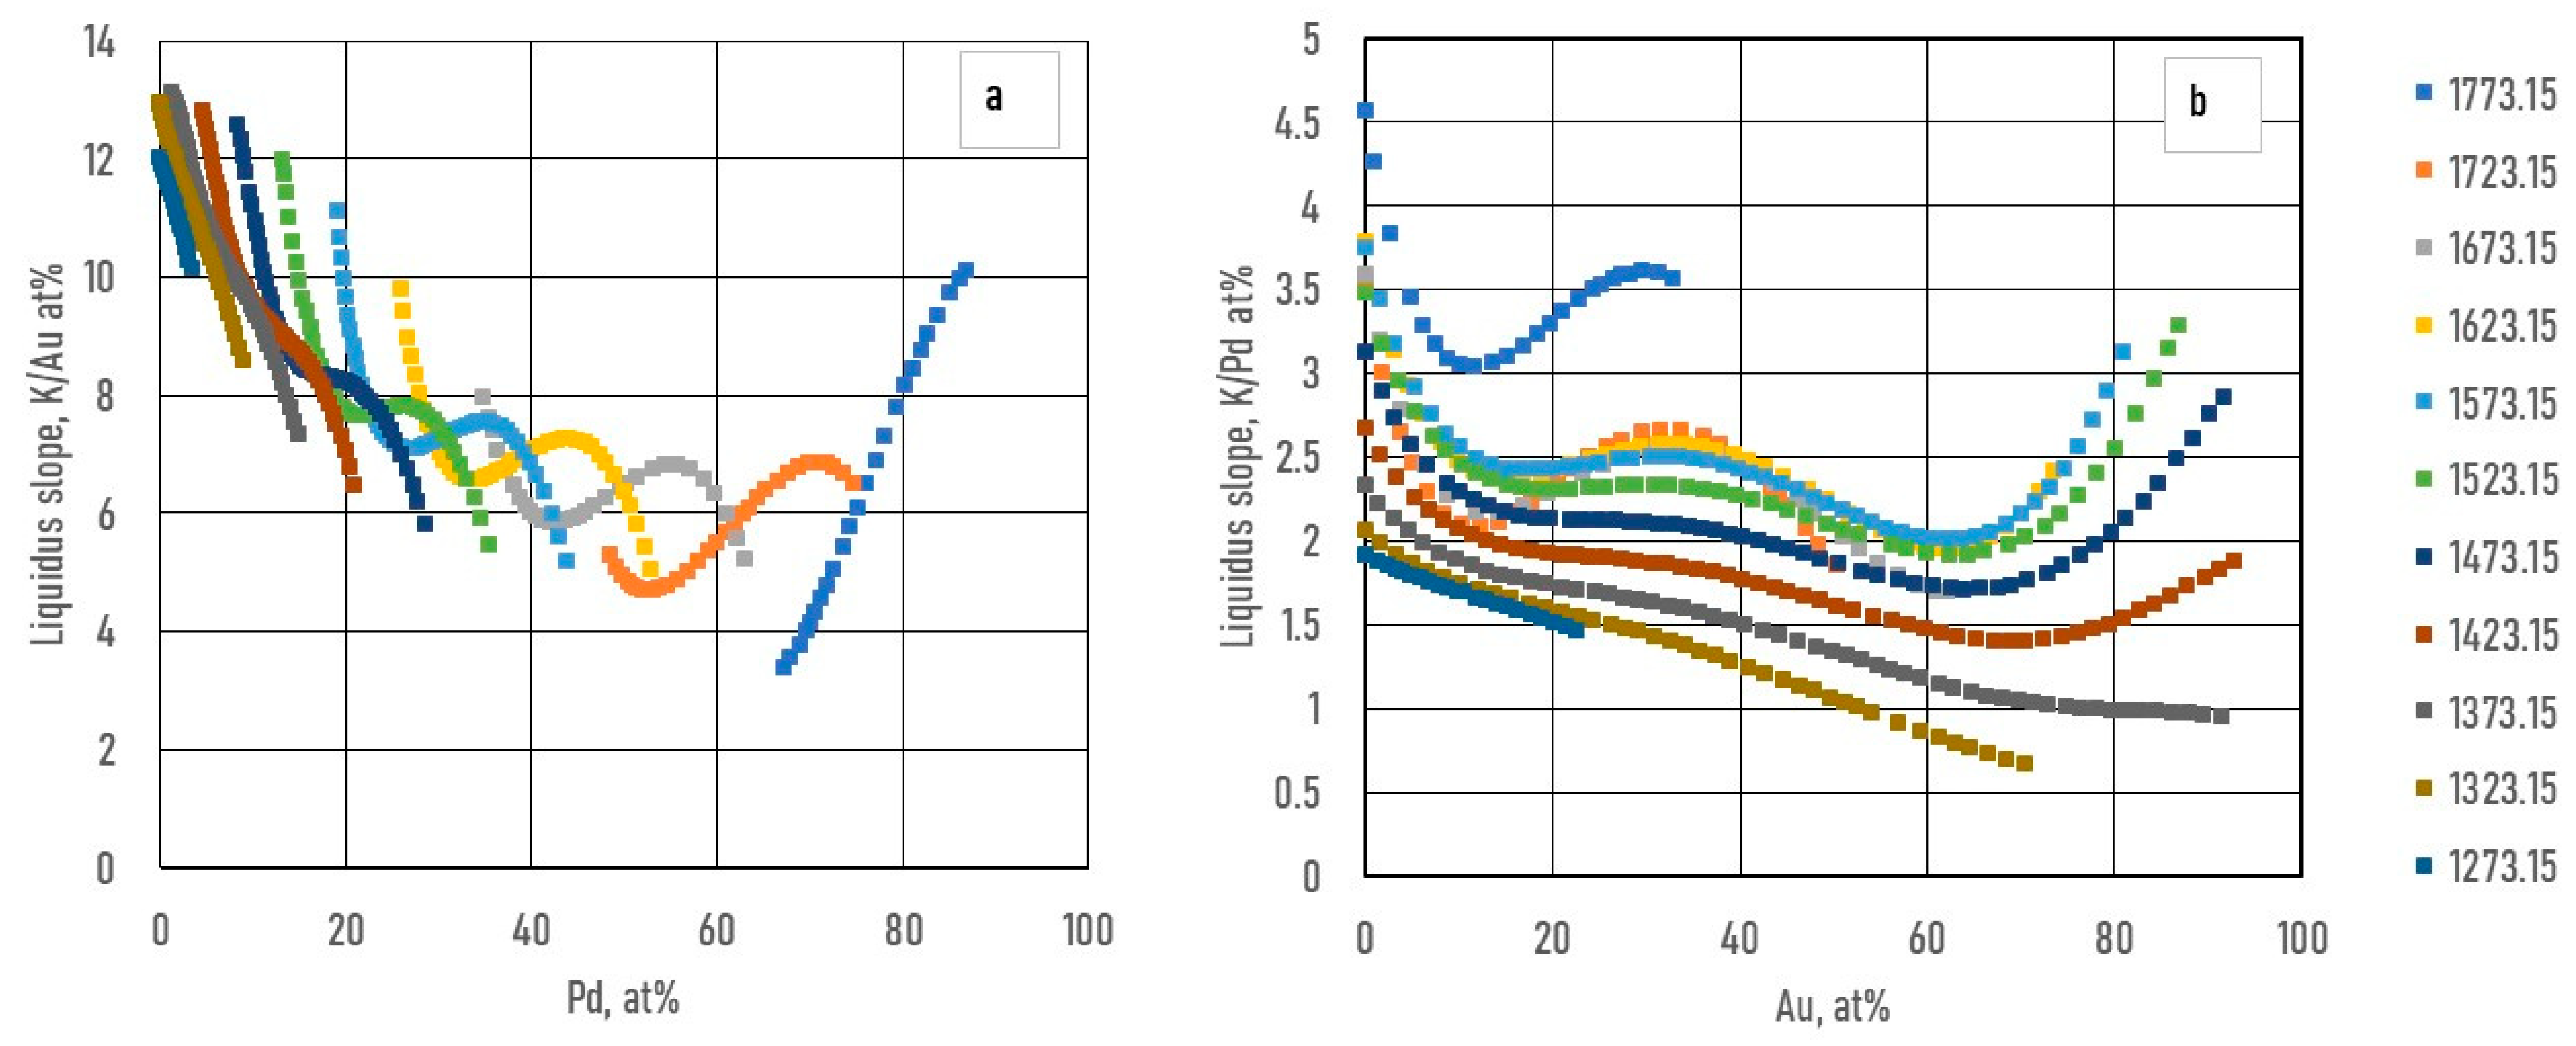
Figure 15.
solidus slopes versus a: Au and b: Pd concentration along the isotherms.
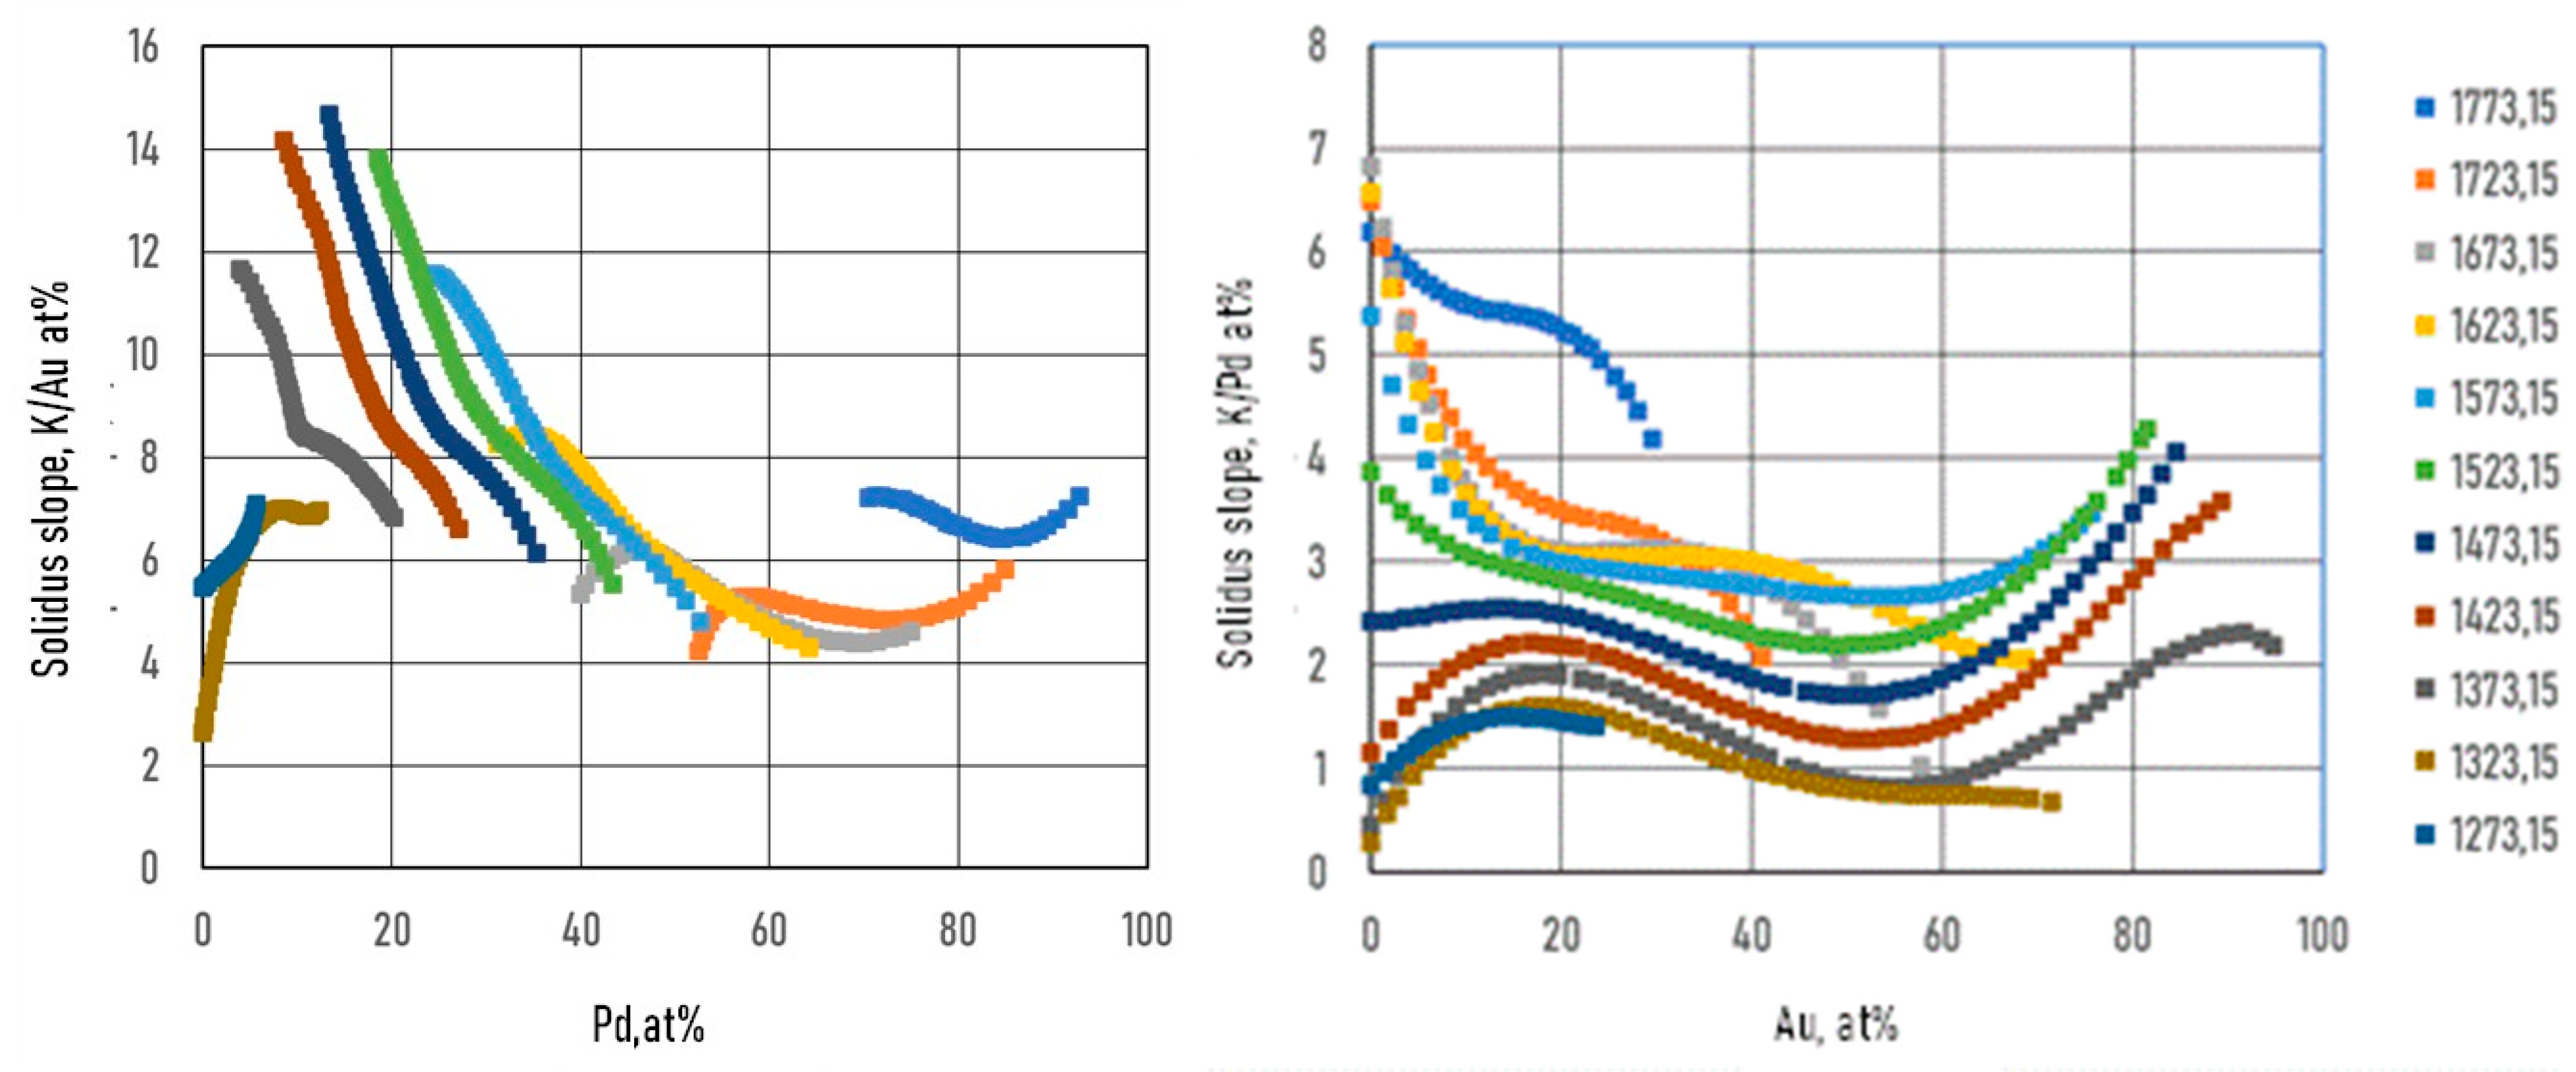
Table 4.
The constants of the slopes.
| Binary alloys | ||||||
| -0.001525122 | 2*9.83954E-06 | 3*-2.21084E-08 | ||||
| 0.000275973 | 2*2.66952E-06 | 3*2.89592E-08 | ||||
| -0.009145785 | 2*0.000216506 | 3*-5.02079E-06 | 4*7.36011E-08 | 5*-5.53729E-10 | 6*1.62381E-12 | |
| 0.002466234 | 2*1.93529E-05 | 3*-1.71905E-06 | 4*5.15282E-08 | 5*-5.63012E-10 | 6*2.23671E-12 | |
| -0.015142951 | 2*0.0006576 | 3*-2.04085E-05 | 4*3.81869E-07 | 5*-4.01939E-09 | 6*2.1859E-11 | |
| 0.000887203 | 2*3.54004E-05 | 3*-1.3818E-06 | 4*-6.83248E-09 | 5*9.61336E-10 | 6*-1.34325E-11 |
Table 5.
The constants of the functions.
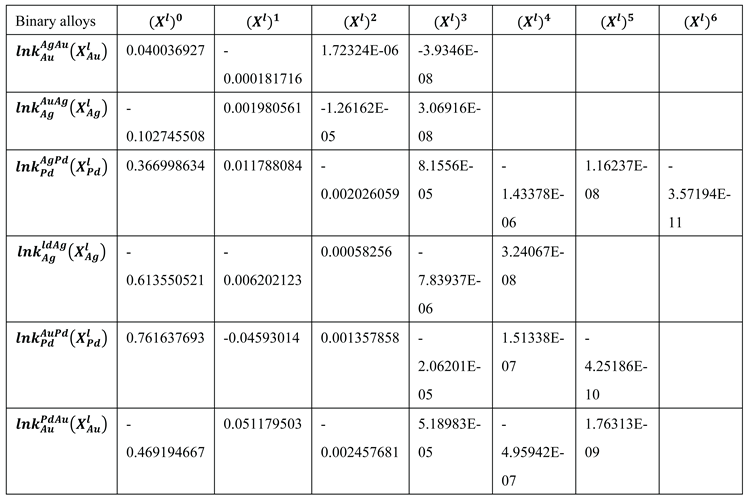
Table 6.
The absolute maximum and average concentration differences between the recalculated and the digitalized solidus concentration.
Table 6.
The absolute maximum and average concentration differences between the recalculated and the digitalized solidus concentration.
| Pd-Ag | Pd-Au | Ag-Au | Au-Ag | Ag-Pd | Au-Pd | |
| Abs. max ∆c, liq., at% | 0.98 | 1.914 | 0.012 | 0.004 | 1.173 | 1.148 |
| Abs. aver. ∆c, liq., at% | 0.175 | 0.543 | 0.002 | 0.002 | 0.22 | 0.241 |
| Abs. max ∆c, sol., at% | 0.7873 | 0.9 | 0.012 | 0.013 | 1.029 | 0.762 |
| Abs. aver. ∆c, sol., at% | 0.286 | 0.28 | 0.002 | 0.005 | 0.213 | 0.221 |
Disclaimer/Publisher’s Note: The statements, opinions and data contained in all publications are solely those of the individual author(s) and contributor(s) and not of MDPI and/or the editor(s). MDPI and/or the editor(s) disclaim responsibility for any injury to people or property resulting from any ideas, methods, instructions or products referred to in the content. |
© 2025 by the authors. Licensee MDPI, Basel, Switzerland. This article is an open access article distributed under the terms and conditions of the Creative Commons Attribution (CC BY) license (http://creativecommons.org/licenses/by/4.0/).
Copyright: This open access article is published under a Creative Commons CC BY 4.0 license, which permit the free download, distribution, and reuse, provided that the author and preprint are cited in any reuse.


