
Submitted:
21 May 2025
Posted:
22 May 2025
You are already at the latest version
Abstract
Ferruginol, tanshinones and carnosol are considered privileged natural products due to their demonstrated diverse biological activities with relevance to cancer research. Globally, cancer continues to be a major contributor to mortality rates, making these compounds potentially valuable molecular scaffolds for further development as potential anticancer agents. In this work, a focused library of ferruginol, tanshinone IIA, and carnosol analogues was studied to examine their effectiveness against various solid tumor models. The compounds were efficiently synthesized from either methyl 12-hydroxy-dehydroabietate or 12-hydroxydehydroabietylamine in 1-3 step processes with good chemical yields. The compounds that were synthesized underwent a methodical evaluation using multiple biological tests (including viability assays, clonogenic assays, and mitochondrial membrane polarization measurements) to determine their ability to inhibit growth in cancer cell models. It was determined that while most compounds exhibited biological activity, compounds 10 and 11 demonstrated significant efficacy against triple negative breast cancer models. These compounds continue to show promising biological activity, suggesting that additional studies to understand their mechanisms of action would be valuable.
Keywords:
abietane
; cytotoxicity
; breast cancer
; tanshinone
; carnosol
; ferruginol
1. Introduction
Cancer is one of the main public health problems around the world, responsible for almost one in sixth deaths worldwide [1]. This disease is the cause of around 30% of premature deaths in population aged 30-69 years which is specifically disproportional in women because of mainly female breast and cervical cancer [2]. According to the latest global cancer statistics, by world region for the year 2022, from the International Agency for Research on Cancer (IARC). There were nearly 20 million new cases alongside 9.7 million deaths from cancer in the year 2022, being breast cancer and lung cancer being the most frequent cancers in women and men, respectively [1]. Based on demographics predictions the number of new cases will rise to 35 million by 2050 [1].
Triple-negative breast cancer (TNBC) is a specific type of breast cancer that’s characterized by the lack of three key receptors: estrogen receptors (ER), progesterone receptors (PR), and excess HER2 protein. TNBC represents about 15-20% of the 2.3 million annual breast cancer diagnoses globally [1,3]. It tends to be more aggressive than other breast cancer types and it is more commonly diagnosed in women under 40 yrs of age, and at a more advanced stage. TNBC has a less favorable prognosis than other breast cancer types and higher risk of recurrence within the first 3-5 years after treatment [3]. It is, therefore, of great importance to invest in prevention and cancer treatments to save many lives worldwide. Chemotherapy is one the conventional clinical therapies which many times shows limited success due to resistance and toxicity leading to a continuous search for novel anticancer drugs. Plant-derived natural products have long been used as anticancer drugs representing almost 60% of FDA approved antitumor drugs [4].
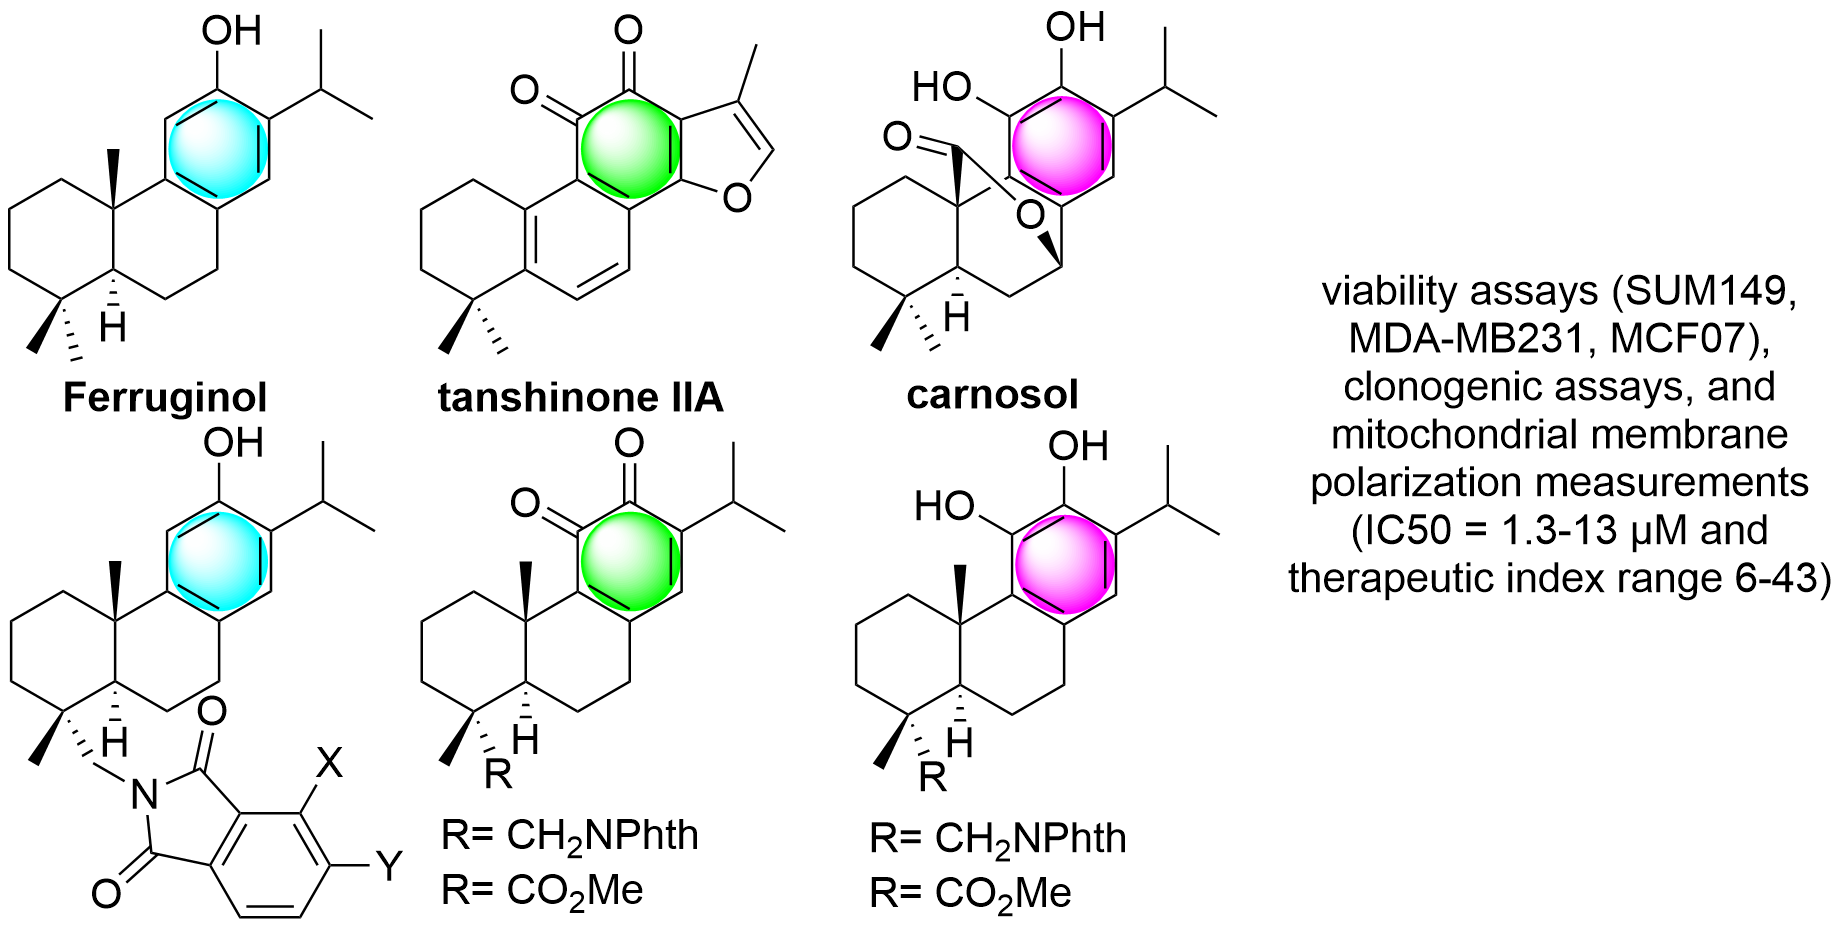
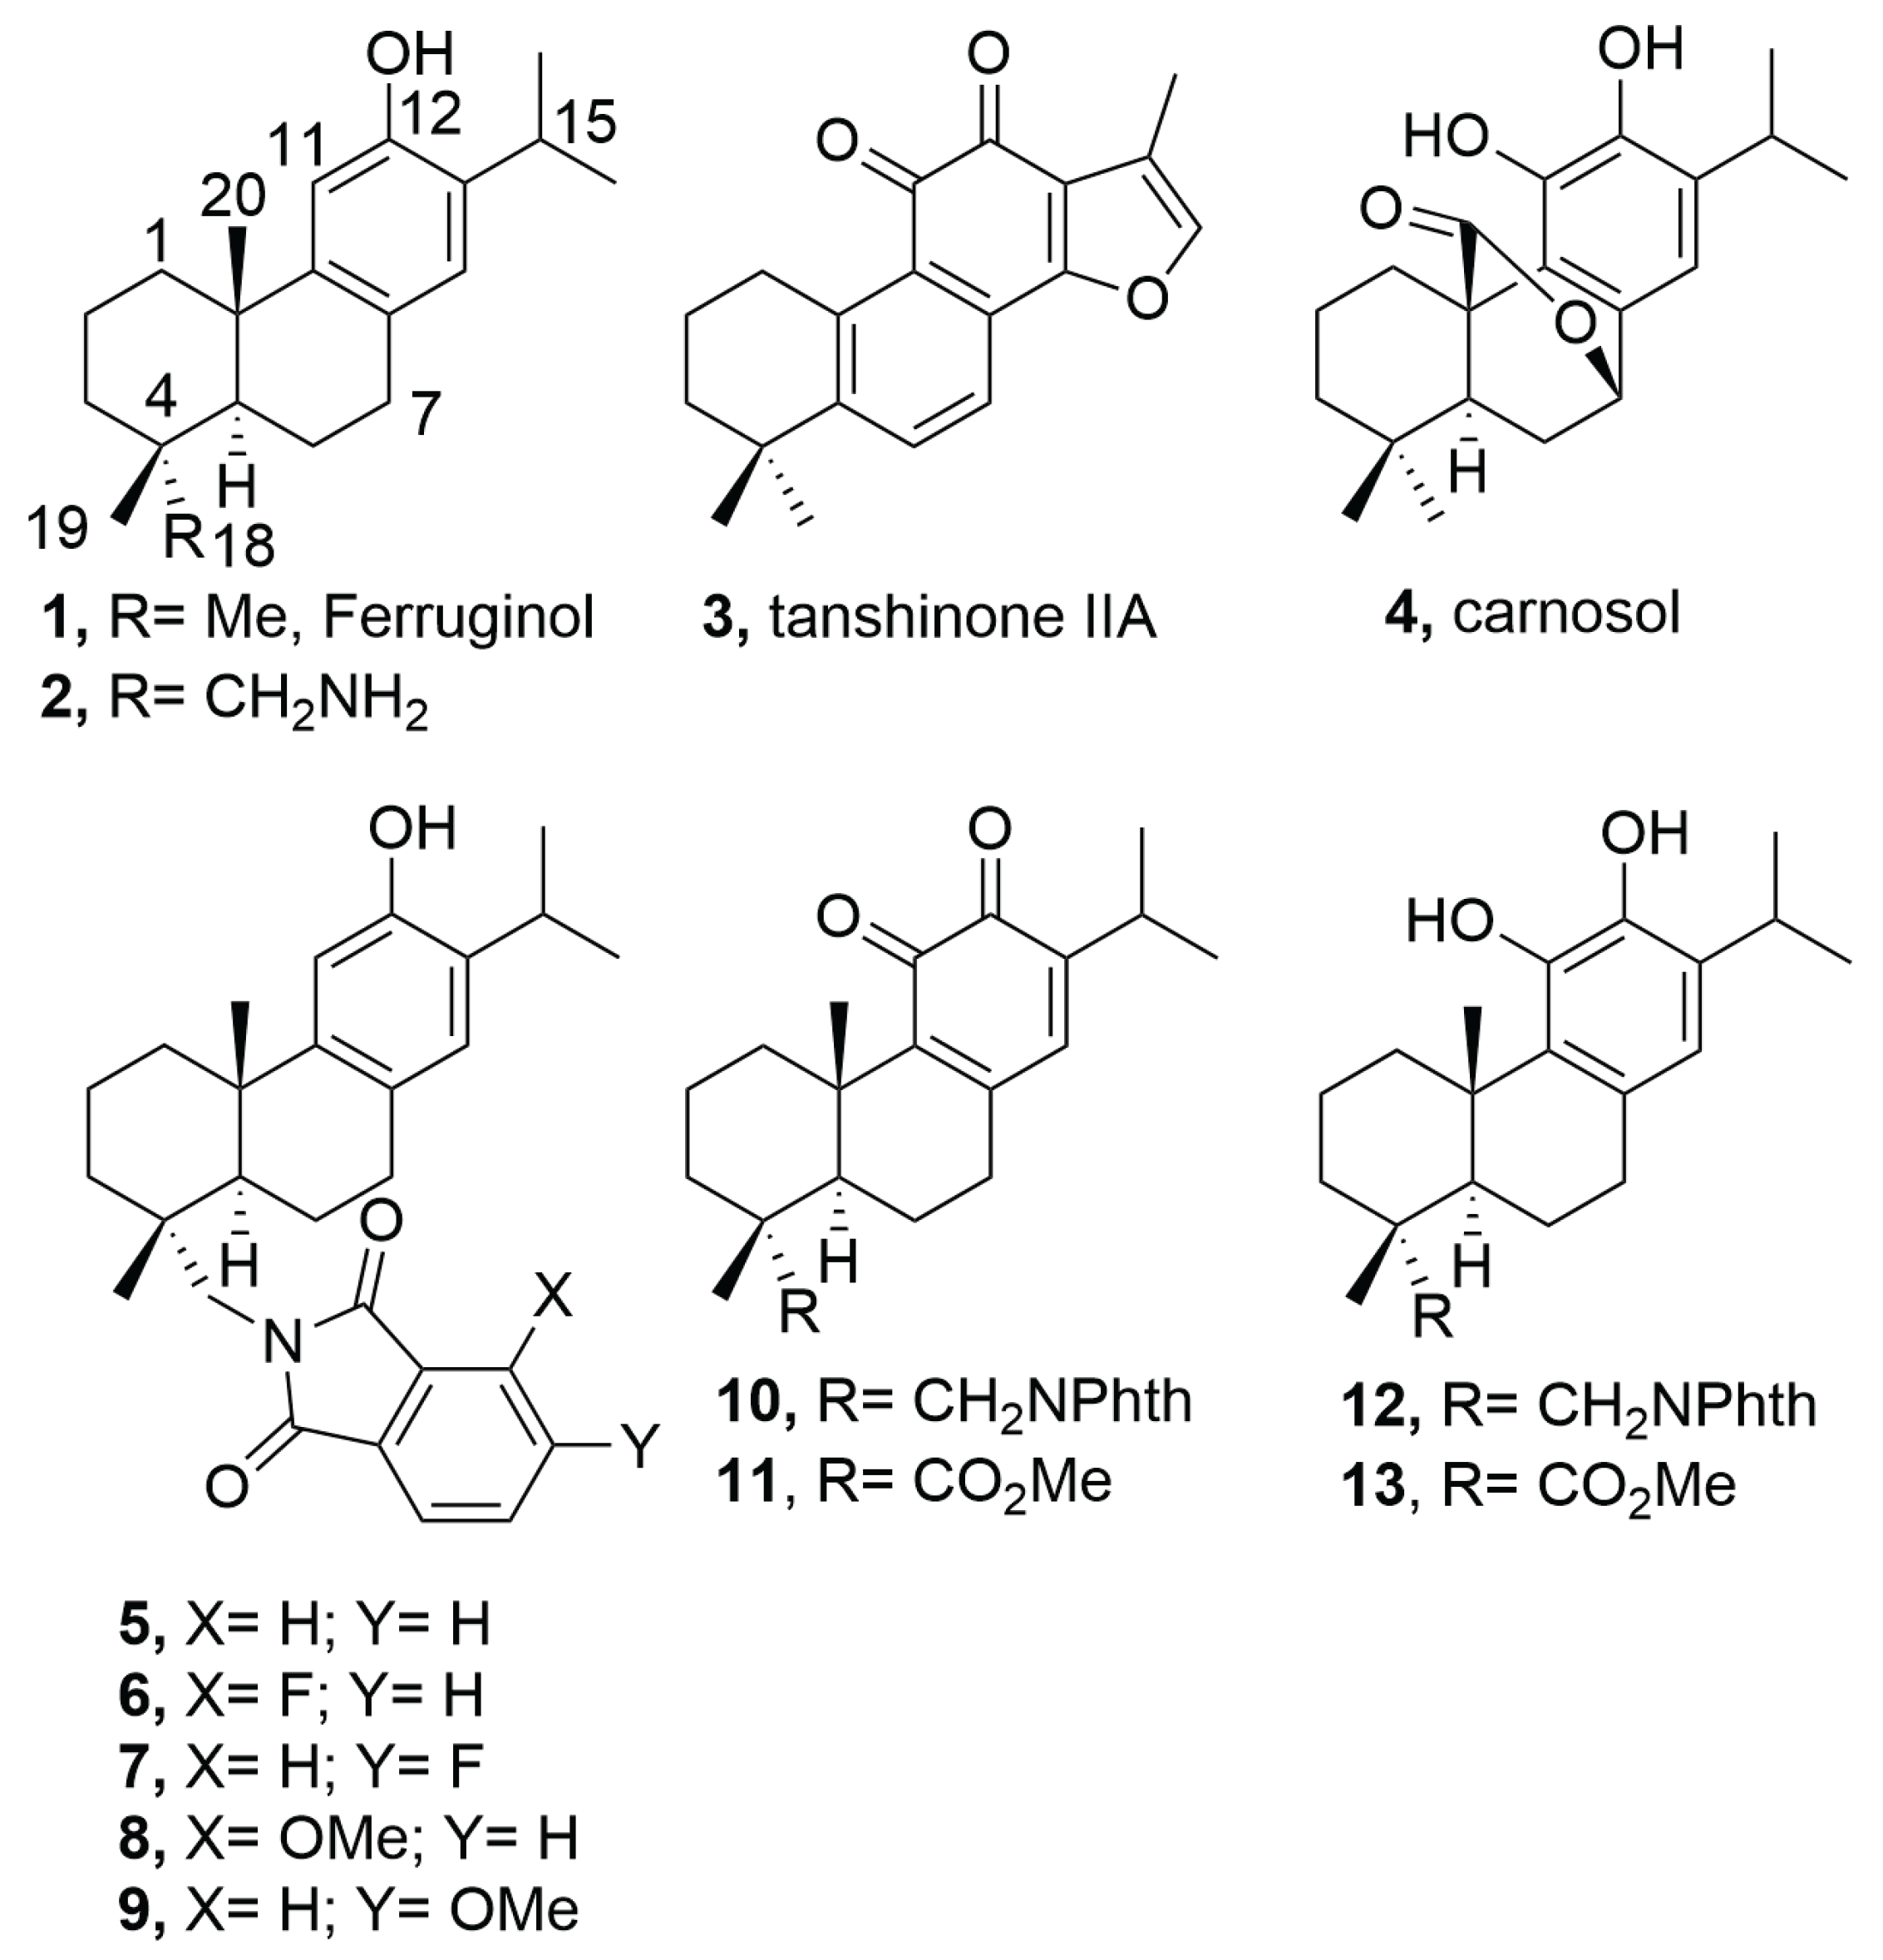
Abietane-type diterpenoids are a large family of natural products found in hundreds of plants and characterized by a 20-carbon skeleton and a variety of oxygenation patterns which possess different pharmacological activities including anticancer properties [5,6]. The first isolated member, abietic acid, has been extensively studied revealing several mechanisms involved in the antitumor properties [7]. Other members like ferruginol (1) [8] and its semisynthetic aminated analogue, 18-aminoferruginol (2)[9], along with tanshinone IIA (3)[10] and carnosol (4)[11] have also demonstrated important antiproliferative and anticancer activities (Figure 1). The abietane natural products and their derivatives and analogues, thus, offer a promising platform for developing antitumor drugs.
Cell proliferation refers to the rapid, uncontrolled growth and division of cancer cells which is a fundamental hallmark of the disease. Understanding cancer proliferation mechanisms continues to drive the development of targeted therapies aimed at disrupting specific aspects of this fundamental cancer process [12]. Encouraged by promising antiproliferative results reported by us on derivatizing readily available methyl 12-hydroxyabieta-8,11,13-trien-18-oate (14)(Scheme 1) and the phthalimide-ferruginol analogue 5 [9,13], we have synthesized further new and related known analogues. In this work, those new molecules along with some studied previously were assessed across a diverse panel of breast cancer models and several biological tests (including viability assays, clonogenic assays, and mitochondrial membrane polarization measurements) to assess their ability to control growth in cancer cell models and unveil their role in the antiproliferative action.
2. Results
2.1. Chemistry
Compounds 1 (ferruginol) and 2 (18-aminoferruginol) (Figure 1) were synthesized following previously reported methods starting from the commercially available (+)-dehydroabietylamine [14,15,16]. The analogues 6-9 were prepared from 12-hydroxydehydroabietylamine (2, 18-aminoferruginol) obtaining this material under optimized protocol [16] and condensating it with appropriate substituted phthalic anhydrides using similar reported conditions [16]. Compounds 10-13 were prepared using reported conditions either from dehydroabietylamine through intermediate 18-(phthalimid-2-yl)ferruginol (5)[13] or methyl dehydroabietate through intermediate methyl 12-hydroxyabieta-8,11,13-trien-18-oate (14)[17], which were readily obtained in four and three synthetic steps in 61% and 78% overall yield, respectively (Scheme 1).
2.2. Biology
The compounds were systematically assessed through multiple biological testing platforms to establish their relative effectiveness and explore potential correlations between chemical structure and biological function. Firstly, their ability to inhibit the proliferation of three specific breast cancer models (SUM149, MDA-MB231, MCF07) were evaluated in vitro by using the established CellTiter-Glo®[18,19] cellular proliferation assay. The results are shown in Table 1 (IC50).
It was found that while most compounds exhibited biological activity, compounds 10 and 11 enhanced cytotoxic effects against triple-negative breast cancer models in standard Cell-Titer-Glo viability assessments, suggesting a favorable differential between therapeutic efficacy and toxicity thresholds. The SUM149 model is emphasized due to its representation of the inflammatory and highly aggressive TNBC subtype.
Further evaluation of various promising compounds using breast cancer models, included analysis of colony-forming inhibition capabilities, and investigations into their specific mechanistic pathways of action. Thus, the anchorage-dependent colony formation assay, also known as clonogenic assay, was conducted. This fundamental method in cancer research evaluates the ability of single cells to grow into colonies when attached to a surface and can measure a cell’s ability to undergo "unlimited" division and form a colony (usually defined as ≥ 50 cells).
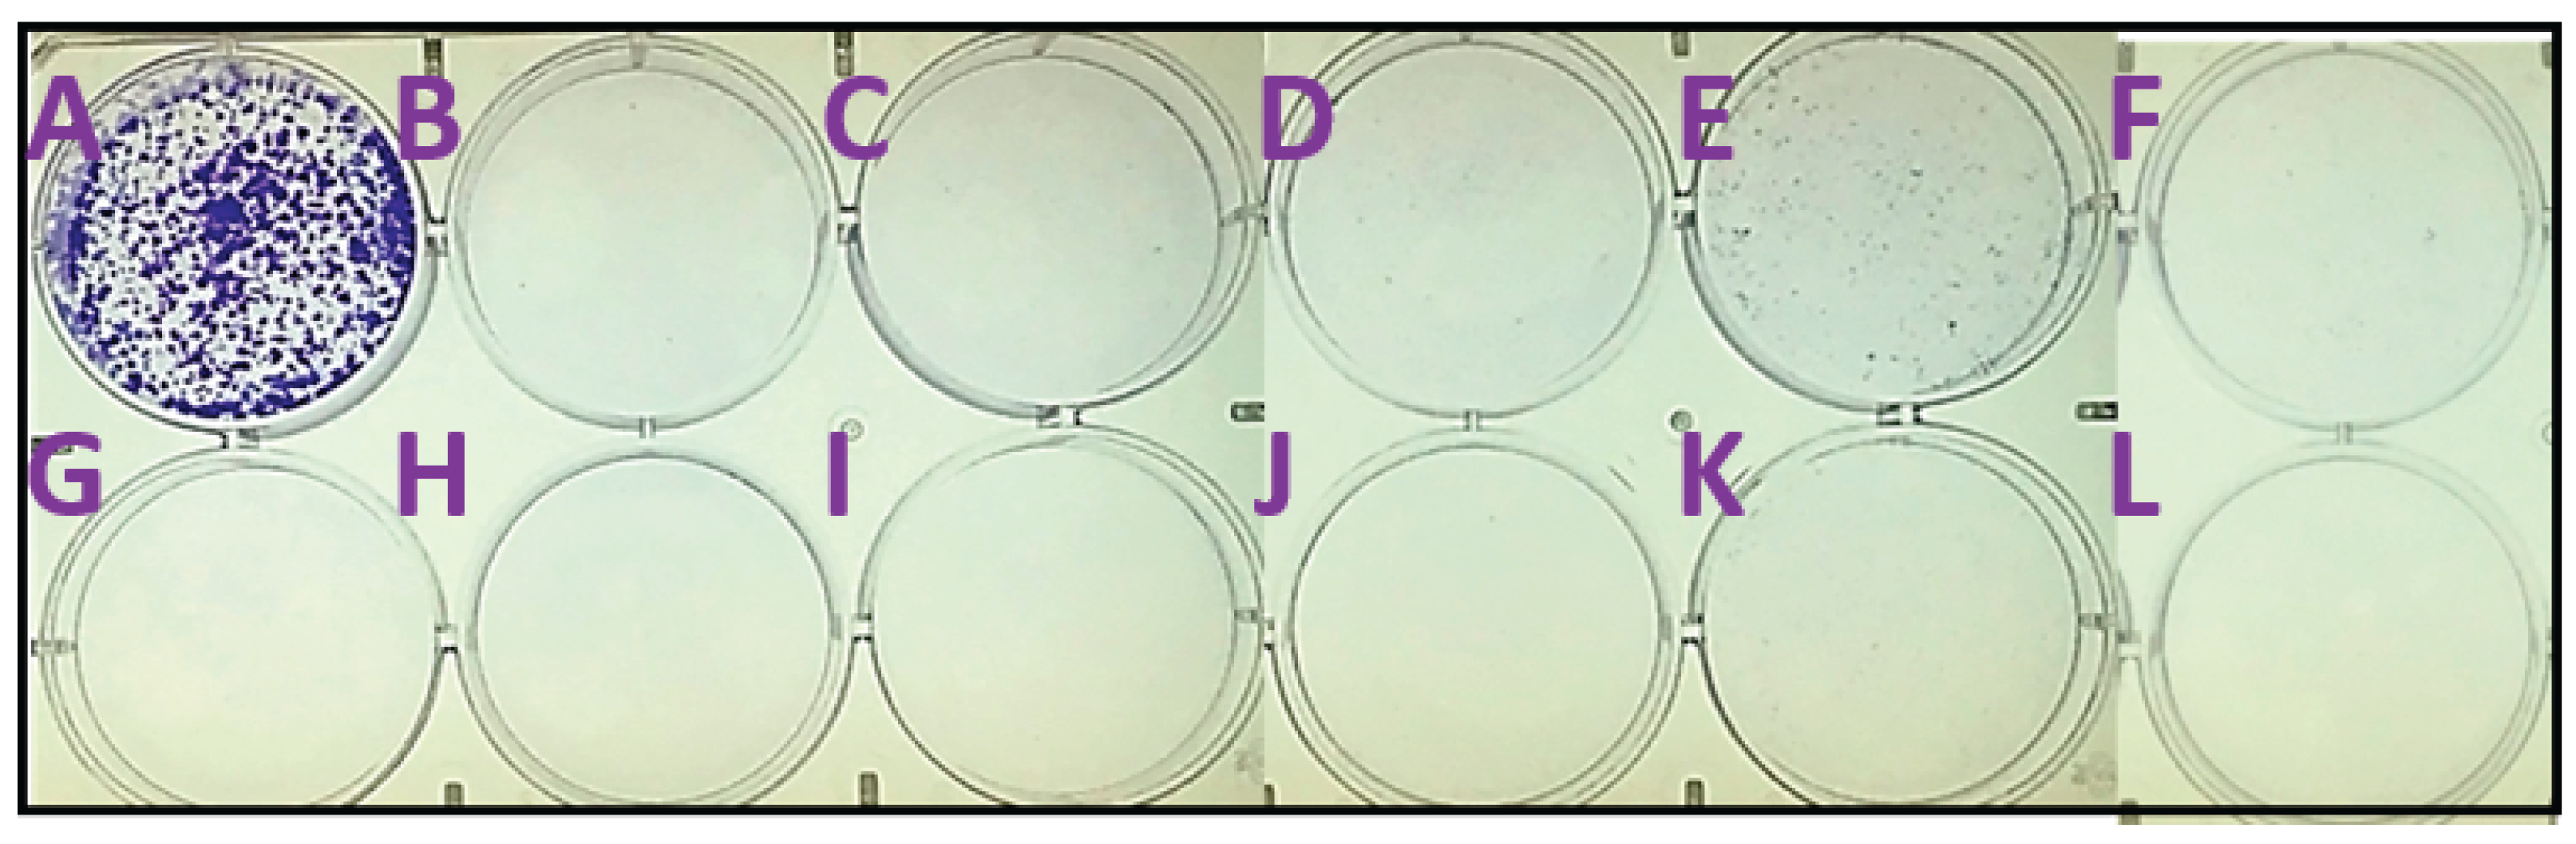
The clonogenic assay offers comprehensive insights into the compound’s overall efficacy and is regarded as the definitive method for assessing post-treatment reproductive cell death (both cytotoxic and cytostatic effects)[20]. The extended duration of the experiment simultaneously provides valuable data on the compounds’ stability over time, which are not detected in short-term viability assays. Figure 2--At a concentration of 20 μM, the compounds demonstrated clear efficacy in abolishing the colony-forming ability of SUM149 cells. The majority of compounds exhibited strong inhibitory effects even at 10 μM, with the notable exceptions of compounds 1, and 10-11—possibly attributable to the cellular mechanisms capable of hydrolyzing or neutralizing these particular agents. In the MDA-MB-231 cellular model (Figure 5, Figure 6 and Figure 7), the evaluated compounds successfully eliminated the cells’ capacity to establish colonies.
Figure 2.
Quantification of colony formation assay (SUM149 cell model) using ImageJ.
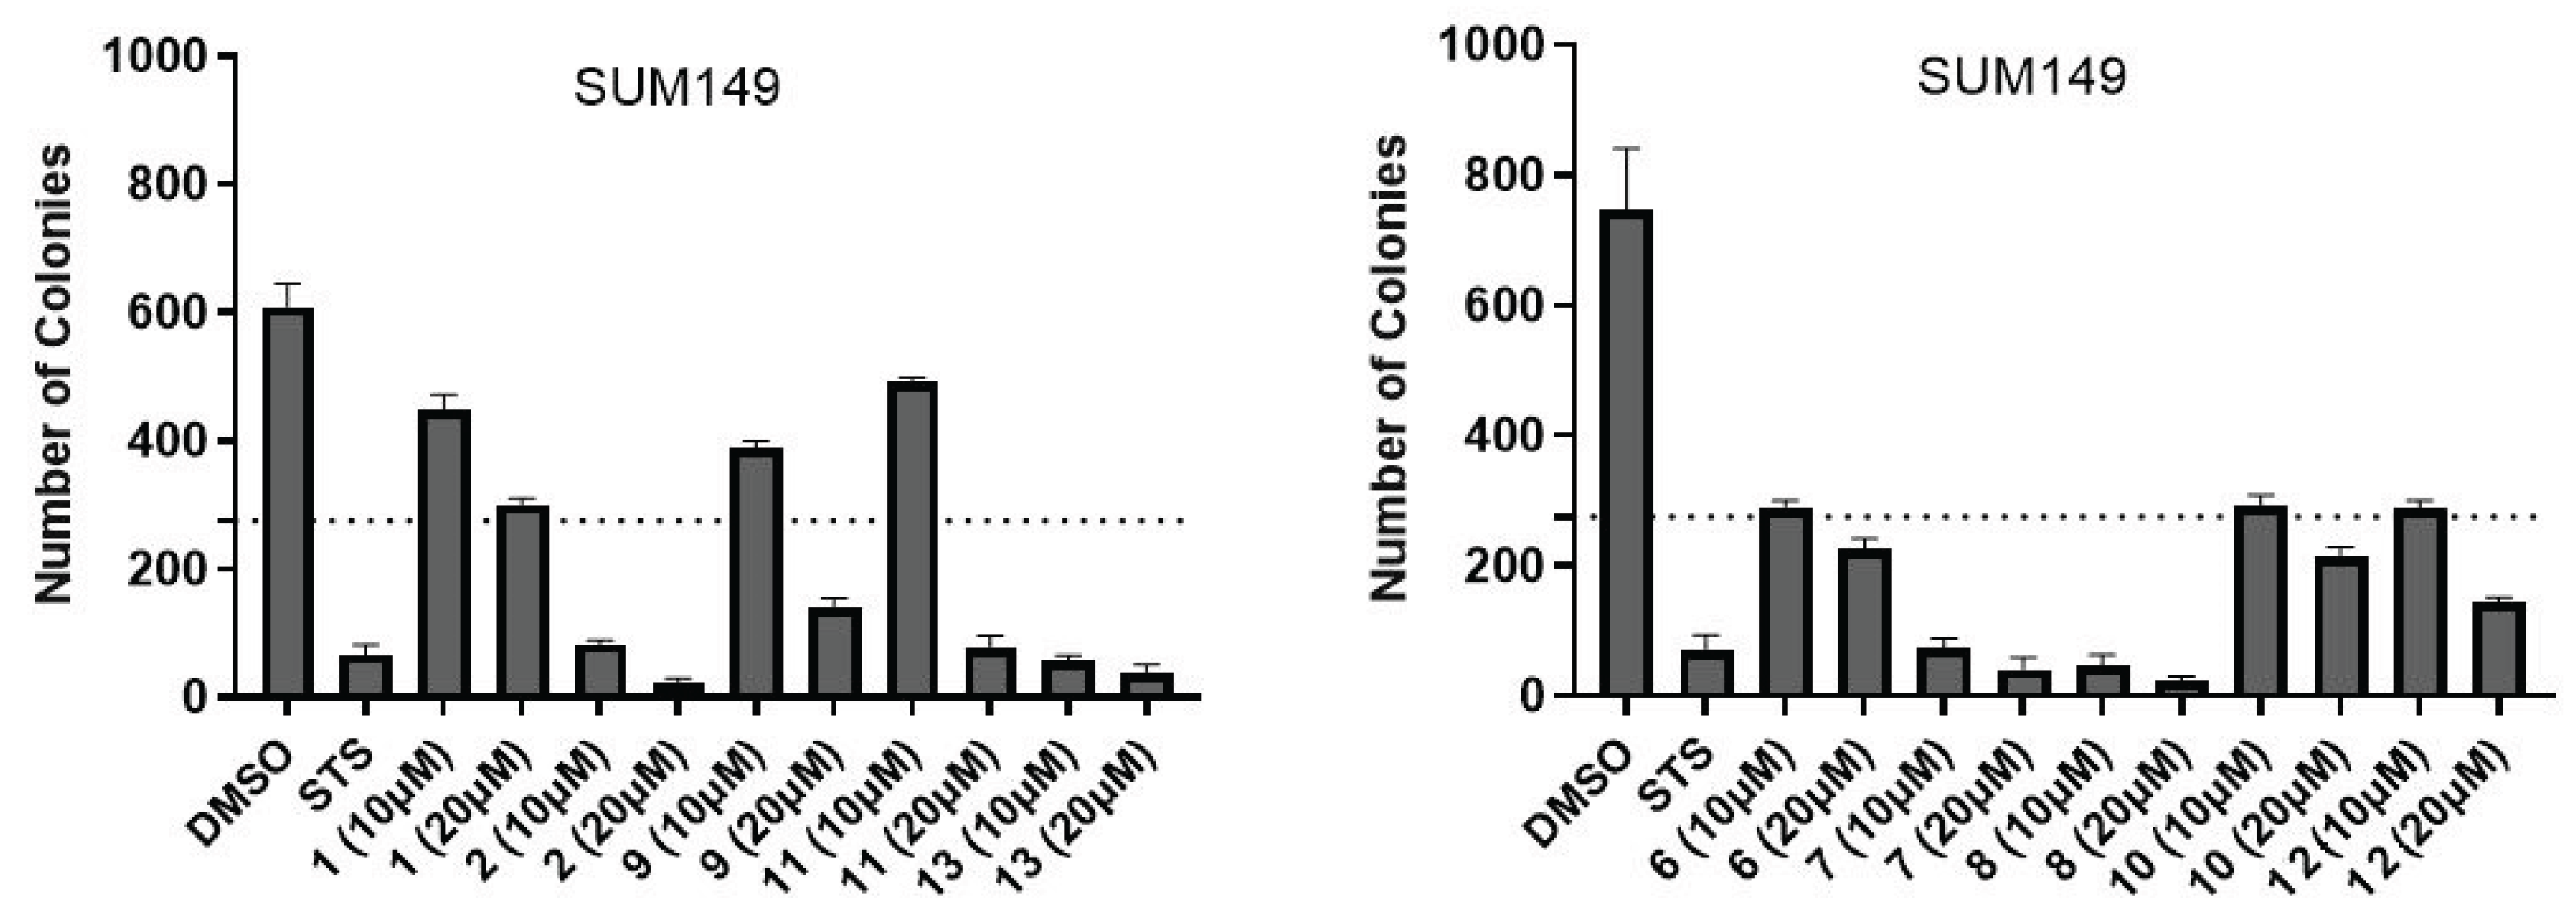
Figure 3.
Representative images of colony formation assay (SUM149 cell model). A. DMSO, B. 9(10 μM), C. 13(10 μM), D. 2(10 μM), E. 1(10 μM), F. 11(10 μM), G. STS (5 μM), H. 9(20 μM), I. 13(20 μM), J. 2(20 μM), K. 1(20 μM), L. 11(20 μM).
Figure 3.
Representative images of colony formation assay (SUM149 cell model). A. DMSO, B. 9(10 μM), C. 13(10 μM), D. 2(10 μM), E. 1(10 μM), F. 11(10 μM), G. STS (5 μM), H. 9(20 μM), I. 13(20 μM), J. 2(20 μM), K. 1(20 μM), L. 11(20 μM).
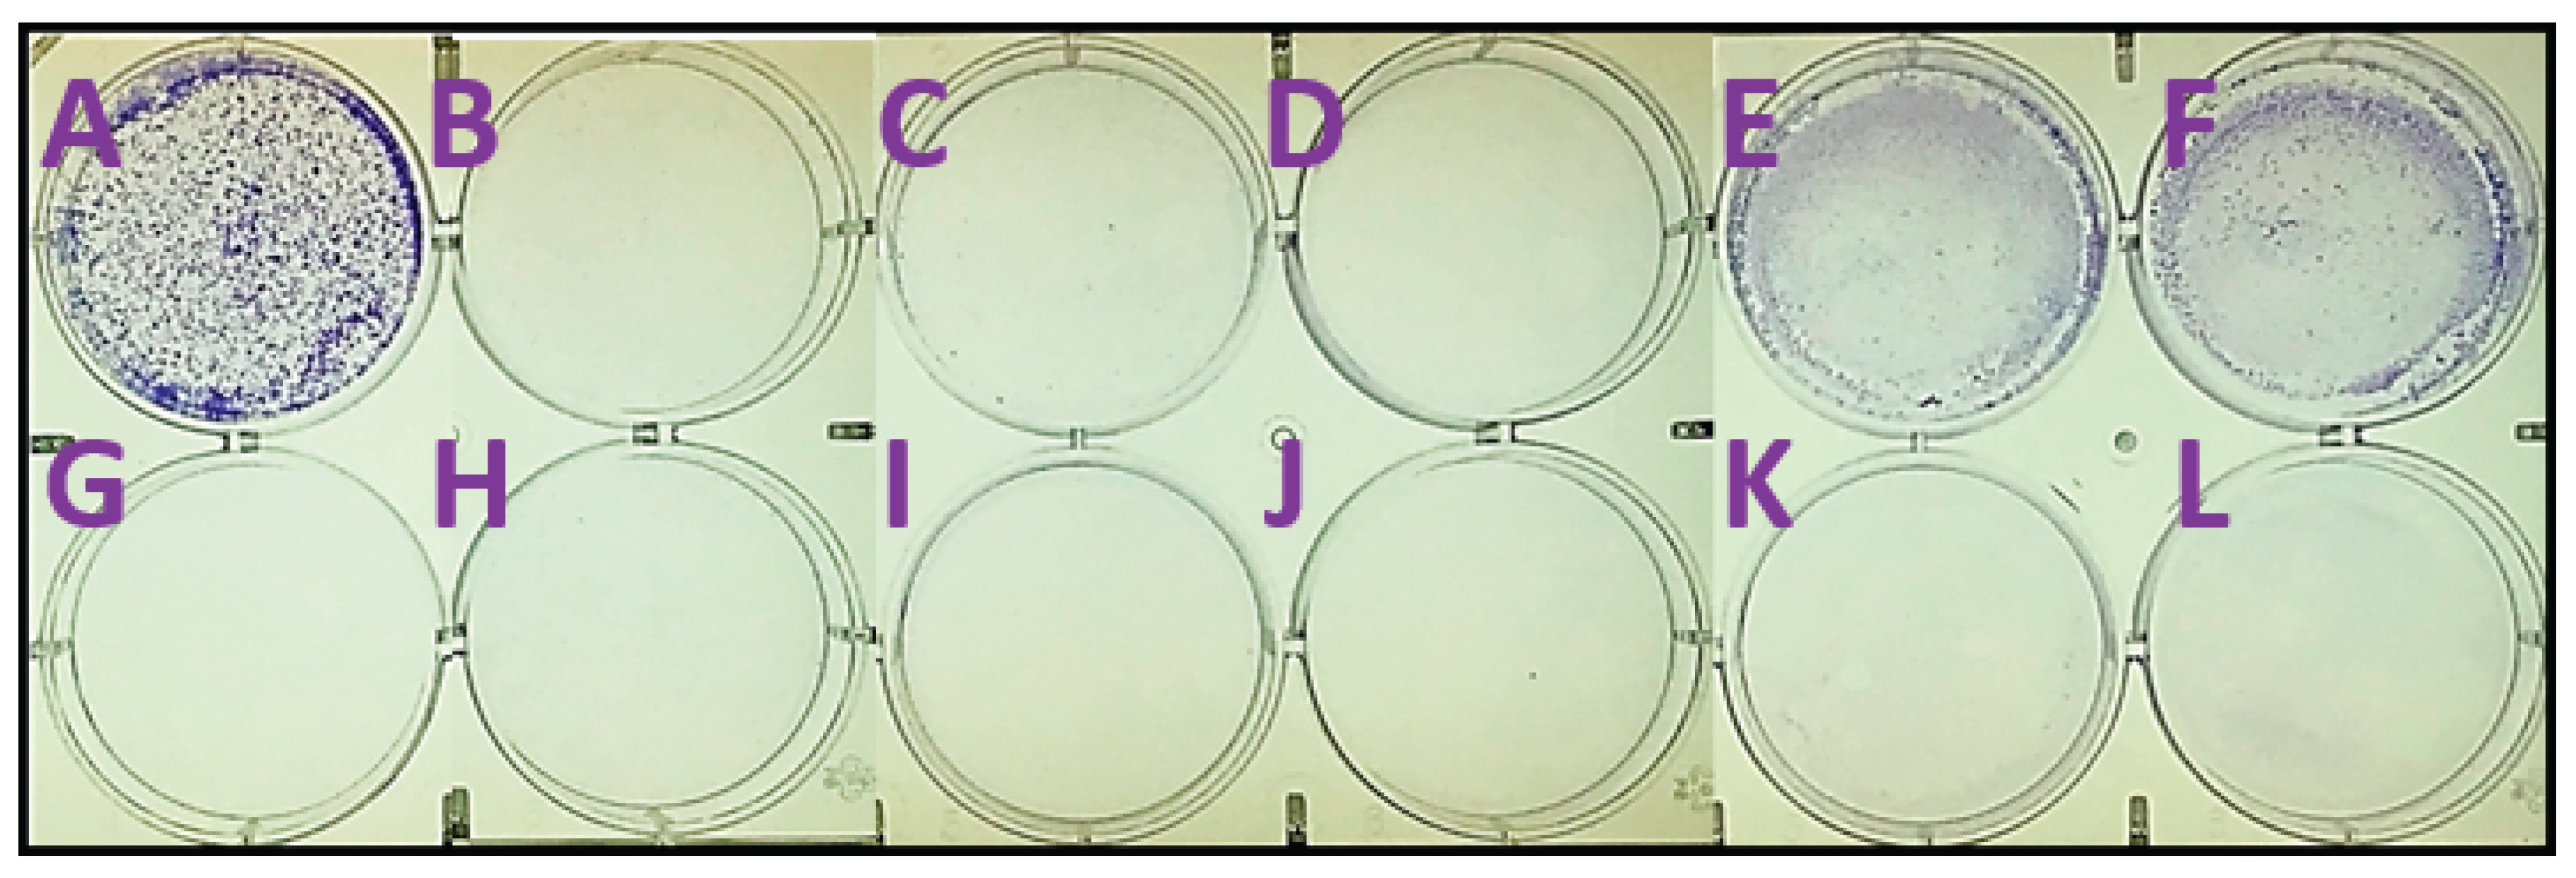
Figure 4.
Representative images of colony formation assay (SUM149 cell model). A. DMSO, B. 10(10 μM), C. 7(10 μM), D. 6(10 μM), E. 8(10 μM), F. 12(10 μM), G. STS (5 μM), H. 10(20 μM), I. 7(20 μM), J. 6(20 μM), K. 8(20 μM), L. 12(20 μM).
Figure 4.
Representative images of colony formation assay (SUM149 cell model). A. DMSO, B. 10(10 μM), C. 7(10 μM), D. 6(10 μM), E. 8(10 μM), F. 12(10 μM), G. STS (5 μM), H. 10(20 μM), I. 7(20 μM), J. 6(20 μM), K. 8(20 μM), L. 12(20 μM).
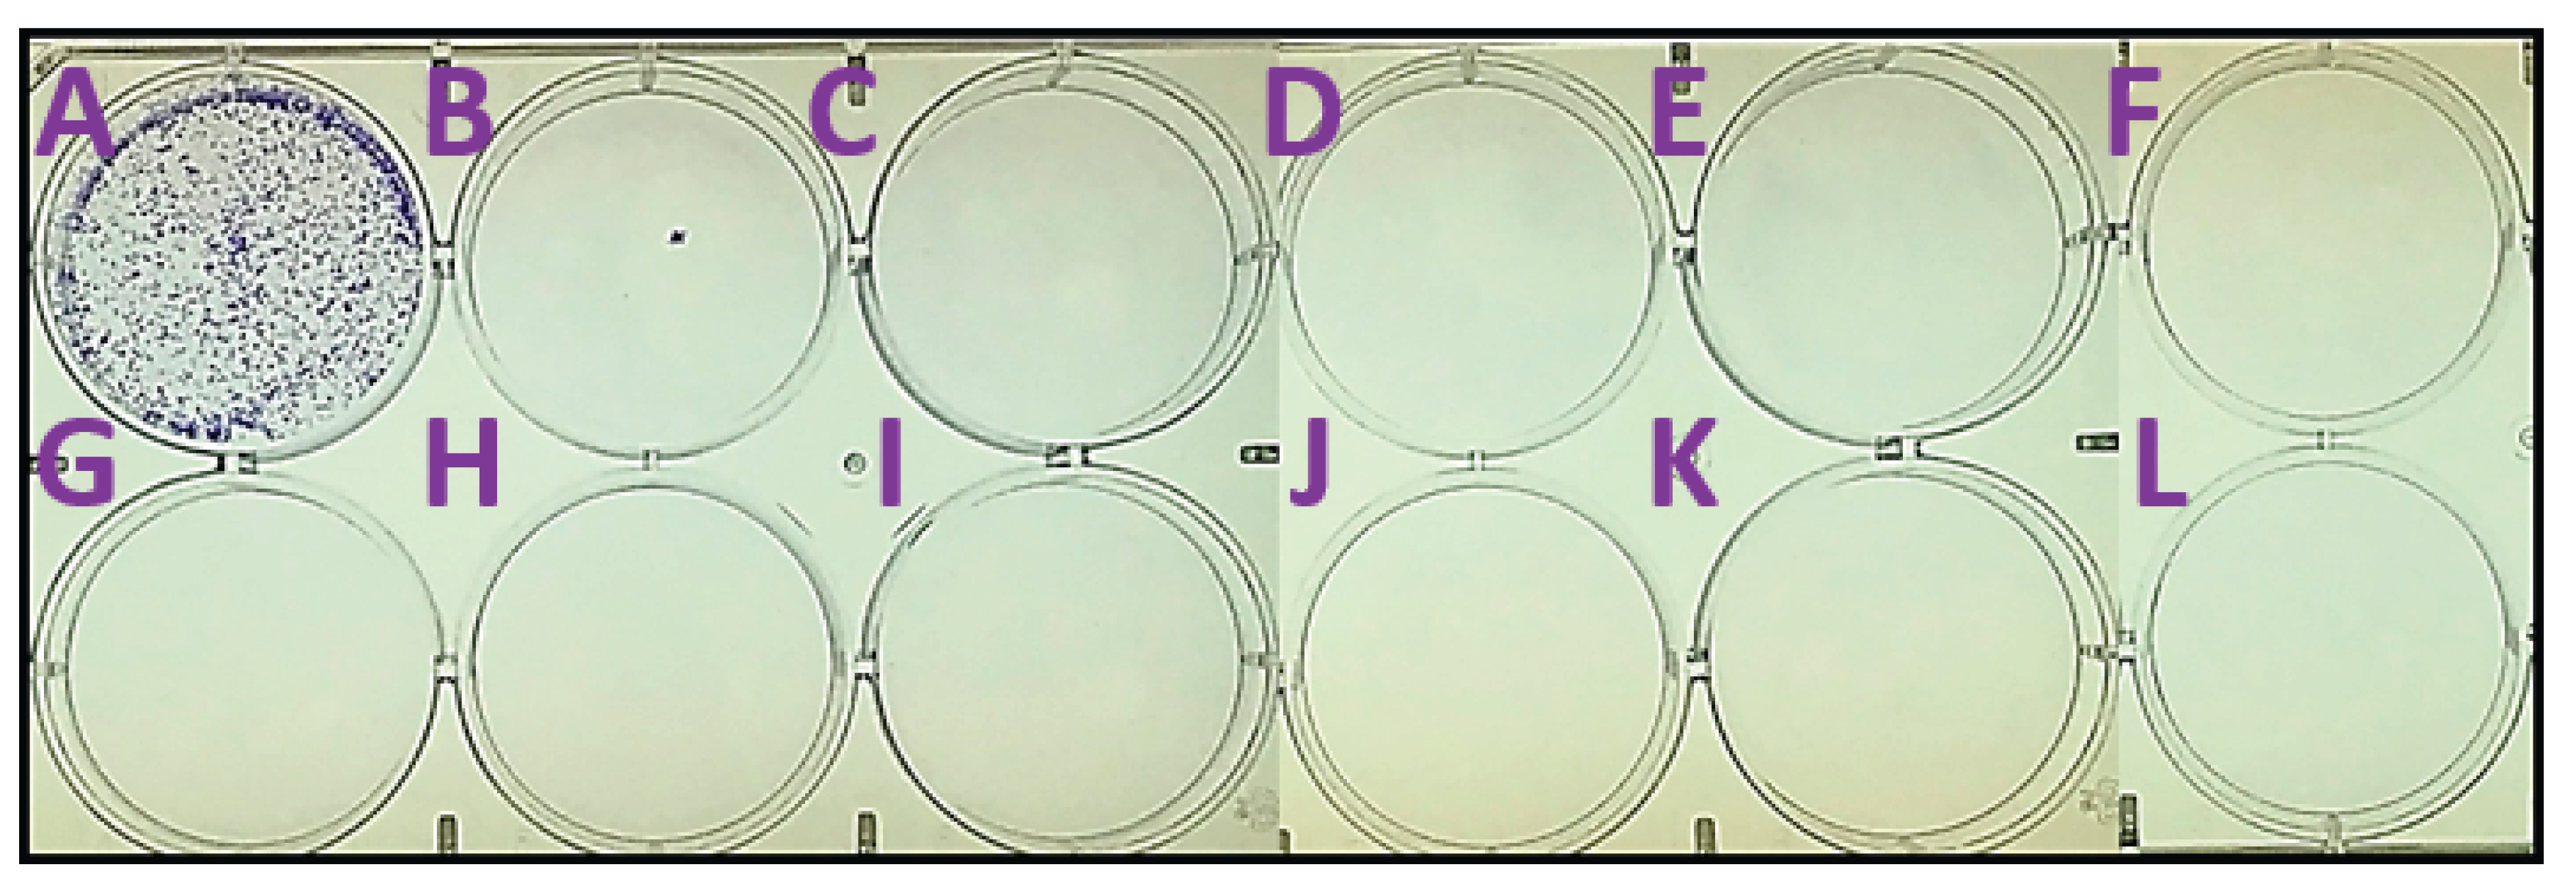
Figure 5.
Quantification of colony formation assay (MDA-MB231 cell model) using ImageJ.
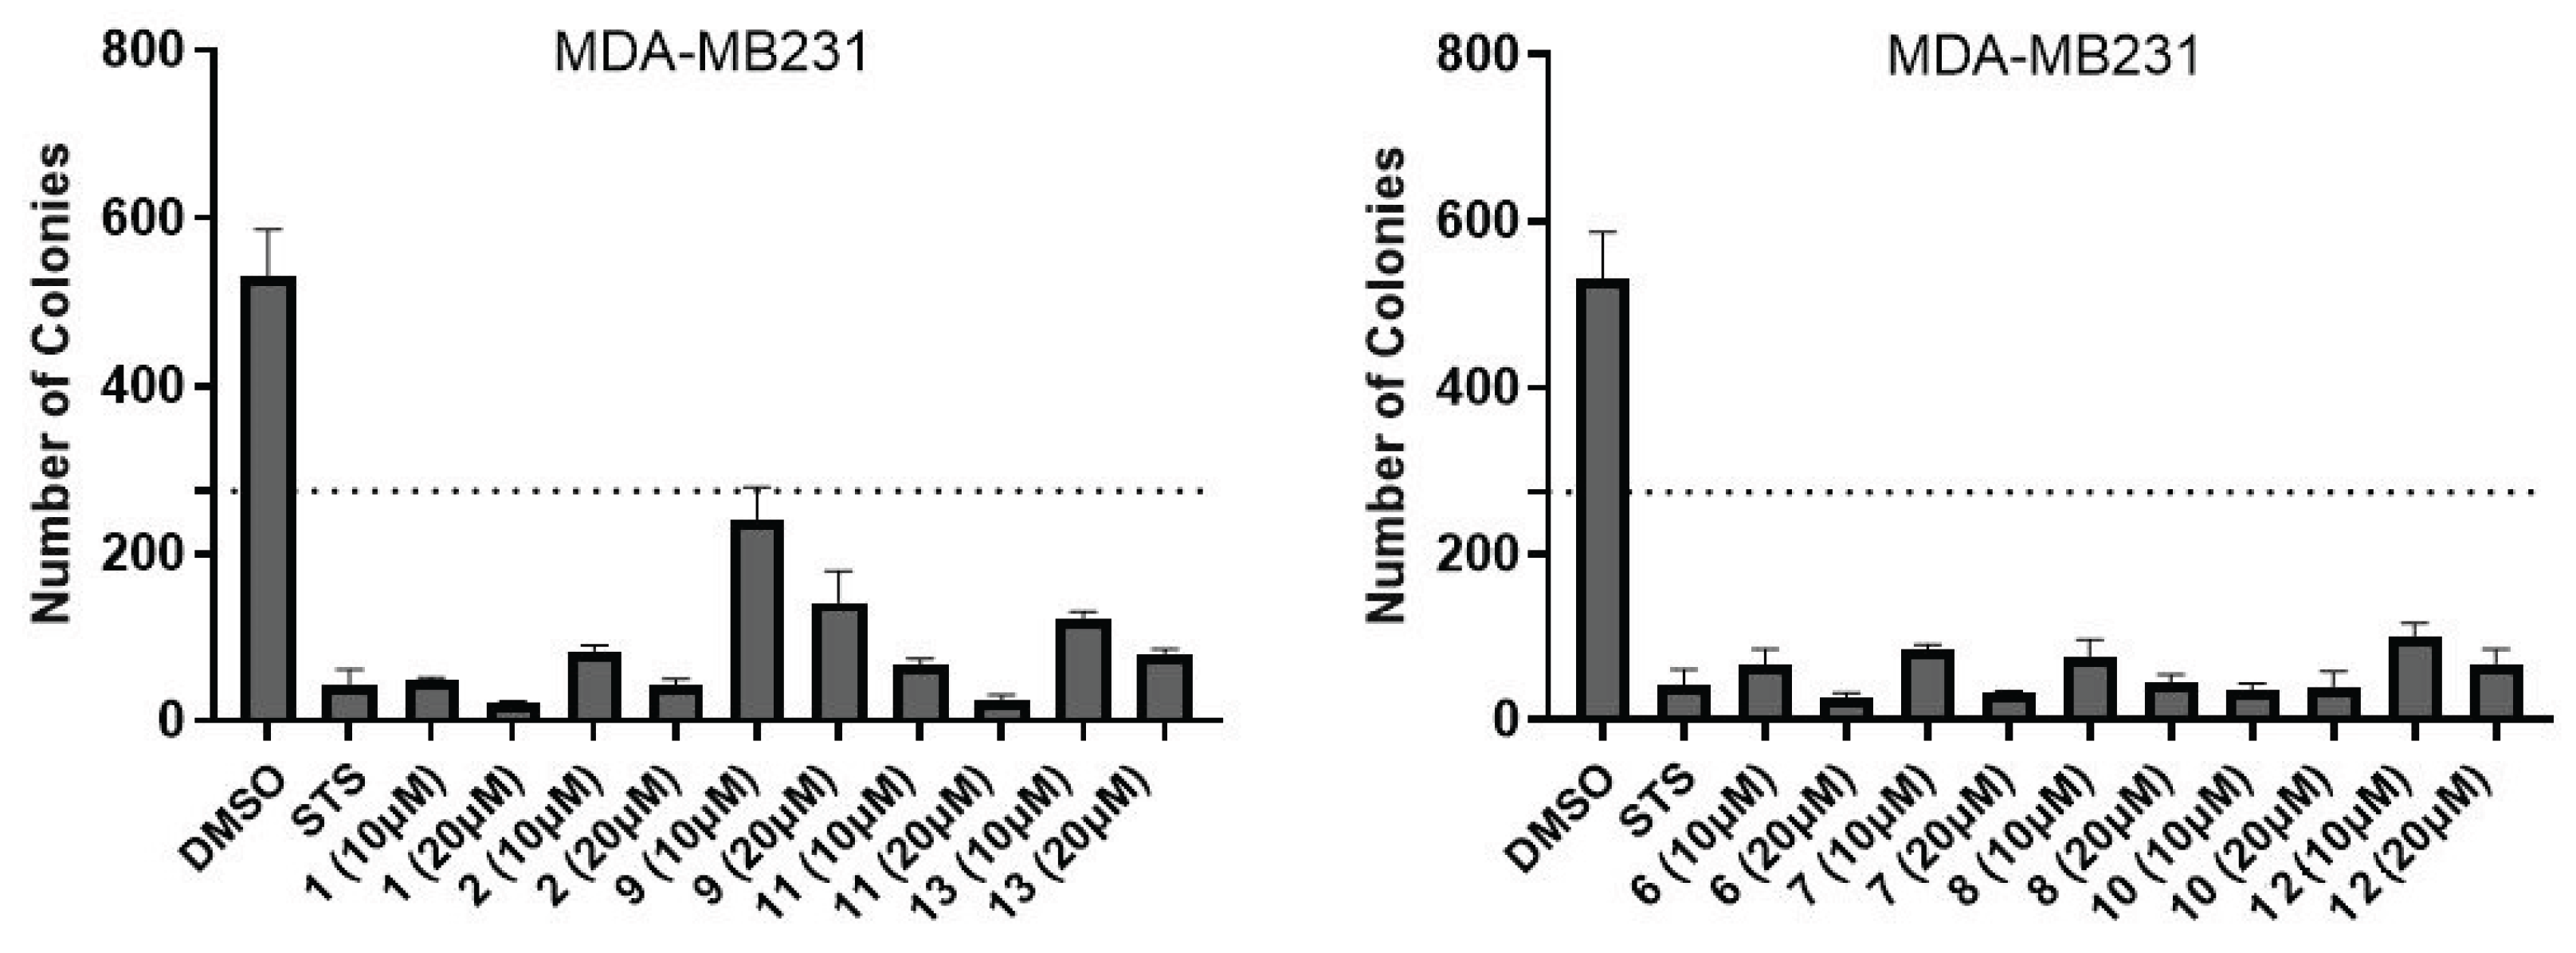
Figure 6.
Representative images of colony formation assay (MDA-MB231 cell model). A. DMSO, B. 9(10 μM), C. 13(10 μM), D. 2(10 μM), E. 1(10 μM), F. 11(10 μM), G. STS (5 μM), H. 9(20 μM), I. 13(20 μM), J. 2(20 μM), K. 1(20 μM), L. 11(20 μM).
Figure 6.
Representative images of colony formation assay (MDA-MB231 cell model). A. DMSO, B. 9(10 μM), C. 13(10 μM), D. 2(10 μM), E. 1(10 μM), F. 11(10 μM), G. STS (5 μM), H. 9(20 μM), I. 13(20 μM), J. 2(20 μM), K. 1(20 μM), L. 11(20 μM).
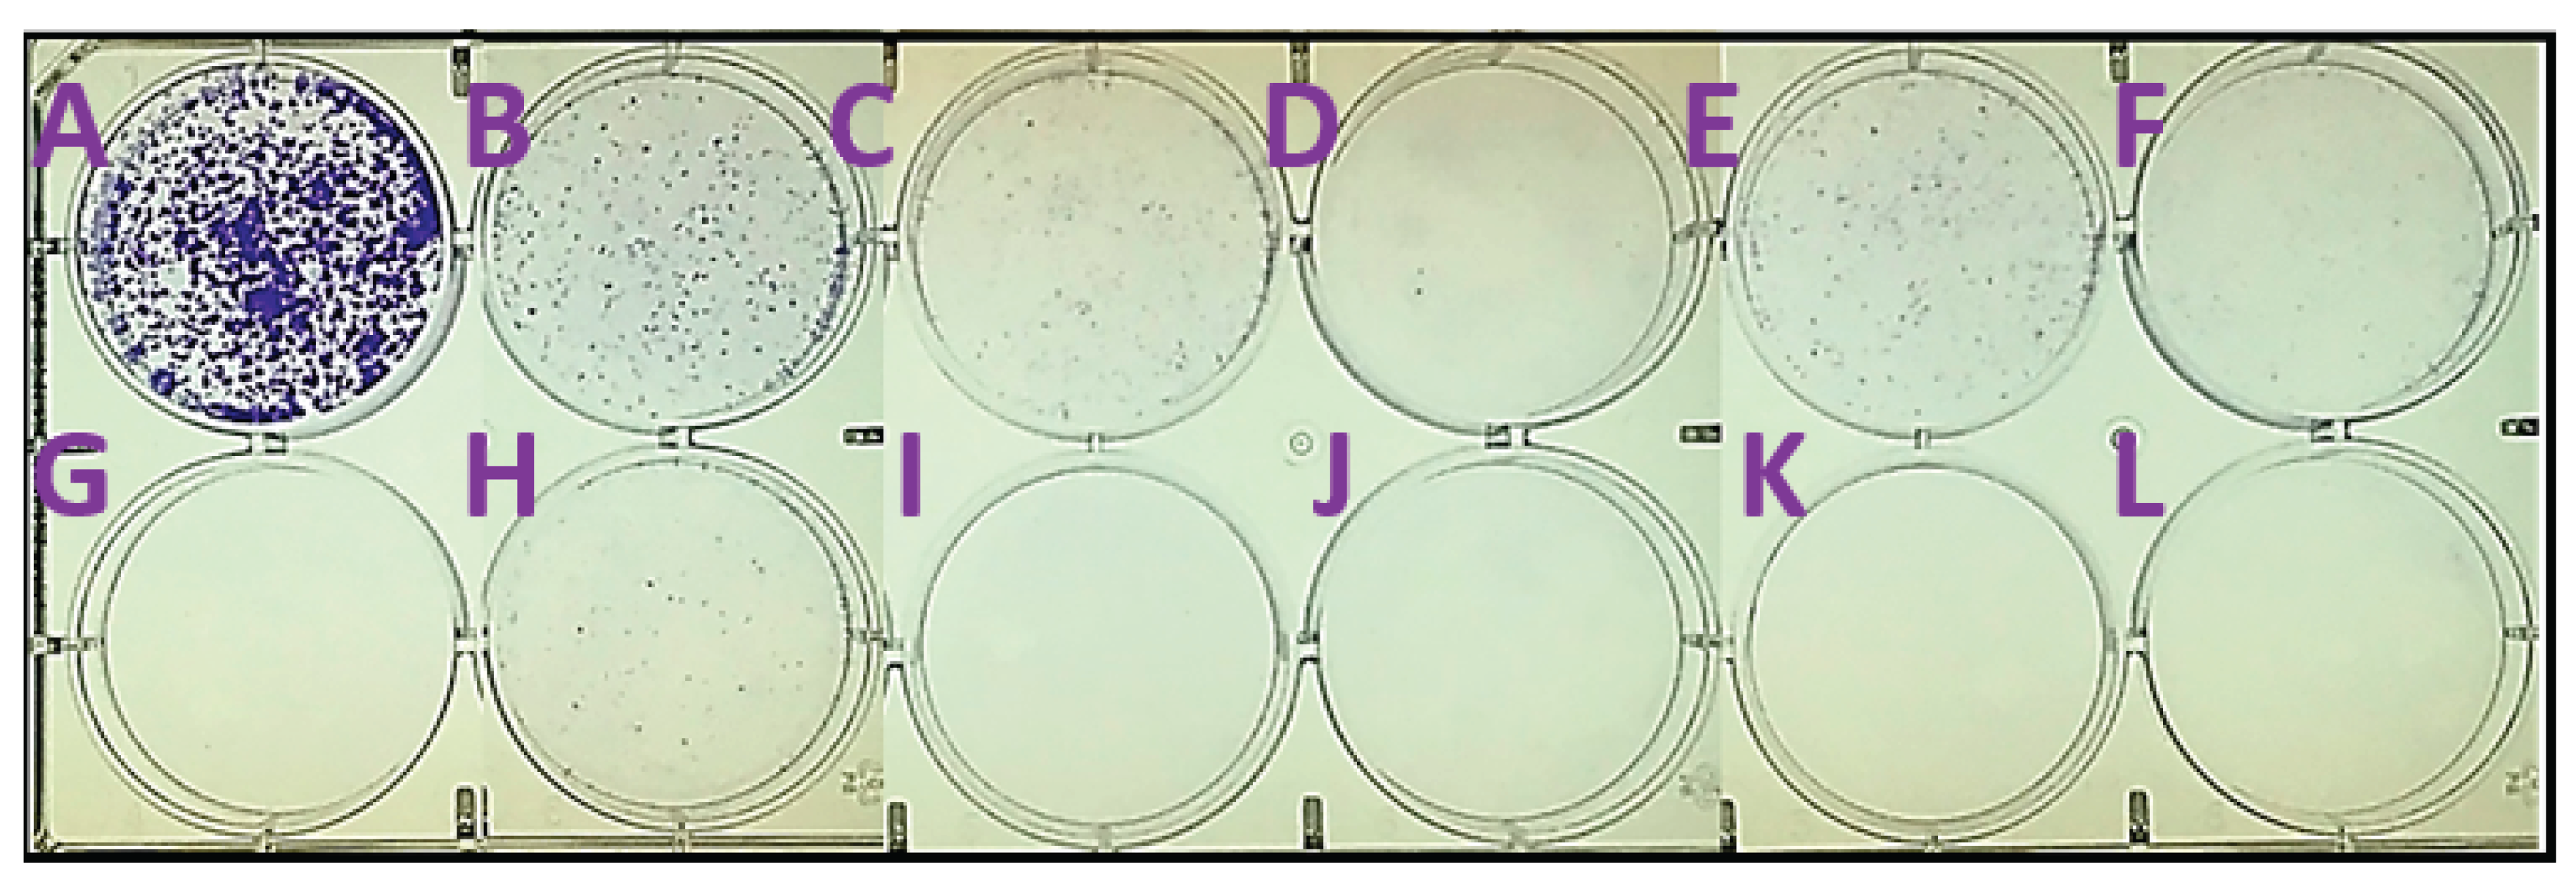
Figure 7.
Representative images of colony formation assay (MDA-MB231 cell model). A. DMSO, B. 10(10 μM), C. 7(10 μM), D. 6(10 μM), E. 8(10 μM), F. 12(10 μM), G. STS (5 μM), H. 10(20 μM), I. 7(20 μM), J. 6(20 μM), K. 8(20 μM), L. 12(20 μM).
Figure 7.
Representative images of colony formation assay (MDA-MB231 cell model). A. DMSO, B. 10(10 μM), C. 7(10 μM), D. 6(10 μM), E. 8(10 μM), F. 12(10 μM), G. STS (5 μM), H. 10(20 μM), I. 7(20 μM), J. 6(20 μM), K. 8(20 μM), L. 12(20 μM).
Finally, we evaluated the compounds potential to affect the mitochondrion. Mitochondrial depolarization is an early indicator of intrinsic apoptosis. Tetramethylrhodamine methyl ester perchlorate (TMRM) can detect this event before other apoptotic markers appear. Also, TMRM assays can measure metabolic reprogramming by assessing changes in mitochondrial potential. This assay can also provide further mechanistic studies by relaying off-target toxicity since it can capture unintended mitochondrial toxicity. It can also highlight if the cancer cell is likely to develop resistant to the compound since cancer cells that resist apoptosis often maintain mitochondrial potential despite treatment. TMRM helps identify these resistant populations early in the drug discovery process. As shown in Figure 8, Figure 9, Figure 10 and Figure 11, the data demonstrates that the compounds consistently induced mitochondrial membrane potential depolarization at both 5 and 10 µM concentrations, independent of exposure duration (24 or 48h). However, SUM149 exhibited higher sensitivity compared to MDAMB231, demonstrating a more pronounced response to all compounds except 1 and 9. Furthermore, a reduction in potency was observed after 48 h treatment in both models, suggesting either compound degradation or cellular mechanisms actively expelling the compounds from the mitochondria. Nevertheless, the collective results suggest that these compounds are probably triggering cell death through apoptotic mechanisms.
Brightfield microscopy images of MDA-MB-231 breast cancer cells is indicated in Figure 12 to highlight the morphological changes that occur upon treatment with compounds 1, 6 and 10. Membrane blebbing, where the cell membrane forms irregular bulges or protrusions as the cytoskeleton detaches from the plasma membrane during the controlled cell death process can be clearly observed with these compounds. The membrane blebbing is a key morphological feature of early apoptosis, where the cell membrane loses its normal structure and develops bubble-like protrusions as internal cellular components begin to fragment and the cell prepares for phagocytic clearance.
2.3. In Silico Calculations
In silico computational studies is an important part of the drug development process. Using the SWISSADME web server [21], through easily inserting the corresponding SMILES notation for each molecule from Chemdraw, we can predict important molecular properties such as the Lipinski’s rule of five [22]. Representative results are displayed in Table 2 and Table S1 and complete results obtained from SWISSADME are compiled in the supplementary material (Figures S7–S19).
All compounds possess molecular weight (MW) values below 500 g/mol. The lipophilicity data by means of the computed consensus log P values ranged from 4.05 to 6.42, which caused the violation of the lipinski’s rule log P < 5 for several compounds (Table 2). This indicates that most of these molecules may need reformulation to be orally active agents, which agrees with the water-solubility parameters giving molecules with moderate to poor solubility (Figures S7–S19). The pharmacokinetic data showed that high gastrointestinal absorption was observed for all compounds, while blood-brain barrier (BBB) permeability potential was not predicted for all compounds (Table S1). Half of the compounds showed the potential to be substrates for P-gp. Lack of inhibitory potential against cytochrome P450 (CYP) isoforms was observed for most of compounds for CYP1A2 and CYP2D6 isoforms. Interestingly, compound 2 was predicted to potentially inhibit only CYP2D6 out of the five isoforms calculated (Table S1).
3. Discussion
The research on the interesting family of naturally occurring abietane diterpenoids found in many plants has attracted significant attention from natural products, synthetic, medicinal chemistry and pharmacological communities due to their diverse structures and wide range of biological properties [5,6,26,27,28].
Over the last decade, we have contributed to this highly dynamic field of research, particularly in the semi-synthesis of natural abietanes, derivatives or analogues and the study of their biological activities. Our objective was consistently focused on identifying compounds with improved therapeutic profiles while simultaneously validating the structural assignments during the isolation process, particularly when working with natural abietane scaffolds as established targets. During our investigations, we developed a scalable synthesis of (+)-ferruginol (1), through the intermediate 18-aminoferruginol (2) starting from commercial (+)-dehydroabietylamine (Scheme 1)[14]. This led to the discovery of 18-(phthalimid-2-yl)ferruginol (5) as a broad-spectrum antiviral agent [29], encouraging the efforts towards the synthesis of ferruginol analogues and their biological profiling. The precedence in the literature that ferruginol (1), like tanshinone IIA (3) and carnosol (4), possesses biological activity, have guided our research [13,17]. We found that compounds 5, 10, 11, and 12 displayed the highest efficacy inhibiting the proliferation of several breast cancer cell lines (IC50 = 1.3-13 mM and therapeutic index range 6-43) (Table 1) [13], thus encouraging further studies herein presented. This compelling finding highlights the crucial importance of natural product derivatization in identifying potent anticancer compounds with enhanced biological activity and availability. Compounds 10 and 11, structurally, are characterized by an orthoquinone functionality at C-11 and C-12 which surely is responsible for their antiproliferative effects. These results aligned well with extensive research on the cytotoxicity of abietane-type diterpenes containing a quinone moiety [30,31]. Ferruginol analogues 6 and 7, containing an atom of fluorine in the phthalimide, were more potent than parent ferruginol (1) with moderate potency (Table 1). Similarly, the new phthalimide analogues 8 and 9 with methoxy substituents were more potent than ferruginol (1), except compound 8 for MDA-MB231 line, displaying similar activities than 5-7, generally (Table 1).
4. Materials and Methods
4.1. Chemistry: General Experimental Procedures
Specific rotation was measured using a 10 cm cell in a Jasco P-2000 polarimeter in DCM. NMR data were collected on a 400 MHz spectrometer. All spectra were recorded in CDCl3 as solvent, otherwise is mentioned. Reactions were monitored by TLC using Merck silica gel 60 F254 (0.25 mm-thick) plates. Compounds on TLC plates were visualized under UV light at 254 nm and by immersion in a 10% sulfuric acid solution and heating with a heat gun. Purifications were performed by flash chromatography on Merck silica gel (230–400 mesh). Commercial reagent grade solvents and chemicals were used as purchased. Combined organic extracts were washed with brine, dried over anhydrous MgSO4, filtered, and concentrated under reduced pressure.
(+)-Dehydroabietylamine (ca. 90%) and (−)-abietic acid >70% was purchased from from TCI Europe (Zwijndrecht, Belgium). Carbon numbering of compounds matched to that of natural products (abietanes skeleton). All known compounds prepared in this work displayed spectroscopic data in agreement with the reported data [13,15,16,17]. Purity of final compound was 95% or higher. Copies of NMR spectra for new compounds 8,9 are available in the supplementary information.
4.2. Synthesis
12-Hydroxy-N,N-(3-methoxyphthaloyl)dehydroabietylamine (8)
A mixture of 3-methoxyphthalic anhydride (356 mg, 2.0 mmol) and 12-hydroxydehydroabietylamine [16] (300 mg, 0.99 mmol) in acetic acid (4.0 mL) was heated at reflux for 3 h, then cooled to rt and 30 mL of water was added. The resulting solid was filtered off, washed with water, dried under vacuum (590 mg) and purified by column chromatography eluting with n-hexane-ethyl acetate 6:4 to give compound 8 (288 mg, 62%) as a pale oil which became a light pale solid after trituration with n-hexane-dichloromethane: mp= 122-125 °C; []20D –22.6 (c 1.0, CH2Cl2); 1H NMR (400 MHz) 7.64 (1H, dd, J = 8.4, 7.2), 7.40 (1H, d, J = 7.2), 7.17 (1H, dd, J = 8.4), 6.85 (1H, s), 6.60 (1H, s), 4.85 (1H, br s, OH), 3.99 (3H, s, CO2CH3), 3.63 (1H, d, J = 13.6), 3.48 (1H, d, J = 13.6), 3.11 (1H, sept., J = 6.8), 2.94-2.89 (2H, m), 2.25-2.18 (1H, m), 2.10 (1H, dd, J = 12.8, 2.0), 1.81-1.59 (3H, m), 1.50-1.25 (4H, m), 1.23 (3H, d, J = 6.8), 1.20 (3H, d, J = 6.8), 1.19 (3H, s), 1.02 (3H, s); 13C NMR (100 MHz) C 169.1 (s), 168.0 (s), 156.4 (s), 150.6 (s), 148.2 (s), 136.0 (d), 134.1 (s), 131.5 (s), 127.2 (s), 126.7 (d), 117.2 (s), 117.2 (d), 115.4 (d), 110.5 (d), 56.2 (q), 48.7 (t), 45.1 (d), 39.3 (s), 38.0 (t), 37.5 (s), 36.8 (t), 29.3 (t), 26.7 (d), 25.7 (q), 22.6 (q), 22.5 (q), 19.5 (t), 19.1 (q), 18.4 (t); HRMS (ESI) m/z 460.2471 [M-H] –, calcd for C29H34NO4: 460.2488; Anal. calcd. for C29H35NO4: C, 75.5; H, 7.6; N, 3.0; Found: C, 75.2; H, 7.2; N, 2.6.
12-Hydroxy-N,N-(4-methoxyphthaloyl)dehydroabietylamine (9)
A mixture of 4-methoxyphthalic anhydride (356 mg, 2.0 mmol) and 12-hydroxydehydroabietylamine [16] (300 mg, 0.99 mmol) in acetic acid (4.0 mL) was heated at reflux for 3 h, then cooled to rt and 30 mL of water was added. The resulting solid was filtered off, washed with water, dried under vacuum (170 mg) and purified by column chromatography eluting with n-hexane-ethyl acetate 6:4 to give compound 9 (80 mg, 18%) as a pale oil which became a light pale solid after trituration with n-hexane-dichloromethane: mp= 115-118 °C; []20D –24.0 (c 1.0, CH2Cl2); 1H NMR (400 MHz) 7.70 (1H, d, J = 8.0), 7.28 (1H, d, J = 2.4), 7.12 (1H, dd, J = 8.4, 2.4), 6.85 (1H, s), 6.59 (1H, s), 3.90 (3H, s, CO2CH3), 3.65 (1H, d, J = 14.0), 3.47 (1H, d, J = 14.0), 3.10 (1H, sept., J = 6.8), 2.92-2.89 (2H, m), 2.26-2.08 (2H, m), 1.82-1.61 (4H, m), 1.50-1.25 (3H, m), 1.23 (3H, d, J = 6.8), 1.21 (3H, d, J = 6.8), 1.21 (3H, s), 1.03 (3H, s); 13C NMR (100 MHz) C 169.2 (s), 169.1 (s), 164.6 (s), 150.6 (s), 148.2 (s), 134.5 (s), 131.5 (s), 127.3 (s), 126.8 (d), 124.9 (d), 123.9 (s), 119.8 (d), 110.5 (d), 107.8 (d), 56.0 (q), 48.8 (t), 45.0 (d), 39.4 (s), 38.1 (t), 37.5 (s), 36.8 (t), 29.3 (t), 26.7 (d), 25.7 (q), 22.7 (q), 22.6 (q), 19.5 (t), 19.1 (q), 18.5 (t); HRMS (ESI) m/z 460.0275 [M-H] –, calcd for C29H34NO4: 460.2488; Anal. calcd. for C29H35NO4: C, 75.5; H, 7.6; N, 3.0; Found: C, 75.1; H, 7.7; N, 2.8.
4.3. Cells
Human cell lines were incubated at 37 °C in a 5% CO2 atmosphere and maintained under sterile conditions [25]. Cells were tested for Mycoplasma (Lonza, Alpharetta, GA, USA) using the manufacturer’s conditions prior to experiments. Cell lines were purchased from American Type Culture Collection (ATCC, Manassas, VA, USA) and SUM149 was obtained from Asterand (Detroit, MI, USA) and cultured without antibiotics unless stated. Cells were cultured in DMEM, F12 or EMEM from ATCC supplemented with 10% fetal bovine serum (FBS, Hyclone, Logan, UT, USA) and 1% GlutaMAX. BJ cells were cultured in EMEM media and breast cancer cells (MDA-MB-231, MCF07) were cultured in DMEM. SUM149 was cultured in Ham’s F12 supplemented with 1% GlutaMAX,1% Pen/Step, 2 μM cortisol and 1 ug/mL insulin. Cells were grown to 80% confluence densities as recommended by ATCC.
4.4. Cell Viabiliy (CellTiterGlo) Assay
Cytotoxicity evaluation was performed using the CellTiter-Glo Luminescent Cell Viability Assay kit (G7570, Promega, Madison, WI, USA), according to the manufacturer’s instructions. Briefly, the cell concentrations used were experimentally determined to ensure logarithmic growth during the 72 h duration of the experiment and avoid adverse effects on cell growth by DMSO exposure. 1x10⁵–3x10⁵ cells/well were seeded in 96-well white flat-bottomed plates (#3610 Corning, Corning, NY, USA) in 100 mL/well. The plates were incubated at 37 °C in 5% CO2 for 24 h before drugging. Test compounds (10 mM in DMSO) in eight 2-fold serial dilutions were dispensed to assay plates. The final concentration of DMSO was 0.3% (v/v) in each well. The positive controls included staurosporine (10 μM) and/or gambogic acid (10 μM). The plates were incubated for 72 h at 37 °C in 5% CO2, then quenched with CellTiter-Glo® (Promega, Madison, WI, USA, 50 uL/well), centrifuged at 1000 rpm for 1 min and incubated at RT for 20 min. Luminescence was recorded with a plate reader (CLARIOstar Plus, BMG LabTech, Ortenberg, Germany). The mean luminescence of each experimental treatment group was normalized as a percentage of the mean intensity of untreated controls. EC50 values were calculated from dose-response curve-fitting via non-linear regression using GraphPad Prism 9.0 (GraphPad Software, San Diego, CA, USA). A therapeutic index (TI) between normal and tumor cell lines can be determined (EC50 non-neoplastic cell line BJ)/(EC50 cancer cell line).
4.5. Cell Morphology
Representative images were collected using 10x objective with a Leica DMi1 Microscope (Leica microsystems, Wetzlar, Germany). MDA-MB231 cells were imaged with a vehicle as the negative control, staurosporine as the positive control (2 μM), or compounds with results shown in representative images for 24 h.
4.6. Colony Formation Assay
MDA-MB-231(0.8x10⁶ cells/well) and SUM-149 cells (1.5X10⁶ cells/well) were plated on a 6-well plate. Two days later, cell media was changed to 5% FBS, and cells were incubated at 37 °C in a 5% CO2 atmosphere for 1 h before vehicle (0.1% DMSO) or compound (5–10μM) was added. After 72 h of treatment, cells were trypsinized and reseeded at 800 cells/mL (MDAMB231) and 1200 cells/mL (SUM149) per well in 6-well plates. After 10 days of culture, the media was removed from the wells and washed once with cold PBS. The colonies were stained with 5 mL of 1% Crystal Violet for 30 min. The dishes were fixed by methanol and rinsed with water three times, air-dried and the colonies were counted using ImageJ.
4.7. Tetramethylrhodamine Methyl Ester Perchlorate (TMRM) Assay
The TMRM assay was performed as described [19]. Briefly, SUM-149 cells (5 × 10⁵ cells/well) or MDA-MB-231 cells (2 × 10⁵ cells/well) were seeded in 6-well plates for 24h at 37 °C, 5% CO2. Cells were then treated with either vehicle (DMSO 0.2%), 20µM EP, or 20μM FCCP (24h). Processing was carried out using the Image-iT TMRM Reagent (Invitrogen, No. I34361, Carlsbad, CA, USA). FCCP was used as the positive control and was added for 10 min prior to TMRM staining. Cell culture medium was removed, and cells were washed with phosphate buffered saline (PBS), trypsinized, or resuspended in PBS supplemented with 1% FBS and analyzed by flow cytometry.
4.8. Statistical Analysis
Statistical analysis of data was performed using GraphPad Prism (Version 10.4.1 San Diego, CA, USA) and/or Microsoft Excel software (Office 2010, Microsoft Corp., Redmond, WA, USA). The statistical methods used were repeated-measures analysis of variance and Tukey’s test for paired data when appropriate.
4.9. ADMET and Drug-Likeness Analysis
The prediction of absorption, distribution, metabolism, excretion, and toxicity (ADMET) parameters and drug-like properties of the compounds was performed using the SwissADME server (http://www.swissadme.ch/, accessed on 6 February 2025)[21]. Key physicochemical parameters calculated encompassed molecular weight (MW), atom counts, and polar surface area (PSA). Lipophilicity was evaluated via iLOGP, XLOGP3, WLOGP, MLOGP, and SILICOS-IT models to generate log P octanol/water (log Po/w) values and consensus log P data. Aqueous solubility (log S) values were predicted through ESOL, Ali, and SILICOS-IT models. The pharmacokinetic descriptors examined included gastrointestinal absorption (GI), blood–brain barrier (BBB) permeability, skin permeability (log Kp), and the substrate potential of P-glycoprotein (P-gp), as well as the inhibition of five major cytochrome P450 isoforms (CYP1A2, CYP2C19, CYP2C9, CYP2D6, and CYP3A4). Compound drug-likeness was assessed through established criteria, including Lipinski, Ghose, Veber, Egan, and Muegge filters.
5. Conclusions
Our studies demonstrate that these compounds show strong efficacy against breast cancer subtypes. While the exact mechanisms underlying their activity remain to be fully elucidated, these results indicate that these specialized compounds warrant additional research, particularly to uncover the basis for their notable selectivity toward specific cancer subtypes. For instance, the diketone system in compounds 10-11 exhibited notable effectiveness against SUM149 cell line. While compounds 11-12 exhibited comparable bioactivity profiles across the tested cell lines, compound 13 showed minimal activity.
There is an inherent consistency for the compounds between cytotoxicity with functional assays such as colony formation, which further validate their promise in the field of solid tumor. Examination of the abietane molecular scaffold reveals it provides a robust structural platform with nuanced features that influence biological activity. More significant structural modifications, such as those seen in compounds 6-8 which feature a less oxidized C ring and incorporate a phthalimide group on the A ring, consistently demonstrate pronounced biological effects across multiple experimental systems—from cell viability assessments to colony formation inhibition studies in various cellular models.
Supplementary Materials
The following supporting information can be downloaded at: www.mdpi.com/xxx/s1, Figure S1-S6: copies of 1H, 13C, and DEPT NMR spectra of 8, 9; Pages: S7-S19: ADMET data of compounds 1-13; Table S1, page S20: pharmacokinetic parameters of compounds 1-13.
Author Contributions
Conceptualization, M.A.G.-C., F.R.; methodology, M.A.G.-C. F.R.; validation, F.R.; formal analysis, M.A.G.-C. and F.R.; investigation, M.A.G.-C., W.E.M.-H., S.L.L. and F.R.; resources, M.A.G.-C., F.R.; writing—original draft preparation, M.A.G.-C.; writing—review and editing, M.A.G.-C., F.R., W.E.M.-H., S.L.L.; funding acquisition, M.A.G.-C., F.R. All authors have read and agreed to the published version of the manuscript.
Funding
This research was partially funded by Louisiana Board of Regents Support Fund Award LEQSF-RD-A-05, NIGMS grant number R15 GM148983 to F.R and the Beckman Scholars Award to S.L.L. The authors thank the Spanish Government (Project CEX2021-001230-S funded by MCIN/AEI /10.13039/501100011033 /FEDER, UE) for financial support. This research was supported by the regional government “Generalitat Valenciana, Conselleria de Educación, Universidades y Empleo”, grant number CIAICO/2022/220 to M.A.G.-C.
Institutional Review Board Statement
Not applicable.
Informed Consent Statement
Not applicable.
Data Availability Statement
The data is available in the manuscript and the supporting information of this article.
Acknowledgments
We acknowledge the support given by the characterization department of the “Instituto de Tecnologia Quimica, ITQ” for providing the NMR, elemental composition and high-resolution mass spectra (through Universitat de Valencia) of the samples.
Conflicts of Interest
The authors declare no conflicts of interest.
References
- Bray, F.; Laversanne, M.; Sung, H.; Ferlay, J.; Siegel, R.L.; Soerjomataram, I.; Jemal, A. Global cancer statistics 2022: GLOBOCAN estimates of incidence and mortality worldwide for 36 cancers in 185 countries. CA Cancer J. Clin. 2024, 74, 229–263. [Google Scholar] [CrossRef] [PubMed]
- Guida, F.; Kidman, R.; Ferlay, J.; et al. Global and regional estimates of orphans attributed to maternal cancer mortality in 2020. Nat. Med. 2022, 28, 2563–2572. [Google Scholar] [CrossRef] [PubMed]
- Vagia, E.; Mahalingam, D.; Cristofanilli, M. The Landscape of Targeted Therapies in TNBC. Cancers 2020, 12, 916. [Google Scholar] [CrossRef]
- Newman, D. J.; Cragg, G. M. Natural Products as Sources of New Drugs over the Nearly Four Decades from 01/1981 to 09/2019. J. Nat. Prod. 2020, 83, 770–803. [Google Scholar] [CrossRef]
- Sargazifar, Z.; Charami, D.G.; Kashi, M.E.; Asili, J.; Shakeri, A. Abietane-Type Diterpenoids: Insights into Structural Diversity and Therapeutic Potential. Chem. Biodiversity 2024, 21, e202400808. [Google Scholar] [CrossRef] [PubMed]
- González, M.A. Aromatic abietane diterpenoids: their biological activity and synthesis. Nat. Prod. Rep. 2015, 32, 684–704. [Google Scholar] [CrossRef]
- Ahmad, B.; Tian, C.; Tang, J.-X.; Dumbuya, J.S.; Li, W.; Lu, J. Anticancer activities of natural abietic acid. Front. Pharmacol. 2024, 15, 1392203. [Google Scholar] [CrossRef]
- Chan, E.W.C.; Wong, S.K.; Chan, H.T. Ferruginol and Sugiol: A Short Review of their Chemistry, Sources, Contents, Pharmacological Properties and Patents. Trop. J. Nat. Prod. Res. TJNPR 2023, 7, 2325–2336. [Google Scholar] [CrossRef]
- Shao, L.; González-Cardenete, M.A.; Prieto-Garcia, J.M. In Vitro Cytotoxic Effects of Ferruginol Analogues in Sk-MEL28 Human Melanoma Cells. Int. J. Mol. Sci. 2023, 24, 16322. [Google Scholar] [CrossRef]
- Shahrokhi, H.; Asili, J.; Tayarani-najaran, Z.; Boozari, M. Signaling pathways behind the biological effects of tanshinone IIA for the prevention of cancer and cardiovascular diseases. Naunyn-Schmiedeberg’s Archives of Pharmacology 2025, in press. [Google Scholar] [CrossRef]
- Alsamri, H.; Al Dhaheri, Y.; Iratni, R. Targeting Triple-Negative Breast Cancer by the Phytopolyphenol Carnosol: ROS-Dependent Mechanisms. Antioxidants 2023, 12, 1349. [Google Scholar] [CrossRef] [PubMed]
- Kroemer, G.; Pouyssegur, J. Tumor cell metabolism: cancer’s Achilles’ heel. Cancer Cell 2008, 13, 472–482. [Google Scholar] [CrossRef]
- González-Cardenete, M.A.; González-Zapata, N.; Boyd, L.; Rivas, F. Discovery of Novel Bioactive Tanshinones and Carnosol Analogues against Breast Cancer. Cancers 2023, 15, 1318. [Google Scholar] [CrossRef] [PubMed]
- González, M. A.; Pérez-Guaita, D. Short syntheses of (+)-ferruginol from (+)-dehydroabietylamine. Tetrahedron 2012, 68, 9612–9615. [Google Scholar] [CrossRef]
- González-Cardenete, M.A.; Hamulić, D.; Miquel-Leal, F.J.; González-Zapata, N.; Jimenez-Jarava, O.J.; Brand, Y.M.; Restrepo-Mendez, L.C.; Martinez-Gutierrez, M.; Betancur-Galvis, L.A.; Marín, M.L. Antiviral Profiling of C-18- or C-19-Functionalized Semisynthetic Abietane Diterpenoids. J. Nat. Prod. 2022, 85, 2044–2051. [Google Scholar] [CrossRef]
- Varbanov, M.; Philippot, S.; González-Cardenete, M.A. Anticoronavirus Evaluation of Antimicrobial Diterpenoids: Application of New Ferruginol Analogues. Viruses 2023, 15, 1342. [Google Scholar] [CrossRef] [PubMed]
- Hamulić, D.; Stadler, M.; Hering, S.; Padrón, J.M.; Bassett, R.; Rivas, F.; Loza-Mejía, M.A.; Dea-Ayuela, M.A.; González-Cardenete, M.A. Synthesis and Biological Studies of (+)-Liquiditerpenoic Acid A (Abietopinoic Acid) and Representative Analogues: SAR Studies. J. Nat. Prod. 2019, 82, 823–831. [Google Scholar] [CrossRef]
- Riss, T.L.; Moravec, R.A.; Niles, A.L., et al. Cell Viability Assays. 2013 May 1 [Updated 2016 Jul 1]. In: Markossian S, Grossman A, Baskir H, et al., editors. Assay Guidance Manual [Internet]. Bethesda (MD): Eli Lilly & Company and the National Center for Advancing Translational Sciences; 2004-. Available online: https://www.ncbi.nlm.nih.gov/books/NBK144065/.
- Ling, T.; Lang, W. H.; Craig, J.; Potts, M. B.; Budhraja, A.; Opferman, J.; Bollinger, J.; Maier, J.; Marsico, T. D.; Rivas, F. Studies of Jatrogossone A as a Reactive Oxygen Species Inducer in Cancer Cellular Models. J. Nat. Prod. 2019, 82, 1301–1311. [Google Scholar] [CrossRef]
- Ling, T.; Lang, W.H.; Maier, J.; Quintana Centurion, M.; Rivas, F. Cytostatic and Cytotoxic Natural Products against Cancer Cell Models. Molecules 2019, 24, 2012. [Google Scholar] [CrossRef]
- Daina, A.; Michielin, O.; Zoete, V. SwissADME: a free web tool to evaluate pharmacokinetics, drug-likeness and medicinal chemistry friendliness of small molecules. Sci Rep 2017, 7, 42717. [Google Scholar] [CrossRef]
- Lipinski, C. A.; Lombardo, F.; Dominy, B.W.; Feeney, P. J. Experimental and computational approaches to estimate solubility and permeability in drug discovery and development settings. Adv. Drug Deliv. Rev. 1997, 23, 3–25. [Google Scholar] [CrossRef]
- Gigante, B.; Santos, C.; Silva, A. M.; Curto, M. J. M.; Nascimento, M. S. J.; et al. Catechols from Abietic acid: synthesis and evaluation as bioactive compounds. Bioorg. Med. Chem. 2003, 11, 1631–1638. [Google Scholar] [CrossRef] [PubMed]
- Miyajima, Y.; Saito, Y.; Takeya, M.; Goto, M.; Nakagawa-Goto, K. Synthesis of 4-epi-parviflorons A, C, and E: structure-activity relationship study of antiproliferative abietane derivatives. J. Org. Chem. 2019, 84, 3239–3248. [Google Scholar] [CrossRef] [PubMed]
- Hay, R.J.; Caputo, J.L.; Macy, M.L. ATCC Quality Control Methods for Cell Lines, 2nd ed.; ATCC: Manassas, VA, USA, 1992. [Google Scholar]
- González, M. A. Synthetic derivatives of aromatic abietane diterpenoids and their biological activities. Eur. J. Med. Chem. 2014, 87, 834–842. [Google Scholar] [CrossRef]
- Antoniuk, O.; Maranha, A.; Salvador, J.A.R.; Empadinhas, N.; Moreira, V.M. Bi- and tricyclic diterpenoids: Landmarks from a decade (2013–2023) in search of leads against infectious diseases. Nat. Prod. Rep. 2024, 21, 1858–1894. [Google Scholar] [CrossRef]
- Kang, J.; Le, T.Q.; Oh, C.H. Recent Advances in Abietane/Icetexane Synthesis. Tetrahedron Lett. 2022, 108, 154133. [Google Scholar] [CrossRef]
- Roa-Linares, V.C.; Betancur-Galvis, L.A.; González-Cardenete, M.A.; Garcia-Blanco, M.A.; Gallego-Gomez, J.C. Broad-spectrum antiviral ferruginol analog affects the viral proteins translation and actin remodeling during dengue virus infection. Antiviral Research 2025, 237, 106139. [Google Scholar] [CrossRef] [PubMed]
- Bisio, A.; Pedrelli, F.; D’Ambola, M.; Labanca, F.; Schito, A.M.; Govaerts, R.; De Tommasi, N. Quinone diterpenes from Salvia species: chemistry, botany, and biological activity. Phytochem. Rev. 2019, 18, 665–842. [Google Scholar] [CrossRef]
- Ait El Had, M.; Zentar, H.; Ruiz-Muñoz, B.; Sainz, J.; Guardia, J.J.; Fernández, A.; Justicia, J.; Alvarez-Manzaneda, E.; Reyes-Zurita, F.J.; Chahboun, R. Evaluation of Anticancer and Anti-Inflammatory Activities of Some Synthetic Rearranged Abietanes. Int. J. Mol. Sci. 2023, 24, 13583. [Google Scholar] [CrossRef]
Figure 1.
Examples of bioactive abietanes and tested compounds 1,2 and 5-13.
Scheme 1.
Synthetic sequence for the preparation of tested compounds 1,2 and 5-15.
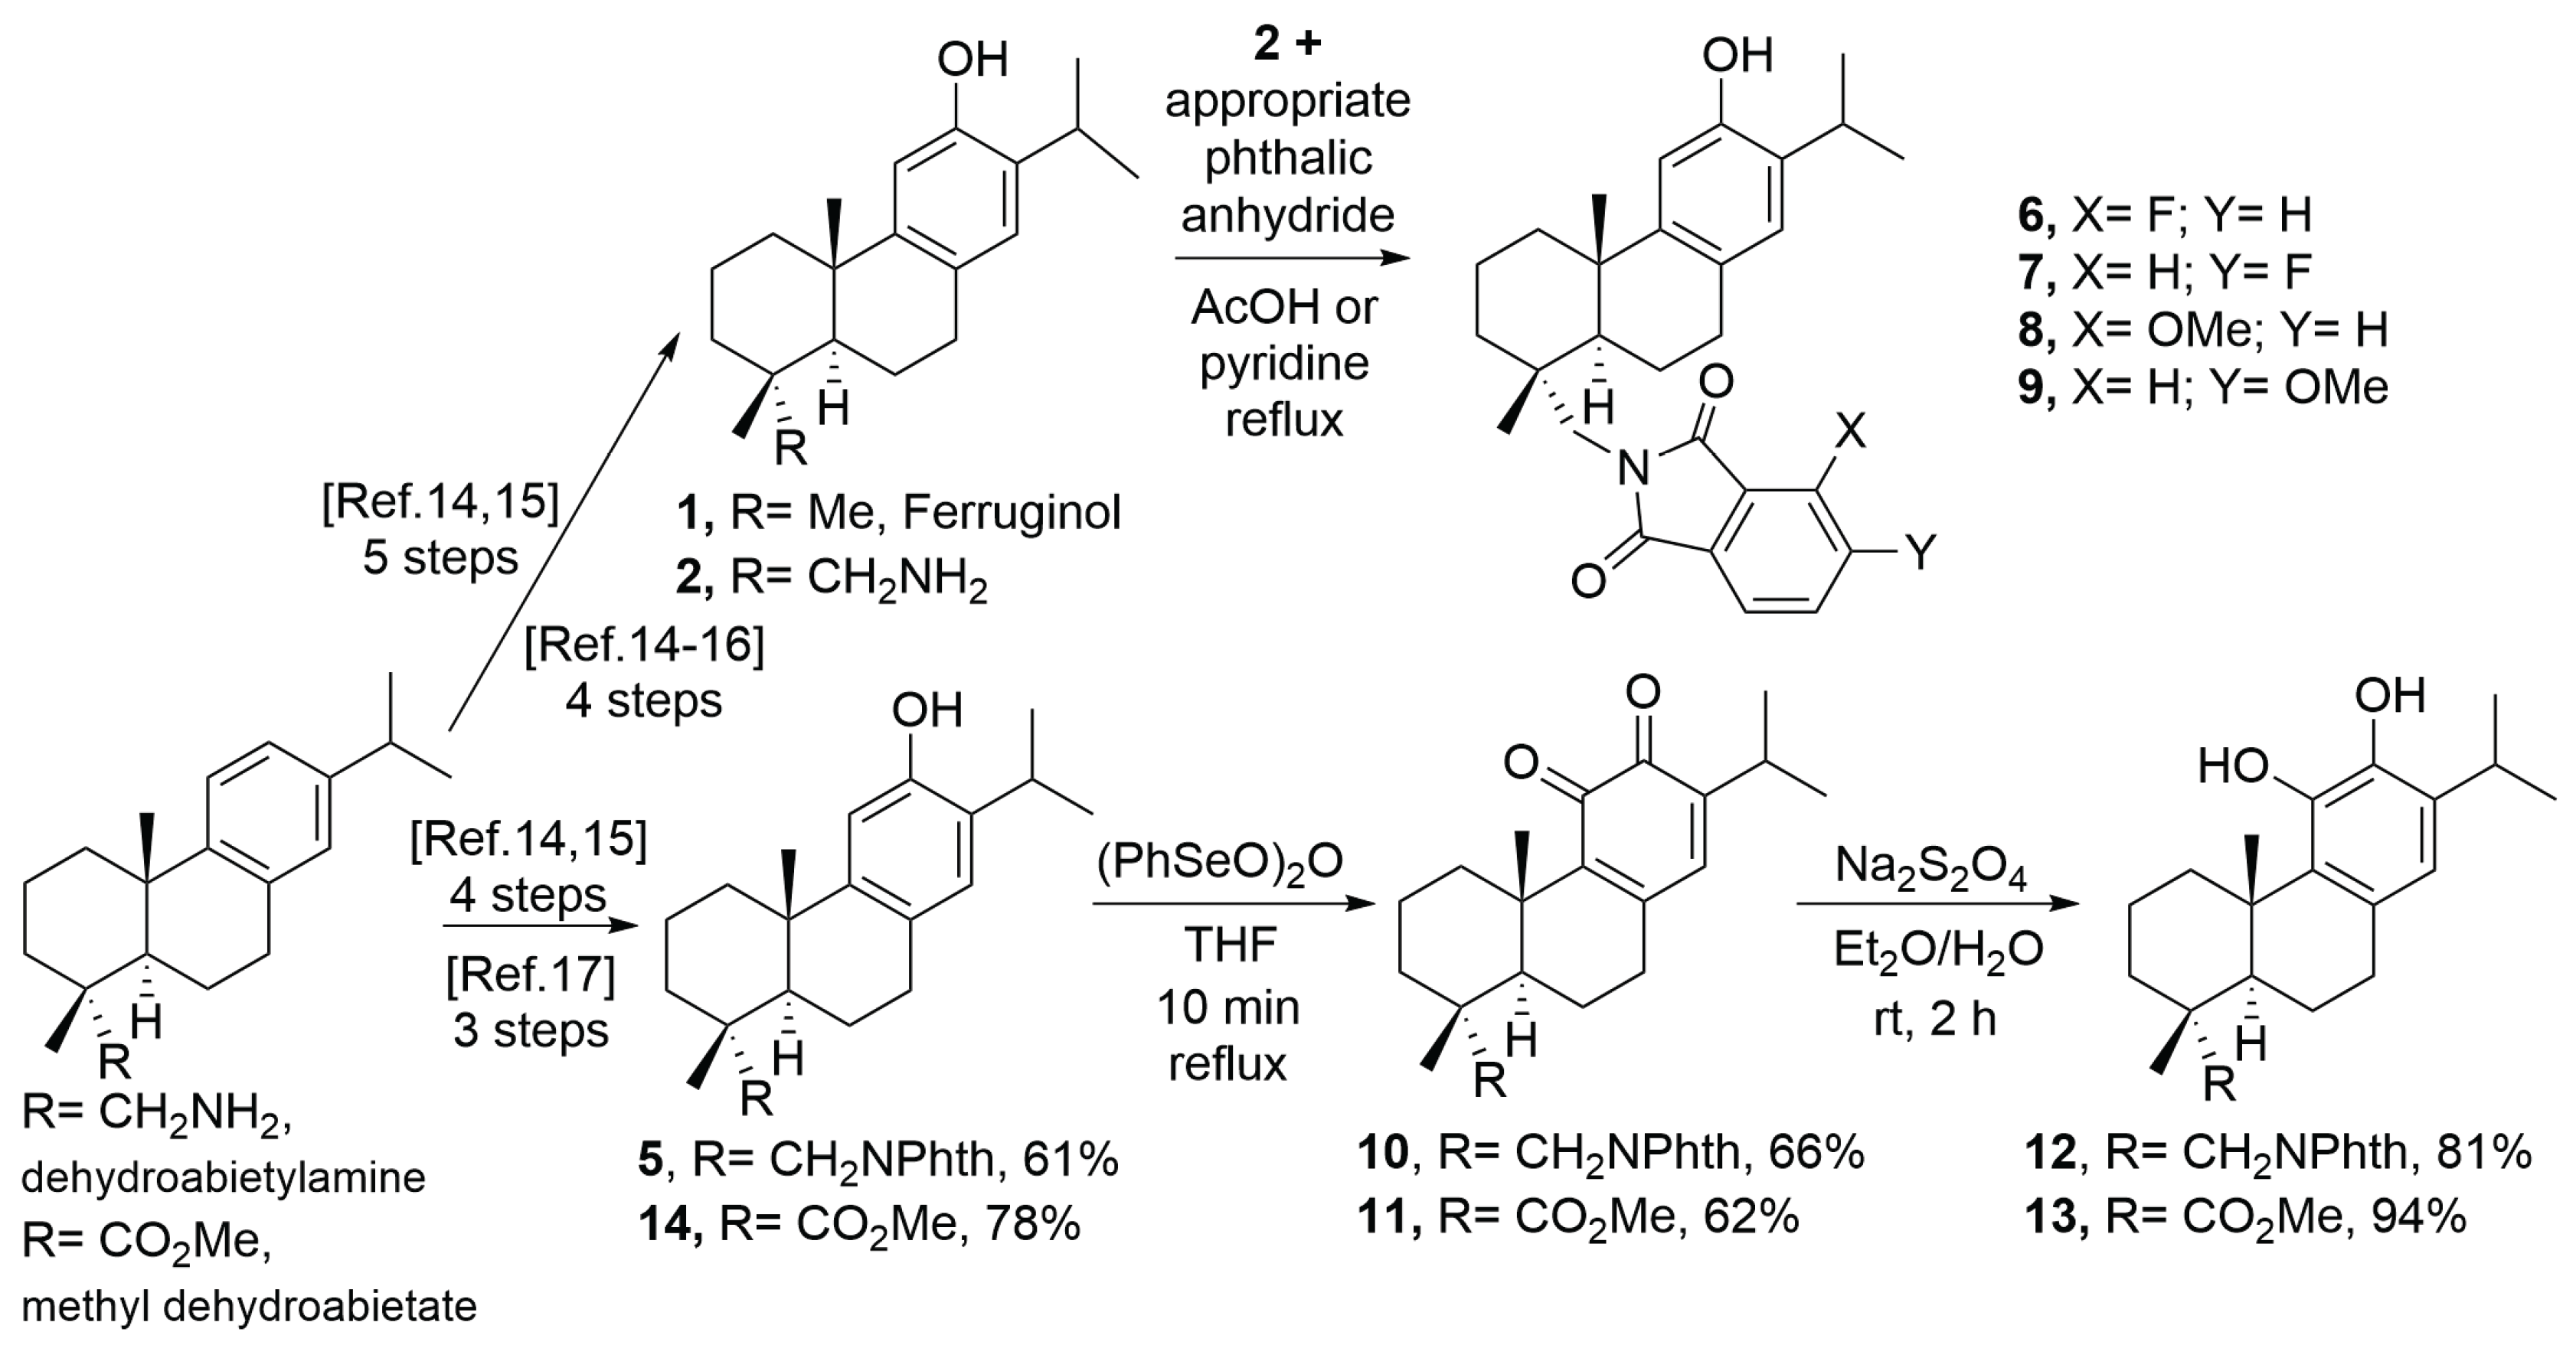
Figure 8.
Relative TMRM mitochondrial % depolarization quantification of SUM149 cell model at two different time points for compound 1-2, 6-13 at 5 or 10 μM. A. after 24 h treatment. B. 48 h treatment. DMSO (Vehicle, 0.1%). Positive control, FCCP (5 or 10 μM, treatment for 30 min).
Figure 8.
Relative TMRM mitochondrial % depolarization quantification of SUM149 cell model at two different time points for compound 1-2, 6-13 at 5 or 10 μM. A. after 24 h treatment. B. 48 h treatment. DMSO (Vehicle, 0.1%). Positive control, FCCP (5 or 10 μM, treatment for 30 min).
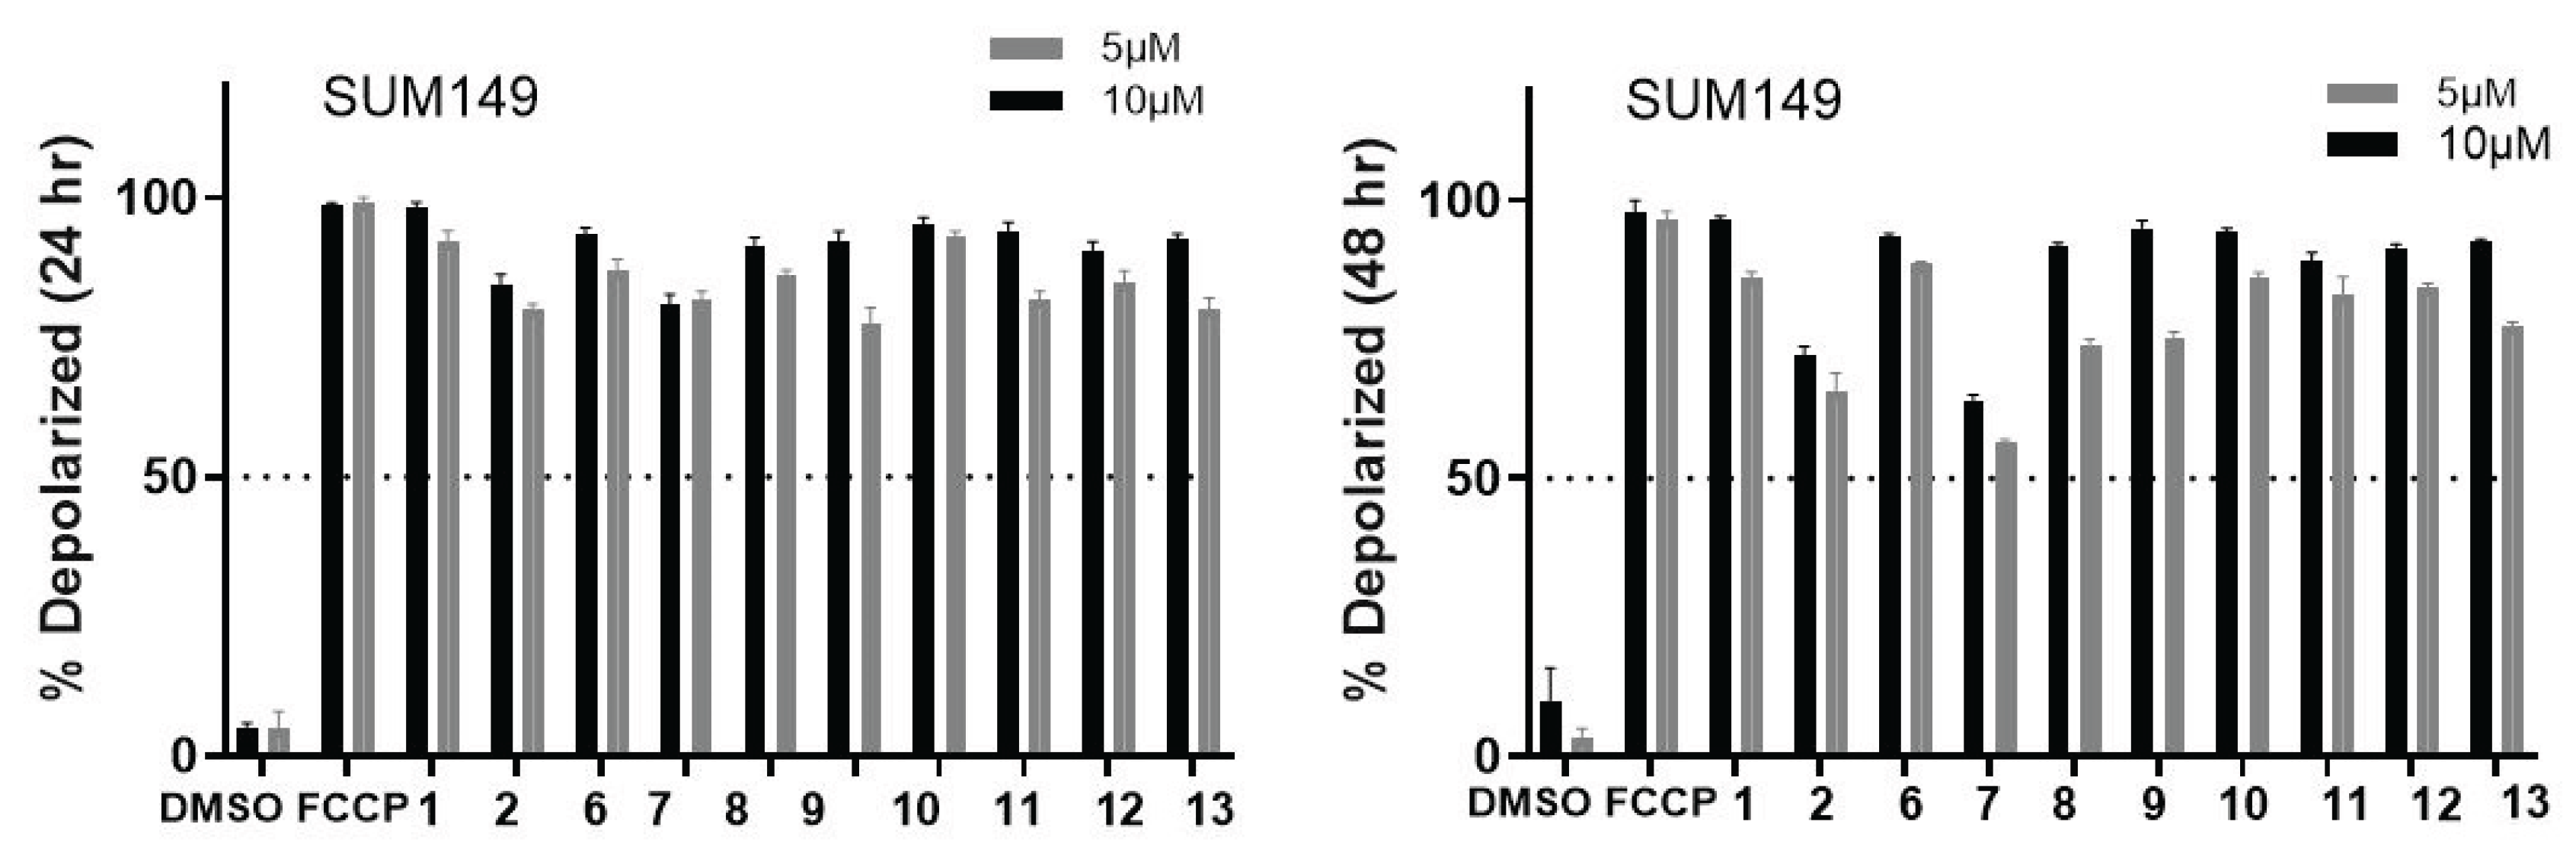
Figure 9.
Fluorescence microscopy image showing TMRM-stained SUM149 breast cancer cells at 4X magnification after 24 h of treatment, demonstrating significant mitochondrial membrane potential loss in treated cells with increasing concentration-dependent effects. A. DMSO. B. FCCP (10 μM, after 30 min treatment). C. Compound 1 (5 μM) D. Compound 1 (10 μM) E. Compound 6 (5 μM) F. Compound 6 (10 μM).
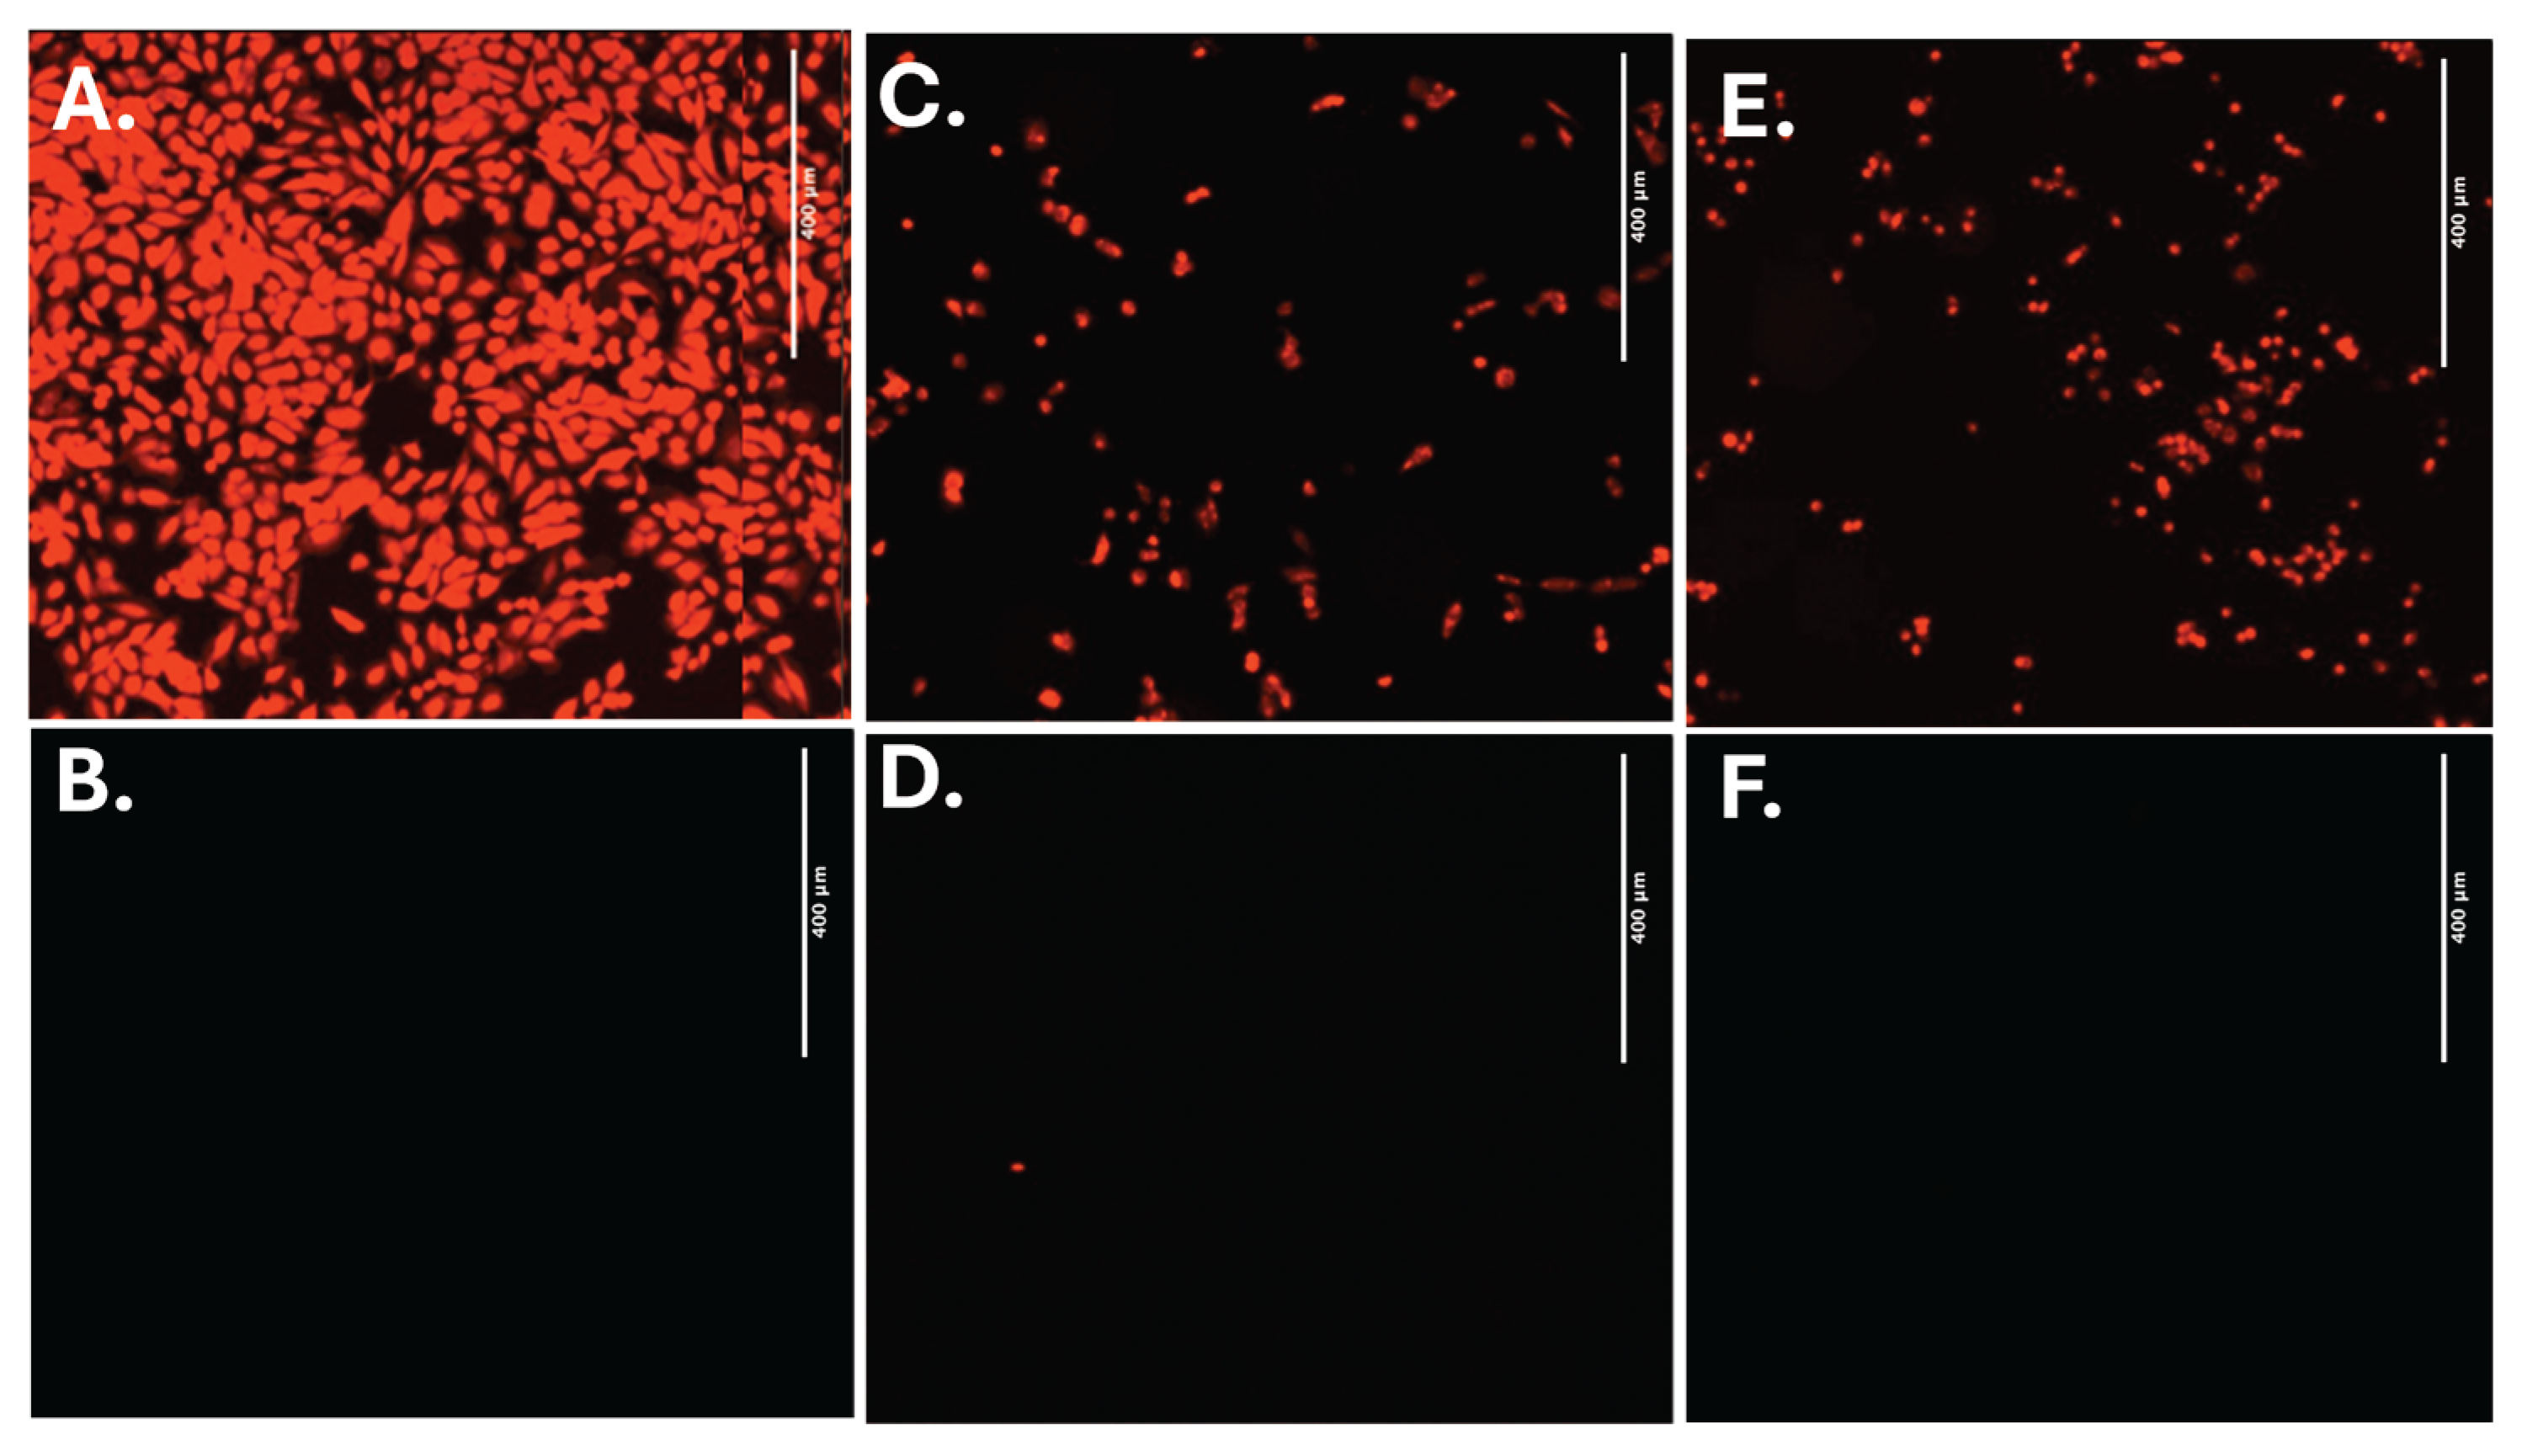
Figure 10.
Relative TMRM mitochondrial % depolarization quantification of MDA-MB-231 cell model at two different time points for compound 1-2, 6-13 at 5 or 10 μM. A. after 24 h treatment. B. 48 h treatment. DMSO (Vehicle, 0.1%). Positive control, FCCP (5 or 10 μM, treatment for 30 min).
Figure 10.
Relative TMRM mitochondrial % depolarization quantification of MDA-MB-231 cell model at two different time points for compound 1-2, 6-13 at 5 or 10 μM. A. after 24 h treatment. B. 48 h treatment. DMSO (Vehicle, 0.1%). Positive control, FCCP (5 or 10 μM, treatment for 30 min).
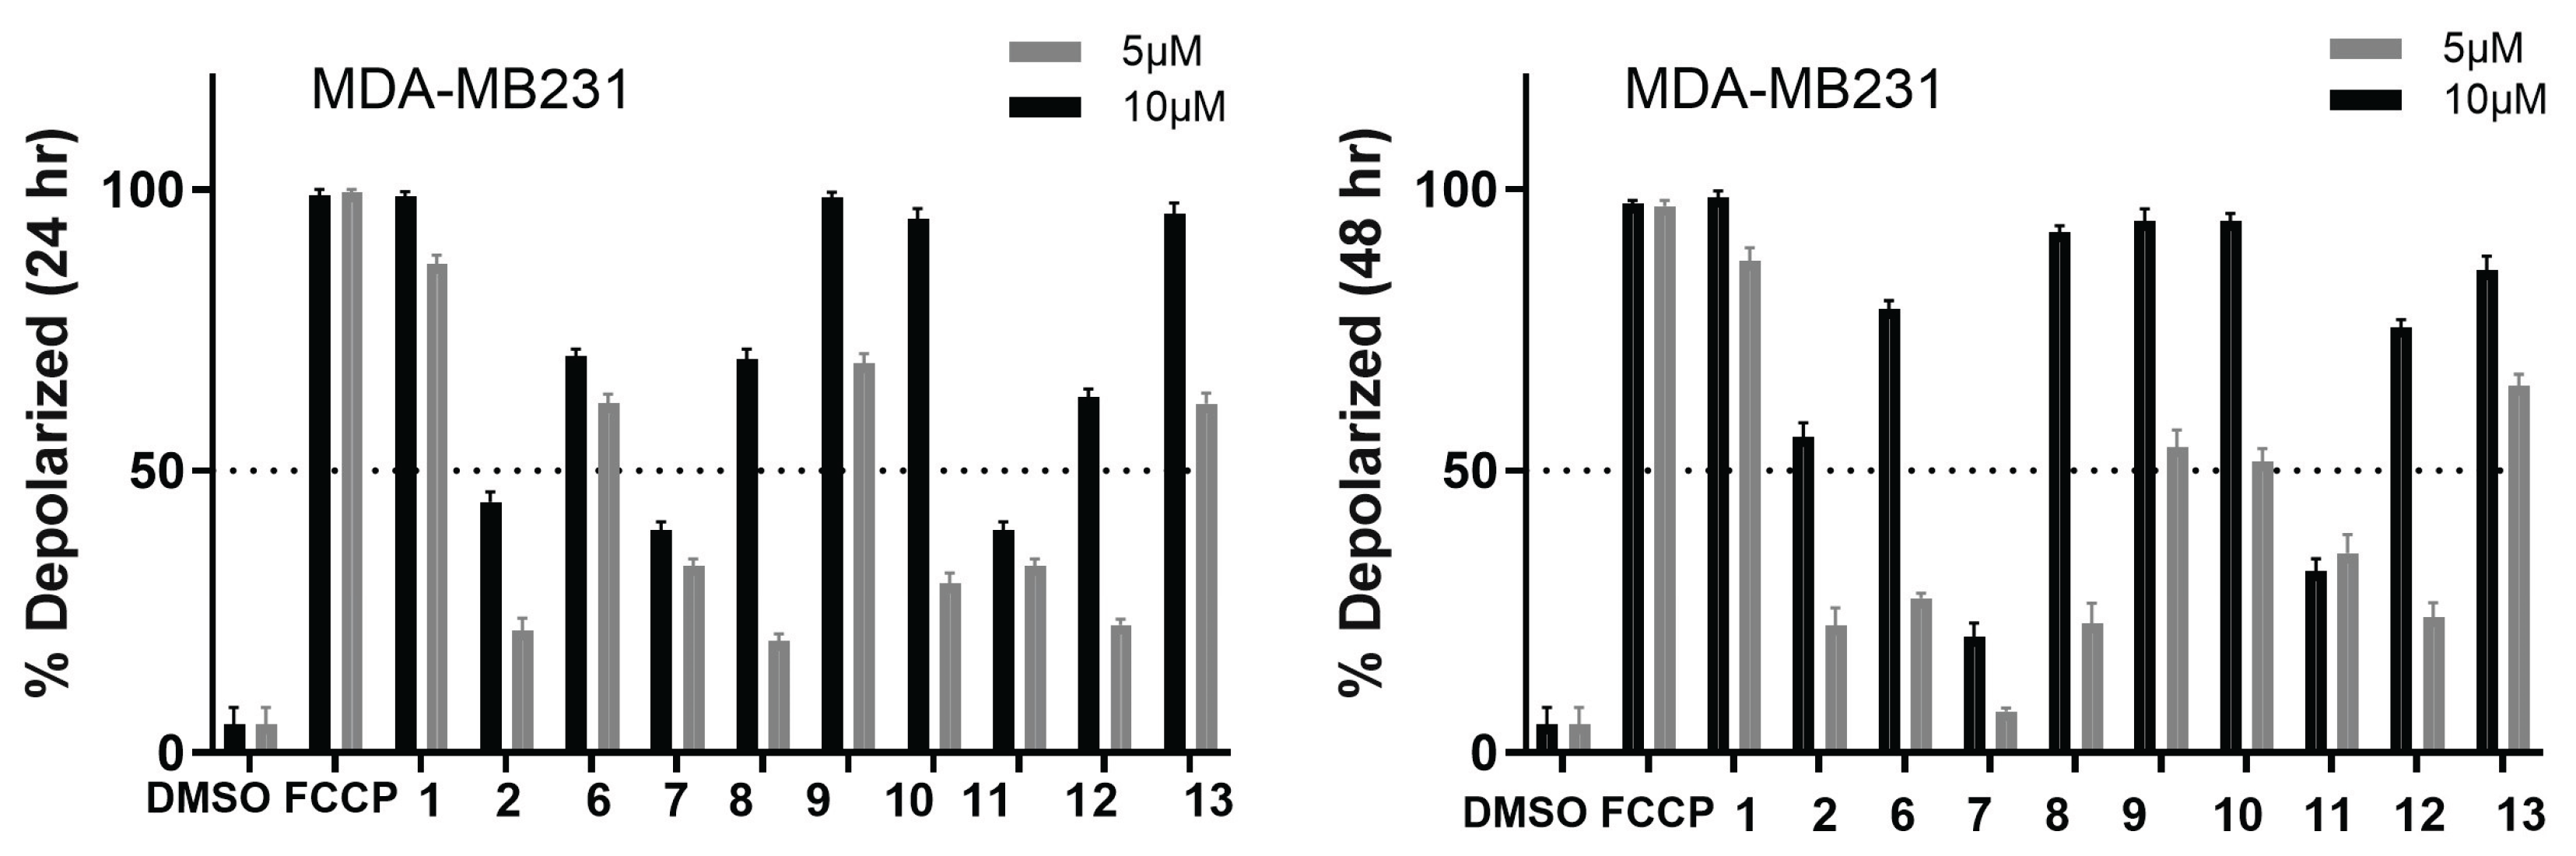
Figure 11.
Fluorescence microscopy image showing TMRM-stained MDA-MB-231 breast cancer cells at 4X magnification after 24 h of treatment, demonstrating significant mitochondrial membrane potential loss in treated cells with increasing concentration-dependent effects. A. DMSO. B. FCCP (10 μM, 30 min). C. Compound 1 (5 μM) D. Compound 1 (10 μM) E. Compound 6 (5 μM) F. Compound 6 (10 μM).
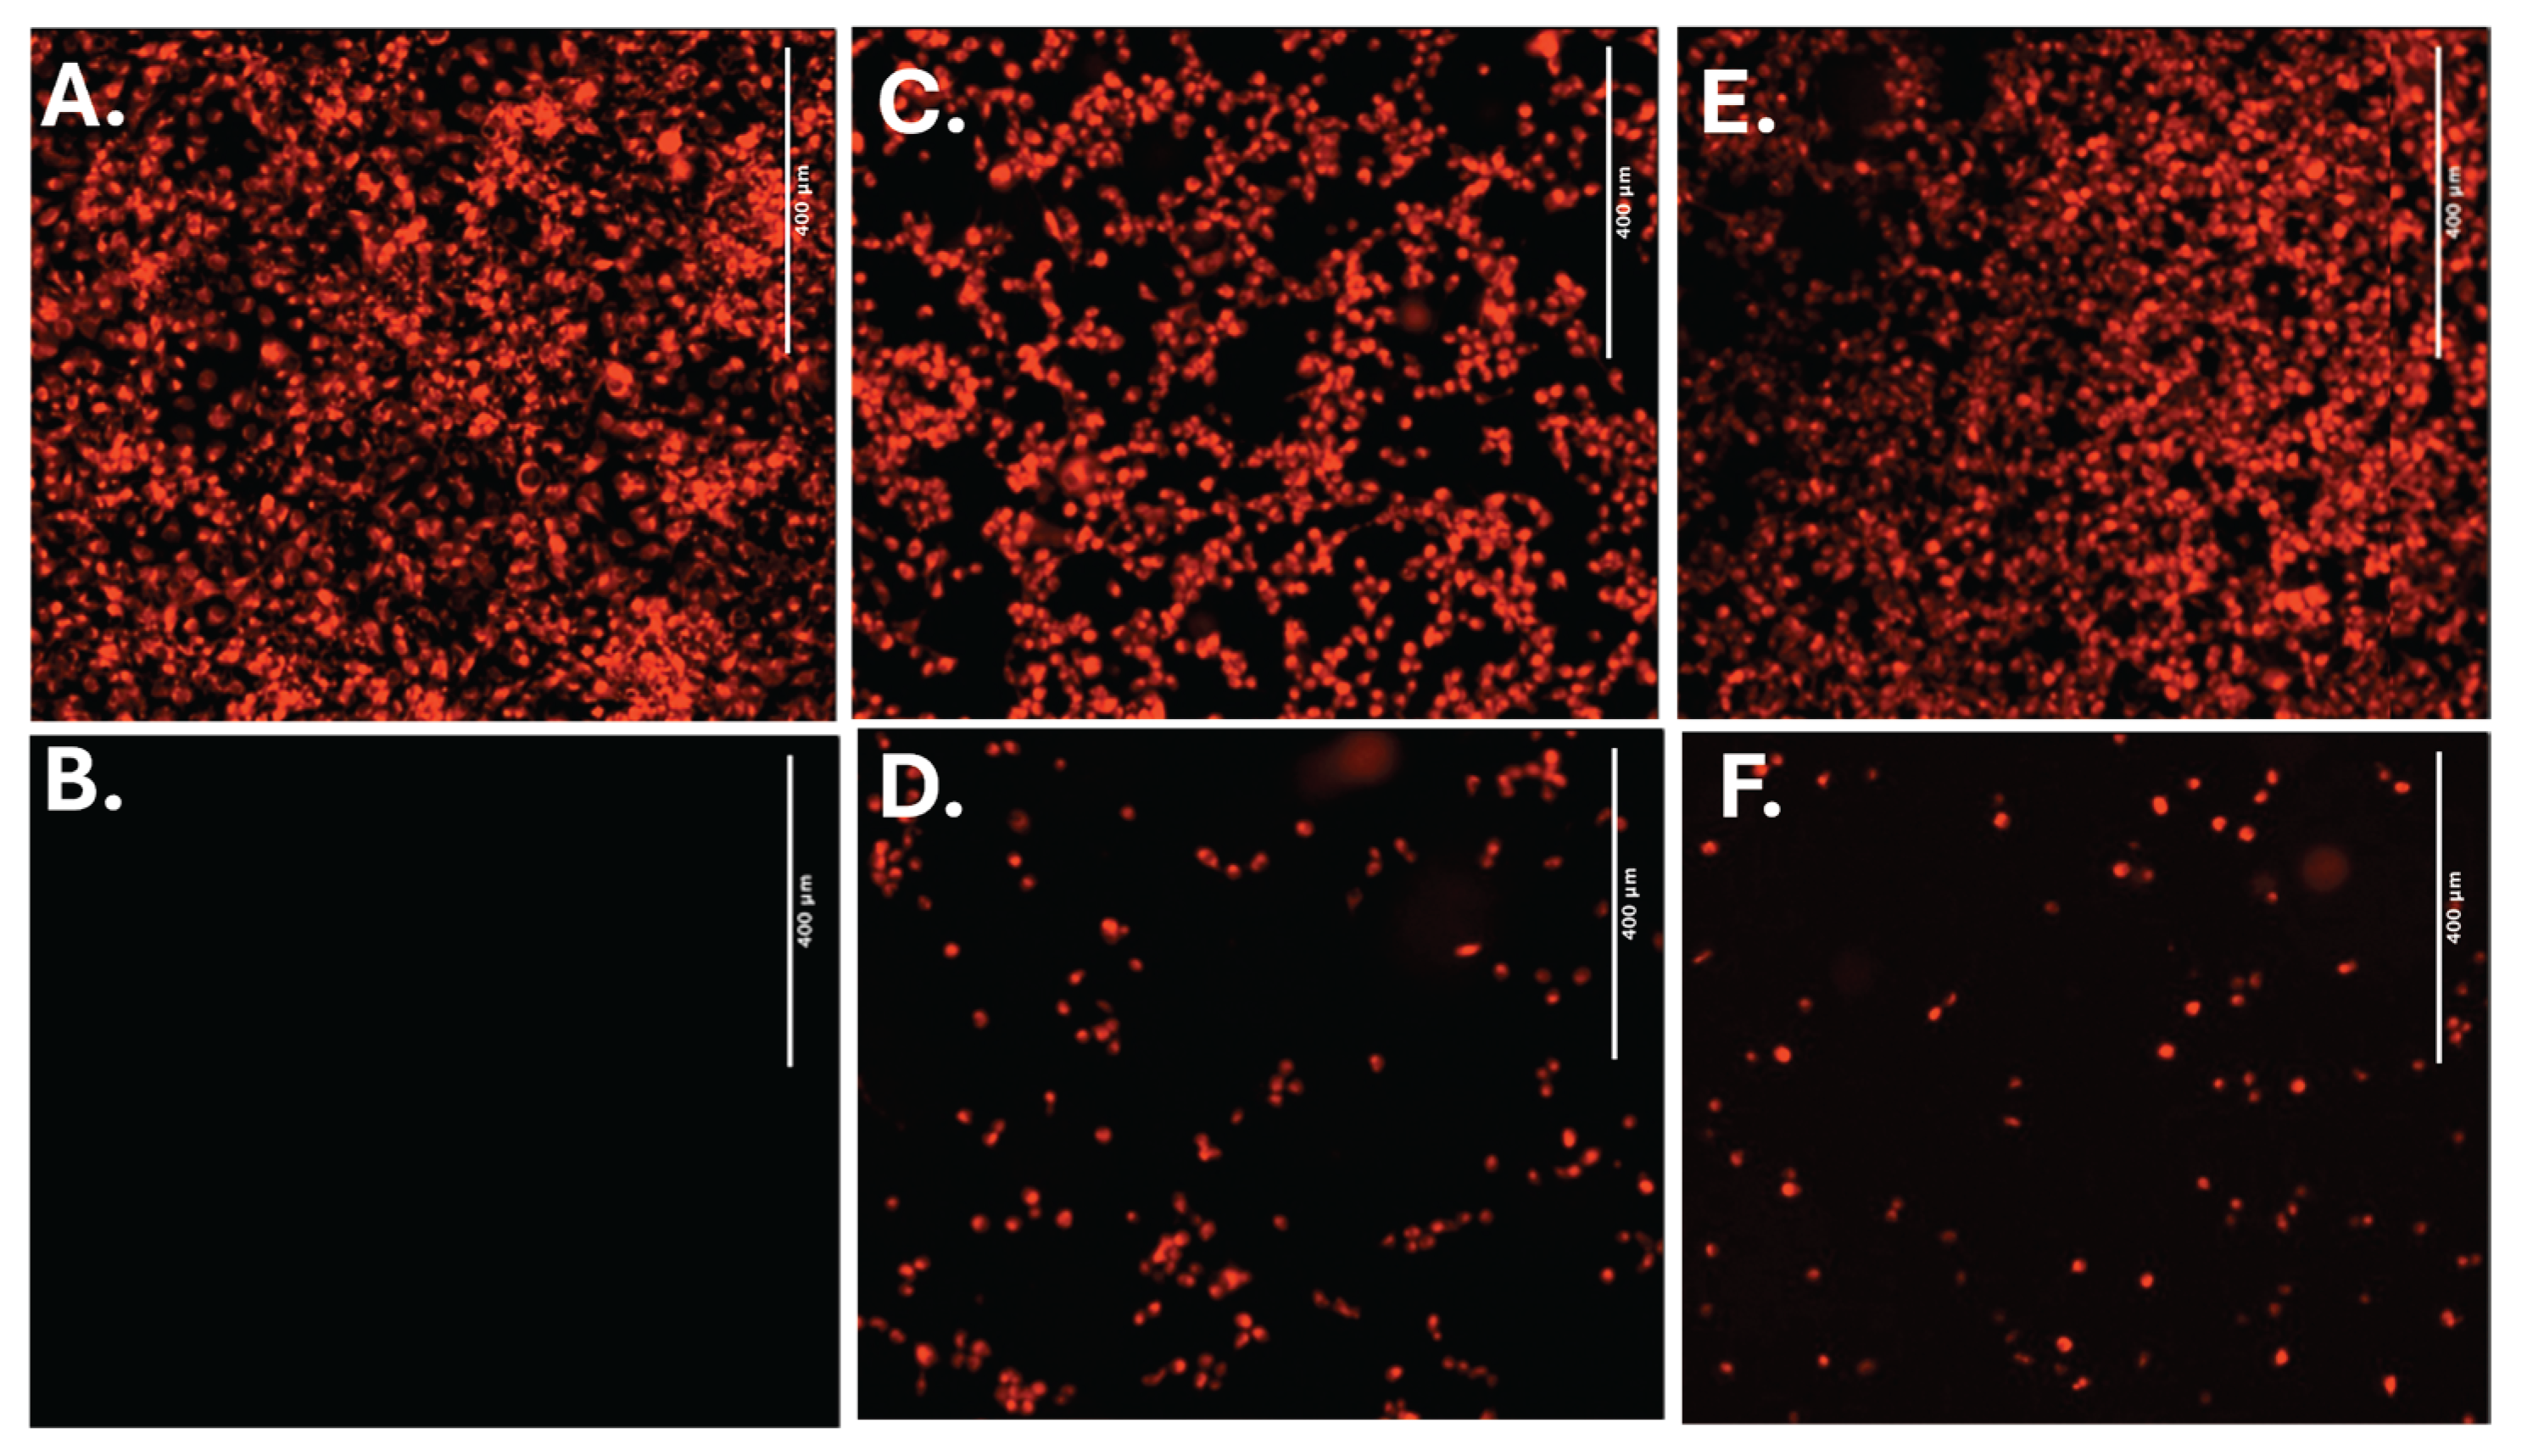
Figure 12.
Brightfield microscopy images of MDA-MB-231 breast cancer cells at 10X magnification following 24 h of treatment, showing morphological changes characteristic of early-stage apoptosis. A. DMSO. B. STS (5 μM). C. Compound 1 (5 μM). D. Compound 6 (5 μM). E. Compound 10 (10 μM).
Figure 12.
Brightfield microscopy images of MDA-MB-231 breast cancer cells at 10X magnification following 24 h of treatment, showing morphological changes characteristic of early-stage apoptosis. A. DMSO. B. STS (5 μM). C. Compound 1 (5 μM). D. Compound 6 (5 μM). E. Compound 10 (10 μM).
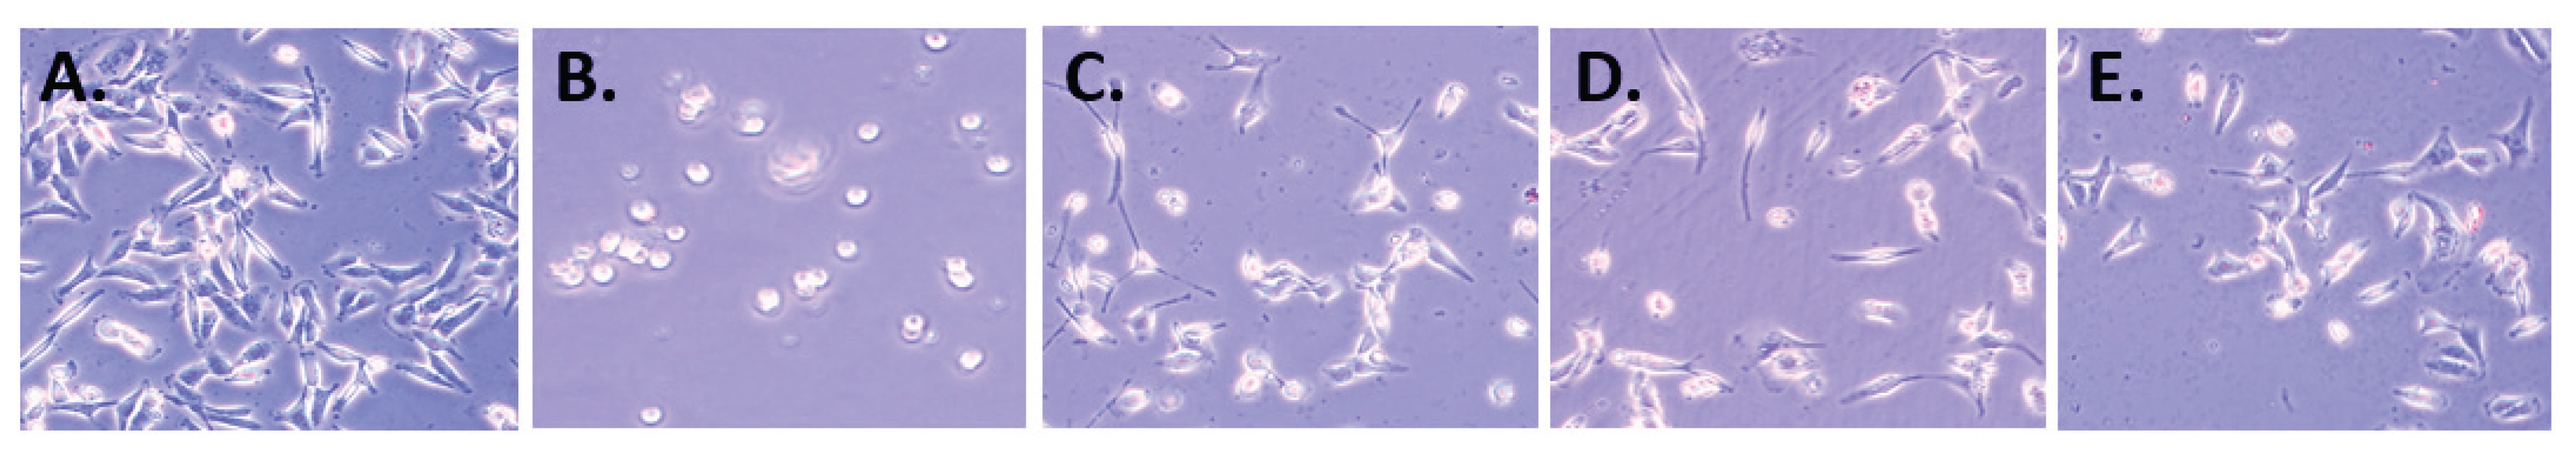

Table 1.
Cytotoxicity (IC50 in µM) of semisynthetic abietanes 1-2, and 5-13 after 72 hours of incubation. a.
Table 1.
Cytotoxicity (IC50 in µM) of semisynthetic abietanes 1-2, and 5-13 after 72 hours of incubation. a.
| Compound | SUM149 | TI | MDA-MB231 | TI | MCF07 | TI | BJ |
|---|---|---|---|---|---|---|---|
| 1b | >50 | >1 | 8.3 ± 1.4 | >6 | 19.0 ± 1.5 | >3 | >50 |
| 2b | 4.4 ± 0.3 | 17 | 5.1 ± 0.6 | 15 | 10.0 ± 1.5 | 7 | 75.0 ± 6.2 |
| 5b | 4.4 ± 0.2 | 17 | 8.2 ± 0.5 | 9 | 13.0 ± 0.6 | 6 | 74.8 ± 5.3 |
| 6 | 4.8 ± 0.2 | 13 | 9.4 ± 0.9 | 7 | 5.4 ± 0.6 | 12 | 63.5 ± 6.3 |
| 7 | 4.3 ± 0.1 | >12 | 7.6 ± 0.2 | >7 | 7.0 ± 0.6 | >7 | >50 |
| 8 | 5.3 ± 0.1 | 12 | 54.6 ± 5.0 | ≈1 | 11.0 ± 1.4 | 6 | 61.2 ± 5.4 |
| 9 | 4.3 ± 0.2 | 14 | 8.2 ± 0.8 | 7 | 12.0 ± 1.2 | 5 | 58.9 ± 5.7 |
| 10b | 1.5 ± 0.4 | 24 | 2.8 ± 0.4 | 13 | 2.3 ± 1.1 | 15 | 35.4 ± 5.0 |
| 11b | 1.3 ± 0.6 | 43 | 3.9 ± 0.8 | 15 | 8.3 ± 0.9 | 7 | 56.5 ± 6.1 |
| 12b | 1.8 ± 0.2 | 18 | 2.8 ± 0.2 | 12 | 4.6 ± 0.6 | 7 | 32.5 ± 5.0 |
| 13b | >50 | ≈1 | 9.4 ± 0.4 | 6 | >50 | ≈1 | 57.6 ± 3.0 |
aCells were treated with compounds for 72 h. Cytotoxicity was determined as the IC50 values calculated from the percentage of viable cells remaining at 72 h, measured with CellTiter-Glo reagent. The IC50 values are indicated as the mean ± SD of at least three independent experiments. TI: Therapeutic index = (EC50 non-neoplastic cell line BJ) ⁄ (EC50 cancer cell line); b Values taken from reference [13].
Table 2.
Physicochemical and molecular properties (drug-likeness) by SWISSADME Online software for compounds 1-13.a,b.
Table 2.
Physicochemical and molecular properties (drug-likeness) by SWISSADME Online software for compounds 1-13.a,b.
| Compound | Consensus Log P | MW | n-HBA | n-HBD | TPSA | Lipinski’s violation |
|---|---|---|---|---|---|---|
| 1 | 5.50 | 286.45 | 1 | 1 | 20.23 | 1 |
| 2 | 4.65 | 301.47 | 2 | 2 | 46.25 | 0 |
| 3 | 5.37 | 294.34 | 3 | 0 | 47.28 | 1 |
| 4 | 4.05 | 330.42 | 4 | 2 | 66.76 | 0 |
| 5 | 6.00 | 431.57 | 3 | 1 | 57.61 | 1 |
| 6 | 6.42 | 449.56 | 4 | 1 | 57.61 | 1 |
| 7 | 6.42 | 449.56 | 4 | 1 | 57.61 | 1 |
| 8 | 6.08 | 461.59 | 4 | 1 | 66.84 | 1 |
| 9 | 6.08 | 461.59 | 4 | 1 | 66.84 | 1 |
| 10 | 5.51 | 445.55 | 4 | 0 | 71.52 | 1 |
| 11 | 4.48 | 344.44 | 4 | 0 | 60.44 | 0 |
| 12 | 5.52 | 447.57 | 4 | 2 | 77.84 | 1 |
| 13 | 4.50 | 346.46 | 4 | 2 | 66.76 | 0 |
| Rule of five | not >5 | <500 | not >10 | not >5 | 1 violation allowed |
a Values were calculated using SwissADME software (http://www.swissadme.ch). b consensusLogP= consensus log partition coefficient; MW= Molecular weight; n-HBA= number of hydrogen bond accepting groups; n-HBD= number of hydrogen bond donating groups; TPSA= Total polar surface area.
Disclaimer/Publisher’s Note: The statements, opinions and data contained in all publications are solely those of the individual author(s) and contributor(s) and not of MDPI and/or the editor(s). MDPI and/or the editor(s) disclaim responsibility for any injury to people or property resulting from any ideas, methods, instructions or products referred to in the content. |
© 2025 by the authors. Licensee MDPI, Basel, Switzerland. This article is an open access article distributed under the terms and conditions of the Creative Commons Attribution (CC BY) license (http://creativecommons.org/licenses/by/4.0/).
Copyright: This open access article is published under a Creative Commons CC BY 4.0 license, which permit the free download, distribution, and reuse, provided that the author and preprint are cited in any reuse.


