
Submitted:
21 May 2025
Posted:
22 May 2025
You are already at the latest version
Abstract
This study investigates the impact of multilayers and drying strategies on the barrier properties of high-speed starch/bentonite-coated paperboard. The machine speed was 400 m/min. The hypotheses were that thin multilayer coatings reduce oxygen permea-bility more effectively than thick single or double coatings and that gentle infrared (IR) drying is required to engender this effect. The experiments involved coating paperboard up to six times with dry coat weights between 0.5 and 1.5 g/m² in each layer. The IR dryer power ranged from 207 kW to 829 kW, and different IR element positions were tested. The results indicated that thin multilayer coatings resulted in fewer pinholes, lower oxygen transmission rates and improved grease resistance compared with one or two thick layers. However, the effectiveness of the multilayer-coated paperboard was in-fluenced by the employed drying strategy. Specifically, gentle IR drying reduced pin-holes, lowered oxygen transmission rates and enhanced grease resistance.
Keywords:
paper coating
; barrier coating
; drying
; multilayer coating
; starch
; bentonite
; topographic analysis
; morphological analysis
1. Introduction
Substantial efforts have been made to increase the use of paper-based packaging materials as replacement for fossil-based materials, as a part of a transition toward sustainable raw materials. Packaging materials that provide oxygen, moisture vapour, water, oil and grease barriers are generally of high importance in packaging applications such as food packaging [1,2]. Modified atmosphere packaging (MAP) is used to extend the shelf life of foods such as meat, fruit and vegetables. For meat, a certain carbon dioxide partial pressure in the headspace is needed to inhibit the growth of microbial organisms. In such cases, the packaging should prevent loss of carbon dioxide [3]. For fresh fruits and vegetables affected by respiration and transpiration, careful control of the passage of water vapour, oxygen and carbon dioxide through the packaging material is needed to optimize the shelf life [4,5].
The hydrophilic nature of the cellulose fibre and the porous fibre structure of paper and paperboard makes the addition of further steps in the manufacturing process necessary to improve the water resistance of the packaging and to improve its gas barrier properties. One such step is the use of coatings in order to make the top layer almost impermeable to the penetrant in question [2]. Defect-free coatings are needed to produce barriers that prevent the penetration of gas molecules and other penetrants. Coatings may also be applied to prevent water and moisture from damaging the structure of the fibre network and deteriorating the mechanical properties of the package. One main drawback of paper and paperboard is their high uptake of moisture and liquid water. Importantly, in several packaging applications, the package retains its properties also at humid ambient conditions. As a consequence of the high wettability of cellulose fibres, contact with water and humid conditions may result in fibre swelling and loss of fibre network strength. The proposed mechanisms for water transport into paper and paperboard are pore and fibre sorption [6]. To reduce wetting and to increase the water resistance of paper and paperboard, hydrophobic sizing agents, e.g., alkenylsuccinic anhydride (ASA) or alkyl ketene dimer (AKD), are added to the fibre furnish during the papermaking process [7,8,9,10]. Seppänen [11] reported water resistance values less than 20 g m-2, measured via a Cobb60 standard test (ISO 535:1991), for papers sized with AKD. Lindström and Larsson [8] defined Cobb60 = 25 g m-2 as the onset of full AKD sizing. Distinguishing between internal and surface sizing is important: interning sizing means to treat the fibre furnish with hydrophobic sizing agents to increase the water repellence of the final product; surface sizing means to apply a polymer dispersion or solution onto the paper surface in order to control the surface porosity, increase the printability and print quality, improve the surface finish, and increase the surface or internal strength of the paper. Paperboard grades are frequently surface-sized prior to coating to promote coating hold-out and surface coverage, i.e., to prevent penetration of the coating into the base board [12,13]. Surface sizes may also contain hydrophobic agents and mineral pigments, and no sharp boundary exists between the surface sizing and coating.
The relative high porosity of regular paper and paperboard results in poor gas barrier properties, high air permeance and low grease resistance. In general, this is also valid under dry conditions. An internal sizing with AKD and ASA does not prevent the permeation of small gas molecules, since the internal sizing does not block the pathways through a porous structure. The air permeance is related to the density of the paper and paperboard: the higher the density, the lower the air permeance. High-density papers (greaseproof papers) have been reported elsewhere as having air permeance less than 0.3 nm Pa-1 s-1 but still possessing too high oxygen transmission to be regarded as an oxygen barrier material [14].
The open fibre network between cellulose fibres results in high gas and water vapour transmission rates (WVTRs) for paper products [15]. In order to increase the resistance to liquid water, humidity and grease and to reduce the transport of water vapour and gases through packaging paper and paperboard, a coating based on suitable polymers may be applied to the surface of the paper and paperboard. Both dry processing, such as the extrusion of polymer melts, and wet processing (solvent-borne coating and dispersion coating) are used.
In the dry coating method for the production of packaging materials, one of the most frequently used barrier polymers is polyethylene (PE) [16]. PE is used especially to reduce water sorption and the permeability of water vapour. PE is very commonly applied onto paper and boards by extrusion coating, as exemplified by Furuheim [14], Kjellgren et al. [17] and Tuominen et al. [18]. Other methods of less commercial production volumes, such as powder coating, have been reported as well [19]. The moisture barrier of high- (HDPE) and low-density polyethylene (LDPE) is very good. WVTR values at 90% RH and 37.8°C for HDPE and LDPE have been reported to correspond to 0.012 g cm m-2 day-1 and 0.039 g cm m-2 day-1, respectively [20]. However, the permeation of oxygen and carbon dioxide through a PE film is higher than for many other barrier polymers [20]. Extrusion coating on paper and paperboard has also been performed with biopolymers such as starches [21], poly (lactic acid) [22] and polyhydroxyalkanoates [23], just to mention a few examples.
Wet coatings are applied onto paper/paperboard substrates as a solution or dispersion where the dispersion medium is a liquid. In almost all industrial coating processes today where a wet coating formulation is applied as a solution or dispersion, water is used as a solvent or dispersion medium, respectively. The coating dispersion is also referred to as the coating colour. In the industrial production of coated paperboard, the substrate is typically double- or triple-coated to enhance its properties and achieve a high coat weight. The most common process for the top coating is blade metering, where the excess applied coating colour is metered to the desired coat weight with a blade [2,24]. In particular, the use of a bent blade, where the bending of the blade results in a tip angle close to 0°, has been the most common method used in board coating [25]. Wet coating methods are widely used in the paper industry. Historically, the main development of wet paper coating technology has been driven by demands to increase print quality and aesthetical aspects such as gloss and brightness [24]. Aesthetical properties and print quality are related to coating homogeneity and surface smoothness [26]. In addition to blade coating, existing coating methods for dispersion coatings include rod coating [27], roll coating [28], metering size press [29], curtain coating [30,31,32], spray coating [33] and slot-die applicator coating [34,35], just to mention a few examples on coating technologies. Each of these coating techniques have been further modified to a variety of designs. For the application of thin layers in surface sizing operations, conventional or metering size presses are most often used. Kinnunen-Raudaskoski et al. [36] showed that the use of a foam coating for the application of thin barrier layers was possible. Wet methods such as spreading and casting are widely used for laboratory-scaled development of renewable packaging materials [37].
Wet coating methods have successfully been used for a long time in the paper industry for the production of printing papers and coated paperboard. Coating equipment has been developed for high solids coating colours based on mineral pigments and synthetic latex binders (e.g., acrylic and styrene-butadiene emulsions). The solid level of such coating colours is typically in the range from 50 to 70% (by wt.), depending on the paper grade and the type of mineral pigment and additives [24]. Synthetic latex dispersions with and without mineral fillers at relatively high solids levels have been used in the production of barrier coatings as well [38,39,40,41]. Due to the amorphous character of film-forming latex polymers, the oxygen barrier properties of the resulting films are rather similar to those of polyolefins such as polypropylene [42]. However, Vähä-Nissi et al. [39] presented an OTR as low as 0.02 cm3/m2 day bar in pilot trials where styrene-butadiene dispersions, modified with platy fillers and wax, were applied onto high-density papers surface-sized with carboxymethyl cellulose (CMC). The oxygen permeability for amorphous polymers is in general higher than that for semicrystalline barrier polymers, at least at not too humid conditions [42,43]. Idris et al. [44] showed that the oxygen transmission rate of poly(vinyl alcohol) PVOH films decreased with increasing degrees of crystallinity. However, the effects of crystallinity on oxygen barrier properties may be more complex than just a function of the degree of crystallinity. Guinault et al. [44] showed that both the degree of crystallinity and the crystalline morphology must be taken into consideration when describing the effects of crystallization on oxygen permeability.
Pure starch films are brittle but show a substantial decrease in tensile stress and increase in strain at rupture after the addition of plasticizer such as glycerol [46]. Both pure starch and thermoplastic starch (TPS) are semi-crystalline polymers. However, the degree of crystallinity and the crystal form of starch are affected by the plasticizer. With glycerol as a plasticizer, the degree of crystallinity in starch films depends on the amylopectin-to-amylose ratio, the glycerol content, the relative humidity during film formation and the kinetics of film formation [47]. The addition of glycerol to amylopectin films resulted in increasing degrees of crystallinity with increasing relative humidity, while relative humidity had almost no effect on the degree of crystallinity without glycerol. However, Yang et al. [48] showed that the addition of glycerol to corn starch suspensions (prepared at 90°C) resulted in substantially lower degrees of crystallinity in cast films (dried at 60°C) than in corresponding films without glycerol. The grease resistance of films and coatings made from water-soluble modified starches may be rather good [49,50], while the gas permeability increases dramatically with increasing ambient humidity at some critical temperature [51]. The addition of glycerol moved the onset of barrier impairment towards lower temperatures. In order to reduce gas and water vapour permeability as well as water uptake, attempts have been made during the last 20 years to coat paperboard for packaging applications with aqueous starch-based bentonite (montmorillonite) dispersions [52,53,54]. For a range of different bentonite clays, starches and plasticizers, Breen et al. [55] carefully investigated structural changes in the composite layers induced by different types of plasticizers as well as the corresponding effects on barrier properties. The ability of bentonite to reduce the water vapour permeability of films based on TPS was found to be strongly dependent on the layer charge of the bentonite clay.
In materials science in general, the 1990s marked the start of greatly increased research into clay nanocomposites and their role in lowering water vapour and gas permeability compared with traditional composite materials. This trend was mainly visible in areas other than the conversion of paper and paperboard and can be exemplified by the pioneering work of Yano and co-workers [56,57]. However, one should keep in mind the historical use of bentonite–starch suspensions as a precoating layer in the industrial coating of paperboard. This precoating was carried out in order to create a very first barrier layer on the surface before subsequent coating steps, which included a regular precoat formulation (frequently containing calcium carbonate) and a top-coat formulation [58]. In the trials described by Weigl et al. [58], the bentonite–starch barrier layer was applied by means of a metered size press equipped with a grooved rod, operating at a web speed of 400 m/min. Hlavatsch et al. [59] investigated further construction of barrier layers consisting of starch and bentonite.
The aim of the present study was to understand the impact of process parameters in the reel-to-reel high-speed pilot coating of paperboard with TPS/bentonite dispersions, with a special focus on multilayer coating and drying strategies. The development of new renewable barrier coating materials has been largely based on casting and drawdown coating from aqueous polymer solutions and dispersions at the laboratory scale. The high viscosity of solutions of polymers such as starches may cause flow problems at high coating speeds. An aqueous solution of a polymer has higher viscosity than well-stabilized water-based polymer dispersion with the same dry solid content. The difference between these two systems increases with increasing dry solid content. Thus, the maximum dry solid content of a blade coating formulation based on a water-soluble biopolymer with or without mineral fillers is normally about 25-30%, as exemplified by Guezennec [60] for poly(vinyl alcohol) solutions. The upper limit depends on the structure and molecular weight of the biopolymer. If nanomaterials such as bentonite or microfibrillated cellulose (MFC) are added as fillers, the maximum dry solid content of the coating suspension may be lowered further depending on the concentration, size and shape of the filler. The concentration of filler in non-porous dry barrier composites cannot be higher than the critical pigment volume concentration (CPVC), e.g., the CPVC of conventional kaolin clay has been reported to be 54% (v/v) [61]. In order to account for inhomogeneity in the distribution of the filler material, the filler concentration should be well below the CPVC when used in barrier applications.
Poor barrier properties of pilot coated paperboards could partly be explained in terms of coating defects, which were visible in dispersion- and solution-coated paperboards [39,60,62,63,64]. Only a few studies have demonstrated the use of the high-machine-speed wet coating of starch/bentonite dispersions onto paperboards for barrier applications. Some of the published studies deal with grease barriers and related issues such as mineral oil migration from paperboard. One pilot trial was described by Tanninen et al. [65], using a blade coating unit at a machine speed of 350 m/min. Menzel and Koch [66] presented the results from pilot trials with a hard blade configuration at 400 m/min. Another pilot trial, but with a bent blade configuration at a speed of 500 m/min, was described by Olsson et al. [67]. However, the coating colours used by Menzel and Koch [66], as well as by Olsson et al. [67], contained citric acid as a crosslinking agent. Pinhole formation due to air bubbles in the coating dispersion has been proposed as one mechanism behind poor barrier properties [64]. In addition to pinholes, defects such as skip-coating and scratches may occur during the coating process [68]. Skip-coating is most frequently observed at high machine speeds and may originate from trapped air/gas and foam bubbles in the wet coating dispersion. Weigl and Grossman [68] found that the air content may increase with increasing nonpolar nature of the dispersed minerals (fillers) and with increasing content of amphiphilic molecules (surfactants). Javed et al. (2021) [62] reported that skip-coating can be minimized in multilayered lignin-containing coating processes if a rotating rod is used to replace the blade as metering element for the very top layers. Additionally, Weigl and Grossman [68] mentioned the necessity to avoid CO2 gas evolution during high-speed coating processes, which may occur in calcium carbonate-based coating colours if the pH value drops below a critical value. It cannot be excluded that both entrapped air bubbles and crosslinking reactions, which include gas evolution, promote the formation of pinholes during high-speed coating processes.
The high viscosity of most biopolymer solutions limits the maximum dry solid content. Most wet-processing coating machines are designed for high solid coating colours. Compared with regular high solid colours, biopolymer solutions (with or without dispersed fillers) contain a lot of water to be evaporated and absorbed into the base substrate. Such water transports start immediately after the application of the solution/dispersion. The amount of water to be absorbed into the base sheet before drying and the amount of water vapour transported during drying are very high when biopolymer solutions are used. Guezennec [60] observed defects (blisters) in the dry coating layer in pilot trials at a speed of 70 m/min when a pure PVOH solution at a 17% dry solid content was used. However, when the PVOH solution was modified via the addition of MFC, the resulting PVOH-MFC suspension did not give rise to any observable blistering. This was discussed in terms of water evaporation during drying. Drying the PVOH/MFC layer was easier than drying a neat PVOH layer, which might explain the absence of blistering [60]. Existing paper coating strategies developed for high solids dispersion coating may suffer from the formation of surface defects when the coat weight is very low. This behaviour is accentuated for substrates with high surface roughness. This is also valid for the extrusion (dry processing) of barrier layers, where the risk for pinhole formation increases with decreasing coating thickness and increasing roughness of the substrate [69].
To minimize surface defects at high machine speeds in barrier coatings with dissolved barrier polymers, a multilayer strategy has been proposed [63,70,71]. Christophliemk et al. [63] and Emilsson et al. [71] presented a multilayer barrier coating for paperboard at a machine speed of 400 m/min from aqueous poly(vinyl alcohol) and starch solutions with and without bentonite, respectively. A type of short-dwell (SDTA) coater equipped with a soft resilient tip as the metering element was used.
In the present study, we have used a similar multilayer strategy as those presented by Christophliemk et al. [63] and Emilsson et al. [71]. A bio-based coating formulation containing starch, plasticizer and bentonite based on formulations used by Johansson et al. [54] and Olsson et al. [72] was used. Paperboards coated with such formulations were shown to possess rather low permeability of water vapour [54,55]. This formulation was selected as a model dispersion to be used in analyses of the coating process, since starch–bentonite dispersions have been used in the paper industry for long time. The optimization of the starch–bentonite formulation with respect to the barrier properties of the coated paperboard is beyond the scope of this paper. Breen et al. [55] have published a thorough study addressing the effects of the layer charge of bentonites on the barrier properties of a coating using a range of different starches and plasticizers.
The overall objective of the present study is to determine important process parameters for multilayer coating technology that will not only highlight opportunities but also discuss a possible process window. Our intention is that the results could be a base for elaborative models presented in forthcoming research. The present study is based on two hypotheses:
- Firstly, the multilayer concept ensured the contour coating profile (i.e., uniform fibre coverage and low variations in coating thickness) and fewer defects in the coating layer;
- Secondly, premature skin formation and blistering drying are decreased with (a) re-duction in the amount of water to be evaporated in infrared (IR) driers as a consequence of multiple coatings with thin, individual layers and (b) a reduction in IR drying power due to the thin, individual layers. This hypothesis is supported by observations of the influence of drying presented elsewhere [60,73].
The results of the present study clearly indicated that the design of the coater as well as the coating and drying strategy must be carefully optimized when barrier-coated paperboards are produced from starch-based aqueous dispersions
2. Materials and Methods
2.1. Materials
Hydroxypropylated and oxidized potato starch (Solcoat P 55) was supplied by Solam GmbH, Emlichheim, Germany. Its Brookfield viscosity (100 rpm) at 25% aqueous solution and 50°C was about 82 mPas, according to the manufacturer. Poly(ethylene glycol), PEG (Carbowax Sentry PEG 600) was purchased from Univar Sweden AB, Malmö, Sweden. According to the supplier, the average molecular weight range and density at 20°C were 570 to 630 and 1.126 g/cm3, respectively. Bentonite, Cloisite Na+, was purchased from Southern Clay Products, Gonzales, TX, USA, and delivered as a powder. The used bentonite powder contained 7.5% water (by. wt.), as analysed gravimetrically. Sodium hydroxide was used for pH adjustments. All chemicals were used without further purifications.
The used substrate was an uncoated triple-ply paperboard with a bleached top layer from Billerud AB, Frövi, Sweden. The board has a grammage of 270 g/m² and a thickness of 390 μm. The water absorptiveness on the brown unbleached side measured 23.3±0.8 g/m2, according to Cobb60 tests (ISO 535:1991).
2.2. Methods
2.2.1. Preparation of Barrier Dispersion
The barrier dispersion (coating colour) was based on the starch/bentonite/PEG formulations used by Olsson et al. [72], with the main exceptions being that no citric acid and a higher-molecular-weight PEG (PEG 600) were used in the present study, compared with PEG 400 that was used by Olsson et al.
The as-received starch was gelatinised during vigorous stirring at 95°C for 45 minutes. The resulting solid content of the aqueous starch solution was 26%. The as-received PEG was heated to >50°C to ensure a liquid state and added to the hot starch solution about 10 minutes after the preparation of the starch solution was completed. A Cowles-type impeller was used for the dispersion of bentonite. The dispersion took place by adding bentonite to water under high stirring. Stirring was continued for about 30 minutes after the last amount of bentonite powder had been added. The final solid content of the bentonite dispersion was 8.5%. This corresponded approximately to the maximum dry solid content that can be achieved for a manageable bentonite suspension of the type used. The bentonite suspension was then pumped into the tank that contained the starch/PEG solution. In order to slightly increase the bentonite content of the final barrier dispersion, a small amount of dry bentonite powder was added to the bentonite/starch/PEG suspension. After this final addition of bentonite powder, the barrier dispersion was stirred for 30 minutes, and the pH was adjusted to pH = 8.5. The final barrier dispersion formulation is shown in Table 1. The final coating colour was then pumped into the machine tank. The dry solid content and the viscosity of the final barrier dispersion used in all coating trials was 19.5% and 0.90 Pas (Brookfield 100 rpm at 32°C), respectively. The temperature of the coating colour during the pilot trials was 32°C.
2.2.2. Pilot Coating
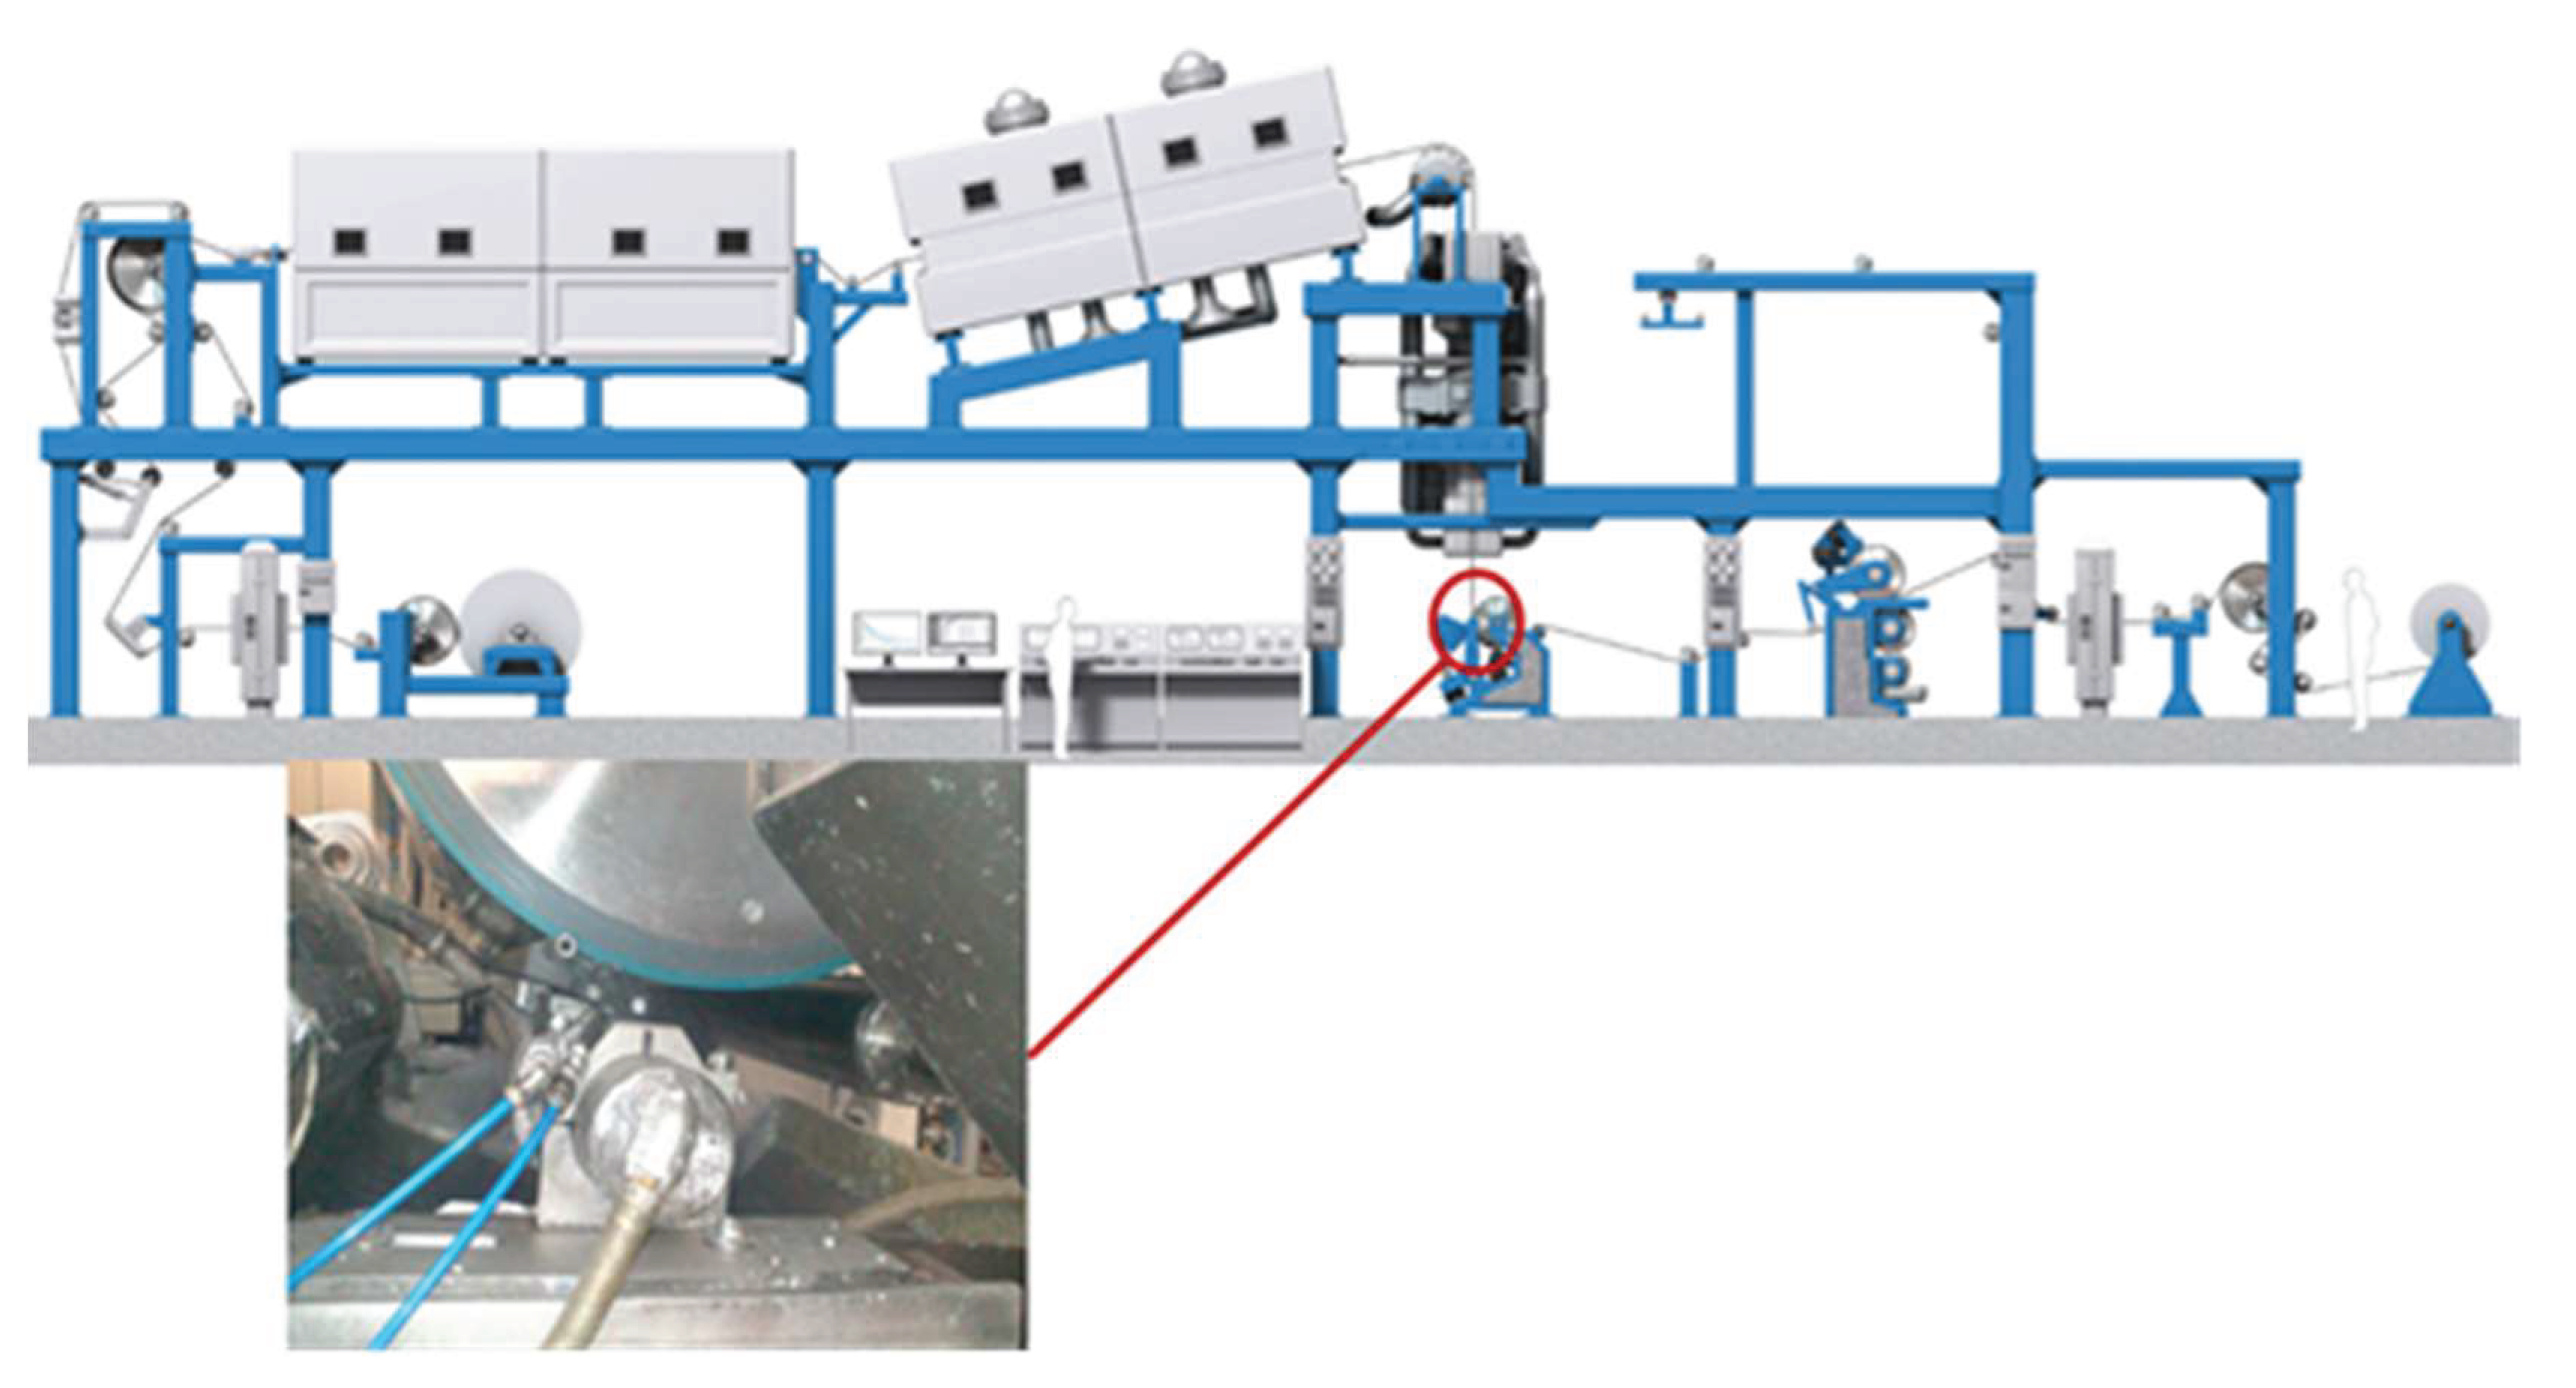
The pilot-scale coating was carried out with the UMV Coating Systems AB pilot coater in Säffle, Sweden, at a machine speed of 400 m/min on paperboard with a web width of ca. 0.55 m. The pilot coater is shown in Figure 1. The coatings were applied onto the brown unbeached backside side of the substrates using a short-dwell time applicator (SDTA), also denoted as a zero-dwell coater (Invo Coater®, UMV Coating System AB, Säffle, Sweden). The dwell time between application and metering was 0.005 s at a machine speed of 400 m/min. The coater can be equipped with several different types of metering elements, integrated in the SDTA coating unit.
In the thin multilayer coating trials, the metering element was a soft and resilient polymer tip (Invo Tip, UMV Coating System AB, Säffle, Sweden). The coat weight was controlled by the metering tip angle. The metering tip angle was kept constant at 20° during all thin multiple coating trials. Thick single- and double-coating trials were performed as reference points. During the reference trials, volumetric rod metering elements with a diameter of 14 mm were used to obtain the desired coat weights. The SDTA coating unit and the metering elements were further described by Christophliemk et al. [63].
Figure 1.
The pilot coater used in the trials. The figure shows the state of the pilot plant during the present study and does not include modifications made later. The insertion shows an enlargement of the application/metering unit.
Figure 1.
The pilot coater used in the trials. The figure shows the state of the pilot plant during the present study and does not include modifications made later. The insertion shows an enlargement of the application/metering unit.
The online drying system consisted of the following:
- One electric infrared (IR) dryer containing 12 individual IR elements, distributed as 6 elements on each side of the web, where the total installed power was 1036 kW, i.e., 86.3 kW per individual IR element, and the total length of the electric IR dryer was 3.6 m;
- One air turn of radius 0.4 m, not formally classified as a dryer, located between the IR dryer and airfloat dryers, where the air turn has some minor effect on the drying process;
- Three airfloat drying hoods, with a maximum temperature of 300°C.
A cooling cylinder was located directly after the last drying hood. The experimental design of the pilot trials is summarized in Table 2. Essentially, two different drying strategies were compared for multilayer coatings up to six individual layers.
- Series A: low IR power and high air hood temperature;
- Series B: medium IR power and low air hood temperature.
In order to gain deeper insights into the impact of IR drying, modifications to Series A and Series B were included. In parallel tests when executing Series A, the second and third layers were dried at high IR power (denoted as Modified Series A). In a parallel test when executing Series B, drying of the sixth layer took place at reduced IR power by switching off the six IR elements located on the uncoated side of the web (denoted as Modified Series B).
In the multilayer approach, each layer was dried before the next layer was applied. The coated reel was moved from the winder to the unwinding position in the front of the pilot machine for application of the next layer. The total coat weight after 6 thin layers was about 5 g/m2. The coat weight of each individual layer varied from 0.45 to 1.5 g/m2, and the highest coat weights were observed for the first layers. Drying between subsequent layers was applied to the double-coated reference sample as well. The paperboards entering the coater for MA2, MB6, RDA2 and RDB2 were A1, B5, RDA1 and RDB1, respectively. The coat weights were calculated from the measured consumption of barrier dispersion. The coat weights and drying conditions are summarized in Table 2.
The dryers for the reference samples, i.e., thick single- and double-coatings with coat weights of each individual layer > 3 g/m2, operated at higher power compared with those for the thin multilayer samples (see Table 2).

Table 2.
Summary of the coat weight drying strategy used in the pilot trials, indicating IR power, number of IR elements and temperature () in the three drying hoods. The IR power is given as a percentage of the maximum power of each active IR element.
Table 2.
Summary of the coat weight drying strategy used in the pilot trials, indicating IR power, number of IR elements and temperature () in the three drying hoods. The IR power is given as a percentage of the maximum power of each active IR element.
| Sample Name | Number of Layers | Total (Accumulated) Coat Weight (g/m2) | IR Power (%) |
Number of Active IR Elements |
Drying Hood #1 (°C) |
Drying Hood #2 (°C) |
Drying Hood #3 (°C |
|---|---|---|---|---|---|---|---|
| Base paperboard | |||||||
| BASE | 0 | 0 | N/A | N/A | N/A | N/A | N/A |
| Series A—IR 20% | |||||||
| A1 | 1 | 1.5 | 20 | 12 | 200 | 200 | 60 |
| A2 | 2 | 2.5 | 20 | 12 | 200 | 200 | 60 |
| A3 | 3 | 3.5 | 20 | 12 | 200 | 200 | 60 |
| A4 | 4 | 4.1 | 20 | 12 | 200 | 200 | 60 |
| A5 | 5 | 4.6 | 20 | 12 | 200 | 200 | 60 |
| A6 | 6 | 5.1 | 20 | 12 | 200 | 200 | 60 |
| Modified Series A—IR 80% | |||||||
| MA2 | 2 | 2.5 | 80 | 12 | 200 | 200 | 60 |
| MA3 | 3 | 3.5 | 80 | 12 | 200 | 200 | 60 |
| Series B—IR 40% | |||||||
| B1 | 1 | 1.4 | 40 | 12 | 60 | 60 | 60 |
| B2 | 2 | 2.4 | 40 | 12 | 60 | 60 | 60 |
| B3 | 3 | 3.05 | 40 | 12 | 60 | 60 | 60 |
| B4 | 4 | 3.70 | 40 | 12 | 60 | 60 | 60 |
| B5 | 5 | 4.30 | 40 | 12 | 60 | 60 | 60 |
| B6 | 6 | 4.75 | 40 | 12 | 60 | 60 | 60 |
| Modified Series B—IR 40%—half of the IR elements are active | |||||||
| MB6 | 6 | 4.75 | 40 | 6 | 60 | 60 | 60 |
| Reference thick single coating | |||||||
| RSA1 | 1 | 5.4 | 80 | 12 | 250 | 250 | 60 |
| RSB1 | 1 | 5.4 | 99 | 12 | 250 | 250 | 60 |
| Reference thick double coating | |||||||
| RDA1 | 1 | 3.7 | 55 | 12 | 200 | 200 | 60 |
| RDA2 | 2 | 6.8 | 20 | 12 | 200 | 200 | 60 |
| RDB1 | 1 | 3.9 | 80 | 12 | 200 | 200 | 60 |
| RDB2 | 2 | 7.0 | 80 | 12 | 200 | 200 | 60 |
2.2.3. Analyses of Coated Paperboard
Pinholes
Pinholes were measured according to SS-EN 13676. A colouring solution prepared by dissolving 0.5 g of dyestuff, Crossing Scarlet MOO (CAS 5413-75-2), in 100 ml of ethanol, was used. The coated side of the sample was in contact with the colouring solution for 5 minutes, after which the surplus was removed and any coloured spots were counted. The results were expressed as the number of pinholes/dm2. The upper detection limit was set to 30 pinholes/dm2. These experiments were performed within one week after the coating trials. For the pinhole measurements and all other analyses mentioned below, the samples were stored at 23°C and 50%RH prior to measurements. The results from the pinhole measurements were performed in five replicates.
Surface Structure—Air Flow Method
A Bendtsen apparatus (Bendtsen Tester, Model 58-27, Messmer Buchel, The Netherlands) was used to test surface roughness according to ISO 8791-2. This method is based on air flow, and the test pressure was 1.47 kPa. All measurements were repeated 21 times, except for those for the uncoated paperboard, which were repeated 42 times. The measurements on the uncoated cardboard were performed on the unbleached brown side.
Profilometry—Images, Roughness and Void Volume
An optical surface profiler (ContourGT-K, Bruker Nano Inc., Tucson, Arizona, USA) and the Vision 64 software program (Bruker Nano Inc., Tucson, Arizona, USA) were used in VSI mode in order to capture contour images and to calculate the roughness parameters stated in Table 3. All measurements were performed in triplicate, except for those for the uncoated paperboard, which were repeated 10 times. The measurements were made using a Michelson 5X objective with an optical resolution of 2.2 µm and a 0.55X field-of-view lens. The pixel size of all images was 3.5 µm. Stitched images (rectangular stitch) were used in all calculations of the roughness parameters. The area of the stitched images was 10 mm x 10 mm. The stitched raw images were optimized by applying a 3-pixel median statistic filter, followed by data restoration (data interpolation from valid pixels around eventual missing pixels) and finally by gentle tilt removal (plane fit). The natural volume was carefully controlled such that it equalled the negative volume and that positive volume = 0 nm3 after the removal of any tilt impact. Optimized images were used in the analyses of the roughness parameters.
The total surface volume () was defined according to the following:
In order to distinguish between roughness and waviness, zero-order Gaussian regression filtering (Vision 64 software program, Bruker Nano Inc., Tucson, Arizona, USA) was used for the elimination of large-scale lateral components. The wavelength cutoff was 1 mm since the roughness scales generally between 0.001 mm and 1 mm [74]. The values of Sa before and after Gaussian regression filtering are shown. Sc and Sv were calculated without Gaussian regression filtering.
All measurements of surface structure, including the Bendtsen test, were completed within 22 months after the coating trials.
Grease Resistance
Grease resistance was measured with the so-called Kit Test according to TAPPI 559 in five replicates. In this test, 12 different mixtures of castor oil, toluene and heptane (Kit solutions), varying in surface tension and viscosity, are prepared. The solutions are numbered from 1 to 12. The higher the Kit number of the Kit solution, the higher the tendency to penetrate the specimen. A drop of the Kit solutions is applied to the surface of the specimen. Then, the Kit rating of the specimen is determined based on the highest numbered Kit solution that does not penetrate within 15 seconds. This means that a high Kit rating number indicates high grease resistance. The maximum Kit rating number is 12. The grease resistance measurements were performed two months after the coating trials.
Oxygen Transmission
The oxygen transmission rate (OTR) was measured according to the ASTM D 3985-05 standard using a Mocon Ox-Tran oxygen transmission rate tester, Model 2/21 MH from Mocon, Inc., Minneapolis, USA. The test area was 5 cm2, and the OTR measurements were performed with air as the permeant (oxygen concentration 20.9% (by vol.) and 50% RH) in two and four replicates for Series A and the reference thick double coating, respectively. All OTR measurements were completed within three months after the coating trials.
The ambient oxygen ingress rate (AOIR) with air as the permeant was used to detect the dynamics of oxygen permeation. The sample cells were connected to a gas permeation analyser (PermMate, Systech, Illinois, USA). The volume of the cell () was 330 ml. The volume of oxygen () was measured vs. . Before each experiment, the sample cell was flushed on the inside with nitrogen to lower the oxygen concentration to about 1% (by vol.). The relative humidity (RH) and temperature were 50% and 23°C, respectively. The experimental details are described elsewhere [75]. The AOIR, defined as (), was calculated from the initial linear part of the curve vs. , under conditions where the oxygen pressure inside of the cell is small in comparison with the oxygen pressure outside of the cell.
where is the atmospheric pressure, is the oxygen pressure in the cell measured at the initial time and is the oxygen pressure in the cell measured at the final time , according to Larsen et al. [76]. Experimental points up to a maximum of 4±1% (by vol.) oxygen were used for the linear curve fit of the initial part of the curve vs. . However, experimental points at a higher oxygen content had to be included for samples BASE, A1, RSB1 and RDB1 due to rapid increases in oxygen concentration. All AOIR measurements were completed within three months after the coating trials and performed in duplicates.
3. Results and Discussion
3.1. Pinholes and Surface Structure
The number of pinholes in the coated sheets was measured as an initial assessment of their barrier properties. The surface roughness measured based on the Bendtsen air leakage method and surface profilometry in combination with measurements of gave some insights into the interactions between the coating dispersion and the substrate. The present study investigated the substrate's responses to applied forces during application and metering, as well as its interaction with the aqueous phase during the period between application and immobilization.
Table 4 displays the number of pinholes and the Bendtsen surface roughness values for the samples analysed in this study. The origin of pinholes and similar defects with a negative impact on the barrier properties has been explained via several mechanisms. Firstly, the coating must cover pores in the substrate, which in most cases means that a uniform coating is required. Poor coating will result in remaining open pores. Other reasons that pinholes may appear include air bubbles being present in the coating dispersion [64] and blistering [60]. In addition to air bubbles and blistering, Christophliemk et al. [63] discussed the balance between sufficient and excess compression of the substrate during metering to ensure uniform coverage, the latter of which may cause defects in the coating layer when the surface relaxes after compression. The use of a polymeric resilient metering tip was proposed to enable additional opportunities to finetune this balance between uniformity and relaxation.
- (1)
- Sample MA3 was excluded from the test protocol due to severe blistering.
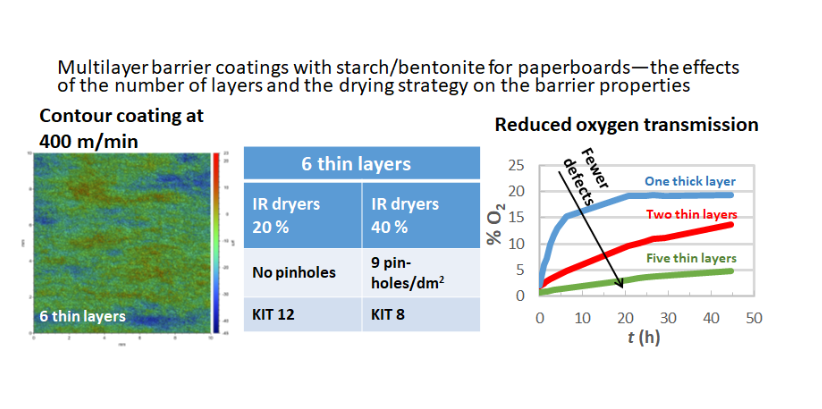
Table 4 clearly shows that the multilayer approach in combination with the selected coater and metering device can be used to achieve coated paperboard free of pinholes even at low coat weights. The multilayered samples A5, A6 and MB6 were all without pinholes. The absence of pinholes indicates that a uniform coating was achieved. This should be compared with the single- and double-coated reference samples, which exhibited significantly higher numbers of pinholes. This occurred notwithstanding the fact that certain reference samples exhibited a higher coat weight compared with any of the multilayer-coated paperboards. For the various multilayer coatings, predicting the number of pinholes was not possible by measuring the Bendtsen roughness. Instead, the effects of drying (in particular, the IR dryer) seem to be decisive. Heilmann [73] proposed that a proper drying strategy of functional coatings, such as barrier coatings, includes suitable evaporation rates as well as heating of the substrate underneath the coating and the initial sedimentation layer. Proper evaporation rates in relation to IR energy transfer are essential to prevent premature film formation of the surface, which can lead to micro-blistering [73].
An increase in IR power from 20% or 40% resulted in an increased number of pinholes (cf. Series A and Series B in Table 4), indicating that 40% IR resulted in premature film formation. The better performance at 20% IR power suggested that all separate layers were thin enough to allow for sufficient heating of the substrate underneath the coating and the initial sedimentation layer already at 20% IR. The conclusion that too high IR power introduces pinholes is also supported by a comparison between A2 and MA2 with 19.0 pinholes/dm2 and over the measurable range, respectively. The only change in production parameters between these two samples was the higher IR power for MA2. Far too harsh IR drying of the multilayered samples, as in the Modified Series A, resulted in severe blistering, observed in the third layer, probably due to premature film formation because of the high IR energy transfer in relation to the enthalpy of vaporization. At optimal conditions, the cooling effect of evaporation is expected to contribute to a temperature profile that promotes drying of the wet layer from bottom to top, as proposed by Heilmann [73].
MB6 had a much lower pinhole surface density than M6. During the MB6 run, all IR elements located on the uncoated side of the web were switched off. This reduced the total IR power from 40% to 20%, which may be one reason for the low number of pinholes for MB6. However, the IR power of the six active IR elements on the coated side was still 40% of the maximum power. The IR setup in MB6 likely resulted in a temperature profile that promotes drying of the wet layer to occur from bottom to top. The zero pinholes observed for MB6 indicates that a similar strategy to that applied already to the first layer, with all IR elements on the uncoated side turned off, would have been successful in reducing the number of pinholes.
The thick reference samples all possessed higher number of pinholes than the detection limits of 30 pinholes/dm2. Even if the coat weight of the reference samples was higher than that for the multilayer samples, none of the reference samples possessed a smaller number of pinholes than the A2 to A6 samples in Series A or the samples B6 and MB6. Notable is that A2 showed a lower number of pinholes than RDB2, even if the coat weight was almost three times higher for RDB2. This probably relates to the dynamics of drying thick layers at high machine speeds. Higher IR power is needed to transfer sufficient energy to the substrate/sedimentation layer at increasing speed and coat weight. Such an increase in IR power may cause premature film formation in the very top surface, leading to pinholes and micro-blisters.
As expected, all coated samples showed lower Bendtsen roughness than the uncoated substrate. There is a clear trend that the Bendsen roughness of the multilayered samples decreased with increasing number of layers, even if the difference to the very next layer was not significant. An increase in IR power when drying the thin multilayered samples did not result in any significant changes in Bendsen roughness. A reduction in Bendtsen roughness after coating indicates a smoother surface of the coated material. A comparison of the thick reference samples (RSA1 and RSB1) and the multilayered samples with approximately the same coat weights (A6, B6 and MB6), revealed that the Bendtsen roughness was lower when the multilayer strategy was applied. This may be due to the large volume of aqueous dispersion applied onto the substrate for RSA1 and RSB1. An increased wet coating volume may lead to more blistering, pinholes and water penetration into the base paperboard. Penetration of water into the base paperboard may in turn cause fibre swelling, loosening of fibre–fibre bonds and subsequent roughening. Swelling likely only occurs after the first pass when the wet coating is in direct contact with the substrate, as proposed by Guezennec [60]. Looking into the double-coated reference samples, Table 4 revealed surprisingly high Bendtsen roughness values for RDA1 and RDA2. This may indicate too low IR power, leading to insufficient heating of the substrate beneath the coating layer, which is expected to increase water penetration and swelling. During the production of functional coatings, Heilmann [73] emphasized the importance of heating the initial sedimentation layer, noting that coatings should be dried from bottom to top to prevent penetration into the substrate and potential skin formation. The variations in Bendtsen roughness between individual measurements of the same sample, as indicated by the error limits in Table 4, reflected the probable variations in surface structure observed for the uncoated paperboard.
Optical surface profilometry provides an in-depth view of the structure of the coated samples compared with what can be obtained with Bendtsen surface roughness. Since Bendtsen surface roughness and optical profilometry use different measurement techniques, the results obtained from these two methods may not always correspond exactly. Optical surface profilometry images (contour images) for BASE, A6, B6, MB6, RSB1 and RDB2 are shown in Figure 2. The long-range waviness is distinctly observable. However, differences in surface roughness could not be observed directly from Figure 2. To draw conclusions about surface roughness, the surface profiler datasets were used in computer-aided calculations to obtain the filtered average roughness (Sa). Table 5 shows the unfiltered Sa; the short wavelength pass-filtered Sa; and Sc, Sv and .
Table 5 shows no significant differences in unfiltered Sa between BASE and the coated paperboards, suggesting a contour coating in all cases. This was valid for soft tip as well as for rod metering. A uniform coating layer promotes low gas transmission of the coated paperboard. The scatter in unfiltered Sa was anticipated to be high due to the large-scale waviness in Figure 2 compared with the image size.
The filtered Sa values are shown in Table 5. The filtered Sa values show roughness values without the influence of waviness. Thus, the experimental scatter of the filtered Sa values was significantly lower than that of the unfiltered Sa values. The filtered Sa showed that the roughness of the multilayered samples was substantially lower than the roughness of the uncoated paperboard. The samples with six thin layers without any pinholes (A6 and MB6) possessed the lowest surface roughness. The diameter of cellulose fibres falls within the length scale of roughness. This implies that the reduced filtered Sa observed for thin multilayer coatings probably reflects a high degree of fibre coverage and coverage of surface voids between cellulose fibres.
The filtered Sa of the reference samples matched or exceeded that of the uncoated paperboard. More important than achieving a contour coating is that the coatings are free of defects such as pinholes and micro-blisters. The thick single-coated reference samples RSA1 and RSB1 possessed the highest roughness (measured as filtered Sa) of all samples, even higher roughness than BASE. This may be explained by the high migration of the coating dispersion (or the aqueous phase), leading to fibre swelling and movements. Another explanation may be the higher power of the IR elements, resulting in premature film formation at the surface and subsequent blistering. Both explanations may result in pinhole formation.
The total surface volume () of the coated paperboards (Table 5) showed no substantial differences between the samples, once again indicating a high degree of contour coating. An additional fact supporting contour coating was the rather constant value of the ratio Sc/Sv between 9 and 12 observed for BASE and all coated samples. The wet volume () applied after metering at each coating step can be calculated from the increase in coat weight, on the condition that the density and dry solid content of the wet coating dispersion are known. The approximate density of the coating dispersion was calculated based on an assumption of ideal mixing [77]. The densities of pure starch, poly(ethylene glycol), water and bentonite were set to 1.4985 g/cm3 [77], 1.126 g/cm3, 0.995 g/cm3 and 2.35 g/cm3 [78], respectively. The estimated resulting density of the coating dispersion and the aqueous phase of the dispersion were 1.07 g/cm3 and 1.04 g/cm3, respectively. The assumption of ideal mixing deviates from real conditions, but the approximation is sufficient to obtain an estimate of the wet volume of the dispersion at each coating step. The real density values are supposed to be higher than the calculated ones.
A basic requirement for fibre coverage is that the wet volume of the coating dispersion fills the surface volume between large-scale height variations caused by fibre flocs. Table 6 shows and for some of the coated samples. For the thin multilayered samples (A1, A6, B1, B6 and MB6), was substantially smaller than , indicating that compression of the substrate beneath the metering element was required to obtain good fibre coverage and uniform coating. Increasing compression beneath the metering element has been shown elsewhere to lead to more uniform coating [79]. In addition, the properties of the resilient metering tip used in the present study are expected to contribute to a uniform coating [80]. Besides the resilient material, the shape and angle of the resilient tip may contribute to the compression as well, in line with the force balance outlined by Renvall and Kuni [25]. The use of an integrated applicator/metering of the short-dwell type and the use of base paperboard with high Cobb values also helped to ensure a sufficient wet volume underneath the blade. Overall, the results indicated that the coating uniformity depends on the design of the coater. It has been reported elsewhere that the coating uniformity becomes strongly dependent on the coating technique in the wavelength range 1-8 mm [81].
was substantially higher than for the thick single-coated reference samples (RSA1 and RSB1), indicating that fibre coverage was possible to achieve in principle without compression of the substrate. For the reference samples RDA1, RDA2 and RDB1, was just slightly higher than . However, the results from optical surface profilometry clearly indicated a contour type of coating also for the reference samples. This indicates that the substrates were compressed beneath the metering element in the reference trials as well, since increasing compression beneath the metering element leads to more uniform coating [79]. However, Christophliemk et al. [63] identified some flaws in barrier-coated paperboard that may relate to high compression of the cellulose fibre network and proposed that a resilient tip may adapt to the substrate to give less defects.
3.2. Grease Resistance and Oxygen Barrier Properties
Measurements of the number of pinholes in the coated samples were used as a first screening of the barrier properties. Analyses of grease resistance and oxygen transmission were only performed for a selection of samples. The AOIR, OTR and Kit ranking numbers are shown in Table 7. The variation in AOIR values for Series A correspond well with the decrease in pinhole surface density (cf. Table 4). A clear decrease in AOIR to values around 10 ml/day was observed from three layers. Due to experimental scatter, distinguishing between AOIR values for the four samples in Series A with three to six layers was not possible. The higher IR power in Series B compared with that in Series A resulted in a higher AOIR. This corresponds well with the observed higher pinhole surface density for Series A, indicating that too high IR power may lead to premature film formation of the very top layer of the coating. Turning off the IR radiation on one side of the web for the sixth layer in Series B gave a significantly lower AOIR (cf. M6 and MB6), which also shows that defects can be minimized with a lower total IR power. All reference samples (RSB1, RDB1 and RDB2) possessed an AOIR rather similar to that of A1 (one thin layer). Table 7 clearly indicates that the concept of thin multilayer coatings gives lower oxygen transmission than one or two thick coating layers. Table 7 also includes the OTR for A6 and RDB1, measured according to the ASTM D 3985-05 standard. All other samples without pinholes (see Table 4) are likely to have OTRs in the same range as A6. Even if a substantial decrease in AOIR with an increasing number or layers in Series A was observed, the OTR was still too high to be regarded as a sufficient oxygen barrier for sensitive food packaging applications [82]. It is rather demanding to achieve a good barrier coating on rough paperboard without any precoating. It is anticipated that conducting multiple coating trials, similar to those performed in the present study, on a smooth and mineral precoated paperboard would result in significantly lower oxygen transmission rates. The importance of a smooth substrate at high-speed coating was highlighted by Vähä-Nissi et al. [39]. The observed experimental scatter for the coated samples was expected, since oxygen transmission through a barrier-coated rough paperboard is strongly affected by local variations in the number of defects and other structural inhomogeneities in the barrier layer.
Figure 3, Figure 4 and Figure 5 describe the dynamics of oxygen permeation. The differences between the four samples of Series A with three to six layers are small (Figure 3). This contrasts with how the number of pinholes changed with additional layers. Oxygen penetration cannot be explained solely based on the number of pinholes. One explanation could be that the defects, caused by outermost micro-blistering, became dominant once the big pores between cellulose fibres were sealed after the two fist layers. The number of micro-blisters may be minimized by lowering the total IR power or by turning off radiation on the uncoated side of the web. Defects caused by compression, not visible in the pinhole tests, could also have become dominant from three thin layers. This could have been solved with a levelling precoating. The optimization of coating parameters such as machine speed, blade tip angle and coater pressure was beyond the scope of the present study. These parameters were constant during all multilayer trials. However, further optimization of the coating parameters could have resulted in further reductions in oxygen permeability. Finally, the levelling of oxygen barrier properties from the three layers could also have reflected limitations in the experimental technique when the AOIR was analysed. The experimental error in Figure 3, Figure 4 and Figure 5 can be estimated from the error limits for the AOIR in Table 7. Figure 4 showed that the oxygen increase for the reference samples was more rapid than for any of the multilayered sample in Series A with more than one coating layer. Figure 5 shows a slower increase in oxygen concentration if the material had been dried with all IR elements on the uncoated side turned off. It cannot be excluded that the very best strategy would have been to dry all thin layers at reduced IR power via IR radiation only from the coated side.
The Kit ranking numbers follow the results from the pinhole test well (Table 4). Samples A5, A6 and MB6 reached Kit ranking 12. These three samples were the only samples free from pinholes. The similarity in results between the pinhole tests and Kit ranking was expected, since both methods are based on the penetration of non-aqueous test solutions. The results show that pinholes are detrimental for high grease resistance. The thin multilayer method can be used during the production of paperboard coated for high grease resistance and without mineral precoating.
4. Conclusions
The present study focused on traditional coating techniques, i.e., applying excess coating colour and then metering to achieve the desired coat weight. Thus, the conclusions strictly apply to such techniques. However, as this study deals with drying effects, most findings are likely relevant to other wet coating methods for paper or paperboard as well.
The results indicated that thin multilayer coatings exhibit fewer pinholes, lower oxygen transmission rates and enhanced grease resistance compared to one or two thick layers. A significant reduction in pinholes and oxygen transmission was observed from the application of only two thin layers. This suggests that multilayer technology can contribute to material savings and promote resource-efficient production methods. These findings were obtained using a coater design aimed at minimizing the dwell time between application and metering, thereby reducing sorption of the coating colour or aqueous phase into the substrate. Noteworthily, these results cannot be directly extrapolated to other designs. In addition, the first layer was applied on paperboard without any precoating. Generally, a rough substrate poses challenges, and a mineral precoating used to level out the roughness is anticipated to result in fewer coating defects.
The roughness measurements showed that a contour coating was achieved for both the multilayer-coated paperboard and the thick single- and double-coated reference samples. The total surface void volume revealed that significant compression of the substrate beneath the blade was required to obtain the contour coating. Filtering the profilometer data to display the roughness variations corresponding to wavelengths less than 1000 μm showed that the multilayer-coated samples had a smoother surface compared with the reference samples with approximately the same coat weight. Hence, the multilayer technique resulted in a smoother surface when measured over several fibre diameters. A resilient metering tip was utilized in this study for the thin multilayer coatings, and it is possible that the tip material influenced the coating uniformity and barrier properties of the coated paperboard.
The quality and barrier properties of the multilayered samples were significantly influenced by the drying strategy. An excessive power setting in the IR dryer led to increased pinholes and higher oxygen penetration in the multilayer-coated samples. Further increases in IR power resulted in blistering, likely due to premature film formation. Modifying the placement of the IR elements to be solely on the coated side of the paperboard appeared to mitigate pinholes and reduce oxygen penetration. This may be attributed to the reduced total power and the one-side radiation favouring drying from the bottom to the top of the newly applied coating layer.
Author Contributions
Conceptualization, L.J. and P.E.; methodology, L.J., H.C., E.B., J.L. and P.E.; formal analysis, L.J. and H.C.; investigation, L.J., H.C., E.B., J.L. and P.E.; resources, L.J., J.L. and P.E.; writing—original draft preparation, L.J. and H.C.; writing—review and editing, L.J., H.C., E.B., J.L. and P.E.; supervision, L.J.; project administration, L.J. and P.E.; funding acquisition, L.J. and P.E. All authors have read and agreed to the published version of the manuscript.
Funding
This research was funded by the SWEDISH GOVERMENTAL AGENCY FOR INNOVATION SYSTEMS (VINNOVA), file reference number 2014-00319; STIFTELSEN NILS OCH DORTHI TROËDSSONS FORSKNINGSFOND, Sweden, grant application number 866/15; and the KNOWLEDGE FOUNDATION, Sweden, file reference number 20180036.
Institutional Review Board Statement
Not applicable.
Informed Consent Statement
Not applicable.
Data Availability Statement
Not applicable.
Conflicts of Interest
The authors declare no conflicts of interest.
References
- Andersson, C. New ways to enhance the functionality of paperboard by surface treatment – a review. Packag. Technol. Sci. 2008, 21, 339-373. [CrossRef]
- Tyagi, P.; Salem, K.S.; Hubbe, M.A.; Lokendra, P. Advances in barrier coatings and film technologies for achieving sustainable packaging of food products – A review. Trends Food Sci. Technol. 2021, 115, 461-485. [CrossRef]
- Jakobsen, M.; Bertelsen, G. Predicting the amount of carbon dioxide absorbed in meat. Meat Sci. 2004, 68(4), 603-610. [CrossRef]
- Matar, C.; Gaucel, S.; Gontard, N.; Guilbert, S.; Guillard, V. Predicting shelf life gain of fresh strawberries ‘Charlotte cv’ in modified atmosphere packaging. Postharvest Biol. Technol. 2018, 142, 28-38. [CrossRef]
- Jalali, A.; Linke, M.; Geyer, M.; Mahajan, P.V. Shelf life prediction model for strawberry based on respiration and transpiration processes. Food Packag. Shelf Life 2020, 25, 100525. [CrossRef]
- Bristow, J.A. The Pore Structure and the Sorption of Liquids. In Paper Structure and Properties; Bristow, J.A., Kolseth, P., Eds.; Marcel Dekker, New York, 1986, pp. 183-201. ISBN 0-8247-7560-0.
- Zhang, W.; Liu, W.; Li, H.; Hubbe, M.A.; Yu, D.; Li, G.; Wang, H. Improving Stability and Sizing Performance of Alkenylsuccinic Anhydride (ASA) Emulsion by Using Melamine-Modified Laponite Particles as Emulsion Stabilizer. Ind. Eng. Chem. Res. 2014, 53, 12330-12338. [CrossRef]
- Lindström, T.; Larsson, P.T. Alkyl Ketene Dimer (AKD) sizing – a review. Nordic Pulp Paper Res. J. 2008, 23(2), 202-209. [CrossRef]
- Hubbe, M A. Paper's resistance to wetting - A review of internal sizing chemicals and their effects. BioResources 2007, 2(1), 106-145.
- Li, H.; Liu, W.; Yu, D.; Song, Z. Anchorage of ASA on cellulose fibers in sizing development. Nordic Pulp Paper Res. J. 2015, 30(4), 626-633. [CrossRef]
- Seppänen, R. On the internal sizing mechanisms of paper with AKD and ASA related to surface chemistry, wettability and friction, PhD Thesis, KTH Royal Institute of Technology, Stockholm, Sweden, 2007.
- Lindström, T. Sizing. In Volume 3 Paper Chemistry and Technology; Ek, M., Gellerstedt, G., Henriksson, G., Eds.; De 671 Gruyter: Berlin, Germany, 2009, p. 301. [CrossRef]
- Engström, G. Pigment Coating. In Volume 3 Paper Chemistry and Technology; Ek, M., Gellerstedt, G., Henriksson, G., Eds.; De 671 Gruyter: Berlin, Germany, 2009, pp. 374-375. [CrossRef]
- Furuheim, K.M.; Axelson, D.E.; Helle, T. Oxygen barrier mechanisms of polyethylene extrusion coated high density papers. Nord. Pulp Paper Res. J. 2003, 18(2), 168-175. [CrossRef]
- Nilsson, L.; Stenström, S. Gas diffusion through sheets of fibrous porous media. Chem. Eng. Sci. 1995, 50(3), 361-371. [CrossRef]
- Neilen, M.; Bosch, J. (2007). Tubular LDPE has the extrusion coating future. In Proceedings of the 11th TAPPI European PLACE Conference, Athens, Greece, 14-16 May 2007, TAPPI Press, Atlanta, GA, USA, pp. 87-96.
- Kjellgren, H.; Stolpe, L.; Engström, G. Oxygen permeability of polyethylene-extrusion-coated greaseproof paper., Nordic Pulp Paper Res. J. 2008, 23(3), 272-276. [CrossRef]
- Tuominen, M.; Lahti, J.; Kuusipalo, J. Effects of flame and corona treatment on extrusion coated paper properties. Tappi J. 2011, 10(10), 29-37.
- Putkisto, K.; Maijala, J.; Grön, J.; Rigdahl, M. Polymer coating of paper using dry surface treatment: Coating structure and performance. Tappi J. 2004, 3(11), 16-23.
- Dhoot, S.N.; Freeman, B.D.; Stewart, M.E. Barrier Polymers. In Encyclopedia of Polymer Science and Technology, 4th ed.; Wiley Online Library: Hoboken, NJ, USA, 2002. [CrossRef]
- Kuusipalo, J. Starch-Based Polymers in Extrusion Coating. J. Polym. Environ. 2001, 9, 125–135. [CrossRef]
- Lahtinen, K., Kotkamo, S., Koskinen, T., Sanna Auvinen, S., Kuusipalo, J. Characterization for Water Vapour Barrier and Heat Sealability Properties of Heat-treated Paperboard/Polylactide Structure, Packag. Technol. Sci. 2009, 22, 451–460. [CrossRef]
- Sängerlaub, S., Brüggemann, M., Rodler, N., Jost, V., Bauer, K.D. Extrusion Coating of Paper with Poly(3-hydroxybutyrate-co-3-hydroxyvalerate) (PHBV)—Packaging Related Functional Properties. Coatings 2019, 9, 457. [CrossRef]
- Kogler, W.; Tietz, M.; Auhorn, W.J. Paper and Board, 7. Coating of Paper and Board. In Ullmann's Encyclopedia of Industrial Chemistry, 7th ed.; Wiley Online Library, 2012. [CrossRef]
- Renvall, S.; Kuni, S. Coat weight control in bent blade mode. Tappi J. 2013, 12(5), 31-38.
- Engström, G.; Rigdahl, M. Literature review: Binder migration - Effect on printability and print quality. Nordic Pulp Paper Res. J. 1992, 7(2), pp. 55-74. [CrossRef]
- Rückert, H. VARI-BAR: Ein System zur Regelung des Strichgewichts als Ergebnis der Weiterentwicklung der bekannten Rollschabereinrichtungen, Wochenblatt Papierfabr. 1982, 110(13), 461-464.
- Hanumanthu, R., Scriven, L.E. Coating with patterned rolls and rods. Tappi J. 1996, 79(5) 126-138.
- Klass, C.P.; Åkesson, R. Development of the metering size press: A historical perspective. In Proceedings of the TAPPI Metered Size Press Forum, Nashville, TN, USA, 16–18 May 1996; pp. 1–12.
- Schweizer, P.M. Stability of Liquid Curtains. In Proceedings of the PITA Coating Conf., Edinburgh, UK, 4-5 March 2003, pp. 103-111.
- Larsson, J.; Karlsson, A. Coating composition, a method for coating a substrate, a coated substrate, a packaging material and a liquid package. US Patent US 2014/0251856 A1, 11 September 2014.
- Döll, H. Curtain coating for paper industry – Single and multilayer. In Proceedings of the TAPPI PaperCon Paper Conference and Trade Show, Minneapolis, MN, USA, 23-26 April 2017.
- Husband, J.C.; Hiorns, A.G. The trend towards low impact coating of paper and board. In Proceedings of the 6th European Coating Symposium, Bradford, UK, 7-9 September 2005, pp. 1-10.
- Kumar, V.; Elfving, A.; Koivula, H.; Bousfield, D.; Toivakka, M. Roll-to-roll processed nanocellulose coatings for barriers applications. Ind. Eng. Chem. Res. 2016, 55(12), 3603-3613. [CrossRef]
- Ruberto, Y; Vivod, V.; Grkman, J.J.; Lavrič, G.; Graiff, C.; Kokol, V. Slot-die coating of cellulose nanocrystals and chitosan for improved barrier properties of paper. Cellulose 2024, 31, 3589–3606. [CrossRef]
- Kinnunen-Raudaskoski, K.; Hjelt, T.; Koskela, H.; Forsström, U.; Sadocco, P.; Causio, J.; Baldi, G. (2015). Thin barrier and other functional coatings for paper by foam coating, TAPPI PaperCon Paper Conference and Trade Show (Proc.), April 19-22 2015, Atlanta, GA, USA.
- Gómez-Estaca, J.; Gavara, R.; Catalá, R.; Hernández-Muñoz, P. (2016). The Potential of Proteins for Producing Food Packaging Materials: A Review, Packag. Technol. Sci. 2016, 29, 203-224. [CrossRef]
- Kimpimäki, T.; Savolainen, A.V. Barrier dispersion coating of paper and board. In Surface Applications of Paper Chemicals; Brander, J. and Thorn, I., Eds; Springer, Dordrecht, the Netherlands, 1997, pp 208-228. [CrossRef]
- Vähä-Nissi, M.; Savolainen, A.; Talja, M.; Mörö, R. Dispersion barrier coating of high-density base papers, Tappi J. 1998, 81(11), 165-173.
- Andersson, C.; Järnström, L; Hellgren, A.-C. Effects of carboxylation of latex on polymer interdiffusion and water vapor permeability of latex films, Nordic Pulp Paper Res. J. 2002, 17(1), 20-28. [CrossRef]
- Andersson, C.; Ernstsson, M.; Järnström, L. Barrier properties and heat sealability/failure mechanisms of dispersion-coated paperboard. Packag. Technol. Sci. 2002, 15(4), 209-224. [CrossRef]
- Mehravar, E.; Leiza, J.R.; Asua, J.M. Performance of latexes containing nano-sized crystalline domains formed by comb-like polymers. Polymer 2016, 96, 121–129. [CrossRef]
- Burgess, S.K.; Karvan, O.; Johnson, J.R.; Kriegel R.M.; Koros, W.J. Oxygen sorption and transport in amorphous poly(ethylene furanoate). Polymer 2014, 55(18), 4748-4756. [CrossRef]
- Idris, A.; Muntean, A.; Mesic, B.; Lestelius, M.; Javed, A. Oxygen Barrier Performance of Poly(vinyl alcohol) Coating Films with Different Induced Crystallinity and Model Predictions. Coatings 2021, 11, 1253. [CrossRef]
- Guinault, A.; Sollogoub, C.; Domenek, S.; Grandmontagne, A.; Ducruet, V. Influence of crystallinity on gas barrier and mechanical properties of PLA food packaging films. Int. J. Mater. Form. 2010, 3(1), 603–606. [CrossRef]
- Jansson, A.; Järnström, L. Barrier and mechanical properties of modified starches. Cellulose 2005, 12, 423–433. [CrossRef]
- Rindlav-Westling, Å.; Stading, M.; Hermansson, A.-M.; Gatenholm, P. Structure, mechanical and barrier properties of amylose and amylopectin films, Carbohydr. Polym. 1998, 36, 217-224. [CrossRef]
- Yang, J.; Tang, K.; Qin, G.; Chen, Y.; Peng, L.; Wan, X.; Xiao, H.; Xia, Q. Hydrogen bonding energy determined by molecular dynamics simulation and correlation to properties of thermoplastic starch films. Carbohydr. Polym. 2017, 166, 256–263. [CrossRef]
- Pawlak, P.; Kippenhahn, R.; Luck, T.; Schönweitz, C. Mehrschichtige Verpackung für fettende Güter, European Patent EP 1 296 790 B1, 25 February 2004.
- Ovaska, S.-S.; Geydt, P.; Österberg, M.; Johansson, L.-S.; Backfolk, K. Heat-Induced changes in oil and grease resistant hydroxypropylated-starch-based barrier coatings. Nordic Pulp Paper Res. J. 2015, 30(3), 488-496. [CrossRef]
- Stading, M.; Rindlav-Westling, Å.; Gatenholm, P. Humidity-induced structural transitions in amylose and amylopectin films. Carbohydr. Polym. 2001, 45, 209-217. [CrossRef]
- Pandey, J.K.; Singh, R.P. Green Nanocomposites from Renewable Resources: Effect of Plasticizer on the Structure and Material Properties of Clay-filled Starch. Starch/Stärke 2005, 57(1), 8-15. [CrossRef]
- Mondragón, M.; Mancilla, J.E.; Rodríguez-González, F.J. Nanocomposites from plasticized high-amylopectin, normal and high-amylose maize starches. Polym. Eng. Sci. 2008, 48, 1261-1267. [CrossRef]
- Johansson, C.; Järnström, L.; Breen, C. Biopolymer based barrier material and method for making the same, PCT Patent WO 2010/077203 A1, 8 July 2010.
- Breen, C.; Clegg, F.; Thompson, S.; Jarnstrom, L.; Johansson, C. Exploring the interactions between starches, bentonites and plasticizers in sustainable barrier coatings for paper and board. Appl. Clay Sci. 2019, 183, 105272. [CrossRef]
- Yano, K.; Usuki, A.; Okada, A.; Kurauchi, T.; Kamigaito, O. Synthesis and properties of polyimide–clay hybrid. J. Polym. Sci. A Polym. Chem. 1993, 31(10), 2493–2498. [CrossRef]
- Yano, K.; Usuki, A; Okada, A. (1997), Synthesis and properties of polyimide-clay hybrid films. J. Polym. Sci. A Polym. Chem. 1997, 35(11), 2289-2294. [CrossRef]
- Weigl, J.; Laber. A.; Bergh, N.-O.; Ruf, F. Oberflächenbehandlung durch Pigmentierung. Wochenblatt Papierfabr. 1995, 123(14/15), 634-645.
- Hlavatsch, J.; Wechselberger, D.; Ruf, F. Streichbentonite – Neuentwicklung mit Perspektive? Wochenblatt Papierfabr. 1997, 125(11/12), 588-594.
- Guezennec, C. Development of New Packaging Materials Based on Micro- and Nano-Fibrillated Cellulose. Ph.D. Thesis, Université de Grenoble, Grenoble, France, 2012; pp. 196–246.
- Al-Turaif, H.; Lepoutre, P. Evolution of surface structure and chemistry of pigmented coatings during drying. Prog. Org. Coat. 2000, 38(1), 43-52. [CrossRef]
- Javed, A.; Rättö, P.; Järnström, L.; Ullsten, H. Lignin-Containing Coatings for Packaging Materials—Pilot Trials. Polymers 2021, 13, 1595. [CrossRef]
- Christophliemk, H.; Bohlin, E.; Emilsson, P.; Järnström, L. Surface Analyses of Thin Multiple Layer Barrier Coatings of Poly(vinyl alcohol) for Paperboard. Coatings 2023, 13(9), 1489. [CrossRef]
- Pignères E.; Gaucel,S.; Coffigniez, F.; Gontard, N.;, Baghe, E.; Lyannaz, L.; Martinez, P.; Guillard, V.; Angellier-Coussy, H. Deciphering the respective roles of coating weight and number of layers on the mass transfer properties of polyvinyl alcohol coated cardboards. Prog. Org. Coat. 2024, 195, 108627. [CrossRef]
- Tanninen, P., Lindell, H., Saukkonen, E., Backfolk, K. (2014). Thermal and mechanical durability of starch-based dual polymer coatings in the press forming of paperboard. Packag. Technol. Sci. 2014, 27(5), 353-363. [CrossRef]
- Menzel, C.¸Koch, K. Impact of the coating process on the molecular structure of starch-based J. Polym. Environ Olsson, E.; Johansson; C.; Larsson. J.; Järnström, L. (2014). Montmorillonite for starch-based barrier dispersion coating — Part 2: Pilot trials and PE-lamination. Appl. Clay Sci. 2014, 97-98, 167-173. [CrossRef]
- Olsson, E.; Johansson, C.; Larsson. J.; Järnström, L. Montmorillonite for starch-based barrier dispersion coating — Part 2: Pilot trials and PE-lamination. Appl. Clay Sci. 2014, 97–98, 167–173. [CrossRef]
- Weigl, J.; Grossmann, H. Investigation into the Runnability of Coating Colors at the Blade at High Production Speed. In Proceedings of the 1996 TAPPI Coating Conference, Nashville, TN, USA, 19–22 May 1996; pp. 311–320.
- Kuusipalo, J. PHB/V in Extrusion Coating of Paper and Paperboard—Study of Functional Properties. Part II. J. Polym. Environ. 2000, 8, 49–57. [CrossRef]
- Mesic, B.; Järnström, L.; Johnston, J. Latex-based barrier dispersion coating on linerboard: Flexographic multilayering versus single step conventional coating technology. Nordic Pulp Pap. Res. J. 2015, 30, 350–360. [CrossRef]
- Emilsson, P.; Larsson, T.; Järnström, L. Multiple barrier application for improved overall efficiency. In Proceedings of the PTS Coating Symposium, Papiertechnische Stiftung PTS, Munich, Germany, 16–17 September 2015; pp. 343–359.
- Olsson, E.; Johansson, C.; Järnström, L; Montmorillonite for starch-based barrier dispersion coating — Part 1: The influence of citric acid and poly(ethylene glycol) on viscosity and barrier properties. Appl. Clay Sci. 2014, 97–98, 160–166. [CrossRef]
- Heilmann, W. Drying of Functional Coatings. In Proceedings of the PTS Coating Symposium, Papiertechnische Stiftung PTS, Bamberg, Germany, 13–14 September 2023; p. 1.8.
- Alam, A.; Thim, J.; Manuilskiy, A.; O’Nils, M.; Westerlind, C.; Lindgren, J.; Lidén, J. MECHANICAL PULPING: Investigation of the surface topographical differences between the Cross Direction and the Machine Direction for newspaper and paperboard. Nordic Pulp Pap. Res. J. 2011, 26, 468-475. [CrossRef]
- Nyflött, Å.; Axrup, L.; Carlsson, G.; Järnström, L.; Lestelius, M.; Moons, E.; Wahlström, T. Influence of kaolin addition on the dynamics of oxygen mass transport in polyvinyl alcohol dispersion coatings. Nord. Pulp Pap. Res. J. 2015, 30, 385–392. [CrossRef]
- Larsen, H., Kohler, A., Magnus, E.M. Ambient oxygen ingress rate method — An alternative method to Ox-Tran for measuring oxygen transmission rate of whole packages, Packag. Technol. Sci. 2000, 13, 233-241. [CrossRef]
- Lourdin, D.; Colonna, P.; Ring, S.G. Volumetric behaviour of maltose-water, maltose-glycerol and starch-sorbitol-water systems mixtures in relation to structural relaxation. Carbohydr. Res. 2003, 338, 2883-2887. [CrossRef]
- Uddin, F. Clays, Nanoclays, and Montmorillonite Minerals. Metall Mater Trans A 2008, 39, 2804–2814. [CrossRef]
- Jäder, J.; Engström, G. Frequency analysis evaluation of base sheet structure in a pilot coating trial using different thickener systems. Nordic Pulp Pap. Res. J. 2004, 19(3), 360-365. [CrossRef]
- Larsson, T.; Emilsson, P. Optimization of coating with water-based barriers. Tappi J. 2019, 18(2), 111–118.
- Hedman, A.; Gron, J.; Rigdahl, M. Coating layer uniformity as affected by base paper characteristics and coating method. Nordic Pulp Pap. Res. J. 2003, 18(3), 333-343. [CrossRef]
- Trinh, B.M.; Chang, B.P.; Mekonnen, T.H. The barrier properties of sustainable multiphase and multicomponent packaging materials: A review. Prog. Mater Sci. 2023, 133, 101071. [CrossRef]
Figure 2.
Contour images of (a) BASE, (b) A6, (c) B6, (d) MB6, (e) RSB1 and (f) RDB2. Image size is 10 mm x 10 mm. The bar to the right indicates the z-axis in μm.
Figure 2.
Contour images of (a) BASE, (b) A6, (c) B6, (d) MB6, (e) RSB1 and (f) RDB2. Image size is 10 mm x 10 mm. The bar to the right indicates the z-axis in μm.
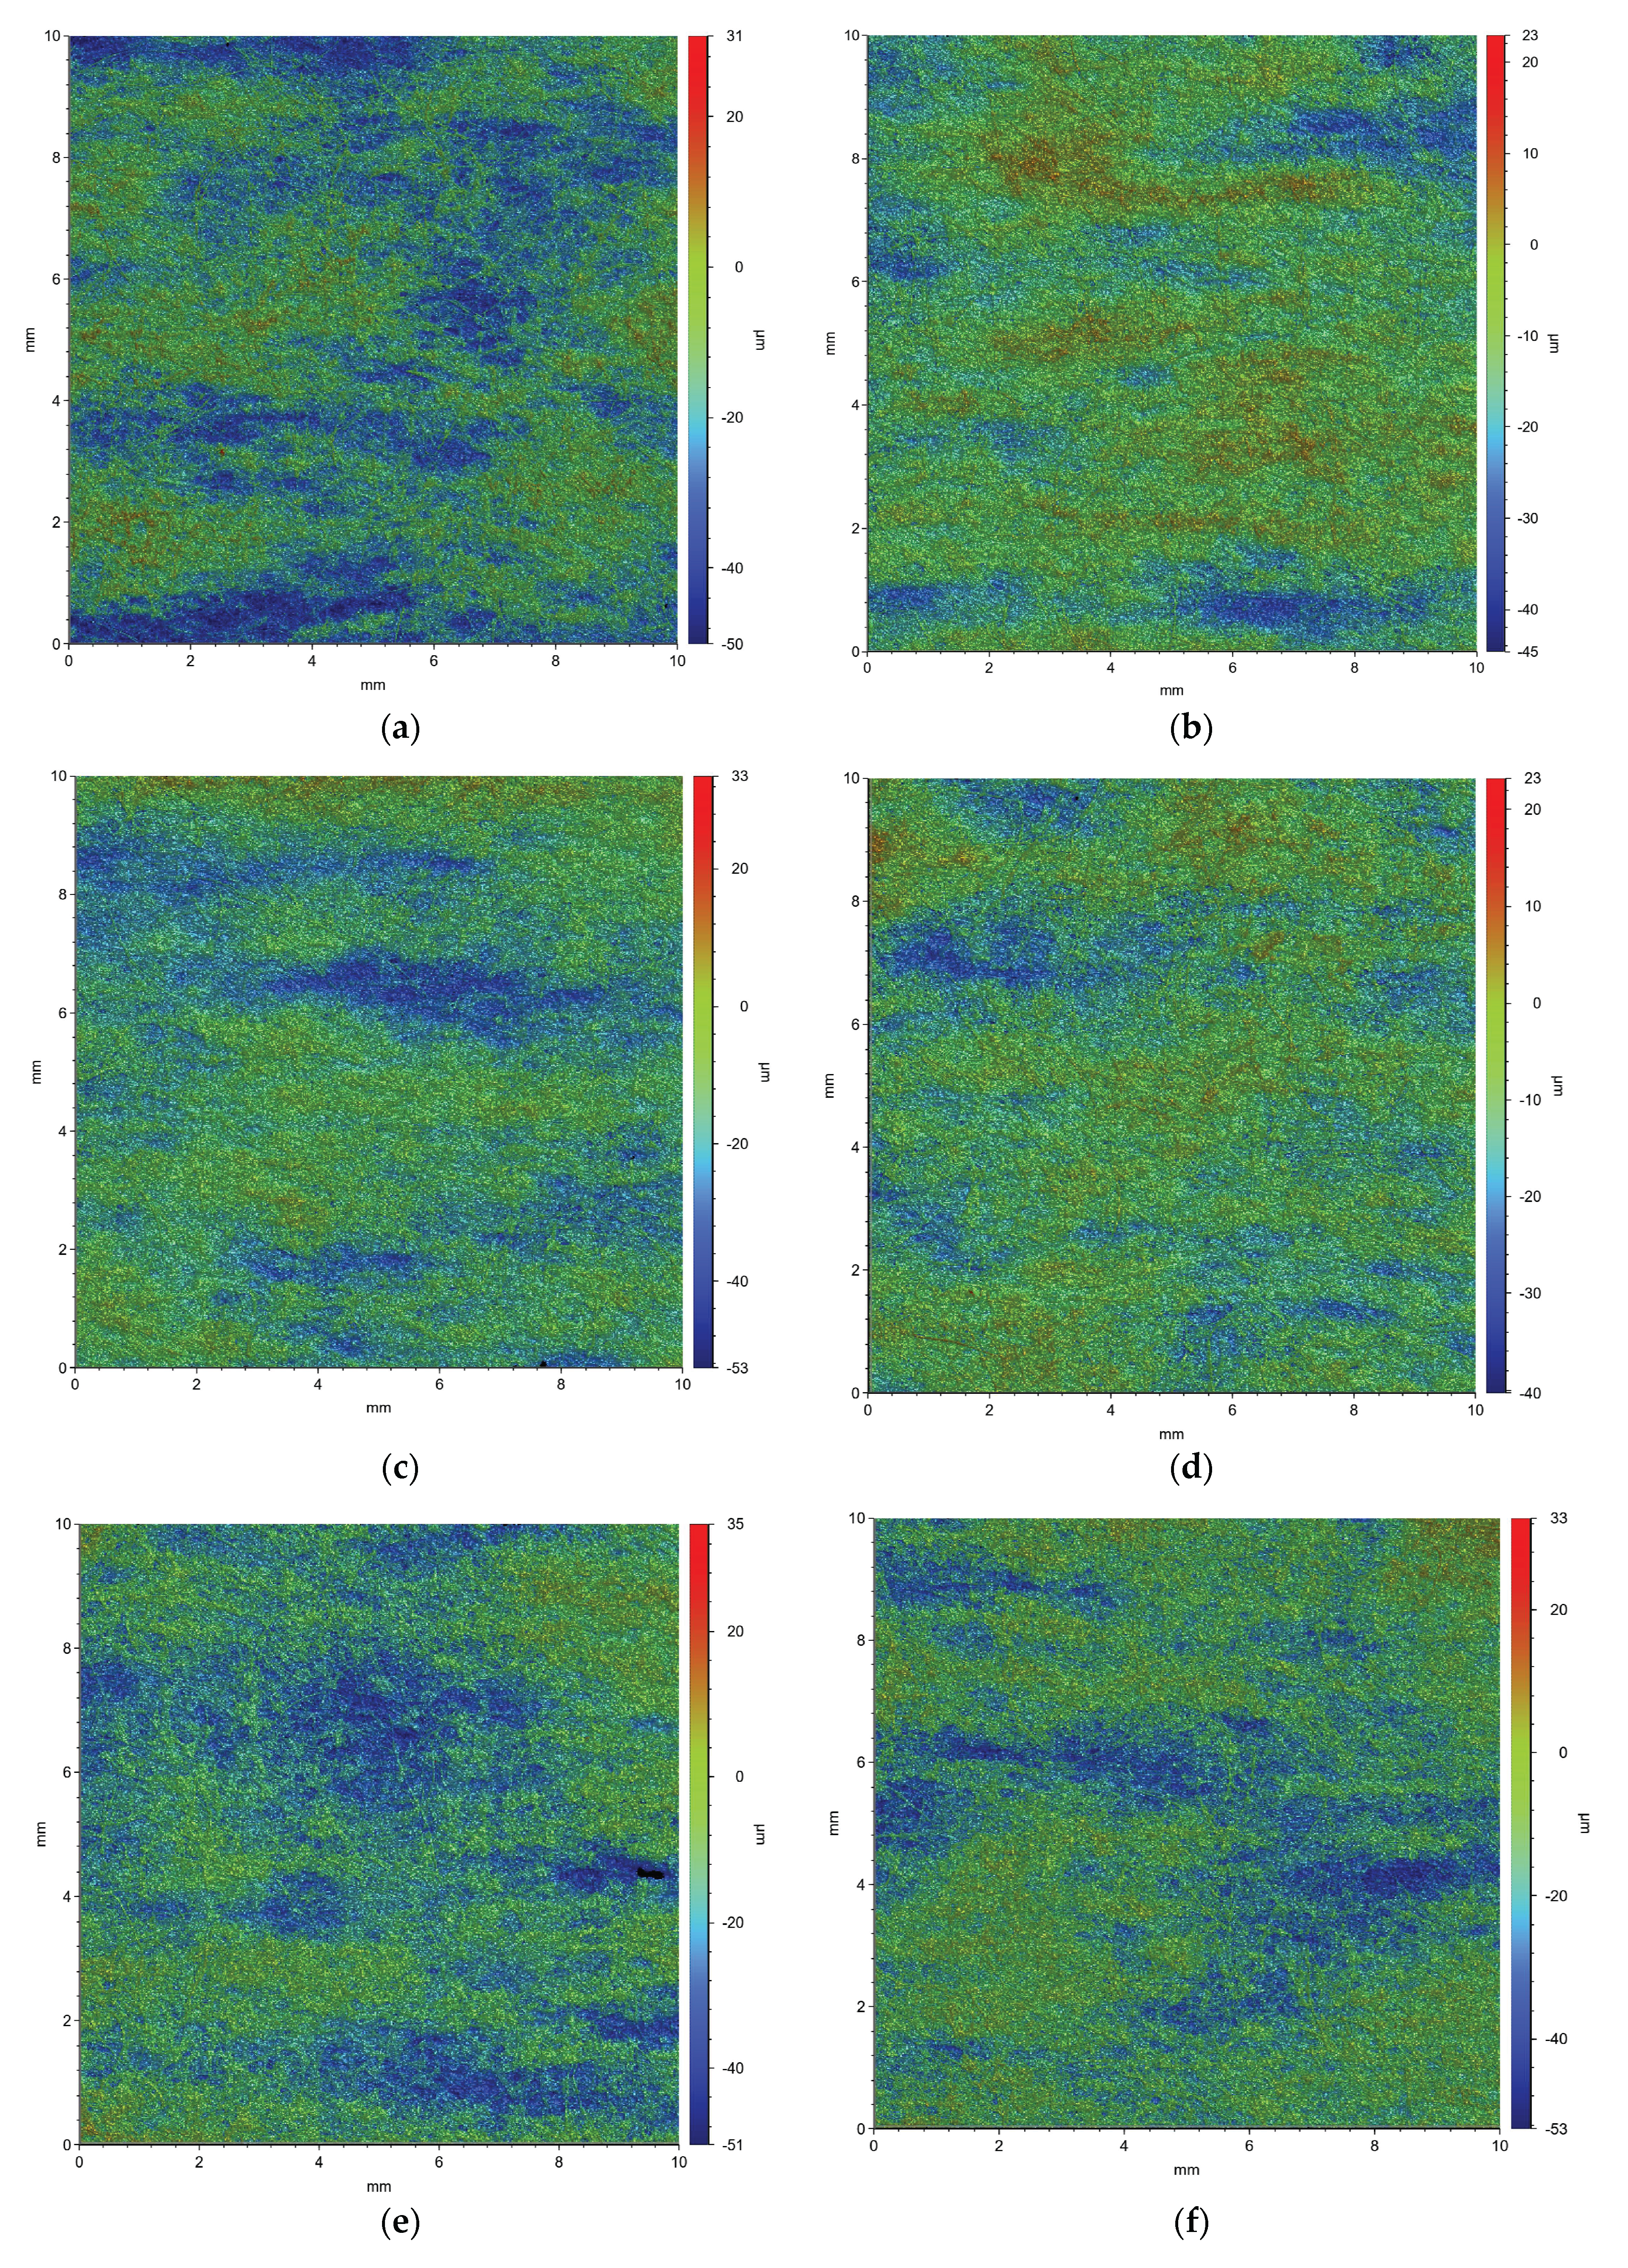
Figure 3.
Oxygen concentration vs. time for BASE and Series A. Mean values of two repeated measurements. Lines are included in order to increase the visibility.
Figure 3.
Oxygen concentration vs. time for BASE and Series A. Mean values of two repeated measurements. Lines are included in order to increase the visibility.
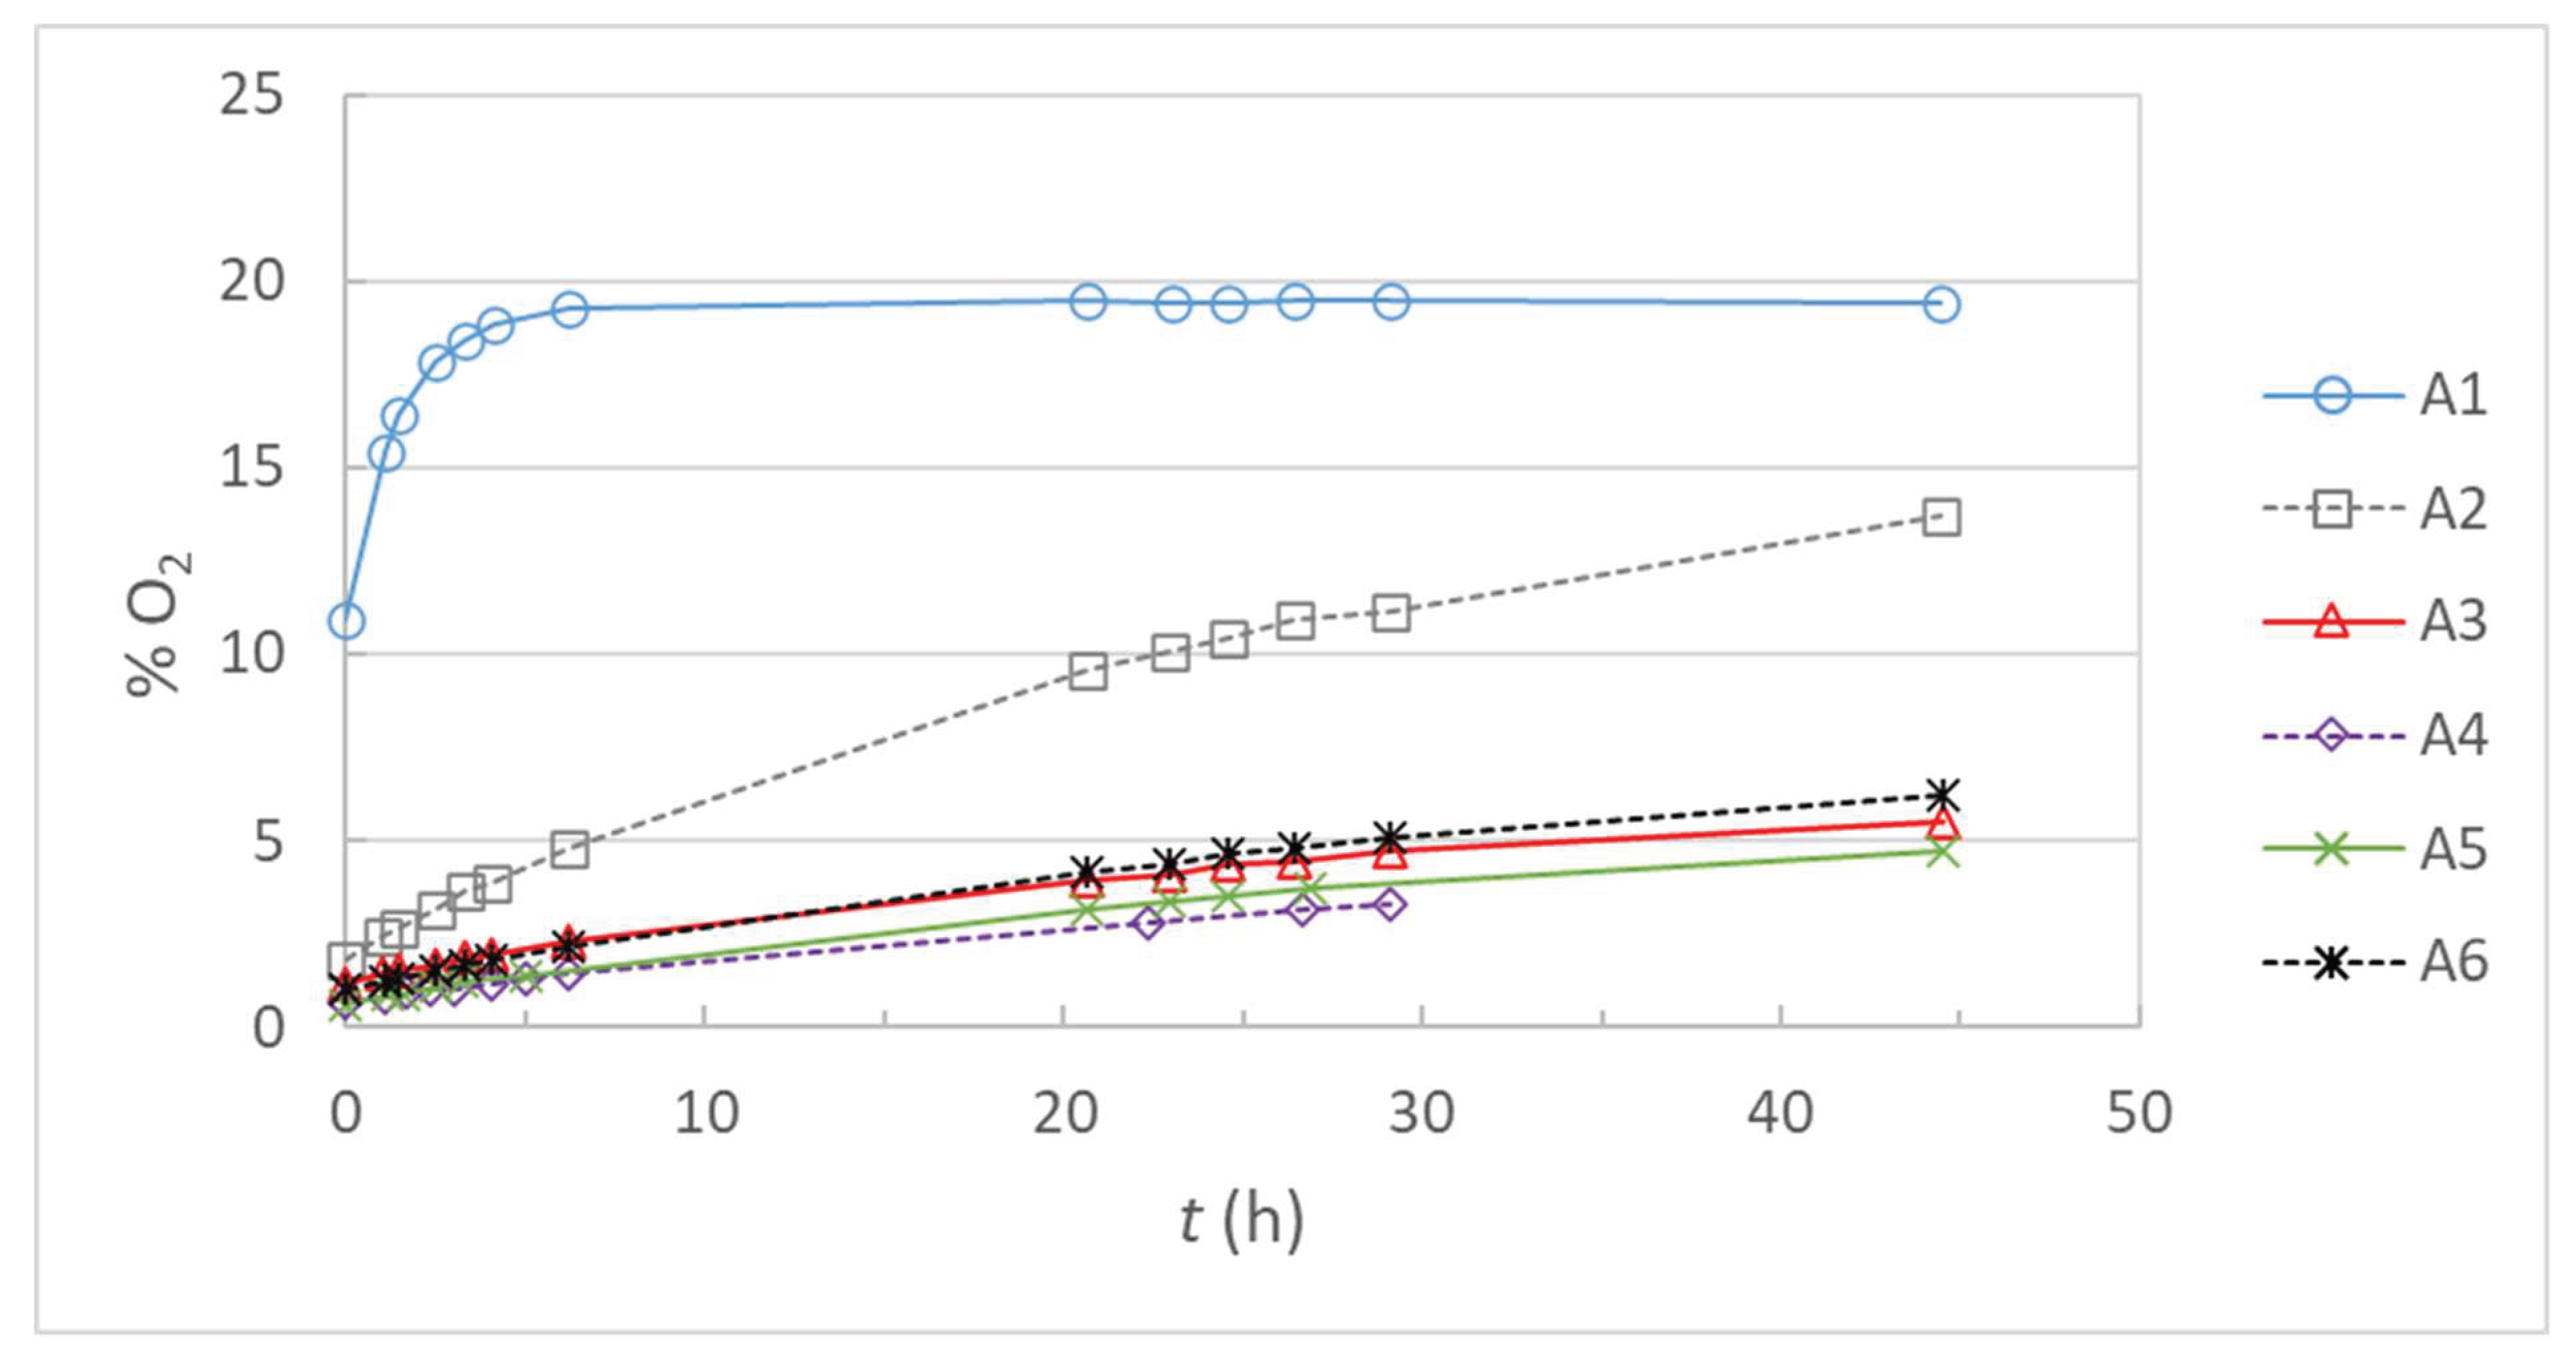
Figure 4.
Oxygen concentration vs. time for BASE and reference samples RSB1, RSB1 and RSB2. Mean values of two repeated measurements. Lines are included in order to increase the visibility.
Figure 4.
Oxygen concentration vs. time for BASE and reference samples RSB1, RSB1 and RSB2. Mean values of two repeated measurements. Lines are included in order to increase the visibility.
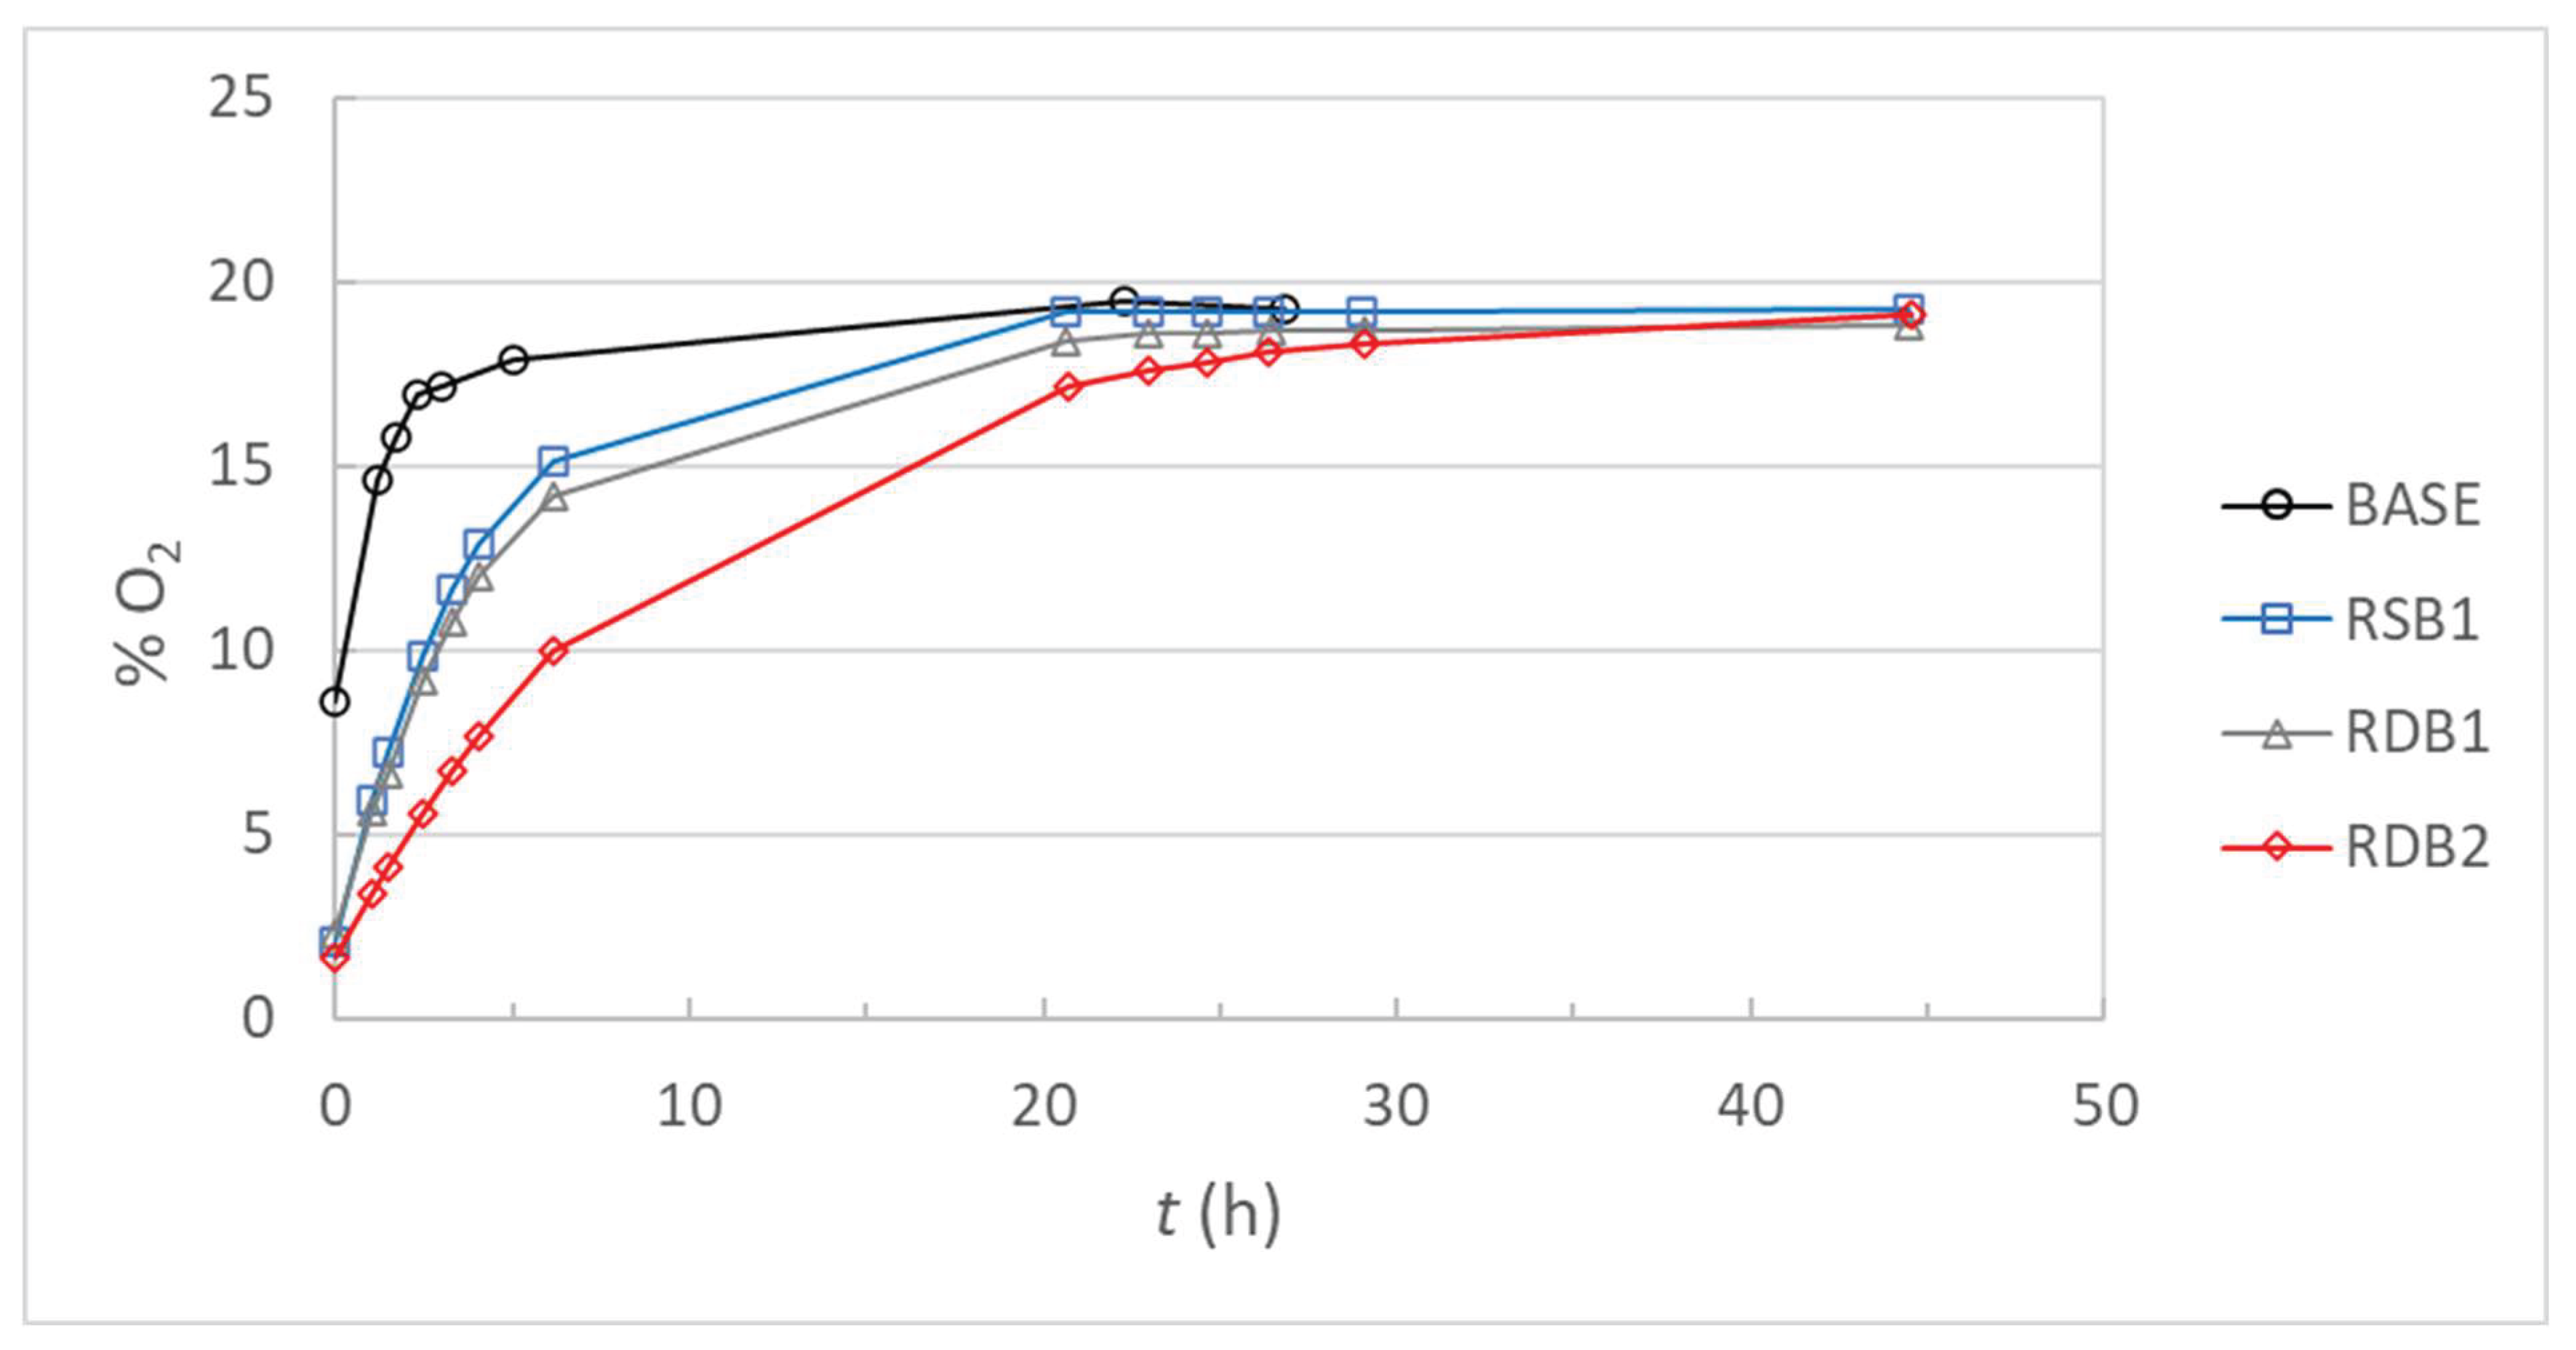
Figure 5.
Oxygen concentration vs. time for B6 and MB6. Mean values of two repeated measurements. Lines are included in order to increase the visibility.
Figure 5.
Oxygen concentration vs. time for B6 and MB6. Mean values of two repeated measurements. Lines are included in order to increase the visibility.
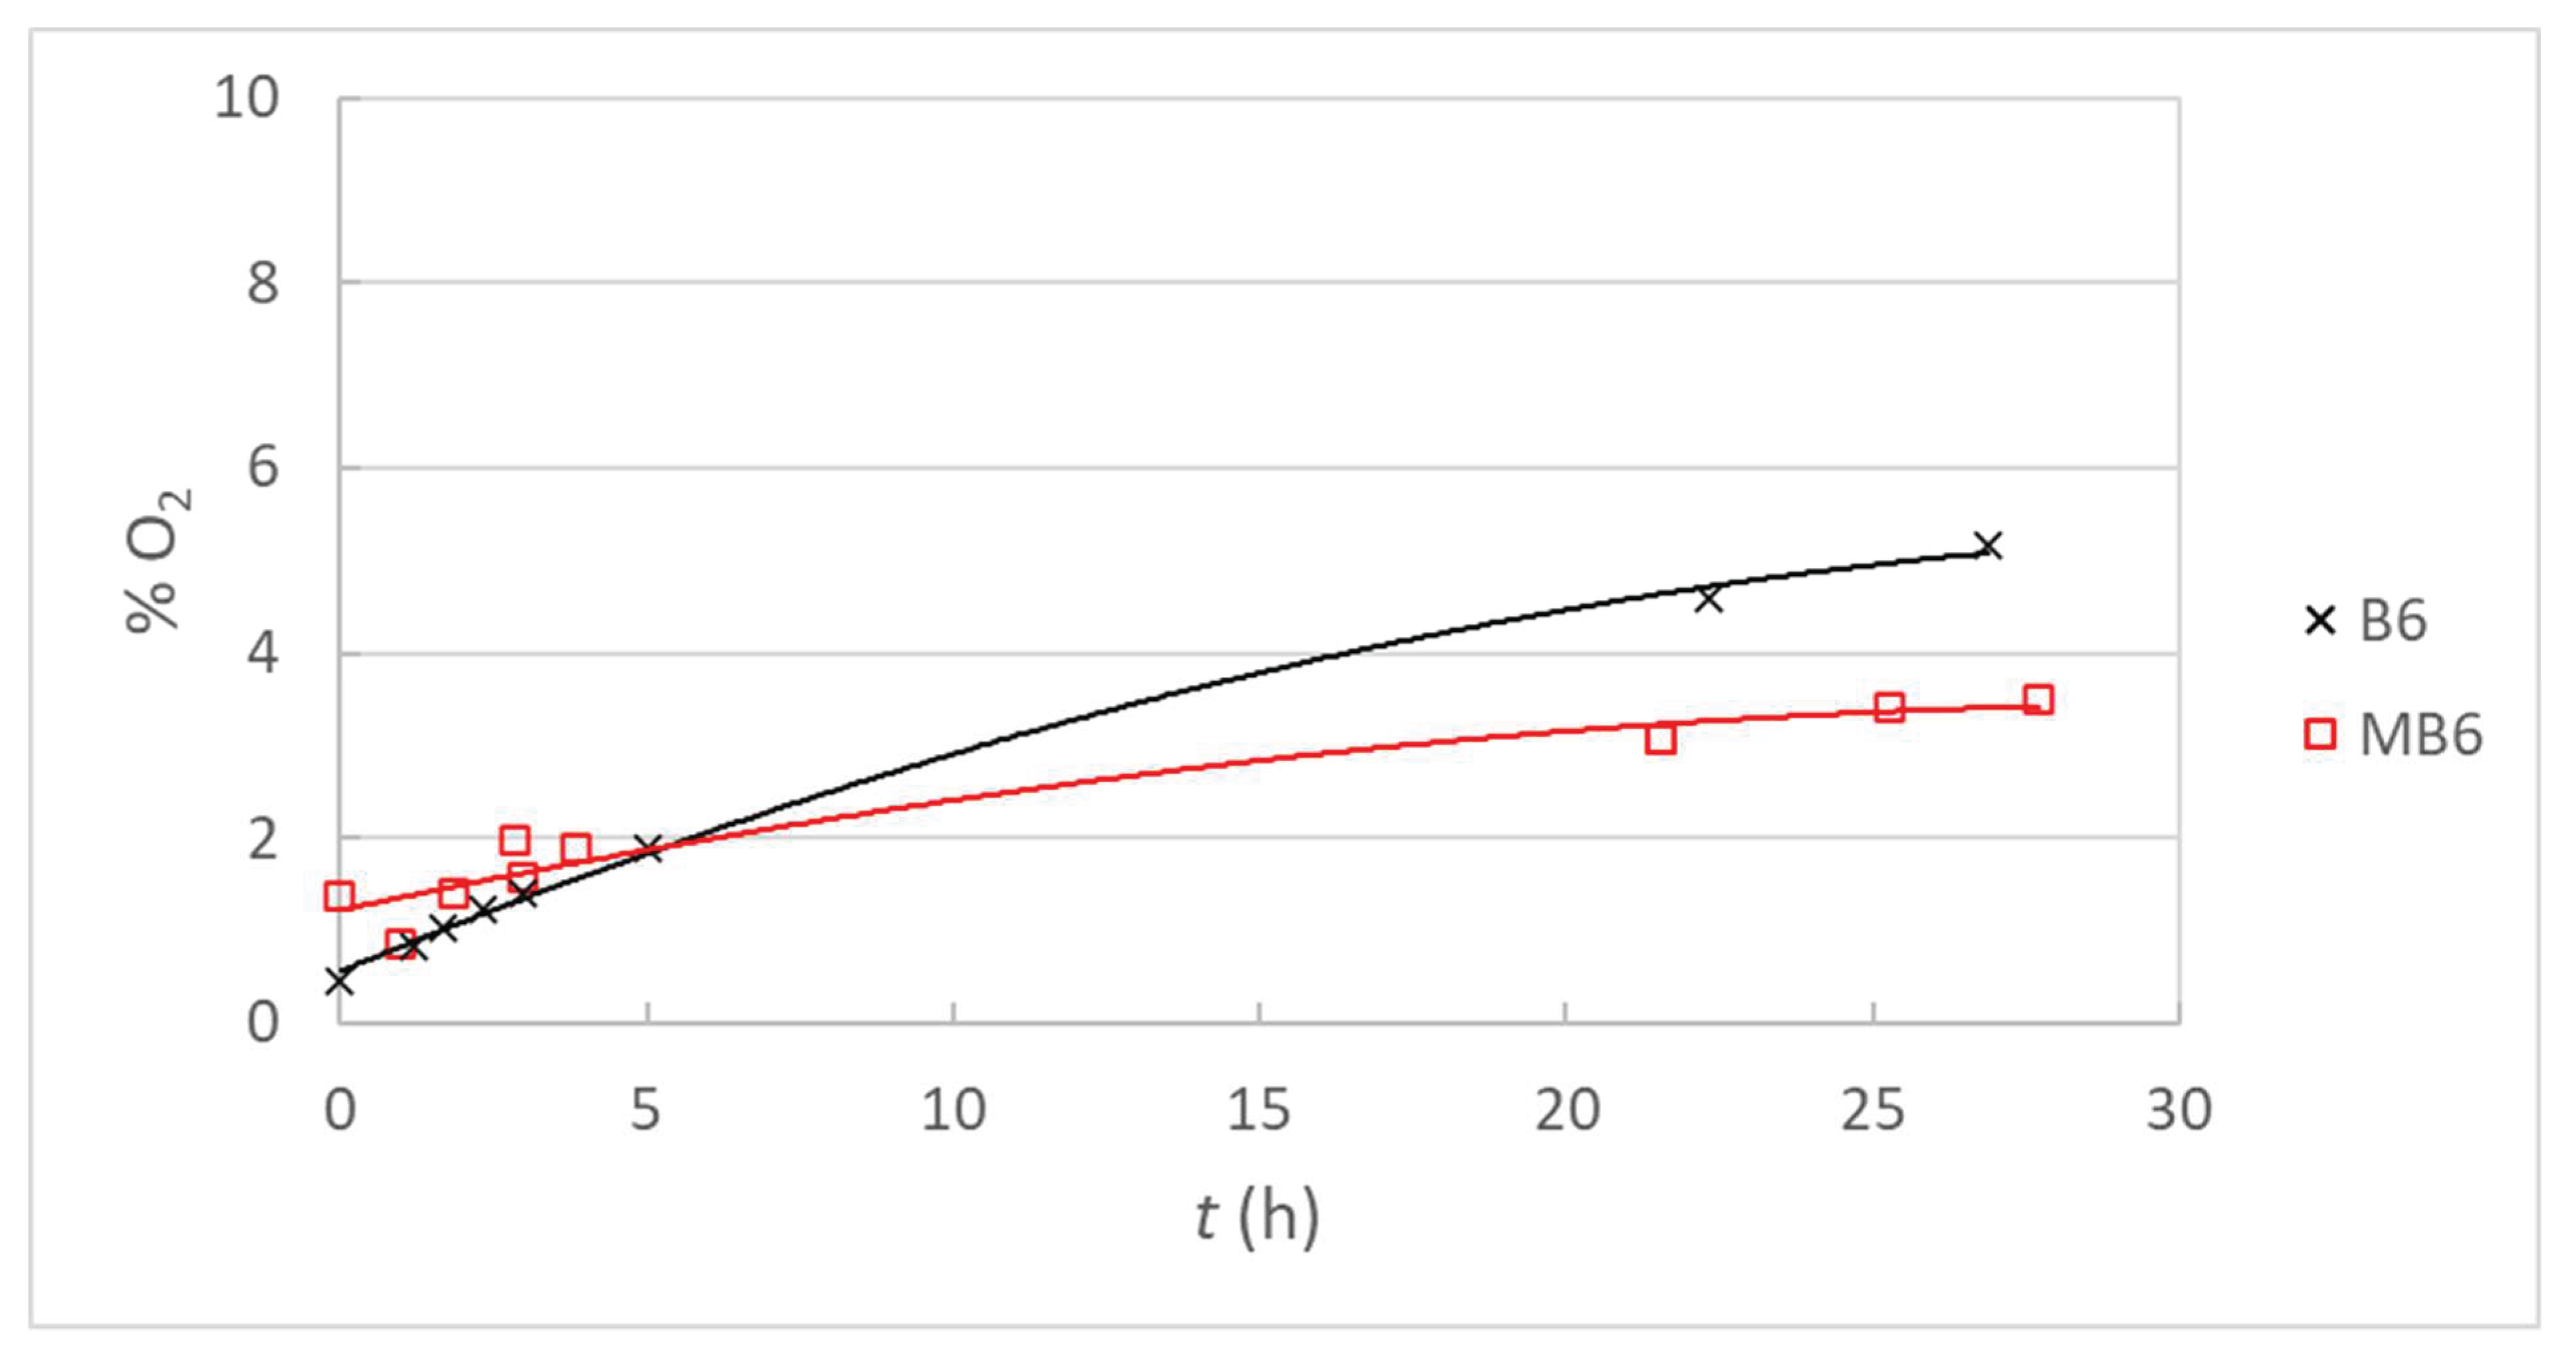
Table 1.
Composition of the barrier dispersion. Dry solid content of the constituent parts, dry mass of the components used during the preparation and coating formulation. The formulation is given as parts (by wt.) per hundred parts of dry bentonite (pph).
Table 1.
Composition of the barrier dispersion. Dry solid content of the constituent parts, dry mass of the components used during the preparation and coating formulation. The formulation is given as parts (by wt.) per hundred parts of dry bentonite (pph).
| Component |
Dry Solid Content (%) |
Dry Mass (kg) |
Coating Formulation (pph) |
| Bentonite, aqueous suspension | 8.5 | 26.6 | 100 |
| Bentonite, powder | 92.5 | 3.8 | |
| Starch, aqueous solution | 26 | 76.7 | 252 |
| PEG 600 (liquid) | 100 | 15.3 | 50 |
Table 3.
List of selected roughness parameters that were obtained from analyses of surface profiler images.
Table 3.
List of selected roughness parameters that were obtained from analyses of surface profiler images.
| Symbol | Name | Description |
| Sa | Average roughness over a measurement area | Arithmetic mean of the absolute values of the surface departures from the mean plane. |
| Sc | Core void volume | This parameter is derived from bearing analyses and expresses the volume (e.g., of a fluid filling the core surface) that the surface would support from 10% to 80% of the bearing area ratio. |
| Sv | Surface void volume | This parameter is derived from bearing analyses and expresses the volume (e.g., of a fluid filling the valleys) that the surface would support from 80% to 100% of the bearing area ratio. |
Table 4.
Bendtsen roughness and number of pinholes for multiple coated paperboards and thick single- and double-coated paperboard. Error limits indicate standard deviation. A minor portion of the pinhole results are derived from the work by Emilsson et al. [71].
Table 4.
Bendtsen roughness and number of pinholes for multiple coated paperboards and thick single- and double-coated paperboard. Error limits indicate standard deviation. A minor portion of the pinhole results are derived from the work by Emilsson et al. [71].
| Sample name |
Roughness (ml/min) |
Pinholes (number/dm2) |
| Base paperboard | ||
| BASE | 1119±139 | >30 |
| Series A—IR 20% | ||
| A1 | 883±165 | >30 |
| A2 | 765±141 | 19.0±3.6 |
| A3 | 691±151 | 4.6±2.0 |
| A4 | 676±152 | 1.6±1.2 |
| A5 | 495±64 | 0.0±0.0 |
| A6 | 490±134 | 0.0±0.0 |
| Modified Series A—IR 80% | ||
| MA2 | 881±134 | >30 |
| MA3 1 | Not measured | Not measured |
| Series B—IR 40% | ||
| B1 | 861±135 | >30 |
| B2 | 770±148 | >30 |
| B3 | 687±112 | >30 |
| B4 | 584±156 | >30 |
| B5 | 585±100 | >30 |
| B6 | 496±126 | 9.4±3.4 |
| Modified Series B—IR 40%—half of the IR elements are active | ||
| MB6 | 482±82 | 0.0±0.0 |
| Reference thick single coating | ||
| RSA1 | 527±89 | >30 |
| RSB1 | 689±135 | >30 |
| Reference thick double coating | ||
| RDA1 | 526±51 | >30 |
| RDA2 | 662±129 | >30 |
| RDB1 | 474±93 | >30 |
| RDB2 | 431±90 | >30 |
Table 5.
Roughness parameters obtained from analyses of surface profiler images. Sa filtered indicates the average roughness after the elimination of waviness (wavelength cutoff 1 mm). The error limits indicate standard deviation.
Table 5.
Roughness parameters obtained from analyses of surface profiler images. Sa filtered indicates the average roughness after the elimination of waviness (wavelength cutoff 1 mm). The error limits indicate standard deviation.
| Sample name |
Sa unfiltered (μm) |
Sa filtered (μm) |
Sc (cm3/m2) |
Sv (cm3/m2) |
Sc/Sv |
(cm3/m2) |
| Base paperboard | ||||||
| BASE | 6.70±0.35 | 4.42±0.21 | 10.10±0.63 | 0.92±0.06 | 11.1±0.9 | 11.02±0.65 |
| Series A—IR 20% | ||||||
| A5 | 5.85±1.02 | 3.32±0.04 | 8.45±1.19 | 0.82±0.13 | 10.3±0.7 | 9.27±1.31 |
| A6 | 6.05±1.48 | 2.99±0.21 | 8.45±1.63 | 1.01±0.30 | 8.5±1.0 | 9.46±1.93 |
| Series B—IR 40% | ||||||
| B5 | 6.02±0.70 | 3.48±0.10 | 8.81±1.00 | 0.89±0.04 | 9.9±0.7 | 9.70±1.04 |
| B6 | 6.43±0.99 | 3.23±0.33 | 9.60±1.49 | 0.87±0.07 | 11.0±0.8 | 10.48±1.56 |
| Modified Series B—IR 40%—half of the IR elements are active | ||||||
| MB6 | 4.99±0.52 | 2.99±0.08 | 7.29±0.63 | 0.76±0.12 | 9.6±0.8 | 8.06±0.75 |
| Reference thick single coating | ||||||
| RSA1 | 7.60±2.03 | 4.83±0.27 | 11.80±4.35 | 0.97±0.05 | 12.0±3.8 | 12.80±4.40 |
| RSB1 | 7.34±0.87 | 5.07±0.29 | 10.98±1.64 | 0.99±0.04 | 11.0±1.3 | 11.96±1.67 |
| Reference thick double coating | ||||||
| RDA1 | 6.41±0.34 | 4.60±0.19 | 9.25±0.26 | 0.98±0.09 | 9.5±0.6 | 10.22±0.35 |
| RDA2 | 5.74±0.60 | 4.06±0.43 | 8.35±0.88 | 0.87±0.10 | 9.7±0.7 | 9.22±0.96 |
| RDB2 | 6.57±1.09 | 4.08±0.18 | 9.95±2.10 | 0.89±0.05 | 11.2±1.9 | 10.84±2.14 |
Table 6.
Total surface volume (Vs) of the paperboard entering the coater, incremental coat weight and the wet volume of coating dispersion applied after metering (Vwet) in the production of coated samples.
Table 6.
Total surface volume (Vs) of the paperboard entering the coater, incremental coat weight and the wet volume of coating dispersion applied after metering (Vwet) in the production of coated samples.
| Sample name | Paperboard entering the coater |
Vs (cm3/m2) |
Incremental coat weight (g/m2) |
Vwet (cm3/m2) |
| A1 | BASE | 11.02±0.65 | 1.5 | 7.2 |
| A6 | A5 | 9.27±1.31 | 0.5 | 2.4 |
| B1 | BASE | 11.02±0.65 | 1.4 | 6.7 |
| B6 | B5 | 9.70±1.04 | 0.45 | 2.1 |
| MB6 | B5 | 9.70±1.04 | 0.45 | 2.1 |
| RSA1 | BASE | 11.02±0.65 | 5.4 | 25.8 |
| RSB1 | BASE | 11.02±0.65 | 5.4 | 25.8 |
| RDA1 | BASE | 11.02±0.65 | 3.7 | 17.7 |
| RDA2 | RDA1 | 10.22±0.35 | 3.1 | 14.8 |
| RDB1 | BASE | 11.02±0.65 | 3.9 | 18.6 |
Table 7.
AOIR, OTR and Kit rating number for some of the samples presented in Table 2. The upper detection limit for OTR measurements was 1000 cm3/m2day atm. The error limits indicate range.
Table 7.
AOIR, OTR and Kit rating number for some of the samples presented in Table 2. The upper detection limit for OTR measurements was 1000 cm3/m2day atm. The error limits indicate range.
| Sample name |
AOIR (mL/day) |
OTR (cm3/m2day atm) |
Kit Rating Number |
| Base paperboard | |||
| BASE | 663±15 | ||
| Series A—IR 20% | |||
| A1 | 337±44 | ||
| A2 | 43.1±2.1 | ||
| A3 | 13.3±9.4 | ||
| A4 | 5.9±1.9 | 5 | |
| A5 | 9.0±4.2 | 12 | |
| A6 | 11.3±1.9 | 511±267 | 12 |
| Series B—IR 40% | |||
| B6 | 22.9±6.4 | 8 | |
| Modified Series B—IR 40%—half of the IR elements are active | |||
| MB6 | 6.7±0.8 | 12 | |
| Reference thick single coating | |||
| RSB1 | 254±38 | >1000 | |
| Reference thick double coating | |||
| RDB1 | 253±30 | ||
| RDB2 | 135±9 | ||
Disclaimer/Publisher’s Note: The statements, opinions and data contained in all publications are solely those of the individual author(s) and contributor(s) and not of MDPI and/or the editor(s). MDPI and/or the editor(s) disclaim responsibility for any injury to people or property resulting from any ideas, methods, instructions or products referred to in the content. |
© 2025 by the authors. Licensee MDPI, Basel, Switzerland. This article is an open access article distributed under the terms and conditions of the Creative Commons Attribution (CC BY) license (http://creativecommons.org/licenses/by/4.0/).
Copyright: This open access article is published under a Creative Commons CC BY 4.0 license, which permit the free download, distribution, and reuse, provided that the author and preprint are cited in any reuse.


