Submitted:
21 May 2025
Posted:
22 May 2025
You are already at the latest version
Abstract
Background: In underdeveloped nations, treatment non-adherence continues to be a significant barrier to effective disease management. It has a major impact on patients and healthcare systems in public primary health care settings. Patients who do not take their medications as prescribed may be at higher risk for negative health consequences. Polypharmacy, side effects, and drug-related problems are obstacles to medication non-adherence. Next are patient-related issues such multimorbidity, lack of support, chronic drugs, and health literacy. Age-related functional decline may also result in non-adherence. The purpose of this study was to ascertain the prevalence and contributing factors of treatment non-adherence among patients presenting to a public primary healthcare setting in South Africa, despite the fact that non-adherence is a significant public health concern. No such study has been conducted in this context. Methods: Between September and October 2014, a cross-sectional quantitative research using structured-questionnaires was carried out with patients. One hundred individuals were chosen through the use of purposeful sampling. Self-reports from patients were used to gauge non-adherence to therapy. A standardized questionnaire administered by the interviewer was used to gather data, and IBM SPSS version 29 was used for analysis. Patients who were using prescription or over-the-counter drugs and were at least 18 years old were included. The characteristics of the participants were described using descriptive statistics, and the frequencies and percentages of categorical variables were reported. Ratios of odds with 95% Binary variables were analyzed using confidence intervals, and the relationships between related factors and treatment non-adherence were examined using the Pearson Chi-square test; a p-value of less than 0.05 was deemed statistically significant. Findings: Of 100 patients aged 60–80 years, 35% were men and 65% were women, all having a high school diploma. Demographic characteristic associated to non-adherence to treatment were gender (p=0.028, age (p=0.030), chronic conditions (p< 0.001), time to the clinic (p=0.018), mode of transport (p=0.010), both alcohol and recreational drugs (p< 0.001), patient reminders (p< 0.001), waiting time to get treatment and treatment by healthcare providers (p< 0.001). Alcohol consumption (R (OR 22.25[95%CI: 8.54-57.98], p < 0.001) and Recreational drugs (OR 8.73[95%CI:5.01-15.98], p< 0.001).
Keywords:
non-adherence
; primary healthcare
; evidence-based nursing
; primary care
1. Introduction
The simplest way to understand non-adherence is to think about how a person interacts with a particular illness or therapy in a social and environmental setting [1]. Stewart et al. (2023) [2] state that a complex interaction of socioeconomic, healthcare system, and patient variables affects non-adherence to treatment in public primary healthcare settings. Poor health literacy, ignorance about the disease and its treatment, fear of side effects, and mental health disorders like anxiety or depression are all patient-related issues, according to Martin et al. (2005) [3]. Factors associated to the healthcare system include things like inadequate communication between patients and healthcare professionals, lengthy wait times, and restricted access to care (Al-Worafi, 2024) [4]. In their research, Burch et al. (2016) [5] found that socioeconomic variables including unemployment, low income, and a lack of social support can also have a big influence on adherence.
Poorer treatment results are linked to medication non-adherence [6]. According to the findings of several authors, including Luga & McGuire (2014) [7] and Cutler et al. (2018) [8], the burden of healthcare in terms of high resource use and extravagant costs for patients and society may increase if patients do not receive the anticipated health benefits due to medication non-adherence. Oliveira et al. (2024) [9] concluded from their study on medication adherence in adults that medication adherence is a critical component of managing chronic diseases and is critical to attaining favorable treatment results. Just 50% of patients with chronic illnesses in wealthy nations take their medications as directed, according to a 2003 World Health Organization (WHO) [10] study.
The prescription of a pharmaceutical medication is one of the most prevalent interventions in industrialized health economies, where medications are necessary treatments for the majority of chronic diseases, according to the findings of a study conducted by Bronkhorst et al. (2014) [11]. But according to WHO (2003) [12], non-adherence is still a major obstacle to getting the most out of prescription drugs, particularly for chronic illnesses.
Around half of medications prescribed for chronic diseases were not taken as directed, according to a classic study by the WHO (Sabaté, 2003 [13]; Simpson et al., 2006) [14]. According to a 2018 Organization for Economic Co-operation and Development (OECD) report [15], inadequate medication adherence is thought to be a contributing factor in almost 200,000 preventable deaths in Europe annually. The significant financial burden of non-adherence is also highlighted in this report, “Investing in medication adherence improves health outcomes and health system efficiency,” which estimates that preventable hospitalizations, emergency care, and outpatient visits cost Europe approximately EUR 125 billion yearly.
Significant numbers of patients, especially those with chronic diseases, do not take their prescriptions as directed, according to reports from the WHO and the OECD [16]. Similarly, non-×optimized medication therapy is expected to have a 500 billion USD economic effect in the United States (USA) [17]. Adherence rates in routine clinical practice are below ideal despite these repercussions. Only 50% of patients are expected to stick with long-term therapy, according to the WHO report [17]. Numerous causes of non-adherence have been found since 2003 in a variety of treatment domains and nations [18,19,20]. Notably, a number of authors disclosed that these factors may be located at the level of the patient (e.g., beliefs, cognition, comorbidities, knowledge), the treatment (e.g., side effects, dosage schedule, co-medication), or the health system (e.g., medication accessibility, communication with healthcare providers, social and IT support) [21,22,23,24].
Numerous treatments have been explored to address non-adherence, with variable degrees of success [25,26]. The great majority of these interventions concentrate on a specific component associated with non-adherence [27]. The majority of these therapies have focused on either a treatment-level barrier (like lowering the dosage regimen) or a patient-level barrier (like sending electronic reminders) [28]. The health system’s obstacles to promoting medication adherence (MA) and healthcare professionals’ (HCPs’) management of it are far less well understood. HCPs and patients highlighted that communication issues might affect MA in a qualitative research conducted in the USA [29].
According to Irish health care professionals, continuity of treatment was found to be a crucial requirement for MA [30]. More inter-professional involvement in patient follow-up, better patient education and IT systems, and improved care coordination were identified as major obstacles in a small study of 16 general practitioners in Finland [10]. It is unclear, however, if these findings apply to other European nations and healthcare professionals. Only half of HCPs ask their patients about adherence, according to studies conducted throughout Europe [31], but there is still a dearth of general knowledge of the obstacles that HCPs believe stand in the way of proper MA treatment in Europe.
One of the main factors influencing the effectiveness of therapy is adherence to medicines. Non-adherence is a severe issue that impacts the patient as well as the healthcare system. In their study, Jimmy and Jose (2011) [32] found that patients who do not take their medications as prescribed have significant deterioration of their illness, mortality, and higher health care expenses. Adherence may be impacted by a number of things. In his research, Chia (2008) [33] came to the conclusion that patient, provider, and health system characteristics, together with their interconnections, may be used to alleviate adherence hurdles. Improving medicine adherence will require identifying unique obstacles for each patient and implementing appropriate strategies to get beyond them. In their regular work, medical professionals including doctors, pharmacists, and nurses play a big part in helping patients take their medications as prescribed.
1.1. Conceptual Framework Correlates and Interventions
A conceptual framework can be employed in a primary care research on treatment non-adherence because it offers an organized method for comprehending and examining the intricate interactions between variables that affect adherence (Stewart et al., 2023) [2]. To increase adherence, this framework may be used to pinpoint important factors, connections, and possible treatments. The best way to understand non-adherence is to look at how a person interacts with a particular illness or therapy in a social and environmental setting. The result of talent and drive is adherence. In addition to more “instinctive,” intuitive, and habitual processes, motivation also includes cognitive decision-making processes.
Ability includes the mental and physical aptitude required to comply. In addition to triggers or cues to actions, which can be internal (such as experiencing symptoms) or external (such as getting a reminder), environmental and social variables also impact motivation and ability. Effective treatments are difficult to find, in part because few of them have a solid theoretical foundation, according to systematic studies of adherence interventions. Individually designed adherence assistance that addresses the unique perceptions (e.g., beliefs about sickness and treatment) and practicalities (e.g., competence and resources) impacting people’s desire and ability to adhere will be more successful.
The key variables include the following factors:
- According to Baryakova et al. (2023) [34], patient-related variables include perceptions of obstacles such as cost, side effects, or absence of symptoms, as well as patient views, attitudes, knowledge, and comprehension of their disease and therapy.
- Treatment-related factors: according to Krousel-Wood et al. (2021) [35], they include the perceived side effects, the number of drugs, and the complexity of the
- treatment plan.
- Healthcare system factors: they include the patient’s experience with the healthcare system, the quality of communication between the patient and provider, and the availability of resources and support, according to Gast et al. (2019) [21].
- Social and environmental factors include factors like social support, access to resources, and cultural beliefs.
Moomba et al. (2019) [36] support the statement by adding that social and environmental factors significantly influence health, encompassing both the social support systems and resources individuals have access to, as well as the cultural beliefs and norms that shape their behaviors and perceptions. These factors, alongside individual choices, collectively impact health outcomes.
According to Bolsewcz et al. (2015) [37], both industrialized and developing nations have identified a number of variables that contribute to poor adherence to ART. According to a research by Ankomah et al. (2016) [38], financial considerations including transportation expenses and food shortages affect adherence. ART adherence may also be adversely affected by social variables, including partner support, disclosure (or lack thereof), stigma and prejudice, religion and family support, and traditional and cultural views.
1.2. Examples of Conceptual Frameworks
The Health Belief Model: According to Holmes et al. (2024) [39], this approach focuses on how patients perceive the advantages, the severity of the sickness, and their vulnerability to It. Moreover, obstacles that affect their health-related behaviors, such as treatment compliance.
The Theory of Planned conduct: According to this theory, attitudes toward the conduct, subjective norms, and perceived behavioral control all have an impact on intentions to behave in a particular way. According to the Perceptions and Practicalities Approach (PaPA): The Theory of Planned Behavior, behavioral intentions are influenced by attitudes toward the behavior, subjective peer norms, and perceived behavioral control. To address each of these constructs, implementation interventions were chosen, according to Bauer et al. (2015) [40]. This method highlights the need of addressing both perceptions and practicality by taking into account both the psychological and practical aspects of adherence.
1.1.2. Connection Between the Two Theories
Drawing from existing conceptual models and new data, Krousel-Wood et al. (2021) [35] offer a broader conceptual framework that includes time preferences, implicit attitudes, and structural determinants of health (SDOH) as new factors that could account for more variation in adherence as measured objectively and subjectively. This model offers recommendations for the planning, execution, and evaluation of treatments aimed at achieving long-term improvements in medication adherence and clinical outcomes for older men and women with hypertension.
1.2. Aim and Objectives
The study sought to ascertain the prevalence of treatment non-adherence and related variables among patients presenting to a South African public primary healthcare environment. This is a unique instance of improving quality and outcome in primary care with evidence-based nursing. The following particular goals were used to accomplish this goal:
- Describe demographics of patients attending the clinic,
- Determine the prevalence of nonadherent to treatment,
- Identify demographic characteristics associated with nonadherence to treatment,
- Assess Healthcare System elements linked to treatment non-adherence.
- Establish Patient-related elements linked to treatment non-adherence
- Ascertain Socio-economic elements linked to treatment non-adherence
2. Materials and Methods
2.1. Study Design, Area, Period
2.1.1. Selection of the Research and Study Design
This was a cross-sectional study that is observational and descriptive in nature. The design was selected because it enabled the researcher to study, appreciate and determine the factors contributing to non-adherence to treatment. The study will benefit the present and the future lives of the patient and impact positively on clinical resources including budget and therapeutic material.
2.2. Study Design
From September 1 to October 30, 2014, a cross-sectional research was carried out in a public basic healthcare clinic in the Eastern Cape of South Africa. A standardized questionnaire was used to measure medication non-compliance in order to ascertain the sociodemographic characteristics and treatment non-adherence of patients receiving public primary healthcare.
2.3. Study Site
The study was carried out at the Mbekweni Public Primary Health Care Center, which is situated in Viedgesville at the mouth of Mbekweni. The clinic serves around 32,769 residents of Viedgesville, which is 15 kilometers away, and Mthatha, which is about 12 km away.
2.4. Study Population, Inclusion, and Exclusion Criteria
Every patient who visited the Mbekweni Primary Health Clinic served as the study’s source population.
Inclusion criteria:
- Adult patients (18 years of age or older) who take medicine from the clinic for any disease and attend the public primary healthcare system were eligible to participate in the research.
- Both males and females
- Participants who are open to taking part in the research
- All races
Exclusion criteria:
- Individuals who declined to take part in the research
- Individuals who were too seriously unwell to answer the interview questions
- Those who did not have a caretaker were also eliminated from the research
2.5. Sample Size Determination and Sampling Technique
2.5.1. Sample Size and Calculation
A single population proportion calculation was used to calculate the sample size, assuming a 95% confidence level, a 5% margin of error, and p = population. Therefore, the formula used to calculate sample size is Slovin’s formula: n = N/(1 + Ne^2) where:
- n = sample size, N = proportion of population size = 526, e = margin of error (<10%)
- n = N/(1 + Ne^2)
- n = 526 / (1 + 526(0.09^2)
- n = 99.98 = 100
Therefore, our sample size was 100.
2.5.2. Data Sampling Strategy
Nonprobability sampling was the method utilized to choose research participants; convenience sampling was employed in this investigation. Targeting both male and female participants as well as a variety of age groups was done in order to cover a wide range of characteristics that influence patient non-compliance with therapy.
Study Variables
Medication non-adherence served as the dependent variable in the result, whereas demographics (gender, age, marital status, educational attainment, and clinical and medication-related factors) were independent categorical variables.
2.6. Data Collection
2.6.1. Data Collection Tool and Data Collectors
The data was collected using a structured questionnaire that was designed with open and closed ended questions in both English and Isixhosa. The questionnaire includes z, 3 = 60–80, 4 = >80), sex (1 = males, and 2 = females. For both sexes the following categories were collected (1 = youth, 2 = middle-aged, 3 = elderly and 4 = old-age), Level of education (1 = illiterate, 2 = primary school, 3= high school and 4 = Tertiary). For patient-related factors (1 = patients who have someone to remind them to take their treatment and patient reminders (1 = child, 2 = grandchild, 3 = mother, 4 = sibling, 5 = grandmother and 6 = sibling). Socio-economic factors (1 = alcohol, 2 = smoke, 3 = drugs, 4 = traditional medicine and 5 = traditional medicine and western medicine). Number of chronic diseases (1 = HPT, 2 = DM, 3 = Arthritis, 4 = TB, 5 = HIV/AIDS, 6 = Epilepsy, 7 = Asthma, 8 = Mental illness).
Patient knowledge about illness (1 = Patient educated about illness, 2 = Patient not educated about their illness), patient not complaint about their medication (1 = Patient educated about side-effects, 2 = patient not educated about side-effects), Patient compliant to their treatment (1 = Patient who take their medication daily, 2 = patient who don’t take their medication daily). Patients’ non-compliance to treatment per illness (1 = HPT, 2 = DM, 3 = TB, 4 = HIV/AIDS, 5 = Epilepsy, 6 = Mental illness). 4 = Arthritis). Patients’ response to treatment (1 = patients who feel better after taking treatment, 2 = people who do not feel better after taking their treatment). The data was then collected by two research assistants, who were supervised by the lead investigator.
2.6.2. Data Collection Techniques
Using a standardized questionnaire, participants were interviewed in-person to achieve the study’s goal. According to the patient’s consent form, participants were told that the information and data collected from them for this study would be kept private and that their names and identification numbers would not be included in the report.
2.7. Data Handling and Analysis
On a computer, data was gathered, cleaned, recorded, and examined using the SPSS statistical software. Software called SPSS 29 was used to enter the coded data that had been gathered. The characteristics of the individuals were described using descriptive statistics, and categorical variables were presented as frequencies and percentages. The relationship between the independent and dependent variables was then examined using Pearson Chi-Square. Binary logistics was used to determine the association between these two factors and the odds ratio, which represents the likelihood of the binary outcome, was ascertained by regression analysis. For every variable, adjusted and crude odds ratios (ORs) with a 95% CI were calculated, and a p-value of less than 0.05 was deemed statistically significant.
Data Reporting
Results from the data analyzed have been presented in the form of tables, bar chats and pie charts.
2.8. Ethical Considerations
The study was conducted in accordance with the Declaration of Helsinki, and the protocol was approved by Walter Sisulu University, Faculty of Medicine & Health Sciences Biosafety Human Ethics Research Committee (HREC). The Project identification number was 071/2014 and issued on 27th August 2014. Furthermore, permission was obtained from OR Tambo Municipality and KSD under which the clinic operates. Finally, permission was obtained from the manager of the clinic where data was collected.
Using a Participant Information Sheet, the research team informed the participants of the study’s goals and advantages prior to data collection. Participants were given an explanation of the study's goals as outlined in the proposal. The participants were then requested to sign a written Consent Form, which was optional, in order to participate in the study. And the participants were told if at any moment they felt like not continuing participating in the project they were free to stop. The researcher and data collectors assured the participants of anonymity and confidentiality of the information as indicated in the patients’ consent form.
3. Results
3.1. Demographic Characteristics of the Study Participants
A value of 35% of the 100 interviewed were men and 65% were women. The majority, 43 percent, were middle-aged, and 45 percent were between the ages of 60 and 80. In terms of education, 40 percent of the participants had completed high school, with 26 (39.5%) females and 13 (40.6%) men having completed high school. In terms of distribution of participants per age, the majority, 38 (58.5%) were elderly. The distribution of participants per gender, majority 31 (47.7%) were females and 14 (40.0%) were elderly males. The distribution of participants per educational level are 26 (47.7%) females and 12 (34.3%) females. In all demographic characteristics the females are the majority (Table 1).
3.2. Patient Related Factors to Non-Adherence
3.2.1. Patient Adherence to Treatment
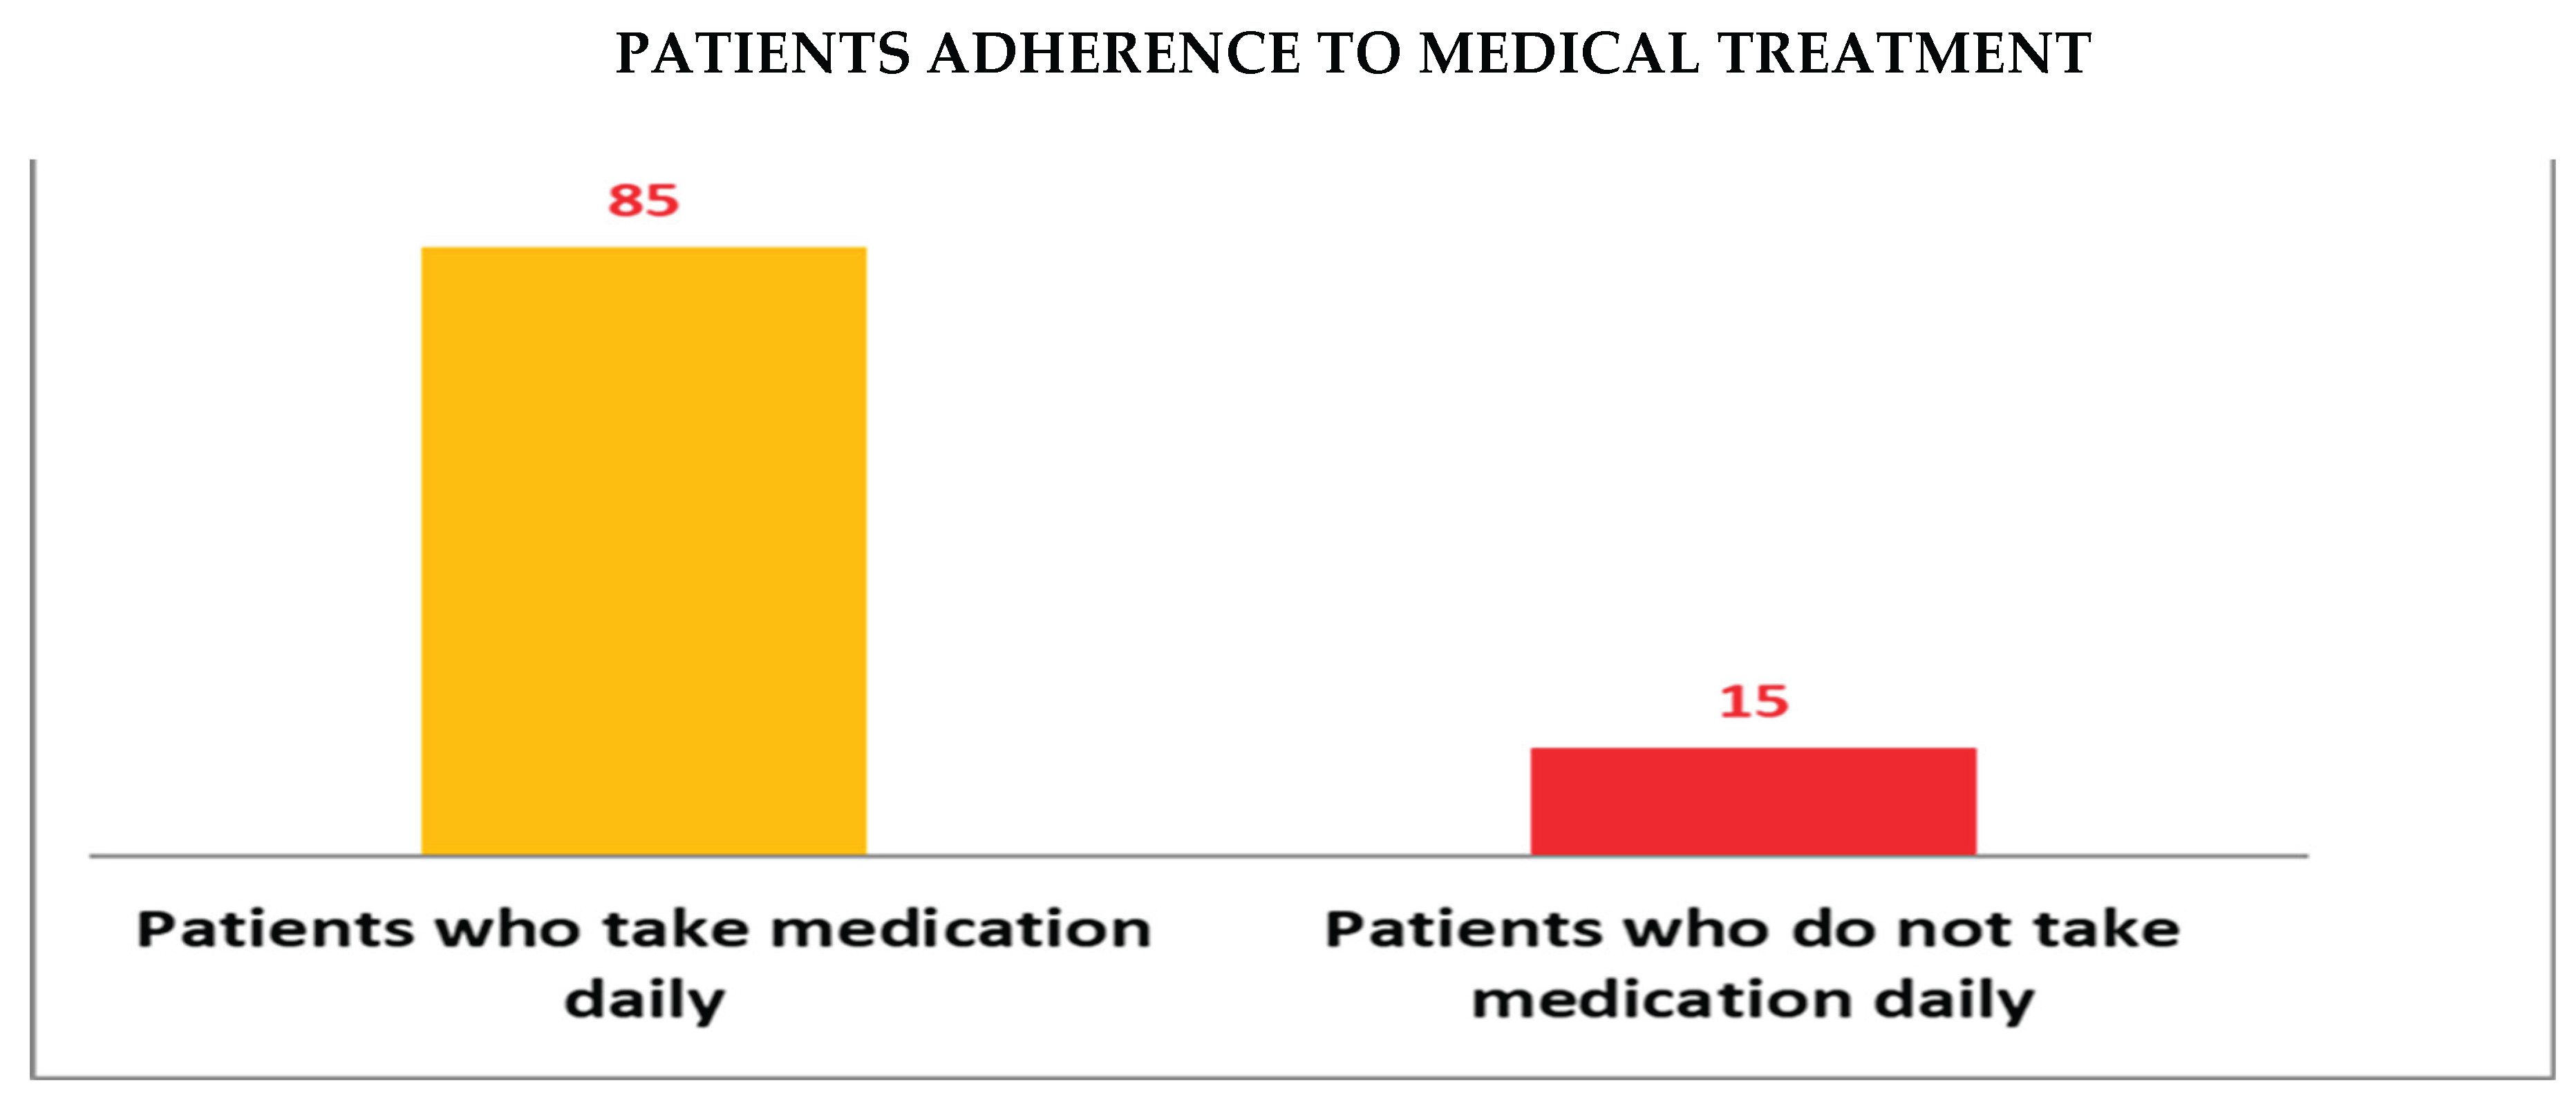
From the results it was established that 85% of patients take their medication daily, while only 15% of patients in the sample are non adherence. (Bar Graph 1).
3.3. Patients’ Non-Adherence with Treatment per Illness
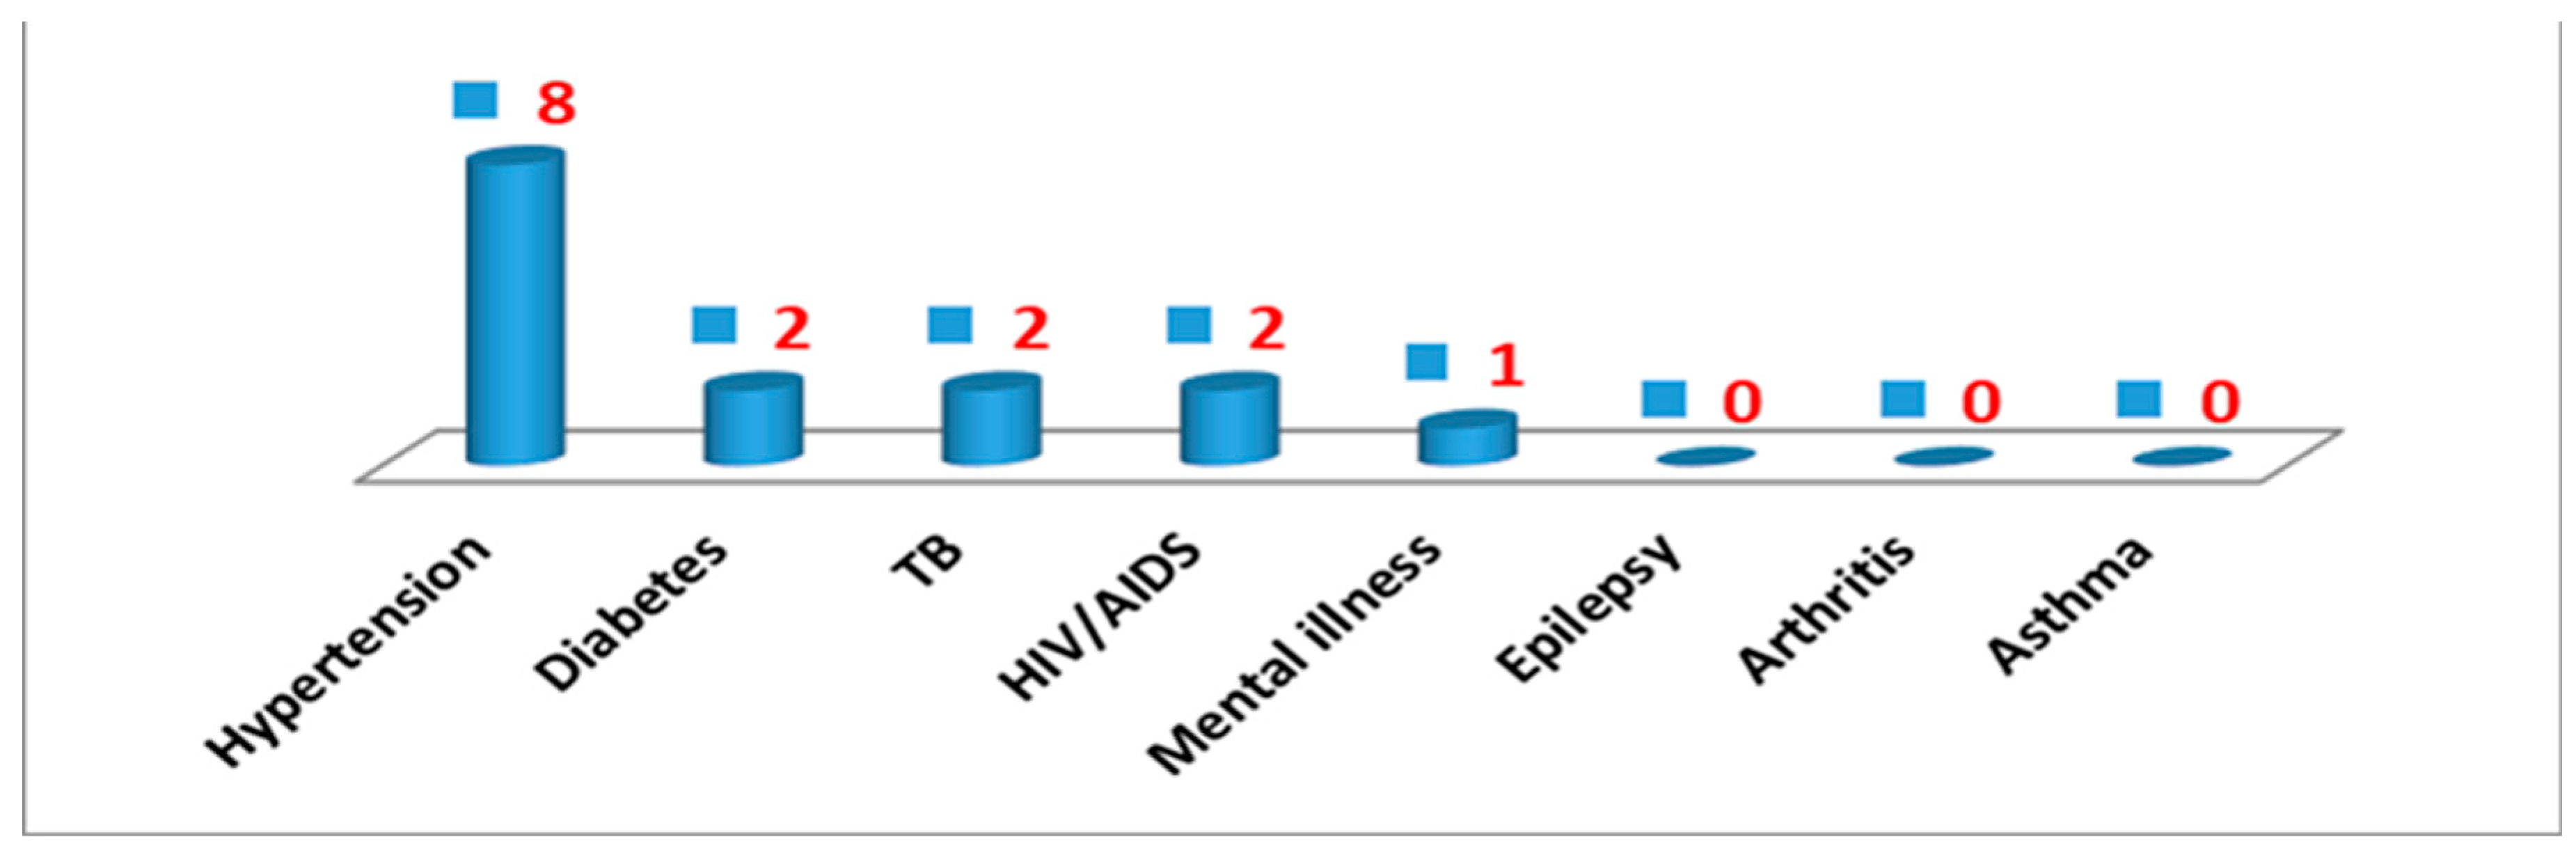
Most patients who are hypertensive are showing non-adherence to treatment followed by diabetes, TB and HIV/AIDS as indicated in Bar Graph 2 below.
3.4. Person to Remind the Patients to Take Their Treatment.
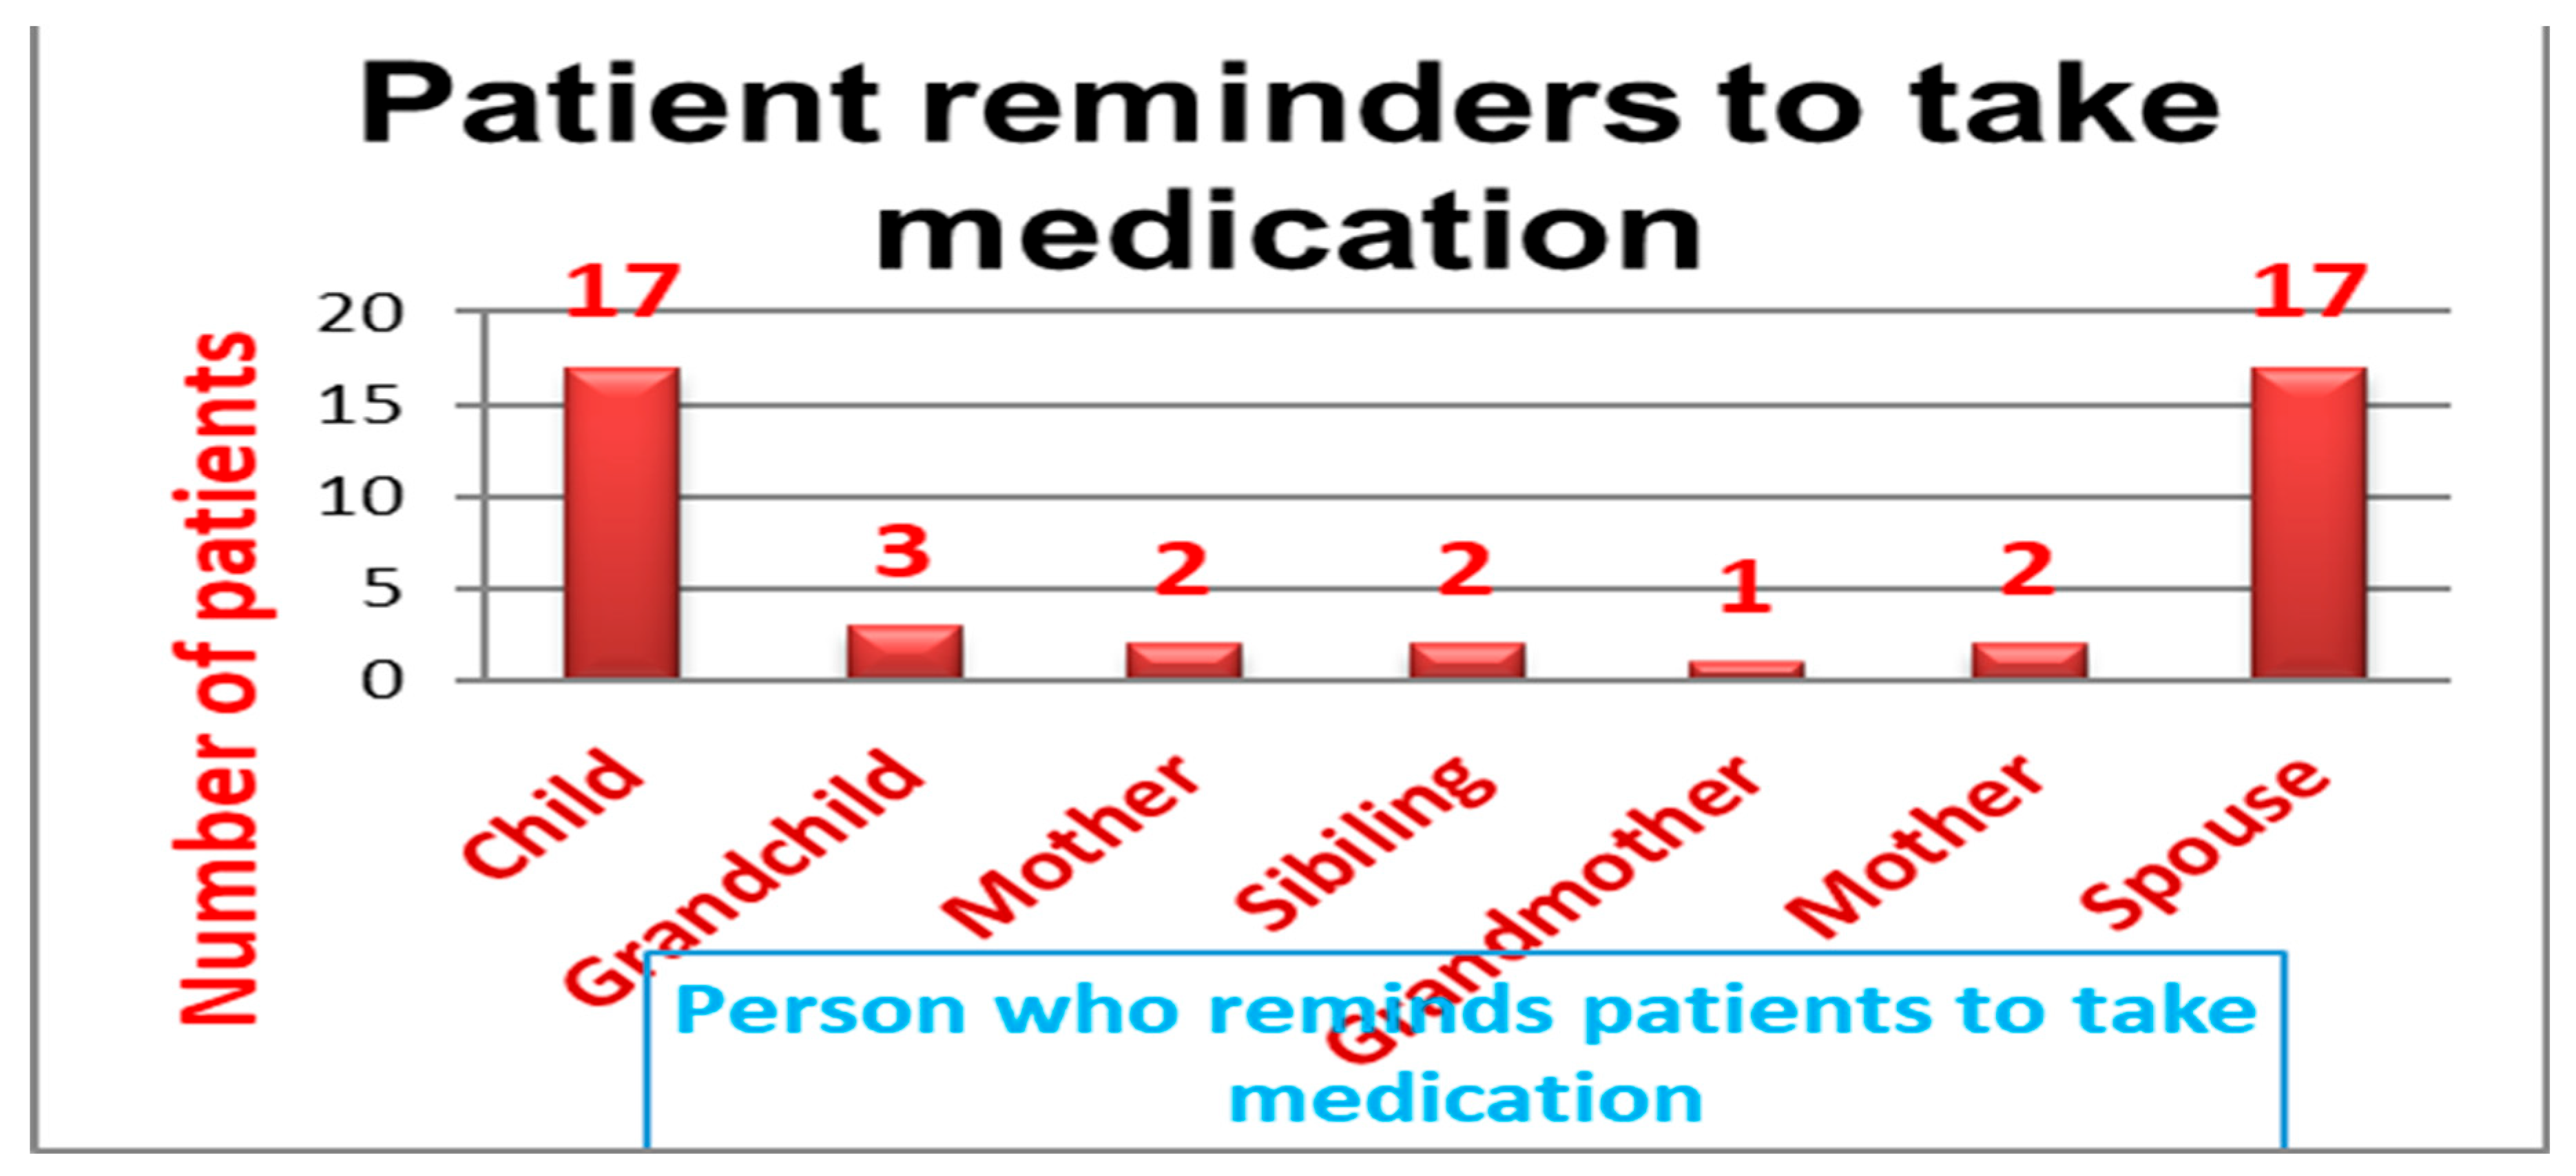
The patients reported that they had someone to remind them to take their medication and were asked to mention those people. The majority reported that the children and spouse reminded them to take their medications both accounting for 17(38.6%), and the least 1(2.3%) said they were reminded by grandmother as demonstrated in Bar Graph 3.
3.5. Number of Meals Taken per Day
It was also important to ask the patients the number of meals they take per day. Some medications require specific timing in relation to meals (e.g., taking them with food, or on an empty stomach). In this study the majority 63(63%) of patients take 3 meals per as shown in Pie Chart 2.
3.6. Factors Linked to Treatment Non-Adherence.
3.6.1. Demographic Characteristics Associated with Nonadherence to Treatment
Demographic characteristics established to be associated with nonadherence to treatment were Gender (p = 0.028), age (p = 0.030), female educational level (p <0.001) and male educational level (p <0.001) as shown in Table 2.
3.6.2. Factors Related to Treatment Non-Adherence in the Healthcare System
The waiting time for patients to obtain treatment at the clinic (p = 0.022), the treatment that patients got from healthcare professionals (p =< 0.001), and the method of transportation (p = 0.010) were all elements in the healthcare system that were linked to non-adherence to treatment. As shown in Table 3, there was no correlation between non adherence and the total distance from home to the clinic (p = 0.110) or the availability of medications (0.509).
3.6.3. Patient-Related Factors Associated with Nonadherence to Treatment
Results from this study revealed that patient related factors associated with non-adherence are: Time it takes for patients to go to the clinic (p = 0.018), Patients with chronic conditions (p < 0.001), Patients who have reminders to take treatment (p < 0.001), Who reminds the patients to take their treatment (p = 0. 011) and Patients response to treatment (p = < 0.001). There is no association of statistical significance between medicine availability and non-adherence to treatment (p = 0.509).

Table 4.
Patient-related factors associated with non-adherence to treatment.
|
Variable Categories |
Non-Compliance |
X2 |
p value |
| Yes No Total | |||
| Time it takes for patients to go to the clinic 0–15mins 16–30mins 31–45mins 46–60mins Total |
4 27 31 2 36 38 4 5 9 5 17 22 15 85 100 |
10.083 | 0.018 |
| Patients with Chronic Conditions Hypertension Diabetes Mellitis Arthritis Tuberculosis HIV/AIDS Epilepsy Asthma Mental Illness Total |
5 22 27 0 25 25 0 10 10 0 10 10 0 10 10 3 6 9 6 2 8 1 0 1 15 85 100 |
40.595 | <0.001 |
| Patients with reminders to take their treatment Yes No Total |
15 39 54 0 46 46 15 85 100 |
15.033 |
< 0.001 |
| Who reminds patients to take their treatment Child Grand Child Mother Sibling Grandmother Spouse Total |
2 15 17 3 0 3 1 3 4 2 0 2 0 1 1 5 12 17 13 31 44 |
14.964 | 0.011 |
3.6.4. Socio-Economic Factors Associated with Nonadherence to Treatment
The odds ratio with 95% CI lower and upper limits and Pearson (X2) Chi-Square (p value) were used to calculate the associations between socioeconomic characteristics and non-compliance. The following socioeconomic factors were statistically significant with non-adherence to treatment: The odds ratio for alcohol use was 8.53 [95% CI: 8.539–57.997], with a p-value of less than 0.001. The odds ratio for those who use recreational drugs was 8.73 [95% CI: 5.005–15.219], with a p-value of less than 0.001.
Socioeconomic characteristics that were not linked to non-adherence included smoking, with an odds ratio of 1.188 [95% CI:1.088, 1.296], p = 0.335. The odds ratio for those who utilize traditional medicine was 0.205 [95%: 0.025, 1.647], with a p-value of 0.103. Lastly, the odds ratio for people who utilize both contemporary and traditional treatment was 0.171[95% CI:0.021–1.375], with p = 0.064. Everything is displayed in Table 5.
4. Discussion of Results
4.1. Key Findings
This study sought to determine treatment non-adherence among patients enrolled in a public health clinic. Of the 100 participants, 35 percent were men and 65 percent were women. Forty percent had completed high school, and the majority, forty-five percent, were between the ages of sixty and eighty. According to the gender breakdown, 13% of men and 26% of women had a high school diploma. There were 15% non-adherent and 85% adherent in terms of non-adherence. Health care systems, patient-related factors, socioeconomic factors, and demographic traits were all linked to non-adherence to treatment.
4.2. Discussion of Key Findings
According to the study’s findings, out of the 100 individuals surveyed, 65% were women and 35% were men. According to a cohort research by Bonolo et al. (2013) [41], non-adherence was 1.5 times more common in women than in men, which is consistent with the findings of this study, which showed that 35% of participants were men and 65% were women. These findings support the necessity of creating treatments in public referral centers that take gender variations into consideration. It is also underlined how crucial it is to comprehend the obstacles to obtaining and using health care services in order to attain and sustain suitable adherence levels.
Participants in this research were mostly between the ages of 60 and 80 (45%). Ghidei et al. (2013) [42] provided support for these findings, indicating that older persons are often thought to be more susceptible to pharmaceutical non-adherence because of things like prescription complexity, side effects, expense, and cognitive loss. However, elderly persons living with HIV may not be included by this generalization. According to the gender breakdown, 13% of men and 26% of women had a high school diploma.
According to the results of the current investigation, medication adherence was significantly predicted by educational attainment. One study claims that high levels of adherence to treatment regimens are a result of educating participants [43]. People with more education are more likely to understand the significance of drugs, which has a big effect on adherence. According to research by Sweileh et al. (2004), patients who were illiterate and could not tell the difference between their prescriptions were more likely to make mistakes, not follow their treatment plans, and had less medical understanding [44].
In terms of non-adherence, results of this study revealed that 85% were adherent and 15% non-adherent. Walsh et al. (2019) [45] revealed that in some studies, nonadherence to treatment has been observed in a range of 85% adherence and 15% non-adherence. According to research conducted in Lesotho, 52.4% of hypertension patients missed visits, and 64.6% had at least one instance of not taking their medicine as directed, according to the Open AIDS Journal. In other cases, >85% adherence was associated with higher treatment success, while >90% adherence did not significantly differ in treatment success. In summary, while a study might show 85% adherence and 15% nonadherence, it's important to remember that nonadherence is a complex issue with varied rates and numerous contributing factors. Understanding these factors is crucial for improving treatment outcomes and patient health.
Several factors were established to be associated with non-adherence to treatment. Results from this study established that demographics that were significantly associated with non-adherence to treatment were gender (p = 0.028). These results are supported by Bonolo et al. (2013) [41] confirming that gender can be a significant factor influencing treatment adherence, with some studies indicating that women may have higher rates of non-adherence compared to men. This disparity can be linked to various factors, including differences in how men and women experience medication side effects, socioeconomic factors, and the societal pressures women face.
Another demographic factor linked to non-adherence was age, which had a statistically significant p value of 0.030. This findings is supported by a cross-sectional study conducted in Hong Kong by Kang et al. (2015) [46], which found that the participants were older (odds ratio [OR] 1.012, 95% CI 1.002–1.022, p = 0.014). Additionally, a research conducted by Ghidei et al. (2013) [42] found that variables such prescription complexity, side effects, expense, and cognitive decline are usually thought to put older persons at higher risk for medication non-adherence.
The educational attainment of both men and women was statistically significant as a demographic component linked to treatment non-adherence (p <0.001). According to the results of the current investigation, medication adherence was significantly predicted by educational attainment. These findings are consistent with a research by Uchmanowicz et al. (2018) [44], which found that persons with more education are more likely to understand the significance of drugs, which has a big effect on adherence. According to a research by Sweileh et al. (2004) [44], patients who were illiterate and could not tell the difference between their medications were more likely to make mistakes, not follow their treatment plans, and had less medical expertise.
A researcher named Al-Worafi et al. (2024) [4] supported the findings of this study by pointing out that treatment by healthcare providers to patients, which was statistically significant with p = < 0.001, is a healthcare system factor that is associated with nonadherence to treatment. Al-Worafi et al. (2024) [4] further supported this study by emphasizing that healthcare system-related factors encompass issues like limited access to care, long waiting times, and poor communication between healthcare providers and patients. Other studies that are supportive of this study are Burch et al. (2016) [5] in their study who revealed that socioeconomic factors such as lack of social support can also significantly impact adherence. A comprehensive understanding of HCPs’ perceived barriers to appropriate MA management in Europe is still lacking, despite the fact that surveys conducted throughout the continent have shown that only half of them ask their patients about adherence [31].
Alinaitwe et al. (2025) [47] found that approximately two out of three (68.7%) of the participants reported a high level of perceived family support, with family members reminding patients to take their medication (65.3%) and providing material support (55.8%) as the most common forms of family support for patients who are likely to forget to take their treatment. The study’s statistically significant value of p = 0.011 aligns with studies that show that individuals who use reminders have significantly higher adherence rates and increased odds of adherence compared to those who do not use reminders.
Patient-related factors associated with non-adherence to treatment were time it takes for patients to go to the clinic. Results in this study were statistically significant (p = 0.018). Results in this study agree with authors Nhlongolwane and Shonisani (2023) [48] who deduced that a significant association exists between the time it takes patients to access healthcare facilities and their adherence to treatment, particularly medication adherence. Long travel times can create logistical challenges for patients, especially those with demanding work or family responsibilities. The time spent traveling can make it difficult to fit in necessary appointments and medication refills, leading to missed doses and potential health complications. Economic factors like transportation costs and lack of food interfere with treatment adherence, according to a study by Ankomah et al. (2016) [38], which supports the findings of this study that found a significant association (p = 0.010) between modes of transportation from home to the clinic.
In this study analysis of chronic conditions patients are suffering from mainly chronic conditions like hypertension, Diabetes Mellitis, etc. There was an association between Chronic illness patients suffer from like HPT with values of p statistically significance of p = < 0.001. These results are supported by WHO report in 2003, that identified that only 50% of patients with chronic diseases in developed countries take their medication as prescribed. Furthermore, another WHO report However, WHO (2003) [12] reported that nonadherence remains a significant barrier to achieving optimum outcomes from appropriately prescribed medicines, especially in long-term conditions experienced by patients in old age.
Other factors associated with non-adherence to treatment are socioeconomic factors like alcohol consumption, Smoking cigarettes, and Reactional drugs. In this study patients analyzed for associations revealed significant values in terms of odd ratios (OR) with 95% Confidence intervals with upper and lower bounds. Results obtained were statistically significant, giving the following values of odds ratio of 8.53 [95% CI: 8.539–57.997], p = <0.001. These results are supported by a study by Velloza et al. (2020) [49] investigators who confirmed that Alcohol consumption, particularly at harmful or hazardous levels, is significantly associated with nonadherence to treatment, particularly for antiretroviral therapy (ART).
Studies consistently show that alcohol use, even moderate amounts, is linked to decrease medication adherence, and hazardous drinking is associated with a fourfold increase in the likelihood of nonadherence. The odds ratio for those who use recreational drugs was 8.73 [95% CI: 5.005–15.219], with a p - value of less than 0.001. In our study, the prevalence of adherence issues was 44.8% among non-users and 64.1% among recreational drug users. A statistically significant correlation between recreational drug usage and lower adherence rates was found by Velloza et al. (2020) [49] based on the findings of the multivariate logistic regression.
The amount of meals patients eat was another socioeconomic element linked to treatment nonadherence. The study found statistically significant results (p = 0.002). This study is supported by the findings of a study by Kalichman et al. (2011) [50], which showed that almost half of non-adherent participants reported recent hunger and that 45% of participants were less than 85% adherent to their prescriptions. Food insufficiency was also linked to non-adherence.
4.3. Strengths and Limitations
A study on non-adherence in South Africa offers valuable insights into healthcare practices and patient behavior but is also subject to limitations.
4.3.1. Strengths
Real-world setting: Studying a public primary healthcare setting provides a realistic view of the challenges and opportunities within the South African healthcare system, according to the provided search results.
Actionable findings: The study can identify factors contributing to non-adherence, which can inform strategies for improving adherence and treatment outcomes, according to the provided search results.
Focus on a specific population:The study focuses on a specific population, which allows for a more targeted approach to interventions, according to the provided search results.
Contribution to knowledge: The study adds to the understanding of non-adherence patterns and associated factors, which can be used to improve public health policies and interventions, according to the provided search results.
4.3.2. Limitations
Potential for bias: The study may be biased by factors such as patient selection, data collection methods, and interpretation of results, according to the provided search results.
Reliance on self-reported data: Self-reported adherence may not accurately reflect actual medication-taking behavior, according to the provided search results.
Challenges in generalization: Findings from a single setting may not be generalizable to other healthcare settings or populations, according to the provided search results.
Potential for confounding variables: According to the search results, adherence may be influenced by factors including socioeconomic position, cultural attitudes, and health literacy, which can also confuse the link between identified factors and adherence.
4.4. Implications and Recommendations
4.4.1. Implications
Poor health outcomes: Non-adherence can lead to treatment failure, increased disease severity, and higher rates of morbidity and mortality.
Increased healthcare costs: Non-adherence can result in more frequent hospitalizations, extended length of stay, and the need for more expensive treatments.
Transmission of infectious diseases: In the context of HIV/AIDS, non-adherence can contribute to viral resistance and continued transmission of the disease.
Reduced quality of life: Non-adherence can negatively impact patients' quality of life by leading to increased symptoms, anxiety, and a sense of loss of control.
4.4.2. Recommendations for This Study
Tailored interventions: Create and carry out therapies that are suited to the unique requirements and conditions of various patient groups.
Improve patient education: Clearly and succinctly explain to patients their prescriptions, treatment plans, and the value of adherence.
Address psychosocial factors: Identify and address psychosocial barriers to adherence, such as stress, anxiety, depression, and lack of social support.
Utilize technology: Utilize technology to support adherence, such as reminder apps, pillboxes, and telehealth.
Strengthen healthcare provider-patient relationships: Foster strong and trusting relationships between healthcare providers and patients.
Promote adherence at the community level: Engage community organizations and leaders to promote adherence and address social determinants of health.
Conduct ongoing research: Conduct ongoing research to identify effective strategies for improving adherence and address emerging challenges.
5. Conclusions
In order to highlight the impact of non-adherence on health outcomes and to guide the development of strategies to improve adherence, a study on medication nonadherence can provide important insights into factors influencing adherence and possible interventions. For instance, studies may identify systemic, social, and psychological factors that contribute to non-adherence, such as complex treatment regimens, lack of knowledge, or financial constraints.
According to The Open AIDS Journal, non-adherence to HIV treatment (ART) can result in treatment failure, drug resistance, and an increased risk of AIDS-related deaths; similarly, non-adherence to cancer treatments (e.g., endocrine therapy) can be associated with an increase in all-cause mortality; and non-adherence to medications for chronic diseases such as diabetes and cardiovascular disease (CVD) can also have a negative impact on health outcomes.
Determining the sociodemographic elements that influence non-adherence, such as age, gender, and educational attainment, is crucial. Patient-related elements, such as the length of time it takes for patients to visit the clinic and the quality of care or assistance they receive from the medical staff. Socioeconomic elements, such as teaching patients about the risks associated with recreational drug use and alcohol use.
Author Contributions
L.N.K.K. conceptualization formal analysis and validation, data collection, creation of the initial draft, writing, editing, and reviewing. Project management included data gathering, analysis, and interpretation; paper preparation; and the choice to publish the findings.
Funding
There was no funding for this study.
Institutional Review Board Statement
The study was conducted in accordance with the Declaration of Helsinki, and the protocol was approved by Walter Sisulu University, Faculty of Medicine & Health Sciences Biosafety Human Ethics Research Committee (HREC). The Project identification number was 071/2014 and issued on 27th August 2014. Furthermore, permission was obtained from OR Tambo Municipality and KSD under which the clinic operates. Finally, permission was obtained from the manager of the clinic where data was collected.
Informed Consent Statement
Using a Participant Information Sheet, the research team informed the participants of the study’s goals and advantages prior to data collection. Participants were given an explanation of the study's goals as outlined in the proposal. The participants were then requested to sign a written Consent Form, which was optional, in order to participate in the study. And the participants were told if at any moment they felt like not continuing participating in the project they were free to stop. The researcher and data collectors assured the participants of anonymity and confidentiality of the information as indicated in the patients’ consent form.
Data Availability Statement
Because they contain information that might jeopardize research participants’ privacy, the data supporting the study’s conclusions are not publicly available.
Acknowledgement
The management of the clinic where the data was gathered is acknowledged by the author. Following their agreement, the patients consented to participate in the trial. The article was final edited by Miss Zingisa Kholiwe.
Conflicts of Interest
The author affirms that there is no financial or personal relation that may have unfairly affected in authoring this work.
References
- Pourhabibi, N.; Mohebbi, B.; Sadeghi, R.; Shakibazadeh, E.; Sanjari, M.; Tol.; Yaseri, M. Determinants of Poor Treatment Adherence among Patients with Type 2 Diabetes and Limited Health Literacy: A Scoping Review. Diabetes Res. 2022, 4:2980250. [CrossRef]
- Stewart, J.F.; Moon, Z.; Horne R. Medication nonadherence: health impact, prevalence, correlates and interventions. Psychology & health 2023, 38, 726–765. [CrossRef]
- Martin, L.R.; Williams, S.M.; Haskard, K.B.; DiMatteo, M.R. The challenge of patient adherence. Therapeutics and Clinical Risk Management 2005, 1, 189–199. https://pubmed.ncbi.nlm.nih.gov/18360559.
- Al-Worafi, Y.M. (2024). Quality of Healthcare Systems in Developing Countries: Status and Future Recommendations. In: Al-Worafi, Y.M. (eds) Handbook of Medical and Health Sciences in Developing Countries, 2024. Springer, Cham. 2024. [CrossRef]
- Burch, L.S.; Smith, C.J.; Anderson, J.; Sherr, L.; Rodger, A.J.; a, Rebecca O'Connell, R. et al. Socioeconomic status and treatment outcomes for individuals with HIV on antiretroviral treatment in the UK: cross-sectional and longitudinal analyses. Lancet Public Health 2016, 1, e26–e36. [CrossRef]
- Walsh, C.A.; Cahir, C.; Tecklenborg, S.; Byrne, C.; Culbertson, M.A.; Bennett, K.E. The association between medication non-adherence and adverse health outcomes in ageing populations: a systematic review and meta-analysis. Br J Clin Pharmacol. 2019, 85, 2464–78. [CrossRef]
- Iuga, A.O.; McGuire, M.J. Adherence and health care costs. Risk Manag Healthcare Policy 2014, 7, 35–44. [CrossRef]
- Cutler, R.L.; Fernandez-Llimos, F.; Frommer, M.; Benrimoj, C.; Garcia-Cardenas, V. economic impact of medication non-adherence by disease groups: a systematic review. BMJ Open 2018, 8, e016982. [CrossRef]
- Oliveira, C.J.; José, H.M.G.; Teixiera da Costa, E.I.M. Medication adherence in adults with chronic diseases in primary healthcare: a quality improvement project. Nurs Rep. 2024,14, 1735–49. [CrossRef]
- Sabaté, E. Adherence to long-term therapies: Evidence for action World Health Organization, 2003. Available at: https://iris.who.int/handle/10665/42682.
- Bronkhorst, E.; Schellack, N,; Gous, A.G.S.; Pretorius, J.P. The need for pharmaceutical care in an intensive care unit at a teaching hospital in South Africa. South. Afr. j. crit. care (Online 2014, 2. [CrossRef]
- World Health Organisation. Failure to take prescribed medicine for chronic diseases is a massive, world-wide problem. Patients fail to receive needed support. WHO, 2003. Available from: https://www.who.int/news/item/01-07-2003-failure-to-take-prescribed-medicine-for-chronic-diseases-is-a-massive-world-wide-problem.
- Simpson, S. H., eurich, D. T., Majumdar, S. R., Padwal, R. S., Tsuyuki, R. T., Varney, J., Johnson, J. A. (2006). A meta-analysis of the association between adherence to drug therapy and mortality. BMJ, 333, (7557), 15. [CrossRef]
- Organization for Economic Co-operation and Development. Joining Forces to leave No One Behind. OECD Report 2018. https://www.oecd.org/en/publications/development-co-operation-report-2018_ / https://www.oecd.org/en/publications/exploring-the-relationship-between-non-communicable-diseases-and-depression_02a1cfc5-en.html.
- Khan, R., Socha-Dietrich, K. Investing in medication adherence improves health outcomes and health system efficiency: Adherence to medicines for diabetes, hypertension, and hyperlipidemia. OECD Health Working Papers No. 105. 2025. [CrossRef]
- World Health Organization. Adherence to long-term therapies: evidence for action. World Health Organization. Published 2003. Accessed October 8, 2023. https://iris.who.int/handle/10665/42682.
- Konstantinou, P.; Kassianos A.P.; Georgiou G, et al. Barriers, facilitators, and interventions for medication adherence across chronic conditions with the highest non-adherence rates: A scoping review with recommendations for intervention development. Transl Behav Med. 2020;10(6):1390-1398. [CrossRef]
- Kvarnström, K.; Airaksinen, M.; Liira. H. Barriers and facilitators to medication adherence: A qualitative study with general practitioners. BMJ Open. 2018;8:e015332. [CrossRef]
- Simon, S.T.; Kini, V.; Levy, A.E.; Ho PM. Medication adherence in cardiovascular medicine. BMJ, 2021, 374, 1493. [CrossRef]
- Gast, A.; Mathes, T. Medication adherence influencing factors - An (updated) overview of systematic reviews. Syst Rev, 2019, 1, 112. [CrossRef]
- Kvarnström, K.; Westerholm, A.; Airaksinen, M.; Liira, H. Factors contributing to medication adherence in patients with a chronic condition: A scoping review of qualitative research. Pharmaceutics. 2021, 7,1100. [CrossRef]
- Peh, K.Q.E.; Kwan, Y.H.;m Goh, H. et al. An Adaptable Framework for Factors Contributing to Medication Adherence: Results from a Systematic Review of 102 Conceptual Frameworks. J Gen Intern Med, 2021, 9, 2784-2795. [CrossRef]
- Kardas, P.; Lewek, P.; Matyjaszczyk, M. Determinants of patient adherence: A review of systematic reviews. Front Pharmacol. 2013, 4,91. [CrossRef]
- Nieuwlaat R, Wilczynski N, Navarro T, et al. Interventions for enhancing medication adherence. Cochrane Database Syst Rev. 2014;2014(11):CD000011. [CrossRef]
- Harsha N, Papp M, Kőrösi L, Czifra Á, Ádány R, Sándor J. Enhancing primary adherence to prescribed medications through an organized health status assessment-based extension of primary healthcare services. Int J Environ Res Public Health. 2019;16(20):3797. [CrossRef]
- Liu X, Thompson J, Dong H, et al. Digital adherence technologies to improve tuberculosis treatment outcomes in China: a cluster-randomised superiority trial. Lancet Glob Health. 2023;11(5):e693-e703. [CrossRef]
- Price D, Robertson A, Bullen K, Rand C, Horne R, Staudinger H. Improved adherence with once-daily versus twice-daily dosing of mometasone furoate administered via a dry powder inhaler: A randomized open-label study. BMC Pulm Med. 2010;10:1. [CrossRef]
- Hamilton JE, Blanco E, Selek S, et al. Patient and Provider Perspectives on Medication Non-adherence Among Patients with Depression and/or Diabetes in Diverse Community Settings – A Qualitative Analysis. Patient Prefer Adherence. 2022;16:1581-1594. [CrossRef]
- Bell S, Kelly H, Hennessy E, Bermingham M, O’Flynn JR, Sahm LJ. Healthcare professional perspectives on medication challenges in the post-stroke patient. Front Pharmacol. 2023;14:1266277. [CrossRef]
- Clyne W, Mshelia C, McLachlan S, et al. A multinational cross-sectional survey of the management of patient medication adherence by European healthcare professionals. BMJ Open. 2016;6(2):e009610. [CrossRef]
- Jimmy, B., Jose, J. Patient Medication Adherence: Measures in Daily Practice. Oman Med J. 2011 May;26(3):155–159. [CrossRef]
- Chia, Y.C. Understanding Patient Management: The Need for Medication Adherence and Persistence. Malays Fam Physician. 2008 Apr 30;3(1):2–6. http://www.ejournal.afpm.org.my/.
- Baryakova, T.H.; Brett H Pogostin, B.H.; Langer, R.; Kevin J McHugh, K.J. Overcoming barriers to patient adherence: the case for developing innovative drug delivery systems Nat Rev Drug Discov. 2023, 27, 5, 387–409. [CrossRef]
- Stewart, S.F.; Zoe Moon, Z.; Horne, R. Medication nonadherence: health impact,.
- prevalence, correlates and interventions. Psychology & health 2023, Vol. 38, No. 6, 726–765. [CrossRef]
- Krousel-Wood, M.; Craig, L.S.; Peacock, E.; Zlotnick, E.; O’Connell, S.; Bradford, D.; Shi, L.; Petty, R. Medication Adherence: Expanding the Conceptual Framework Am J hypertens, 2021, 9, 895–909. https://pmc.ncbi.nlm.nih.gov/articles/PMC8457429/#. [CrossRef]
- Moomba, K.; Van Wyk, B. Social and economic barriers to adherence among patients at Livingstone General Hospital in Zambia. Afr J Prm Health Care Fam Med. 2019, 1, a1740. Available from: https://phcfm.org/index.php/phcfm/article/view/1740/3034#. [CrossRef]
- Bolsewicz K, Debattista J, Vallely A, Whittaker A, Fitzgerald L. Factors associated with antiretroviral treatment uptake and adherence: A review. Perspectives from Australia, Canada and the United Kingdom. AIDS Care 2015, 27, 21, 1429–1438. [CrossRef]
- Ankomah A, Ganle JK, Lartey MY, et al. ART access-related barriers faced by HIV-positive persons linked to care in southern Ghana: A mixed method study. BMC Infect Dis. 2016, 16, 738. http://doi.org/10.1186/s12879-016-2075-0.
- Holmes, E.A.F.; DA Hughes, D.A.; Morrison, V.L. Predicting Adherence to Medications Using Health Psychology Theories: A Systematic Review of 20 Years of Empirical Research. Value in Health 2024, 8, 863-876. Available From: https://www.valueinhealthjournal.com/article/S1098-3015(14)04621-X/pdf#.
- Bauer, M.S., Damschroder, L., Hagedorn, H. et al. An introduction to implementation science for non-specialists. BMC Psychol 3, 32 (2015). [CrossRef]
- Bonolo, P.F.; Ceccato, M.G.; Rocha, G.M.; Acurcio, F.A.; Campo, L.N.; Guimaraes, M.D. Gender differences in non-adherence among Brazilian patients initiating antiretroviral therapy. Clinics 2013, 5, 612-620. [CrossRef]
- Ghidei, L.; Simone, M.; Salow, M.; Zimmerman, K.; Paquin, A.M.; 3,4, Skarf, L.M. Aging, Antiretrovirals, and Adherence: A Meta Analysis of Adherence among Older HIV-Infected Individuals. Drugs Aging 2013, 10, 1-18. [CrossRef]
- Uchmanowicz, B.; Chudiak, A.; Uchmanowicz, I.; Rosińczuk, J.; Froelicher, E.S. Factors influencing adherence to treatment in older adults with hypertension. Clin Interv Aging 2018, 33, 2425. [CrossRef]
- Sweileh, W.; Aker, O.; Hamooz, S. Rate of compliance among patients with diabetes mellitus and hypertension. Natural Sci, 2004, 1, 1–11.
- Walsh, C.A.; Cahir, C.; Tecklenborg, S.; Byrne, C.; Culbertson, M.A.; Bennett, K.E. The association between medication non-adherence and adverse health outcomes in ageing populations: A systematic review and meta-analysis. Br J Clin Pharmacol, 2019, 6, 11, 2464–2478. [CrossRef]
- Kang, C.D.; Tsang, P.M.; Winson, T.L.; Harry, H.X. Wang, Kirin, Q.L. Liu, Sian M. Griffiths, Martin, C.S. Wong Kang, C.D. et al. Determinants of medication adherence and blood pressure control among hypertensive patients in Hong Kong: a cross-sectional study. Int J Cardiol. 2015, 182, 250–7. [CrossRef]
- Alinaitwe, B., Shariff, N.J. & Madhavi Boddupalli, B. Treatment adherence and its association with family support among pulmonary tuberculosis patients in Jinja, Eastern Uganda. Sci Rep, 2025, 15, 11150. [CrossRef]
- Nhlongolwane, N.; Shonisani, T. Predictors and Barrier associated with Non-Adherence to ART by People Living with HIV and AIDS in a Selected Local Municipality of Limpopo Province, South Africa. The Open AIDS Journal, 2023, Volume 17. 2023, 17, e187461362306220. [CrossRef]
- Velloza, J.; Kemp, C.G.; Aunon, F.M.; Ramaiya, M.K.; Creegan, E.; Jane, M. Alcohol Use and Antiretroviral Therapy Non-Adherence Among Adults Living with HIV/AIDS in Sub-Saharan Africa: A Systematic Review and Meta-Analysis. AIDS Behav, 2020, 6, 727–1742. [CrossRef]
- Kalichman, S.C.; Pellowski, J.; Kalichman, M.O.; Cherry, C.; Detorio, M.; Caliendo, A.M.; Schinazi, R.F. Food Insufficiency and Medication Adherence Among People Living with HIV/AIDS in Urban and Peri-Urban Settings. Prev Sci, 2011, 3, 324–332. [CrossRef]
Bar Graph 1.
Frequency of patient adherence to treatment (n = 100).
Bar Graph 2.
Frequency of patients’ nonadherence to treatment per illness.
Bar Graph 3.
Patient reminders to take medication.
Pie Chart 2.
Number of meals taken by the participants
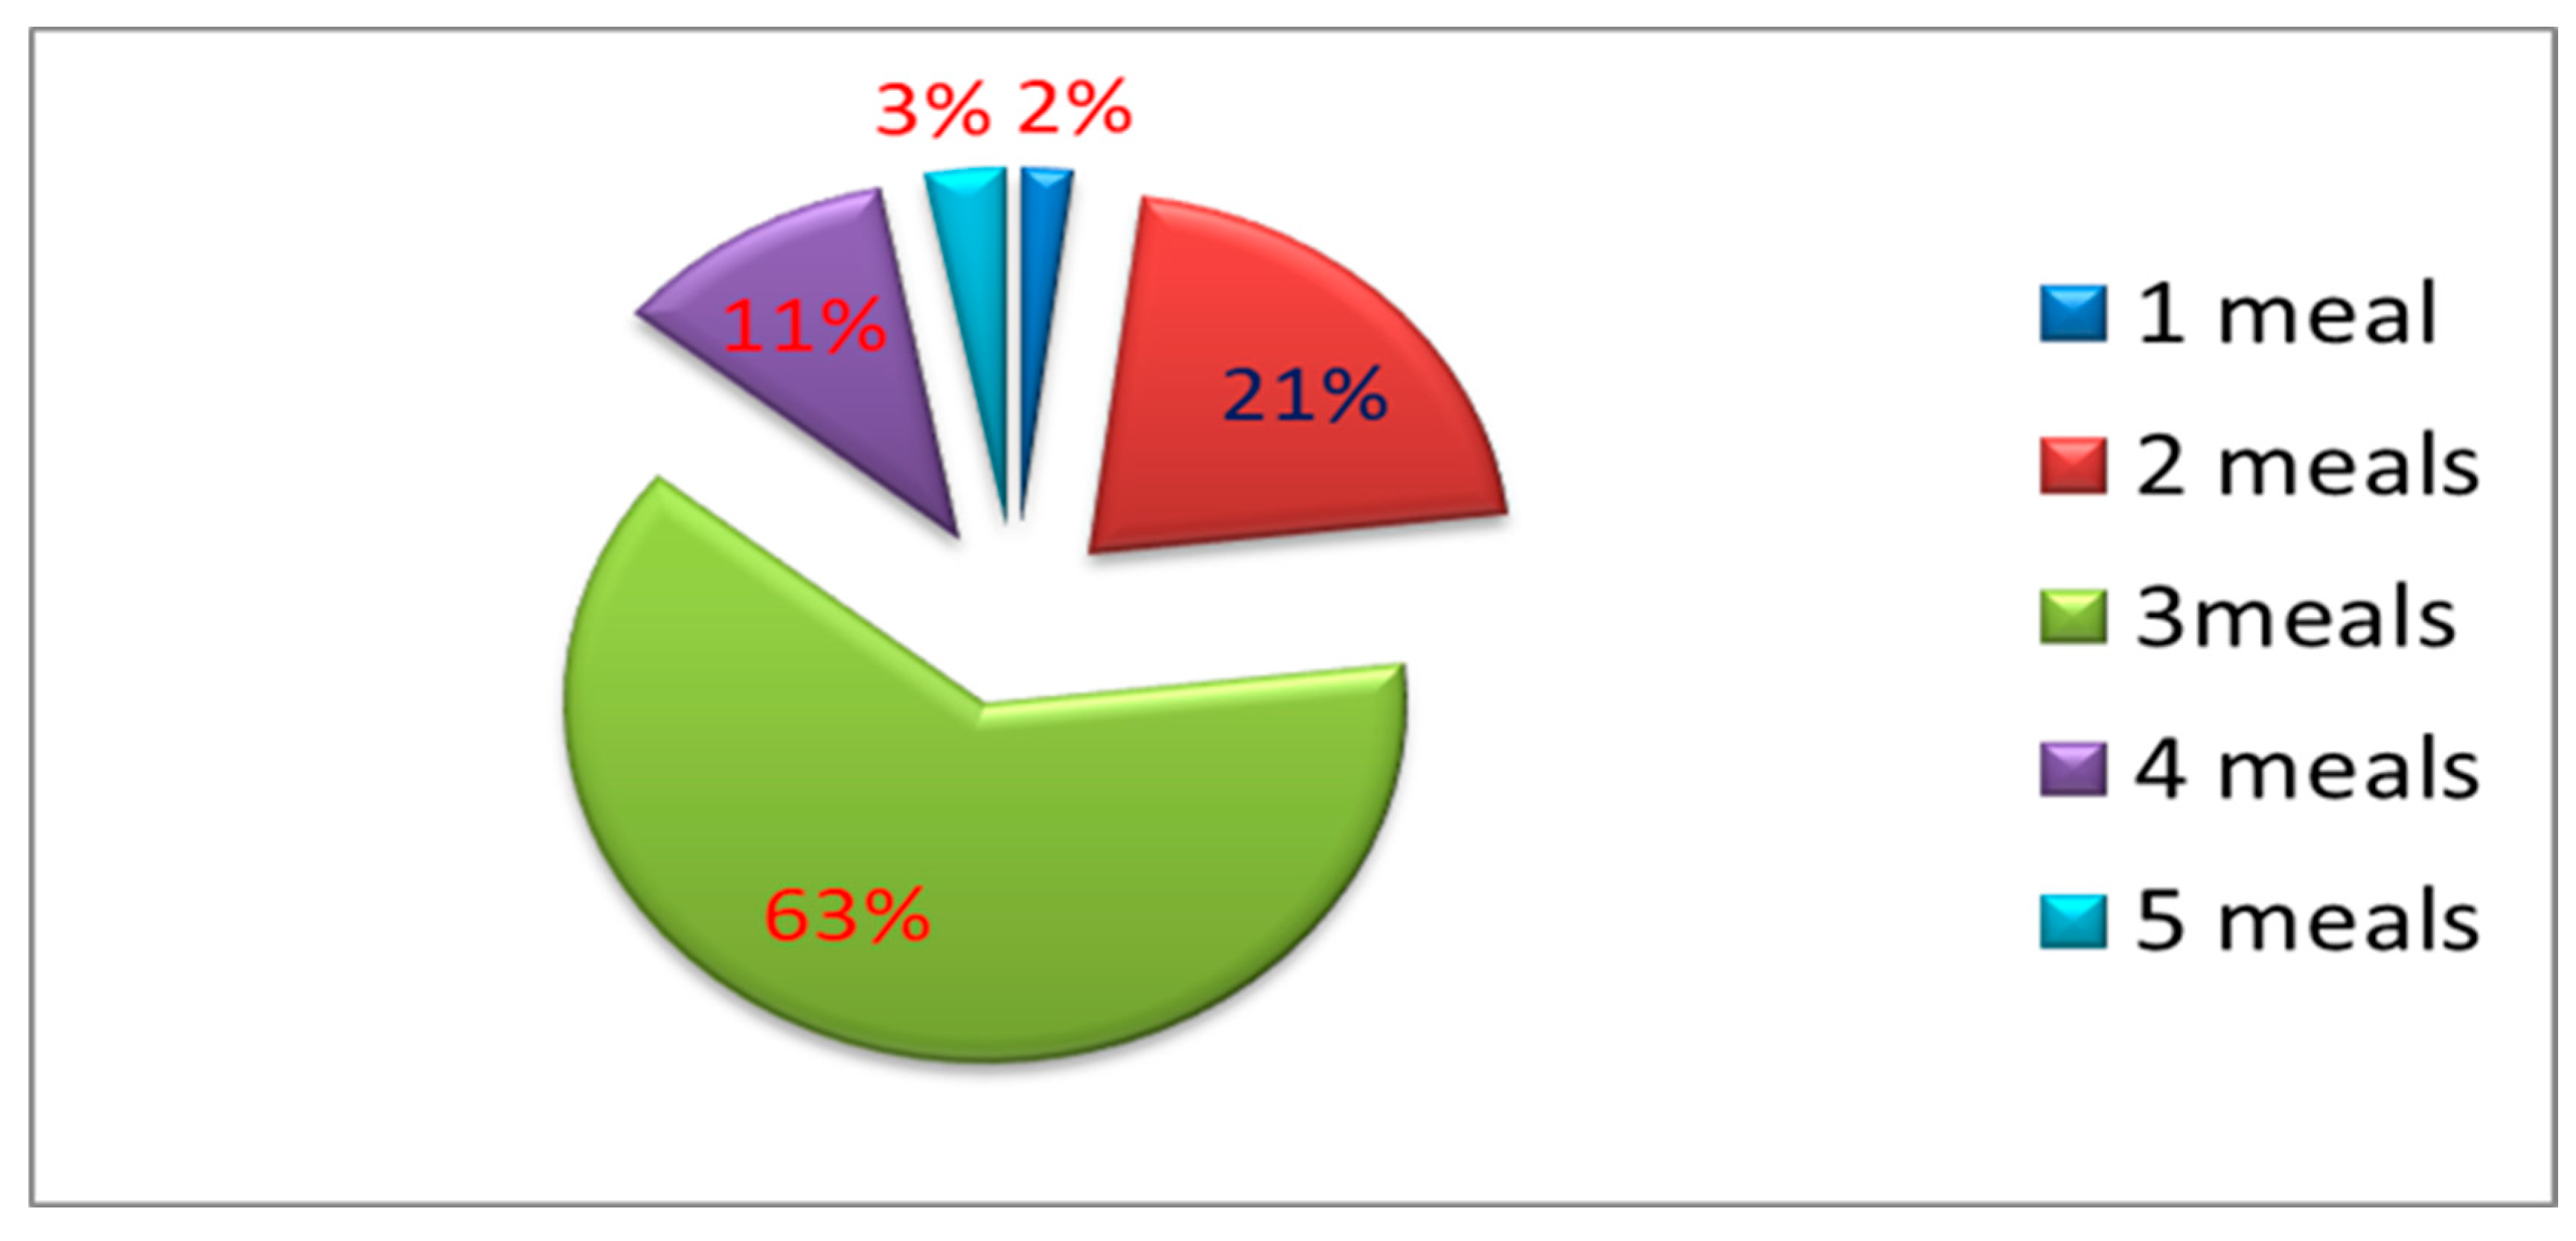
Table 1.
Socio-demographics of the study Participants (n = 100).
| Variable | Frequency (n) | Percentage (% ) |
|---|---|---|
|
Gender Male Female Total |
35 65 100 |
35.0 65.0 100.0 |
|
Age Range 18–39 40–59 60–80 >80 Total |
15 37 45 3 100 |
15.0 37.0 45.0 3.0 100.0 |
|
Distribution per Age Category Youth Middle Age Elderly Old Age Total |
14 43 38 3 100 |
21.5 66.2 58.5 4.6 100.0 |
|
Age distribution per Male Youth Middle Age Elderly Old Age Total |
8 11 14 2 35 |
22.9 31.4 40.0 5.7 100.0 |
|
Age distribution Female Youth Middle age Elderly Old Age Total |
7 26 31 1 65 |
10.8 40.0 47.7 1.5 100.0 |
|
Educational Level Illiterate Primary High School Tertiary Total |
28 30 40 2 100 |
28.0 30.0 40.0 2.0 100.0 |
| Distribution of educational level per gender | ||
|
Female Educational Level Illiterate Primary High School Tertiary Total |
17 21 26 1 65 |
10.8 40.0 47.7 1.5 100.0 |
|
Male Educational Level Illiterate Primary High School Tertiary Total |
11 9 12 3 35 |
31.4 25.7 34.3 8.6 100.0 |
Table 2.
Demographic characteristics associated with non-adherence to treatment.
|
Variable Categories |
Non-adherence | X2 p Value |
| Yes No Total | ||
|
Gender Female Male Total |
6 59 65 9 26 35 15 85 100 |
|
| 4.848 0.028 | ||
|
Age 16–39 40–59 60–80 >80 Total |
4 11 15 4 33 37 5 40 45 2 1 3 15 85 100 |
8.925 0.030 |
|
Educational level Illiterate Primary High School Tertiary Total |
6 22 28 5 25 30 4 36 40 0 2 2 15 85 100 |
2.110 0.550 |
|
Female Educational Level Illiterate Primary High School Tertiary Total |
15 2 17 0 21 21 0 26 26 0 2 2 15 51 66 |
55.952 <0.001 |
|
Male Educational Level Illiterate Primary High School Tertiary Total |
11 0 11 0 8 8 4 9 13 0 0 0 15 17 32 |
20.880 < 0.001 |
Table 3.
Healthcare system factors associated with nonadherence to treatment.
|
Variable Categories |
Non-adherence |
X2 |
p Value |
| Yes No Total | |||
| Waiting time to get treatment 0–30mins 31–60mins 91–120mins 121–180mins 181–210mins 200–240mins 241–300mins Total |
2 23 25 3 5 8 0 1 1 0 10 10 0 8 8 0 13 23 10 25 35 15 85 100 |
14.840 | 0.022 |
| Treatment by Healthcare Providers Acceptable Good Bad Total |
15 13 28 0 69 69 0 3 3 15 85 100 |
45.378 | <0.001 |
| Mode of Transport Taxi Walking Own Car Horse Total |
9 64 73 2 19 21 3 2 5 0 0 0 14 85 100 |
9.227 | 0.010 |
| Distance from home to the clinic >5 km <5Km Walking distance Total |
5 53 58 7 22 29 3 10 13 15 95 100 |
4.416 | 0.110 |
| Medicine Availability Not always available Always available Total |
7 32 39 8 53 61 15 85 100 |
0.436 | 0.509 |
Table 5.
Association between socio-economic factors and non-compliance to treatment.
|
Variable Categorical Values |
Non-compliance |
X 2 |
p value |
OR |
95% CI Lower Higher bounds |
| Yes No Total | |||||
| Alcohol consumption Yes No Total |
11 0 11 4 85 89 15 85 100 |
70.037 | <0.001 | 22.25 | 8.539 - 57.977 |
| Smoking Yes No Total |
0 5 5 15 80 95 15 85 100 |
0.929 | 0.333 | 1.188 | 1.088 - 1.296 |
| Recreational Drugs Yes No Total |
4 0 4 11 85 96 15 85 100 |
23.611 | <0.001 | 8.727 | 5.005 - 15.219 |
| Traditional Medicine Yes No Total |
1 22 23 14 63 77 15 85 100 |
2.658 | 0.103 | 0.205 | 0.025 - 1.647 |
| Meals taken per day One meal Two meals Three meals Four Meals Five meals Total |
2 0 2 3 18 21 6 57 63 4 7 11 0 3 3 15 85 100 |
17.291 | 0.002 | - | - |
Disclaimer/Publisher’s Note: The statements, opinions and data contained in all publications are solely those of the individual author(s) and contributor(s) and not of MDPI and/or the editor(s). MDPI and/or the editor(s) disclaim responsibility for any injury to people or property resulting from any ideas, methods, instructions or products referred to in the content. |
© 2025 by the authors. Licensee MDPI, Basel, Switzerland. This article is an open access article distributed under the terms and conditions of the Creative Commons Attribution (CC BY) license (http://creativecommons.org/licenses/by/4.0/).
Copyright: This open access article is published under a Creative Commons CC BY 4.0 license, which permit the free download, distribution, and reuse, provided that the author and preprint are cited in any reuse.


