
Submitted:
20 May 2025
Posted:
21 May 2025
You are already at the latest version
Abstract
Fire safety design for steel beams is crucial in the construction of steel structures. However, there remains a significant gap in the testing of the fire resistance of insulated steel beams. This study focuses on full-scale experimental research examining the fire resistance performance of steel beams with varying fire protection methods, cross-sectional dimensions, and heating curves. During the tests, the furnace temperature, specimen temperature, and deflection at mid-span were measured. The test results indicated that specimens mainly failed in lateral-torsional buckling. Additionally, a markedly non-uniform temperature distribution was observed across the cross-section, and the predictions made by GB 51249-2017 were found to be unsafe. The use of fiber cement board for fire protection may be ineffective, as it tends to become brittle at elevated temperatures, making it susceptible to breakage and detachment when the beams begin to bend. Furthermore, due to potential creep deformation, specimens subjected to longer heating durations exhibited lower critical temperatures compared to those with shorter heating durations. Finally, the design method outlined in BS EN 1993-1-2 and ANSI/AISC 360-22 was evaluated against the test results, indicating an accurate prediction of these methods for specimens with shorter heating durations, but an unconservative prediction for specimens with longer heating durations due to ignorance of creep deformation.
Keywords:
Fire resistance
; Steel beams
; Fire-protection
; Fire tests
; Fire-safety design
; Creep deformation
1. Introduction
1.1. Research on the Fire-Resistance of Beams
The mechanical properties of steel will be significantly reduced at elevated temperatures, so it is worth studying the fire performance of steel beams in a fire. Burgess et al. [1] investigated the structural behavior of steel beams in fire using the secant stiffness method and emphasized the importance of the shielding effect provided by concrete slabs. Liu et al. [2] conducted fire-resistance tests on axially restrained steel beams and discovered that catenary action is more pronounced in scenarios with lower load levels and higher axial restraint. Yin and Wang [3] utilized ABAQUS to simulate the large-deflection behavior of restrained steel beams in a fire, building on the tests conducted by Liu et al. [2]. Their numerical research [3] indicated that adequate axial restraint enables beams to endure indefinitely through catenary forces. Li and Guo [4] performed fire tests on restrained beams during both the heating and cooling stages, demonstrating that restrained steel beams exhibit superior fire-resistant capabilities compared to isolated steel beams in both phases.
In addition to axial restraint, rotational restraint is a crucial factor that influences the fire resistance of steel beams. Tan and Huang [5,6] investigated the impact of semi-rigid connections on the fire resistance of steel beams through finite element (FE) analysis. Their findings indicated that rotational restraints increase critical temperatures, while axial restraints decrease them. Given the growing demand for fire-resistant design in steel structures, the design methodologies for restrained steel beams in fire scenarios are becoming increasingly significant. Dwaikat and Kodur [7] proposed a simplified method to predict internal forces and deflections in restrained beams at elevated temperatures, introducing a three-stage response model (elastic, elastoplastic, catenary) that was validated against FE simulations. Creep deformation is another critical factor affecting the fire-resistance behavior of steel beams. Kodur and Dwaikat [8] and Al-azzani et al. [9] analyzed the effects of high-temperature creep using ANSYS, demonstrating that neglecting creep results in unconservative predictions, as creep accelerates deflections and reduces restraint forces during rapid heating or under high stress.
In recent years, as steel structures have become increasingly complex, lightweight, and high-quality, there has been a growing body of research focused on the fire resistance of steel beams. Shakil et al. [10] simulated steel beams subjected to traveling fire and identified a five-stage failure mechanism, highlighting the roles of cyclic axial forces and catenary action. Nguyen et al. [11] examined the buckling behavior of I-beams under combined transverse loads and negative end moments during fire exposure. Lam and Rodrigues [12] and Couto et al. [13] investigated the fire resistance of cold-formed steel beams, emphasizing the impact of local buckling. Additionally, Xie et al. [14], Kucukler [15], Pournaghshband et al. [16], and Shaheen et al. [17] explored the fire resistance of stainless steel beams, noting the influence of material properties.
However, the aforementioned research primarily focuses on steel beams without fire protection, and there remains a significant gap in the study of fire-protected steel beams. Furthermore, due to the relatively high costs associated with full-scale fire tests, most research has concentrated on numerical simulations and analytical studies. This paper focuses on full-scale fire tests on fire-protected steel beams, taking into account various cross-sectional dimensions, heating curves, and types of fire protection.
1.2. Calculation Method from GB 51249-2017
According to the Chinese specification (GB 51249-2017) [18] on the fire resistance of steel beams, the ultimate moment (MT) of the steel beams at elevated temperatures can be calculated using the Load-bearing Capacity Method, as described in Eq. (1).
where fT denotes the designed steel strength at T ˚C, φbT denotes the stability coefficient of beams at T ˚C, and W denotes the cross-section modulus. It should be noted that the φbT is a temperature-dependent coefficient, and can be calculated by GB 50017 [19] and GB 51249 [18]. Thus, the ultimate moment (MT) versus temperature curves can be determined by Eq. (1), and the critical temperature (Tcr) can be calculated.
Since steel structures are typically insulated by various fire protection measures, it is essential to calculate the steel temperature while taking these protections into account. The Chinese specification GB 51249 [18] provides a method for evaluating the steel temperature during a fire, as indicated by Eq. (2)
Where ρs and cs denote the density and specific heat of steel, respectively; Fi/V denotes the shape factor of the cross-section; Ts and Tg denote the steel and air temperature; ΔTs and Δt denote incremental temperature and time.
In Eq.(2), the coefficient α represents the comprehensive heat transfer coefficient. If the steel structure was protected by an intumescent coating, α can be calculated by Eq.(3)
where Ri denotes the equivalent thermal resistance of the intumescent coating. Besides, if the steel structure was protected by a fire-retardant coating, α could be calculated by Eq.(4)
where λp and dp denote the equivalent thermal conductivity and thickness of the coating. Based on Eq. (2), the relationship between the temperature of the steel and the heating time can be established, allowing for the determination of fire resistance (tcr).
2. The Specimens
The Q355 steel was utilized in the manufacturing of the beams, and the actual material properties of the steel were determined through tensile tests, as summarized in Table 1. It can be observed that, although different steel thicknesses were employed for the beams' web and flange, the variation in yield strength is minimal, ranging from 398 MPa to 410 MPa, with an average value of 404 MPa.
The steel beams were fabricated from hot-rolled H-sections, and their nominal dimensions are presented in Figure 1. The full length, effective length, and heating length of the specimens are 6000 mm, 5600 mm, and 4500 mm, respectively, as illustrated in Figure 1. Two concentrated loads (F) are applied at the mid-span of the beam, with a spacing of 1200 mm. According to Chinese standards for steel structures (GB 50017-2017 [19]), the load-bearing capacities of the steel beams with cross-sections of HN 400×200×8×12 and HN 588×300×12×20 are 108 kN and 360 kN, respectively. Assuming an identical load ratio of 0.3 for the steel beams, the loads applied to specimen D-1 and the other specimens were 36 kN and 120 kN, respectively.
Different fire protection methods were employed, including fire-retardant coatings, fiber cement boards, and intumescent coatings, as illustrated in Table 2. According to information provided by the fire protection supplier, the equivalent thermal conductivity (λi) of the fire-retardant coating and fiber cement board is 0.08 and 0.12 W/(m·K), respectively. Additionally, the equivalent thermal resistance (Ri) of the intumescent coating is approximately 0.08 and 0.14 m2·K/W for coating thicknesses of 1.5 mm and 2.5 mm, respectively. To achieve specific fire resistance ratings, such as tcr = 60 min or tcr = 120 min, the required thickness of the fire protection can be calculated using Eqs. (1)–(4), as summarized in Table 2.
Concerning the purpose of the test parameters, specimens D-1 and D-2 are compared to investigate the influence of shape factors on fire resistance; Specimens D-2, D-3, and D-4 are compared to investigate the protective effectiveness of the different fire protection methods; Specimens D-3 with ISO-1 are compared to investigate the influence of the heating curves; Specimens D-4 with ISO-2 are compared to investigate the influence of heating duration (i.e., creep derformation).
(1) Implementation of the fire-retardant coating
Before applying the fire retardant coating, the surface of the steel beam was de-rusted and polished. Subsequently, a primer for the fire retardant coating, approximately 2-3 mm thick, was initially sprayed onto the surface to enhance adhesion. Given that the heating length of the beams is 4500 mm, the length of the fire retardant coating was set to 5000 mm to ensure that the heated section is adequately protected. Although the steel beam was exposed to fire on three sides, the coating was also applied to the upper surface of the steel beam. After the base coating was completely dry, subsequent layers were applied until the target thickness was achieved, with each layer measuring between 5 and 10 mm. An interval of no less than 24 hours was maintained between each application to ensure that the fire retardant coating was fully dry. Once the total thickness reached 10 mm, a layer of fiber mesh (Figure 2(a)) was added to enhance the adhesion of the fire retardant coating. When the target thickness was achieved, the surface was scraped flat to prevent variations in fire resistance caused by uneven coating, as illustrated in Figure 2 (b).
(2) Implementation of the cement fiber fireproof board
Two cement fiber fireproof boards measuring 340 × 2500 × 20 mm and four boards measuring 620 × 2500 × 20 mm were utilized for fire protection construction, as indicated in Figure 3. First, thin-walled angle steel with dimensions of 30 × 30 mm was welded to the flange of the steel beam to create a longitudinal frame keel. Next, transverse keels were installed every 1 m on the outer side of the lower flange, secured to both the longitudinal frame keels and the steel beam through welding. The longitudinal keels were employed to secure the fireproof boards on the left and right sides of the steel beam, while the transverse keels were used to anchor the fireproof panels at the bottom of the steel beam. As the steel beam was exposed to fire on three sides, the upper flange remained unprotected by fireproof boards. The fireproof boards and keels were connected using self-tapping screws. The self-tapping screw nuts were embedded into the board approximately 1 cm, and fire-retardant couting was applied to the screw holes to cover the nuts.
(3) Implementation of the intumescent coating
First, the surface of the steel beam must be de-rusted and polished, ensuring that any dust, floating rust, oil stains, and other contaminants are removed to prevent interference with the adhesion of the intumescent coating. Prior to applying the intumescent coating, a layer of anti-rust primer compatible with the intumescent coating should be applied, and the primer must be allowed to dry completely for at least 12 hours, as indicated in Figure 4(a). During the application of the intumescent coating, the thickness of each coat should not exceed 0.2 mm, and the interval between coats must be greater than 24 hours. The subsequent coat should only be applied once the surface of the previous coat is fully air-dried, until the target total thickness is achieved. Since the total coating thickness does not exceed 3 mm, there is no need to incorporate fiberglass mesh to enhance adhesion. After each layer of coating is applied and the surface is dry, an electronic thickness gauge should be used to measure the actual thickness of the intumescent coating at various locations, as indicated in Figure 4(b). Any areas that do not meet the thickness requirements must be recoated to ensure uniform distribution of the intumescent coating.
3. Test Set-Up
Figure 5 illustrates the fire-resistance test set-up for the steel beams, where elevated temperatures were generated through natural gas combustion. The beams were simply supported and torsion-restrained against the wall of the fire test furnace. Two concentrated loads were applied at the midpoint of the beam span, with a distance of 1200 mm between them. These concentrated loads were applied using hydraulic actuators, which were anchored to the reaction girder and connected to the upper flange of the beam via a connection stud. Since steel beams in engineering applications are typically exposed to fire on three sides, fireproof boards were necessary to shield the outer surface of the upper flange from direct heating. To enhance the reuse rate of the fireproof boards, high-temperature-resistant aluminum silicate fiber cotton was employed to repeatedly wrap the covers. Additionally, aluminum silicate fiber was utilized to fill the gap between the specimen and the furnace wall, ensuring that the high temperatures within the furnace do not escape.
Five thermocouples, labeled TF1 ~ TF5, were arranged to record the temperatures within the furnace. These thermocouples were strategically fixed near the flame nozzle to prevent direct exposure to the flame, as illustrated in Figure 6. In addition to furnace temperature, specimen temperatures were measured at three distinct sections of the steel beam. In each section, four thermocouples were arranged to monitor the temperature of the upper flange, the mid-point of the web, the underside of the web, and the lower flange, as depicted in Figure 6. In the test, a linear variable displacement transducer (LVDT) was used to measure the deflection of the steel beam at mid-span. The LVDT was fixed on an independent scaffold and connected to the upper flange of the steel beam through a nickel-chromium alloy wire, as indicated in Figure 7.
4. Test Program
After the installation of the specimens and measurements, the two concentrated loads at mid-span were gradually applied to the steel beams. Since both actuators shared the same hydraulic oil source, the hydraulic pressure they generated remained constant. During the loading process, it was essential to monitor the stability of the connection between the loading device and the connecting components. A laser level was used to assess whether the connection between the loading device and the steel beam was horizontal and balanced. If it was not, the steel beam was readjusted after unloading until it was positioned horizontally.
Two heating curves were utilized in the tests: one is the ISO-834 [20] standard heating curve, and the other is the electrical heating curve [21]. The temperature evolution methods for these two curves are presented in Eqs. (5) and (6).:
where T0 (˚C) denotes the ambient temperature, t (min) denotes the heating duration, and T (˚C) denotes the elevated temperatures.
Assuming an ambient temperature of T0 = 0 ˚C, the comparison of these heating curves is illustrated in Figure 8. It is evident that the electrical heating curve exhibits a faster heating rate during the initial heating stage, reaching 1000 ˚C in just 15 minutes, whereas the ISO834 [20] heating curve takes 100 minutes to achieve the same temperature. However, the electrical heating curve [21] ceases to increase after reaching approximately 1000 ˚C, while the ISO834 [20] heating curve continues to rise even at this temperature. This phenomenon occurs because electrical fires are typically caused by the combustion of organic polymer materials. In an electrical fire, the temperature increases rapidly during the early stages of combustion; however, due to limitations in fire density, the temperature cannot continue to rise indefinitely.
5. Test Results
5.1. Temperature Results
Figure 9 shows the furnace temperature for each test. It is evident that the temperatures measured at various positions exhibit some deviation. This variation is attributed to the use of natural gas combustion during the tests, which creates a complex hot air flow within the furnace cavity, leading to temperature non-uniformity. Nevertheless, the average temperature aligns with the designed heating curve.
Figure 10 illustrates the temperature of the specimen at various positions. It is evident that the temperature rise curves at identical locations on different cross-sections are similar, indicating that the specimens were uniformly heated along their length. However, the temperature distribution across the cross-section was found to be significantly non-uniform, with the web generally exhibiting the highest temperature, except for specimen D-3, which was protected by a fiber cement board. This phenomenon occurred because the web of the steel beams with contour protection schemes was directly heated on both sides, whereas the web of specimen D-3 was not directly exposed to the fire. The lowest temperature on the cross-section was observed at the upper flange of the beams, which was heated on only one side. The temperature difference between the upper flange and the web could reach 300 °C, which may significantly influence the fire-resistance behavior of the beams, as the upper flange contributes more to the overall stability of the steel beams. In Figure 10(c), a sudden increase in the temperatures of specimens T2-4 and T2-2 was observed at approximately 25 minutes, which may be attributed to the partial failure of the fiber fireproof board, resulting in the steel beam being directly exposed to the fire.
5.2. Displacement Results
According to the Chinese specification (GB 9978.1 [22]) regarding fire resistance tests for beams, the failure criterion is defined as the point at which the deflection reaches L2/(400d) mm or the deflection rate reaches L2/(9000d2) mm/min. In this context, L and d represent the span length and web height of the beams, respectively. Consequently, the failure deflection and deflection rate of specimen D-1 are 196 mm and 8.71 mm/min, respectively, while the corresponding values for the other specimens are 134 mm and 5.93 mm/min.
Figure 11 illustrates the deflection curve and deflection rate for each specimen. It is evident that the deflection of each specimen progresses slowly during the initial stage, except for specimen D-1, whose deflection rate exceeds 0.5 mm/min, reaching up to 2 mm/min in the same period. The gradual increase in mid-span deflection is attributed to a reduction in the elastic modulus; however, the steel beams remain in an elastic state. The faster deflection rate of specimen D-1 can be attributed to its higher temperature evolution rate. As depicted in Figure 10(a), the average temperature evolution rate of its web reaches 10 °C/min, whereas specimen D-2, which employs the same fire protection method and is subjected to identical fire conditions, has a temperature evolution rate of only 7 ˚C/min.
Furthermore, it is observed that before the specimen reaches its fire resistance limit, about 10 to 20 minutes, the deflection rate gradually increases, leading to a rapid rise in mid-span deflection. This phenomenon is caused by the reduction in yield strength of steel at elevated temperatures, as certain areas of the beam progressively transition into a plastic state, resulting in a rapid decrease in its deformation stiffness.
5.3. Test Phenomenon
Figure 12 shows the residual deformation and fire protection characteristics of the specimens. Specimen D-3 exhibited failure due to flexural buckling, while the other specimens failed due to lateral-torsional buckling. This phenomenon may have been triggered by the fiber cement board of specimen D-3 breaking at approximately 25 minutes, which caused a rapid increase in specimen temperature and a significant rise in the deflection rate. At this point, the mid-span deflection had not yet fully developed, as its deflection rate reached the critical threshold, resulting in a failure mode characterized by flexural buckling.
Figure 12 (a, b, e) illustrates the failure modes of the specimens protected by fire-retardant coatings. It was observed that the fire-retardant coating on specimen D-1 exhibited no significant peeling, whereas specimens D-2 and ISO-1 displayed extensive peeling over large areas. Figure 12 (c) depicts the failure mode of specimen D-3, which was protected by fiber cement board. During the test, a substantial amount of water vapor was noted to escape from the steel beam supports, attributed to the evaporation of water within the fiber cement board due to the fire. At the bottom of the specimen D-3, approximately 43% of the fiber cement board area detached, and numerous cracks along with localized peeling were simultaneously observed on the sides of the specimen. The cracks and peeling of the fiber cement board occurred as the moisture within the board evaporated, leading to increased brittleness. Figure 12 (d, f) presents the failure modes of the specimens protected by intumescent coatings. It is evident that the intumescent coating expanded fully and uniformly, demonstrating excellent adhesion. Although the upper surface of the steel beam is also protected by an intumescent coating, it is covered by a fireproof board, which has not expanded and remains in a black gelatinous state. In contrast, the remaining heated areas have completely foamed and are in a white granular state.
5.4. Discussion of the Test Results
(1) Determination of the fire resistance and critical temperature
Based on the deflection curves and deflection rates of the specimens, the fire resistance (tcr) of the specimens was determined, as indicated in Figure 11 and Table 3. Additionally, the failure temperature corresponding to the fire resistance was obtained from Figure 10. Since the largest deflection occurred at the mid-span of the beams, the temperatures at the mid-span cross-section (i.e., T2-1, T2-2, T2-3, and T2-4) were selected to represent the failure temperature of the beams, as summarized in Table 3. In some instances, due to the failure of the thermocouples at the mid-span cross-section, such as T2-2 of specimen D-2, the thermocouple data from the same location on adjacent sections were utilized. Assuming a linear temperature distribution between the measured points, as illustrated in Figure 13, the temperature distribution of each specimen was determined, as indicated in Figure 11. It can be observed that the temperature on the lower flange of the specimens was almost uniformly distributed, with T2-4 being slightly higher than T2-3, except for specimen D-2. The mid-point of the web exhibited the highest temperature, while the upper flange displayed the lowest temperature. The average temperature of the specimens at fire resistance was calculated using Eq. (7) and is denoted as the critical temperature (Tcr), as summarized in Table 3. In Eq.(7), Aflange and Aweb represent the flange and web areas of the beam, respectively.
(2) Influence of fire-protection method on critical temperature
Table 3 compares the designed critical temperature (Tcr,d) with the test results (Tcr,t). A good agreement was observed between the two, with an average discrepancy of less than 10%, except for specimen D-3. Additionally, the designed value, Tcr,d, was generally higher than the test results, Tcr,t. The Tcr,t for specimen D-3, was significantly lower than that of the other specimens, which may be attributed to its fire protection method. The evaporation of water in the fiber cement board at elevated temperatures can lead to brittle failure, cracking, and peeling, resulting in the steel beam losing its fire protection. The direct heating of the steel beam caused its deflection rate to increase rapidly, reaching the critical point of failure before the deflection was fully developed. This phenomenon demonstrates that fiber cement boards are unsuitable for the fire protection of steel beams, as steel beams are prone to bending deformation under fire conditions. This bending deformation can cause the bottom fiber cement board to bend and the side fiber cement board to shear, ultimately leading to the premature failure of the fiber cement board. The test results (Tcr,t) of specimens also indicate that fire-retardant coating and intumescent coating had better protective behavior than fiber cement board, and the difference in Tcr,t between fire-retardant coating and intumescent coating was relatively small.
(3) Influence of creep deformation on critical temperature
An interesting phenomenon was observed: the critical temperature (Tcr,t) of specimen D-4 was approximately 8.6% higher than that of the other specimens (D-2, ISO-1, and ISO-2). This difference may be attributed to creep deformation. Numerous studies, including those by Al-Azzani et al. [9] and Kodur et al. [8], have indicated that creep deformation can significantly reduce the critical temperature of steel beams. Since specimen D-4 was heated for only 49 minutes, while specimens D-2, ISO-1, and ISO-2 were heated for approximately 100 to 110 minutes, the creep deformation in D-2, ISO-1, and ISO-2 would be more pronounced, resulting in lower critical temperatures for those specimens.
(4) Influence of heating curves on critical temperature
This study compares the critical temperature (Tcr,t) of D-2, D-4, ISO-1, and ISO-2. The results indicate that the difference among them was relatively small, suggesting that the heating curves have a limited impact on the critical temperature. However, this conclusion is predicated on the assumption that the beams are protected from fire and that the heating durations are comparable. In cases where beams are unprotected from fire and the heating durations vary, such as with D-4, the resulting creep deformations may differ significantly, leading to substantial variations in critical temperatures.
(5) Influence of fire protection on fire resistance
Table 3 compares the designed fire resistance (tcr,d) with the test results (tcr,t), revealing a discrepancy that was more significant than the critical temperature. Generally, except for specimens D-1 and D-3, the design values were higher than the test results, with differences ranging from 6% to 22%. This variation is primarily attributed to errors in the calculation of the critical temperature (Tcr). The results presented in Table 3 indicate that the designed critical temperatures (Tcr,d) for specimens D-2, ISO-1, and ISO-2 are approximately 8% higher than the corresponding test results. This overestimation of the critical temperature naturally leads to an inflated assessment of fire resistance. Notably, the tcr,d for specimen D-3 was 126% higher than its tcr,t, which can be attributed to the premature failure of the fiber cement board.
(6) Influence of shape factors (Fi/V) on fire resistance
The shape factor (Fi/V) is a critical parameter in determining the steel temperature for fire-protected beams, as indicated in Equation (2). The shape factors (Fi/V) for specimens D-1 and D-2 were measured at 177 and 110 mm-1, respectively. Consequently, during the fire protection design process, the thickness of the fire-retardant coating for D-1 should be proportionately greater than that for D-2. A comparison of the results between D-1 and D-2 reveals that the shape factor (Fi/V) significantly influences fire resistance (tcr,t). Specimen D-1, which has a higher shape factor (Fi/V) and a thicker fire-retardant coating, was observed to reach Tcr earlier. This finding suggests that the temperature calculation method outlined in the Chinese specification GB 51249 [18] may not be effective in the context of an electrical fire.
6. Evaluation of BS EN 1993-1-2
6.1. Critical Temperature
BS EN 1993-1-2 [23] provides a method to evaluate the critical temperature of the steel beams failing in lateral-torsional buckling. The buckling resistance moment (Mb,fi,t,Rd) at time t of a laterally unrestrained member with a Class l or Class 2 cross-section should be determined from Eq.(8).
where ꭓLT,fi denotes the reduction factor for lateral-torsional buckling in the fire design situation, Wpl,y denotes the plastic section modulus, ky denotes the reduction factor for the yield strength of steel. In Eq.(8), the value of ꭓLT,fi should be determined according to the following equations:
where kE,θdenotes the reduction factor for the elastic modulus, Mcr is the elastic critical moment for lateral-torsional buckling at room temperature.
Figure 14 (a) shows the key coefficient ꭓLT,fi and buckling moment of the specimens at elevated temperatures, as per BS EN 1993-1-2 [23], and the critical temperature (Tcr,EC3) is determined and summarized in Table 4. It can be seen that the variation range of coefficient ꭓLT,fi is limited in a temperature range from 200 to 700˚C, indicating that the buckling resistance moment at elevated temperatures was mainly determined by its reduced yield strength.
The relative errors of Tcr,EC3 for D-1 and D-4 ranged within ±5%, indicating high accuracy. However, the prediction of Tcr,EC3 for D-2, ISO-1, and ISO-2 was 14% higher than the test results. This discrepancy may be attributed to the calculation method outlined in BS EN 1993-1-2 [23], which does not account for creep deformation. Consequently, the predicted Tcr,EC3 values for specimens with shorter heating durations are relatively accurate, while those for specimens with longer heating durations are considered unsafe.
(a) (b)
6.2. Fire Resistance
In BS EN 1993-1-2 [23], the temperature increase Δθa,t of an insulated steel member during a time interval Δt should be obtained from Eqs. (14)~(15).
where Aₚ denotes the appropriate area of fire protection material per unit length; V denotes volume of the member per unit length; cₚ denotes temperature-independent specific heat of fire protection material.
It should be noted that the Eqs. (14)~(15) are not applicable for intumescent coating, since the thickness (dₚ), density (ρₚ), thermal conductivity (λₚ) and specific heat (cₚ) of intumescent coating continuously change during the heating process. Besides, the value of λₚ, ρₚ, cₚ of the fire-retardant coating in our tests are 0.108 W/(m·K), 600 kg/m3, and 1500 J/(kg·K), respectively. Therefore, based on Eqs. (14)~(15), the steel temperature evolution could be calculated, as shown in Figure 14 (b), and the fire-resistance tcr,EC3 could be determined, as summarized in Table 4.
It can be seen from Figure 14 (b) that the calculated temperature evolution curve of D-1 matches well with the test results, whereas the discrepancy of D-2 and ISO-1 is significant. The predictive fire resistance of specimens ranges from -1% to -5%, indicating a considerably high accuracy. Besides, the fire resistance predicted by BS EN 1993-1-2 [23] is on the safe side.
7. Evaluation of ANSI/AISC 360-22
7.1. Critical Temperature
The American specification ANSI/AISC 360-22 [24] presents a method to evaluate the load-bearing capacity of beams at elevated temperatures. In the calculation process, the temperature over the depth of the member shall be taken as the temperature calculated for the bottom flange, and the calculation methods are given in Eqs. (16)~(22).
where
where Fcr(T) denotes the critical lateral-torsional buckling load of the beam at T ˚C, Lr(T) denotes the limiting unbraced length for the limit state of inelastic lateral-torsional buckling at T ˚C, Lb denotes the effective length (Lb=5600mm for our cases), E(T) denotes the elastic modulus at T ˚C, Fy(T) denotes the yield strength at T ˚C, Sx denotes elastic section modulus, h0 denotes distance between the flange centroids, J denotes torsional constant, the value of coefficient c for our cases is c=1, Zx denotes plastic section modulus, kp and ky denote retention factor of proportional limit and yield strength, Cb denotes the lateral-torsional buckling modification factor for nonuniform moment diagrams (Cb=1.15 for our cases),
In ANSI/AISC 360-22 [24], the key factor calculating the Lr(T), which determines the failure mode of the beams. Figure 15 (a) shows the variation of Lr(T) with temperature, it is seen that this value increases with the temperature except for the range from 400 ˚C to 540 ˚C. Besides, the Lr(T) of the specimens is always higher than 5600mm, indicating an inelastic lateral-torsional buckling of the beams. The load-bearing capacities of the beams at elevated temperatures are illustrated in Figure 15 (a), where an increase segment between 300 ˚C to 400 ˚C was found, which is due to the sudden increase in Lr(T). Since the ANSI/AISC 360-22 [24] adopted the lower flange temperature to conduct the calculation. Therefore, T2-4 of the test results were compared with calculation results (Tcr,ANSI) from ANSI/AISC 360-22 [24], as summarized in Table 5.
It has been observed that the relative errors of ANSI/AISC 360-22 [24] range from 1.5% to 19.6%, indicating potentially unsafe predictions. Additionally, a trend similar to that of BS EN 1993-1-2 [23] was observed, where predictions for specimens D-1 and D-4 were accurate, while predictions for other specimens were significantly unconservative. This discrepancy may also be attributed to potential creep deformation.
7.2. Fire Resistance
The calculation method for insulated steel members with contour protection schemes in ANSI/AISC 360-22 [24] is given in Eq. (23).
where coefficient W denotes weight (mass) per unit length. Figure 15 (b) compares the calculation results with the test results of the average temperature. It is seen that the ANSI/AISC 360-22 [24] generates a considerably higher result for D-1 and ISO-1, but a slightly higher result for D-2, this phenomenon was attributed to the application range of ANSI/AISC 360-22 [24] was for uniformly heated specimens. It was emphasized in ANSI/AISC 360-22 [24] that when applying this method to steel beams supporting floor and roof slabs, the approach will overestimate the temperature rise in the beam.
8. Conclusions
This paper carried out full-scale fire resistance tests on simply-supported insulated steel beams, and some conclusions could be obtained as follows:
(1) Test results indicated that the steel beams subjected to three-sided fire exhibited a non-uniform temperature distribution. The difference between the lowest temperature on the upper flange and the highest temperature at the midpoint of the web reached 300 °C when the average cross-sectional temperature was 600 °C. This non-uniform temperature distribution presents a challenge in engineering applications, as it complicates the prediction of the mechanical behavior and fire resistance of the beams.
(2) It was found that the critical temperature (Tcr) and fire resistance (tcr) of the specimens with fire-retardant or intumescent coatings were lower than the values predicted by GB 51249-2017. The discrepancies in GB 51249-2017 for Tcr and tcr range from 0% to 8.4% and from 6% to 41%, respectively, indicating an unsafe design methodology. Furthermore, the fiber cement board may not be effective for the fire protection of beams, as it can become brittle at elevated temperatures and is prone to breakage and detachment when the beams begin to bend.
(3) Fire-retardant coatings and intumescent coatings exhibit superior protective properties compared to fiber cement board, with only a minor difference in critical temperature between the two types of coatings.
(4) Creep deformation can significantly reduce the critical temperature of steel beams. Research indicates that beams subjected to shorter heating durations exhibit a critical temperature that is 8.6% higher than that of specimens exposed to longer heating durations. Furthermore, the heating curves have a limited impact on the critical temperature, provided that the beams are protected from fire and their heating durations are comparable. In contrast, if these conditions are not met, creep deformation will affect the critical temperature.
(5) The accuracy of the design methods outlined in BS EN 1993-1-2 and ANSI/AISC 360-22 was evaluated based on the test results. It was found that both specifications provided accurate predictions on the critical temperature for D-1 and D-4, that has shorter heating durations, but unconservative predictions for other specimens with longer heating durations. This phenomenon was attributed to the ignorance of creep deformation in both specifications, emphasizing the importance of considering the creep deformation in the fire safety design of steel beams.
Author Contributions
Weihua Wang: Writing - Original Draft; Tao Zhu: Conceptualization; Xian Gao: Resources; Jingjie Yang: Funding acquisition; Xilong Chen: Supervision; Weiyong Wang: Validation.
Funding
This study was supported by the National Natural Science Foundation of China (52408531), the research project of State Grid Fujian Economic Research Institute (SGFJJY00BDJS2400037), and the research project of State Grid Fujian Economic Research Institute (SGFJJYO0BDJS2310040). Any opinions, findings, and conclusions or recommendations expressed in this paper are those of the authors and do not necessarily reflect the views of the sponsors.
Data Availability Statement
The original contributions presented in the study are included in the article, and further inquiries can be directed to the corresponding author.
Conflicts of Interest
The authors declare no conflicts of interest.
References
- Burgess I W, Rimawi J E, Plank R J. Studies of the Behaviour of Steel Beams in Fire[J]. Journal of Constructional Steel Research, 1991(19):285-312. [CrossRef]
- Liu T C H, Fahad M K, Davies J M. Experimental investigation of behaviour of axially restrained steel beams in fire[J]. Journal of constructional steel research, 2002,58(9):1211-1230. [CrossRef]
- Yin Y Z, Wang Y C. A numerical study of large deflection behaviour of restrained steel beams at elevated temperatures[J]. Journal of Constructional Steel Research, 2004,60(7):1029-1047.
- Li G, Guo S. Experiment on restrained steel beams subjected to heating and cooling[J]. Journal of Constructional Steel Research, 2008,64(3):268-274. [CrossRef]
- Tan K, Huang Z. Structural Responses of Axially Restrained Steel Beams with Semirigid Moment Connection in Fire[J]. Journal of structural engineering (New York, N.Y.), 2005,131(4):541-551. [CrossRef]
- Huang Z, Tan K. Structural response of restrained steel columns at elevated temperatures. Part 2: FE simulation with focus on experimental secondary effects[J]. Engineering Structures, 2007,29(9):2036-2047. [CrossRef]
- Dwaikat M, Kodur V. Engineering Approach for Predicting Fire Response of Restrained Steel Beams[J]. Journal of engineering mechanics, 2011,137(7):447-461. [CrossRef]
- Kodur V K R, Dwaikat M M S. Effect of high temperature creep on the fire response of restrained steel beams[J]. Materials and Structures, 2010,43(10):1327-1341.
- Al-azzani H, Yang J, Sharhan A, et al. A Practical Approach for Fire Resistance Design of Restrained High-Strength Q690 Steel Beam Considering Creep Effect[J]. Fire Technology, 2021,57(4):1683-1706. [CrossRef]
- Shakil S, Lu W, Puttonen J. Behaviour of vertically loaded steel beams under a travelling fire[J]. Structures, 2022,44:1-17. [CrossRef]
- Nguyen T Q, Nguyen X T, Nguyen T N M, et al. Buckling strength of steel I-beams subjected to simultaneous transverse loads and negative end moments under elevated temperature[J]. Structures, 2024,67:106934.
- Laím L, Rodrigues J P C. Experimental and numerical study on the fire response of cold-formed steel beams with elastically restrained thermal elongation[J]. Journal of Structural Fire Engineering, 2016,7(4):388-402.
- Couto C, Vila Real P, Lopes N. Local-global buckling interaction in steel I-beams—A European design proposal for the case of fire[J]. Thin-Walled Structures, 2025,206:112664. [CrossRef]
- Xie B, Dai W, Zhang S, et al. Experimental and numerical investigation on fire resistance of stainless steel core plate beams[J]. Thin-Walled Structures, 2023,190:110948. [CrossRef]
- Kucukler, M. Kucukler M. Stainless steel I-section beams at elevated temperatures: Lateral–torsional buckling behaviour and design[J]. Thin-Walled Structures, 2025,208:112720. [CrossRef]
- Pournaghshband A, Afshan S, Theofanous M. Elevated temperature performance of restrained stainless steel beams[J]. Structures, 2019,22:278-290. [CrossRef]
- Shaheen M A, Afshan S, Foster A S. Performance of axially restrained carbon and stainless steel perforated beams at elevated temperatures[J]. Advances in Structural Engineering, 2021,24(15):3564-3579. [CrossRef]
- GB 51249-2017. Code for fire safety of steel structures in buildings [S]. China Planning Press, 2017, Beijing. (In Chinese).
- GB 50017-2017. Standard for design of steel structures [S]. China Architecture & Building Press, 2017, Beijing. (In Chinese).
- ISO-834. Fire-resistance tests - Elements of building construction [S]. International Organization for Standardization, 1975, Geneva.
- GB/T 26784-2011. Fire resistance test for elements of building construction - Alternative and additional procedures [S]. Standards Press of China, 2011, Beijing. (In Chinese).
- GB9978.1-2008. Fire-resistance tests - Elements of building construction - Part 1: General requirements [S]. Standards Press of China, 2008, Beijing. (In Chinese).
- BS EN 1993-1-2:2024. Eurocode 3 - Design of steel structures. Part 1-2: Structural fire design [S]. British Standards Institution, 2024, London.
- ANSI/AISC 360-22. Specification for Structural Steel Buildings [S]. American Institute of Steel Construction, 2022, Washington.
Figure 1.
Dimension of the cross-section.
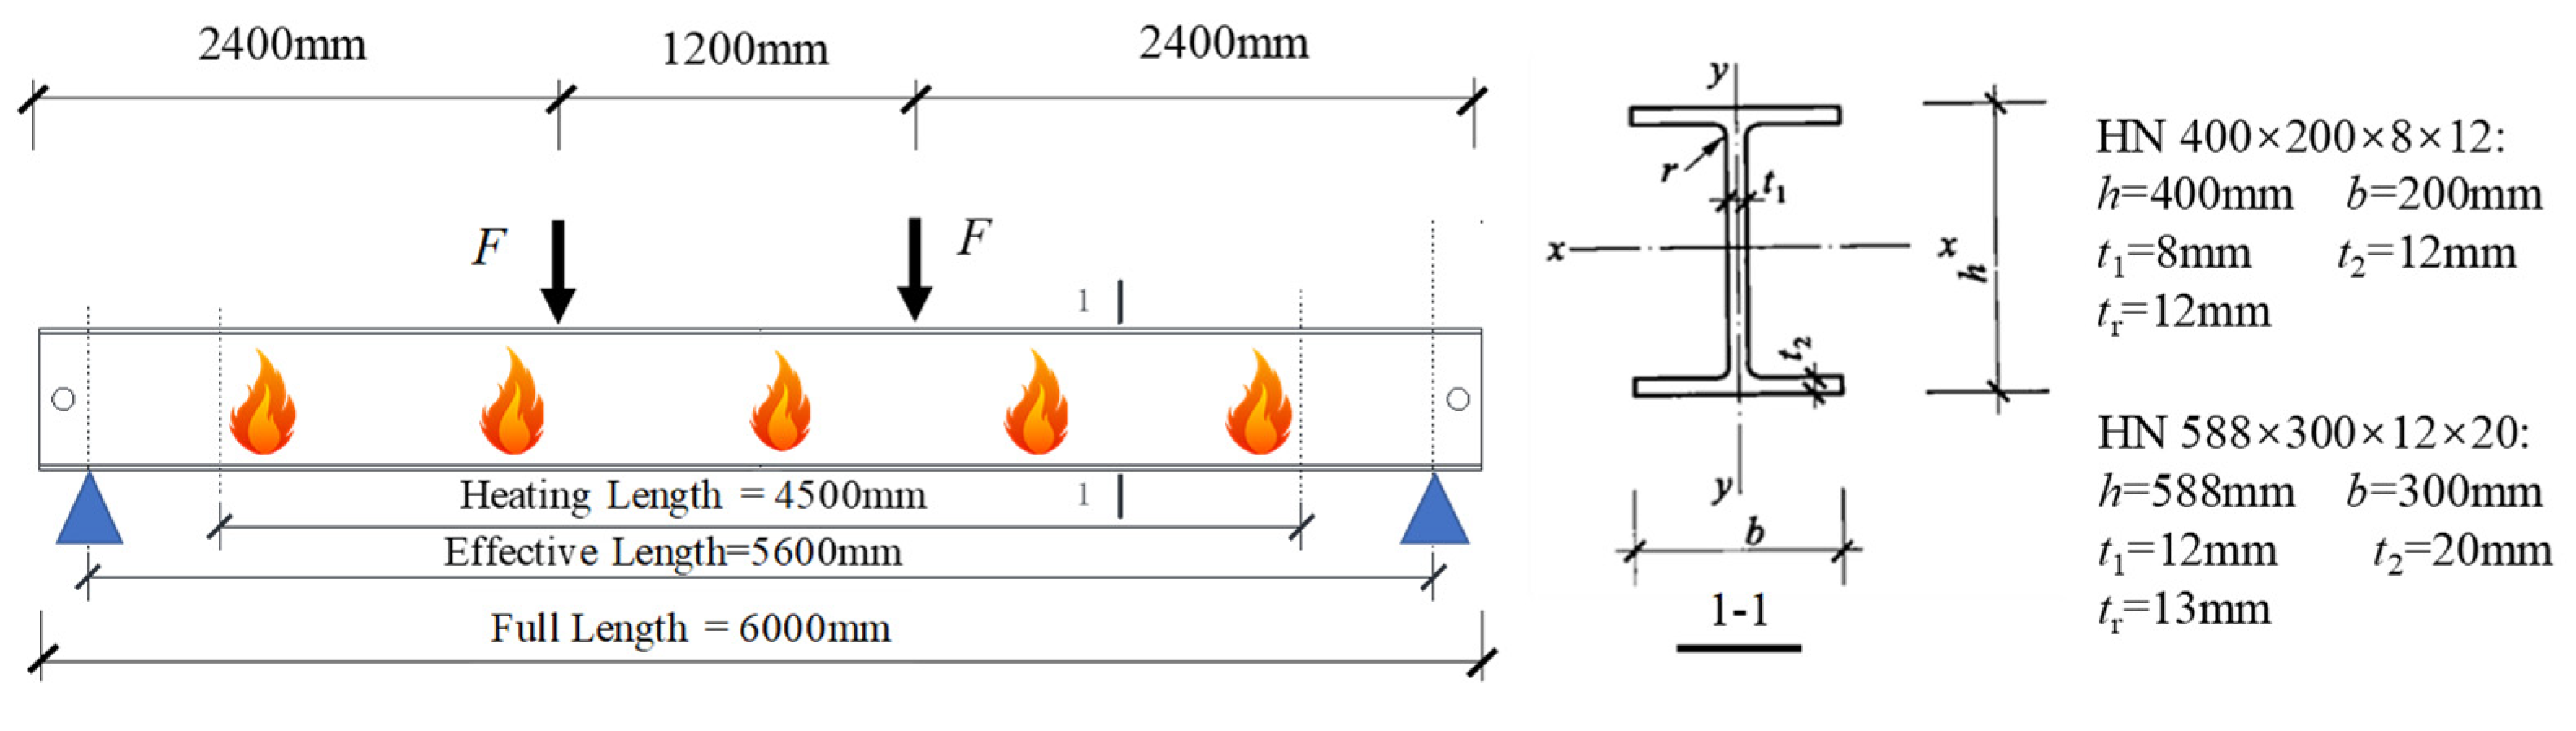
Figure 2.
Construction for the fire-retardant coating: (a) Fiber mesh; (b) Finished specimens.
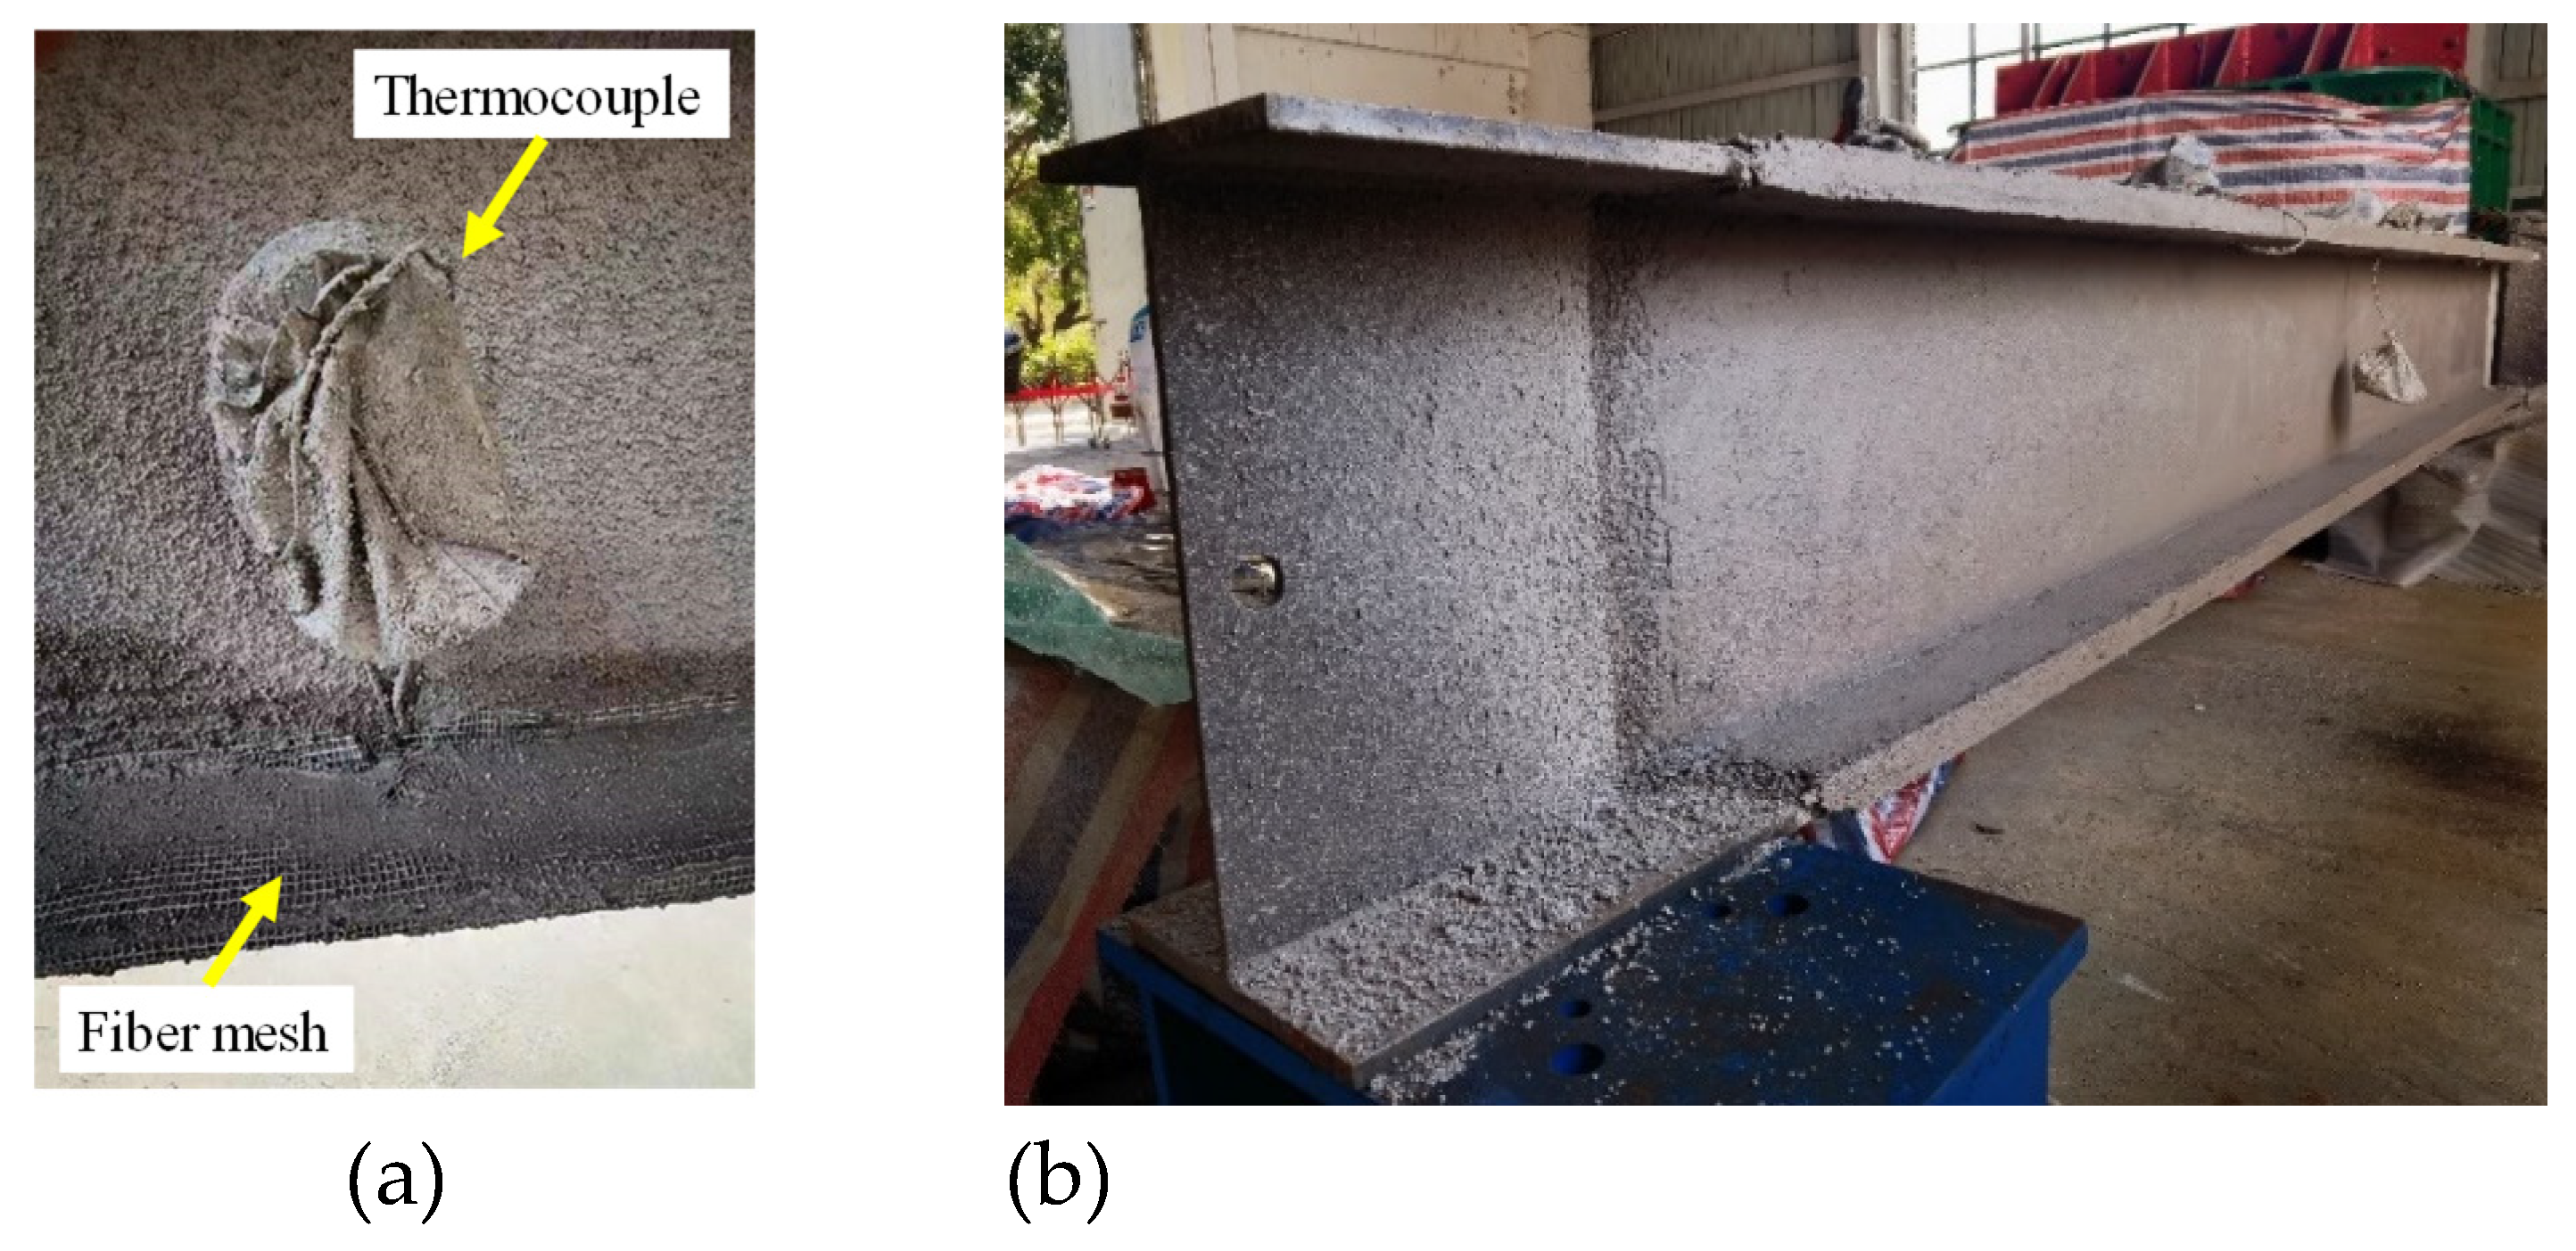
Figure 3.
Construction for the cement fiber fireproof board: (a) Installation of keels; (b) Finished specimens.
Figure 3.
Construction for the cement fiber fireproof board: (a) Installation of keels; (b) Finished specimens.
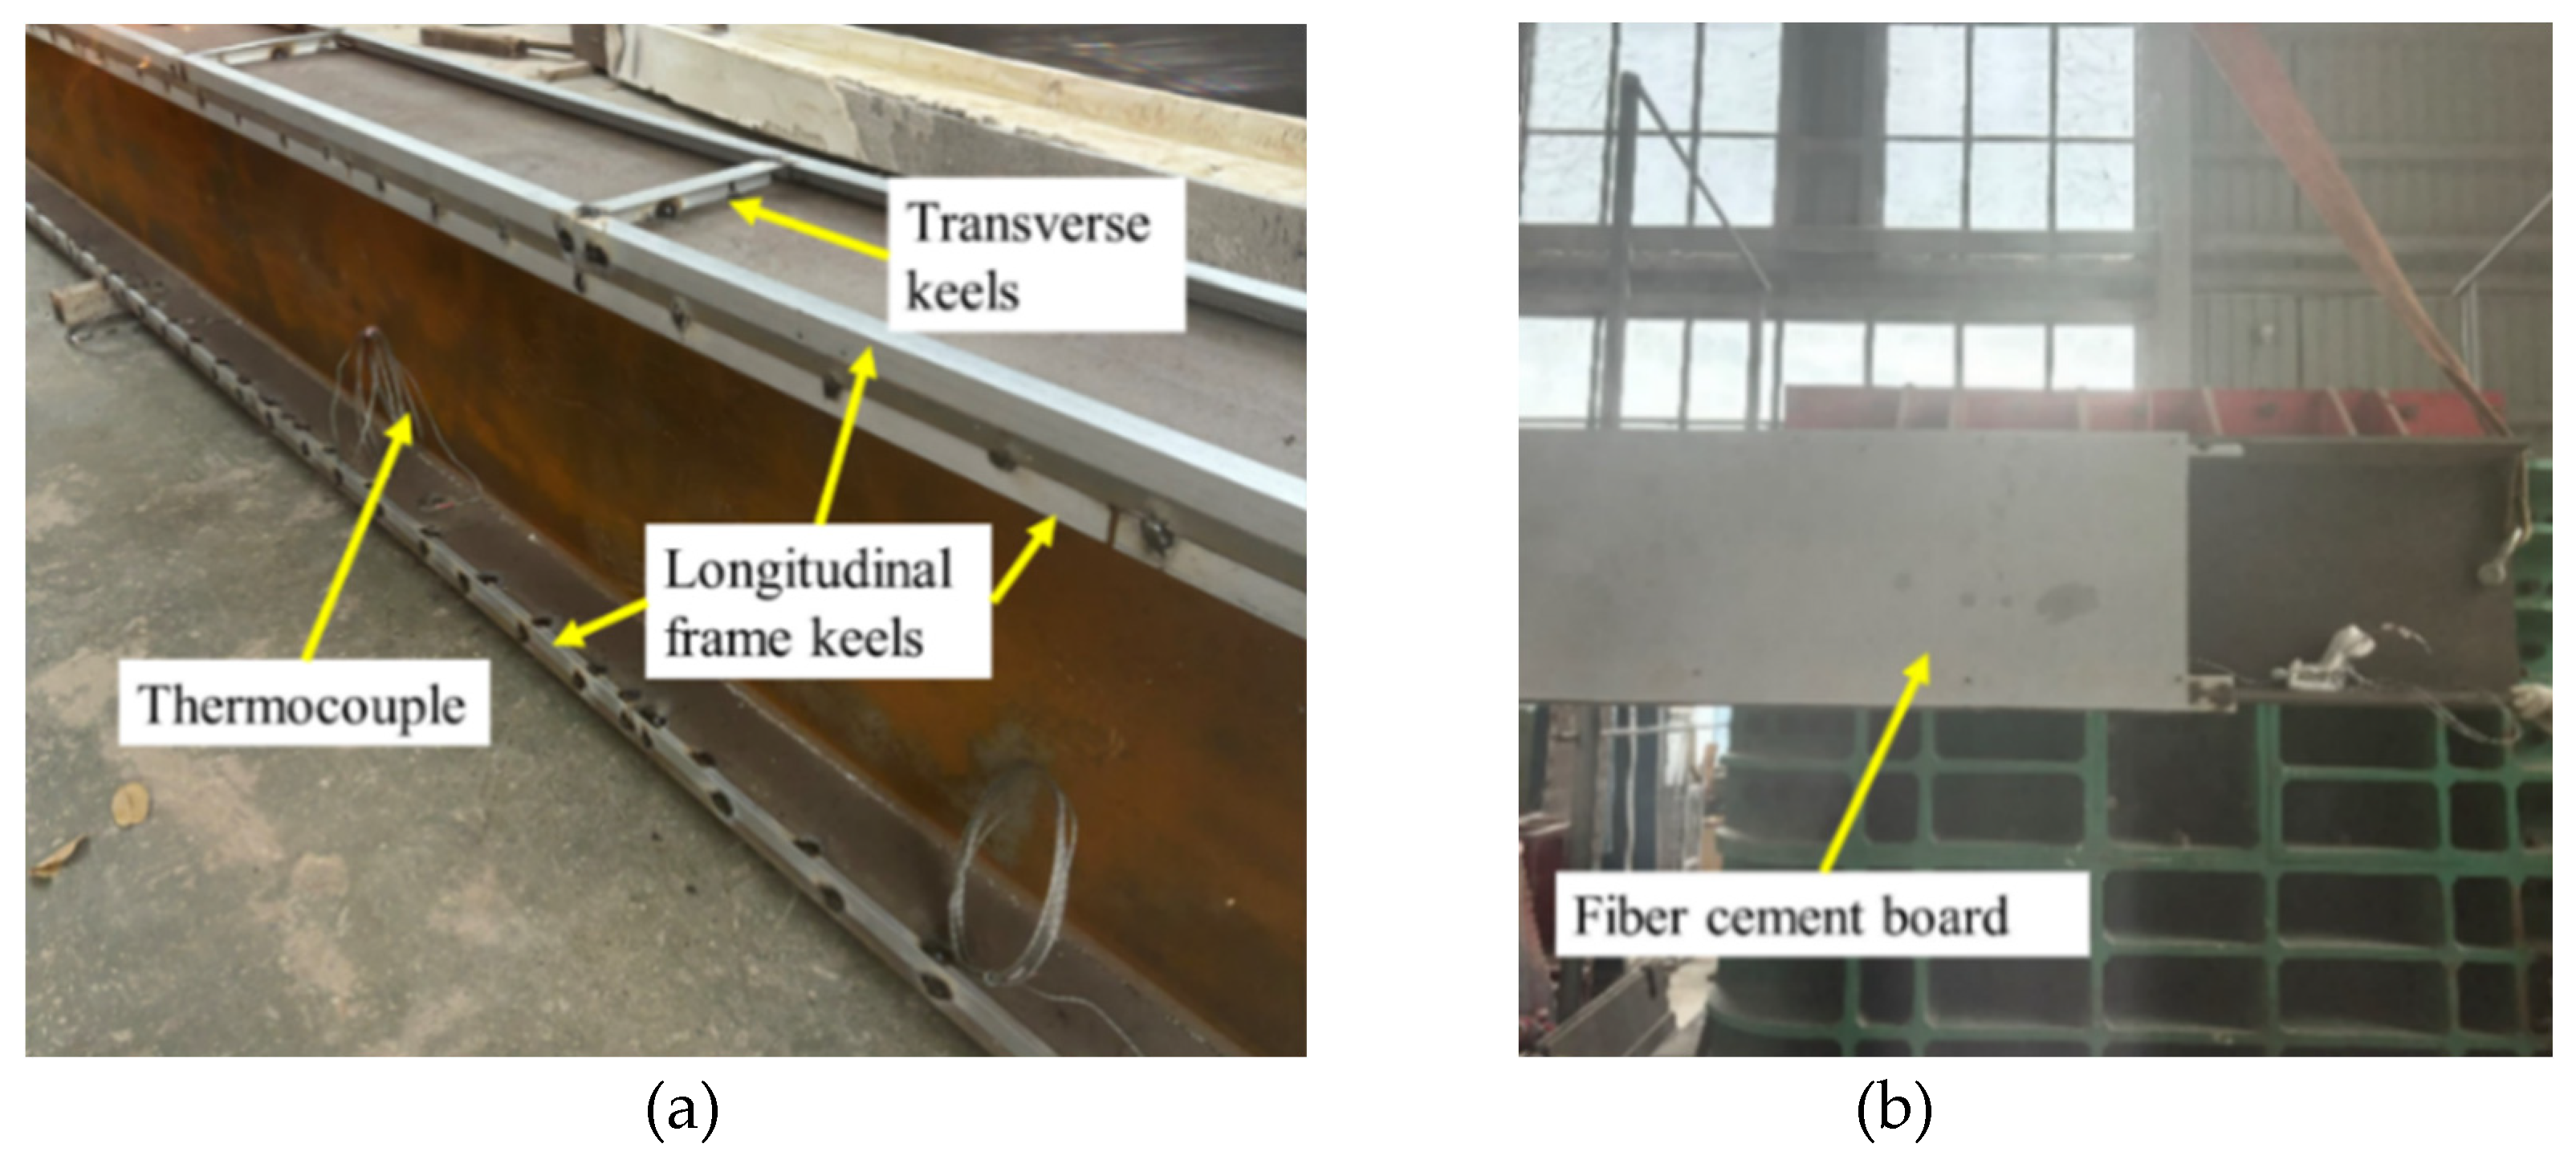
Figure 4.
Construction for the intumescent coating: (a) Anti-rust primer; (b) Electronic thickness gauge.
Figure 4.
Construction for the intumescent coating: (a) Anti-rust primer; (b) Electronic thickness gauge.
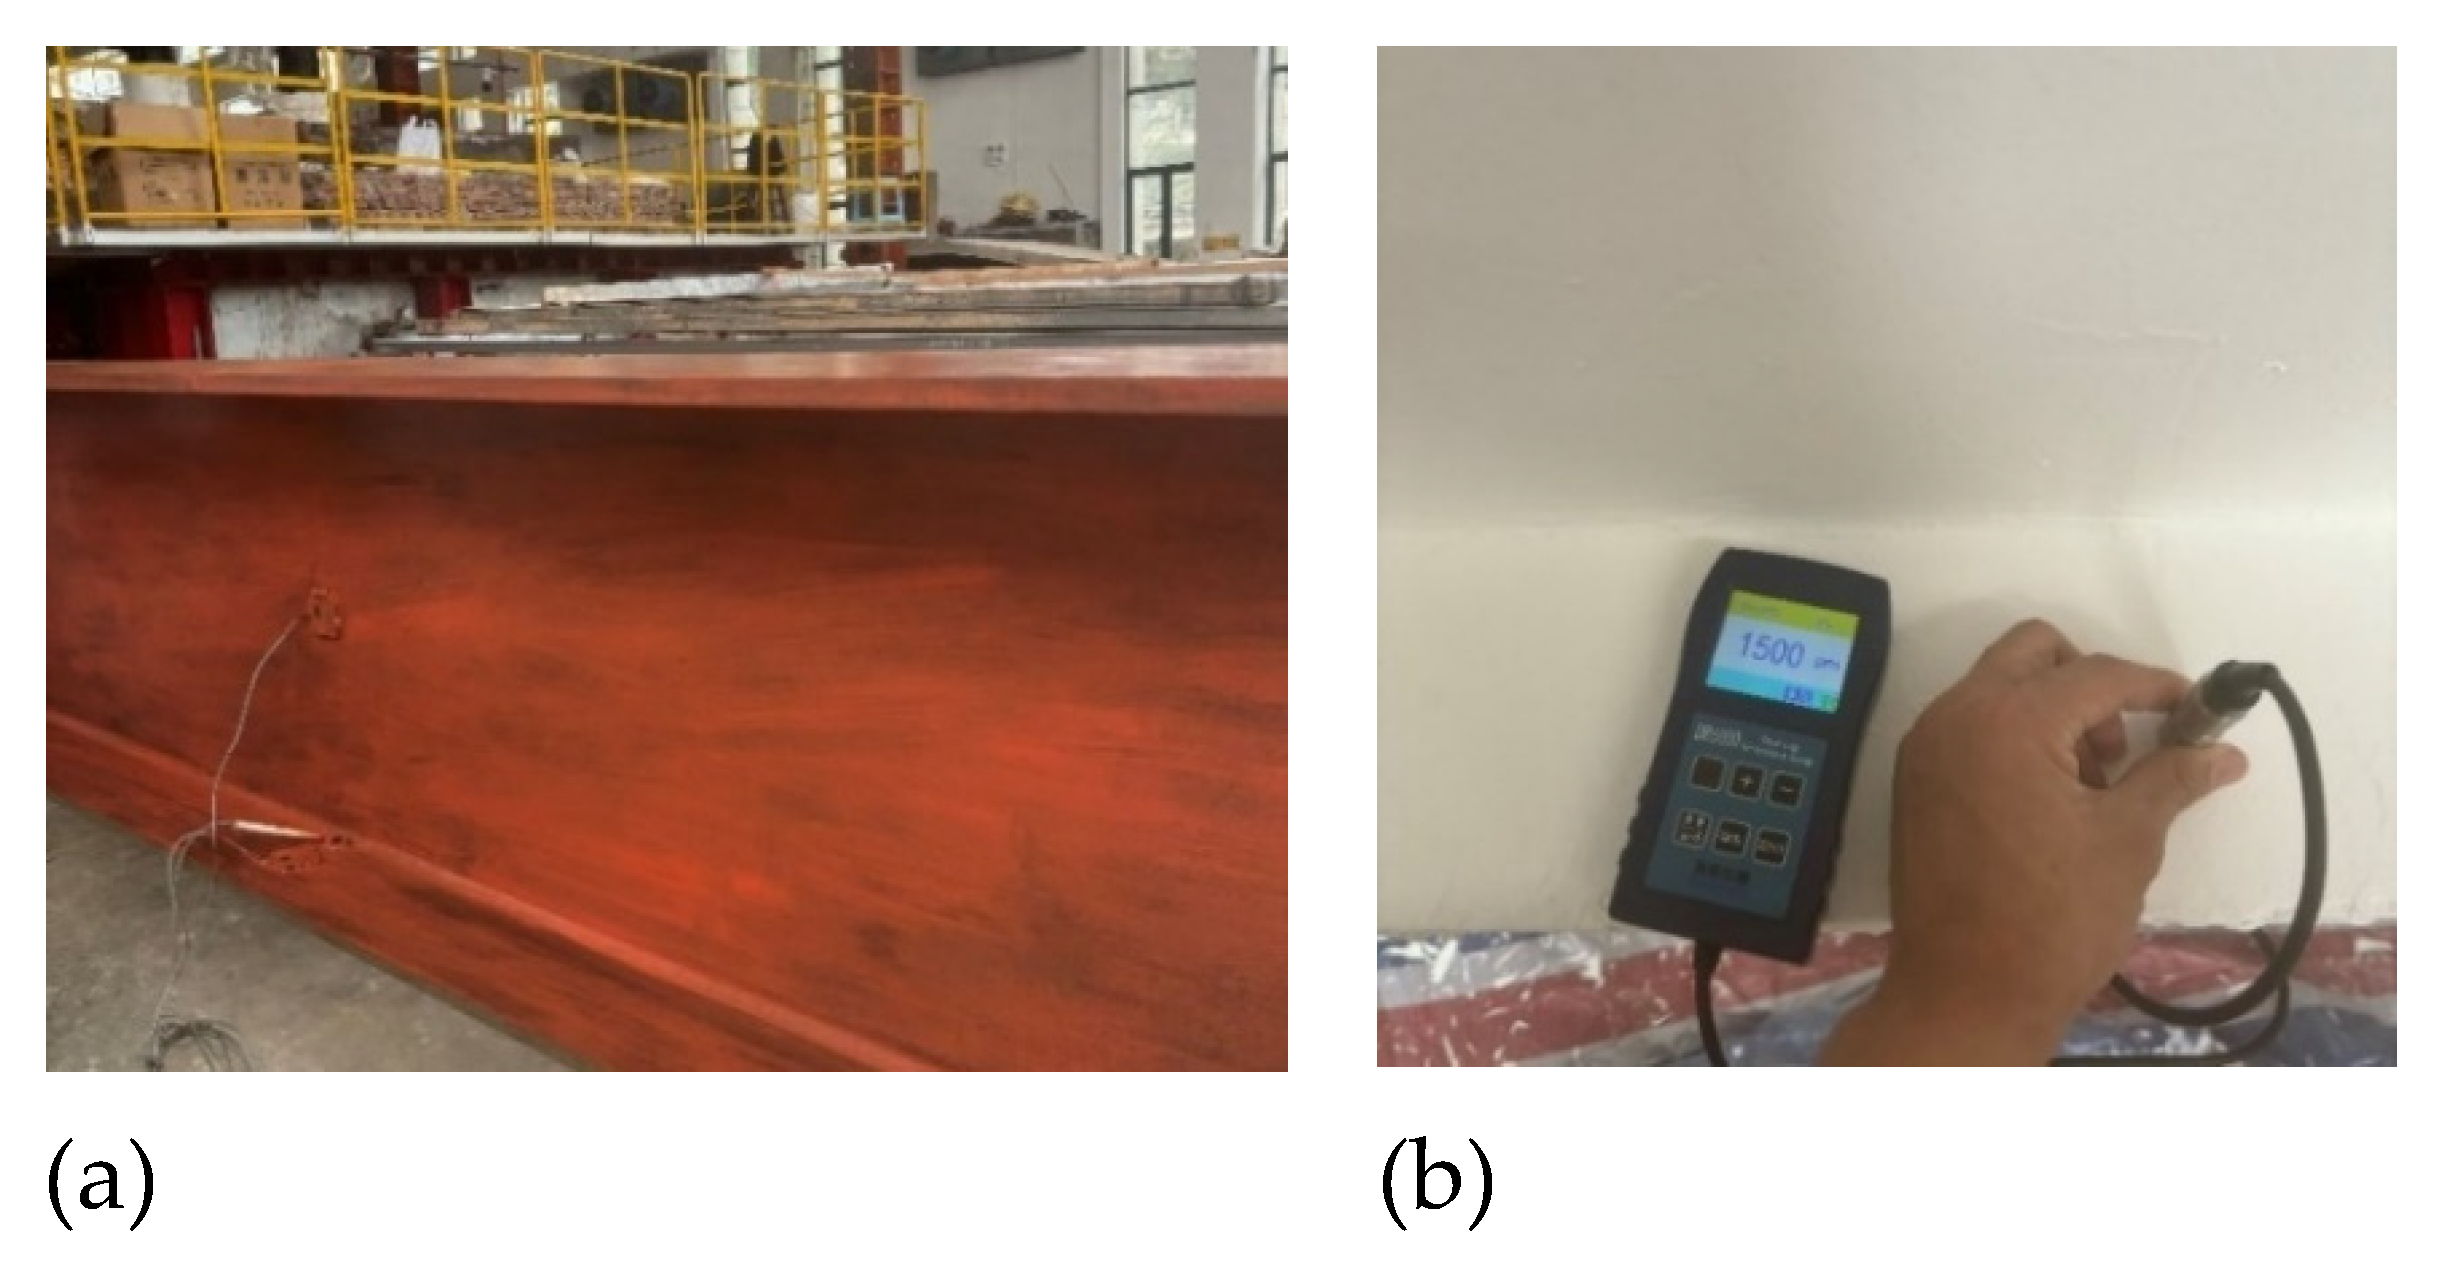
Figure 5.
Test set-up.
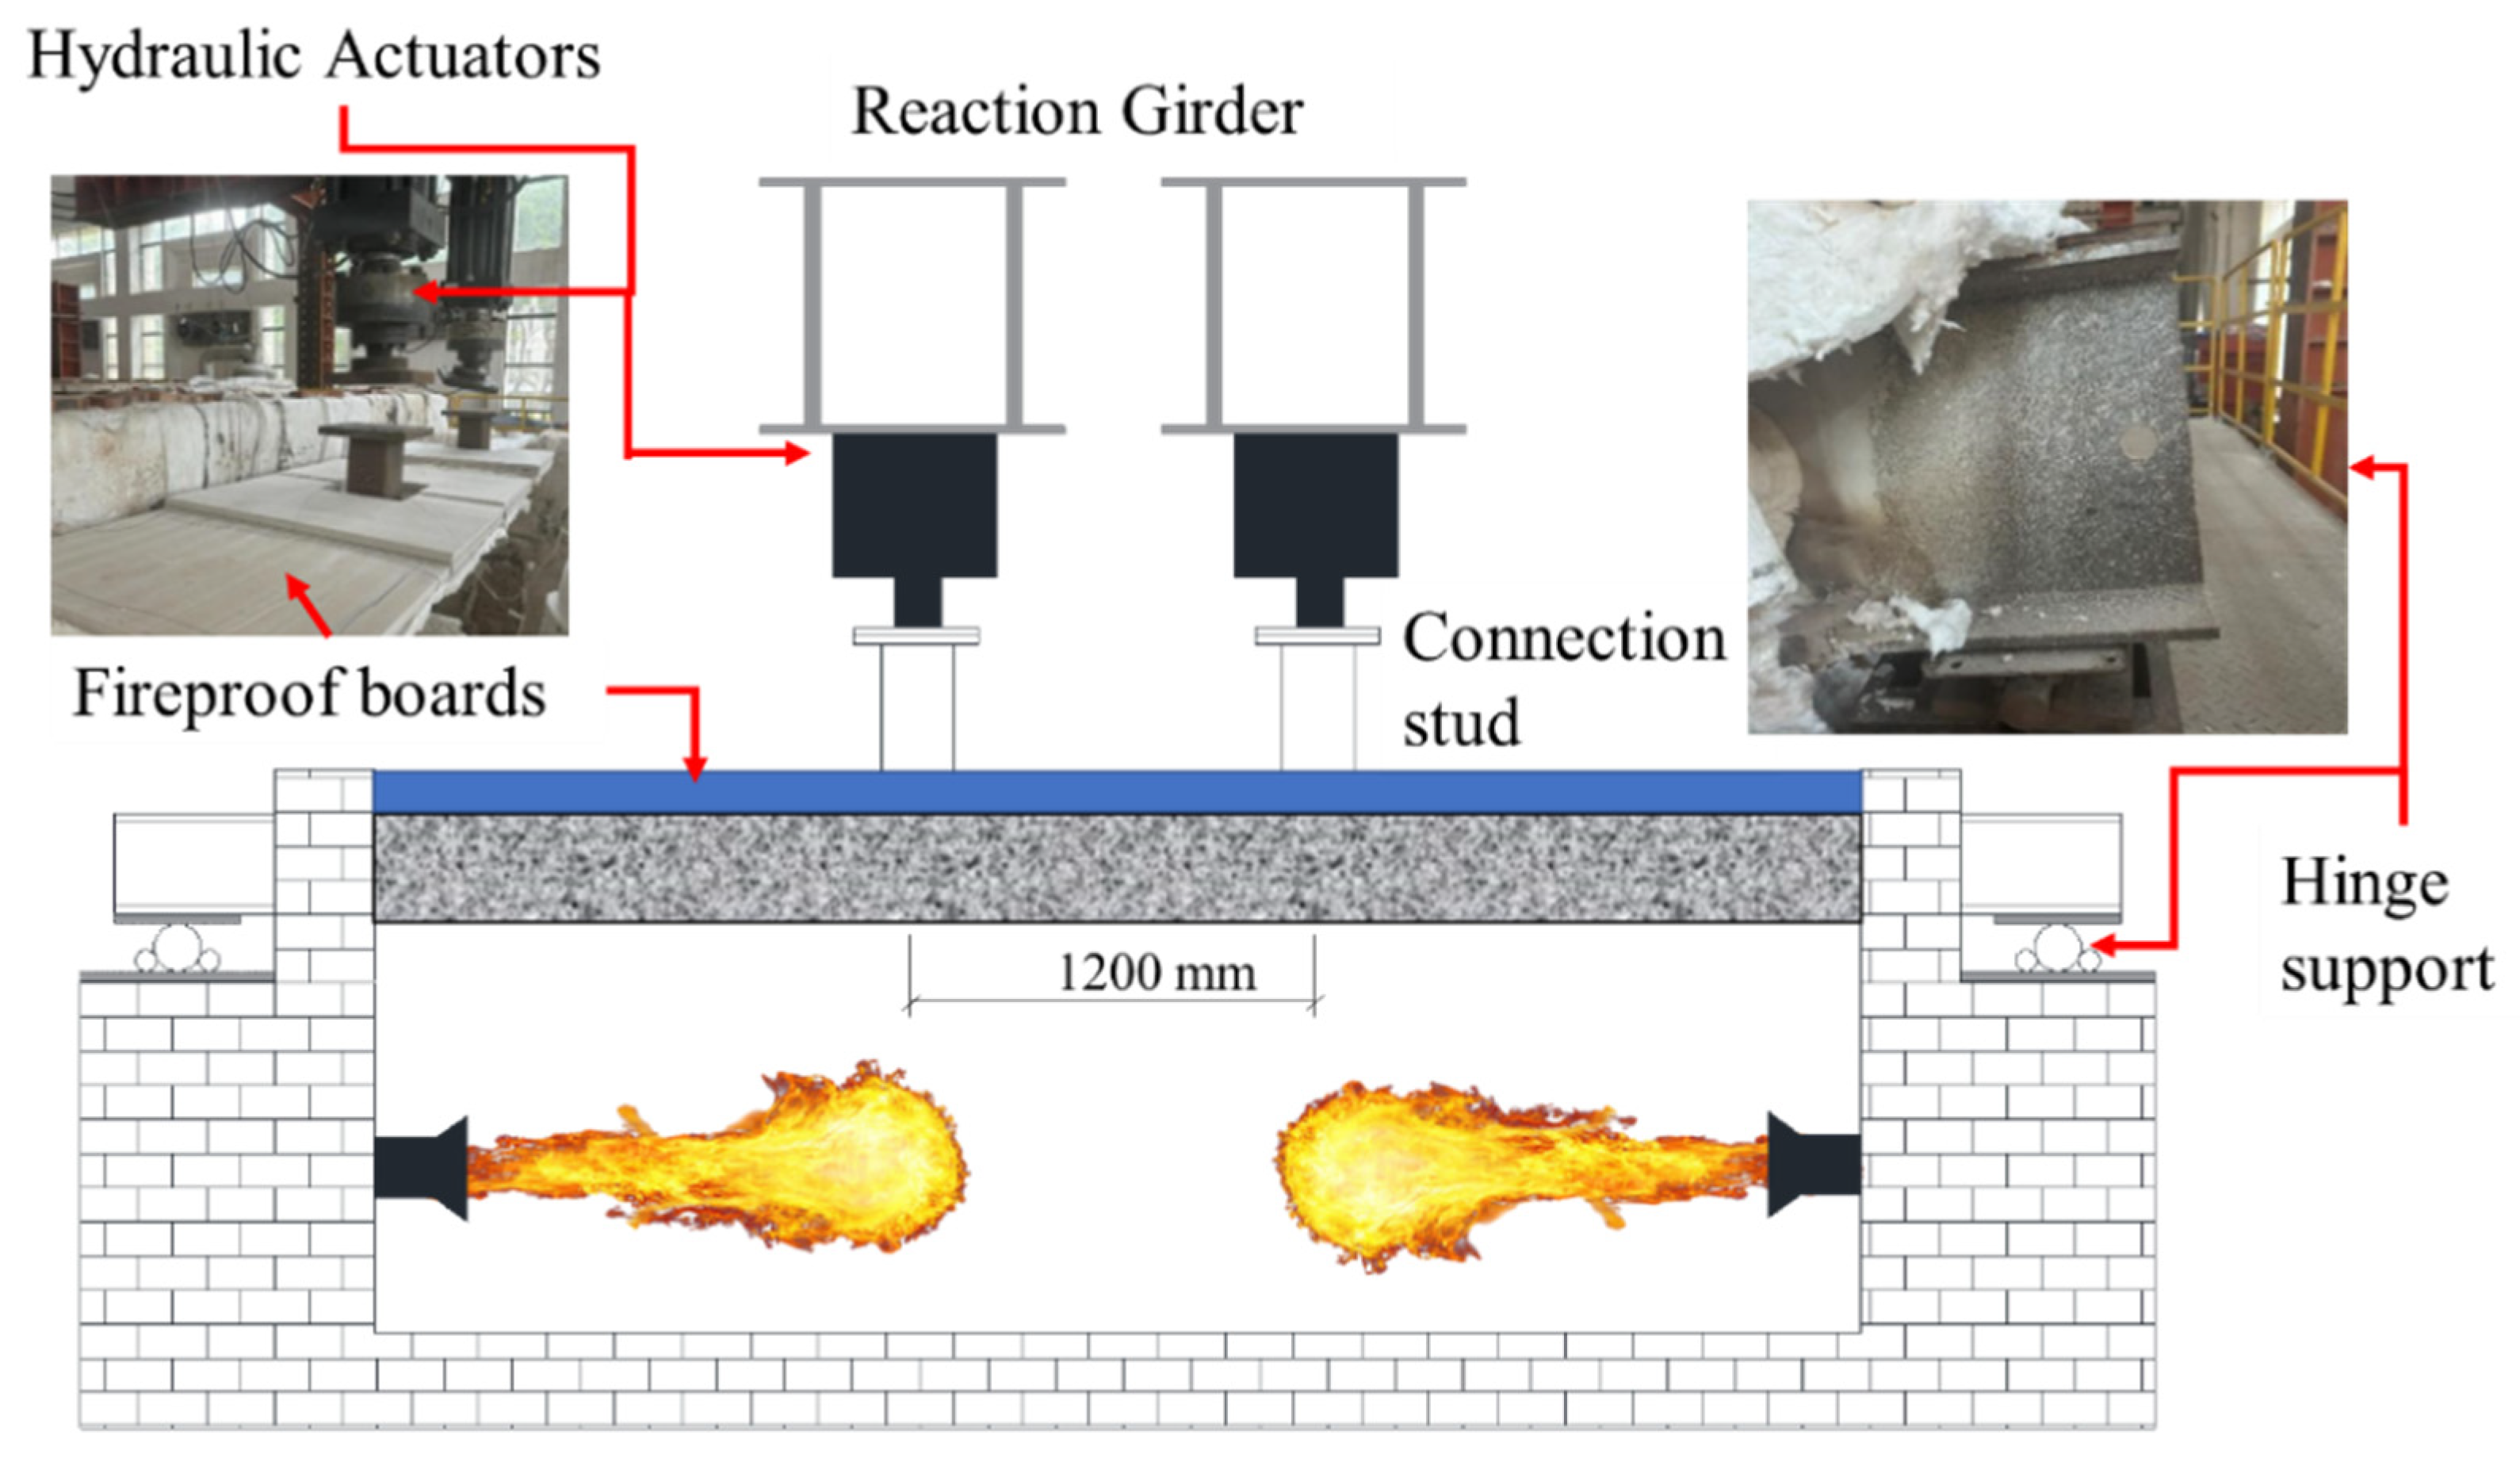
Figure 6.
Arrangement of the thermocouples.
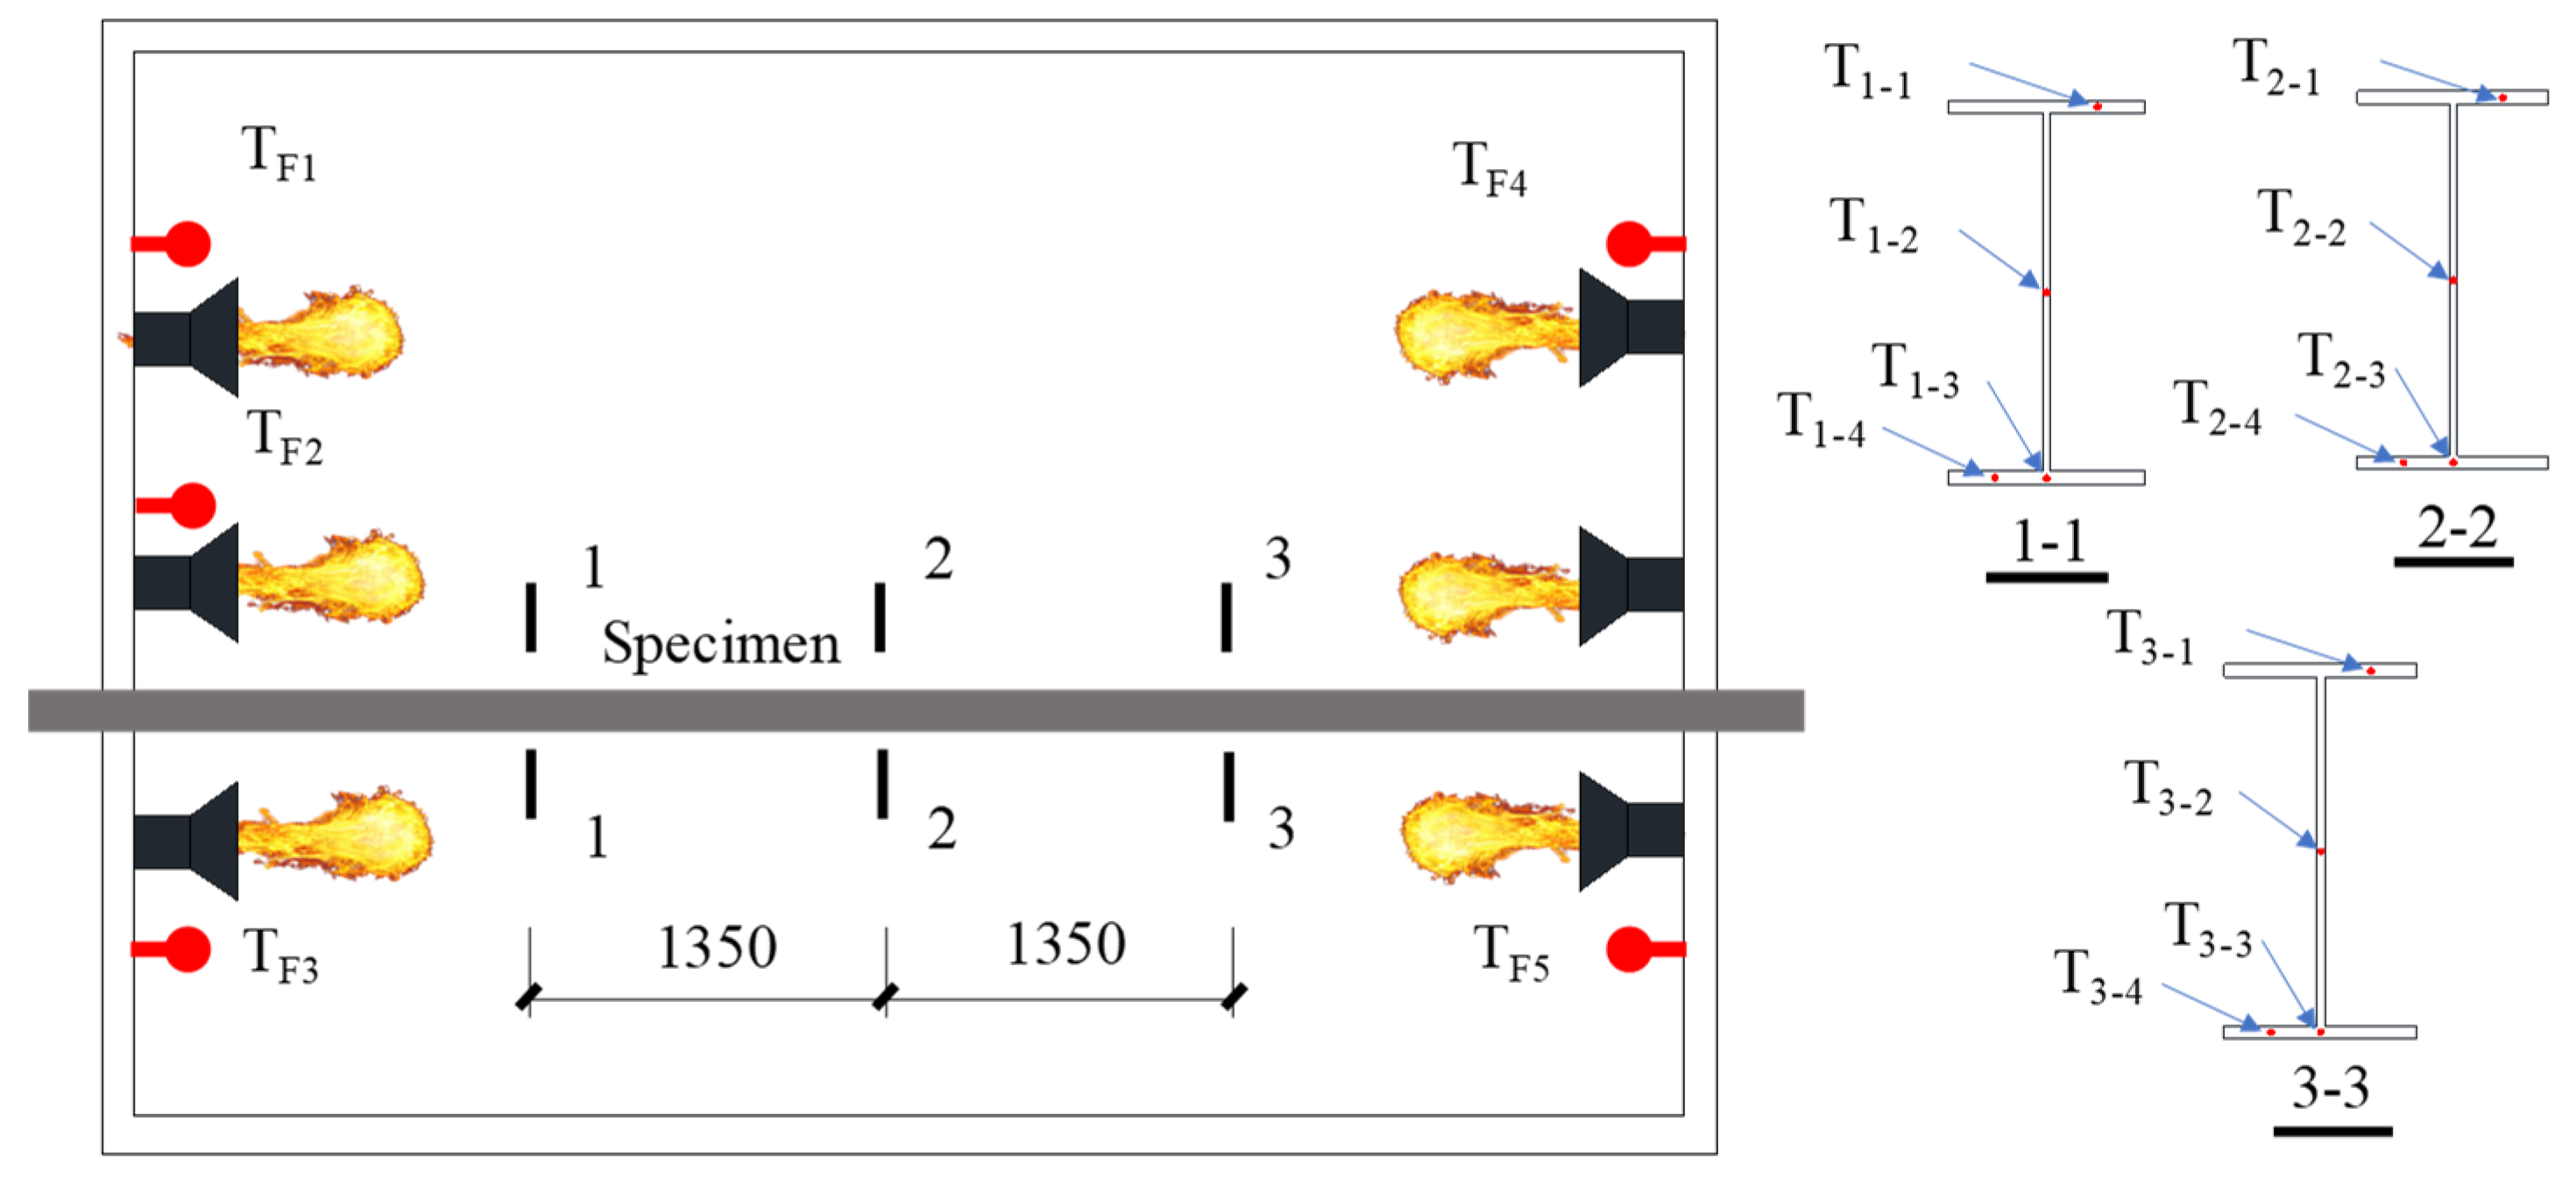
Figure 7.
Arrangement of the LVDT.
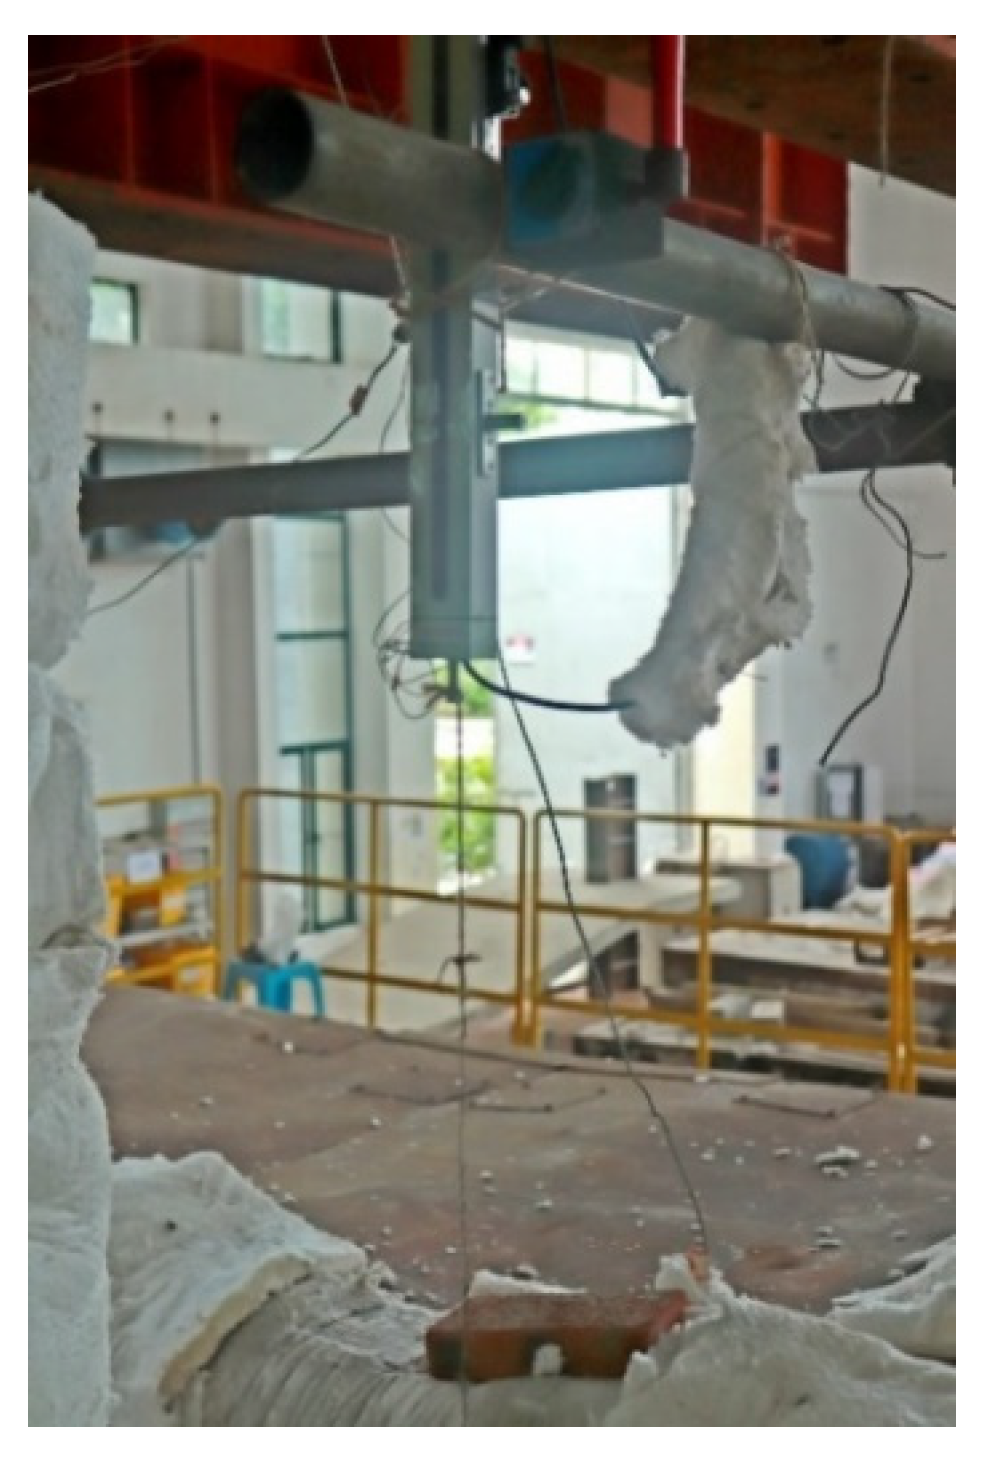
Figure 8.
Heating curves.
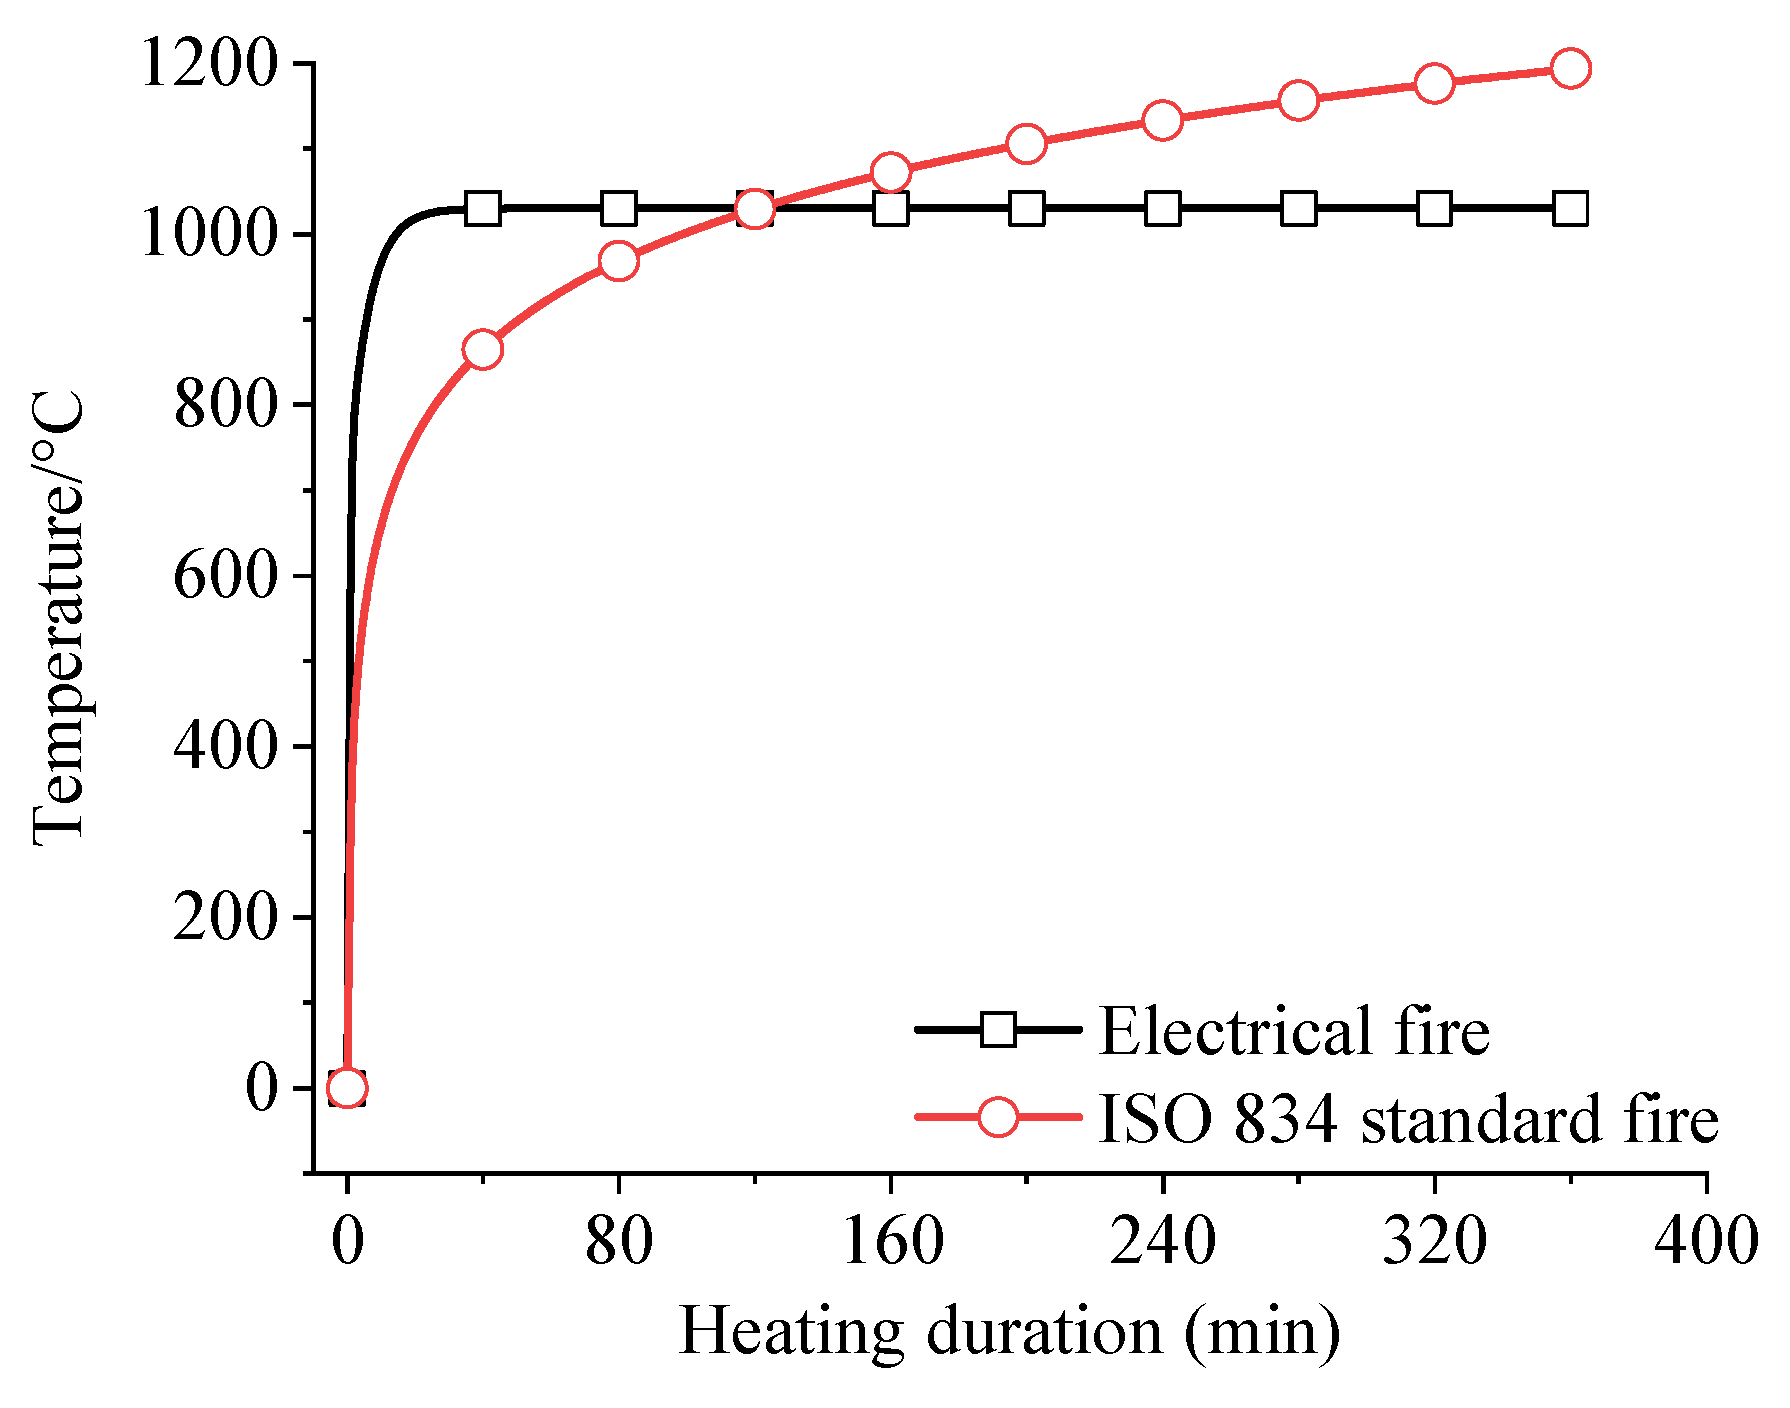
Figure 9.
Furnace temperature: (a) D-1; (b) D-2; (c) D-3; (d) D-4; (e) ISO-1; (f) ISO-2.
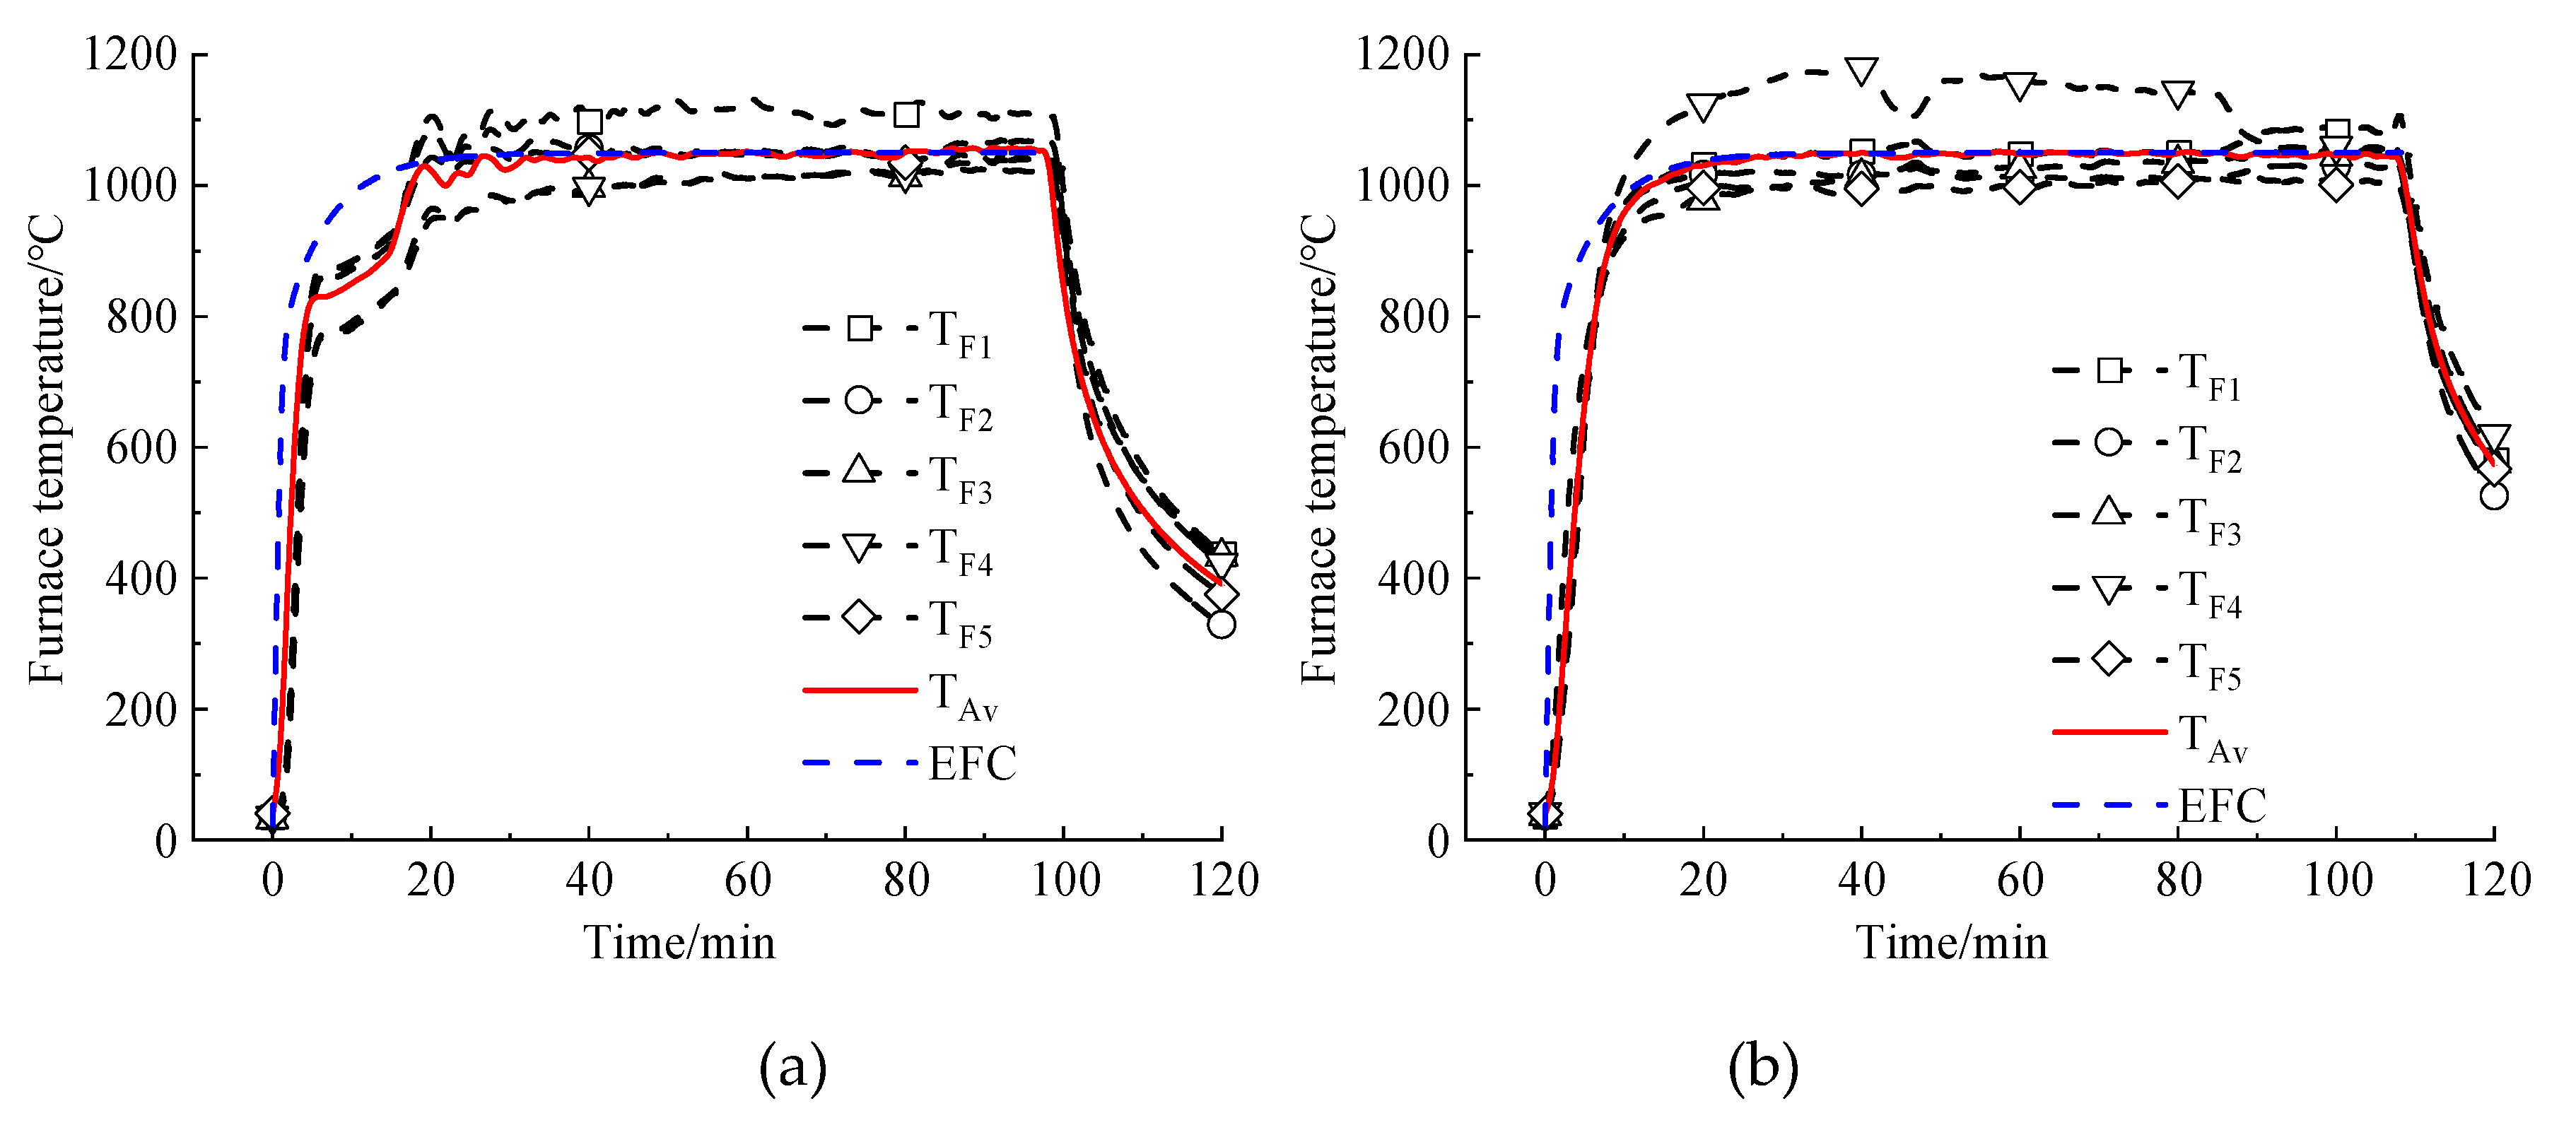
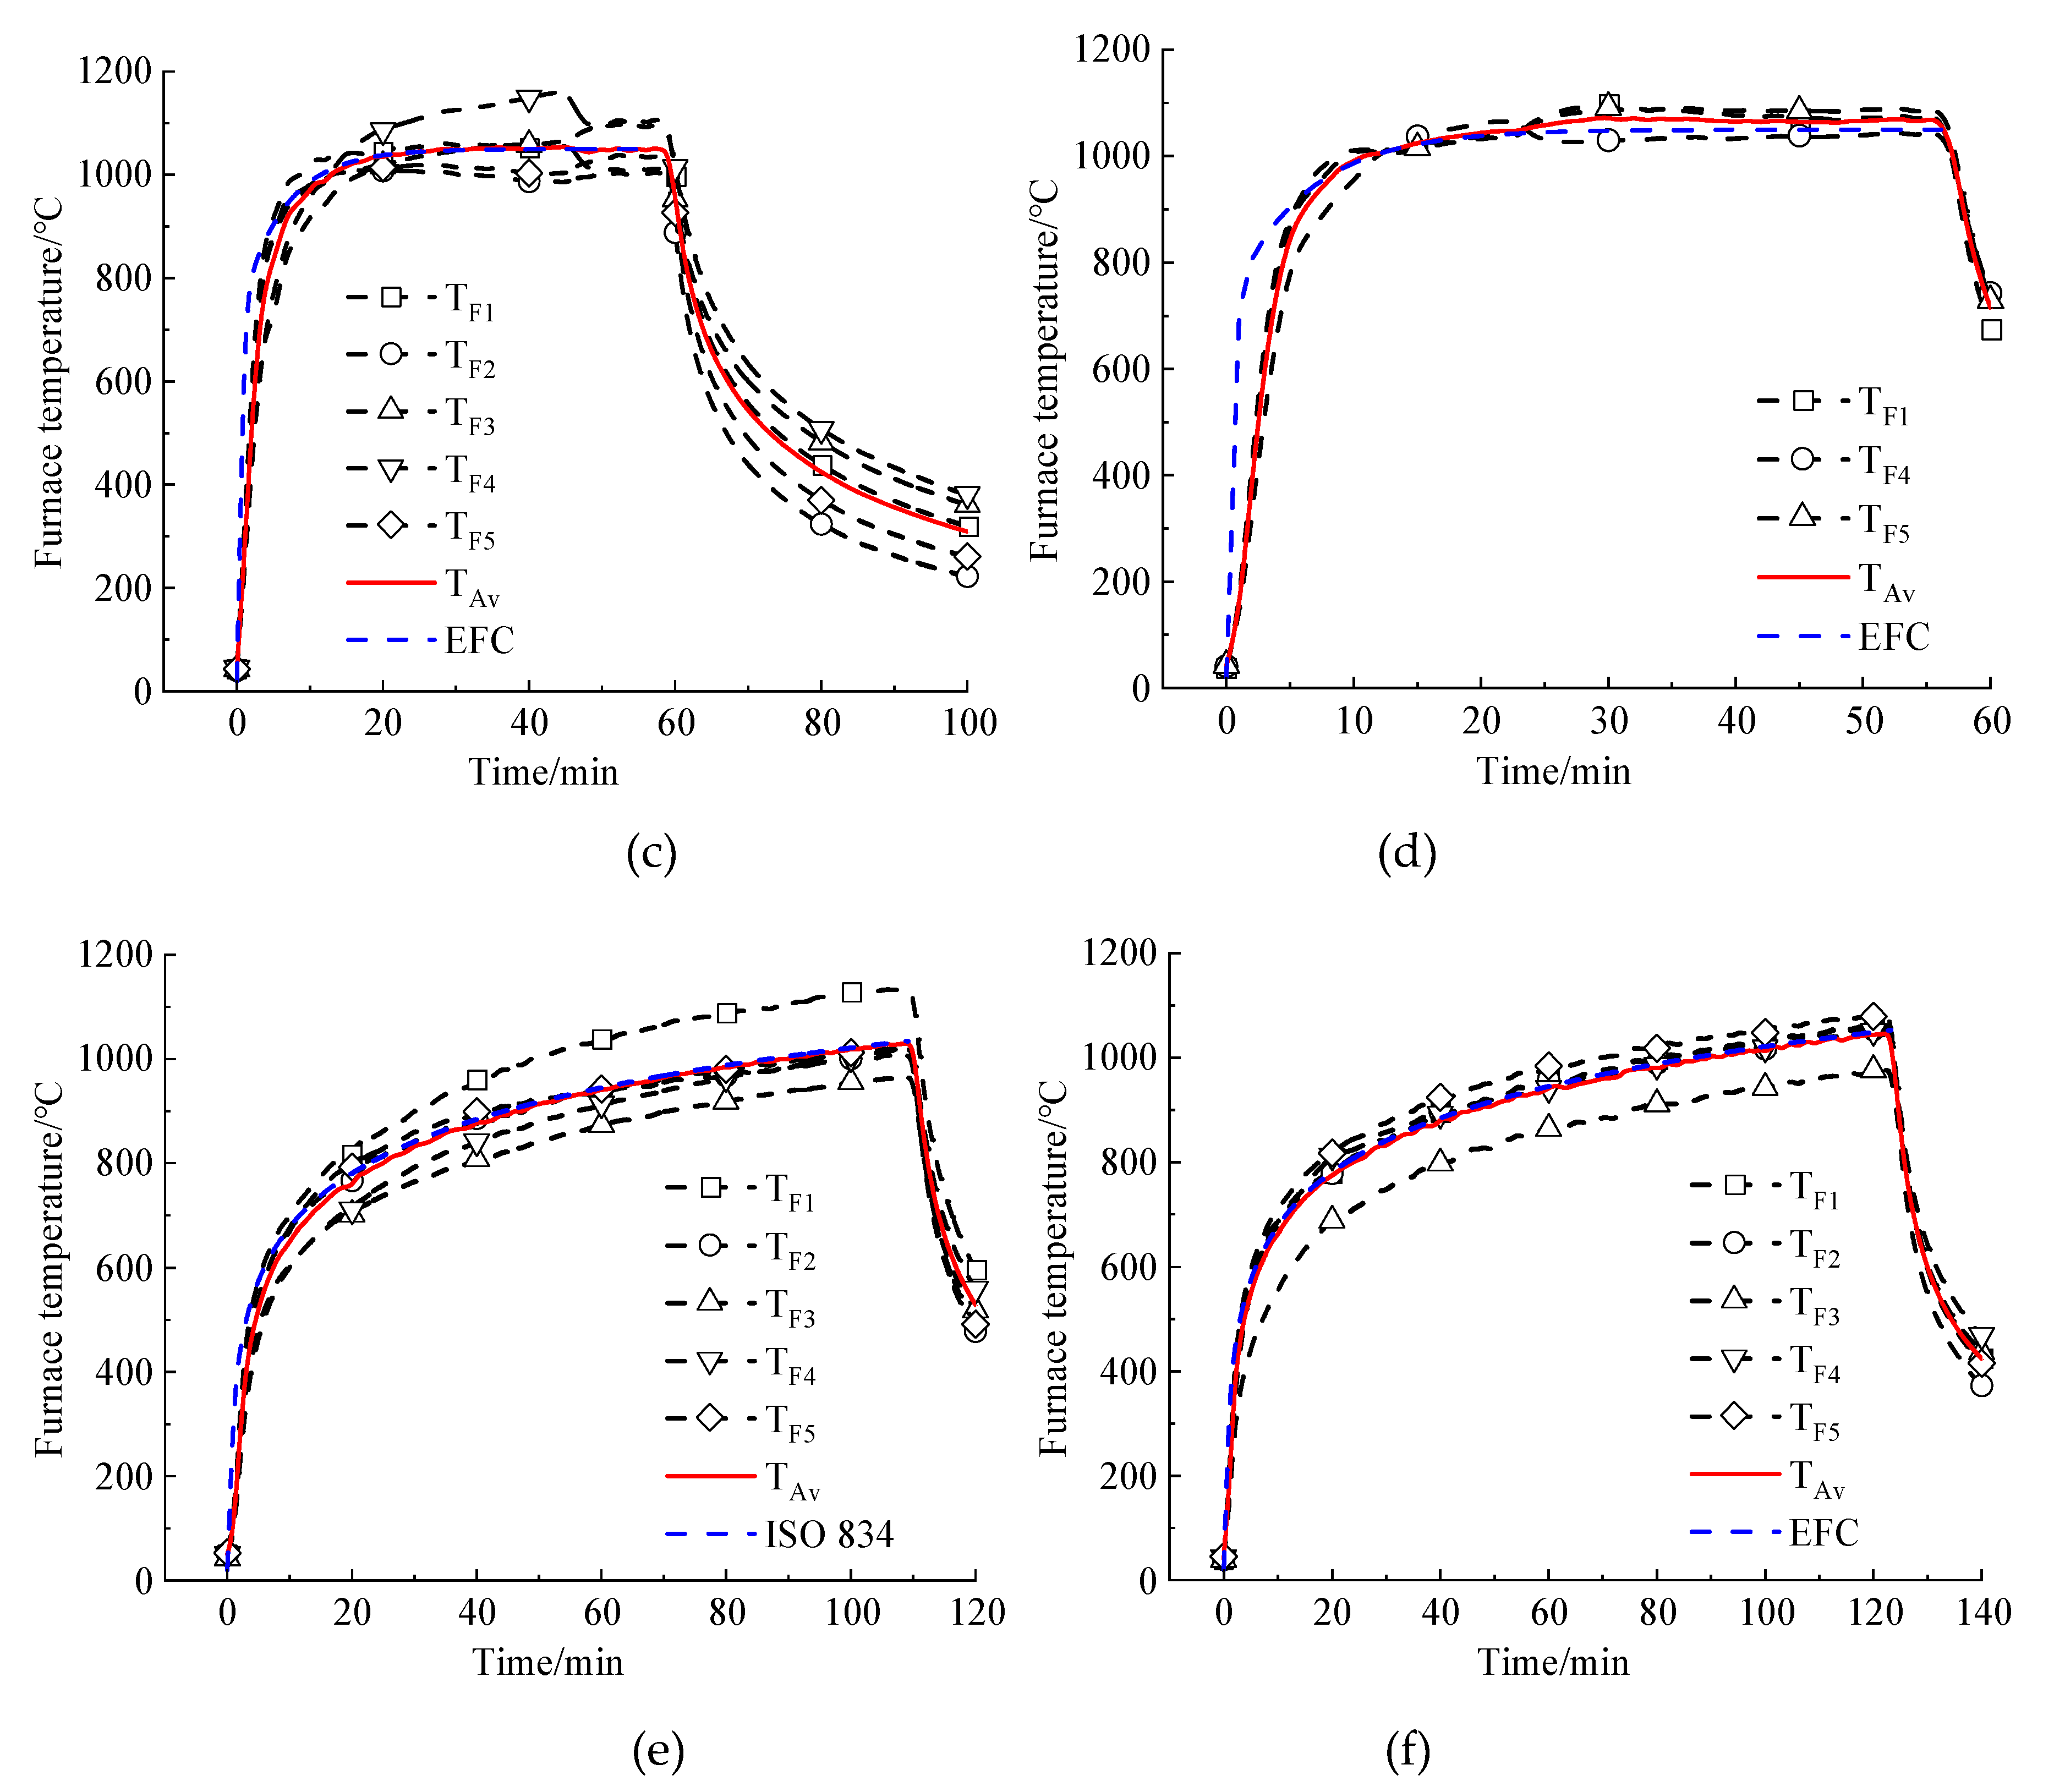
Figure 10.
Specimen temperature: (a) D-1; (b) D-2; (c) D-3; (d) D-4; (e) ISO-1; (f) ISO-2.
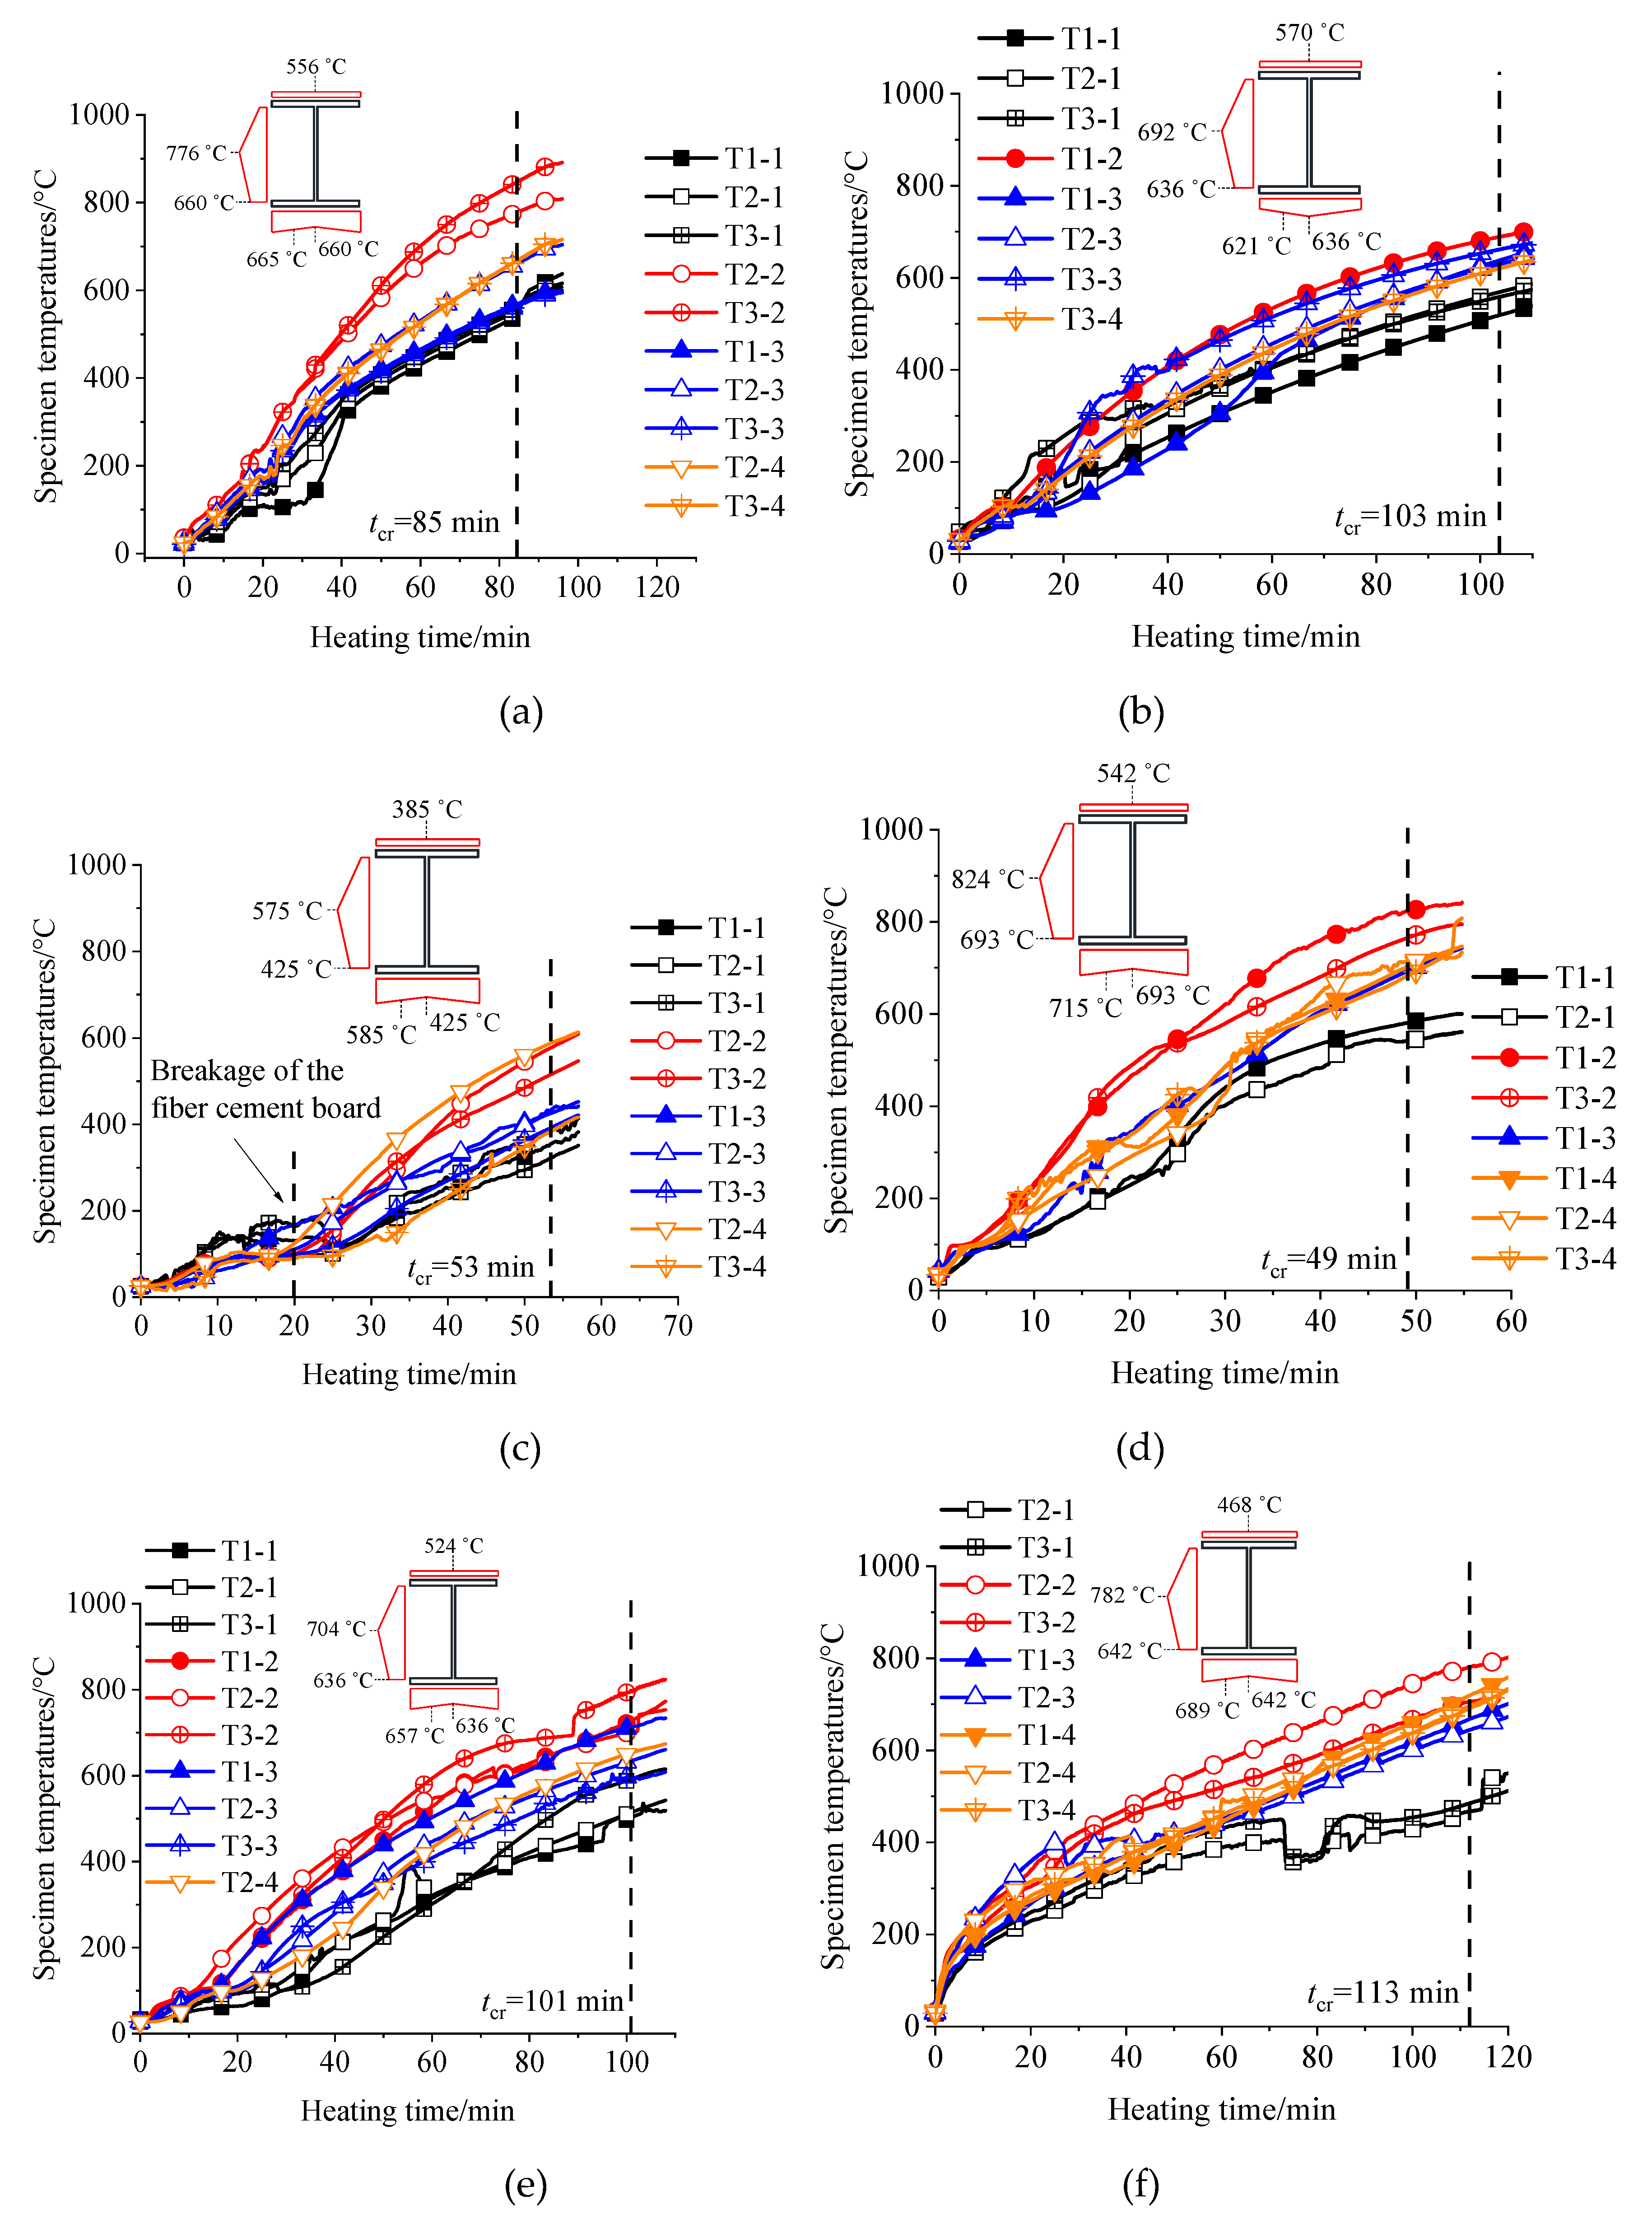
Figure 11.
Deflection at the mid-span: (a) D-1; (b) D-2; (c) D-3; (d) D-4; (e) ISO-1; (f) ISO-2.
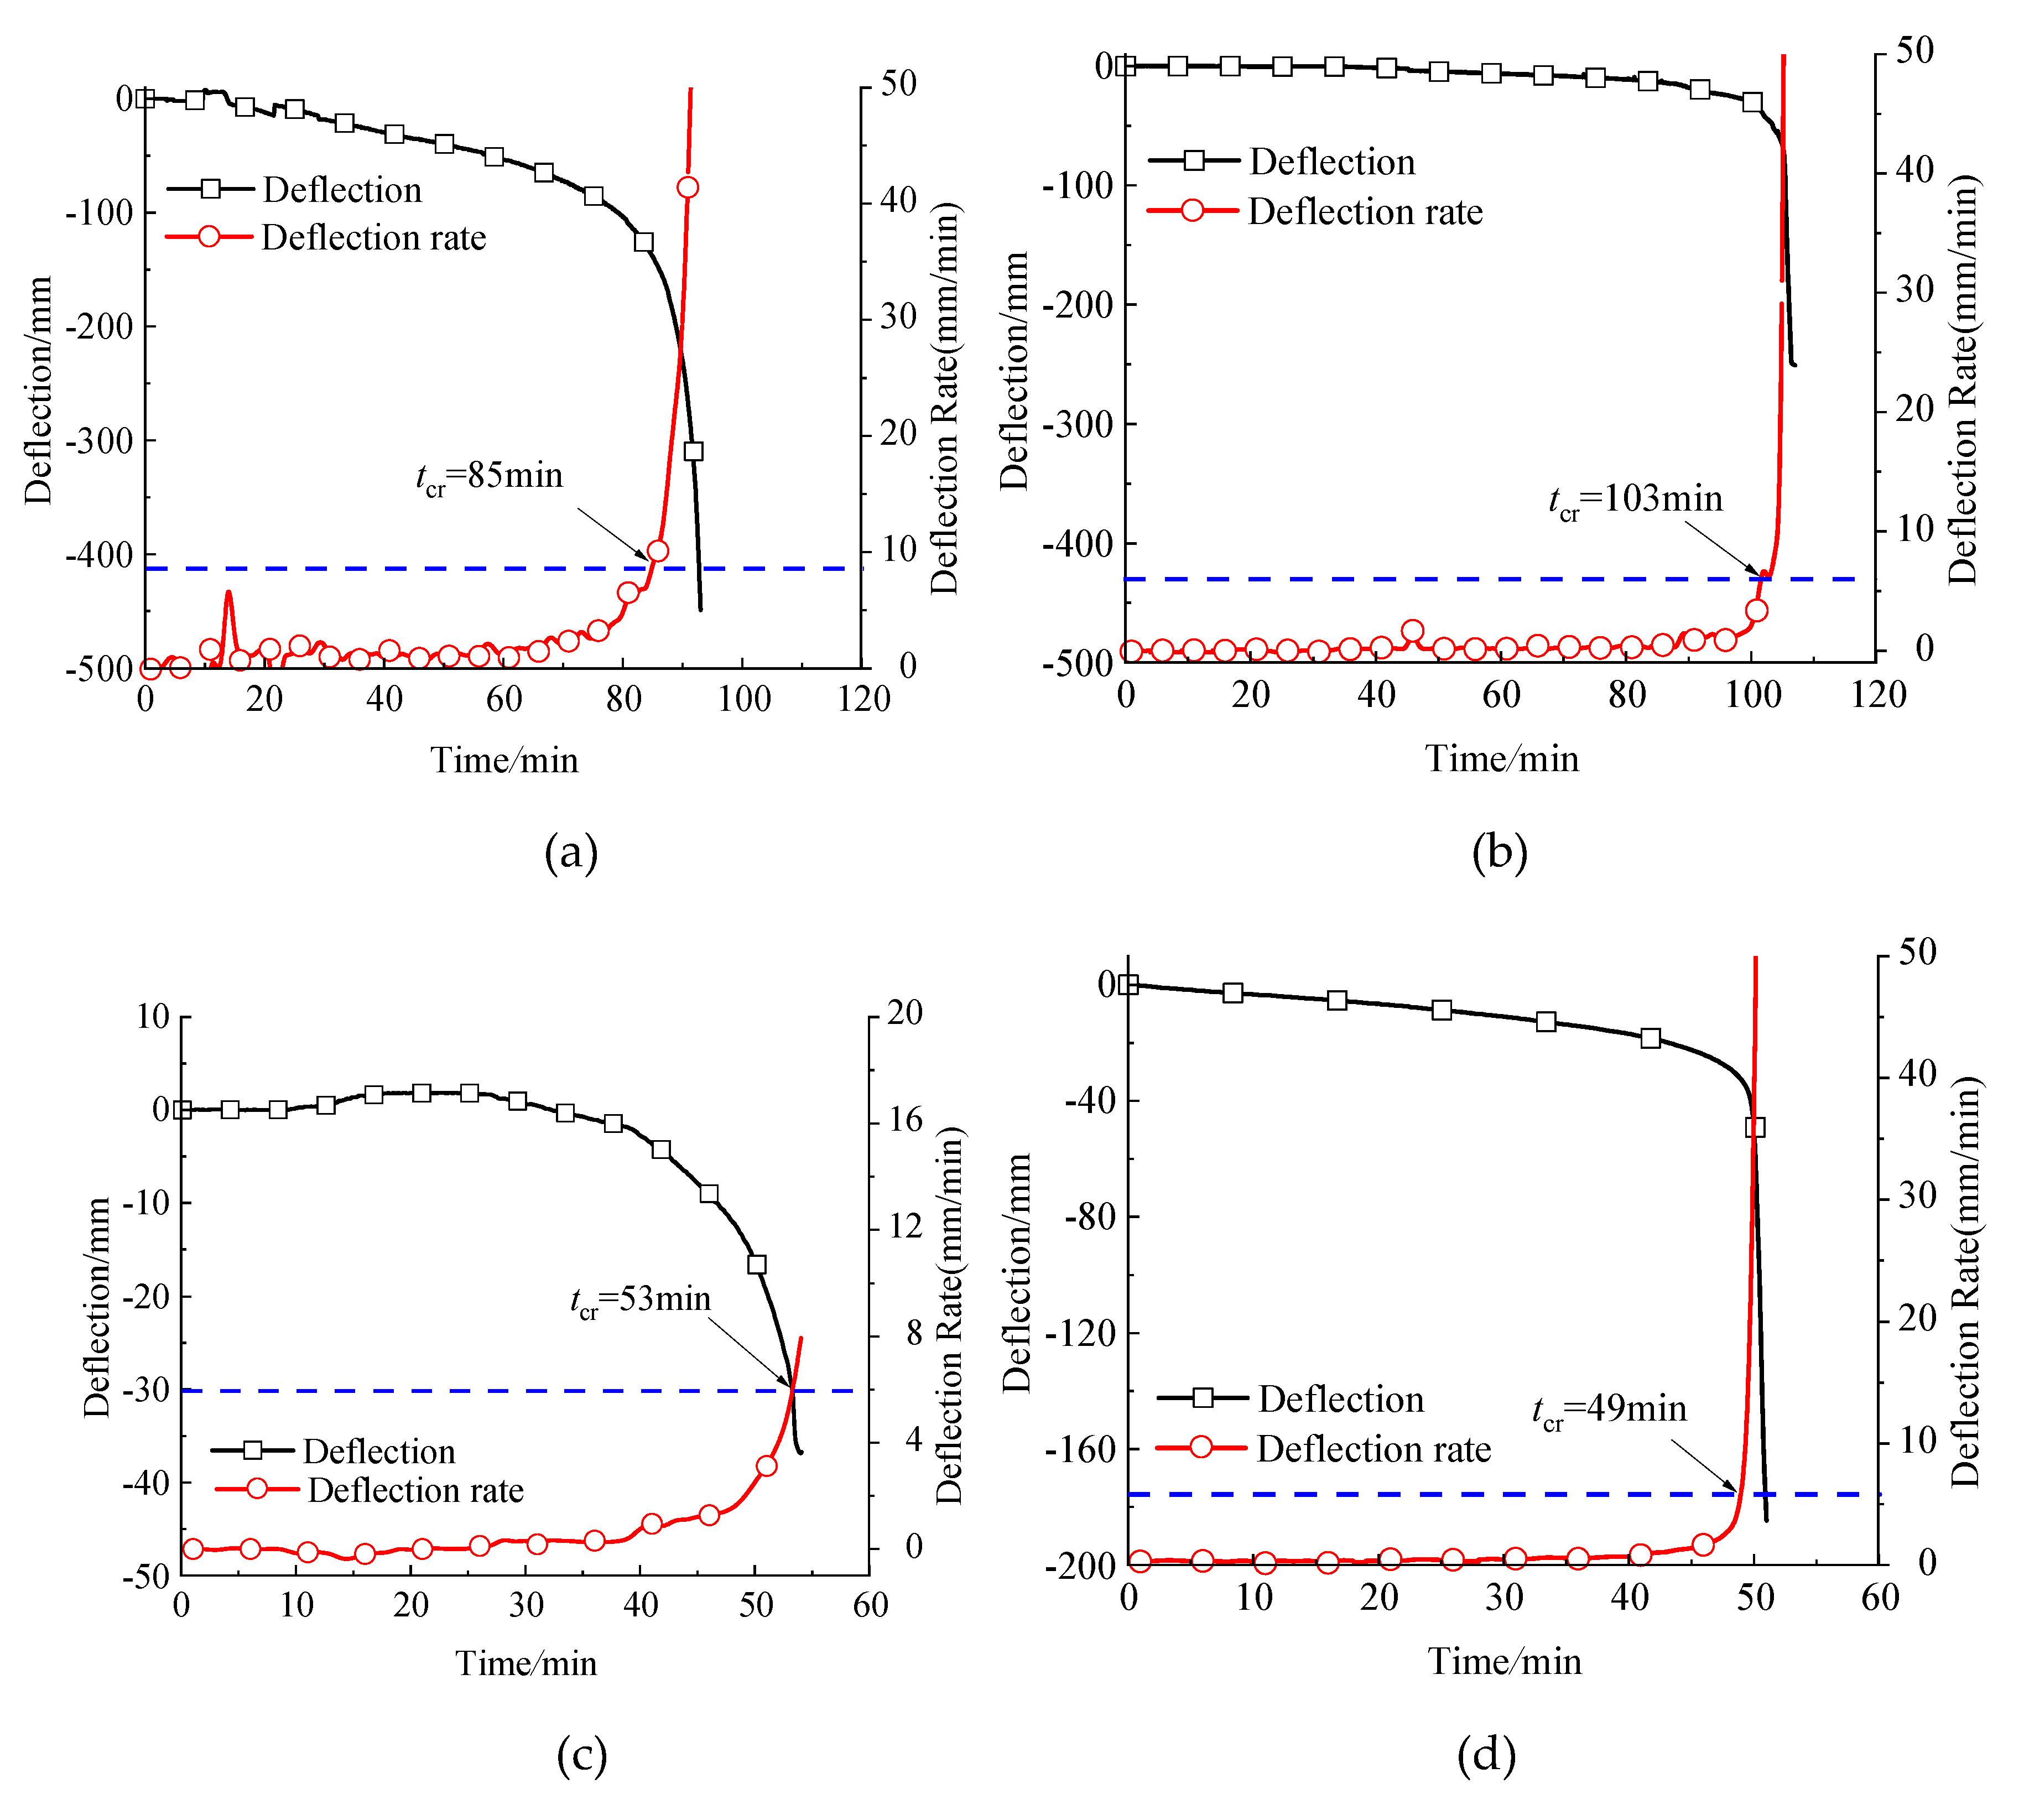
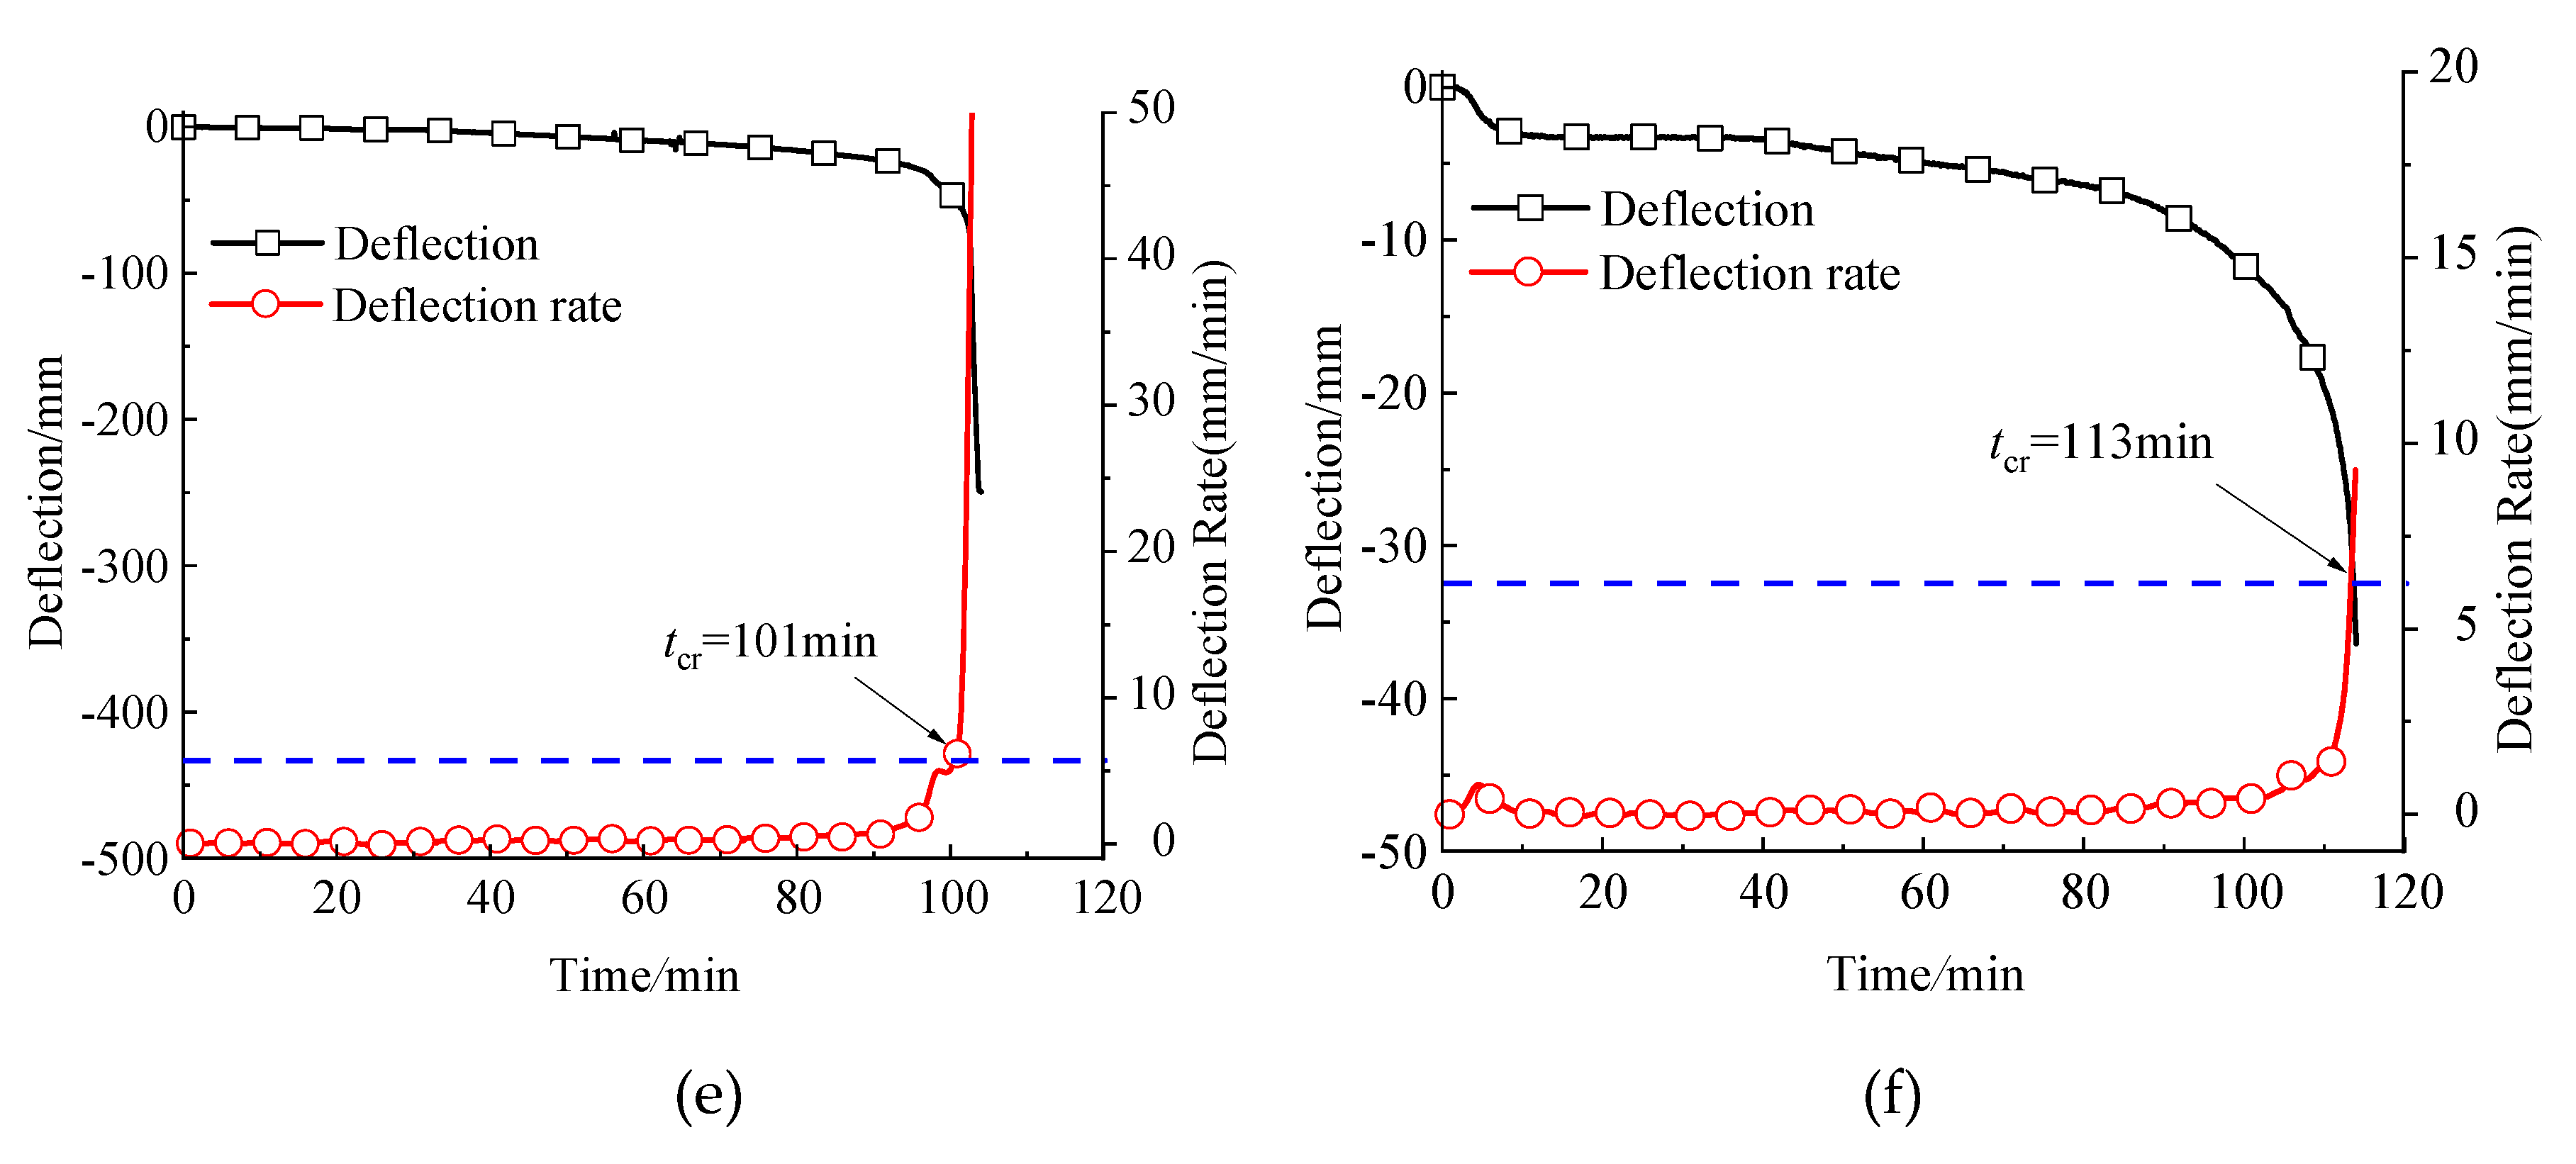
Figure 12.
Failure mode of the specimens: (a) D-1; (b) D-2; (c) D-3; (d) D-4; (e) ISO-1; (f) ISO-2.
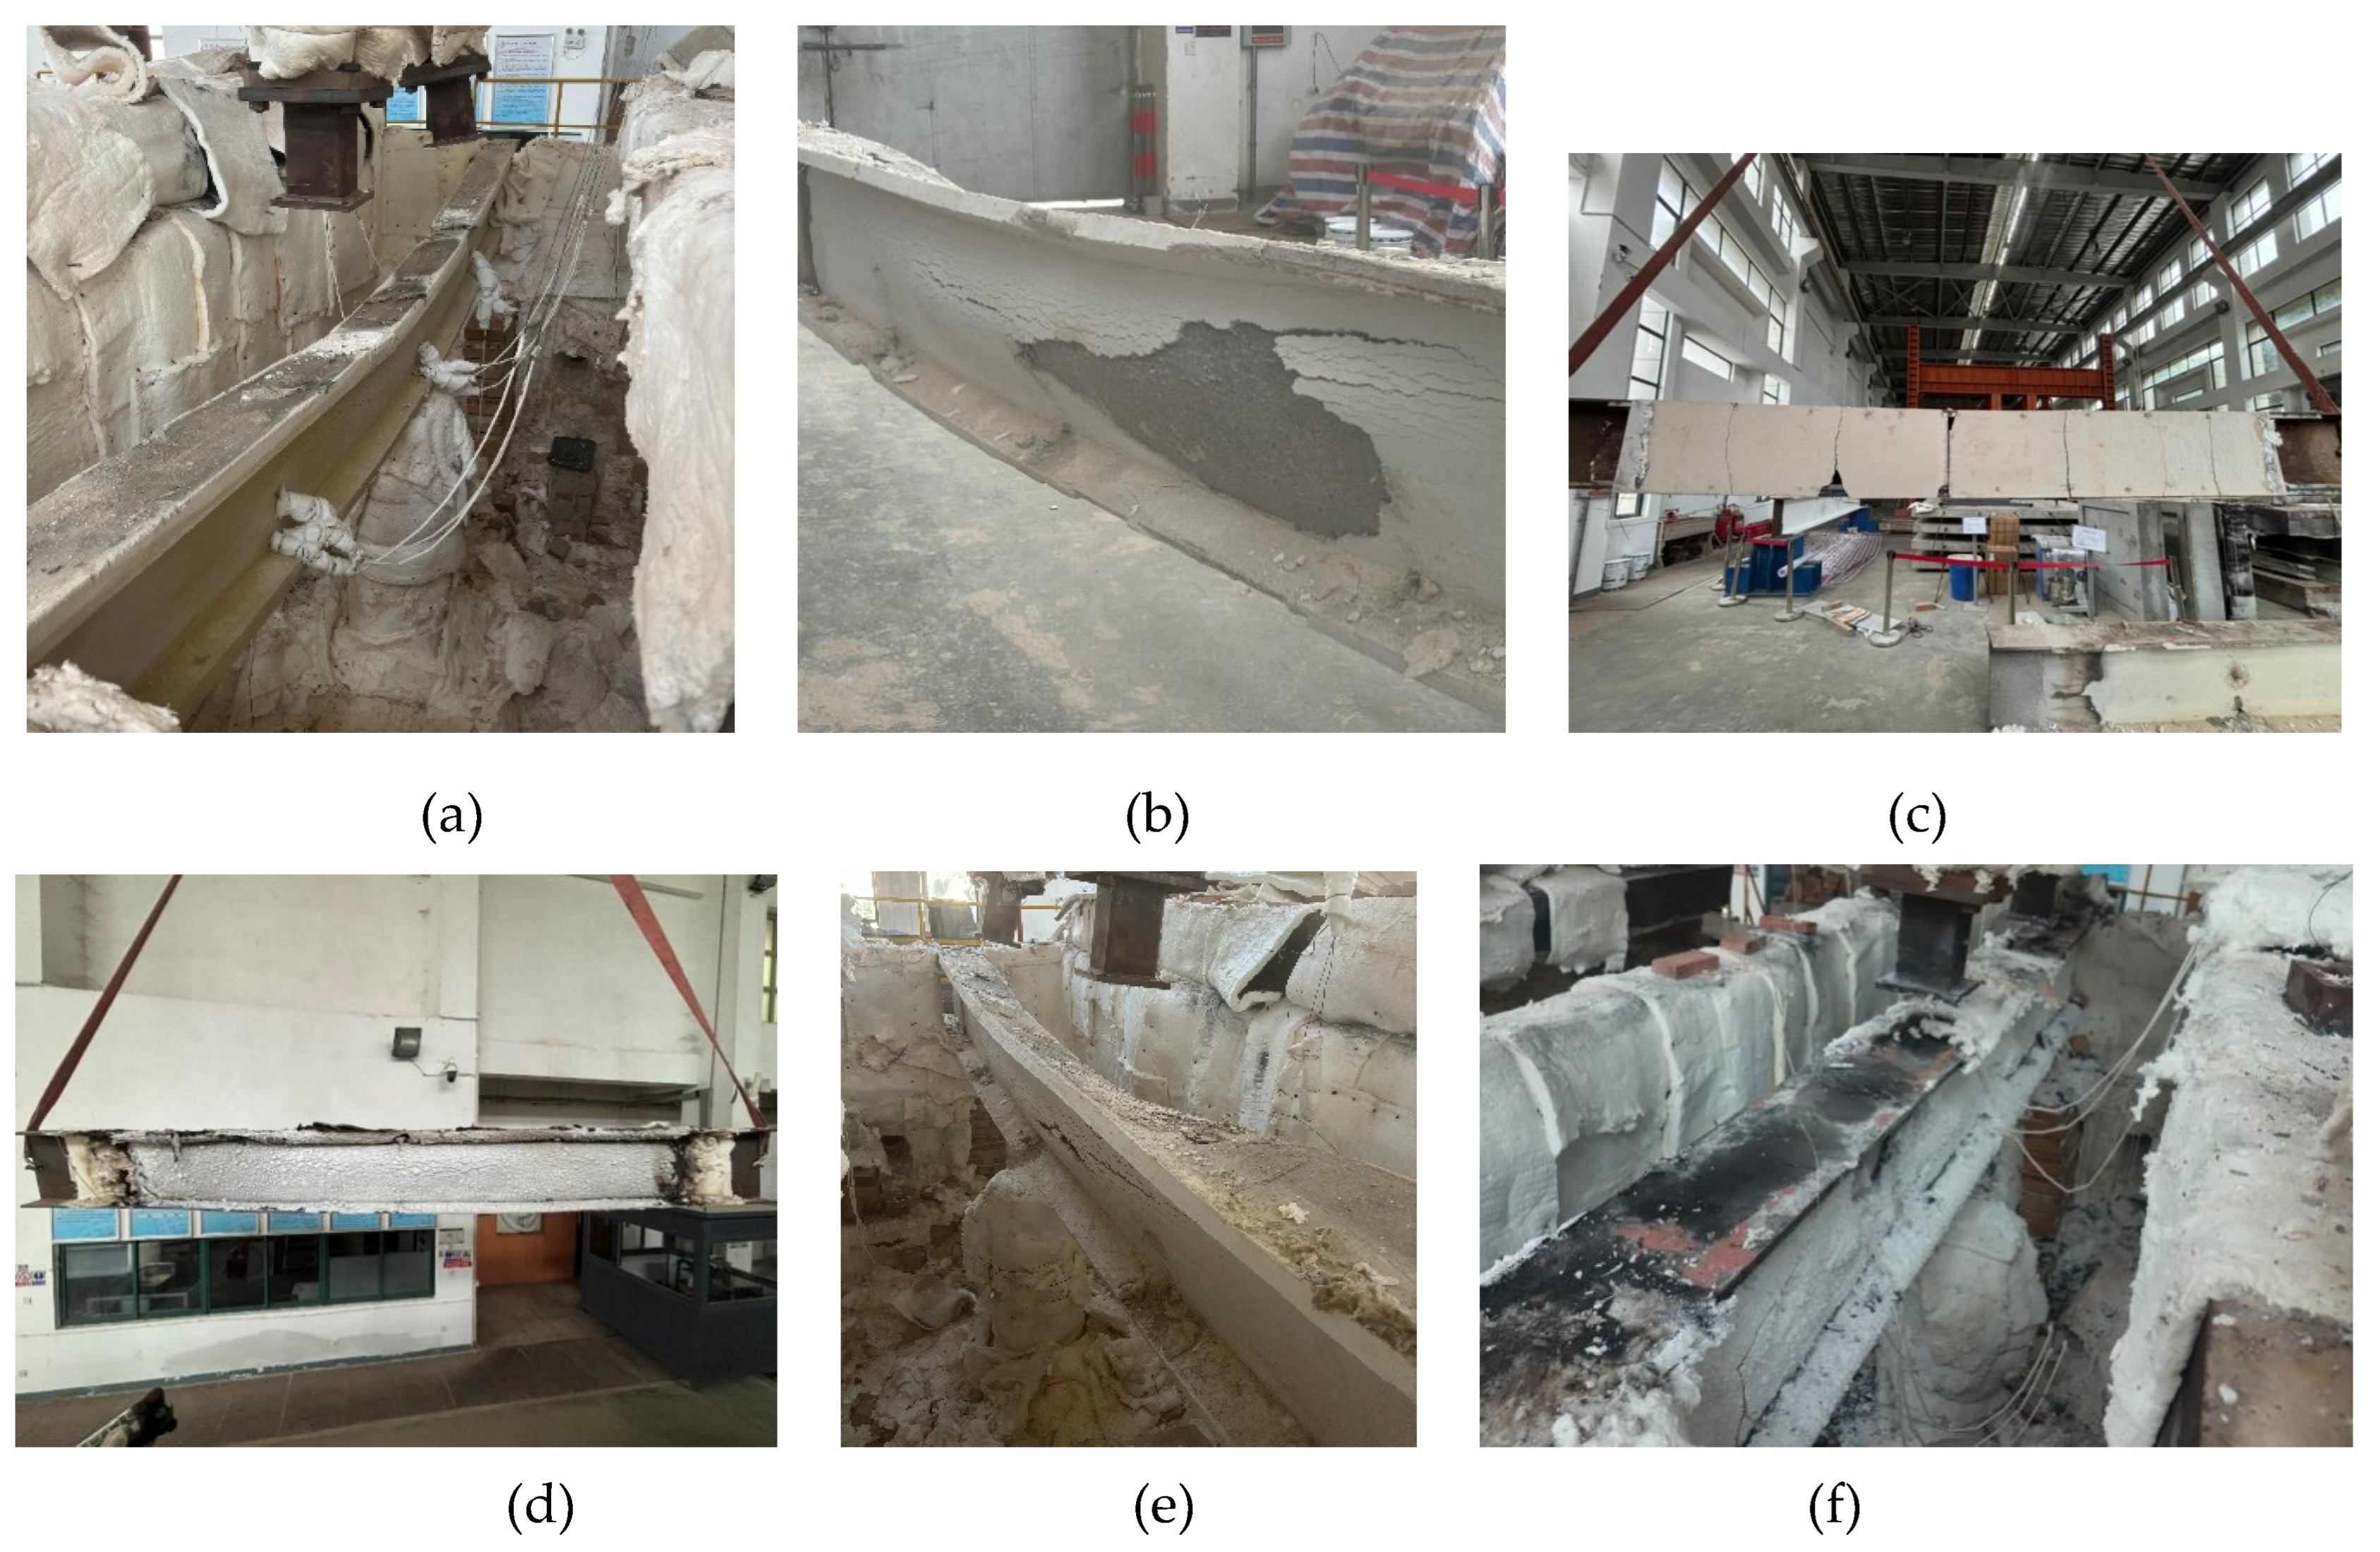
Figure 13.
Temperature distribution mode.
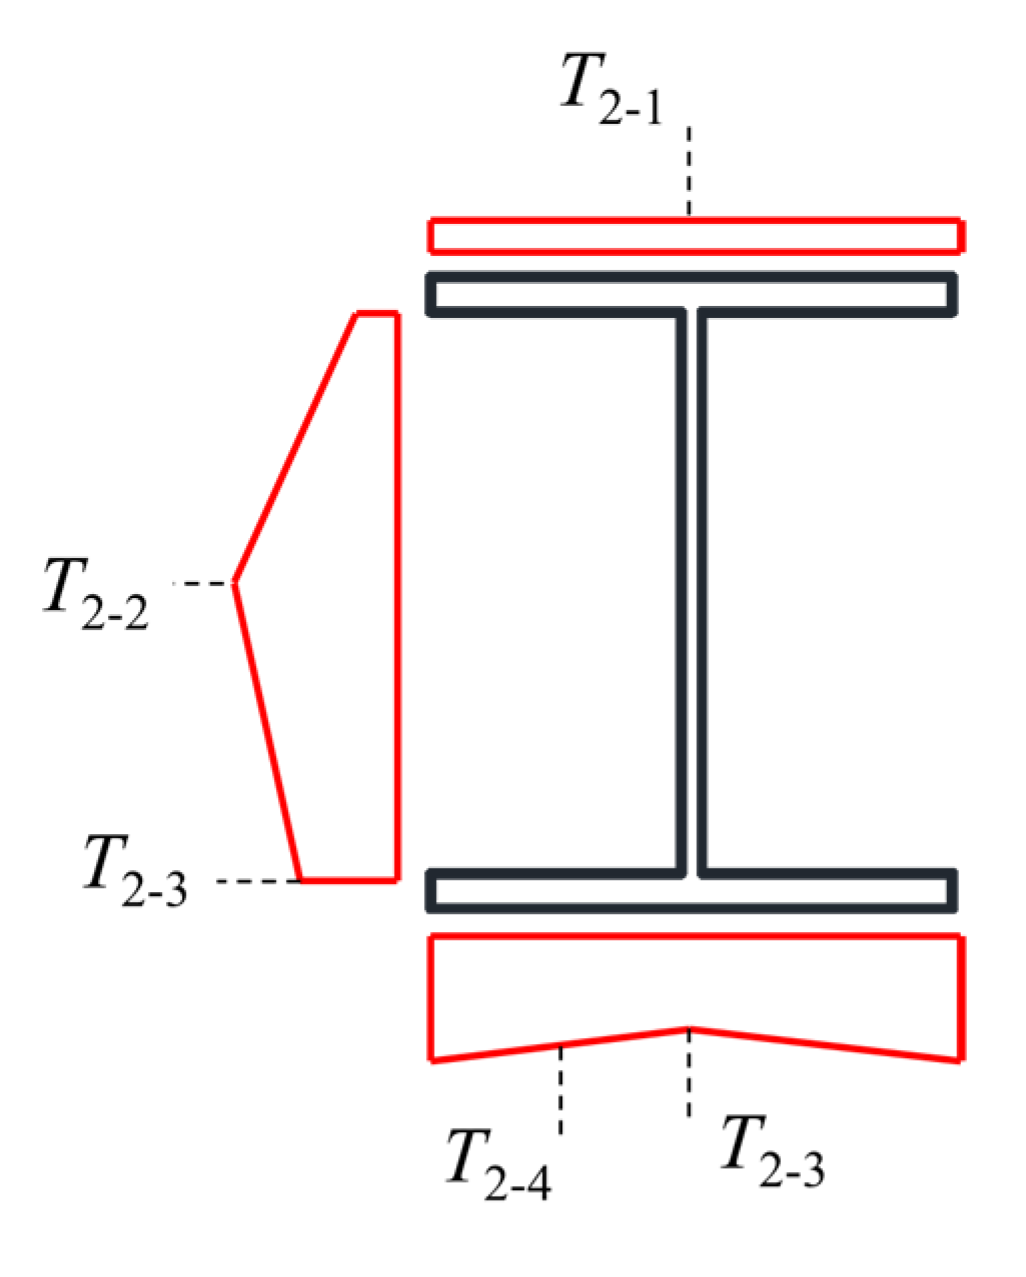
Figure 14.
Assessment of the accuracy of BS EN 1993-1-2 [23]: (a) Reduction of the load-bearing capacity; (b) Temperature increase of the insulated beams.
Figure 14.
Assessment of the accuracy of BS EN 1993-1-2 [23]: (a) Reduction of the load-bearing capacity; (b) Temperature increase of the insulated beams.
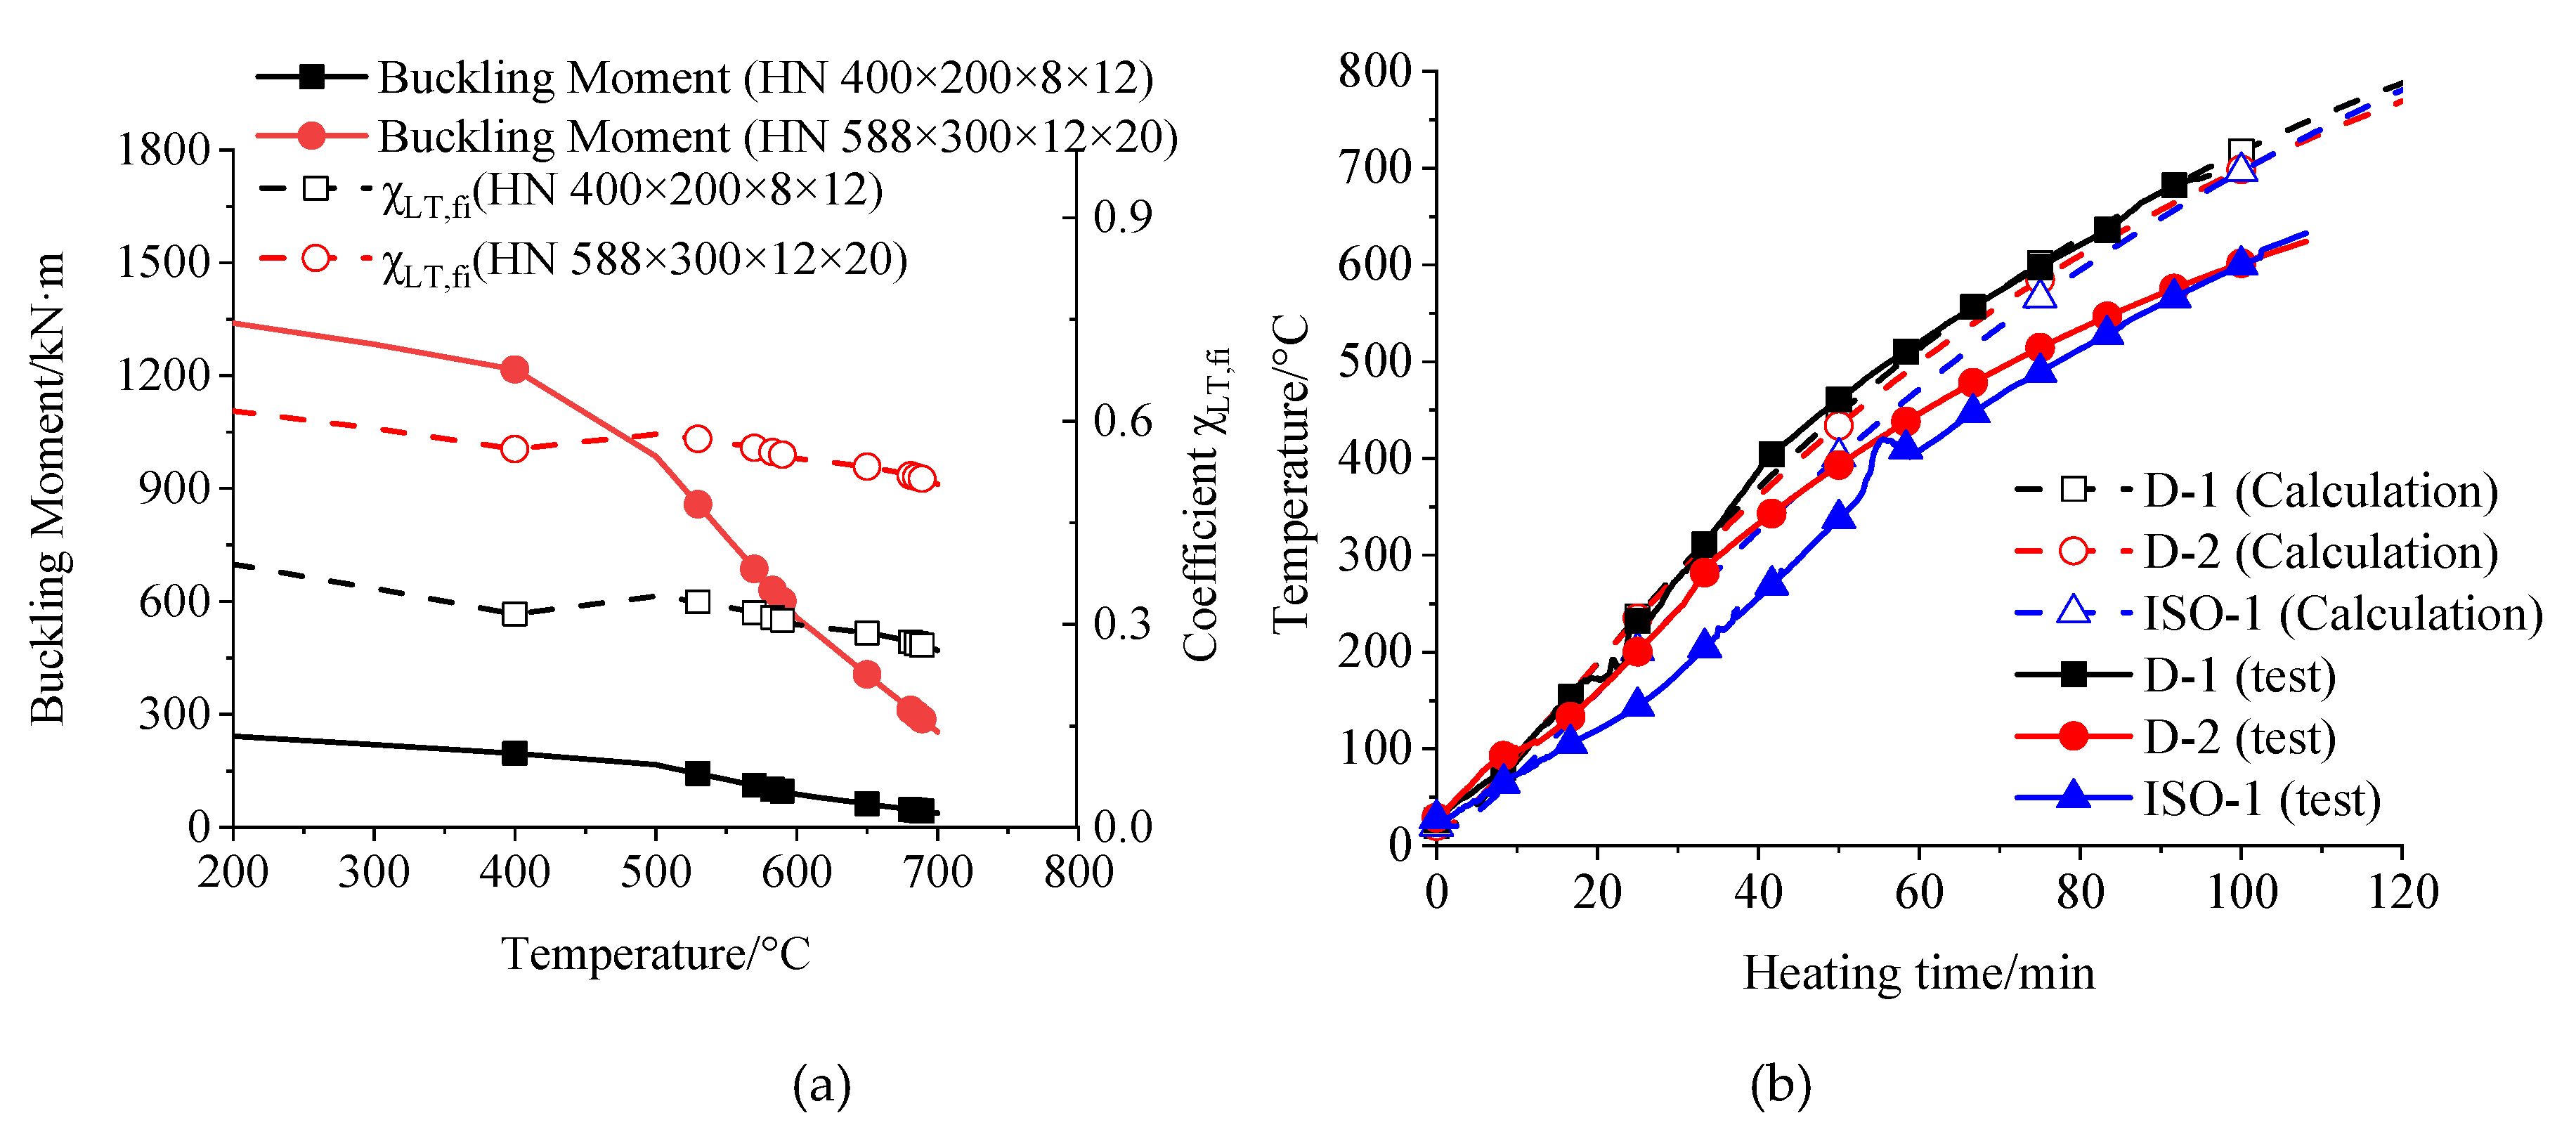
Figure 15.
Assessment of the accuracy of ANSI/AISC 360-22 24: (a) Reduction of the load-bearing capacity; (b) Temperature increase of the insulated beams.
Figure 15.
Assessment of the accuracy of ANSI/AISC 360-22 24: (a) Reduction of the load-bearing capacity; (b) Temperature increase of the insulated beams.
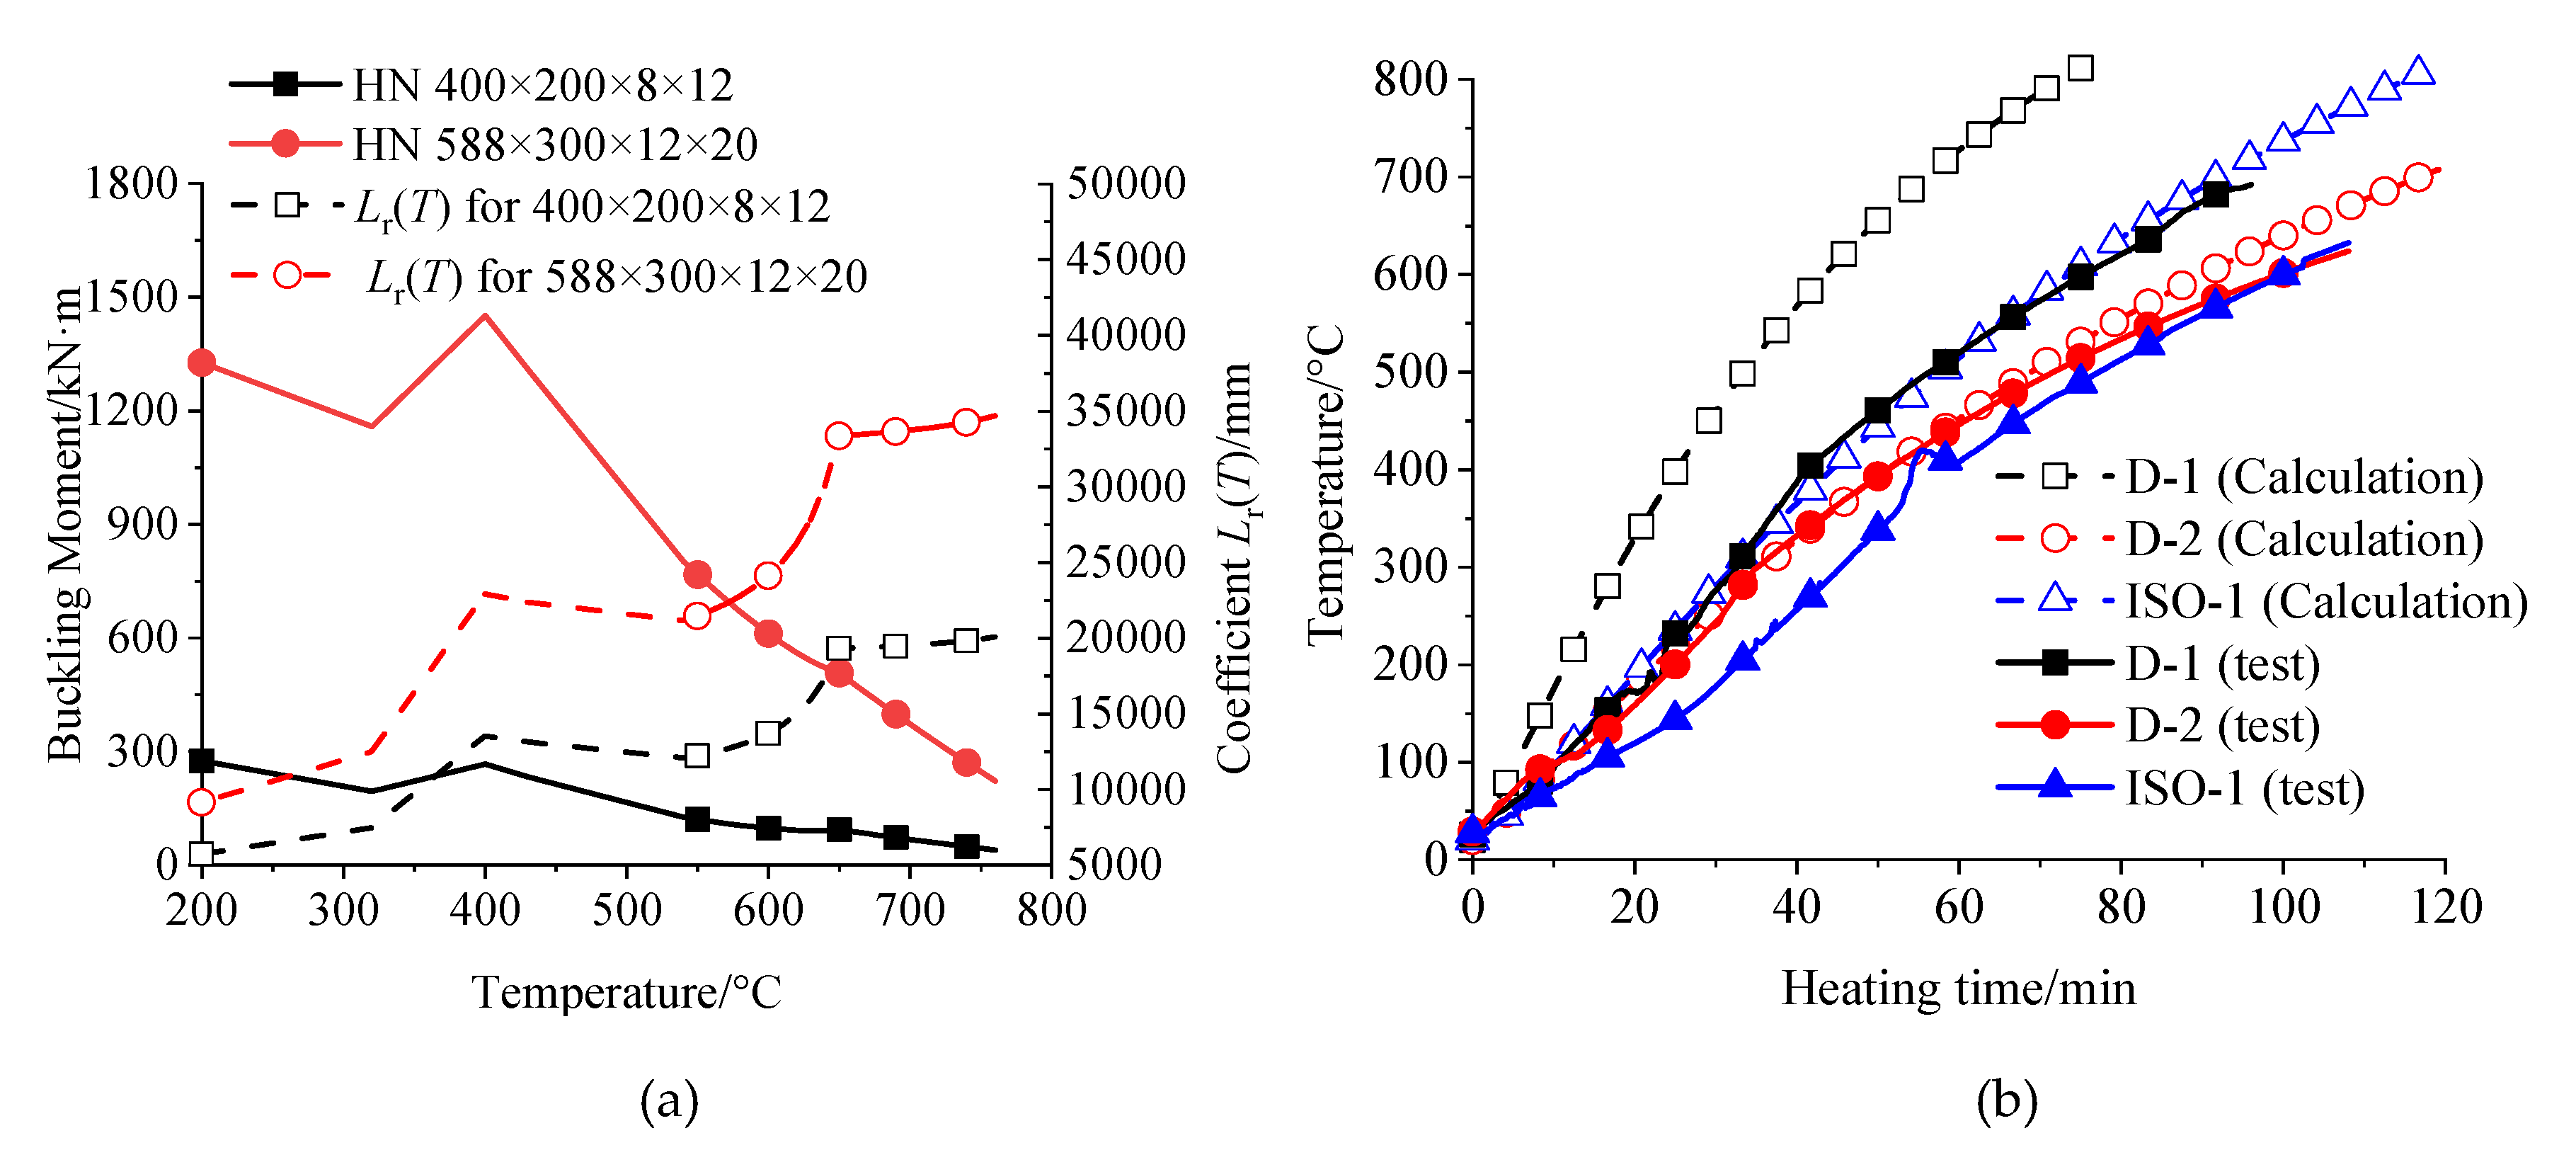

Table 1.
Material properties.
| Labels | Yield strength /MPa |
Average Yield strength/MPa | Ultimate strength /MPa |
Average ultimate strength /MPa |
|---|---|---|---|---|
| C-8-1 | 401.6 | 401.7 | 549.4 | 549.6 |
| C-8-2 | 402.5 | 549.6 | ||
| C-8-3 | 401.0 | 549.7 | ||
| C-12-1 | 403.0 | 406.0 | 542.6 | 539.6 |
| C-12-2 | 410.3 | 538.2 | ||
| C-12-3 | 404.8 | 538.1 | ||
| C-20-1 | 405.9 | 404.5 | 564.6 | 563.8 |
| C-20-2 | 398.2 | 563.9 | ||
| C-20-3 | 409.3 | 562.8 |
Table 2.
Specimen labels.
| Labels | Dimensions /mm |
Heating curves |
Fire Protections |
Thickness /mm |
Applied load /kN |
Tcr /˚C |
tcr /min |
|---|---|---|---|---|---|---|---|
| D-1 | HN 400×200×8×12 | EFC | FRC | 20 | 36 | 676 | 120 |
| D-2 | HN 588×300×12×20 | EFC | FRC | 15 | 120 | 661 | 120 |
| D-3 | HN 588×300×12×20 | EFC | FCB | 20 | 120 | 661 | 120 |
| D-4 | HN 588×300×12×20 | EFC | IC | 1.5 | 120 | 661 | 60 |
| ISO-1 | HN 588×300×12×20 | ISO-834 | FRC | 12 | 120 | 661 | 120 |
| ISO-2 | HN 588×300×12×20 | ISO-834 | IC | 2.5 | 120 | 661 | 120 |
Note: EHC means “Electrical heating curve”, FRC means “Fire-retardant coating”, FCB means “Fiber cement board”, and IC means “Intumescent coating”.
Table 3.
Critical temperature and fire resistance of the specimens.
| Lables |
Tcr,d (˚C) |
T2-1 (˚C) |
T2-2 (˚C) |
T2-3 (˚C) |
T2-4 (˚C) |
Tcr,t (˚C) |
tcr,d (min) |
tcr,t (min) |
(Tcr,d-Tcr,t)/ Tcr,t | (tcr,d-tcr,t)/ tcr,t |
|---|---|---|---|---|---|---|---|---|---|---|
| D-1 | 676 | 556 | 776 | 660 | 665 | 648 | 120 | 85 | 4.3% | 41% |
| D-2 | 661 | 570 | 692 | 636 | 621 | 610 | 120 | 103 | 8.3% | 17% |
| D-3 | 661 | 385 | 575 | 425 | 586 | 487 | 120 | 53 | 35.7% | 126% |
| D-4 | 661 | 542 | 824 | 693 | 715 | 663 | 60 | 49 | -0.3% | 22% |
| ISO-1 | 661 | 524 | 704 | 636 | 657 | 610 | 120 | 101 | 8.4% | 19% |
| ISO-2 | 661 | 468 | 782 | 642 | 689 | 612 | 120 | 113 | 8.0% | 6% |
Table 4.
Assessment of the accuracy of BS EN 1993-1-2 23.
| Lables | Tcr,t (˚C) | Tcr,EC3 (˚C) | tcr,t (˚C) | tcr,EC3 (˚C) | (Tcr,EC3-Tcr,t)/ Tcr,t | (tcr,EC3-tcr,t)/ tcr,t |
|---|---|---|---|---|---|---|
| D-1 | 648 | 615 | 85 | 81 | -5% | -5% |
| D-2 | 610 | 697 | 103 | 101 | 14% | -2% |
| D-3 | 487 | - | 53 | - | ||
| D-4 | 663 | 697 | - | - | 5% | |
| ISO-1 | 610 | 697 | 101 | 100 | 14% | -1% |
| ISO-2 | 612 | 697 | - | - | 14% |
Note: D-3 was not used to assess the calculation methods since its premature failure.
Table 5.
Assessment of the accuracy of ANSI/AISC 360-22 [24].
Table 5.
Assessment of the accuracy of ANSI/AISC 360-22 [24].
| Lables | Tcr,t (˚C) | T2-4 (˚C) | Tcr,ANSI (˚C) | (Tcr, ANSI -T2-4)/ T2-4 | (Tcr, ANSI -Tcr,t)/ Tcr,t |
|---|---|---|---|---|---|
| D-1 | 648 | 665 | 675 | 1.5% | 4% |
| D-2 | 610 | 621 | 743 | 19.6% | 22% |
| D-3 | 487 | 586 | - | ||
| D-4 | 663 | 715 | 743 | 3.9% | 12% |
| ISO-1 | 610 | 657 | 743 | 13.1% | 22% |
| ISO-2 | 612 | 689 | 743 | 7.8% | 21% |
Note: D-3 was not used to assess the calculation methods since its premature failure.
Disclaimer/Publisher’s Note: The statements, opinions and data contained in all publications are solely those of the individual author(s) and contributor(s) and not of MDPI and/or the editor(s). MDPI and/or the editor(s) disclaim responsibility for any injury to people or property resulting from any ideas, methods, instructions or products referred to in the content. |
© 2025 by the authors. Licensee MDPI, Basel, Switzerland. This article is an open access article distributed under the terms and conditions of the Creative Commons Attribution (CC BY) license (http://creativecommons.org/licenses/by/4.0/).
Copyright: This open access article is published under a Creative Commons CC BY 4.0 license, which permit the free download, distribution, and reuse, provided that the author and preprint are cited in any reuse.


