
Submitted:
17 May 2025
Posted:
20 May 2025
You are already at the latest version
Abstract
Precision detection of orchard tree canopies and non-target areas is critical for minimizing chemical overuse and enhancing the sustainability of smart agricultural systems. Pesticide application methods often result in excessive agrochemical application and environmental degradation. To address these challenges, this study proposes a real-time intelligent orchard spraying system based on an improved YOLOv9-SEDA deep learning architecture, optimized for deployment on edge devices. The model integrates depthwise separable convolutions to reduce computational overhead, Efficient Channel Attention (ECA) for enhanced feature representation, and a Lookahead optimizer combined with AdamW to improve training stability and convergence. Additionally, the Swish activation function is employed to enhance learning efficiency and nonlinearity. The system integrates real-time visual perception with intelligent control logic to dynamically adjust spray patterns based on canopy presence, reducing unnecessary application in sparse or non-target areas. Field experiments conducted with a structured-light depth camera and a Jetson Xavier NX-based autonomous spraying robot demonstrate the system’s real-time performance and operational viability. YOLOv9-SEDA achieves a precision of 89.5%, recall of 91.1%, mAP@0.5 of 94.2%, and mAP@0.5:0.95 of 84.6%, outperforming state-of-the-art detectors including YOLOv9, YOLOv5, YOLOv7, ATSS, and RetinaNet. Controlled trials reveal a 20.75% reduction in pesticide consumption and a 97.91% decrease in spray wastage. These findings underscore the potential of deep learning-enabled, resource-efficient vision systems for real-time control in industrial informatics and precision agriculture.
Keywords:
Autonomous spraying robots
; Deep Convolutional Neural Networks
; Edge AI for Smart Agriculture
; precision agriculture
; real-time detection
1. Introduction
Precision pesticide application in orchard environments is increasingly critical for reducing chemical overuse, environmental contamination, and exposure to non-target species [1]. Conventional spraying methods often result in excessive pesticide use, leading to ecological degradation and the development of pesticide resistance. To address these limitations, intelligent agricultural systems that leverage robotics, sensor fusion, and machine learning have emerged as viable alternatives. Autonomous spraying robots equipped with real-time perception modules enable selective application by identifying tree structures and environmental conditions. These systems integrate multimodal sensing, including visual, infrared, and LiDAR data, to support adaptive spraying control [2,3]. The use of embedded AI algorithms further improves decision-making accuracy, allowing precise targeting and significant reductions in pesticide usage. A Fin Ray-inspired soft gripper with integrated force feedback and ultrasonic slip detection was developed for apple harvesting, achieving a 0% fruit damage rate when force feedback was enabled, compared to 20% without it, and demonstrating effective non-destructive picking in orchard trials [37]. Beyond manipulation systems, these developments represent a practical advancement in smart agricultural technology within the context of industrial informatics. Recent work [4] emphasizes the role of computer vision in automating agricultural practices such as fruit picking, disease monitoring, and spraying, which align closely with the goals of this study.
Recent advances in deep learning have significantly improved pest detection and precision pesticide application in agriculture [5,6,7,8]. Lightweight segmentation models and optimized YOLO architectures have enabled real-time inference with reduced computational complexity, facilitating deployment on edge devices in resource-constrained environments [9,10]. To improve small-target detection, techniques such as hybrid SGD-GA optimization and enhanced feature extraction layers have been incorporated into models like YOLOX and YOLOv7, achieving high accuracy in field conditions [11,12,13]. An improved YOLOv4-based detection method was proposed for recognizing apples in complex orchard environments, significantly enhancing detection accuracy and reducing model size for efficient deployment in real-world scenarios [27]. A high-efficiency target detection algorithm, Seedling-YOLO, was developed based on YOLOv7-Tiny to assess broccoli seedling transplanting quality, achieving a mean Average Precision (mAP@0.5) of 94.3% and a detection speed of 29.7 frames per second in field conditions [9]. Using a ZED 2 stereo camera and YOLO V4-Tiny, a potted flower detection and localization system was implemented, yielding a mean average precision of 89.72%, a recall rate of 80%, and an average detection speed of 16 FPS, with a mean absolute localization error of 18.1 mm [16]. Similarly, an apple detection framework integrating ShufflenetV2 and YOLOX-Tiny, enhanced with attention and adaptive feature fusion modules, achieved 96.76% average precision and operated at 65 FPS in complex orchard environments [36]. An improved YOLOX-based method utilizing RGB-D imaging was developed for real-time apple detection and 3D localization, achieving a mean average precision of 94.09%, F1 score of 93%, and spatial positioning errors under 7 mm in X and Y axes and under 5 mm in Z axis [38]. Advanced frameworks such as CEDAnet and Transformer-based modules have been applied to UAV-based orchard monitoring, achieving precise tree segmentation in dense canopies [14]. Additionally, multi-sensor fusion systems integrating LiDAR, vision, and IMUs have shown promise for dynamic tree localization and pose estimation in semi-structured orchards [15,40]. A deep learning-based variable rate agrochemical spraying system was developed for targeted weed control in strawberry crops, utilizing VGG-16 for real-time classification of spotted spurge and shepherd’s purse, achieving a 93% complete spray rate on target weeds [41]. These developments highlight the importance of real-time, adaptable solutions for intelligent pesticide management in modern orchard environments.
Recent advancements in deep learning have significantly enhanced plant disease and pest detection in precision agriculture. Lightweight models such as ResNet50 and MobileNetv2 have shown efficiency in image classification tasks, while YOLO-based detectors, particularly YOLOv5 and YOLOv8, have achieved high accuracy in real-time object detection [16,17,18]. For tomato crops, an improved Faster R-CNN model incorporating ResNet-50, K-means clustering for anchor box optimization, and Soft-NMS achieved a mean average precision of 90.7% in detecting flowers and fruits in complex environments [39]. Similarly, a CNN enhanced with attention mechanisms yielded 96.81% accuracy in classifying tomato leaf diseases [23,28], while a hybrid model combining Competitive Adaptive Reweighted Sampling (CARS) and CatBoost algorithms estimated tomato transpiration rates with an of 0.92 and RMSE of 0.427 g·· [34]. Furthermore, a comprehensive review on CNN-based vegetable disease detection emphasized the dominance of VGG models and underscored challenges in data limitations and generalization performance [35]. Complementary work reviewed nondestructive quality assessment in tomatoes using mechanical, electromagnetic, and electrochemical sensing integrated with deep learning [43]. In parallel, deep learning-based approaches for apple quality assessment have achieved promising results. A multi-dimensional view processing method leveraging Swin Transformer and an enhanced YOLOv5s framework attained 94.46% grading accuracy and 96.56% defect recognition at 32 FPS [29]. Another YOLOv5-based model incorporating Mish activation, DIoU loss, and Squeeze-and-Excitation modules reached a grading accuracy of 93% with throughput of four apples per second on an automatic grading machine [33]. In addition, a CNN-VGG16-based system classified apple color and deformity with 92.29% accuracy [31], and recent reviews have reported that deep learning combined with spectral imaging can achieve up to 98.7% mean average precision in apple maturity estimation [32]. Across both crop types, architectural innovations such as multi-scale feature fusion, Receptive Field Attention Convolution, and advanced loss functions like WIoUv3 have further enhanced detection robustness in field conditions [18,19]. Techniques including transfer learning and mini-batch k-means++ clustering have also proven effective in reducing training overhead and improving bounding box precision in low-data regimes [20]. Meanwhile, data augmentation and semantic segmentation strategies have contributed to better handling of small, occluded, or overlapping targets in dense crop environments [21,22]. [24] demonstrated early use of YOLO for pest detection in greenhouse settings, underscoring the long-term potential of real-time detection frameworks in integrated pest management. Collectively, these developments form a foundation for the design of scalable, edge-deployable detection systems in smart agricultural applications.
Despite recent advancements, several challenges remain. Whereas precision spraying technologies have shown promise in reducing pesticide usage, most current systems still face significant limitations in real-time deployment, particularly in complex orchard environments. Dense tree canopies, variable lighting, and occlusions present serious obstacles for reliable pest detection and precise spraying. Existing YOLO architectures, including YOLOv9, often face challenges with computational complexity, limiting their applicability on resource-constrained industrial robotics platforms such as autonomous orchard spraying robots. To directly address these challenges, we propose YOLOv9-SEDA, featuring depthwise separable convolutions, Efficient Channel Attention (ECA), Swish activation, and Lookahead-AdamW optimization. This combination explicitly addresses real-time performance and reliability requirements, crucial for industrial robotics applications.
This paper proposes YOLOv9-SEDA (referred to as SEDA), an enhanced object detection framework tailored for real-time pesticide application in orchard environments. A systematic literature review [25] supports the growing use of YOLO-based models in agricultural object detection, particularly in scenarios requiring real-time decision making. The main contributions of this work are as follows:
- Model Architecture Enhancement: SEDA integrates depthwise separable convolutions and Efficient Channel Attention (ECA) to improve feature extraction while significantly reducing computational complexity.
- Improved Training Stability and Non-Linearity Handling: The Lookahead optimizer combined with AdamW is employed to enhance convergence speed and stability, while the Swish activation function mitigates vanishing gradients and improves non-linear representation.
- Edge Device Optimization: The framework is designed for real-time operation on resource-constrained edge devices, enabling practical deployment in field scenarios.
- Robust Detection in Complex Environments: SEDA is particularly effective at detecting small and overlapping targets under variable environmental conditions, addressing challenges common in dense orchards.
- Sustainable Agricultural Impact: By improving detection precision, the system supports targeted pesticide application, leading to significant reductions in chemical usage and environmental impact.
- Comprehensive Validation: Extensive experimental evaluations demonstrate that SEDA outperforms YOLOv9 and other state-of-the-art models in both accuracy and inference speed, validating its effectiveness for intelligent agricultural spraying systems.
2. Methodology
2.1. YOLOv9: Model Architecture and Configuration
The YOLOv9 architecture consists of a backbone network and a detection head. The backbone begins with down-sampling layers, followed by multiple RepNCSPELAN4 blocks, which enhance feature extraction through residual and non-local operations. ADown layers perform average pooling and further down-sampling, reducing spatial resolution while increasing feature depth. This structure enables effective multi-scale representation, progressing from fine to abstract features. The detection head incorporates SPPELAN blocks with spatial pyramid pooling for contextual feature aggregation, followed by upsampling and concatenation for multi-scale fusion [26]. A distinctive feature of YOLOv9 is its reversible auxiliary branch, which uses CBLinear and CBFuse layers to enhance cross-level feature integration. Final object predictions are generated via the DualDDetect module, which processes features across multiple scales for accurate detection of objects of varying sizes.
2.2. YOLOv9-SEDA: Advancements in Object Detection Accuracy and Efficiency
In this study, the SEDA model is proposed as an enhanced variant of YOLOv9, integrating several architectural optimizations to improve detection accuracy and computational efficiency. Specifically, S represents the Swish activation function, which replaces conventional activations to enable smoother gradient flow and improved convergence. E denotes the Efficient Channel Attention (ECA) mechanism, enhancing feature representation by modeling channel-wise dependencies with minimal overhead. D corresponds to depthwise separable convolutions, which significantly reduce parameters and computation while preserving feature extraction capabilities. A indicates the use of the AdamW optimizer wrapped within the Lookahead algorithm, improving optimization stability and convergence speed. As illustrated in Figure 1, these components are systematically integrated into the SEDA architecture, enabling high-precision object detection across varying scales while maintaining real-time inference speed. The resulting framework is well-suited for complex agricultural environments, balancing performance with resource efficiency.
To summarize the architectural innovations in SEDA, Table 1 provides a comparative overview of each enhancement, its function, and its practical benefit for industrial robotics applications. These modifications address specific bottlenecks observed in YOLOv9, improving performance on edge devices in real-time agricultural scenarios.
2.3. Optimizing Computational Efficiency with Depthwise Separable Convolution in YOLOv9-SEDA
Figure 2 illustrates the operational flow of a depthwise separable convolutional block, a core component of the SEDA architecture. The process begins with an input tensor of shape (Batch_size, representing a batch of feature maps. A depthwise convolution (Conv1) is first applied independently to each input channel, significantly reducing computational cost while preserving spatial information. Each filter operates solely on its corresponding input channel , maintaining per-channel feature integrity. The output retains the input dimensions, ensuring consistency across layers.
- : Output feature map at spatial location for channel c.
- : Input feature map at spatial location for channel c.
- : Depthwise filter (kernel) of size applied to channel c.
- k: Size of the kernel.
A pointwise convolution (Conv2) with a kernel is then applied to combine information across channels and adjust the feature map depth, producing an output tensor of shape (Batch_size.
- : Output feature map at spatial location for channel d.
- : Pointwise filter weight connecting input channel c to output d.
- C: Total number of input channels.
To ensure stable and efficient training, the feature maps are normalized using a Batch Normalization (BN) layer, which improves convergence and model stability. A Swish activation function is then applied to introduce non-linearity and enhance the model’s ability to learn complex patterns. The block outputs processed feature maps with shape (Batch_size, which are forwarded for subsequent stages in the architecture.
- : Input feature map.
- : Depthwise convolutional kernel.
- : Pointwise convolutional kernel.
This modular block design greatly enhances computational efficiency and feature extraction capabilities, which makes it highly effective for real-time object detection tasks.
2.4. ECA-Convolution Block: Structure and Operational Flow
Figure 3 illustrates the structure of a convolutional block integrated with the ECA mechanism. The process begins with an input tensor of shape (Batch_size, in_channels, where Batch_size is the number of samples and in_channels denotes the input channels. A convolutional (Conv) layer is first applied to extract spatial and channel-wise features, producing an output tensor of shape (Batch_size, out_channels.
- : Output feature map at spatial location for channel d.
- : Input feature map at spatial location for input channel c.
- : Convolutional kernel for channel c to d of size .
- k: Size of the convolutional kernel.
The convolutional output is then passed through Batch Normalization (BN), which normalizes the activations and stabilizes training by reducing internal covariate shift.
- : Input feature for channel d at spatial location .
- : Mean and variance of features in channel d.
- : Learnable scale and shift parameters.
- : Small constant to prevent division by zero.
Next, a Leaky ReLU activation function is applied to introduce non-linearity into the model, enabling it to learn complex patterns by selectively activating neurons based on the input values.
Here, denotes the negative slope of the Leaky ReLU activation function. The resulting feature maps are then passed through the ECA layer, which re-weights channel-wise responses to emphasize informative features without significant computational overhead. The ECA process begins with a global average pooling operation that compresses each channel’s spatial dimensions into a single scalar value.
- : Channel descriptor for channel d.
- : Activation at spatial location for channel d.
- : Height and width of the feature map.
The channel-wise attention weights are computed by applying a 1D convolution over the descriptors with a kernel size k_size which helps capture spatial dependencies and refine channel attention.
- : Attention weight for channel d.
- : Sigmoid activation function.
- Conv1D: 1D convolution applied to the channel descriptors.
- : Concatenated channel descriptors.
- : Kernel size for the 1D convolution.
- : Reweighted feature map for channel d.
- : Channel-wise attention weight.
- : Original feature map activation at spatial location for channel d.
Finally, the attention weights are applied to reweight the original feature map , producing the refined output for each channel. The resulting tensor retains the shape (Batch_size, out_channels and is optimized for downstream object detection tasks. This block design effectively combines convolution, normalization, activation, and attention mechanisms to emphasize the most relevant features for accurate detection.
2.5. Optimizing Convergence and Stability with AdamW and Lookahead Integration
Figure 4, outlines the process for combining AdamW with Lookahead to improve optimization stability and convergence. The procedure begins by setting the Nominal Batch Size and calculating the Accumulation Factor, which adjusts for batch size variations and helps stabilize gradient updates during training.
The weight decay term is scaled according to the batch size and accumulation factor to ensure consistent regularization across varying batch sizes. The first and second moment estimates for the Adam optimizer are then updated as follows:
The bias-corrected moments are computed as:
The update rule for the parameters is given by:
- : Biased first and second moment estimates.
- : Bias-corrected moments.
- : Gradient of the loss with respect to the parameter.
- : Learning rate.
- : Weight decay coefficient.
- : Fast weights (inner optimizer’s parameters).
The final step integrates the base optimizer (AdamW) with the Lookahead optimizer, configured using key parameters: la_steps, which defines the number of inner updates before Lookahead adjustment, and la_alpha, the blending factor for parameter updates. Figure 5 illustrates the operational flow of the Lookahead optimizer during training. At each step, the inner optimizer updates model parameters, followed by a Lookahead update computed as:
- : Loss function.
The Lookahead optimizer then increments its _la_step counter. If _la_step reaches or exceeds la_steps, a Lookahead Update is triggered, in which the slow weights are updated by interpolating between the fast weights and the slow weights , as shown in Figure 5. The slow weights are updated as follows:
- : Lookahead interpolation factor.
The updated parameters are cached to support rollback or future evaluation. If _la_step is less than la_steps, the inner optimizer continues without triggering a Lookahead update. This mechanism balances the flexibility of short-term exploration with the stability of long-term refinement, leading to improved convergence, generalization, and optimization efficiency.
2.6. Activation Enhancement Using Swish in YOLOv9-SEDA
Figure 6 illustrates the operational flow of the Swish activation function used in the SEDA framework. During network initialization, Swish is defined as part of the model. In the forward pass, it is applied to input activations to enable smoother gradients and improve convergence. The Swish function is defined as:
where is the sigmoid activation function, which scales the input into a bounded range between 0 and 1, defined as:
This involves applying the Sigmoid Activation to compute , followed by multiplying the input x with the sigmoid output. The resulting operation creates a smooth, non-monotonic activation curve, allwoing for both which is beneficial for both positive and negative gradients, which is beneficial for capturing complex patterns at each element in the input tensor x:
where represents the activation value at spatial location for channel c. Additionally, during backpropagation, the gradient of the Swish activation function is computed for efficient optimization. The gradient is given by:
where is the Swish activation output as defined in Equation (18), and is the Sigmoid activation as defined in Equation (19). Finally, the processed output, now transformed through the Swish activation logic, is returned. This activation function improves gradient flow during backpropagation, helping to mitigate the vanishing gradient problem and leading to better convergence and accuracy in SEDA.
3. Experimental Setup
3.1. Dataset Collection and Preprocessing
The dataset used to train and evaluate SEDA comprises 1,265 high-resolution images of agricultural fields with densely arranged trees and vegetation. Images were collected at the Zhenjiang Organic Matter Cooperative Processing Center and annotated using LabelImg. The dataset includes five class labels: Tree, Base, Sky, Ground, and All, with the Tree label serving as the primary target for precise pesticide application.
Dataset preprocessing involved several augmentation techniques to enhance generalization. Each training image was used to generate three variants through random rotations between and , brightness adjustments of , and noise affecting up to 6% of pixels. Additionally, 15% of images were converted to grayscale to simulate low-light conditions. These augmentations increased dataset diversity and improved the model’s robustness to real-world variability in agricultural settings, as summarized in Table 2.
Figure 7 presents a random subset of annotated images, highlighting the environmental complexity (occlusions, variable lighting, dense foliage) and class distributions.
3.2. Hardware (Robot and Spraying System)
The spraying robot illustrated in Figure 8 is designed for precise, automated pesticide application. It features a fan structure for uniform spray dispersion and a nozzle for targeted delivery. A camera mounted on the frame provides real-time visual input for tree detection, activating the sprayer only when a target is present to minimize chemical waste. A water tank supplies the liquid, while an onboard computer processes visual data and controls system functions. The system is powered by a battery, enabling autonomous field operation without frequent recharging or refills.
To evaluate SEDA’s real-world deployment feasibility, experiments were conducted using the NVIDIA Jetson Xavier NX—an edge platform equipped with a 384-core Volta GPU, a 6-core ARM Carmel CPU, and 48 tensor cores. This setup offers real-time processing capability within a compact, energy-efficient footprint, validating the model’s suitability for embedded AI in real-time industrial agriculture robotics. The integration of vision, control, and power components enables accurate and efficient spraying under resource-constrained conditions.
The experiments specifically evaluate the suitability of YOLOv9-SEDA for industrial real-time precision spraying tasks. A Jetson Xavier NX platform is selected due to its widespread industrial deployment, low-power consumption, and realistic processing constraints faced by commercial agricultural robotics. This setup reflects a practical scenario in embedded AI deployment for field-ready agricultural robots.
3.3. Camera
The camera shown in Figure 9 is a structured light depth sensor, commonly used in robotic perception tasks. It captures 3D information by projecting an infrared pattern onto the scene and analyzing its deformation using onboard sensors and lenses. This mechanism enables accurate depth estimation, essential for detecting trees, obstacles, and other features in autonomous agricultural systems. Its compact form factor supports seamless integration into robotic platforms for real-time spatial awareness and navigation.
3.4. Model Training and Performance Evaluation
The SEDA model was trained on high-performance hardware, as summarized in Table 3, including an Intel(R) Xeon(R) Gold 6226R @ 2.90 GHz CPU, NVIDIA RTX 3090 GPU, and Ubuntu 20.04.5 LTS. The implementation was developed using PyTorch 1.12 and Python 3.8. Training was conducted over 400 epochs with a learning rate of 0.001 and a batch size of 16. The dataset was partitioned into 70% for training, 20% for validation, and 10% for testing.
Model performance was evaluated using standard metrics: Precision, Recall, F1-score, and mean Average Precision (mAP). Precision, defined as the ratio of true positives to predicted positives, is calculated as:
where represents True Positives and represents False Positives. Recall, which measures the proportion of correctly identified positive samples out of all actual positives, is given as:
where represents False Negatives. The F1-score, a harmonic mean of precision and recall, is computed as:
To evaluate the overall detection performance, mAP was used, which is the average precision across all classes. It is calculated as:
where N is the number of classes and is the average precision for class i. During inference, the model was tested on the reserved test set to measure its real-world applicability, ensuring low latency and high accuracy in detecting targets such as tree labels. Table 3 below summarizes the detailed training environment setup:
4. Results and Discussion
4.1. Evaluation of Individual Modification Enhancements
Table 4 presents a comparative analysis of various object detection architectures and enhancements, including Depthwise Separable, Efficient Channel Attention, AdamW (Lookahead), Swish Activation, and the proposed SEDA model. Performance is evaluated using Precision (P), Recall (R), mAP@0.5, mAP@0.5:0.95, F1-score, and inference time.
SEDA achieves the highest P (89.5%), R (91.1%), mAP@0.5 (94.2%), mAP@0.5:0.95 (84.6%), and F1-score (90.3%), demonstrating superior accuracy and robustness. Although its inference time (15.3 ms) is slightly higher, it remains suitable for real-time applications.
Depthwise Separable offers faster inference (11.8 ms) with moderate accuracy. Efficient Channel Attention improves feature representation but incurs a higher computational cost (22.1 ms) and reduced mAP. AdamW (Lookahead) and Swish Activation enhance optimization and non-linearity handling, yielding balanced performance but falling short of SEDA in aggregate metrics.
Overall, SEDA outperforms all evaluated models, offering state-of-the-art accuracy while maintaining practical inference efficiency for high-precision detection tasks.
4.2. Comparison with Baseline Models
To evaluate SEDA’s performance, we conducted a comparative analysis against baseline models, including YOLOv9, YOLOv5, YOLOv7, and other state-of-the-art detectors such as ATSS, RetinaNet, and RCNN. As shown in Table 5, SEDA consistently outperforms all compared models across key metrics, including Precision, Recall, mAP, F1-score, and model efficiency.
SEDA achieved the highest precision (89.5%) and recall (91.1%), outperforming YOLOv9 (84.4%, 86.6%) and YOLOv5 (83.9%, 88.8%). Its mAP reached 94.2% at IoU@0.5 and 84.6% at IoU@0.5:0.95, notably higher than YOLOv9 (91.1%, 76.1%) and YOLOv5 (91.9%, 71.5%). SEDA also achieved the highest F1-score (90.3%), indicating well-balanced precision and recall.
In terms of model size, SEDA has 39.6M parameters and an 80.7MB weight file, which is more compact than YOLOv9 (50.7M, 102.7MB). Although its inference time (15.3 ms) is slower than YOLOv5 (11.3 ms) and YOLOv9 (9.4 ms), the trade-off is justified by superior accuracy and robustness.
These results confirm SEDA’s effectiveness in real-time object detection, demonstrating improved accuracy, reduced model complexity, and strong generalization performance across diverse detection tasks.
4.3. Performance Analysis of SEDA: Precision-Recall Curve and Detection Accuracy
To evaluate the performance of YOLOv9 and its improved variant SEDA, we conducted a comparative analysis focusing on precision, recall, and mAP. Figure 10 and Figure 11 illustrate training trends and model performance.
Both models exhibit steady convergence over 400 epochs, with SEDA showing consistently lower training losses, including box, classification, and DFL loss. The reduced box loss indicates improved bounding box regression, while lower classification and DFL losses reflect enhanced object recognition and distribution learning, respectively. These results highlight the effectiveness of SEDA’s architectural modifications in reducing training errors.
In terms of detection capability, SEDA achieves higher precision and recall throughout training, reflecting improved performance in minimizing both false positives and false negatives. Additionally, SEDA outperforms YOLOv9 in mAP@0.5 and mAP@0.5:0.95, demonstrating superior localization accuracy across IoU thresholds. The performance gap is particularly evident at the stricter mAP@0.5:0.95 level, indicating SEDA’s robustness in high-accuracy detection scenarios.
Figure 11, depicts the Precision-Recall (PR) curve for SEDA, providing a visual evaluation of its detection performance across different confidence thresholds. The curves represent the precision-recall tradeoff for individual classes such as "tree," "base," "ground," and "sky," as well as the overall mAP@0.5 for all classes. SEDA achieves consistently high precision and recall values across all classes, with particularly strong performance for "sky" (0.981) and "ground" (0.980). The overall mAP@0.5 of 0.942 highlights the model’s robustness and reliability in detecting objects in diverse and complex scenarios.
The "tree" class achieves a slightly lower precision-recall performance (0.937) compared to other classes, which might be attributed to the higher variability in object appearance and occlusion within the dataset. However, the PR curve for the "tree" class still demonstrates high precision at varying recall levels, indicating the model’s ability to maintain accurate detections even as it identifies more objects. This analysis underscores the effectiveness of SEDA in maintaining high performance across multiple object categories.
4.4. Object Detection Image Analysis: Evaluation of YOLOv9 and SEDA Results
Figure 12, compares object detection results from the dataset images, YOLOv9, and the improved SEDA algorithm. The top row presents raw dataset images, showcasing potted trees in a natural environment. The middle row shows detection results using YOLOv9, with bounding boxes for detected objects such as "tree," "base," and "ground," along with their associated confidence scores. However, YOLOv9 exhibits certain limitations. As can be seen, in the first and second images of the second row, red dotted triangles indicate areas where YOLOv9 places bounding boxes inconsistently, highlighting inaccurate detections.
The third row depicts the results of the proposed SEDA algorithm, showing significant improvements in detection accuracy and consistency. SEDA demonstrates enhanced precision, with well-defined and correctly localized bounding boxes around the objects. Confidence scores for the detected objects are generally higher than in YOLOv9, especially for the base and ground objects. The third-row images further demonstrate how SEDA addresses YOLOv9’s shortcomings, providing more robust and reliable detection outcomes.
This comparison underscores SEDA’s effectiveness in enhancing detection performance in complex environments by improving detection precision and confidence. The visual distinction between the model outputs highlights the advancements made through structural enhancements.
4.5. Industrial Deployment and Real-World Testing
In this study, we present a comparison between the SEDA method, and the Uncontrolled method. The key advantage of the SEDA method is its ability to spray only where trees are detected, ensuring that the spray is applied efficiently, targeting areas where it is most needed. As a result, it does not excessively spray non-tree areas, reducing waste. Additionally, SEDA adjusts the spray volume based on tree density, spraying more in areas with higher tree concentration and less in areas with fewer trees. This targeted spraying not only increases the overall efficiency of the spraying process but also ensures that resources are utilized more effectively. In contrast, the Uncontrolled method, while providing more uniform coverage, sprays indiscriminately across all regions, leading to excessive spray in non-tree areas and potentially wasting resources.
Table 6 presents a detailed comparison of regional spray coverage between the proposed SEDA framework and the uncontrolled spraying method. The table reports spray coverage percentages across six predefined spatial zones (top-left, top-right, middle-left, middle-right, bottom-left, and bottom-right), representing different regions of the canopy or field. As shown, the SEDA method consistently achieves lower coverage in most regions compared to the uncontrolled approach. Notably, SEDA reduces coverage in the bottom-right region from 47.84% to 29.50%, indicating more precise targeting and minimal overspray in peripheral areas. Similar reductions are observed in the top-left (27.73% vs. 39.74%) and middle-left (19.75% vs. 34.98%) regions, further demonstrating SEDA’s ability to focus spraying only on relevant areas. Although the bottom-left and middle-right zones show comparable coverage, the overall average spray coverage is reduced from 38.42% in the uncontrolled method to 30.47% with SEDA. This 20.74% reduction in average coverage highlights the effectiveness of the proposed system in minimizing chemical usage, thereby enhancing operational efficiency and environmental sustainability in precision agriculture.
This shows that the SEDA method has reduced spray coverage by approximately 20.75% compared to the Uncontrolled method. This reduction in spray coverage highlights the efficiency of the SEDA method in minimizing waste, ensuring that only the necessary areas are sprayed. This experiment demonstrates how SEDA’s intelligent spraying not only optimizes coverage but also leads to a significant reduction in resource consumption, achieving a more sustainable and cost-effective spraying solution.
Table 7 presents a quantitative comparison of spray wastage in selected non-target spots using the proposed SEDA framework and the uncontrolled spraying method. The evaluated spots represent areas where pesticide application is not required—such as open ground, sky, or tree-free regions—thus, lower spray coverage indicates more effective waste reduction.
As shown, the uncontrolled method exhibits substantial spray deposition in these non-target zones, with coverage values of 29.92%, 35.74%, and 40.74% across Spot-1 to Spot-3, yielding an average wastage of 35.47%. In contrast, SEDA demonstrates significantly lower spray coverage of only 0.81%, 0.51%, and 0.89%, respectively, resulting in an average wastage of just 0.74%.
This represents a reduction in non-target spray deposition of over 97.9%, confirming SEDA’s effectiveness in minimizing chemical waste. The results validate that SEDA achieves high-precision spraying by activating the nozzle only when target trees are detected, thereby improving environmental safety and resource efficiency in orchard management.
In addition to detection accuracy and spray precision, practical deployment requires high inference speed, compact model size, and robustness in unstructured environments. Table 8 presents a comparative evaluation of YOLOv9-SEDA against baseline models, including YOLOv5, YOLOv7, YOLOv9, ATSS, RetinaNet, and Double Head, when deployed on the Jetson Xavier NX platform. The comparison highlights differences in real-time inference speed, model size, accuracy, and robustness, providing insights into their practical suitability for deployment in orchard environments.
As illustrated in Table 8, YOLOv9-SEDA significantly outperforms state-of-the-art industrial baselines in detection accuracy while maintaining competitive inference speed. Despite having a slightly lower FPS than YOLOv5 and YOLOv9, it offers enhanced robustness and a compact model size, making it well-suited for real-world deployment in agricultural environments. These findings confirm the potential of YOLOv9-SEDA as a practical and scalable solution for intelligent spraying systems, delivering high precision and reliability while satisfying the real-time constraints of embedded platforms.
5. Conclusion
This study proposed YOLOv9-SEDA, an enhanced and computationally efficient object detection framework tailored for real-time, targeted pesticide spraying in orchard environments. The model integrates depthwise separable convolutions to reduce computational complexity, ECA to improve feature representation, the Swish activation function to facilitate smoother gradient propagation, and a Lookahead-AdamW optimization strategy to accelerate and stabilize convergence. Comprehensive experiments conducted on high-resolution orchard datasets demonstrated the superior performance of YOLOv9-SEDA compared to existing state-of-the-art models, achieving a precision of 89.5%, recall of 91.1%, mAP@0.5 of 94.2%, and mAP@0.5:0.95 of 84.6%, with an inference latency of 15.3 ms, thereby validating its suitability for edge deployment.
The practical utility of the proposed method was further validated through deployment on an autonomous robotic platform operating in real-world orchard conditions. The system achieved a 20.75% reduction in overall spray coverage and a 97.91% reduction in non-target area spraying, underscoring its potential to enhance operational efficiency, minimize agrochemical usage, and promote sustainable agricultural practices.
From an industrial informatics perspective, the lightweight nature and high inference speed of YOLOv9-SEDA make it well-suited for integration into broader Industry 4.0 and Industrial Internet of Things (IIoT) frameworks. Its capabilities extend beyond agriculture, offering applicability in various domains such as automated quality inspection, logistics, and industrial surveillance.
Future research will focus on expanding the model’s generalization capability across diverse agricultural environments, incorporating multi-modal sensory inputs, and extending the framework to include semantic segmentation and disease classification modules. Furthermore, integration with automated aerial platforms such as unmanned aerial vehicles (UAVs) and industrial mobile robots will be explored to facilitate scalable deployment across large-scale agricultural and industrial sites. These efforts aim to advance the development of robust, autonomous vision systems for intelligent environmental interaction in next-generation automation ecosystems.
Author Contributions
Conceptualization, Y.S., Z.K.; methodology, Z.K.; software, Z.Y. and Z.K.; validation, Y.S., Z.K., H.L.; formal analysis, Y.S., Z.K., and H.L.; investigation, Z.Y. and Z.K.; resources, Z.K. and H.L.; data curation, Z.K.; writing—original draft preparation, Z.K.; writing—review and editing, Z.K., and H.L.; visualization, Z.K.; supervision, Y.S.; project administration, Y.S., Z.K., and H.L.; funding acquisition, H.L. All authors have read and agreed to the published version of the manuscript.
Funding
This research was funded by National Natural Science Foundation of China, grant number 32171908.
Institutional Review Board Statement
Not applicable.
Informed Consent Statement
Not applicable.
Data Availability Statement
The data presented in this study is available upon request from the corresponding author. The data is not publicly available due to privacy reasons.
Conflicts of Interest
The authors declare no conflicts of interest.
References
- Aktar, M. W. , Sengupta, D., & Chowdhury, A. Impact of pesticides use in agriculture: Their benefits and hazards. Interdisciplinary Toxicology, 2009, 2, 1–12. [Google Scholar] [PubMed]
- Wang, J. , Zhang, X., & Li, Y. A vision-based tree detection approach for orchard autonomous spraying. Computers and Electronics in Agriculture 2022, 194, 106714. [Google Scholar]
- Liu, H. , Zeng, X., Shen, Y., Xu, J., & Khan, Z. A single-stage navigation path extraction network for agricultural robots in orchards. Computers and Electronics in Agriculture 2024, 229, 109687. [Google Scholar]
- Gao, X. The application of computer vision technology in the field of agricultural automation. International Journal of Advance in Applied Science Research 2025, 4, 1–5. [Google Scholar]
- Wang, Y. , Zhang, Z., & Liu, T. Multimodal sensor fusion for adaptive orchard spraying. Sensors 2022, 22, 3014. [Google Scholar]
- Albanese, D. Bevilacqua, M., D’Antonio, D., Rossi, M., & Ricciardi, C. Deep learning and agrifood robotics: A review. Computers and Electronics in Agriculture 2021, 191, 106553. [Google Scholar]
- Anagnostis, A. , Papakostas, G. A., Ntalianis, K., & Kaburlasos, V. G. An Edge-AI IoT framework for pest detection in agriculture. Sensors 2021, 21, 3024. [Google Scholar]
- Jia, L. , Sun, F., & Gao, Y. YOLOv7-based lightweight pest detection framework for precision agriculture. Applied Sciences 2023, 13, 2112. [Google Scholar]
- Zhang, Z. , Wang, L., & Wu, Y. YOLOv8-based object segmentation model for canopy detection in orchards. Computers and Electronics in Agriculture, 2024, 233, 109987. [Google Scholar]
- Khan, Z. Liu, H., Shen, Y., & Zeng, X. Deep learning improved YOLOv8 algorithm: Real-time precise instance segmentation of crown region orchard canopies in natural environment. Computers and Electronics in Agriculture 2024, 224, 109168. [Google Scholar]
- Ye, W. , Lin, H., & Chen, L. Hybrid optimization of pest detection using SGD and genetic algorithms. IEEE Access 2023, 11, 86530–86542. [Google Scholar]
- Zhang, W. , Liu, Y., Chen, Q., Ma, X., & Zhou, L. Improved YOLOX model for cotton pest detection. Sensors 2022, 22(11), 4312. [Google Scholar]
- Khan, Z. Liu, H., Shen, Y., Yang, Z., Zhang, L., & Yang, F. (2025). Optimizing precision agriculture: A real-time detection approach for grape vineyard unhealthy leaves using deep learning improved YOLOv7 with feature extraction capabilities. Computers and Electronics in Agriculture 2025, 231, 109969. [Google Scholar]
- Zhu, R. , Tang, X., & Yang, H. CEDAnet: Context-aware tree detection for UAV-based orchard monitoring. Remote Sensing 2024, 16, 245. [Google Scholar]
- Tang, X. , Liu, Z., & Gao, H. A multi-sensor fruit tree mapping framework for semi-structured orchards. Precision Agriculture 2024, 25, 103–120. [Google Scholar]
- Balafas, A. , Papoutsoglou, E., Pappas, C., & Drakopoulos, V. Evaluation of deep learning models for plant disease detection in agriculture. Sensors 2023, 23, 332. [Google Scholar]
- Vilar Andreu, A. , Martínez-Pérez, R., Bravo, I., & Pomares, H. YOLOv8-based universal pest detector with high mAP. Computers in Biology and Medicine, 2024, 170, 107575. [Google Scholar]
- Zhao, J. Li, T., & Huang, Q. YOLOv8-RFA: Improved real-time detection using receptive field attention and DyHead. IEEE Access 2024, 12, 23412–23423. [Google Scholar]
- Feng, L. , Chen, M., & Xu, Y. YOLO-HGC-SCS: Hybrid feature fusion network for small pest detection. IEEE Sensors Journal 2024, 24, 121–132. [Google Scholar]
- Ren, Y. , Wang, H., Zhang, Y., Li, J., & Chen, X. Transfer learning-based pest detection with mini-batch k-means clustering. Computers and Electronics in Agriculture, 2020, 178, 105738. [Google Scholar]
- Zou, W. , Luo, Y., & Jiang, H. Field-based image segmentation and augmentation for crop-weed-soil classification. Biosystems Engineering, 2024, 228, 34–44. [Google Scholar]
- Yang, L. , Sun, X., & Chen, J. Lightweight YOLOv8 model for efficient wheat head detection. Agronomy 2024, 14, 76. [Google Scholar]
- Shen, Y. , Yang, Z., Khan, Z., Liu, H., Chen, W., & Duan, S. Optimization of improved YOLOv8 for precision tomato leaf disease detection in sustainable agriculture. Sensors 2025, 25, 1398. [Google Scholar] [PubMed]
- Lippi, M., Bonucci, N., Carpio, R. F., Contarini, M., Speranza, S., & Gasparri, A. (2021). A YOLO-based pest detection system for precision agriculture. In Proceedings of the 29th Mediterranean Conference on Control and Automation (MED) (pp. 342–347). IEEE.
- Badgujar, C. M. Poulose, A., & Gan, H. (2024). Agricultural object detection with You Only Look Once (YOLO) algorithm: A bibliometric and systematic literature review. Computers and Electronics in Agriculture 2024, 223, 109090. [Google Scholar]
- Wang, C. Y. , Yeh, I. H., & Liao, H. Y. M. (2025). Yolov9: Learning what you want to learn using programmable gradient information. In European Conference on Computer Vision (pp. 1–21). Springer, Cham.
- Ji, W. , Gao, X., Xu, B., Pan, Y., Zhang, Z., & Zhao, D. Apple target recognition method in complex environment based on improved YOLOv4. Journal of Food Process Engineering 2021, 44, e13866. [Google Scholar]
- Zhao, S. , Peng, Y., Liu, J., & Wu, S. Tomato leaf disease diagnosis based on improved convolution neural network by attention module. Agriculture 2021, 11, 651. [Google Scholar]
- Ji, W. , Wang, J., Xu, B., & Zhang, T. Apple grading based on multi-dimensional view processing and deep learning. Foods, 2023, 12, 2117. [Google Scholar]
- Zhang, T. , Zhou, J., Liu, W., Yue, R., Yao, M., Shi, J., & Hu, J. Seedling-YOLO: High-efficiency target detection algorithm for field broccoli seedling transplanting quality based on YOLOv7-Tiny. Agronomy, 2024, 14, 931. [Google Scholar]
- Qiu, D. , Guo, T., Yu, S., Liu, W., Li, L., Sun, Z., & Hu, D. Classification of apple color and deformity using machine vision combined with CNN. Agriculture 2024, 14, 978. [Google Scholar]
- Ma, J. , Li, M., Fan, W., & Liu, J. State-of-the-art techniques for fruit maturity detection. Agronomy 2024, 14, 2783. [Google Scholar]
- Xu, B. , Cui, X., Ji, W., Yuan, H., & Wang, J. Apple grading method design and implementation for automatic grader based on improved YOLOv5. Agriculture 2023, 13, 124. [Google Scholar]
- Tong, Z. , Zhang, S., Yu, J., Zhang, X., Wang, B., & Zheng, W. A hybrid prediction model for CatBoost tomato transpiration rate based on feature extraction. Agronomy 2023, 13, 2371. [Google Scholar]
- Rehman, M. U. Liu, J., Nijabat, A., Faheem, M., Wang, W., & Zhao, S. Leveraging convolutional neural networks for disease detection in vegetables: A comprehensive review. Agronomy 2024, 14, 2231. [Google Scholar]
- Ji, W. , Pan, Y., Xu, B., & Wang, J. A real-time apple targets detection method for picking robot based on ShufflenetV2-YOLOX. Agriculture, 2022, 12, 856. [Google Scholar]
- Chen, K. , Li, T., Yan, T., Xie, F., Feng, Q., Zhu, Q., & Zhao, C. A soft gripper design for apple harvesting with force feedback and fruit slip detection. Agriculture 2022, 12, 1802. [Google Scholar]
- Hu, T. , Wang, W., Gu, J., Xia, Z., Zhang, J., & Wang, B. Research on apple object detection and localization method based on improved YOLOX and RGB-D images. Agronomy, 2023, 13, 1816. [Google Scholar]
- Sun, J. , He, X., Ge, X., Wu, X., Shen, J., & Song, Y. Detection of key organs in tomato based on deep migration learning in a complex background. Agriculture 2018, 8, 196. [Google Scholar]
- Liu, H. , Zeng, X., Shen, Y., Xu, J., & Khan, Z. A single-stage navigation path extraction network for agricultural robots in orchards. Computers and Electronics in Agriculture 2025, 229, 109687. [Google Scholar]
- Liu, J. , Abbas, I., & Noor, R. S. Development of deep learning-based variable rate agrochemical spraying system for targeted weeds control in strawberry crop. Agronomy, 2021, 11, 1480. [Google Scholar]
- Wang, J. , Gao, Z., Zhang, Y., Zhou, J., Wu, J., & Li, P. Real-time detection and location of potted flowers based on a ZED camera and a YOLO V4-tiny deep learning algorithm. Horticulturae 2021, 8, 21. [Google Scholar]
- Huang, Y. , Li, Z., Bian, Z., Jin, H., Zheng, G., Hu, D., & Fang, H. Overview of deep learning and nondestructive detection technology for quality assessment of tomatoes. Foods 2025, 14, 286. [Google Scholar]
Figure 1.
YOLOv9-SEDA: A novel architecture for precision object detection.
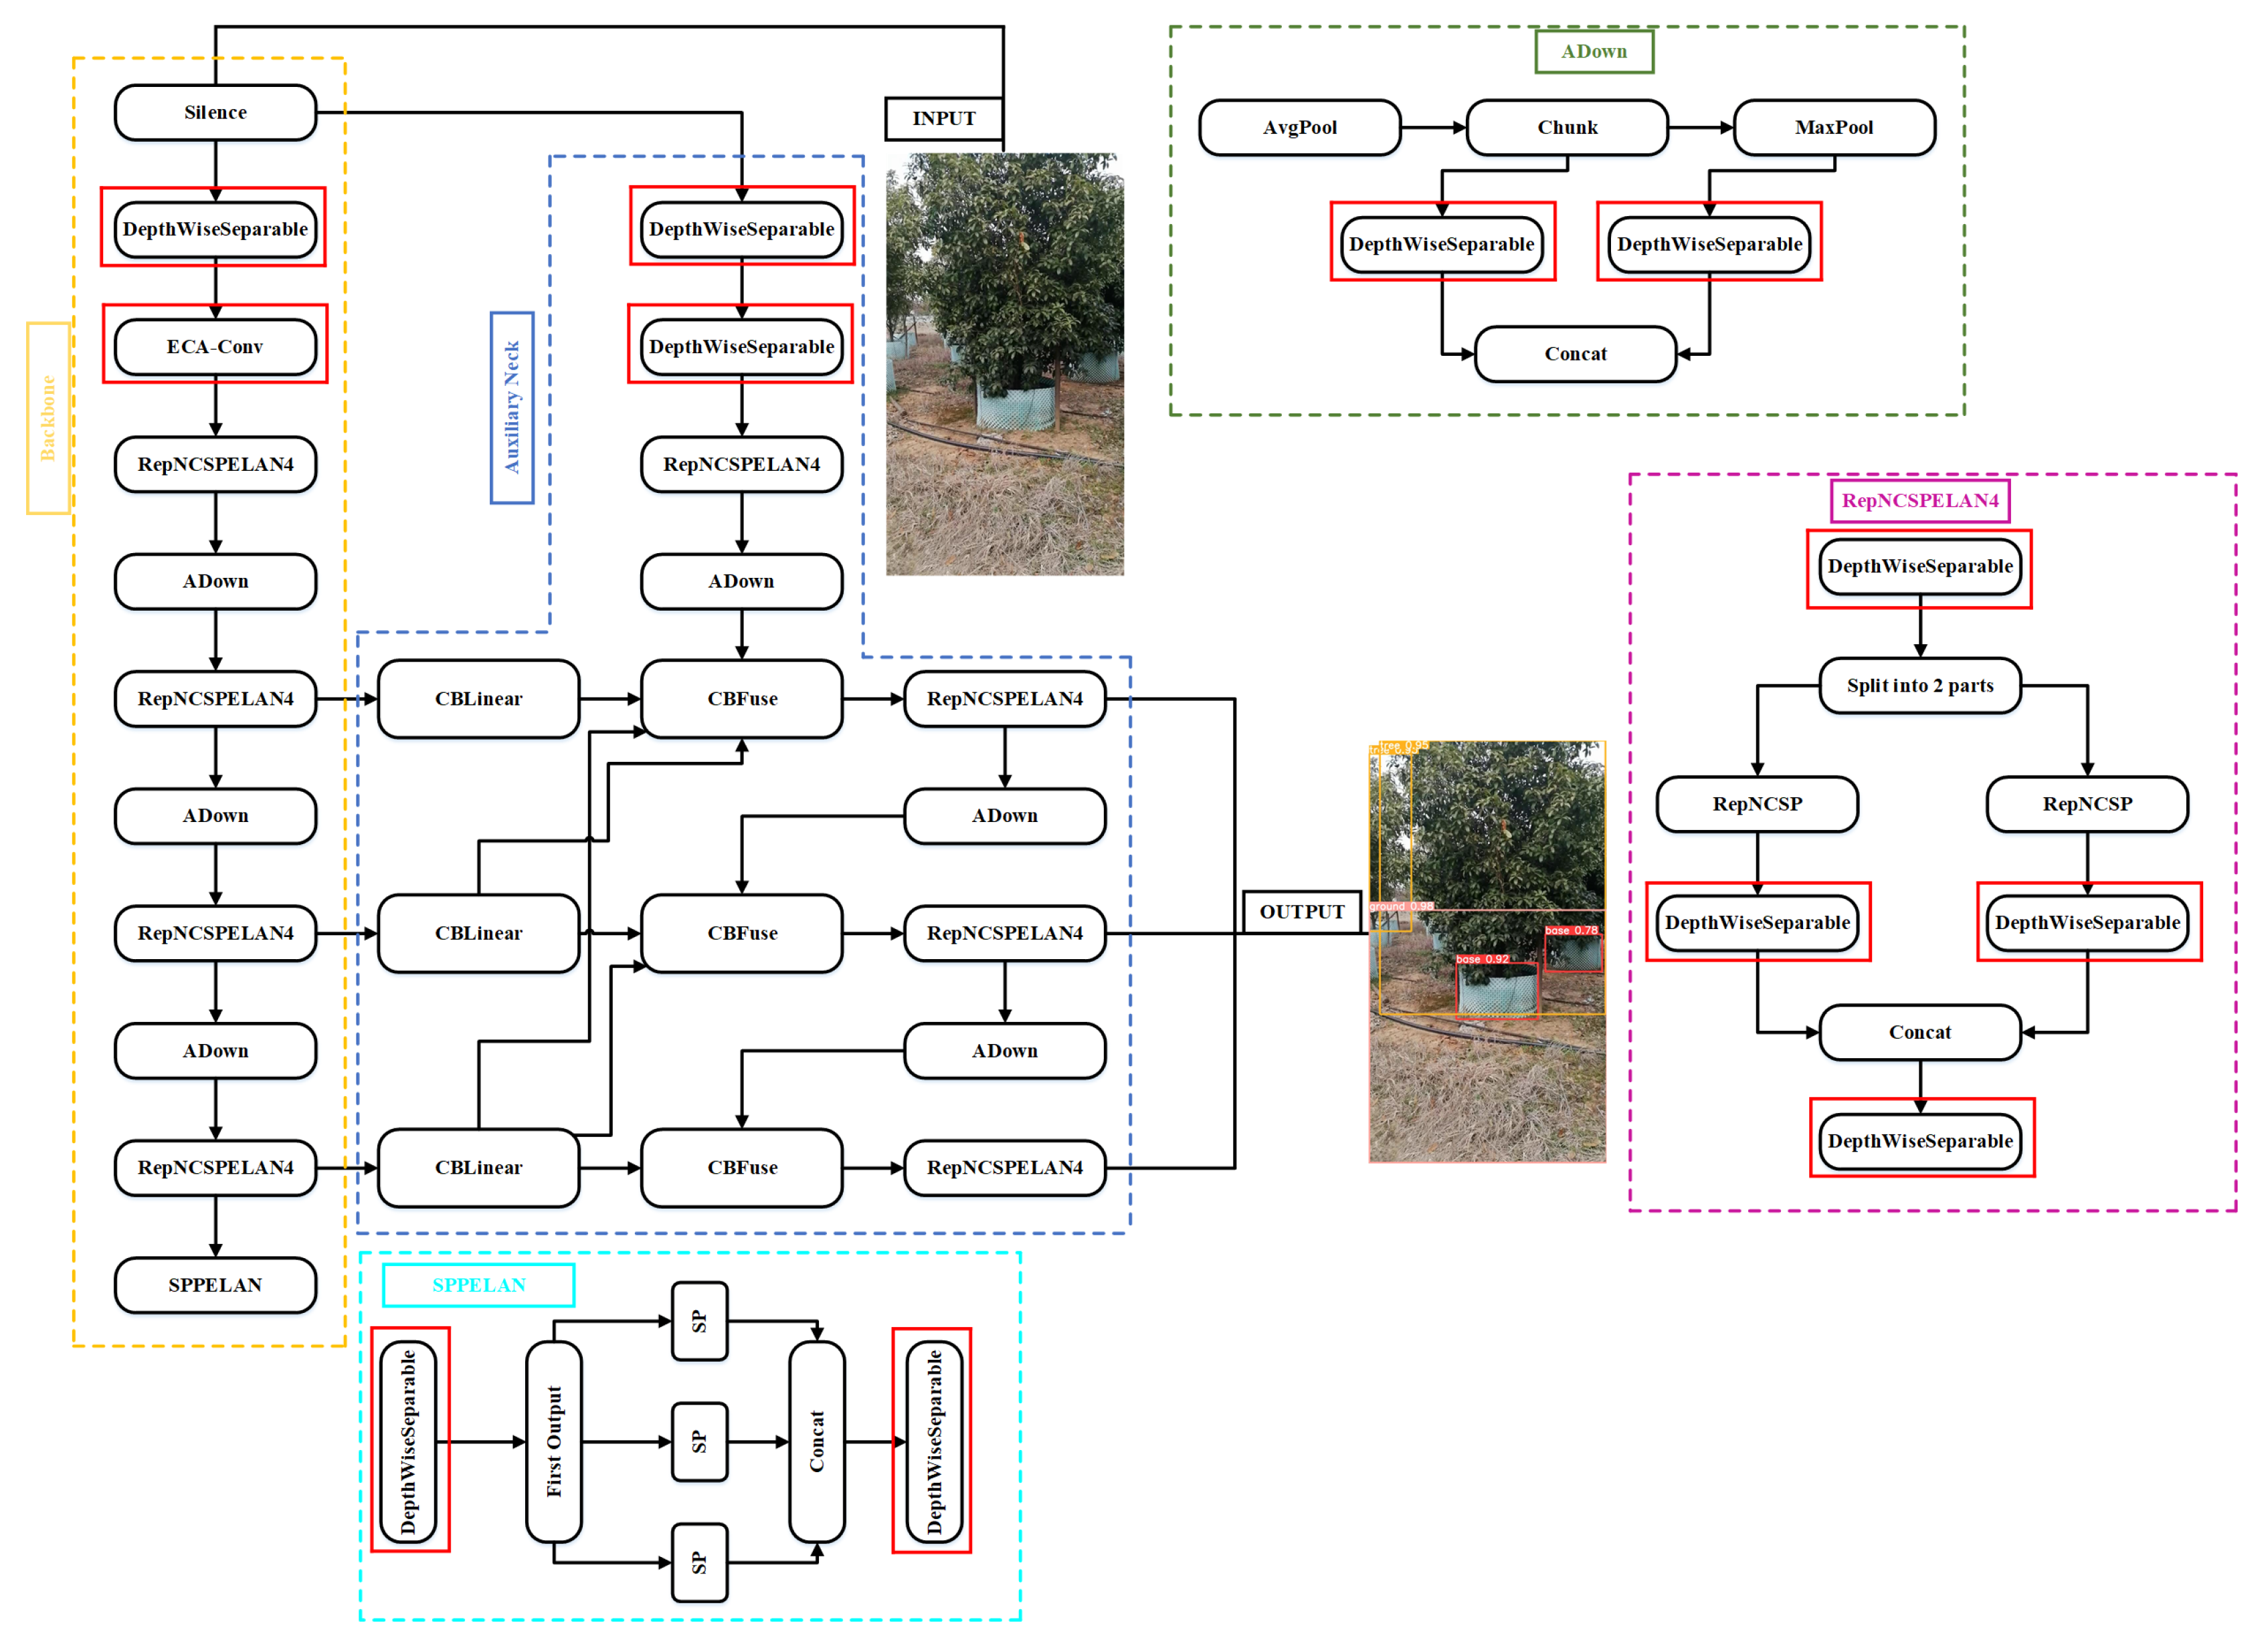
Figure 2.
Depthwise separable convolution module with batch normalization and activation for enhanced feature extraction.
Figure 2.
Depthwise separable convolution module with batch normalization and activation for enhanced feature extraction.
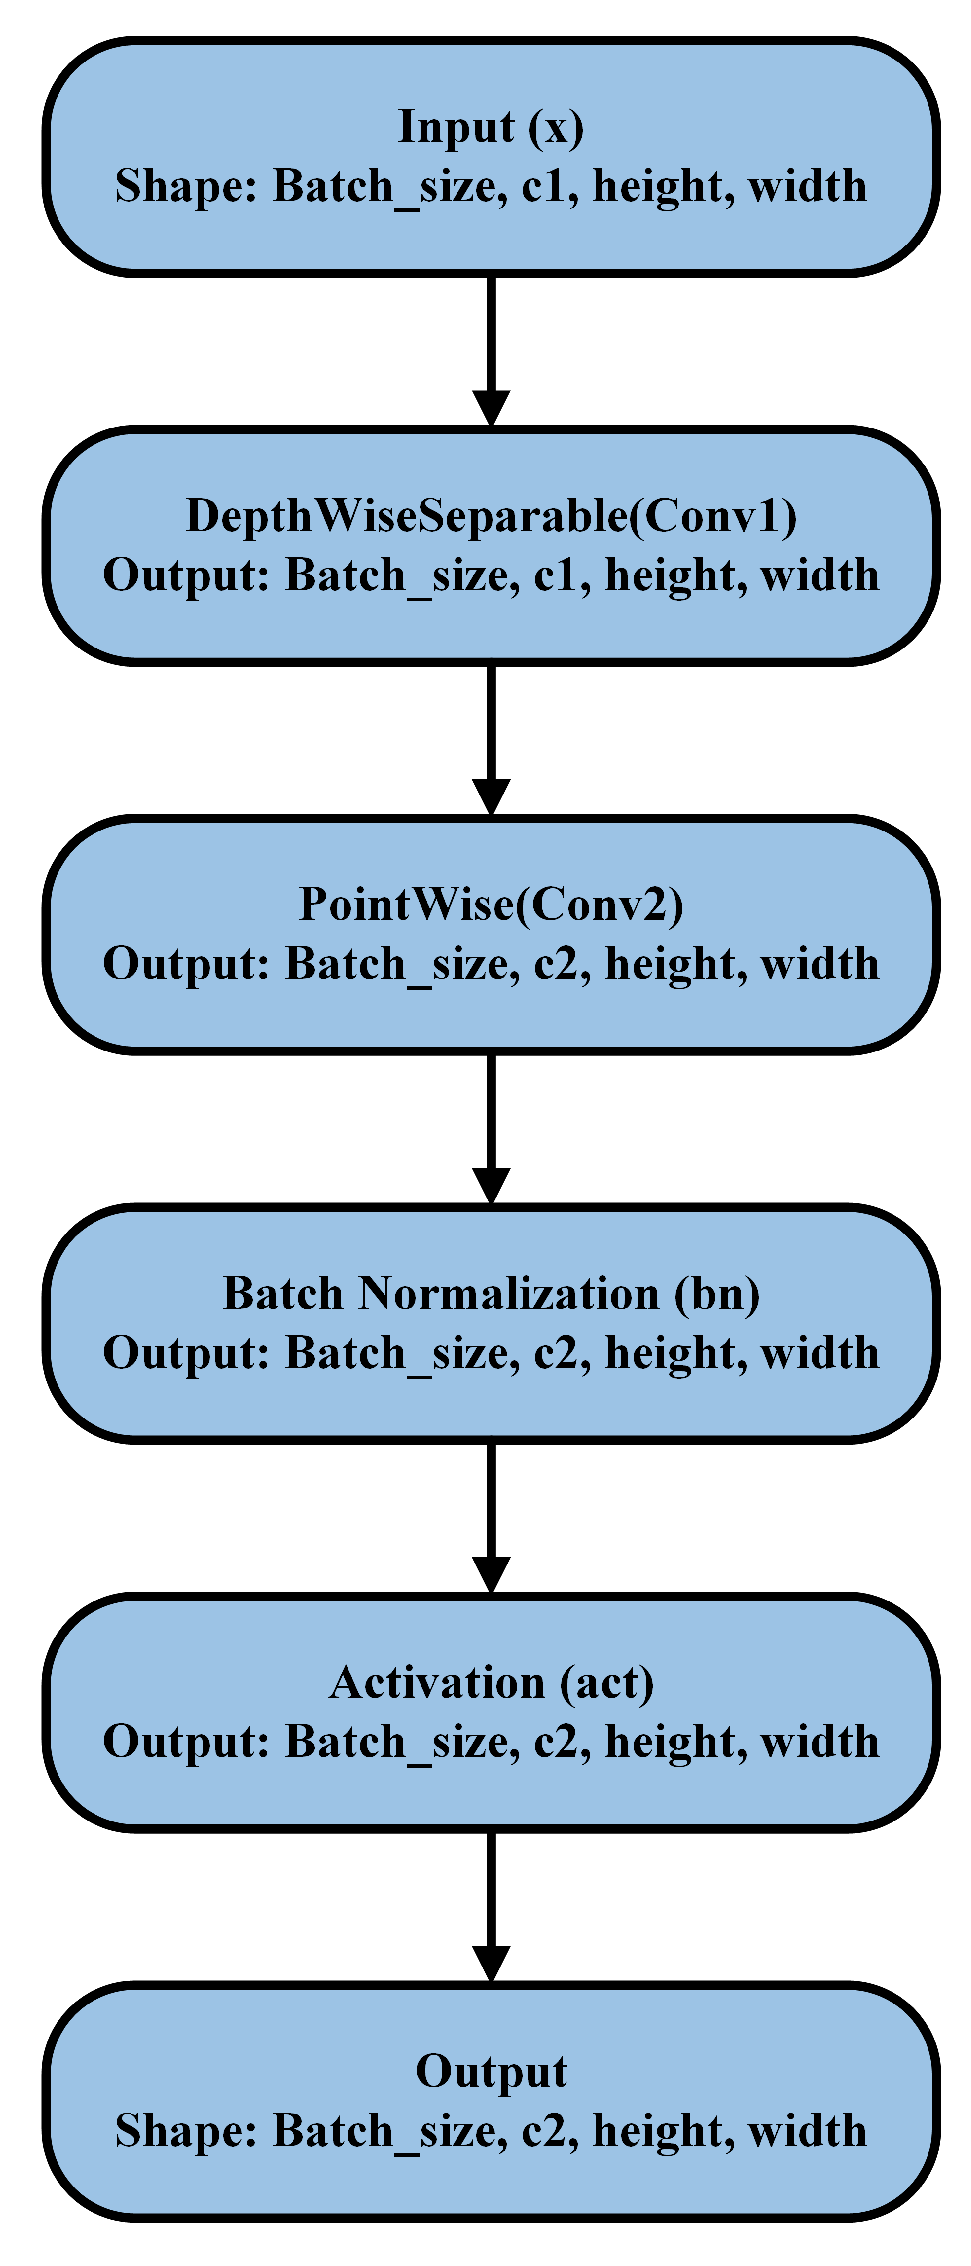
Figure 3.
Convolutional block with ECA attention for enhanced feature representation.
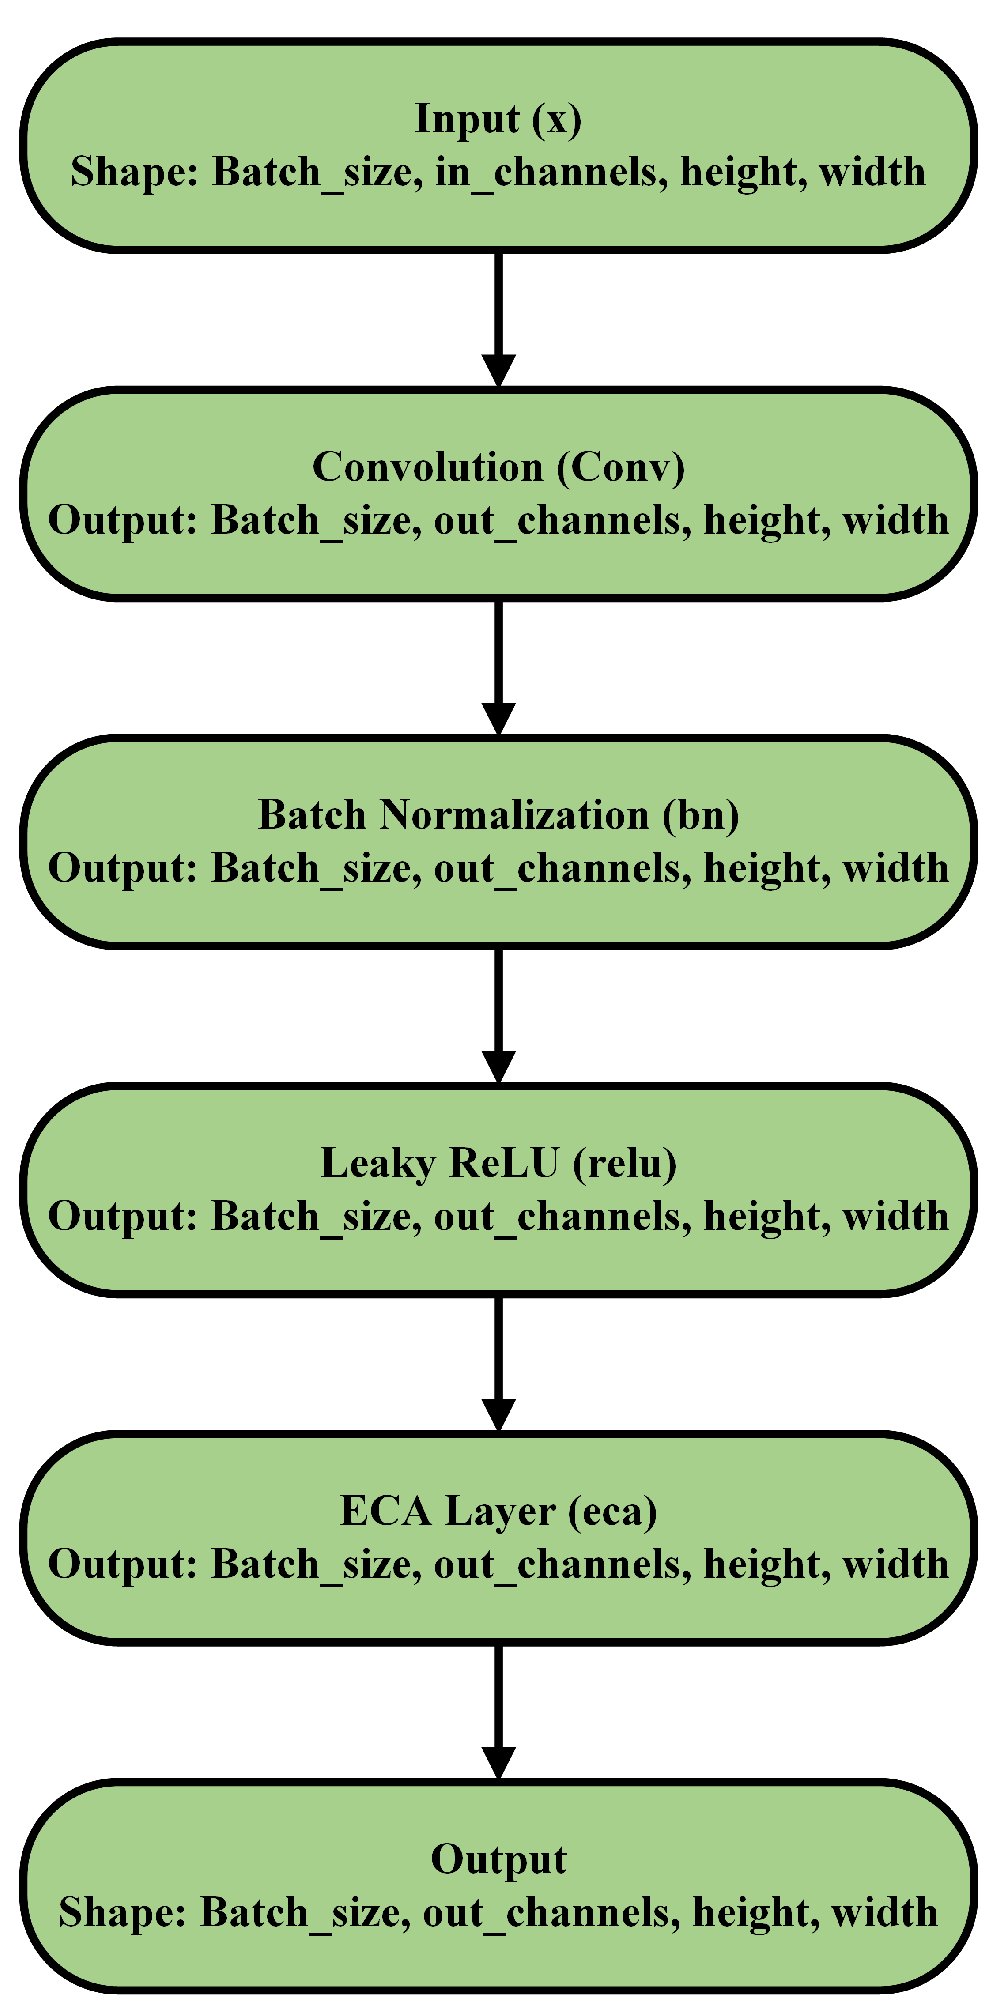
Figure 4.
Lookahead-enhanced AdamW optimization flow for improved model training stability.
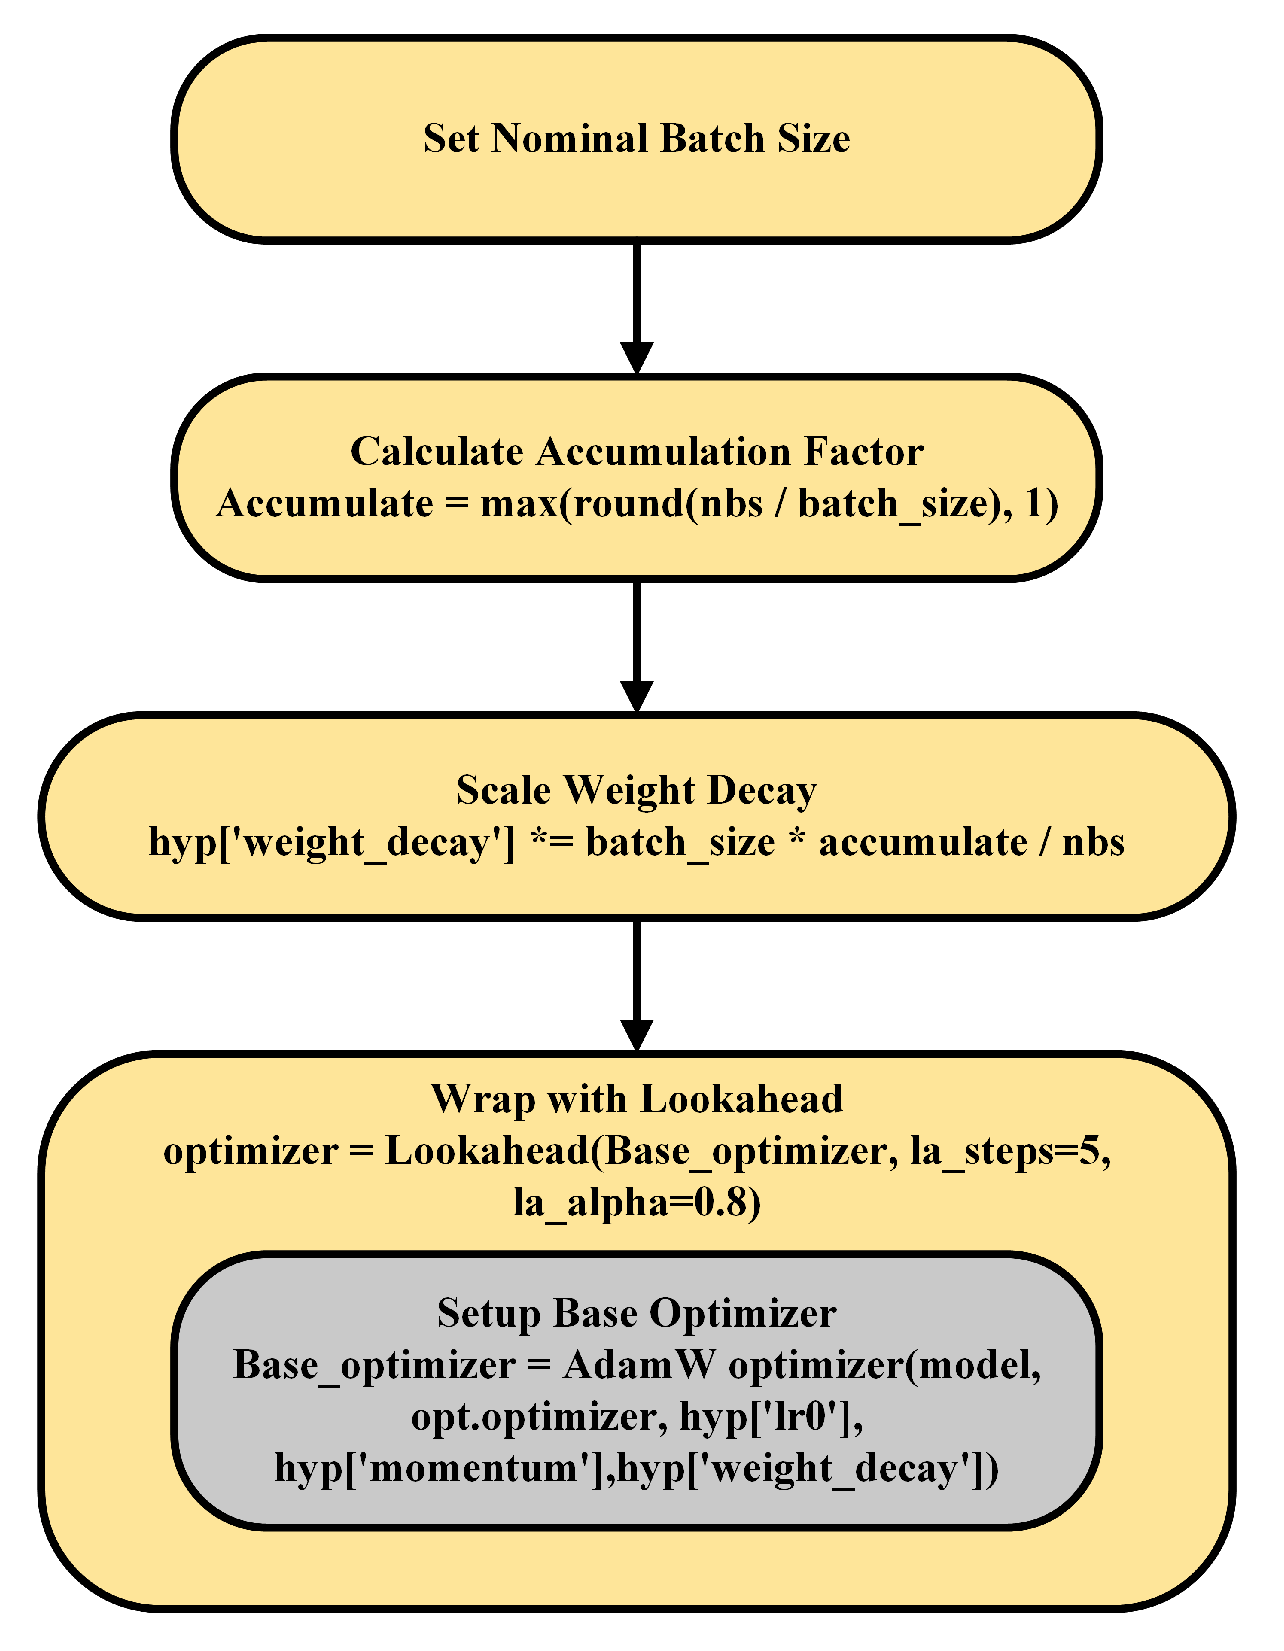
Figure 5.
Lookahead optimizer flowchart: progressive parameter update mechanism for enhanced gradient descent stability.
Figure 5.
Lookahead optimizer flowchart: progressive parameter update mechanism for enhanced gradient descent stability.
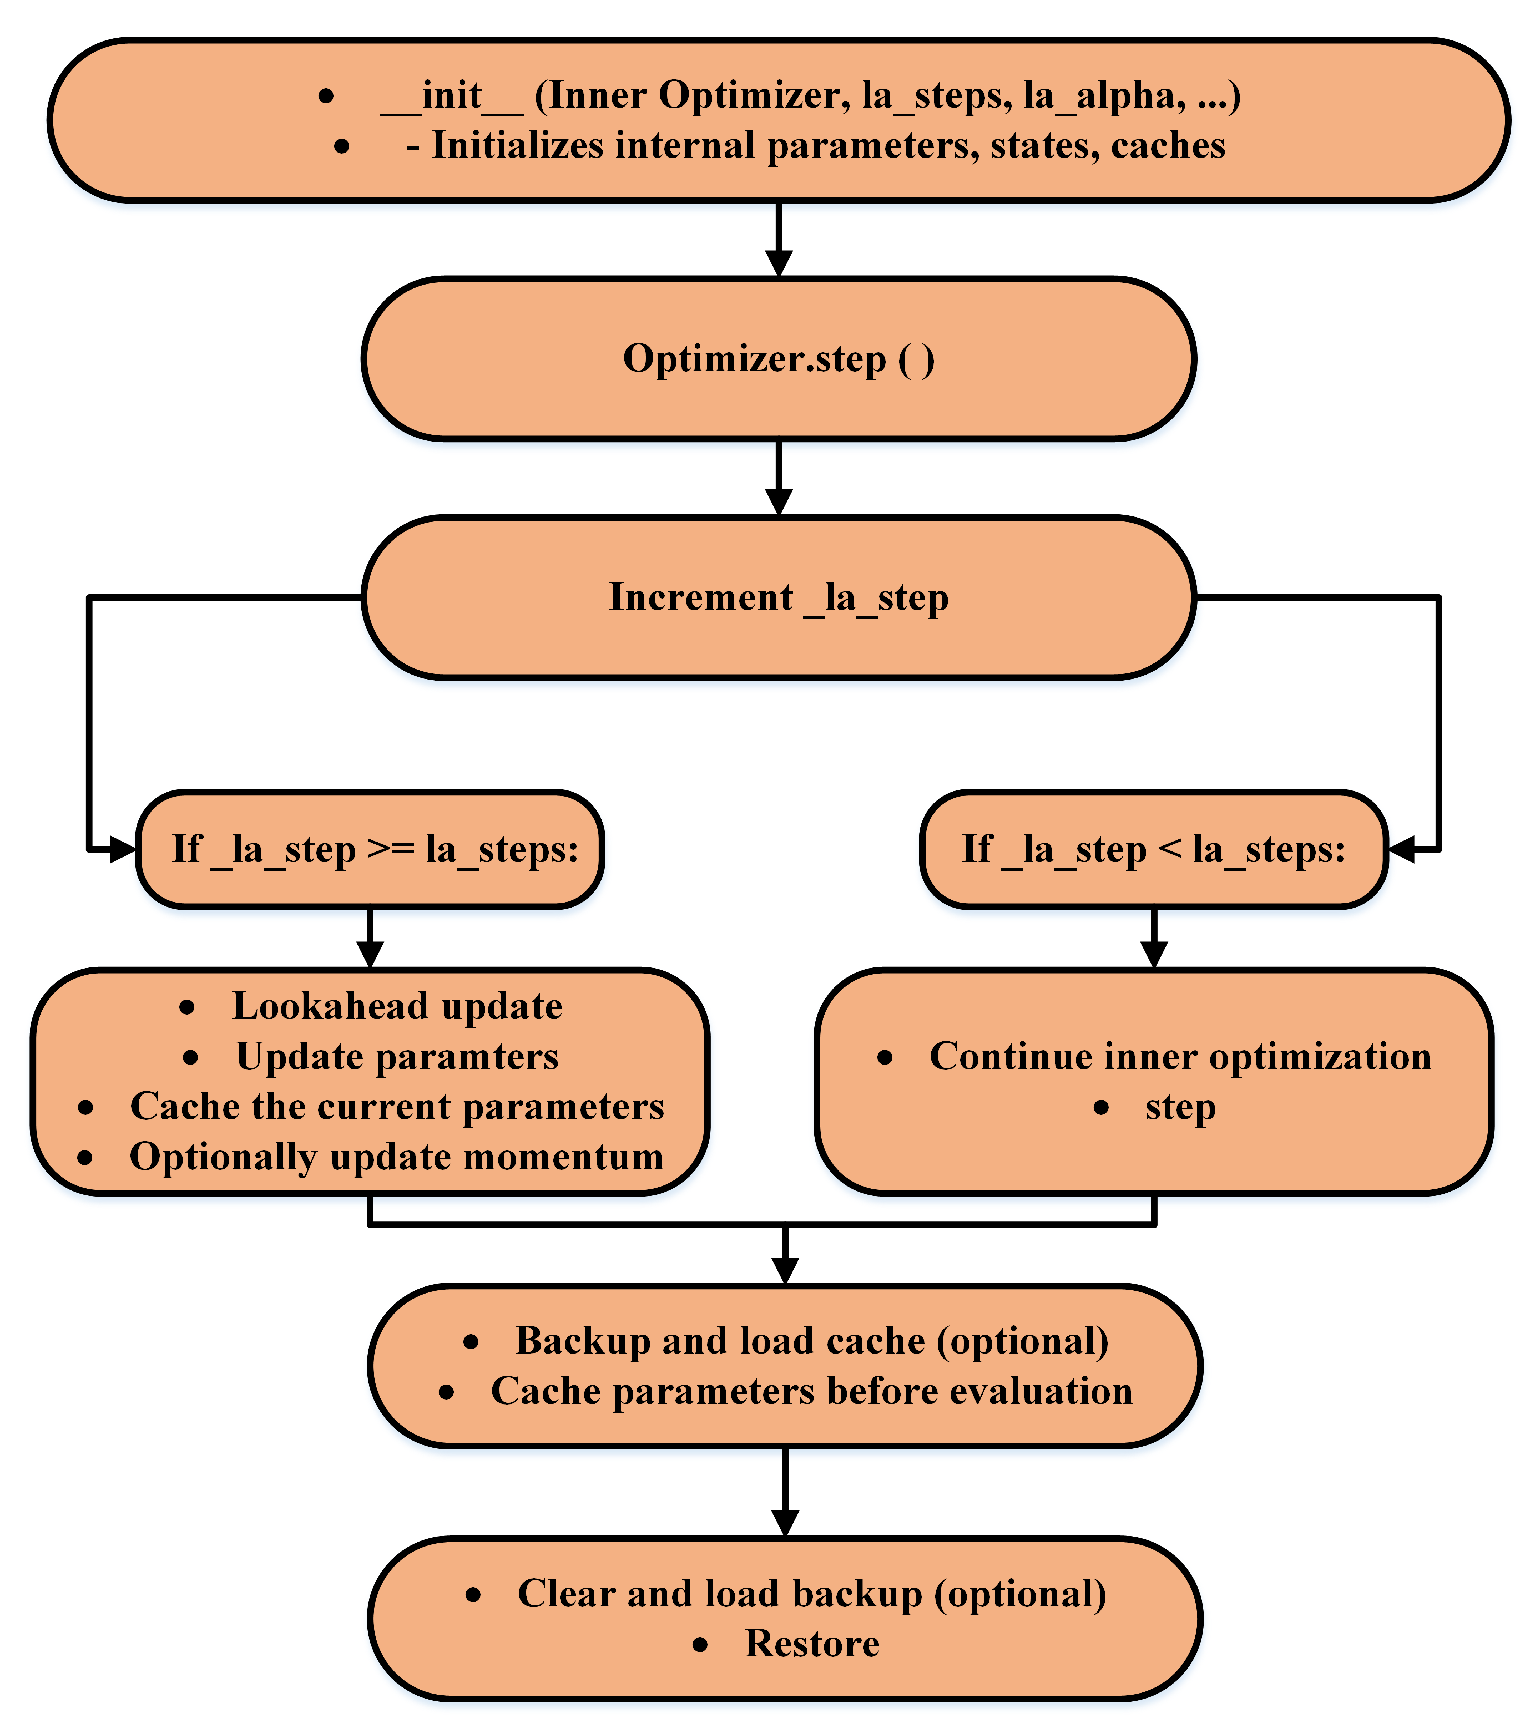
Figure 6.
Swish activation function flowchart: forward pass implementation using sigmoid and element-wise multiplication.
Figure 6.
Swish activation function flowchart: forward pass implementation using sigmoid and element-wise multiplication.
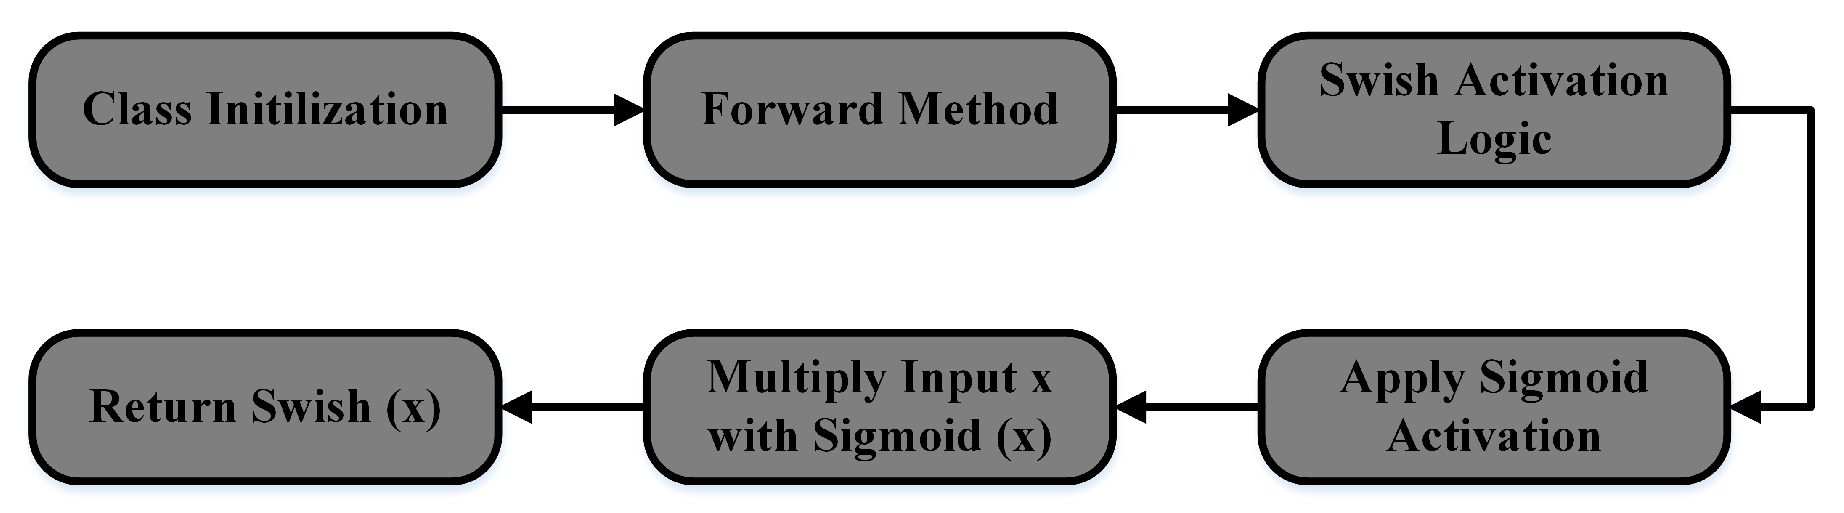
Figure 7.
Sample images from the orchard tree dataset.
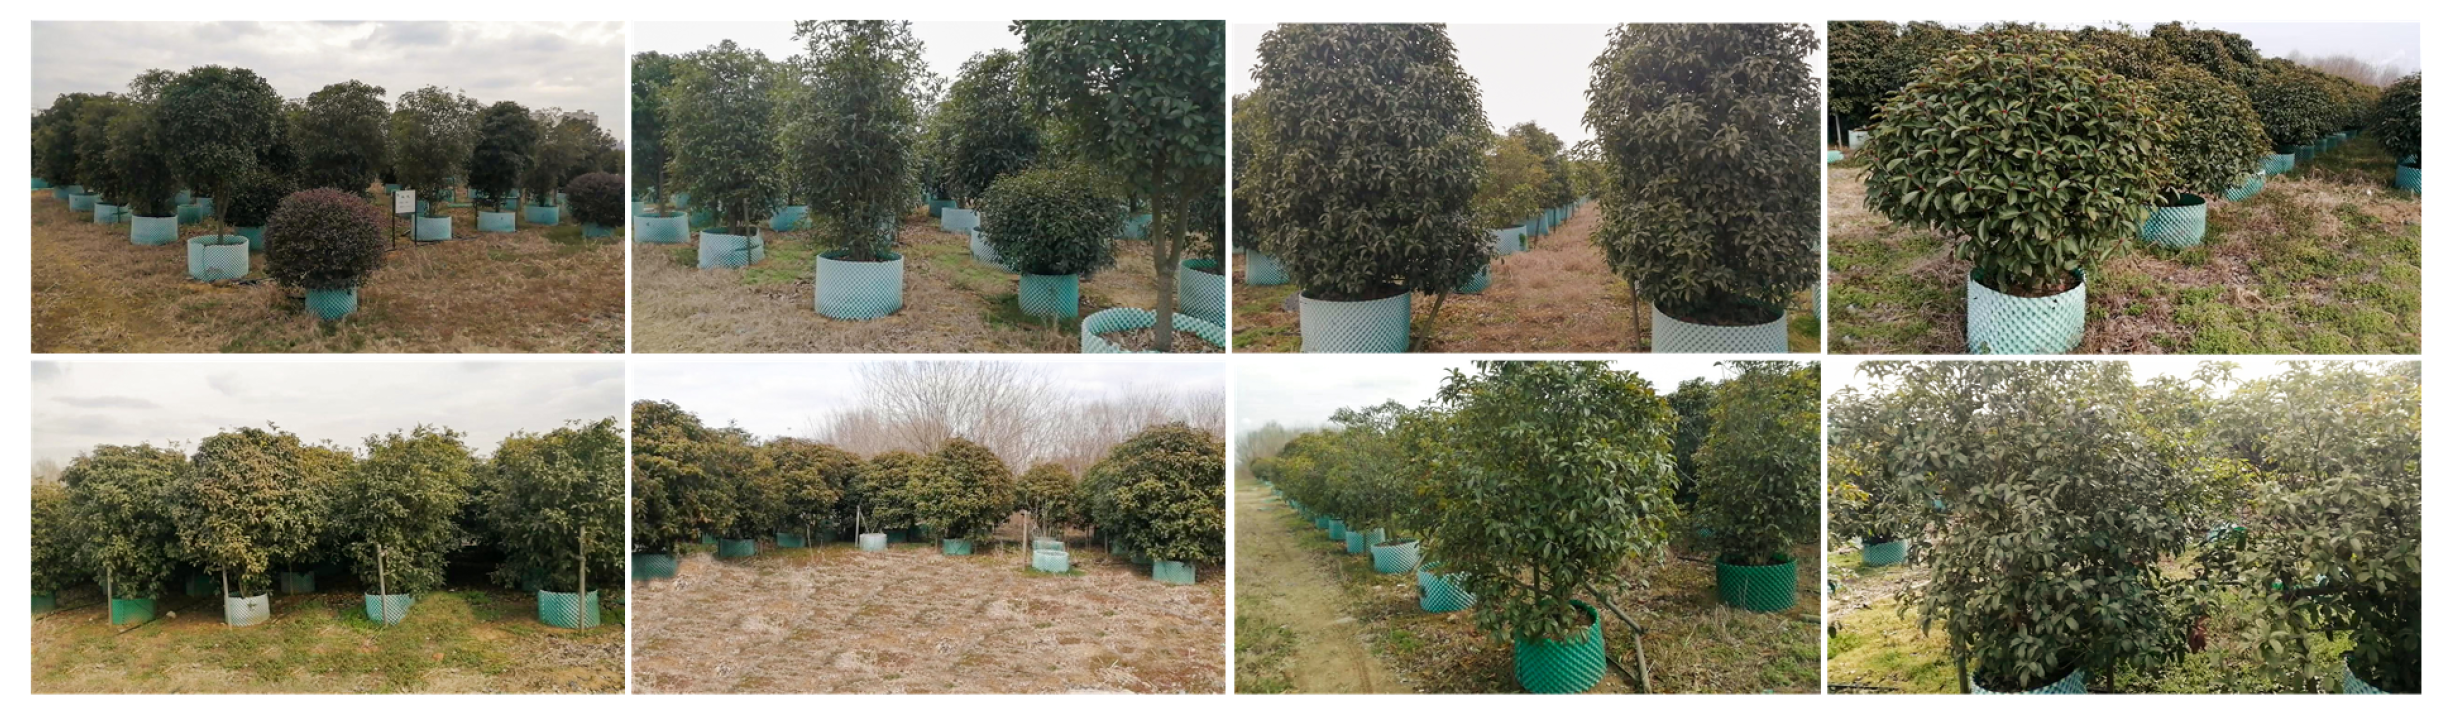
Figure 8.
Robot and spraying System: components for efficient and targeted spraying
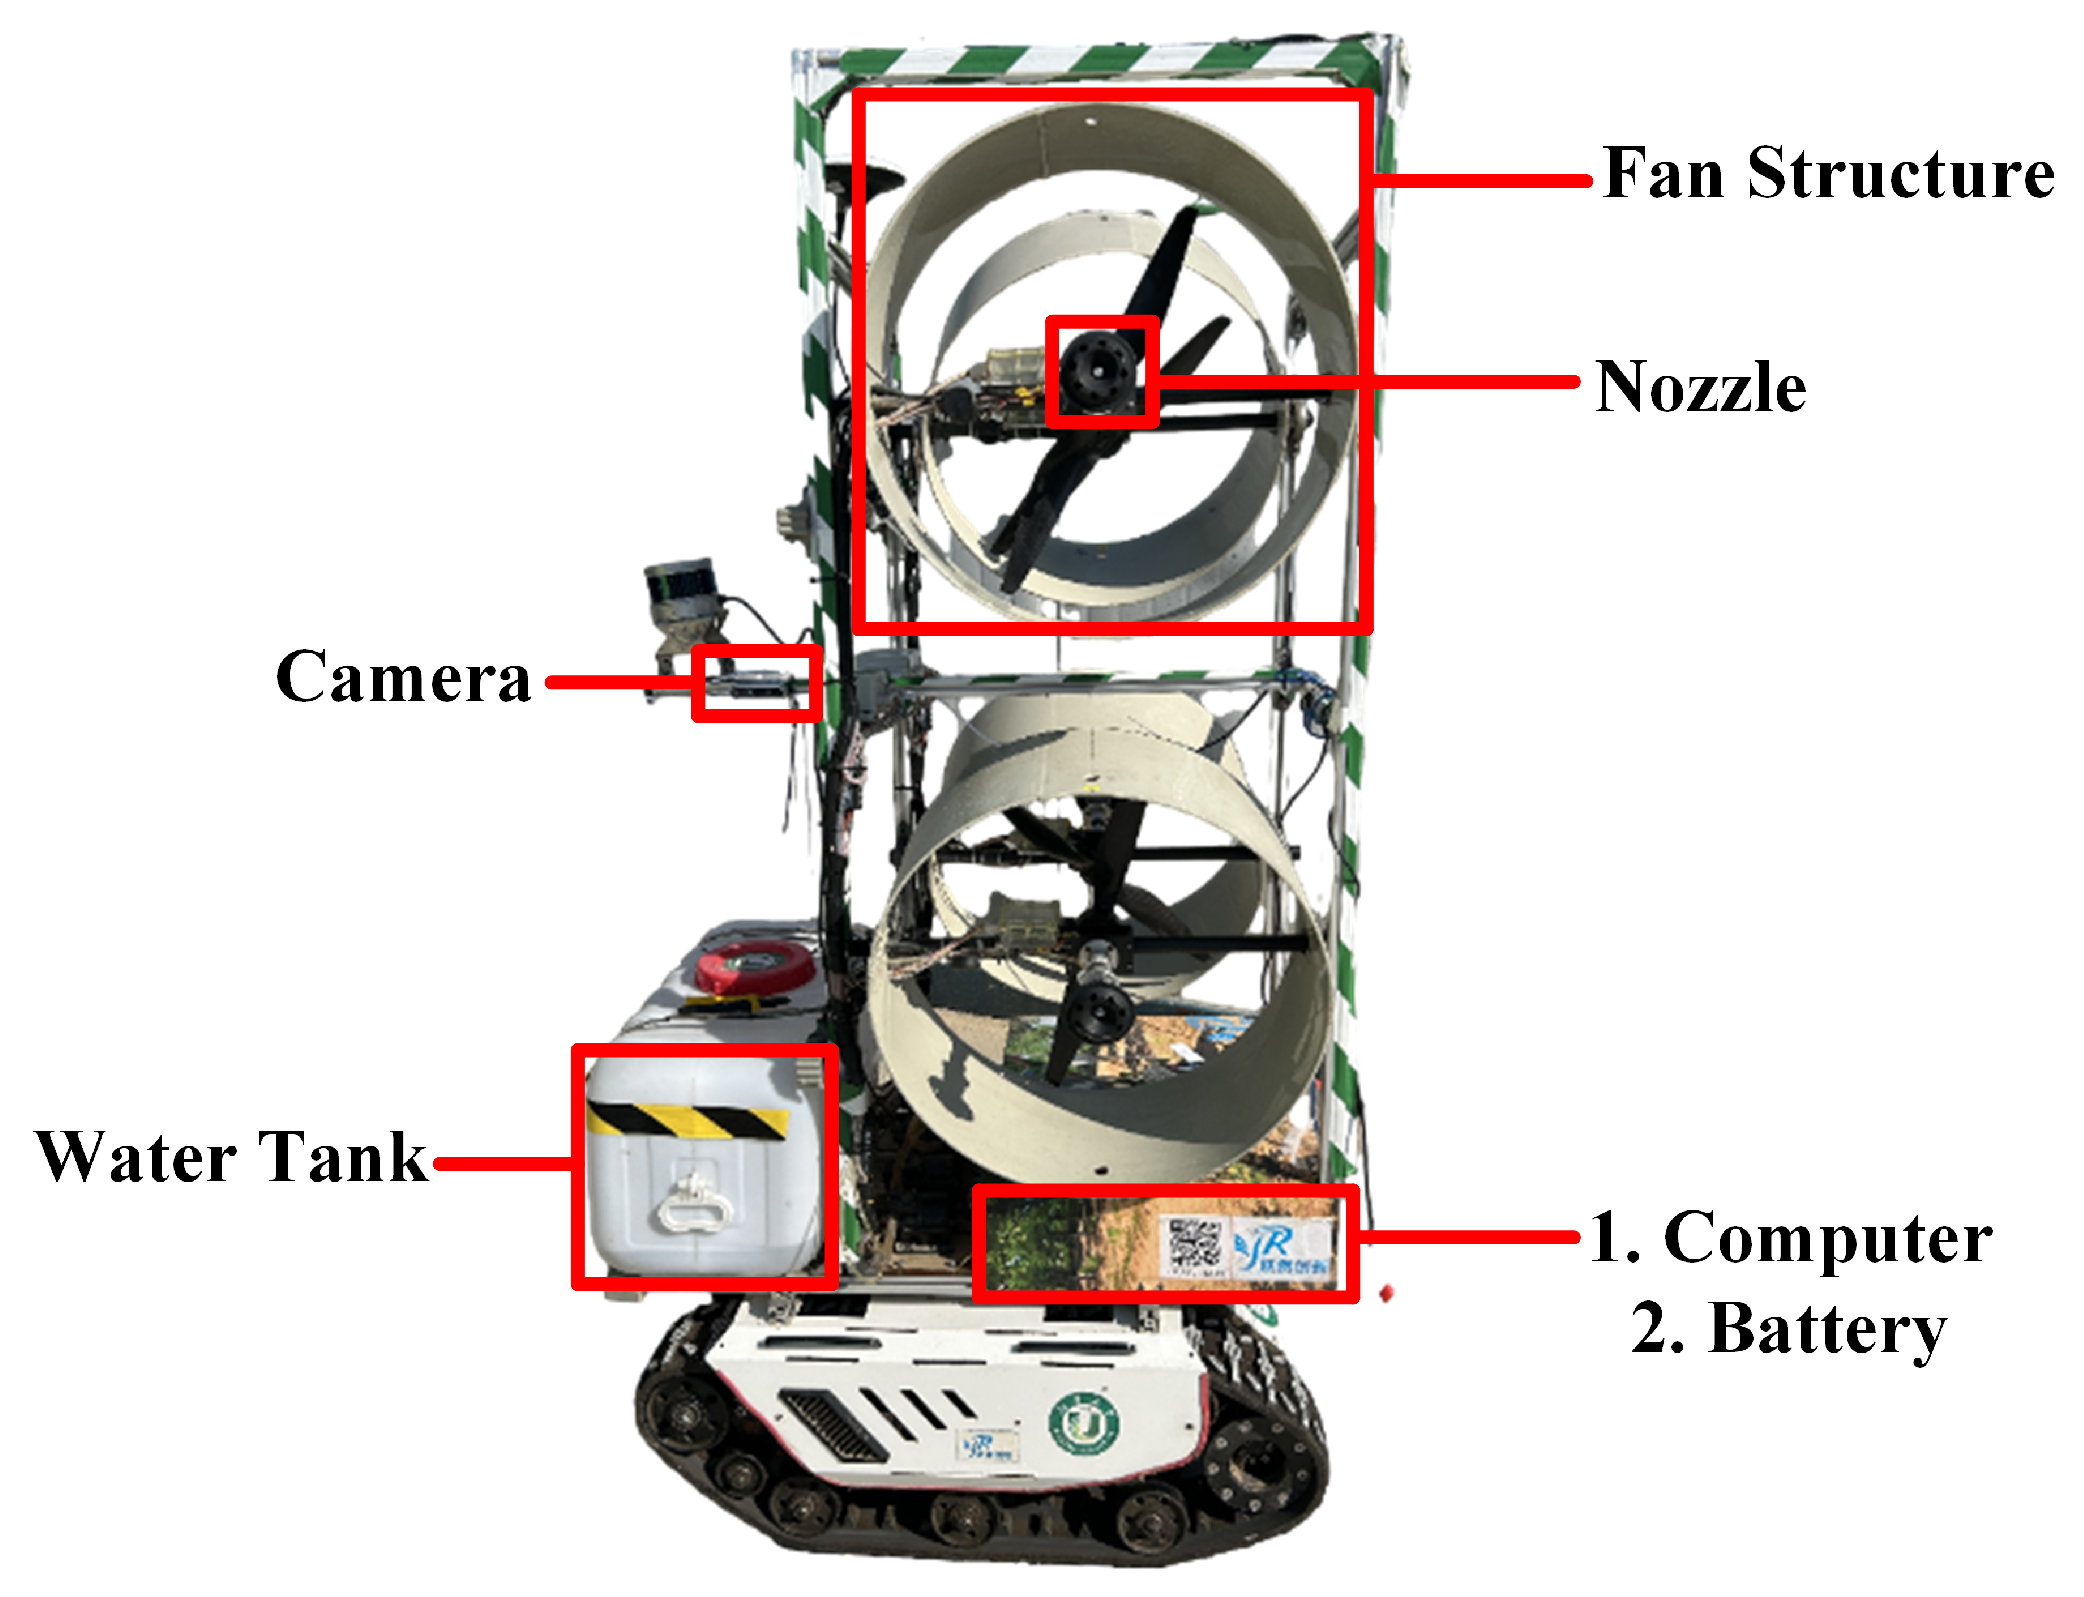
Figure 9.
Structured light depth-sensing camera for object detection and spatial awareness
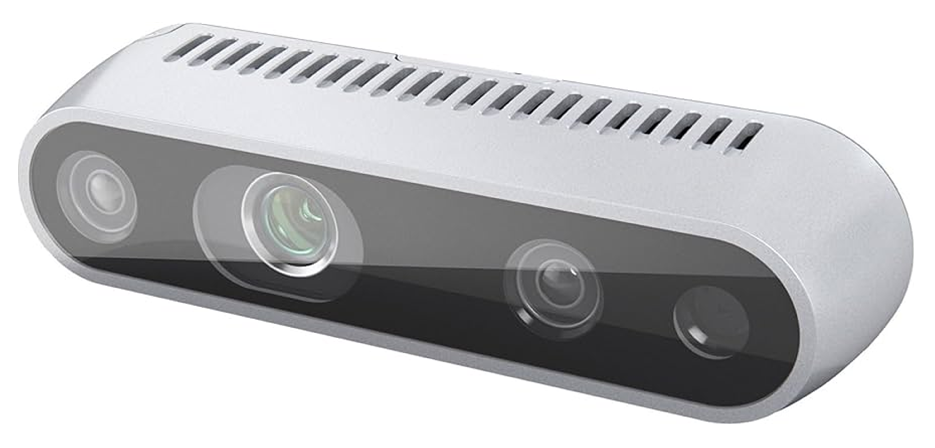
Figure 10.
Comparison of training and validation metrics between YOLOv9 and SEDA for real-time orchard detection.
Figure 10.
Comparison of training and validation metrics between YOLOv9 and SEDA for real-time orchard detection.
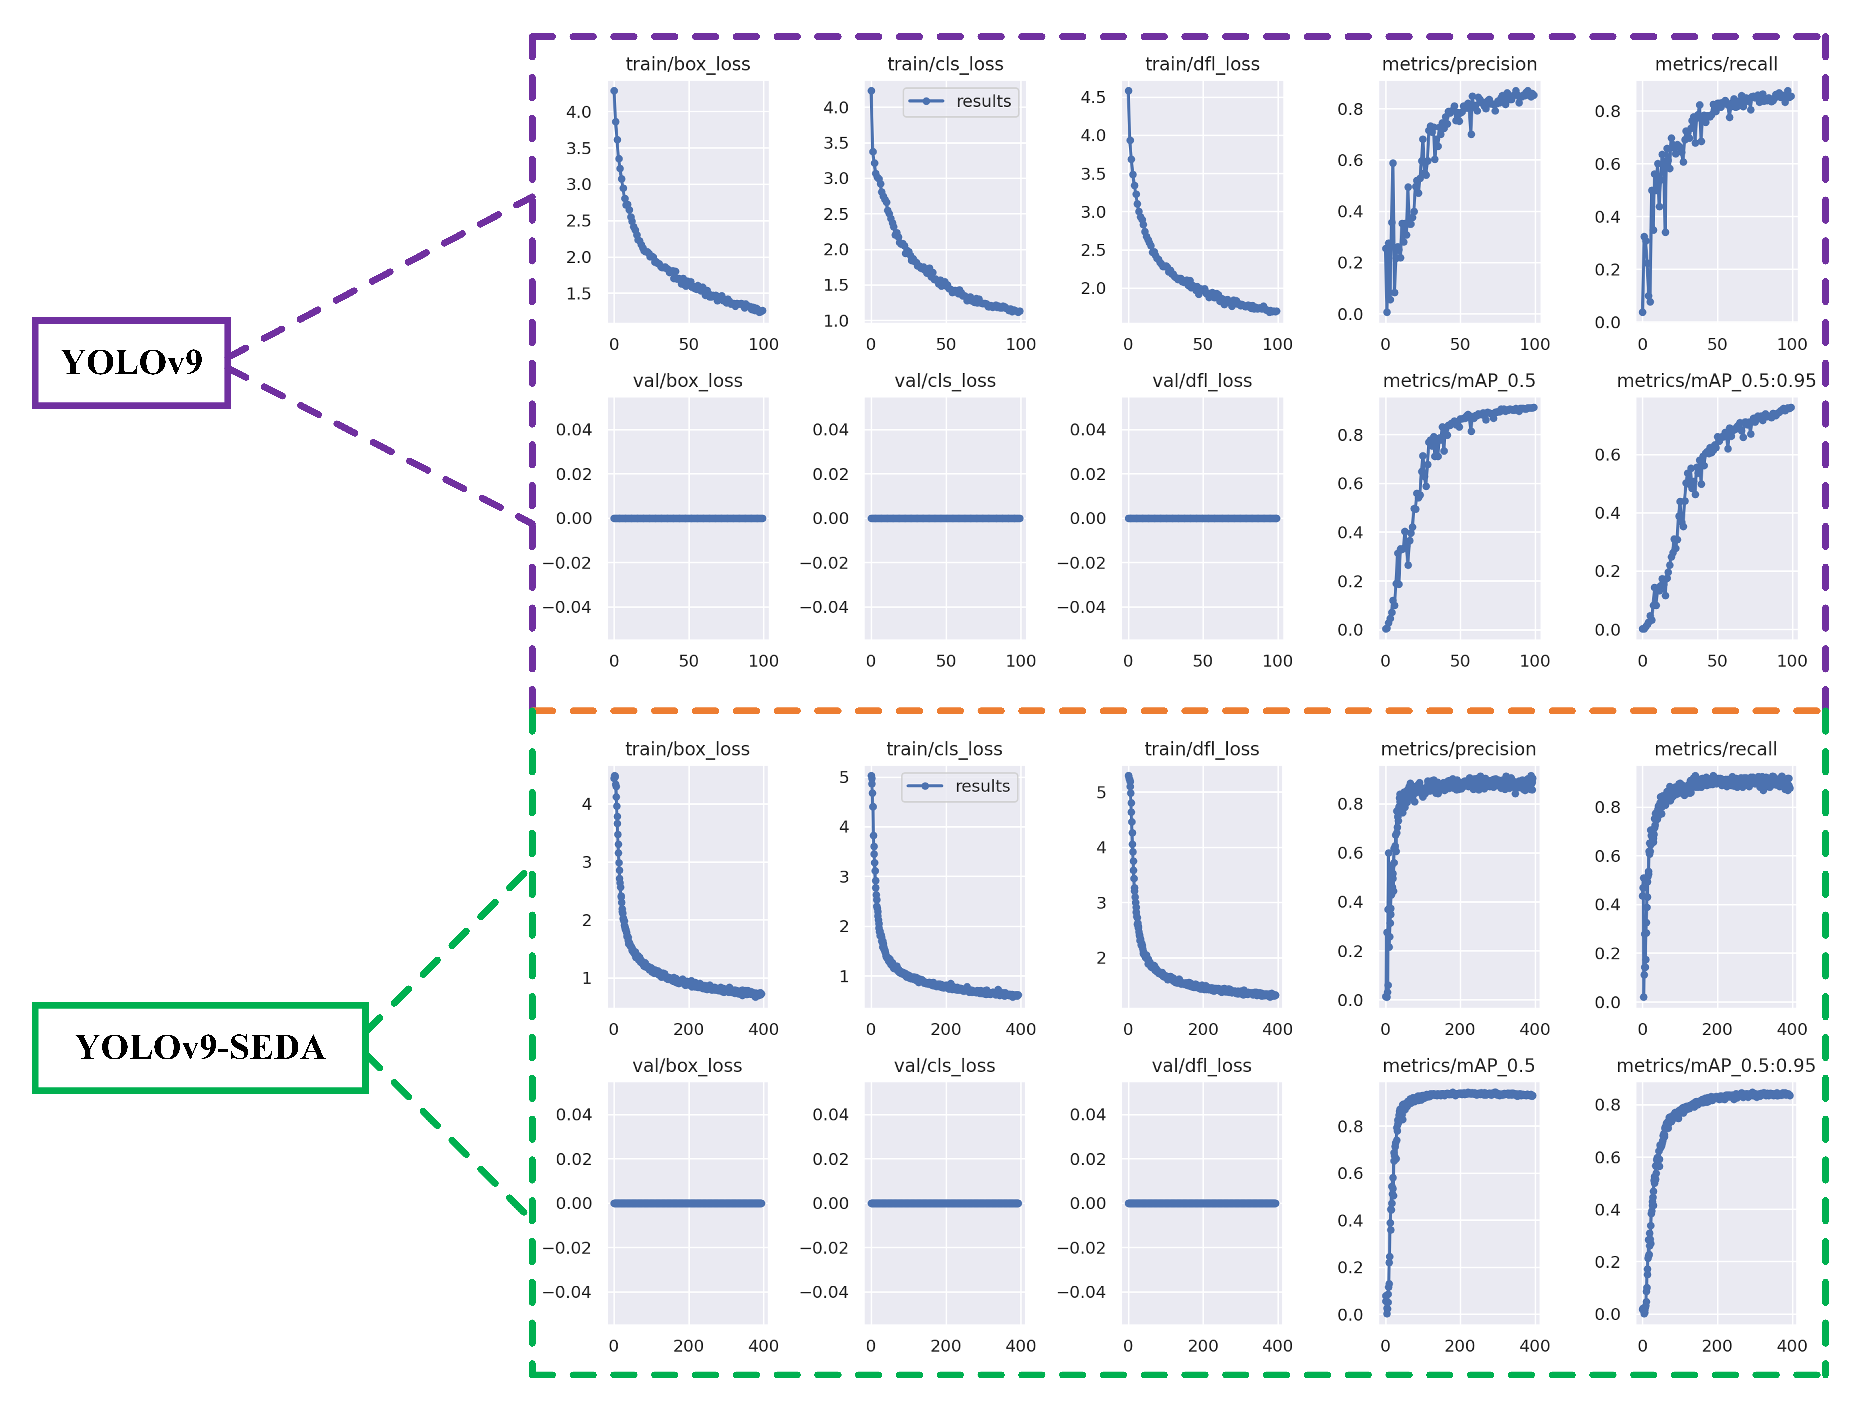
Figure 11.
Precision-Recall curve for multi-class object detection with mAP@0.5.
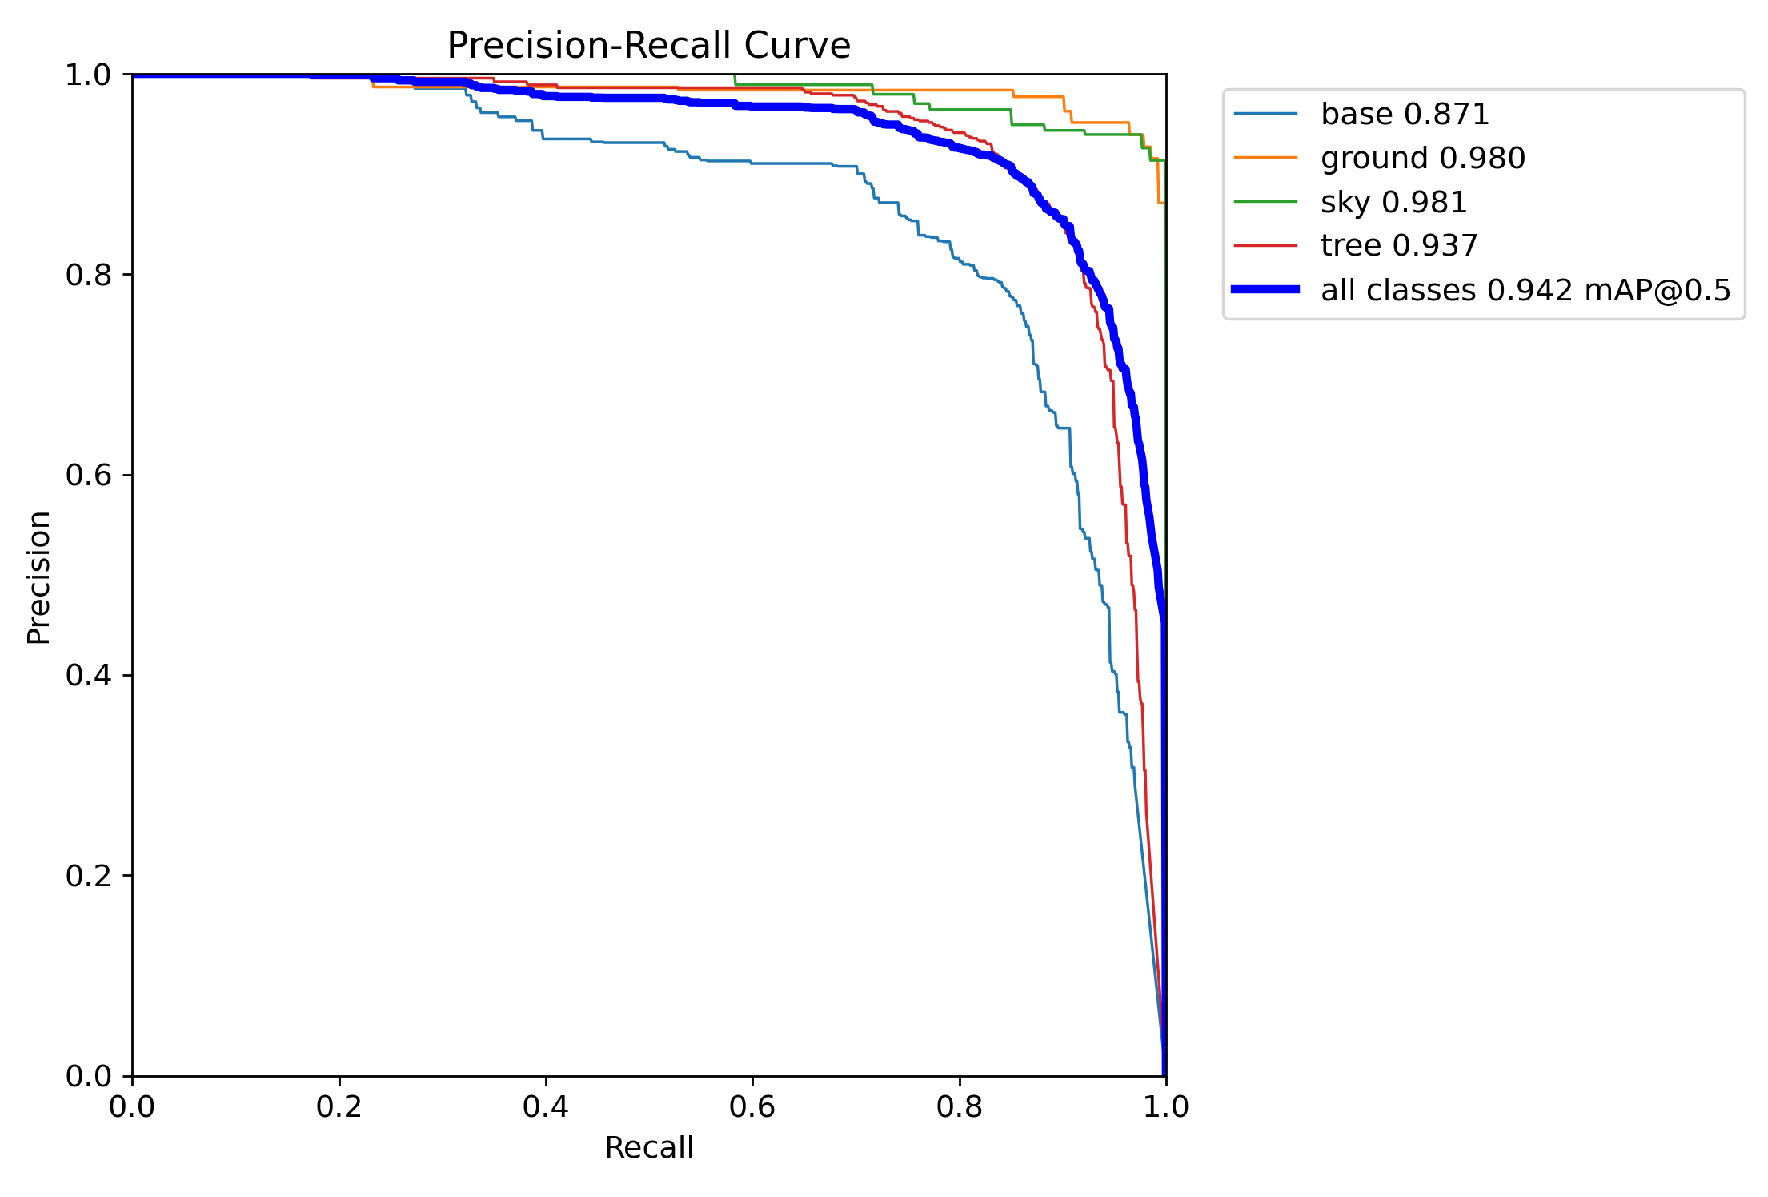
Figure 12.
Performance metrics comparison of object detection algorithms.
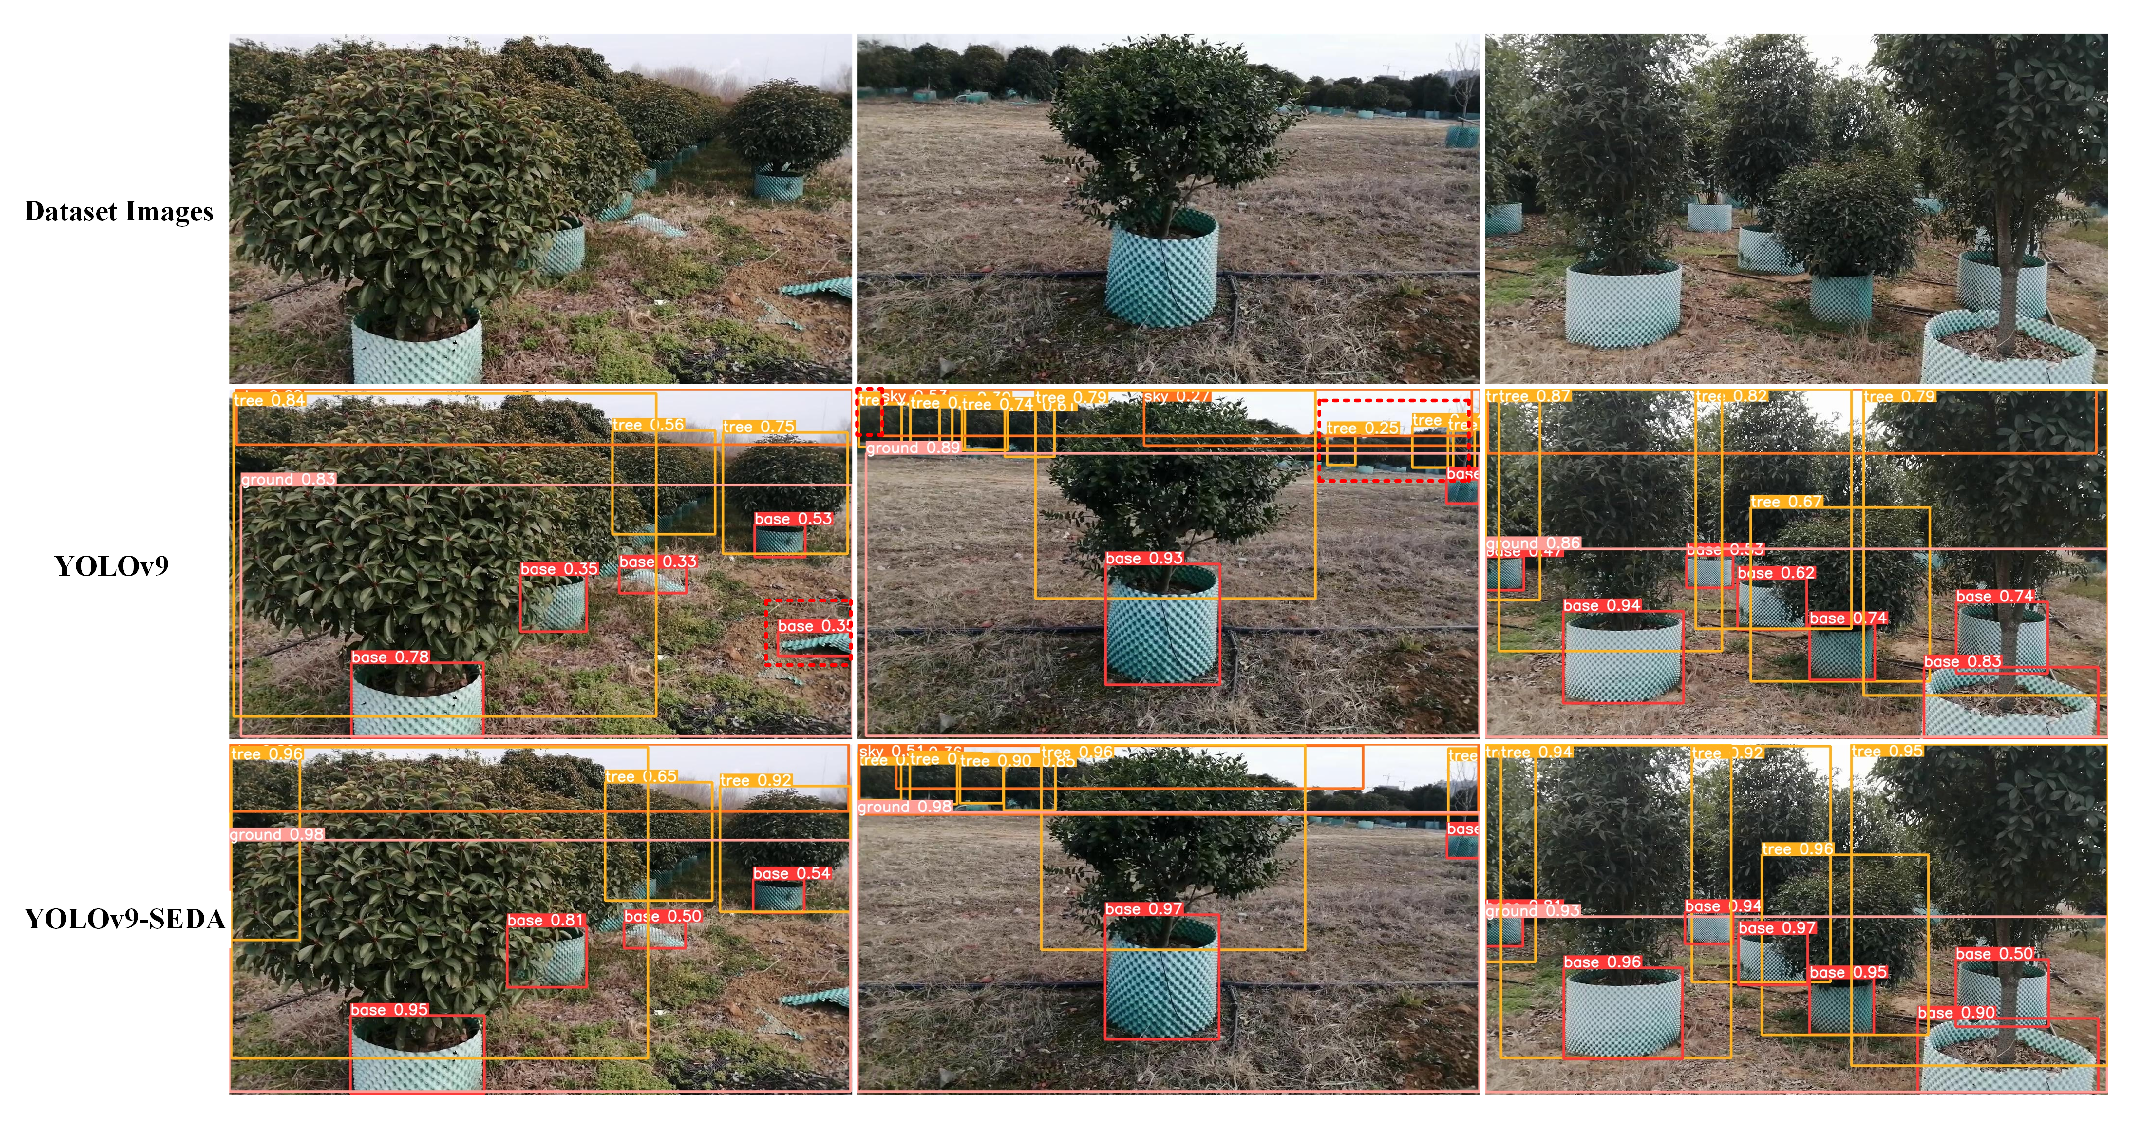

Table 1.
Summary of YOLOv9-SEDA architectural enhancements and their industrial benefits.
| Component | YOLOv9 Limitation Addressed | Benefit in Industrial Deployment |
|---|---|---|
| Depthwise Separable Convolutions | High computational load in standard convolutions | Reduces model size and computation, enabling real-time inference on embedded devices |
| Efficient Channel Attention (ECA) | Weak channel-wise feature representation | Enhances attention to key features without significant overhead |
| Swish Activation | Poor gradient flow with ReLU/Leaky ReLU | Improves gradient propagation and learning of complex patterns |
| AdamW + Lookahead Optimizer | Unstable convergence in training | Boosts optimization stability and generalization, critical for field variability |
Table 2.
Dataset attributes and preprocessing details.
| Attribute | Details |
|---|---|
| Total images | 1265 images |
| Preprocessing applied | Auto orientation |
| Augmentations applied | Rotation: between and |
| Grayscale: applied to 15% of images | |
| Brightness: between and | |
| Noise: up to 6% of pixels |
Table 3.
Training environment setup.
| Category | Configuration |
|---|---|
| CPU | Intel(R) Xeon(R) Gold 6226R CPU @ 2.90 GHz |
| GPU | NVIDIA RTX 3090 |
| System environment | Ubuntu 20.04.5 LTS |
| Framework | PyTorch 1.12 |
| Programming language | Python 3.8 |
Table 4.
Performance comparison of YOLOv9-SEDA components and the overall network.
| Network | P (%) | R (%) | mAP@0.5 (%) | mAP@0.5:0.95 (%) | Inference Time (ms) | F1 Score |
|---|---|---|---|---|---|---|
| Depthwise Separable | 87.5 | 90.1 | 93.2 | 81.4 | 11.8 | 88.9 |
| Efficient Channel Attention | 86.4 | 82.4 | 90.0 | 74.5 | 22.1 | 85.3 |
| AdamW (Lookahead) | 86.8 | 84.1 | 90.2 | 75.8 | 11.9 | 85.6 |
| Swish Activation | 85.1 | 86.6 | 90.6 | 75.7 | 12.5 | 85.5 |
| YOLOv9-SEDA (Ours) | 89.5 | 91.1 | 94.2 | 84.6 | 15.3 | 90.3 |
Table 5.
Performance comparison of object detection algorithms for real-time orchard detection.
| Algorithm | P (%) | R (%) | mAP@0.5 (%) | mAP@0.5:0.95 (%) | Inference Time (ms) | F1 Score |
|---|---|---|---|---|---|---|
| YOLOv5 | 83.9 | 88.8 | 91.9 | 71.5 | 11.3 | 86.3 |
| YOLOv7 | 83.4 | 83.0 | 88.8 | 61.9 | 11.3 | 83.2 |
| YOLOv9 | 84.4 | 86.6 | 91.1 | 76.1 | 9.4 | 85.5 |
| ATSS | 69.9 | 71.3 | 70.0 | 65.1 | – | 70.6 |
| RetinaNet | 56.9 | 69.6 | 68.2 | 58.5 | – | 62.7 |
| Double Head | 65.4 | 72.5 | 69.5 | 63.8 | – | 68.7 |
| YOLOv9-SEDA (Ours) | 89.5 | 91.1 | 94.2 | 84.6 | 15.3 | 90.3 |
Table 6.
Regional spray coverage comparison between SEDA and the uncontrolled method.
| Method | Top-Left | Top-Right | Middle-Left | Middle-Right | Bottom-Left | Bottom-Right | Average |
|---|---|---|---|---|---|---|---|
| SEDA | 27.73% | 31.86% | 19.75% | 35.89% | 38.12% | 29.50% | 30.47% |
| Uncontrolled | 39.74% | 39.58% | 34.98% | 34.31% | 34.07% | 47.84% | 38.42% |
Table 7.
Comparison of spray wastage in non-target spots: SEDA vs. uncontrolled method.
| Method | Spot-1 | Spot-2 | Spot-3 | Average |
|---|---|---|---|---|
| SEDA | 0.81% | 0.51% | 0.89% | 0.74% |
| Uncontrolled | 29.92% | 35.74% | 40.74% | 35.47% |
Table 8.
Deployment performance comparison on Jetson Xavier NX.
| Method | mAP (%) | FPS | Model size (MB) | Robustness |
|---|---|---|---|---|
| YOLOv5 | 71.5 | 88.5 | 42.1 | Medium |
| YOLOv7 | 61.9 | 88.5 | 74.8 | Medium |
| YOLOv9 | 76.1 | 106.3 | 102.7 | High |
| ATSS | 65.1 | – | 408.9 | Medium |
| RetinaNet | 58.5 | – | 378.4 | Low |
| Double Head | 63.8 | – | 409.4 | Low |
| YOLOv9-SEDA (Ours) | 84.6 | 65.3 | 80.7 | High |
Disclaimer/Publisher’s Note: The statements, opinions and data contained in all publications are solely those of the individual author(s) and contributor(s) and not of MDPI and/or the editor(s). MDPI and/or the editor(s) disclaim responsibility for any injury to people or property resulting from any ideas, methods, instructions or products referred to in the content. |
© 2025 by the authors. Licensee MDPI, Basel, Switzerland. This article is an open access article distributed under the terms and conditions of the Creative Commons Attribution (CC BY) license (http://creativecommons.org/licenses/by/4.0/).
Copyright: This open access article is published under a Creative Commons CC BY 4.0 license, which permit the free download, distribution, and reuse, provided that the author and preprint are cited in any reuse.


