Submitted:
19 May 2025
Posted:
20 May 2025
You are already at the latest version
Abstract
The study investigated the correlation of five primary volatile phenols (VPs) and their glycosides in smoke-exposed and non-smoke-exposed Pinot noir wines to evaluate and identify the potential markers for smoke taint. The results showed that all putative VP-glycosides in smoke-exposed wines were higher than in non-smoke-exposed wines, with a fold change ranging from 2.1 to 31.9 for the top fifteen differentiations. VP-glycosides showed strong positive correlations among themselves, with the correlation coefficients for hexose-guaiacol vs. pentose (P)-hexose (H)-cresol and syringyl-β-D-glucopyranoside vs. H-P-4-methylguaiacol of 0.94 and 0.92. VP-glycosides also showed relatively high correlations with free and strong acid-hydrolyzed VPs. For example, H-P-guaiacol vs. free-form guaiacol, and H-P-guaiacol vs. total guaiacol the 0.71, and 0.78. The strong correlation indicates that these compounds are connected and regulated by the severity of the smoke exposure. Multivariate analysis effectively differentiated smoke-exposed wines from non-smoke-exposed ones. However, more research is needed to fill the gaps in understanding smoke-derived compounds.
Keywords:
pinot noir
; smoke-exposure
; smoke taint
; volatile phenols
; volatile phenol-glycosides
; SPME-GC-MS
; HPLC–HRMS/MS
1. Introduction
Wildfire smoke impacts agricultural products by directly burning crops, orchards, and livestock, damaging infrastructure, and altering soil composition, sunlight, and ozone levels. The haze of wildfires has significantly damaged wine grapes, resulting in enormous economic losses in the US wine industry [1,2]. When vineyards are exposed to wildfire smoke, volatile phenols (VPs) and other smoke-related compounds can permeate the grape skins, potentially leading to „smoke taint” in wines that downgrade wine quality. The taint, described as smoky, burnt, dirty, ashy, etc., by sensory [3,4,5,6,7] is a big concern for the wine industry.
Some VPs, including guaiacol, 4-methylguaiacol, 4-ethylguaiacol, 4-ethylphenol, syringol, o-, p-, and m-cresols, eugenol, vanillin, cis- and trans-oak lactone, furfural, thiophenols, etc, have been established to some extent as indicators of the smoke effect [6,8,9,10,11]. Although extensive research has been done to identify volatile phenols contributing to the smoke taint, the results are inconclusive [5,6,8,16,17]. Because there are no universally accepted chemical markers and threshold levels. Also, the severity of smoke damage to wine grapes depends on many factors, including smoke intensity, fuel type, wind patterns, exposure timing, grape varieties, microbial fermentation, etc. [8,12,13,14,15,16,17]. Some grape varieties absorb more offending taint compounds than others, while some are more tolerant [15]. Specifically, Syrah seems to favor a slightly smoky character. As a result, smoke taint is highly unpredictable, making it enormously challenging to find a quick answer to which grapes to use and mitigate the risk of smoke taint [16].
Furthermore, volatile phenols can bind with sugar molecules to form stable glycosides [14,18,19,20]. Phenol glucosides, consistently found at elevated concentrations in smoke-affected wine, can function as smoke-taint precursors. They can be hydrolyzed to free VPs during winemaking and aging [21,22,23]. Thus, bounded-form precursors have also been evaluated as the potential smoke taint to improve the evaluation of smoke taint risk [5,6,30,31]. So far, all the glycosides identified in grapes or wine are that the sugar is directly bound to the aglycone as a β-d-glucose [24]. The second and third can be added to the β-d-glucose moiety to form disaccharide and trisaccharide glycosides. The tentatively identified phenolic glycosides, such as β-d-glucosyl-β-d-glucosides (gentiobiosides), β-d-glucopyranosides (monoglucosides), and disaccharides, have been found in smoke-affected grapes and wines at significantly elevated levels [16,18,25,26,27].
In 2020, a historic windstorm with hot, dry conditions caused simultaneous „mega-fires” around Oregon, devastating wineries. The flavor chemistry laboratory at Oregon State University analyzed hundreds of wine samples for five primary VPs (e.g., guaiacol, 4-methylguaiacol, o-, p-, and m-cresols) to evaluate the potential smoke taint, helping wineries make informed decisions about harvest and wine production. This study aimed to characterize VP-glycosides in some samples and correlate them with free and bound forms of VPs to help evaluate and identify potential markers for assessing smoke exposure.
2. Results and Discussions
2.1. Concentration of Free-Form and Total VPs in Non-Smoke-Exposed and Smoke-Exposed Wines
Quantating free-form and total VPs is essential to better understand risk during smoke-impacted vintages. Calibration standard curves demonstrated good linearity (R2 > 0.9990) (Table S1) were obtained for all analytes. The concentrations of the free and total VPs of the 14 non-smoke-exposed samples and 21 smoke-exposed ones were shown in Table S2 and Figure 2a. The free and total VPs concentration levels in the non-smoke-exposed wine provide baselines for the evaluation smoky effect. The mean value of free-form guaiacol, 4-methylguaiacol, o-cresol, p-cresol, and m-cresol concentration for non-smoke-exposed wines was 6.8, 1.8, 1.5, 1.5, and 1.6 μg/L, respectively. Meanwhile, the mean value of total VPs concentration in non-smoke-exposed wines was 18.4, 2.3, 4.0, 7.8, and 1.0 μg/L, respectively, slightly higher than the reference baseline reported [28,29]. In comparison, for smoke-exposed wines, the mean concentrations of free-form guaiacol, 4-methylguaiacol, o-cresol, p-cresol, and m-cresol were 51.9, 13.3, 14.5, 7.4, and 12.7 μg/L, respectively; while the concentration of total VPs in smoke-exposed wines was 117.2, 38.9, 26.9, 24.4, and 12.8 μg/L, respectively.
Figure 1.
The fragmentation pathway (color-coded) is an example of using the MS/MS data for level 2 annotations. a) Extracted ion chromatogram m/z 609.2. b) Proposed fragmentation pattern for Hexose-Hexose-Pentose-4-Ethylguaiacol; the dotted lines represent the sequential fragmentation. c) Spectra acquired for m/z 609.2 using a collision energy of 40 V.
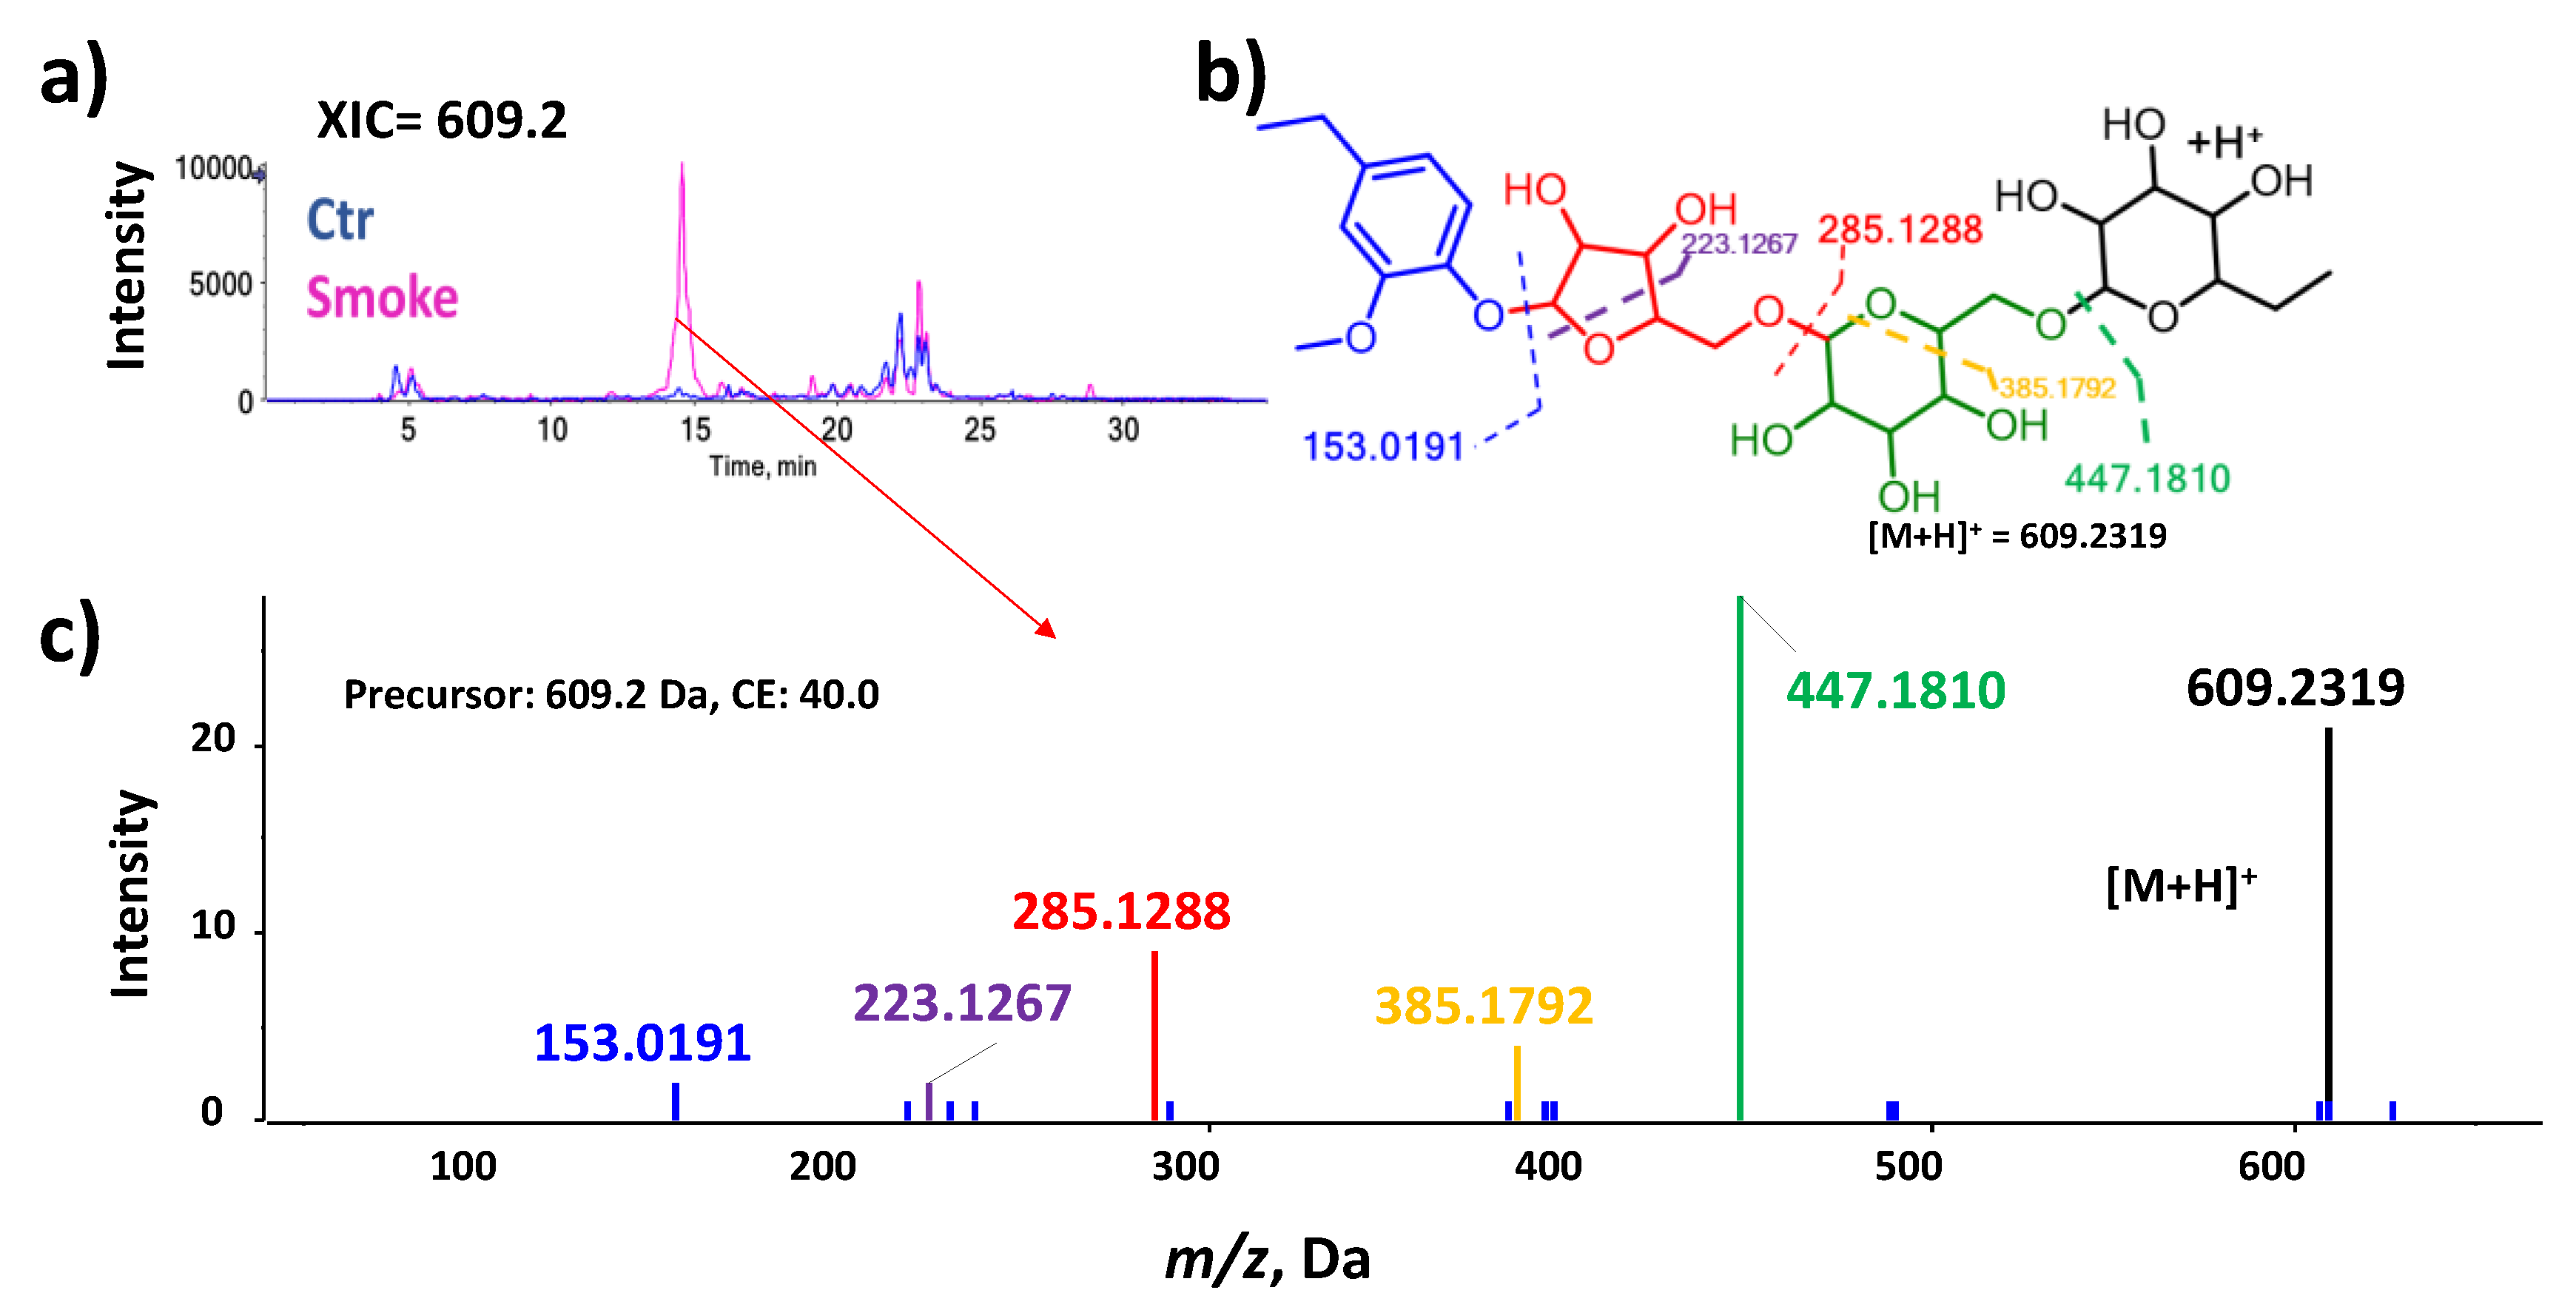
Figure 2.
The bar chart of VPs and VP-glycosides for smoke-exposed and non-smoke-exposed wines (Control). Each dot corresponds to a sample. The yellow dot in each group corresponds to the mean. a) Concentration of VPs (µg/L) was analyzed by SPME-GC-MS. b) The relative abundance of VPs-glycosides was estimated from HPLC-HRMS/MS. H: hexose, P: pentose.
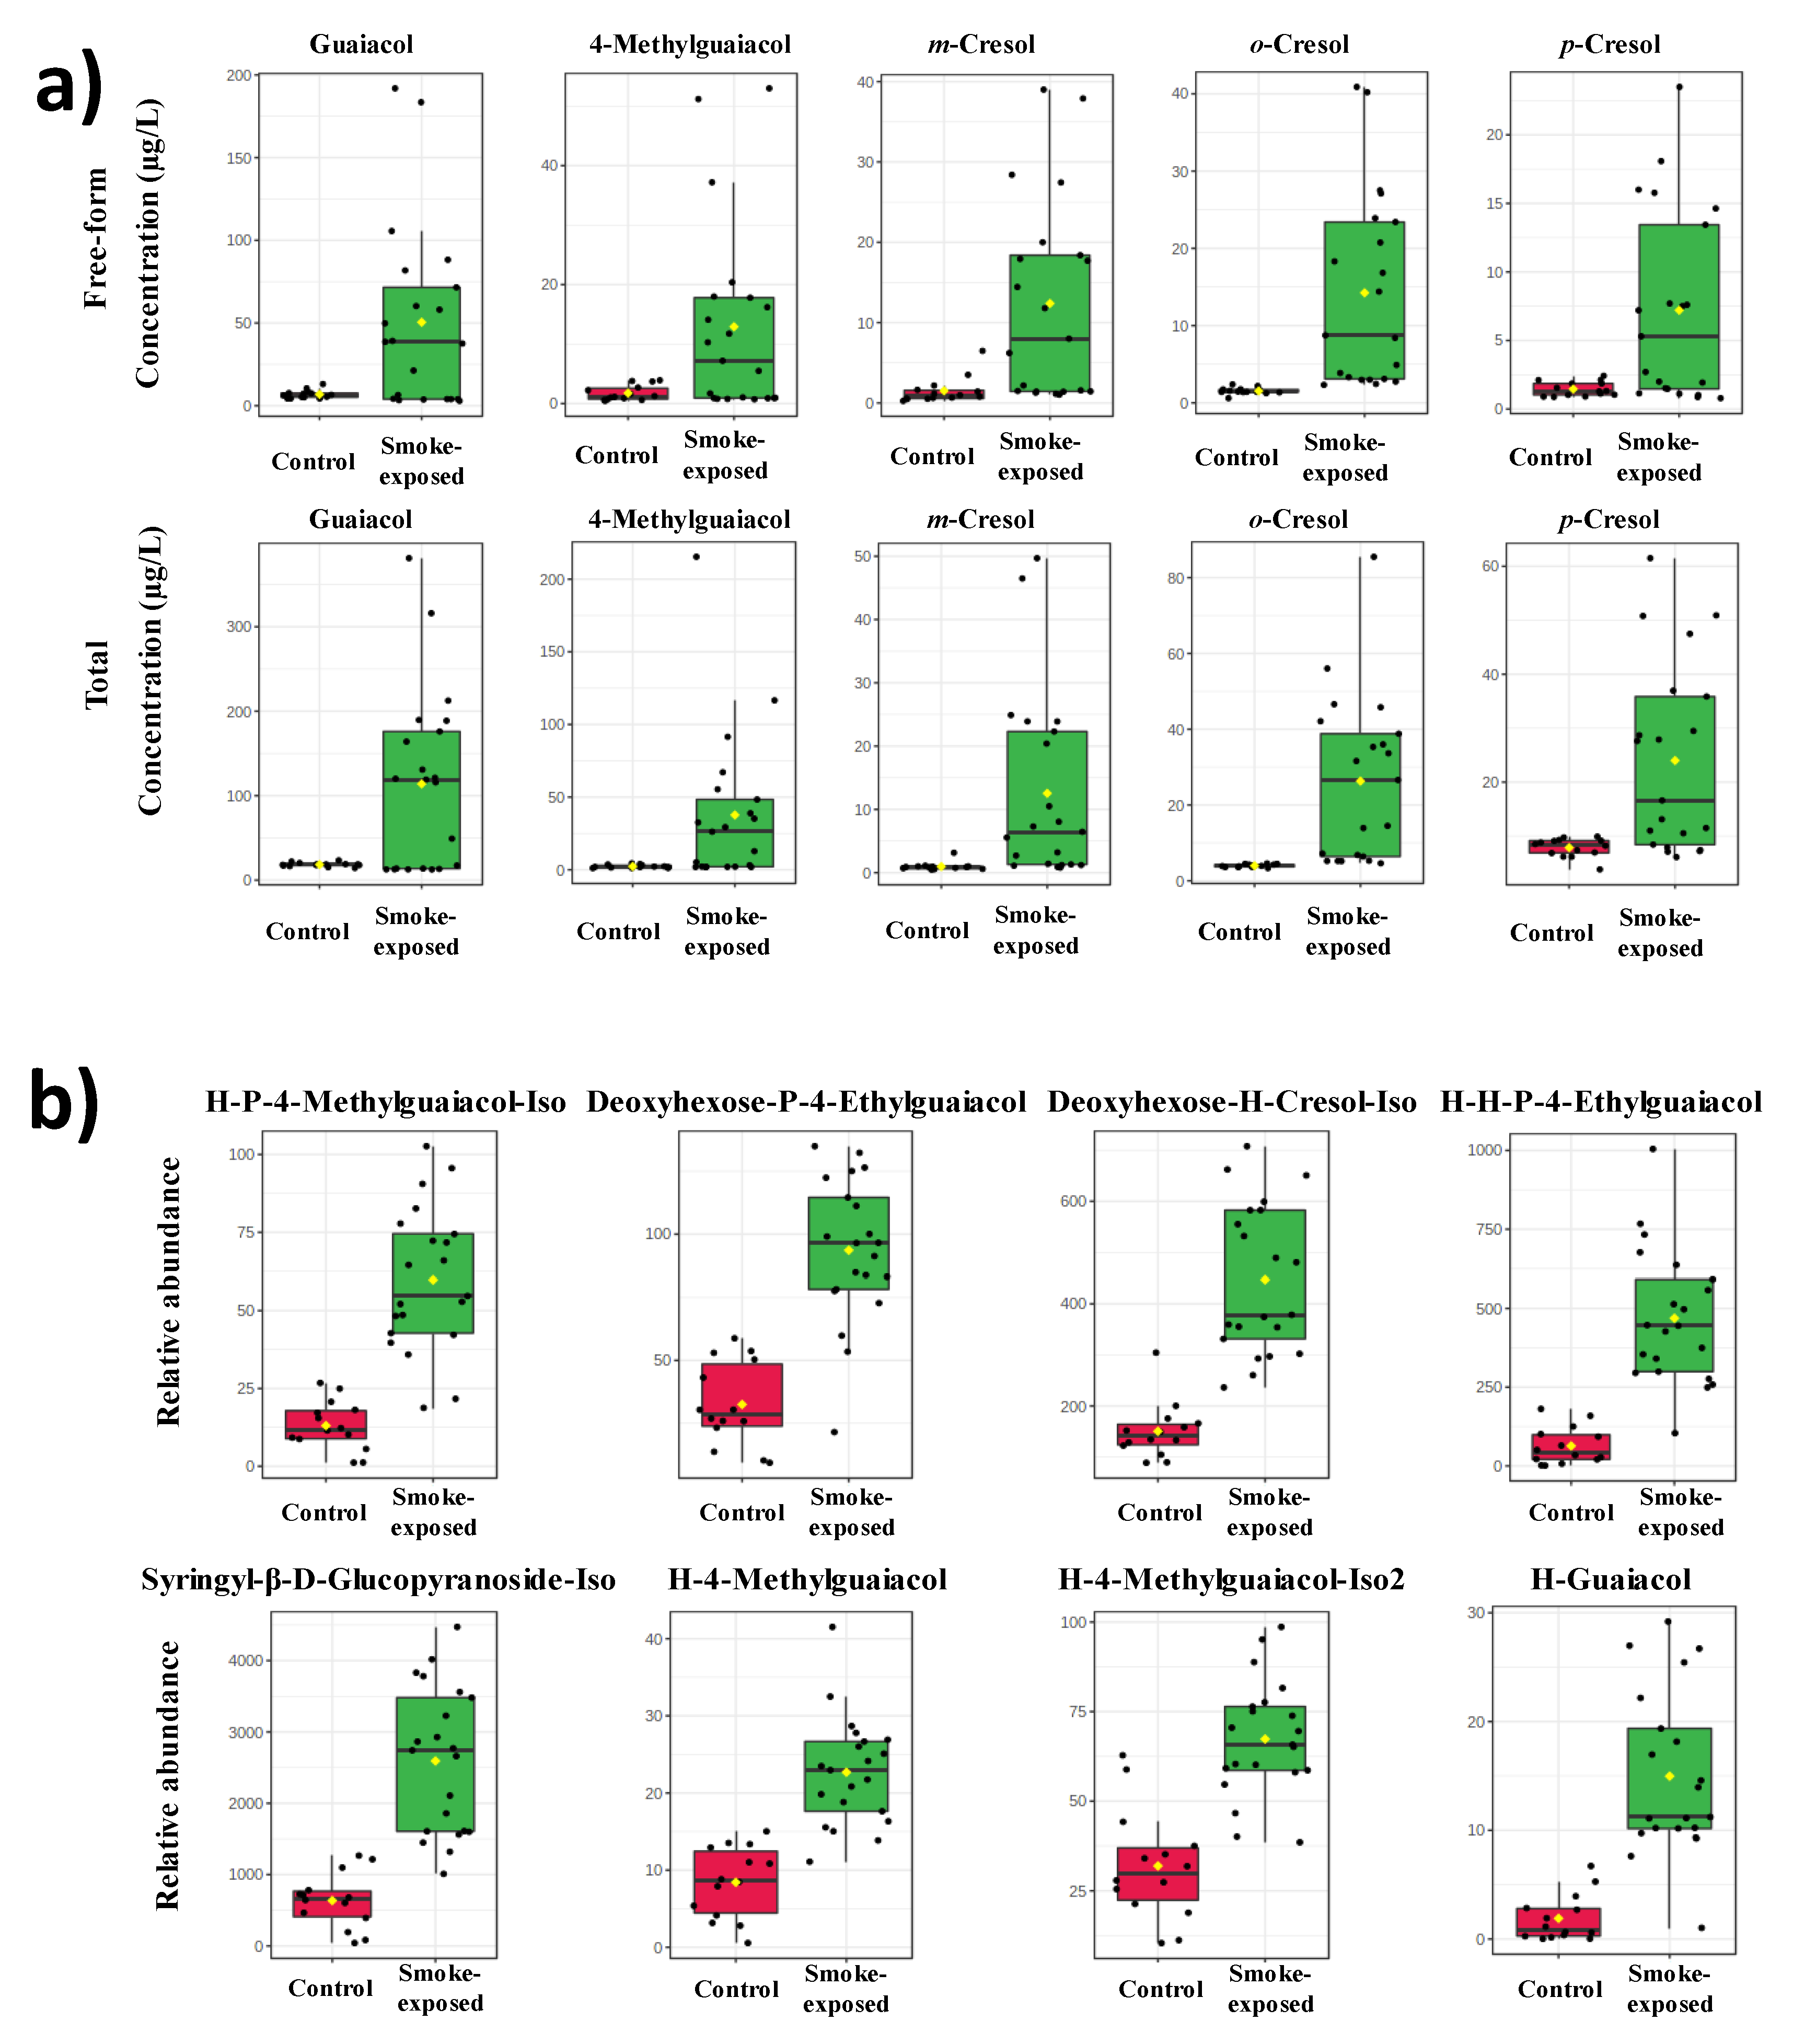
As expected, the free-form and total VPs in smoke-exposed wines were significantly higher than in non-smoke-exposed wines. The concentration of free-form guaiacol, 4-methylguaiacol, o-, p-, and m-cresol in smoke-exposed wine were 7.6, 7.5, 9.4, 5.1, and 8.4-fold, respectively, higher than that of non-smoke-exposed wines. Whereas total guaiacol, 4-methylguaiacol, o-, p-, and m-cresol concentrations in smoke-exposed wine were 6.4, 17.0, 6.8, 3.1, and 13.3-fold of those in non-smoke-exposed wine, respectively. Although VPs have been identified as potential marker compounds, it has not been unequivocally demonstrated that they are the root cause of wine smoke taint. However, the contribution of VPs to smoke taint has been intensively discussed in our previous publication [30].
2.2. VP-Glycoside Analysis in Wines by HPLC–HR-MS/MS
Glycosides in non-smoke-exposed and smoke-exposed wine samples were characterized by HPLC–HRMS/MS. As reported, level 2 annotations (putatively annotated metabolites) were produced by querying and matching MS/MS spectral data with open-access databases [31]. Additionally, glycosides reported in the literature for smoked taint wine were included in the study by matching exact mass and MS/MS data [32]. Despite the high-throughput analysis provided by HPLC–HRMS/MS analysis, including elemental composition, MS/MS data, and isotopic pattern, it is hard to assign the order of the sugars and their absolute configuration when analyzing disaccharides. To avoid the possibility of false positives, when isomers were present, the compounds were indicated as such, and all the annotations were considered putative (level 2, L2). From this search, 35 different VP-glycosides were tentatively annotated according to the criteria established by the Metabolomics Standards Initiative [33,34]. Detailed information about VP-glycosides, including accepted compound identification, adducts detected, exact mass, mass error, and formula, were listed in Table S3. The top eight most discriminant glycosides identified in this study were hexose (H)-pentose (P)-4-methylguaiacol-Iso, deoxyhexose-P-4-ethylguaiacol, deoxyhexose-H-cresol-Iso, H-H-P-4-ethylguaiacol, syringyl-β-D-glucopyranoside-Iso, H-4-methylguaiacol, H-4-methylguaiacol-Iso2, and H-guaiacol (Figure 2b). These results were in agreement with literature that disaccharides are the dominant VP-glycosides in smoke-exposed grapes and wines [18]. H-P-glycosides are consistently identified as the most abundant VP-glycosides in smoke-exposed V.vinifera [35], among others, including syringyl-β-D-glucopyranoside, guaiacyl-β-D-gentiobioside, and syringyl-β-D-gentiobioside. Deoxyhexose-H-cresol, deoxyhexose-H-P-phenol, deoxyhexose-P-4-ethylguaiacol, H-guaiacol, H-H-P-4-ethylguaiacol, H-P-4-methylguaiacol, H-P-guaiacol, H-P-P-4-methylguaiacol, and P-H-cresol, P-P-H-cresol have been identified in smoke-exposed grapes by HPLC-qTOF-MS [32].
2.3. Heating Map Analysis of VPs and Glycosides for Smoke-Exposed and Non-Smoke-Exposed Wines
To visualize the differences between the non-smoke-exposed and smoke-exposed wines, a hierarchical clustering heatmap and dendrogram of VPs concentration across wine samples were performed (Figure 3). Each color-coded cell on the heatmap corresponded to a measurement. VP compounds were shown in columns, and wine samples were in rows (Figure 3a). Figure 3a showed the wine samples were well separated into two groups. A few smoke-exposed wines, samples 27 to 34, had similar VP concentrations to the non-smoke-exposed stay in the same category as non-smoke-exposed samples, as demonstrated by the cluster dendrogram (Figure 3B, Table S2). However, the glycosides of samples 27-34 were categorized with the rest of the smoke-exposed samples when the dendrogram was performed using VP-glucosides, implying that VP-glycosides may have more discrimination power than VPs alone. Hierarchical clustering heatmaps and dendrogram computed using the relative abundance for the 35 tentatively identified VP-glycosides in non-smoke-exposed and smoke-exposed wines support the idea of using VP-glycosides as potential markers of smoke exposure (Figure 3c and 3d).
2.4. PCA Analysis of VPs and VP-Glycosides
PCA is an unsupervised method that expresses the variance of a multidimensional data set with fewer dimensions using principal components (PCs). As a result, the discriminant variables of each group can be distinguished, and the relationship between samples can be established [36]. Here, PCA was used to visualize the dissimilarities between non-smoke-exposed and smoke-exposed wines. As shown in Figure 4a, the two principal components accounted for 90.8% (PC1) and 2.4% (PC2) of the total variance. The cumulative contribution was much higher than the 60% mark, which is generally considered a good separation model [37]. Thus, good separation was observed for the two clusters in the present study. The smoke-exposed wines had more data dispersion, probably due to different degrees of exposure to wildfire smoke. In agreement with the dendrogram, samples 27-34 were close to non-smoke-exposed wines yet separated well from the non-smoke-exposed wines. A biplot was performed (Figure 4b) to facilitate the visualization among loadings (samples) and scores (VPs).
PCA analysis was also performed to capture the similarities and differences between samples among 35 tentative annotated VP-glycosides (Figure 4C). Two principal components described close to 70% of the total variance of the data (58.49% and 9.56% for PC1 and PC2, respectively). The distinct separation of the two categories suggested VP-glycosides could be potential smoke exposure biomarkers.
Univariate analysis identified the top 15 volatile phenol glycosides to differentiate non-smoke-exposed and smoke-exposed wines. The p-values of the top 15 VP-glycosides were very low (p < 9×10⁻⁵, Table 1), with a fold change (FC) ranging from 2.11 to 31.88, indicating that the contents of the top 15 VP-glycosides were significantly affected by smoke. A hexose-pentose-4-methylguaiacol isomer (H-P-4-methylguaiacol-iso) presented the most significant difference in smoke-exposed wines (FC = 4.58, p-value = 2.37×10⁻⁸).
2.5. Correlation of Glycosides to the Free and Total Form of VPs
Correlation analysis was performed to evaluate potential connections between VPs and putative VP-glycosides. The correlation heatmap and matrix for 35 tentative annotated VP-glycosides and the VPs (free-form and total) were plotted using Pearson’s correlation analysis (Figure 5). The correlation matrix identifies positive or negative correlations between different compounds. The results showed that VPs and VP-glycosides were all positively correlated (Table S4), and nearly 60% of correlations were statistically significant (p < 0.05). For examples, H-P-guaiacol vs. free-form guaiacol (r = 0.77, p = 2.50×10⁻⁸), H-P-guaiacol vs. total guaiacol (r = 0.78, p = 6.60×10⁻⁸), H-P-guaiacol-iso1 vs. free-form guaiacol (r = 0.65, p = 2.36×10⁻⁵) and H-P-guaiacol-iso1 vs. total guaiacol (r = 0.71, p = 2.19×10⁻⁶) showed the strong correlation in agreement with the findings [18]. The positive correlations indicated the potential interaction among their biosynthetic pathways, converting the VP to VP-glycosides.
Furthermore, strong correlations were also observed between the VP-glycosides, such as syringyl-β-D-glucopyranoside vs. H-guaiacol (r = 0.92), syringyl-β-D-glucopyranoside vs. P-H-cresol (r = 0.92), syringyl-β-D-glucopyranoside vs. H-P-4-methylguaiacol (r = 0.92), H-guaiacol vs. P-H-cresol (r = 0.94), and H-guaiacol vs. H-P-4-methylguaiacol (r = 0.90). However, there is a stronger correlation among VPs or glycosides than between VPs and glycosides (Figure 5).
3. Summary
The free form and total volatile phenols and their glycosides in smoke-exposed and non-smoke-exposed Pinot noir were analyzed by SPME-GC-MS and HPLC-HR-MS/MS. Results showed that smoke exposure significantly increases the concentration of VPs and glycosides in wine, which is well separated by a heating map and PCA analysis from non-smoke exposure wines. Moreover, fifteen VP-glycosides identified were much higher in smoke-exposed wines, strongly correlated with each other and with free and total VPs, suggesting a coordinated regulation of these compounds in response to smoke exposure. The findings inform future efforts to mitigate the adverse effects of smoke exposure on wine quality. However, further structural characterization is advised to ensure a complete assessment of the presence of VP-glycosides.
4. Materials and Methods
4.1. Materials
4.1.1. Wine Samples
Fourteen non-smoke-exposed (referred to as „control” in bar charts and figures) Pinot noir wine samples (numbered 1 to 14) were randomly selected from Oregon research vintages made between 2013 and 2016 without barrel aging. They were stored at -20oC before analysis. Twenty-one smoke-exposed wines with risk from smoke taint (numbered 15 to 35) were obtained from Oregon grape growers and winemakers in the summer of 2020, the most destructive wildfire season on record in Oregon State, and analyzed promptly.
4.1.2. Chemicals and Reagents
Standards of guaiacol (≥ 98%), 4-methylguaiacol (99%), o-cresol (≥ 99.5%), p-cresol (≥ 99%), and m-cresol (99%) were obtained from Sigma-Aldrich (St. Louis, MO, USA). 2-Methoxyphenol-3, 4, 5, 6-d4 (guaiacol-d4; 98.5%), 2-methoxy-4-methylphenol-3, 5, 6-d3 (4-methylguaiacol-d3; 99.3%), m-cresol-d7 (98.7%), p-cresol-d7 (99.2%), and o-cresol-d7 (99%) were purchased from CDN Isotopes (Pointe-Claire, Quebec, Canada). Tartaric acid (AR grade) was from Johnson Matthey Company (Heysham, Lancs, UK). Ethanol (HPLC grade) was from Greenfield Global USA Inc. (Brookfield, CT, USA). Methanol (HPLC and LC-MS grade) and sodium hydroxide 10 N solution (30% w/w) were from Fisher Scientific (Fair Lawn, NJ, USA). Citric acid, sodium chloride (ACS grade), and hydrochloric acid were purchased from EMD Millipore Corporation (Billerica, MA, USA). Milli-Q water was obtained from a Milli-Q purification system (Millipore, Boston, MA, USA).
Synthetic wine was used to build up standard curves for volatiles quantitation. It was prepared by dissolving 3.5 g of tartaric acid into one liter of 12% aqueous ethanol and adjusting it to pH 3.2 with sodium hydroxide [38].
4.2. Quantitation of Free-Form VPs in Wines
4.2.1. Internal Standard (IS) Preparation
Five volatile phenols, including guaiacol, 4-methylguaiacol, m-cresol, o-cresol, and p-cresol, were quantitated in wine samples. Stable isotope-labeled compounds were used as internal standards (IS). The IS (guaiacol-d4, 4-methylguaiacol-d3, o-cresol-d7, p-cresol-d7, and m-cresol-d7, were dissolved in methanol and then mixed to get a final concentration of 10 mg/L (ppm).
4.2.2. Wine Sample Preparation
Two milliliters of wine sample were diluted with 8 mL citric acid buffer saturated with salt (0.2 M, pH 3.5) in a 20 mL auto-sampler glass vial. Then 10 μL of a mixture of IS was added and cap tightly. A duplicate sample and a QA/QC standard were run every ten samples.
4.2.3. Standard Curve Preparation
Individual standard compounds of guaiacol, 4-methylguaiacol, o-cresol, p-cresol, and m-cresol were weighed and dissolved in 1 mL of methanol separately. Then, a mixture of stock solution (500 mg/L) was obtained by mixing above individual standard compounds. Nine data points with an incremental concentration of the sub-stock standard solution (0.01- 5 mg/L) were prepared by diluting the stock solution with pure methanol. All stock solutions were frozen until use.
The linear calibration curve ranged from 0.05 to 25 µg/L of analytes was prepared in a 20 mL sample vial by mixing 50 µL of a mixture of sub-stock standards, 10 µL of IS, 2 mL synthetic wine, and 8 mL citric acid buffer solution (0.2 M, pH 3.5).
4.2.4. Free-Form VPs Quantitation by Gas Chromatography-Mass Spectrometry (GC-MS)
Quantitation of free-form VPs was analyzed using an Agilent 6890 gas chromatograph equipped with an Agilent 5973 mass selective detector (Agilent Technologies, Inc., Santa Clara, CA, USA ). The free-form VPs in samples were extracted using a 50/30 μm Divinylbenzene/Carboxen/Polydimethylsiloxane (DVB/CAR/PDMS) fiber (Supelco Inc., Bellefonte, PA, USA) at 50℃ for 25 min at stirring of 250 rpm. The extraction was handled by a multipurpose autosampler (Gerstel Inc., Linthicum, MD, USA). Then, the volatiles were desorbed in the GC port at 250℃ for seven minutes in splitless mode. A SUPEL COWAXTM-10 column (59 m × 250 μm × 0.25 mm film, Supelco Inc.) was used for the separation. The flow rate of the carrier gas (helium) was 2 mL/min. The oven temperature was initially at 60℃ for 3 min, then ramped to 160℃ at 20℃/min rate, to 200℃ at 5℃/min rate, and held for 10 min, and finally, to 230℃ at 20℃/min rate and held for 5 min. The transfer line and MS source temperature were 280℃and 230℃, respectively. Selective ion monitoring (SIM) mode was adopted to acquire the data. Selected ions were used to build the calibration curve using ChemStation software (Table S1, as supplemental information).
4.3. Quantitation of Total VPs in Wines
Total VPs were analyzed after acid hydrolysis [11]. In brief, 2 mL wine samples and 20 μL HCl (10M) were mixed in 20 mL headspace glass vials to get a pH of 1.2. The vials were held in a water bath (100℃) for four hrs. After cooling down with ice, 8 mL citric acid buffer (0.2M, pH 3.5) saturated with NaCl and 20 μL of IS (10 mg/L) were added to the wine sample. A Duplicate was prepared for every ten samples. Total VPs were analyzed on an Agilent 7890A gas chromatograph equipped with an Agilent 5975C MSD (Agilent Technologies, Inc.). Compounds were separated on an OPTIMA ® FFAP plus column (60 m × 250 μm × 0.5 mm, Macherey-Nagel Inc., Düren, Germany). Other instrument settings for total VPs analysis were the same as previously described.
4.4. Untargeted Data-Dependent Acquisition Analysis of VP-Glycosides by HPLC-HR-MS/MS
Untargeted VP-glycoside analysis in wine was conducted according to Alcazar Magana et al., 2020 [31] with some modifications. A Shimadzu Nexera UHPLC system connected to a high-resolution AB SCIEX Triplet OF® 5600 mass spectrometer equipped with a Turbo V ionization source operated in positive electrospray ionization (ESI) mode was used. Chromatographic separation was accomplished using an Inertsil Phenyl-3 column (4.6 mm × 150 mm, 100 Å, five μm; GL Sciences, Torrance, CA, USA). One mL of each wine was diluted five times with aqueous methanol (70% v/v) and centrifuged at 10,000 rpm for 5 min. From the supernatant, 5 μL was injected in triplicates. Gradient elution was performed using a mobile phase consisting of solvent A (water containing 0.1% v/v formic acid) and solvent B (methanol containing 0.1% v/v formic acid). The flow rate was 0.4 mL/min. The chromatographic method was 30 min, and the gradient was as follows: an initial one min at 5% B, followed by 5 to 30% B from 1 to 10 min, then 30 to 100% B from 10 to 20 min, hold at 100% B from 20 to 25 min and then return to 5% B from 25 to 30 min.
Data-dependent acquisitions (DDAs) were conducted to obtain precursor and fragment ion information to assist in annotating compounds in the wine samples. DDA analyses were performed using positive ionization mode (ESI+). The following parameter settings were used for detecting positive ions: spray voltage of 4500 V, source temperature of 550°C, and a period cycle time of 950 ms. In addition, the following settings were used: full scan with ion accumulation of 150 ms, followed by a dynamic MS/MS selection of the eight most intense ions with 100 ms accumulation; after two MS/MS acquisitions, the precursor (fragmented) ions were excluded for 30 s; collision energy 35 V with collision energy spread (CES) of 15 V ramped through each MS/MS scan using a range of m/z 100–1200. Mass calibration was automatically performed after every two hours with a calibrant delivery system.
4.5. Data Processing and Annotation of Wine Metabolites
Annotation confidence was established according to reporting criteria for chemical analysis suggested by the Metabolomics Standards Initiative [33,34]. The level 2 (L2, considered the cut-off; any sample’s value above the cut-off is regarded as a positive result; below the cut-off is considered negative) annotations were based on exact mass, isotopic pattern, and MS/MS spectral data (Figure 1). Also, two manual data evaluations were included: (1) examination of the metabolite structures concerning the suitability of the ionization mode in which a compound was detected, and (2) elution peaks for tentatively annotated features were interrogated to omit compounds originating from in-source fragmentation.
4.6. Statistical Analysis
Data distribution, hierarchical clustering heatmaps, hierarchical clustering dendrogram, principal component analysis (PCA), and Pearson correlation analysis were conducted using an online version of MetaboAnalyst V5.0 (www.metaboanalyst.ca, Xia Lab at McGill University, Ca). In addition, hierarchical cluster analysis was performed using Euclidean distance with Ward’s linkage algorithm [39].
Supplementary Materials
The following supporting information can be downloaded at the website of this paper posted on Preprints.org.
Author Contributions
Armando Alcazar-Magana: Data curation, formal analysis, investigation, methodology, software, validation, original draft Ruiwen Yang: Data curation, formal analysis, investigation, validation, original draft Michael C. Qian: Conceptualization, methodology, project administration, resources, supervision, validation, visualization, review &editing Yanping L. Qian: Conceptualization, data curation, formal analysis, investigation, methodology, project administration, supervision, validation, visualization, intensive review, and editing.
Acknowledgments
The authors thank the Oregon winemakers and grape growers for providing wine samples. In addition, the China Scholarship Council (#201906170269) partially supported Ruiwen Yang’s study at Oregon State University.
Disclosure Statement
The authors declare no research funding received for the study and no competing financial interests. No generative AI tool was used to write this manuscript.
Abbreviations
| Volatile phenols (VPs) |
| Solid-phase microextraction and gas chromatography-mass spectrometry (SPME-GC-MS) |
| High-performance liquid chromatography combined with high-resolution accurate Tandem mass spectrometry (HPLC–HR-MS/MS) |
| Two-dimensional correlation spectroscopy (2D-COS) |
| Mid-infrared (MIR) |
| Isotope dilution assay (SIDA) |
| Australian Wine Research Institute’s Commercial Services Laboratory (AWRI) |
| Stir bar sorptive extraction (SBSE) |
| Ultrahigh-performance liquid chromatography-quadrupole time-of-flight mass spectrometry (uHPLC-QToF) |
| Internal standards (IS) |
| Mass selective detector (MSD) |
| Selective ion monitoring (SIM) |
| Electrospray ionization (ESI) |
| Data-dependent acquisitions (DDAs) |
| Collision energy spread (CES) |
| Principal component analysis (PCA) |
| Partial least squares-discriminant analysis (PLS-DA) |
References
- Adams, A. Wine Business. January 20 2021,.
- Beck, L. As Wildfires Take over the West, Oregon Winemakers Adapt. NEW LEDE 2022.
- Fryer, J.A.; Tomasino, E. Analysis of Retronasal Flavor Alterations in Smoke-Affected Wines and the Efficacy of Various Inter-Stimulus Rinse Protocols in Clearing Smoke-Related Attributes. Beverages 2022, 8, 23. [Google Scholar] [CrossRef]
- Kennison, K.R.; Wilkinson, K.L.; Williams, H.G.; Smith, J.H.; Gibberd, M.R. Smoke-Derived Taint in Wine: Effect of Postharvest Smoke Exposure of Grapes on the Chemical Composition and Sensory Characteristics of Wine. J. Agric. Food Chem. 2007, 55, 10897–10901. [Google Scholar] [CrossRef] [PubMed]
- Kennison, K.R.; Gibberd, M.R.; Pollnitz, A.P.; Wilkinson, K.L. Smoke-Derived Taint in Wine: The Release of Smoke-Derived Volatile Phenols during Fermentation of Merlot Juice Following Grapevine Exposure to Smoke. J. Agric. Food Chem. 2008, 56, 7379–7383. [Google Scholar] [CrossRef]
- Parker, M.; Osidacz, P.; Baldock, G.A.; Hayasaka, Y.; Black, C.A.; Pardon, K.H.; Jeffery, D.W.; Geue, J.P.; Herderich, M.J.; Francis, I.L. Contribution of Several Volatile Phenols and Their Glycoconjugates to Smoke-Related Sensory Properties of Red Wine. J. Agric. Food Chem. 2012, 60, 2629–2637. [Google Scholar] [CrossRef]
- Summerson, V.; Gonzalez Viejo, C.; Pang, A.; Torrico, D.D.; Fuentes, S. Review of the Effects of Grapevine Smoke Exposure and Technologies to Assess Smoke Contamination and Taint in Grapes and Wine. Beverages 2021, 7, 7. [Google Scholar] [CrossRef]
- Kennison, K.R.; Wilkinson, K.L.; Pollnitz, A.P.; Williams, H.G.; Gibberd, M.R. Effect of Timing and Duration of Grapevine Exposure to Smoke on the Composition and Sensory Properties of Wine. Aust. J. Grape Wine Res. 2009, 15, 228–237. [Google Scholar] [CrossRef]
- Tomasino, E.; Cerrato, D.C.; Aragon, M.; Fryer, J.; Garcia, L.; Ashmore, P.L.; Collins, T.S. A Combination of Thiophenols and Volatile Phenols Cause the Ashy Flavor of Smoke Taint in Wine. Food Chem. Adv. 2023, 2, 100256. [Google Scholar] [CrossRef]
- Fudge, A.L.; Schiettecatte, M.; Ristic, R.; Hayasaka, Y.; Wilkinson, K.L. Amelioration of Smoke Taint in Wine by Treatment with Commercial Fining Agents: Amelioration of Smoke Taint in Wine. Aust. J. Grape Wine Res. 2012, 18, 302–307. [Google Scholar] [CrossRef]
- Noestheden, M.; Thiessen, K.; Dennis, E.G.; Tiet, B.; Zandberg, W.F. Quantitating Organoleptic Volatile Phenols in Smoke-Exposed Vitis Vinifera Berries. J. Agric. Food Chem. 2017, 65, 8418–8425. [Google Scholar] [CrossRef]
- Singh, R.; Bhumbla, D.K.; Keefer, R.F. Recommended Soil Sulfate-S Tests. In RECOMMENDED SOIL TESTING PROCEDURES FOR THE NORTHEASTERN UNITED STATES; 493; Cooperative Extension, University of Delaware, 2011; pp. 55–61.
- Ristic, R.; Fudge, A.L.; Pinchbeck, K.A.; De Bei, R.; Fuentes, S.; Hayasaka, Y.; Tyerman, S.D.; Wilkinson, K.L. Impact of Grapevine Exposure to Smoke on Vine Physiology and the Composition and Sensory Properties of Wine. Theor. Exp. Plant Physiol. 2016, 28, 67–83. [Google Scholar] [CrossRef]
- Jiang, W.; Parker, M.; Hayasaka, Y.; Simos, C.; Herderich, M. Compositional Changes in Grapes and Leaves as a Consequence of Smoke Exposure of Vineyards from Multiple Bushfires across a Ripening Season. Molecules 2021, 26, 3187. [Google Scholar] [CrossRef] [PubMed]
- Bilogrevic, E.; Jiang, W.; Culbert, J.; Francis, L.; Herderich, M.; Parker, M. Consumer Response to Wine Made from Smoke-Affected Grapes. OENO One 2023, 57, 417–430. [Google Scholar] [CrossRef]
- Szeto, C.; Lloyd, N.; Nicolotti, L.; Herderich, M.J.; Wilkinson, K.L. Beyond Volatile Phenols: An Untargeted Metabolomic Approach to Revealing Additional Markers of Smoke Taint in Grapevines ( Vitis Vinifera L.) Cv. Merlot. J. Agric. Food Chem. 2024, 72, 2018–2033. [Google Scholar] [CrossRef]
- Rochfort, S.; Reddy, P.; Fernanado, K.; Liu, Z.; Ezernieks, V.; Spangenberg, G. Detection of Biomarkers for Characterizing Smoke-Taint in Grapes. Food Chem. X 2024, 23, 101665. [Google Scholar] [CrossRef]
- Hayasaka, Y.; Parker, M.; Baldock, G.A.; Pardon, K.H.; Black, C.A.; Jeffery, D.W.; Herderich, M.J. Assessing the Impact of Smoke Exposure in Grapes: Development and Validation of a HPLC-MS/MS Method for the Quantitative Analysis of Smoke-Derived Phenolic Glycosides in Grapes and Wine. J. Agric. Food Chem. 2013, 61, 25–33. [Google Scholar] [CrossRef]
- Liu, J.; Zhu, X.; Ullah, N.; Tao, Y. Aroma Glycosides in Grapes and Wine. J. Food Sci. 2017, 82, 248–259. [Google Scholar] [CrossRef]
- Oberholster; Lim, L.X.; Plaza, C.M.; Perez, I.A.; Wen, Y.; Neupane, B. Grape Smoke Exposure Risk Assessment: Wine Matrix Impact on Smoke Marker Compound Smoke Expression. BIO Web Conf. 2023, 56, 02039. [CrossRef]
- Oberholster, A.; Wen, Y.; Dominguez Suarez, S.; Erdmann, J.; Cauduro Girardello, R.; Rumbaugh, A.; Neupane, B.; Brenneman, C.; Cantu, A.; Heymann, H. Investigation of Different Winemaking Protocols to Mitigate Smoke Taint Character in Wine. Molecules 2022, 27, 1732. [Google Scholar] [CrossRef] [PubMed]
- Parker, M.; Capone, D.L.; Francis, I.L.; Herderich, M.J. Aroma Precursors in Grapes and Wine: Flavor Release during Wine Production and Consumption. J. Agric. Food Chem. 2018, 66, 2281–2286. [Google Scholar] [CrossRef]
- Whitmore, B.A.; McCann, S.E.; Noestheden, M.; Dennis, E.G.; Lyons, S.M.; Durall, D.M.; Zandberg, W.F. Glycosidically-Bound Volatile Phenols Linked to Smoke Taint: Stability during Fermentation with Different Yeasts and in Finished Wine. Molecules 2021, 26, 4519. [Google Scholar] [CrossRef]
- Winterhalter, P.; Skouroumounis, G.K. Glycoconjugated Aroma Compounds: Occurrence, Role and Biotechnological Transformation. In Biotechnology of Aroma Compounds; Berger, R.G., Babel, W., Blanch, H.W., Cooney, Ch.L., Enfors, S.-O., Eriksson, K.-E.L., Fiechter, A., Klibanov, A.M., Mattiasson, B., Primrose, S.B., Rehm, H.J., Rogers, P.L., Sahm, H., Schügerl, K., Tsao, G.T., Venkat, K., Villadsen, J., Von Stockar, U., Wandrey, C., Eds.; Advances in Biochemical Engineering/Biotechnology; Springer Berlin Heidelberg: Berlin, Heidelberg, 1997; Vol. 55, pp. 73–105 ISBN 978-3-540-61482-1. [Google Scholar]
- Hayasaka, Y.; Baldock, G.A.; Parker, M.; Pardon, K.H.; Black, C.A.; Herderich, M.J.; Jeffery, D.W. Glycosylation of Smoke-Derived Volatile Phenols in Grapes as a Consequence of Grapevine Exposure to Bushfire Smoke. J. Agric. Food Chem. 2010, 58, 10989–10998. [Google Scholar] [CrossRef] [PubMed]
- Hayasaka, Y.; Dungey, K.A.; Baldock, G.A.; Kennison, K.R.; Wilkinson, K.L. Identification of a β-d-Glucopyranoside Precursor to Guaiacol in Grape Juice Following Grapevine Exposure to Smoke. Anal. Chim. Acta 2010, 660, 143–148. [Google Scholar] [CrossRef] [PubMed]
- Kang, W.; Xu, Y.; Qin, L.; Wang, Y. Effects of Different β-D-Glycosidases on Bound Aroma Compounds in Muscat Grape Determined by HS-SPME and GC-MS. J. Inst. Brew. 2010, 116, 70–77. [Google Scholar] [CrossRef]
- Coulter, A.; Baldock, G.; Parker, M.; Hayasaka, Y.; Francis, I.L.; Herderich, M. Concentration of Smoke Marker Compounds in Non-smoke-exposed Grapes and Wine in Australia. Aust. J. Grape Wine Res. 2022, 28, 459–474. [Google Scholar] [CrossRef]
- Merrell, C.P.; Arvik, T.J.; Runnebaum, R.C. Understanding Smoke Exposure Results: Pinot Noir Baseline Concentrations of Smoke Impact Markers across Five Vintages. Catal. Discov. Pract. 2021, 5, 4–11. [Google Scholar] [CrossRef]
- Yang, R.; Qian, Y.L.; Feng, Y.; Huang, L.; Magana, A.A.; Qian, M.C. Volatile Phenols in Smoke-Exposed Pinot Noir Wines - Biomarkers and Model Prediction. Am. J. Enol. Vitic. 2023, 74, 0740028. [Google Scholar] [CrossRef]
- Alcazar Magana, A.; Wright, K.; Vaswani, A.; Caruso, M.; Reed, R.L.; Bailey, C.F.; Nguyen, T.; Gray, N.E.; Soumyanath, A.; Quinn, J.; et al. Integration of Mass Spectral Fingerprinting Analysis with Precursor Ion (MS1) Quantification for the Characterisation of Botanical Extracts: Application to Extracts of Centella asiatica (L.) Urban. Phytochem. Anal. 2020, 31, 722–738. [Google Scholar] [CrossRef]
- Caffrey, A.; Lerno, L.; Rumbaugh, A.; Girardello, R.; Zweigenbaum, J.; Oberholster, A.; Ebeler, S.E. Changes in Smoke-Taint Volatile-Phenol Glycosides in Wildfire Smoke-Exposed Cabernet Sauvignon Grapes throughout Winemaking. Am. J. Enol. Vitic. 2019, 70, 373–381. [Google Scholar] [CrossRef]
- Sumner, L.W.; Amberg, A.; Barrett, D.; Beale, M.H.; Beger, R.; Daykin, C.A.; Fan, T.W.-M.; Fiehn, O.; Goodacre, R.; Griffin, J.L.; et al. Proposed Minimum Reporting Standards for Chemical Analysis: Chemical Analysis Working Group (CAWG) Metabolomics Standards Initiative (MSI). Metabolomics 2007, 3, 211–221. [Google Scholar] [CrossRef]
- Viant, M.R.; Kurland, I.J.; Jones, M.R.; Dunn, W.B. How Close Are We to Complete Annotation of Metabolomes? Curr. Opin. Chem. Biol. 2017, 36, 64–69. [Google Scholar] [CrossRef]
- Noestheden, M.; Dennis, E.G.; Romero-Montalvo, E.; DiLabio, G.A.; Zandberg, W.F. Detailed Characterization of Glycosylated Sensory-Active Volatile Phenols in Smoke-Exposed Grapes and Wine. Food Chem. 2018, 259, 147–156. [Google Scholar] [CrossRef] [PubMed]
- Xia, J.; Psychogios, N.; Young, N.; Wishart, D.S. MetaboAnalyst: A Web Server for Metabolomic Data Analysis and Interpretation. Nucleic Acids Res. 2009, 37, W652–W660. [Google Scholar] [CrossRef] [PubMed]
- Wang, X.; Yang, S.; He, J.; Chen, L.; Zhang, J.; Jin, Y.; Zhou, J.; Zhang, Y. A Green Triple-Locked Strategy Based on Volatile-Compound Imaging, Chemometrics, and Markers to Discriminate Winter Honey and Sapium Honey Using Headspace Gas Chromatography-Ion Mobility Spectrometry. Food Res. Int. 2019, 119, 960–967. [Google Scholar] [CrossRef] [PubMed]
- Castejón-Musulén, O.; Lopez, R.; Ontañón, I.; Ferreira, V. A Two-Run Heart-Cut Multidimensional Gas Chromatography Method Using Flame Ionization and Mass Spectrometry for Automated and Robust Determination of Nearly Complete Wine Aroma-Volatile Profiles. J. Chromatogr. A 2024, 1713, 464501. [Google Scholar] [CrossRef]
- Pang, Z.; Chong, J.; Zhou, G.; de Lima Morais, D.A.; Chang, L.; Barrette, M.; Gauthier, C.; Jacques, P.-É.; Li, S.; Xia, J. MetaboAnalyst 5.0: Narrowing the Gap between Raw Spectra and Functional Insights. Nucleic Acids Res. 2021, 49, W388–W396. [Google Scholar] [CrossRef]
Figure 3.
Unsupervised analysis for VPs and VP-glycosides. Hierarchical clustering heatmaps (a, c) and dendrograms (b, d) were constructed based on VPs concentration (µg/L) and the relative abundance of VP-glycosides, respectively. Each colored cell on the map corresponds to a wine sample. Samples 1-14 correspond to non-smoke-exposed wines (Control), while 15-35 correspond to smoke-exposed wines.
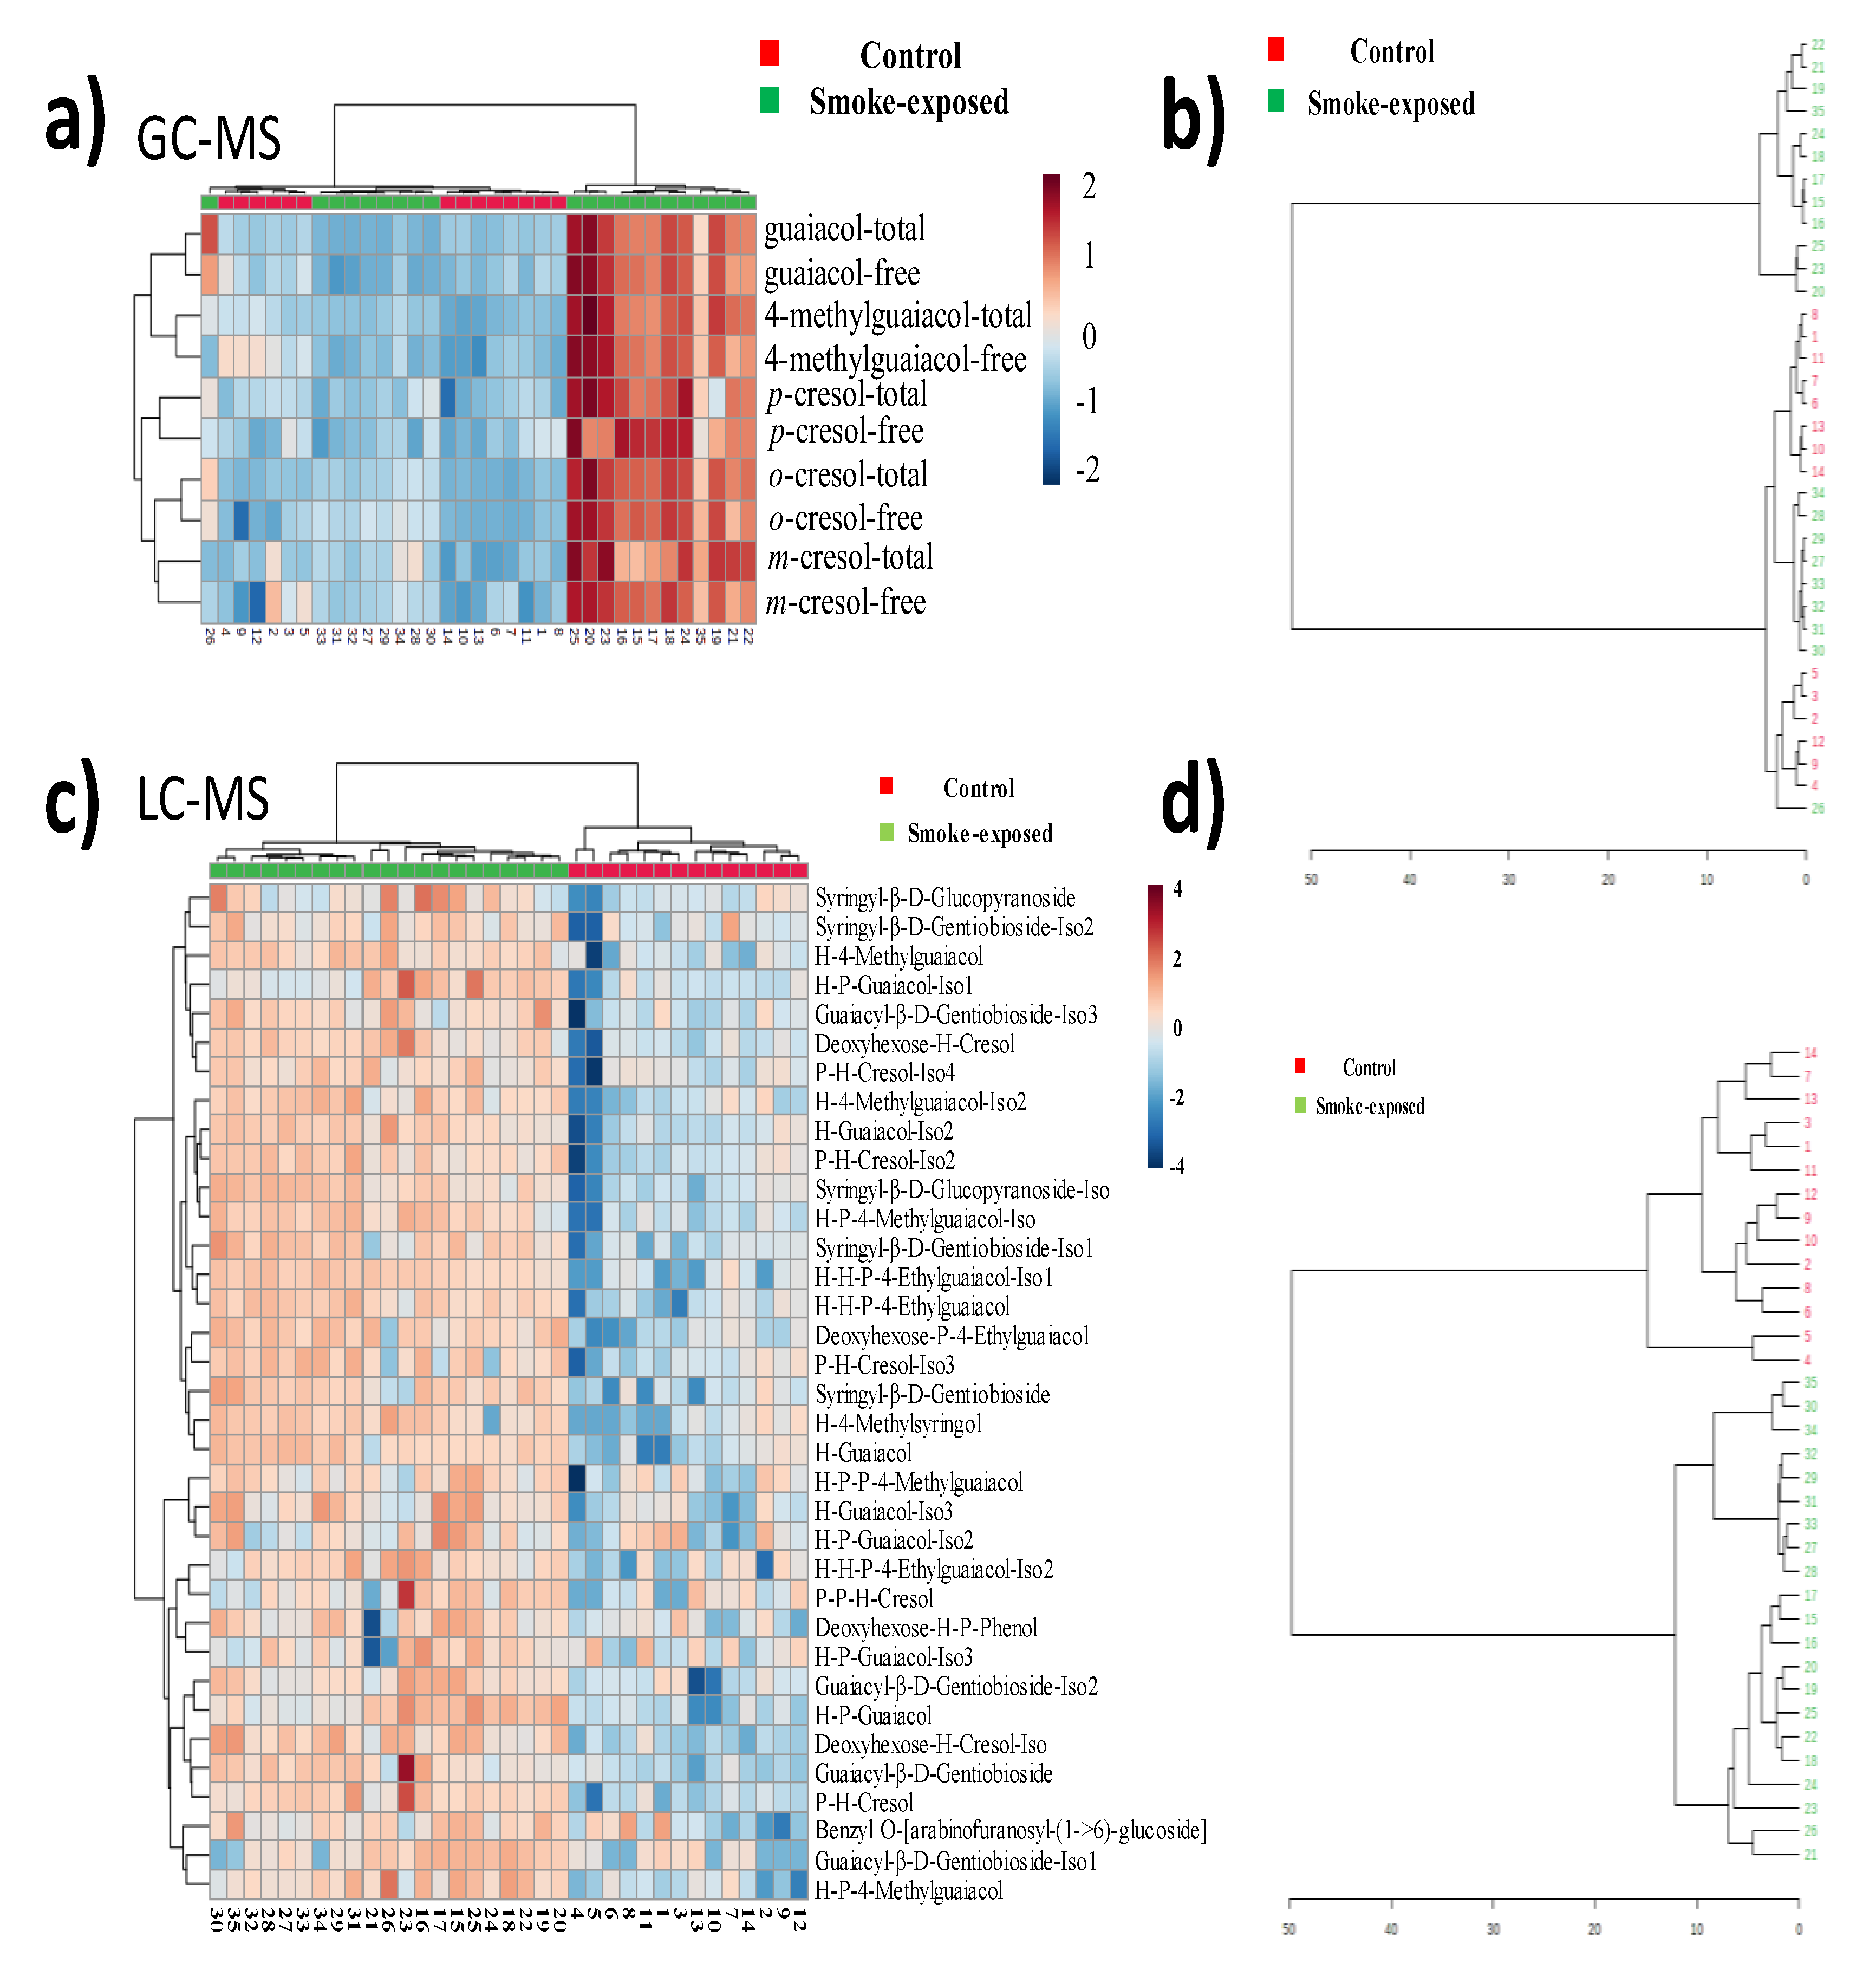
Figure 4.
Unsupervised principal component analysis (PCA) for VPs and VP-glycosides. a) Score plot- PCA for free VPs in non-smoke-exposed and smoke-exposed wines (Control). Explained variances are shown in the corresponding axes. b) Biplot between the two selected PCs. Each dot corresponds to a wine sample. Sample numbers 1 to 14 correspond to non-smoke-exposed wines (Control), while 15 to 35 correspond to smoke-exposed wines. c) Unsupervised principal component analysis for VP-glycosides. Each dot corresponds to a wine sample. PC1 and PCA2 describe 68% of the variation among samples. PCA was computed in Progenesis QI (V2.3).
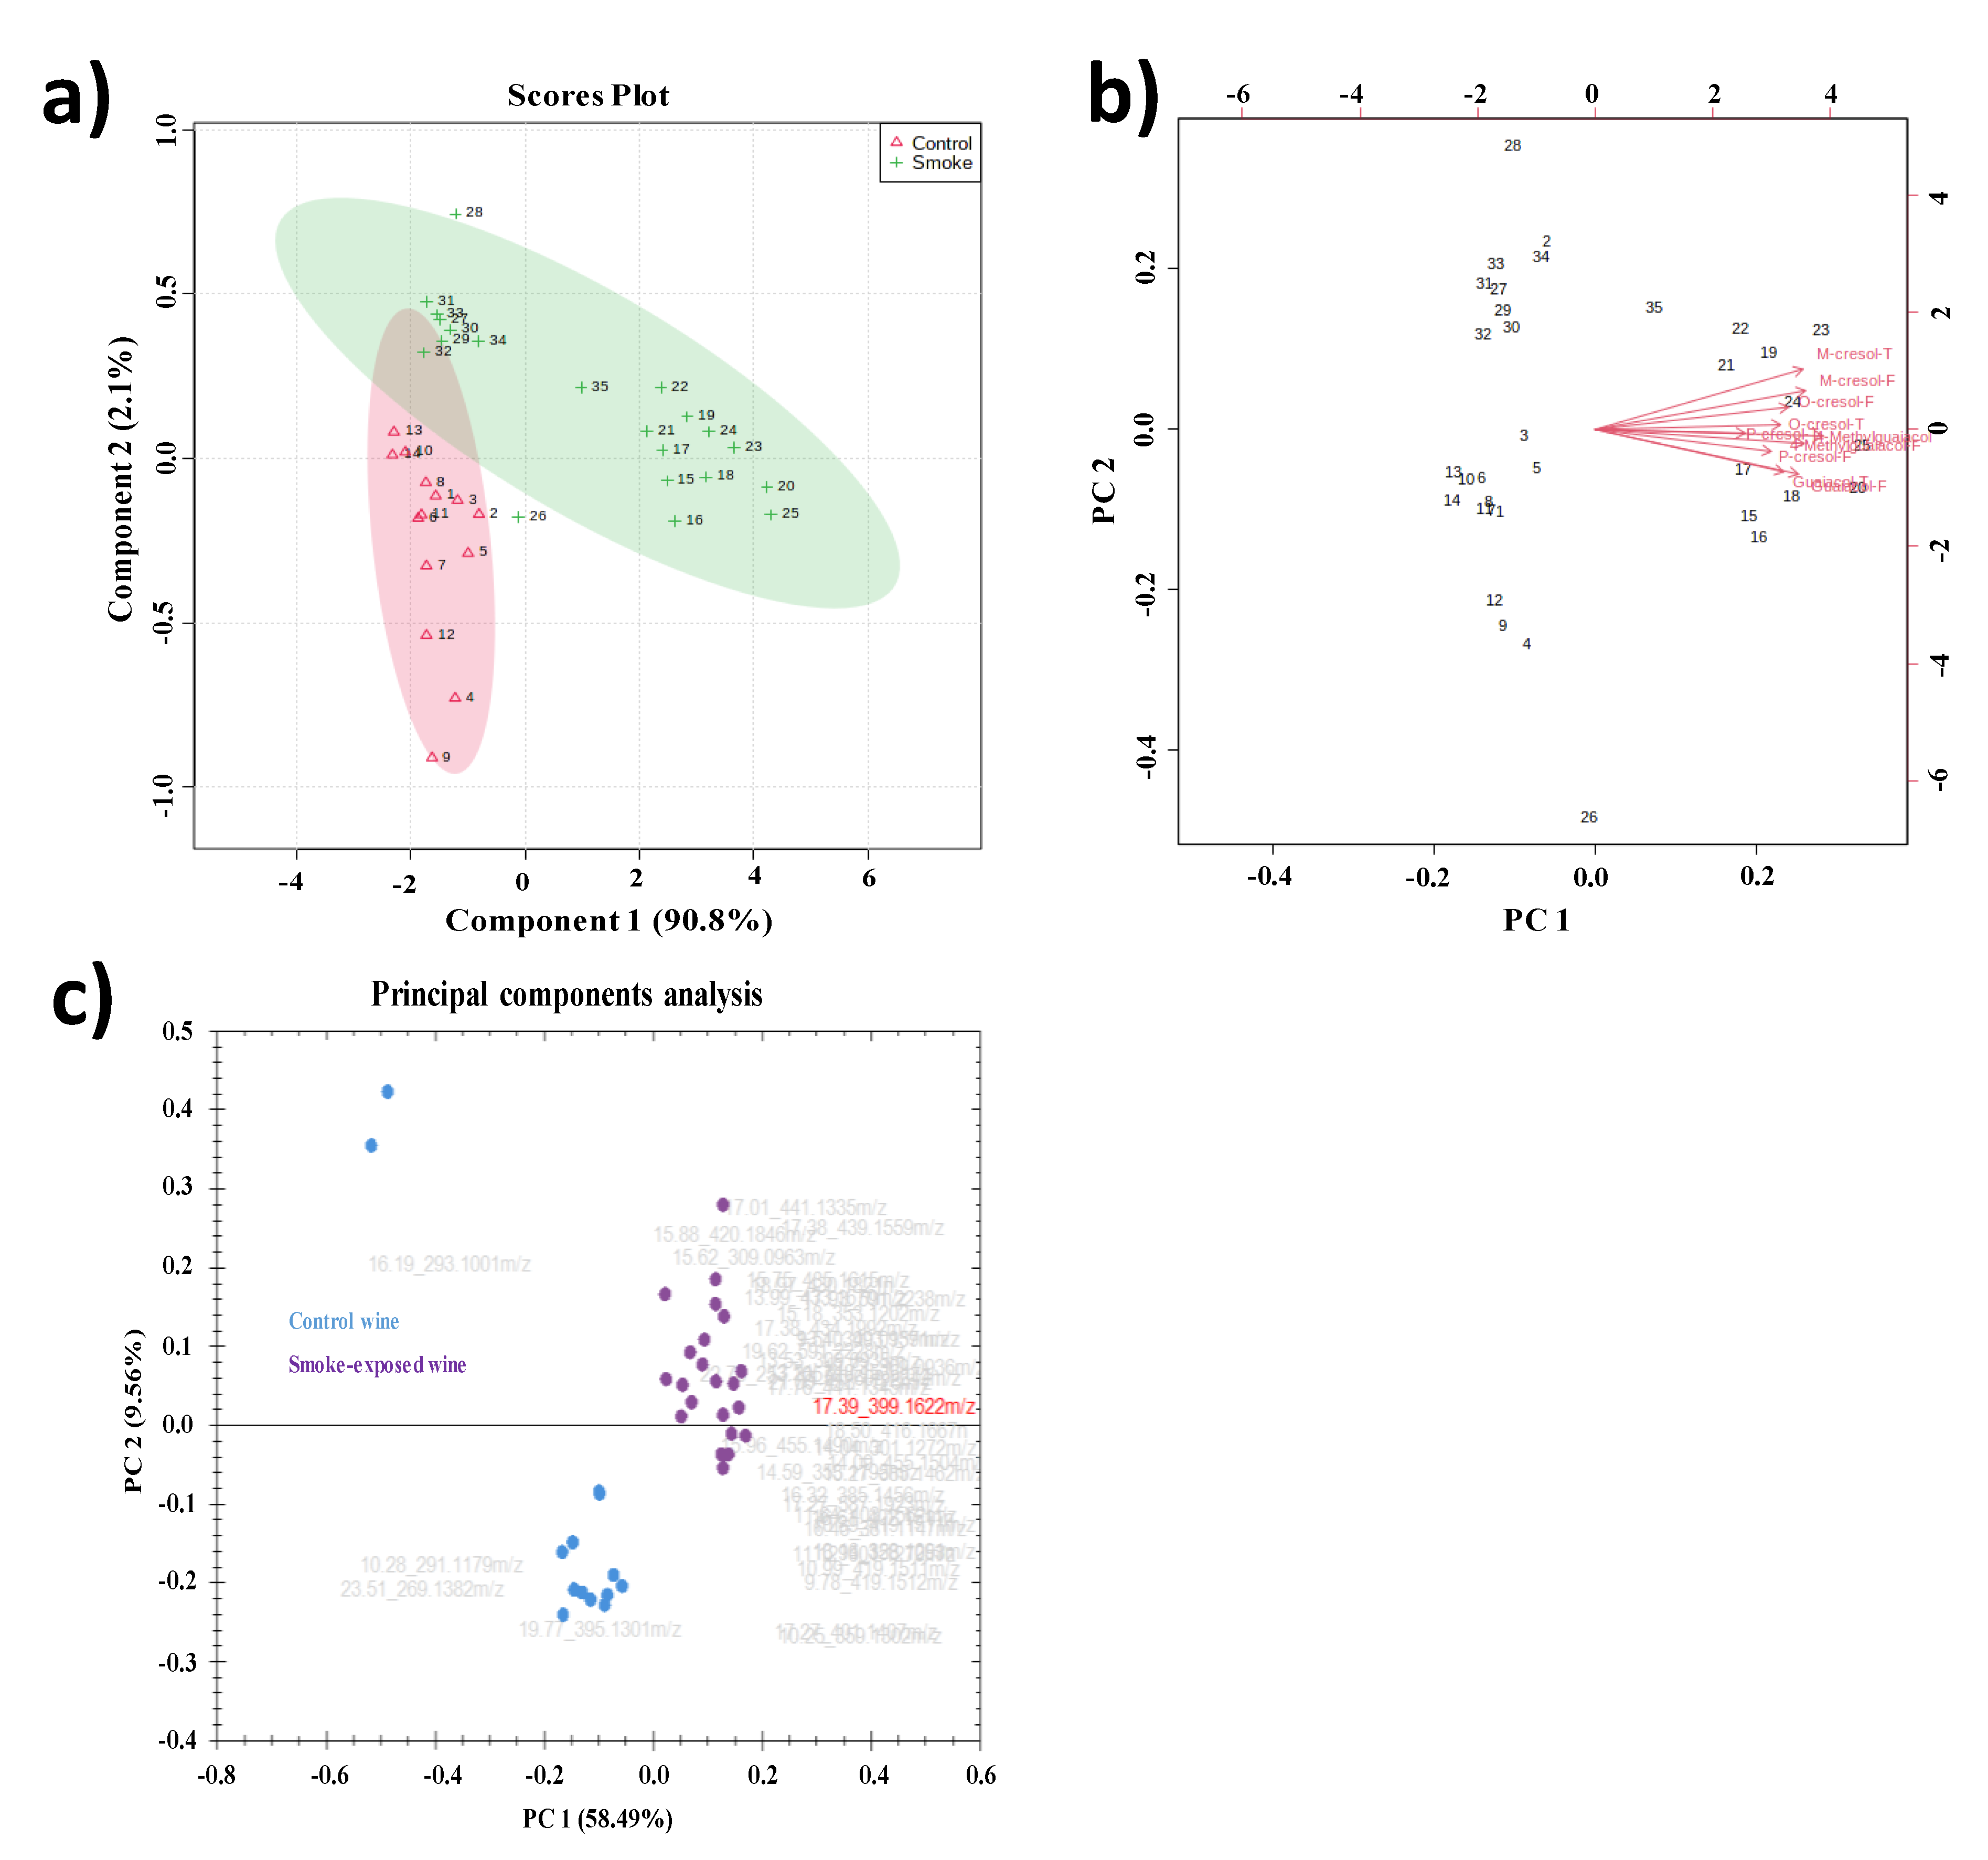
Figure 5.
The heatmap of 35 tentative annotated VP-glycosides with VPs by Pearson’s correlation analysis. The darker the red color, the stronger the correlation. All correlations were positive. H-hexose, P-pentose.
Figure 5.
The heatmap of 35 tentative annotated VP-glycosides with VPs by Pearson’s correlation analysis. The darker the red color, the stronger the correlation. All correlations were positive. H-hexose, P-pentose.
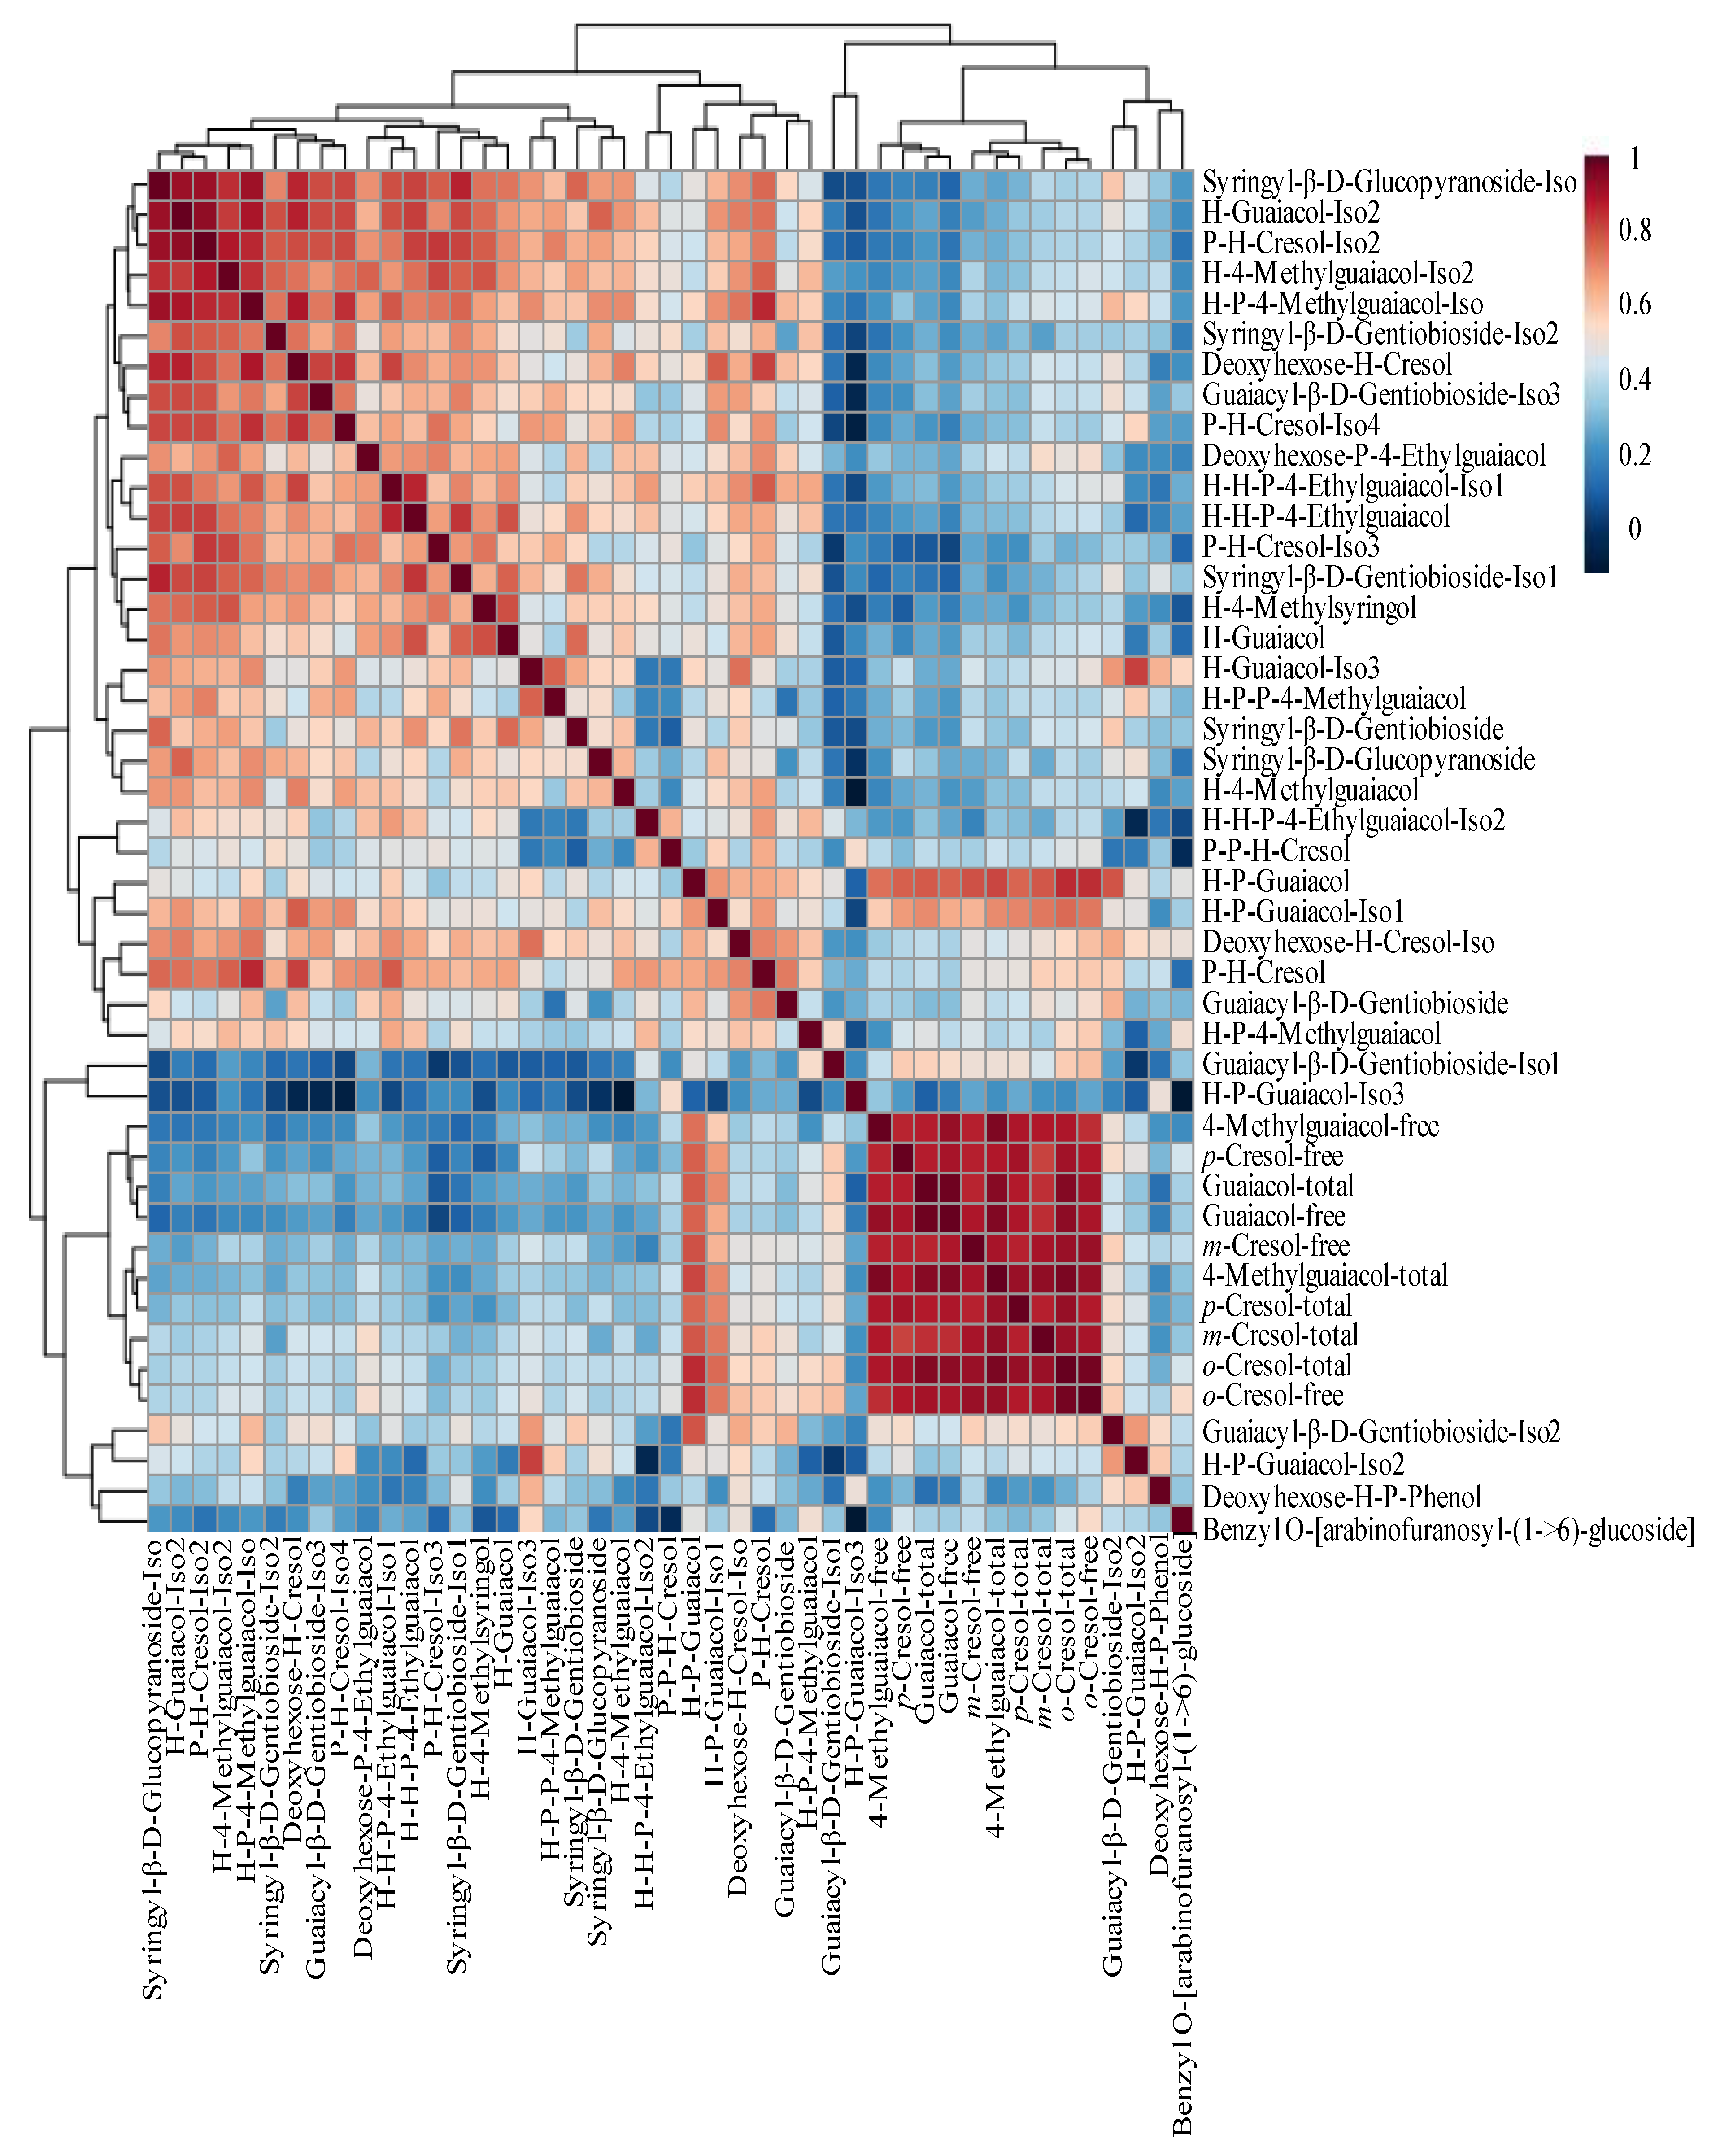

Table 1.
Univariate analysis parameters of top 15 volatile phenol glycosides identified from non-smoke-exposed and smoke-exposed wines.
Table 1.
Univariate analysis parameters of top 15 volatile phenol glycosides identified from non-smoke-exposed and smoke-exposed wines.
| Tentative glycosides | Fold-change (FC) | Raw p-value | |
|---|---|---|---|
| 1 | H-P-4-Methylguaiacol-Iso | 4.58 | 2.37×10⁻⁸ |
| 2 | Deoxyhexose-P-4-Ethylguaiacol | 2.88 | 2.59×10⁻⁸ |
| 3 | Deoxyhexose-H-Cresol-Iso | 2.97 | 3.02×10⁻⁸ |
| 4 | H-H-P-4-Ethylguaiacol | 7.39 | 6.61×10⁻⁸ |
| 5 | Syringyl-β-D-Glucopyranoside-Iso | 4.08 | 9.50×10⁻⁸ |
| 6 | H-4-Methylguaiacol | 2.69 | 1.26×10⁻⁷ |
| 7 | H-4-Methylguaiacol-Iso2 | 2.11 | 2.52×10⁻⁷ |
| 8 | H-Guaiacol | 7.88 | 3.95×10⁻⁷ |
| 9 | P-H-Cresol-Iso2 | 3.90 | 5.13×10⁻⁷ |
| 10 | Syringyl-β-D-Gentiobioside-Iso1 | 2.60 | 8.96×10⁻⁷ |
| 11 | H-H-P-4-Ethylguaiacol-Iso1 | 31.88 | 2.21×10⁻⁵ |
| 12 | P-H-Cresol-Iso3 | 3.52 | 3.23×10⁻⁵ |
| 13 | H-P-4-Methylguaiacol | 2.66 | 4.37×10⁻⁵ |
| 14 | Deoxyhexose-H-Cresol | 3.13 | 5.73×10⁻⁵ |
| 15 | Syringyl-β-D-Gentiobioside | 5.65 | 8.64×10⁻⁵ |
Abbreviations: H-Hexose, P-Pentose, Iso-Isomer.
Disclaimer/Publisher’s Note: The statements, opinions and data contained in all publications are solely those of the individual author(s) and contributor(s) and not of MDPI and/or the editor(s). MDPI and/or the editor(s) disclaim responsibility for any injury to people or property resulting from any ideas, methods, instructions or products referred to in the content. |
© 2025 by the authors. Licensee MDPI, Basel, Switzerland. This article is an open access article distributed under the terms and conditions of the Creative Commons Attribution (CC BY) license (http://creativecommons.org/licenses/by/4.0/).
Copyright: This open access article is published under a Creative Commons CC BY 4.0 license, which permit the free download, distribution, and reuse, provided that the author and preprint are cited in any reuse.


