
Submitted:
18 May 2025
Posted:
19 May 2025
You are already at the latest version
Abstract
A pivotal role of metabolic reprogramming in urothelial carcinoma is hallmarked by the dependence of two-fold faster proliferation of urothelial carcinoma cell line T24 than benign cell line, TRT-HU1 on five-fold higher glucose (basal) 16mM vs 3mM in McCoy’s 5A media and Keratinocyte Serum Free media, respectively. Here, we report that an additional 10% increase to 17.6mM and 3.3mM glucose significantly shortens the doubling time by 3h and 1h for T24 and TRT-HUI, respectively. T24 grown at 17.6mM glucose lowers the confocal localization fatty acid mimetic, Betulinic Acid (BA conjugated to FITC (BA-FITC) with Mito-tracker red (mitochondrial marker), which doubles the IC50 of BA and BA-FITC by lowering cell cycle arrest in G0/G1 phase from 54.2% to 43.8% and caspase-3/7 mediated apoptosis and by reversing caspase 3, p53, PTEN, GAPDH and XIAP gene expression induced by BA in T24 grown at basal glucose (16mM). Besides slowing the glycogen and pH decline of T24 at basal glucose, BA exhibited eight-fold higher IC50 than Mitomycin C (MC) on TRT-HU1 by not mimicking the glucose-insensitive cycle arrest and apoptosis of MC. Overall, glucose-sensitivity of lower IC50 of BA-FITC and BA on T24 vs TRT-HU1 supports the safety of BA conjugates for theragnostic purposes.
Keywords:
Betulinic Acid
; Mitomycin C
; metabolic reprogramming
; urothelial carcinoma
; theragnostic
1. Introduction
The pivotal role of metabolic reprogramming in the onset and rapid recurrence of urothe lial carcinoma [1,2,3] is affirmed by the genomics of resected tumor and by metabolomics of patient’s urine. The overexpression of genes driving glycolysis [1,2,3,4,5] and fatty acid metabolism in tumor [6] predicted the urinary detection of 12-19 metabolites [7] and glycogen depletion [8] coupled with fatty acid accumulation in tumor cells shed into urine by patients, converse of the metabolomics for normal urothelial cells shed into the urine.
The multi-omics of resected tumors are attested by the dependence of two-fold faster proliferation [9] of urothelial carcinoma cell line T24 relative to benign urothelial cell line TRT-HU1 on five-fold higher glucose levels of 16mM and 3mM in McCoy’s 5A media and Keratinocyte Serum Free media, respectively (basal) (Figure 1). Here, we hypothesized that if rapid proliferation of urothelial carcinoma (T24) is fueled by fatty acid synthesis and oxidation, then a 10% increase in glucose from basal levels, would decrease the intracellular accumulation of the fatty acid mimetic, Betulinic Acid (BA) as well opposes the pharmacological effect of BA on proliferation, cell cycle arrest and apoptosis. We arrived at the paradigm of 10% increase in glucose from basal levels to mimic the effect of hyperglycemia on lower sensitivity of antibody drug conjugates, Enfortumab vedotin in bladder cancer [10] and higher risk of urothelial carcinoma in diabetic patients [11,12]. However, the confounding effect of hypertonic stress on cell viability[13] discouraged any further increase in glucose above 10% from basal levels.
Past research highlighted the anticancer effect of BA at basal glucose levels via depolarization of mitochondrial membrane potential [14,15,16,17,18] and induction of apoptosis via caspase dependent cell death and cell cycle arrest [18,19,20,21]. The anticancer activity of topical BA on horse melanoma [22] even merited the registration of a pilot clinical study (NCT00346502). However, the role of metabolic reprogramming in the anticancer action of BA and in higher uptake of BA by cancer cells is not known. While prior research supports the premise of BA conjugates [14] as a theragnostic, BA is also one of the many active ingredients [23] in the anti-inflammatory Oleogel S-10 approved recently in Europe for the treatment of Dystrophic Epidermolysis bullosa [24] and urothelial carcinoma is also amenable to topical treatment [25].
To test our hypothesis, we chemically conjugated BA [14] with fluorescein isothiocyanate (FITC) (Figure S3-supplementary) for determining the confocal co-localization of BA-FITC with Mito-tracker Red labelled mitochondria in T24 and TRT-HU1 cell lines of human urothelium. We determined the cytotoxicity and safety of BA relative to the standard chemotherapeutic drug, Mitomycin C (MC) [25] on T24 and TRT-HU1 cell lines grown in McCoy’s 5A media and Keratinocyte Serum Free media containing 16mM and 3mM glucose (basal), respectively and 10% increase from respective basal levels. We compared the effect of BA and MC on cell cycle arrest and caspase-3/7 mediated apoptosis and only investigated the glucose-sensitive BA by determining the effect of BA on gene expressions involved in apoptosis [15,16,18,19,20], glycolysis, glycogenolysis [1,2,3,4,5,8] and pH decline amidst glucose scarcity [26] (Figure 1).
2. Results
2.1. Effect of 10% Glucose Increase on Doubling Time of Cell Lines
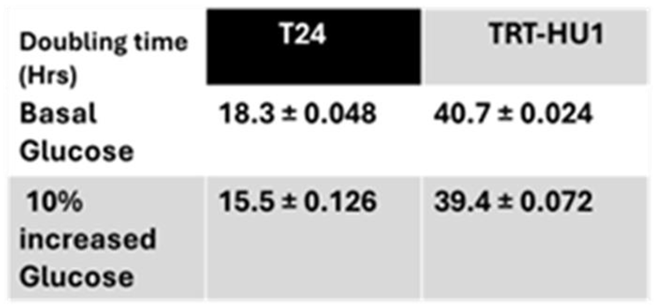
The growth of urothelial carcinoma cell line T24 in McCoy’s 5a Medium containing 16mM of glucose reproduced the previously reported faster doubling time of 19h, [9] which is more than two-fold faster than the 40h doubling time of non-neoplastic human bladder cell lines TRT-HU1 grown in Keratinocyte Serum Free media containing 3mM glucose.(Table 1).
It is self-evident that the two-fold faster proliferation of T24 is fueled by Warburg effect, dependent on > five-fold higher glucose than TRT-HU1 (Figure 1) to sustain a higher rate of glycolysis. The role of Warburg effect in faster T24 proliferation is further affirmed by a further shortening of the doubling time from 18.3±0.048h to 15.5±0.126h brought about by a mere 10% rise in glucose levels from 16mM to 17.6mM whereas a proportional 10% increase in glucose from 3mM to 3.3mM for TRT-HU1 only shortened the doubling time from 40.7±0.024h to 39.4±0.072h.
2.2. Effect of 10% Glucose Increase From Basal Levels on MC Evoked Cytotoxicity, Cell Cycle Arrest and Apoptosis
MTT results plotted in Figure 2 display that MC exhibited comparable cytotoxicity on normal TRT-HU1 and neoplastic urothelial cancer cell T24 with IC50 of 3.7-4.3µM at basal glucose (Figure 2A), and 10% increase in glucose from basal levels did not elicit any change in IC50. The glucose insensitive, cytotoxic actions of MC are also confirmed by comparable induction of caspase 3/7 apoptotic activity (Figure 2B) and non-selective cell cycle arrest in G0/G1 phase (Figure 2C) of T24 and TRT-HU1 cells at basal glucose and at 10% increase in glucose from basal levels of 16mM and 3mM, respectively. Cell cycle arrest was determined after cell synchronization by double thymidine block of 18 h followed by continuous exposure to MC for 12h.
2.3. Effect of 10% Glucose Increase From Basal Levels on BA Evoked Cytotoxicity, Cell Cycle Arrest and Apoptosis
Unlike MC, BA evoked concentration dependent higher cytotoxicity in T24 cells than in TRT-HU1 cells and BA IC50 on T24 was significantly lower (17.9±0.268µM) (Figure 3A) than IC50 (34.5±1.165 µM; p ≤0.01) on TRT-HU1 grown at respective basal levels of glucose. The difference in IC50 is suggestive of relative resistance of normal urothelial cells to BA and potentially improved safety profile of BA [14] as a potential theragnostic. A rightward shift in BA IC50 from18.3 ±0.048μM to 35.3 ±0.386μM in T24 cells grown at 10% increased glucose from basal levels was associated with significant reduction, p ≤0.05 in caspase-3/7 apoptosis (Figure 3B) and markedly lower percentage of cell cycle arrest (Figure 3C). While BA arrested a higher percentage of T24 cells than TRT-HUI (54.2% vs 41.5%) at basal glucose, 10% increase in glucose from basal levels brought parity, 43.8% vs 46.8%.
2.4. Combined and Isolated Effect of BA and 10% Glucose Increase on Gene Expression
While glucose insensitive anticancer actions of MC are consistent with published findings, glucose sensitive anticancer actions of BA warranted further investigations without using MC as control. The increased caspase dependent apoptosis of BA treated T24 cells at basal glucose (Figure 3B) was accompanied by the up-regulation of Caspase 3, p53, Phosphatase and Tensin Homolog deleted on Chromosome 10 (PTEN) and Glyceraldehyde-3-Phosphate Dehydrogenase (GAPDH) together with the downregulation of anti-apoptotic gene, X-linked inhibitor of apoptosis protein (XIAP) at basal glucose (Figure 4A). Because BA induced upregulation of gene expression in T24 cells grown at basal glucose is reversible with 10% increase in glucose from basal levels (Figure 4B) we inferred that BA targets glucose scarcity induced metabolic reprogramming of T24 cells. Meanwhile, expression of these genes in TRT-HU1 was not altered by 10% increase in glucose from basal levels (Figure 4C-D)
2.5. Effect of 10% Glucose Increase on Mitochondrial Localization and Toxicity of Betulinic Acid Conjugated to FITC
We examined the mitochondrial localization of Betulinic Acid (BA) conjugated to FITC (BA-FITC) (Figure 5) [14] by confocal microscopy and compared the colocalization of green fluorescence emitted by BA-FITC with the red fluorescence of Mito Tracker (mitochondrial marker) in T24 and TRT-HU1 cells. BA-FITC exhibited higher intracellular uptake and mitochondrial localization in T24 relative to TRT-HU1 grown at basal glucose levels. The mitochondria as a site for the antiproliferative action of BA is affirmed by the decline in Pearson’s correlation coefficient (Supplementary Figure S2) from 0.91 to 0.75 for colocalization in T24 cells grown at basal level of 16mM (Figure 5A) and at 17.6mM (Figure 5B), respectively. Lower mitochondrial localization of BA-FITC at higher glucose resulted in mor than two-fold higher IC50 of BA-FITC from 13.5±0.054(µM) (Figure 5C) to 31.4±0.324(µM) (Figure 5D) for T24 cells, whereas the increase in IC50 in TRT-HU1 was relatively minor compared to T24.
2.6. Effect of BA on Glycogen and pH Decline Amidst Glucose Scarcity
Here, we checked whether the glycogen depletion found in tumor cells shed into urine by patients [8] is reproduced by T24 cells exposed briefly to glucose scarcity after growing for 8h at basal glucose (Figure 6A, 7A), or at 10% increased glucose from basal (Figure 6B, 7B). The 8h time point is the midpoint for the doubling time at 10% increased glucose (Table.1). We replaced buffered growth media of T24 and TRT-HU1 cells with unbuffered isotonic solution of pH 7.4 for creating glucose scarce conditions for glycogen assay and for interrogating the effect of glucose scarcity on lactic acid production in bladder cancer cells. The lack of any temporal change in pH of isotonic unbuffered solution at incubation condition of 37˚C and 5% CO2 during the duration of assay eliminated any confounding factors in following data interpretation. Compared to assay after cell growth in basal glucose (Figure 6A, Figure 7A), relatively faster proliferation (Table.1) of T24 at 10% increased glucose resulted in a steeper decline of glycogen content (Figure 6B) and of pH (Figure 7B) in T24 cells relative to TRT-HU1 and T24 cells mimicked glycogen decline reported in tumor cells shed into urine.
A slower decline of glycogen (Figure 6C-D) and of pH (Figure 7C-D) in BA treated cells stems from combined effect of BA evoked cell cycle arrest (Figure 3B) reducing proliferation amidst glucose scarcity and mitochondrial localization of BA (Figure 5A-B)- fatty acid mimetic- inhibiting fatty acid synthesis from glycogen to fuel faster T24 proliferation amidst glucose scarcity.
3. Discussion
A pivotal role of metabolic reprogramming in carcinogenesis [1,2,3,4,5] is substantiated by the significant decrease in the doubling time of T24 cells growing at 10% increase in glucose from the basal level of 16mM in commercially available McCoy’s 5A media. The glucose sensitive localization of BA-FITC, a fatty acid mimetic, in the mitochondria of T24 cells corroborates fatty acid accumulation [8,27,28] in cancer cells shed into urine by urothelial carcinoma patients. Moreover, the fatty acid accumulation coupled with glycogen depletion in cancer cells aligns with the aberrant expression of glycolysis genes in resected tumors aligns with urine metabolomics [7]. Higher lethality of BA-FITC than of BA on T24 cells mirrors the past results of BA conjugated bis-arylidene oxindole [14] and underlies that BA conjugation increases the lethality of polar dyes FITC, towards cancer cells compared to BA alone.
Unlike glucose insensitive intercalation of MC with nuclear DNA [29], we found that the glucose sensitive mitochondrial localization of BA is deterministic in BA evoked cell cycle arrest and caspase-3/7 mediated apoptosis [15,18,23]. We analyzed the effect of MC and BA on cell cycle after cell synchronization via double thymidine block, which arrests the cells at G1 phase. Upon release of thymidine block, the G0/G1 phase lasts 9-10 h, nearly the midpoint of the doubling time of 18 h for T24 cells. The caveats of doubling time and cell synchronization are relevant in interpreting BA evoked cell cycle arrest in G0/G1 phase as opposed to arrest in S or G2/M phase [20] seen in other cancer cell lines hallmarked by different doubling times. As opposed to the arrest of nearly an identical percentage of T24 and TRT-HU1 cells by MC at basal and at 10% increased glucose, BA arrested a higher percentage of T24 cells grown at basal glucose than TRT-HUI cells in G0/G1 phase.
While the mechanism of action and gene expression involved in the anticancer effect of MC is well known, the same is not the case for BA. Therefore, we probed whether BA selectively targets metabolic reprogramming of urothelial carcinoma in causing minimal harm to normal urothelial cells, TRT-HU1 [16]. T24 cells grown at 10% increased glucose not only successfully resisted the mitochondrial localization of FITC conjugated BA but also reversed the BA induced gene expression [19]. A lower mitochondrial localization of BA-FITC in T24 grown at 17.6mM glucose resulted in two-fold higher IC50 than the IC50 of BA-FITC measured in T24 cells grown at 16mM glucose. The glucose sensitive localization of BA-FITC in mitochondria of T24 cells is consistent with the past reports on BA depolarizing the mitochondrial potential of cancer cells, and inhibiting topoisomerase 1B, involved in mitochondrial translation and carcinogenesis [20].
T24 cells grown at 17.6mM glucose, mere 10% higher than basal level of 16mM recapitulated the glycogen depletion [8] noted in tumor cells isolated from urine of patients, likely resulting from glycogenolysis for fatty acid synthesis, decreased glycogenesis [30] and oxidative phosphorylation [26]. To assess the effect of BA on glycogen and pH decline amidst glucose scarcity, we replaced the buffered growth media containing 16mM or 17.6mM glucose with unbuffered isotonic solution at pH 7.4 after cells had reached their log growth phase in 8h. The absence of the buffering effect from the bicarbonate buffer in the isotonic solution enables detection of pH decline ensuing from rapid proliferation amidst glucose scarcity. BA evoked cell cycle arrest [18,31,32,33] in 54.2% of T24 cell grown at basal glucose sheds light on slower decline in pH and glycogen content amidst glucose scarce conditions for 3h [34]. Thus, innately faster proliferation of T24 cells at basal glucose levels of 16mM is fueled by “Warburg effect” [26,27,35] hallmarked by glycogenolysis [30], accelerated glycolysis, faster formation of pyruvate [27], and lactate conversion [27,28], which lowers pH of the extracellular space [36]. Hence, we expected rapid proliferation of T24 cells amidst glucose scarcity to enhance lactic acid production, raise assembly and export of acid equivalents into extracellular space [36]. Importantly, the rationale for tumor detection by pH-sensitive Magnetic Resonance Imaging (MRI) probes [37,38] and by pH-sensitive fluorescent probes is dependent on acidic pH of cancer cells due to lactate production.
Based on our findings, we reason that cancer cells internalizing Betulinic acid, a fatty acid mimetic, is likely to inhibit enzymes involved in de novo synthesis of fatty acids by pentose phosphate pathway amidst glucose scarcity, which warrants further investigation in future studies. Accordingly, we inferred that lower IC50 of BA as well as BA-FITC in T24 cells [16] grown at basal glucose is dependent on the glucose scarcity dependent upregulation of pro-apoptotic genes: Caspase 3, p53, PTEN and the downregulation of anti- apoptotic XIAP [39] gene along with metabolic marker GAPDH. The caspase 3/7 apoptotic assay substantiated 10% increase in glucose reverses the Caspase 3 upregulation induced by BA at basal levels.
A faster proliferation of T24 cells with 10% increase from basal glucose also corroborates the higher risk of urothelial carcinoma in diabetic patients[11,12] and the arrest of carcinogenesis with drugs that inhibits glycolysis [1,2,3,4,5]. A dramatic rise in IC50 of BA and BA-FITC on T24 cells grown at 17.6mM glucose mimics the lower sensitivity of diabetic bladder cancer patients to antibody drug conjugates, Enfortumab vedotin [10], which was ascribed to the lactate overproduction in presence of hyperglycemia. We could also draw an intriguing parallel between the decline in the mitochondrial localization of FITC tagged BA in T24 cells grown at 10% increased glucose and reduced tumor uptake of 2- Fluoro-2-deoxy-D-glucose (2-FDG) in PET scan performed without lowering the blood glucose levels [40]. We posit that any potential impairment of BA action by hyperglycemia can be averted by combining BA with newer Glucagon-like peptide-1 receptor (GLP-1R) agonists [41]. Likewise, the influence of hyperglycemia in PET scan of diabetic cancer patients [42] can be mitigated by the acceleration of glucosuria [43] with the use of sodium-glucose co-transporter-2(SGLT-2) inhibitors which may incur hypoglycemia risk and retrospective studies on diabetic bladder cancer patients treated with SGLT-2 inhibitors [44] can answer whether the high risk of urothelial carcinoma in diabetic patients stems from hyperglycemia or glucosuria. Interestingly, BA induced GAPDH upregulation in T24 cancer cells [9] may offer a potential alternative mechanism for raising FDG uptake into tumor without triggering the hypoglycemia risk [40]. Overall, our findings demonstrate that the anticancer action of BA is dependent on metabolic reprogramming of cancer cells.
4. Materials and Methods
4.1. Materials
Betulinic Acid (Catalog no. B8936; 456.7 Daltons), Mitomycin C (Catalog no. M4287; 334.3 Daltons) and fluorescein isothiocyanate (FITC) (Catalog no. 46950; 389.38 Daltons) were procured from Sigma Aldrich whereas Mito-tracker red (Catalog no. M22425) was procured from Invitrogen. The conjugation of Betulinic acid with FITC was confirmed by the rise in molecular weight (supplementary data). TRT-HU1 (Catalog no. CVCL_M720) and Keratinocyte Serum Free media (Catalog no.10724011) were procured from Cellosaurus and Gibco, respectively whereas T24 (Catalog no. HTB-4) and McCoy’s 5A media (Catalog no.16600082) were purchased from ATCC and Gibco, respectively. Thymidine (Catalog no. T1895) and Propidium Iodide (Catalog no. 81845) for cell synchronization in cell cycle analysis were procured from Sigma-Aldrich. Caspase3/7 assay kit (Catalog no. C10430) was procured from Invitrogen.
4.2. Cell Culture
Urothelial carcinoma T24 cells and non-cancerous human urothelial TRT-HU1 were grown in respective media supplemented with 10% fetal bovine serum (FBS) at 37˚C in a humidified 5% CO2 atmosphere. TRT-HU1- KSFM Medium was supplemented with Epidermal Growth Factor (EGF) and Bovine Pituitary Extract (Invitrogen). Cells were used within 5 passages after initial thawing. Basal and 10% increased glucose levels in media for T24 cells were 16mM and 17.6mM, respectively whereas basal and 10% increased glucose for TRT-HU1 were 3mM and 3.3mM, respectively. Doubling time was measured after first two passages using the formula, [ T × (ln2)] / [ ln (Xe / Xb)], where T = Time in hrs., Xe is number of cells at the end and Xb is the number of cells in the beginning. Hemocytometer was used for cell counting.
4.3. Cell Viability Assay (MTT)
After two passages, 5,000 cells (T24 and TRT-HU1) were plated in each well of 96 well plates and incubated overnight before 18h exposure to increasing concentrations of BA or MC and concentration reducing cell viability by 50%, (IC50) was determined by plotting MTT assay readings taken at 570nm using TECAN Spark 20M spectrophotometer.
4.4. Cell Cycle Analysis After Cell Synchronization by Double Thymidine Block
T24 and TRT-HU1 cells were grown in T25 flasks in basal and at 10% increased glucose from basal until confluency. Both the cell lines were sub-cultured in 1:3 flasks and incubated overnight at 37ºC and then subjected to double thymidine (2mM) block for 18 h each. After first block, cells were washed with 1x PBS after removing thymidine and then allowed to grow for 9h on fresh pre warmed media (basal and 10% increased) before the second thymidine block for 18 h. After again removing thymidine, cells were treated at respective IC50 of BA (20µM) and MC (4µM) for 12 h and analyzed by propidium iodide method using BD Accuri C6 plus flow cytometer, BD, USA.
4.5. Caspase 3/7 Apoptotic Assay
Cells were plated as described in MTT assay. Cells were then either left untreated or treated with BA (20µM), and MC (4µM) for 12 h using camptothecin (5µM) as positive control. Caspase 3/7 assay was performed according to manufacturer’s protocol and the fluorescence intensity was measured at excitation/emission wavelength of 590/610 nm.
4.6. Quantitative PCR
Untreated T24 and TRT-HU1 cells or cells treated with BA (20µM) for 12 h were washed with 1X PBS before lysing with 1 ml Trizol (Invitrogen) for total RNA extraction, as per manufacturer’s instructions. RNA purity and concentration was determined using nanodrop 2000 (Thermofisher Scientific, USA). cDNA was created using the High-Capacity cDNA Reverse Transcription Kit from Applied Biosystems (now Invitrogen) with 1 μg of total RNA. PCR was performed with a HotStarTaq Master Mix Kit (Qiagen, Valencia, CA, U) using sequence specific primers for the Glyceraldehyde-3-Phosphate Dehydrogenase (GAPDH), Caspase 3, p53, Phosphatase and Tensin Homolog deleted on Chromosome 10 (PTEN) and, X-linked inhibitor of apoptosis protein (XIAP), designed in-house using previously published sequences (NCBI, Bethesda, MD, USA) on online primer design tool of Primer3; http://biotools.umassmed.edu/bioapps/primer3_www.cgi). The primers were: GAPDH, Caspase 3 (NM_004346.4) L: 5’-ACTGGACTGTGGCATTGAGA -3’; R: 5’-GCACAAAGCGACTGGATGAA-3’, p53 L: 5’- TGGCCATCTACAAGCAGTCA-3’; R: 5’-GGTACAGTCAGAGCCAACCT-3’, PTEN (NM_000314.8) L: 5’-ACCGGCAGCATCAAATGTTT-3’; R: 5’-AGTTCCACCCCTTCCATCTG-3’, XIAP (NM_001167.4) L: 5’- TGCTCACCTAACCCCAAGAG-3’; R: TCCGGCCCAAAACAAAGAAG-3’. Quantitative PCR (CFX Connect Real Time system, BIORAD, USA) was performed as per manufacturer’s instructions.
4.7. Confocal Microscopy
Pre heated 18mm coverslips (Warner’s instruments) were placed in each well of 6-well plates before plating 1.2x10⁶ cells/well and allowed to grow overnight before 2h exposure to media with or without 20 µM BA-FITC. Cells were then washed with 1X PBS before 15 min treatment with 25nM Mito tracker Red (Invitrogen). The cells were again washed with 1X PBS before mounting coverslips on slides under Confocal Microscope (Olympus Fluoview FV1000). Z-stack images were taken at 60x magnification with Laser HV454v, 2x Gain and 13% offset.
4.8. Glycogen and pH Assay
5,000 T24 and TRT-HU1 cells were plated in each well of 96 well plates and allowed to grow for 8h in respective growth media with basal or 10% increased glucose, with and without BA treatment at 37ºC and 5% CO2. Media was subsequently replaced with unbuffered, isotonic solution of pH 7.4 to create glucose scarcity for glycogen assay by fluorometric Glycogen assay kit ab65620, Abcam, as per manufacturer’s instructions using glycogen standard and excitation/emission of 535/587nm at 30, 60 and 120 mins, respectively. Cell proliferation amidst scarcity determined the rate of lactic acid production and pH decline from initial pH of 7.4, which was measured by Accumet 950 pH/ion meter (Thermofisher Scientific, USA) at 0,30,60,120 and 180 mins.
4.9. Statistical Analysis
Data are expressed as mean ± SD. Time dependent decline in glycogen and pH of cell lines relative to isotonic solution of pH 7.4 was plotted and significance analyzed by two-way ANOVA using Graph pad Prism version 10 software. Pearson’s coefficient was determined for colocalization, and significant difference assessed by student’s t-test. Results were considered significant at p<0.05.
5. Conclusions
BA differs from MC in targeting glucose scarcity induced metabolic reprogramming of urothelial carcinoma for lower toxicity on normal human urothelial cells. While traditional safe human use of birch bark as a folklore medicine is authenticated by an eight-fold higher IC50 of BA on TRT-HU1 than Mitomycin C, BA-FITC also mimicked FDG in metabolic reprogramming dependent entry into T24 cancer cells. Overall, findings hint at the promise of BA conjugates as a next generation theragnostic for urothelial carcinoma.
Supplementary Materials
The following supporting information can be downloaded at: Preprints.org.
Author Contributions
CRediT authorship contribution statement Anirban Ganguly: Writing – original draft, Visualization, Validation, Software, Project administration, Methodology, Investigation, Formal analysis, Data curation, Conceptualization. Keara Healy: Cell culture, Media preparation Stephanie Daugherty: Software, Methodology Aratrika Halder: Preparation of BA-FITC conjugate, Chemistry methodology Shingo Kimura: Cell culture Rajkumar Banerjee: Intellectual input regarding chemistry methodology Jonathan Beckel: Intellectual inputs, Review & editing and primer design, Funding Acquisition Pradeep Tyagi: Intellectual inputs, Review & editing, Supervision, Project administration, Conceptualization, Funding acquisition
Funding
This work was supported by NIH, R01DK117884 and NCI, R21 CA263243
Data Availability Statement
Supporting data can be found at University of Pittsburgh shared drive folder
Acknowledgments
We acknowledge lab students and associate scientists for their encouragement and support.
Conflicts of Interest
The authors declare that they have no known competing financial interests or personal relationships that could have appeared to influence the work reported in this paper.
Abbreviations
The following abbreviations are used in this manuscript:
ATCC- American Type Culture Collection, BECB- Bladder Epithelial Cell Basal, KSFM- Keratinocyte Serum Free Medium, BA-FITC- Fluorescein Isothiocyanate conjugated Betulinic Acid, BA- Betulinic Acid
References
- Afonso, J.; Barbosa-Matos, C.; Silvestre, R.; Pereira-Vieira, J.; Goncalves, S.M.; Mendes-Alves, C.; Parpot, P.; Pinto, J.; Carapito, A.; Guedes de Pinho, P.; et al. Cisplatin-Resistant Urothelial Bladder Cancer Cells Undergo Metabolic Reprogramming beyond the Warburg Effect. Cancers (Basel) 2024, 16. [Google Scholar] [CrossRef] [PubMed]
- Afonso, J.; Goncalves, C.; Costa, M.; Ferreira, D.; Santos, L.; Longatto-Filho, A.; Baltazar, F. Glucose Metabolism Reprogramming in Bladder Cancer: Hexokinase 2 (HK2) as Prognostic Biomarker and Target for Bladder Cancer Therapy. Cancers (Basel) 2023, 15. [Google Scholar] [CrossRef]
- Kuo, Y.H.; Chan, T.C.; Lai, H.Y.; Chen, T.J.; Wu, L.C.; Hsing, C.H.; Li, C.F. Overexpression of Pyruvate Dehydrogenase Kinase-3 Predicts Poor Prognosis in Urothelial Carcinoma. Front Oncol 2021, 11, 749142. [Google Scholar] [CrossRef] [PubMed]
- Gao, M.; Zhu, H.; Xu, H.; Jin, X.; Zheng, G.; Zhu, J.; Gu, C.; Wang, X. PGK1 can affect the prognosis and development of bladder cancer. Cancer Med 2024, 13, e70242. [Google Scholar] [CrossRef]
- Massari, F.; Ciccarese, C.; Santoni, M.; Iacovelli, R.; Mazzucchelli, R.; Piva, F.; Scarpelli, M.; Berardi, R.; Tortora, G.; Lopez-Beltran, A.; et al. Metabolic phenotype of bladder cancer. Cancer Treat Rev 2016, 45, 46–57. [Google Scholar] [CrossRef]
- Wu, C.; Wei, X.; Huang, Z.; Zheng, Z.; Zhang, W.; Chen, J.; Hong, H.; Li, W. Urinary microbiome dysbiosis is associated with an inflammatory environment and perturbed fatty acids metabolism in the pathogenesis of bladder cancer. J Transl Med 2024, 22, 628. [Google Scholar] [CrossRef] [PubMed]
- Wang, R.; Kang, H.; Zhang, X.; Nie, Q.; Wang, H.; Wang, C.; Zhou, S. Urinary metabolomics for discovering metabolic biomarkers of bladder cancer by UPLC-MS. BMC Cancer 2022, 22, 214. [Google Scholar] [CrossRef]
- Yosef, H.K.; Krauss, S.D.; Lechtonen, T.; Jutte, H.; Tannapfel, A.; Kafferlein, H.U.; Bruning, T.; Roghmann, F.; Noldus, J.; Mosig, A.; et al. Noninvasive Diagnosis of High-Grade Urothelial Carcinoma in Urine by Raman Spectral Imaging. Anal Chem 2017, 89, 6893–6899. [Google Scholar] [CrossRef]
- Sasaki, K.; Takahashi, M.; Ogino, T.; Yasui, H. In vitro estimation of cell kinetic parameters in human urinary bladder cancers. Gan 1981, 72, 795–797. [Google Scholar]
- Xing, Z.; Yang, T.; Li, X.; Xu, H.; Hong, Y.; Shao, S.; Li, T.; Ye, L.; Li, Y.; Jin, X.; et al. High-glucose-associated YTHDC1 lactylation reduces the sensitivity of bladder cancer to enfortumab vedotin therapy. Cell Rep 2025, 44, 115545. [Google Scholar] [CrossRef]
- Jenkins, D.J.A.; Willett, W.C.; Yusuf, S.; Hu, F.B.; Glenn, A.J.; Liu, S.; Mente, A.; Miller, V.; Bangdiwala, S.I.; Gerstein, H.C.; et al. Association of glycaemic index and glycaemic load with type 2 diabetes, cardiovascular disease, cancer, and all-cause mortality: a meta-analysis of mega cohorts of more than 100 000 participants. Lancet Diabetes Endocrinol 2024, 12, 107–118. [Google Scholar] [CrossRef] [PubMed]
- Woolcott, C.G.; Maskarinec, G.; Haiman, C.A.; Henderson, B.E.; Kolonel, L.N. Diabetes and urothelial cancer risk: the Multiethnic Cohort study. Cancer Epidemiol 2011, 35, 551–554. [Google Scholar] [CrossRef] [PubMed]
- Wang, Z.; Wang, D.; Chen, J.; Long, T.; Zhong, C.; Li, Y. Effects of glucose and osmotic pressure on the proliferation and cell cycle of human chorionic trophoblast cells. Open Life Sci 2022, 17, 1418–1428. [Google Scholar] [CrossRef]
- Pal, A.; Ganguly, A.; Chowdhuri, S.; Yousuf, M.; Ghosh, A.; Barui, A.K.; Kotcherlakota, R.; Adhikari, S.; Banerjee, R. Bis-arylidene oxindole-betulinic Acid conjugate: a fluorescent cancer cell detector with potent anticancer activity. ACS Med Chem Lett 2015, 6, 612–616. [Google Scholar] [CrossRef] [PubMed]
- Rzeski, W.; Stepulak, A.; Szymanski, M.; Sifringer, M.; Kaczor, J.; Wejksza, K.; Zdzisinska, B.; Kandefer-Szerszen, M. Betulinic acid decreases expression of bcl-2 and cyclin D1, inhibits proliferation, migration and induces apoptosis in cancer cells. Naunyn Schmiedebergs Arch Pharmacol 2006, 374, 11–20. [Google Scholar] [CrossRef]
- Zuco, V.; Supino, R.; Righetti, S.C.; Cleris, L.; Marchesi, E.; Gambacorti-Passerini, C.; Formelli, F. Selective cytotoxicity of betulinic acid on tumor cell lines, but not on normal cells. Cancer Lett 2002, 175, 17–25. [Google Scholar] [CrossRef]
- Wang, S.; Wang, K.; Zhang, C.; Zhang, W.; Xu, Q.; Wang, Y.; Zhang, Y.; Li, Y.; Zhang, Y.; Zhu, H.; et al. Overaccumulation of p53-mediated autophagy protects against betulinic acid-induced apoptotic cell death in colorectal cancer cells. Cell Death Dis 2017, 8, e3087. [Google Scholar] [CrossRef]
- Zhan, X.K.; Li, J.L.; Zhang, S.; Xing, P.Y.; Xia, M.F. Betulinic acid exerts potent antitumor effects on paclitaxel-resistant human lung carcinoma cells (H460) via G2/M phase cell cycle arrest and induction of mitochondrial apoptosis. Oncol Lett 2018, 16, 3628–3634. [Google Scholar] [CrossRef]
- Kim, S.Y.; Hwangbo, H.; Kim, M.Y.; Ji, S.Y.; Kim, D.H.; Lee, H.; Kim, G.Y.; Moon, S.K.; Leem, S.H.; Yun, S.J.; et al. Betulinic Acid Restricts Human Bladder Cancer Cell Proliferation In Vitro by Inducing Caspase-Dependent Cell Death and Cell Cycle Arrest, and Decreasing Metastatic Potential. Molecules 2021, 26. [Google Scholar] [CrossRef]
- Coricovac, D.; Dehelean, C.A.; Pinzaru, I.; Mioc, A.; Aburel, O.M.; Macasoi, I.; Draghici, G.A.; Petean, C.; Soica, C.; Boruga, M.; et al. Assessment of Betulinic Acid Cytotoxicity and Mitochondrial Metabolism Impairment in a Human Melanoma Cell Line. Int J Mol Sci 2021, 22. [Google Scholar] [CrossRef]
- Zeng, A.Q.; Yu, Y.; Yao, Y.Q.; Yang, F.F.; Liao, M.; Song, L.J.; Li, Y.L.; Yu, Y.; Li, Y.J.; Deng, Y.L.; et al. Betulinic acid impairs metastasis and reduces immunosuppressive cells in breast cancer models. Oncotarget 2018, 9, 3794–3804. [Google Scholar] [CrossRef] [PubMed]
- Weber, L.A.; Delarocque, J.; Feige, K.; Kietzmann, M.; Kalbitz, J.; Meissner, J.; Paschke, R.; Cavalleri, J.V. Effects of Topically Applied Betulinic Acid and NVX-207 on Melanocytic Tumors in 18 Horses. Animals (Basel) 2021, 11. [Google Scholar] [CrossRef]
- Pisha, E.; Chai, H.; Lee, I.S.; Chagwedera, T.E.; Farnsworth, N.R.; Cordell, G.A.; Beecher, C.W.; Fong, H.H.; Kinghorn, A.D.; Brown, D.M.; et al. Discovery of betulinic acid as a selective inhibitor of human melanoma that functions by induction of apoptosis. Nat Med 1995, 1, 1046–1051. [Google Scholar] [CrossRef]
- Kern, J.S.; Sprecher, E.; Fernandez, M.F.; Schauer, F.; Bodemer, C.; Cunningham, T.; Lowe, S.; Davis, C.; Sumeray, M.; Bruckner, A.L.; et al. Efficacy and safety of Oleogel-S10 (birch triterpenes) for epidermolysis bullosa: results from the phase III randomized double-blind phase of the EASE study. Br J Dermatol 2023, 188, 12–21. [Google Scholar] [CrossRef] [PubMed]
- Tyagi, P.; Hafron, J.; Kaufman, J.; Chancellor, M. Enhancing Therapeutic Efficacy and Safety of Immune Checkpoint Inhibition for Bladder Cancer: A Comparative Analysis of Injectable vs. Intravesical Administration. Int J Mol Sci 2024, 25. [Google Scholar] [CrossRef]
- Nagao, A.; Kobayashi, M.; Koyasu, S.; Chow, C.C.T.; Harada, H. HIF-1-Dependent Reprogramming of Glucose Metabolic Pathway of Cancer Cells and Its Therapeutic Significance. Int J Mol Sci 2019, 20. [Google Scholar] [CrossRef] [PubMed]
- Feron, O. Pyruvate into lactate and back: from the Warburg effect to symbiotic energy fuel exchange in cancer cells. Radiother Oncol 2009, 92, 329–333. [Google Scholar] [CrossRef]
- Faubert, B.; Solmonson, A.; DeBerardinis, R.J. Metabolic reprogramming and cancer progression. Science 2020, 368. [Google Scholar] [CrossRef]
- McKenna, E.; Traganos, F.; Zhao, H.; Darzynkiewicz, Z. Persistent DNA damage caused by low levels of mitomycin C induces irreversible cell senescence. Cell Cycle 2012, 11, 3132–3140. [Google Scholar] [CrossRef]
- Zois, C.E.; Harris, A.L. Glycogen metabolism has a key role in the cancer microenvironment and provides new targets for cancer therapy. J Mol Med (Berl) 2016, 94, 137–154. [Google Scholar] [CrossRef]
- Lee, H.Y.; Min, K.J. Betulinic Acid Increases the Lifespan of Drosophila melanogaster via Sir2 and FoxO Activation. Nutrients 2024, 16. [Google Scholar] [CrossRef] [PubMed]
- Park, C.; Jeong, J.W.; Han, M.H.; Lee, H.; Kim, G.Y.; Jin, S.; Park, J.H.; Kwon, H.J.; Kim, B.W.; Choi, Y.H. The anti-cancer effect of betulinic acid in u937 human leukemia cells is mediated through ROS-dependent cell cycle arrest and apoptosis. Anim Cells Syst (Seoul) 2021, 25, 119–127. [Google Scholar] [CrossRef] [PubMed]
- Zhang, Y.; He, N.; Zhou, X.; Wang, F.; Cai, H.; Huang, S.H.; Chen, X.; Hu, Z.; Jin, X. Betulinic acid induces autophagy-dependent apoptosis via Bmi-1/ROS/AMPK-mTOR-ULK1 axis in human bladder cancer cells. Aging (Albany NY) 2021, 13, 21251–21267. [Google Scholar] [CrossRef]
- Heiss, E.H.; Kramer, M.P.; Atanasov, A.G.; Beres, H.; Schachner, D.; Dirsch, V.M. Glycolytic switch in response to betulinic acid in non-cancer cells. PLoS One 2014, 9, e115683. [Google Scholar] [CrossRef]
- Zhu, X.; Jin, C.; Pan, Q.; Hu, X. Determining the quantitative relationship between glycolysis and GAPDH in cancer cells exhibiting the Warburg effect. J Biol Chem 2021, 296, 100369. [Google Scholar] [CrossRef]
- Dumas, J.F.; Brisson, L.; Chevalier, S.; Maheo, K.; Fromont, G.; Moussata, D.; Besson, P.; Roger, S. Metabolic reprogramming in cancer cells, consequences on pH and tumour progression: Integrated therapeutic perspectives with dietary lipids as adjuvant to anticancer treatment. Semin Cancer Biol 2017, 43, 90–110. [Google Scholar] [CrossRef] [PubMed]
- McClure, M.B.; Kogure, Y.; Ansari-Pour, N.; Saito, Y.; Chao, H.H.; Shepherd, J.; Tabata, M.; Olopade, O.I.; Wedge, D.C.; Hoadley, K.A.; et al. Landscape of Genetic Alterations Underlying Hallmark Signature Changes in Cancer Reveals TP53 Aneuploidy-driven Metabolic Reprogramming. Cancer Res Commun 2023, 3, 281–296. [Google Scholar] [CrossRef]
- Cao, B.; Li, Q.; Xu, P.; Zhang, Y.; Cai, S.; Rao, S.; Zeng, M.; Dai, Y.; Jiang, S.; Zhou, J. Vesical Imaging-Reporting and Data System (VI-RADS) as a grouping imaging biomarker combined with a decision-tree mode to preoperatively predict the pathological grade of bladder cancer. Clin Radiol 2024, 79, e725–e735. [Google Scholar] [CrossRef]
- Xu, H.; Ju, L.; Xiong, Y.; Yu, M.; Zhou, F.; Qian, K.; Wang, G.; Xiao, Y.; Wang, X. E3 ubiquitin ligase RNF126 affects bladder cancer progression through regulation of PTEN stability. Cell Death Dis 2021, 12, 239–s41419. [Google Scholar] [CrossRef]
- Sprinz, C.; Altmayer, S.; Zanon, M.; Watte, G.; Irion, K.; Marchiori, E.; Hochhegger, B. Effects of blood glucose level on 18F-FDG uptake for PET/CT in normal organs: A systematic review. PLoS One 2018, 13, e0193140. [Google Scholar] [CrossRef]
- Ibrahim, S.S.; Ibrahim, R.S.; Arabi, B.; Brockmueller, A.; Shakibaei, M.; Busselberg, D. The effect of GLP-1R agonists on the medical triad of obesity, diabetes, and cancer. Cancer Metastasis Rev 2024, 43, 1297–1314. [Google Scholar] [CrossRef] [PubMed]
- Mahato, A.; Jain, A.; Prakash, V.S.; Nair, R.; Joshi, R.; Paliwal, D.; Tiwari, A.; Khandpur, S.; Singh, H. Use of Oral Empagliflozin to Obtain Optimal Blood Sugar Levels for Conducting (18) F-FDG PET-CT in Patients with Hyperglycemia-A Pilot Study. World J Nucl Med 2023, 22, 191–195. [Google Scholar] [CrossRef] [PubMed]
- Bouchelouche, K. PET/CT in Bladder Cancer: An Update. Semin Nucl Med 2022, 52, 475–485. [Google Scholar] [CrossRef] [PubMed]
- Roth, B.J.; Gill, B.C.; Khooblall, P.; Vallabhaneni, S.; Bole, R.; Bajic, P. Associations Between Sodium-Glucose Co-transporter 2 Inhibitors and Urologic Diseases: Implications for Lower Urinary Tract Symptoms From a Multi-State Health System Analysis. Urology 2024, 192, 119–125. [Google Scholar] [CrossRef]
Figure 1.
Two-fold faster proliferation of urothelial carcinoma (T24) cell line relative to benign urothelial cells (TRT-HU1) is fueled by “Warburg effect”, which is sustained >5fold higher 16mM glucose in McCoy’s 5a medium (panel A) of relative to 3mM glucose in Keratinocyte Serum Free media for TRT-HU1(panel B). A 10% increase from basal levels to 17.6mM and 3.3mM for T24 and TRT-HU1 cell lines shortens the doubling time by 3h and 1h, respectively, and lowers confocal co-localization of natural fatty acid mimetic, Betulinic Acid (BA-FITC) with Mito-tracker red (mitochondrial marker) which coincides with slower decline of glycogen stores and of pH amidst glucose scarcity. Findings highlight that BA does not mimic nuclear DNA binding of mitomycin (MC) to evoke non-selective, glucose-insensitive cell cycle arrest and caspase-3/7 apoptosis of T24 and TRT-HU1 cells. (HK2- hexokinase 2). Because faster proliferation of T24 cells amidst glucose scarcity is fueled by mitochondrial accumulation of fatty acids, hallmarked by faster glycogen depletion and lactic acid production (pH decline), mitochondrial accumulation of a fatty acid mimetic (BA) inhibits fatty acids synthesis from glycogen, as indexed by slower glycogen decline amidst glucose scarcity. A mere 10% increase in glucose to 17.6mM from basal level of 16mM for T24 doubled IC50 of BA and BA-FITC relative to TRT-HU1 by reversing the upregulation of caspase 3, p53, PTEN, GAPDH and XIAP gene expression induced by BA in T24 at basal glucose (16mM).
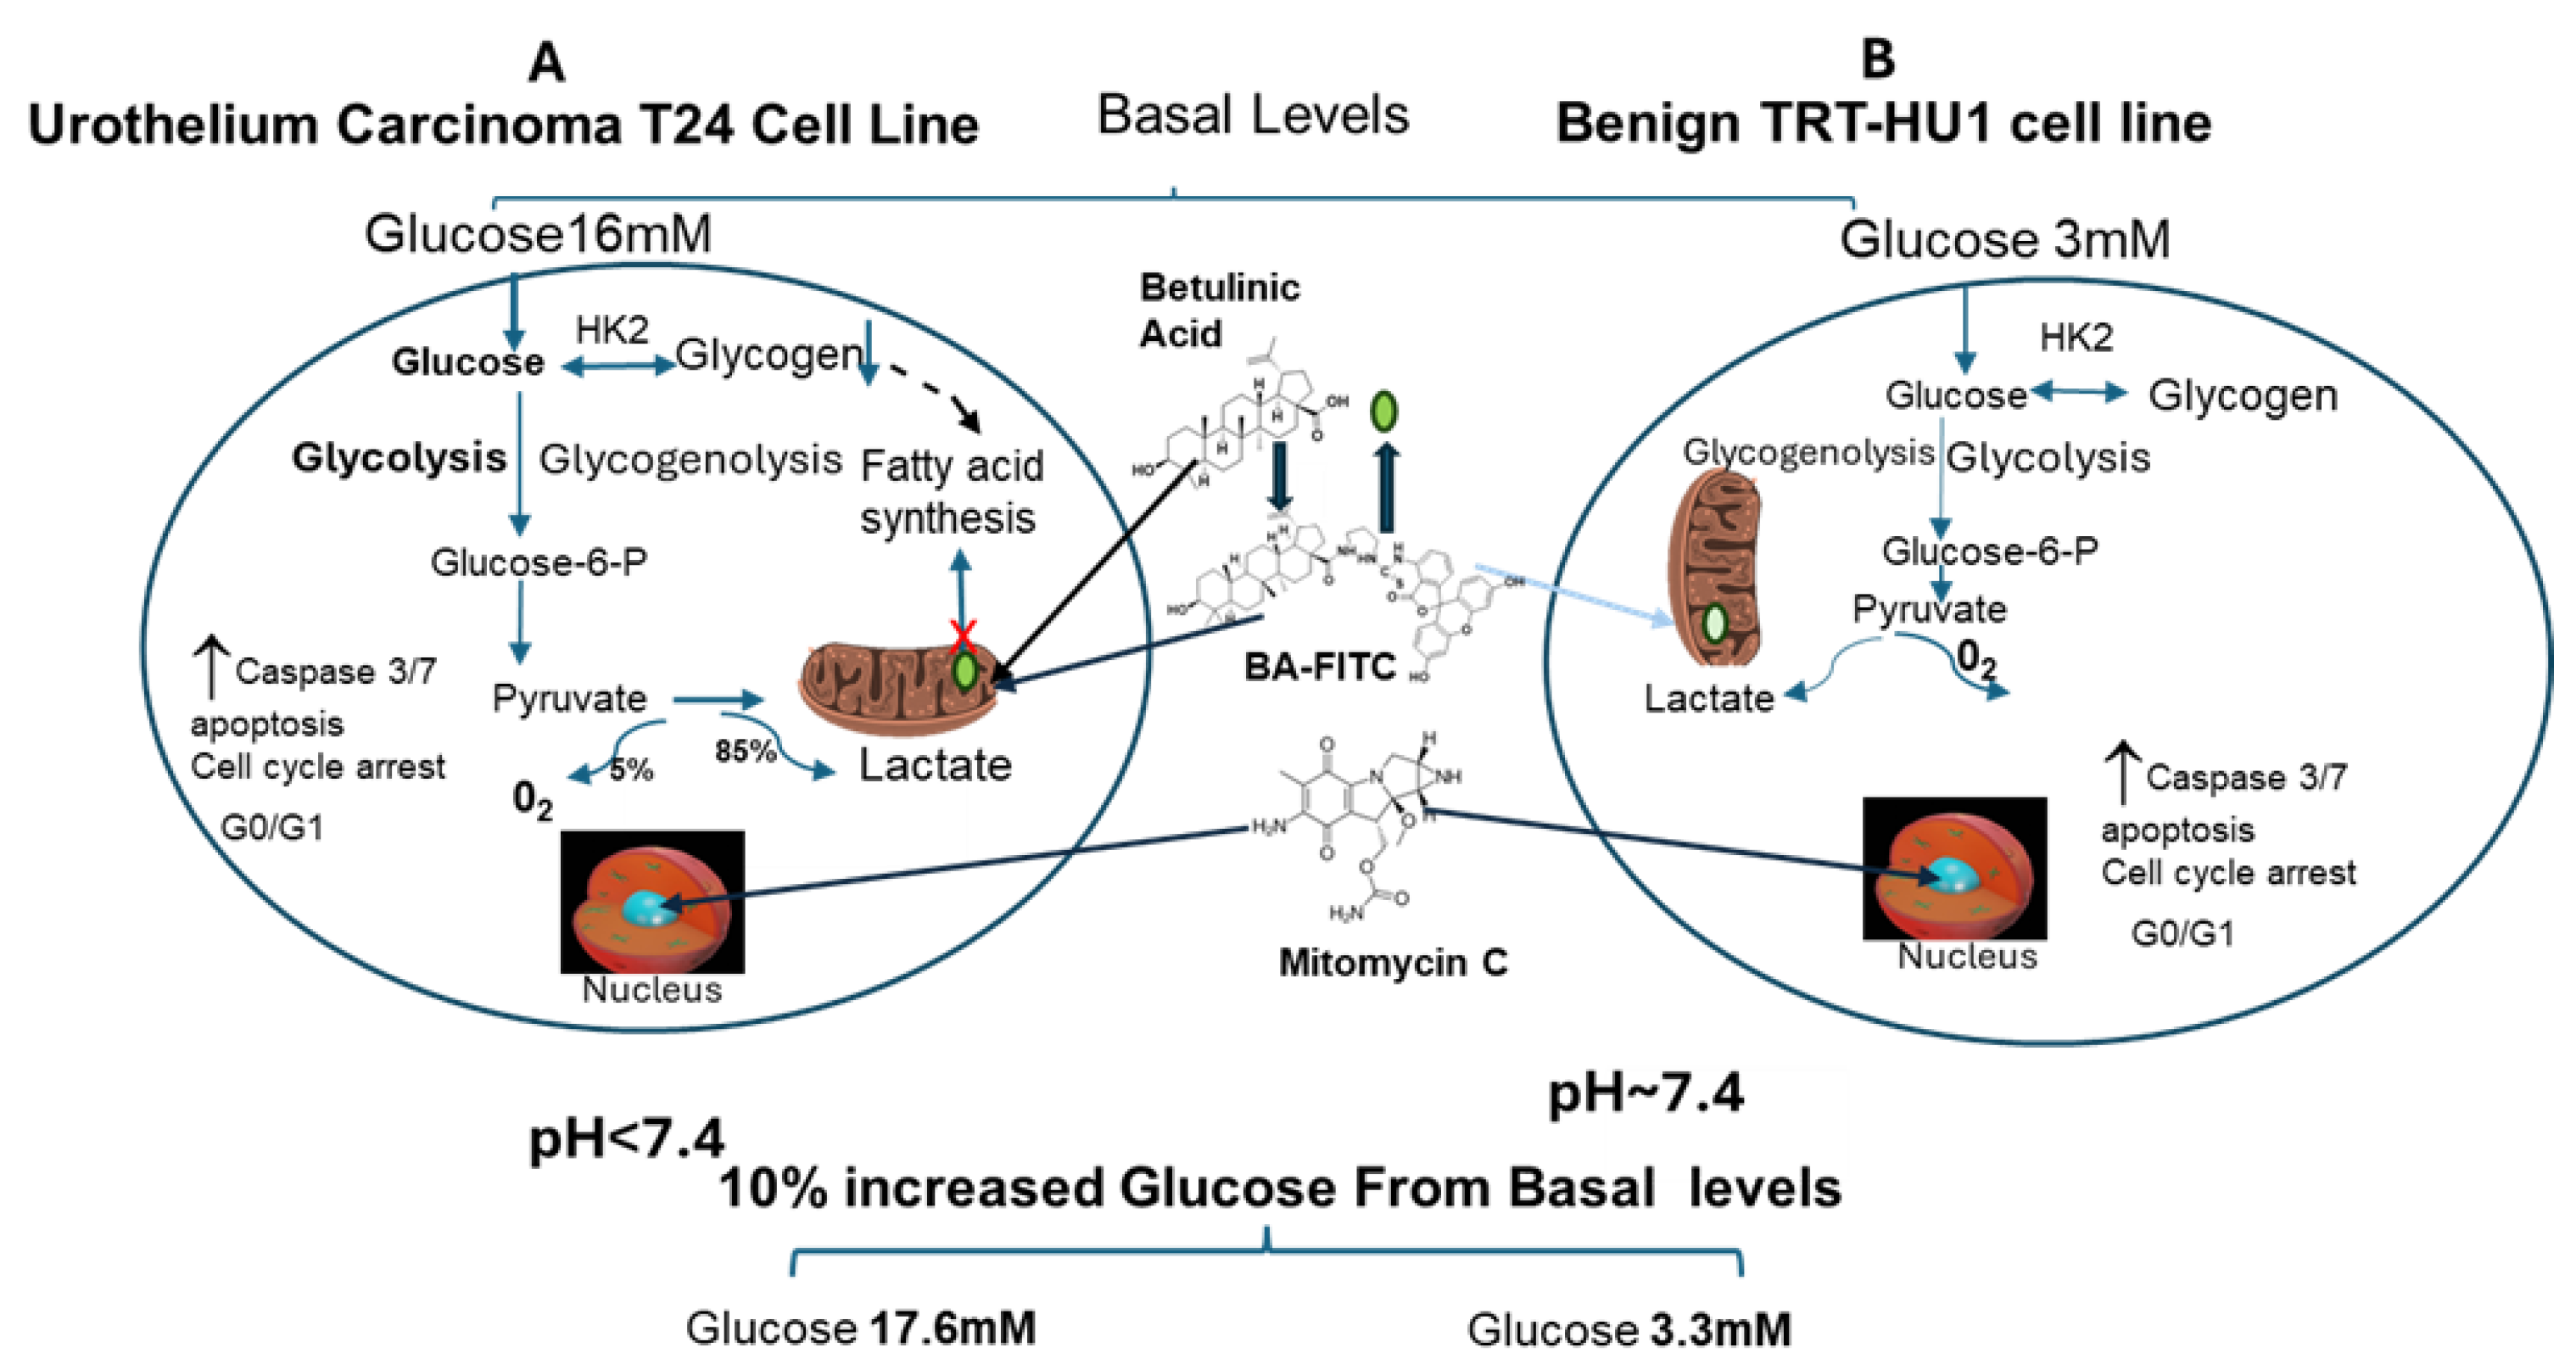
Figure 2.
Standard chemotherapeutic drug, Mitomycin C (MC), exhibited non-selective cytotoxicity on carcinoma cell line T24 and benign urothelial cell TRT-HU1 at basal (panel A) as well as at 10 % increased glucose from basal levels. The glucose-insensitive IC50 of MC determined after 18h exposure to MC is mirrored by caspase3/7 apoptotic activity (panel B) at basal (p value ≤0.01) and at 10% increased glucose (p value ≤0.05) and cell cycle arrest at G0/G1 phase determined after 12h exposure to MC (panel C). .
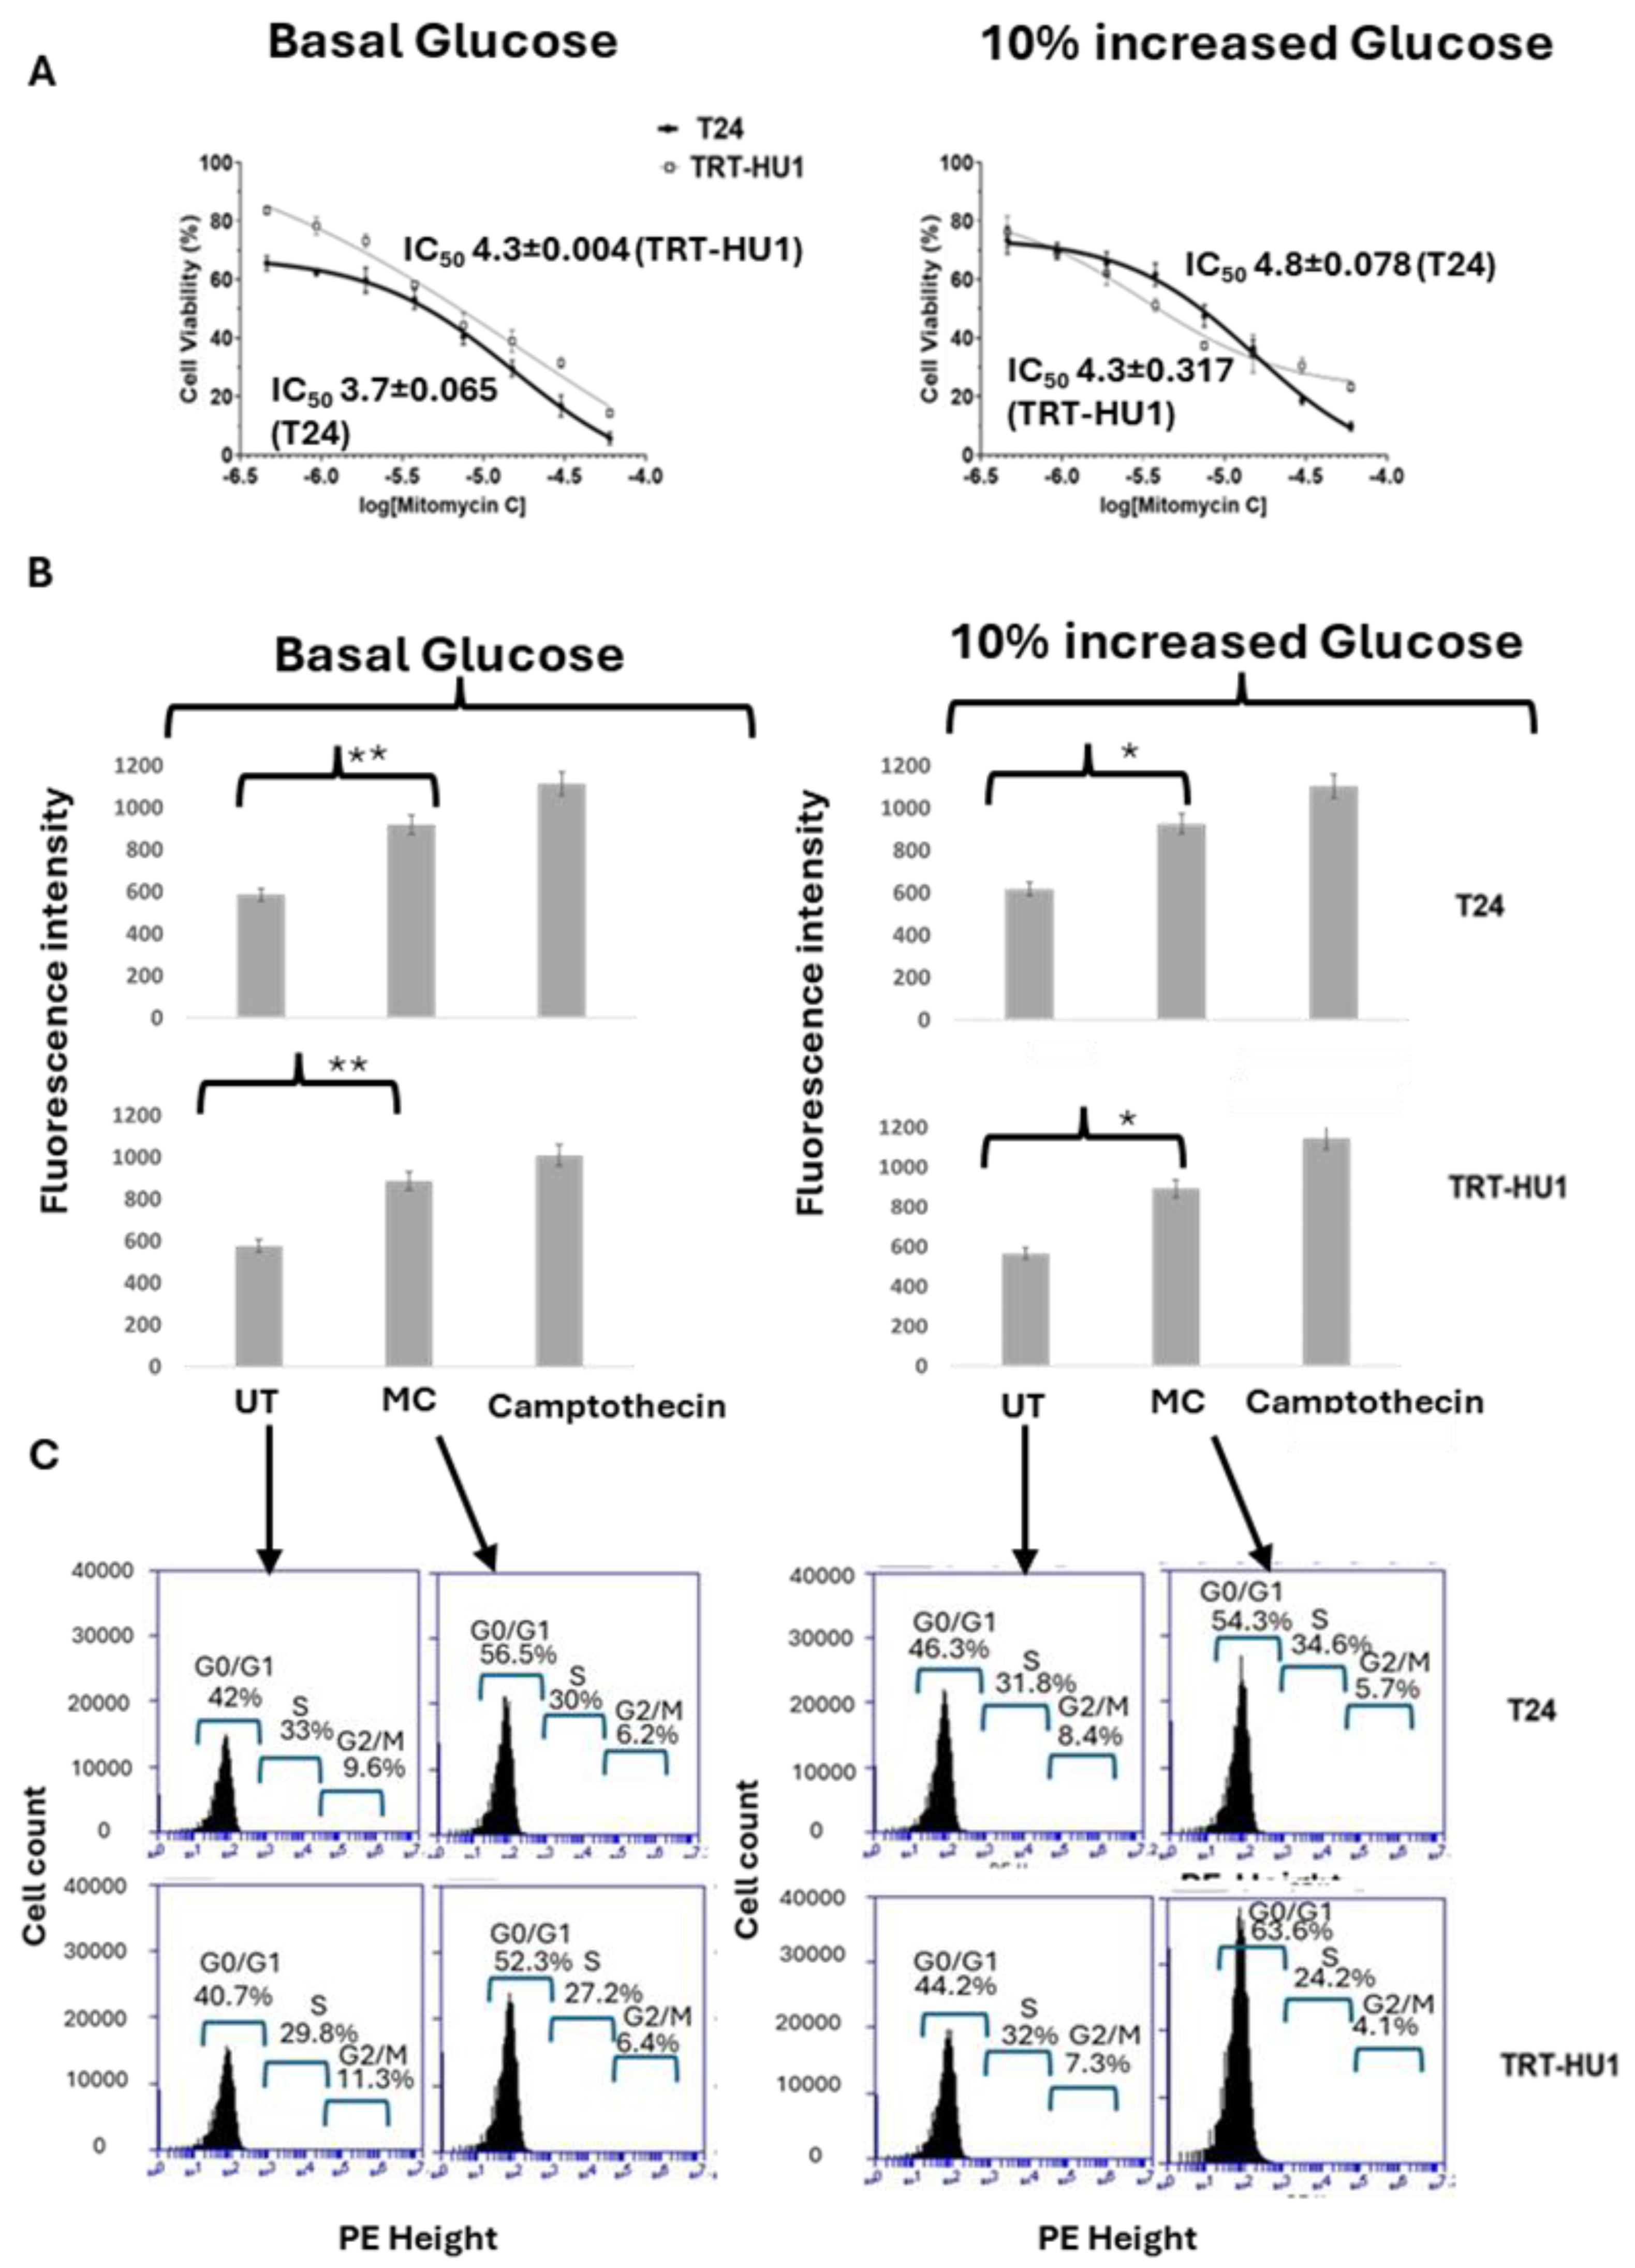
Figure 3.
Betulinic Acid (BA) exhibited significantly lower IC50 in T24 compared to TRT-HU1 grown at basal glucose (p value ≤0.01, panel A) and the IC50 difference was abolished by 10% increase in glucose from basal levels, which mirrored the results of Caspase 3/7 apoptotic assay (p value ≤0.05; panel B). The doubling of BA IC50 with 10% increase in glucose in T24 cells was determined by significantly lower apoptosis and lower cell cycle arrest as opposed to 13% higher cell cycle arrest (41.5% vs 54.2%) in G0/G1 phase of T24 cells grown at basal glucose (panel C). IC50 was determined by concentration dependent antiproliferative action of BA after 18h exposure and cell cycle arrest and apoptosis were determined after 12h exposure and Camptothecin was used as positive control in Caspase 3/7 apoptotic assay.
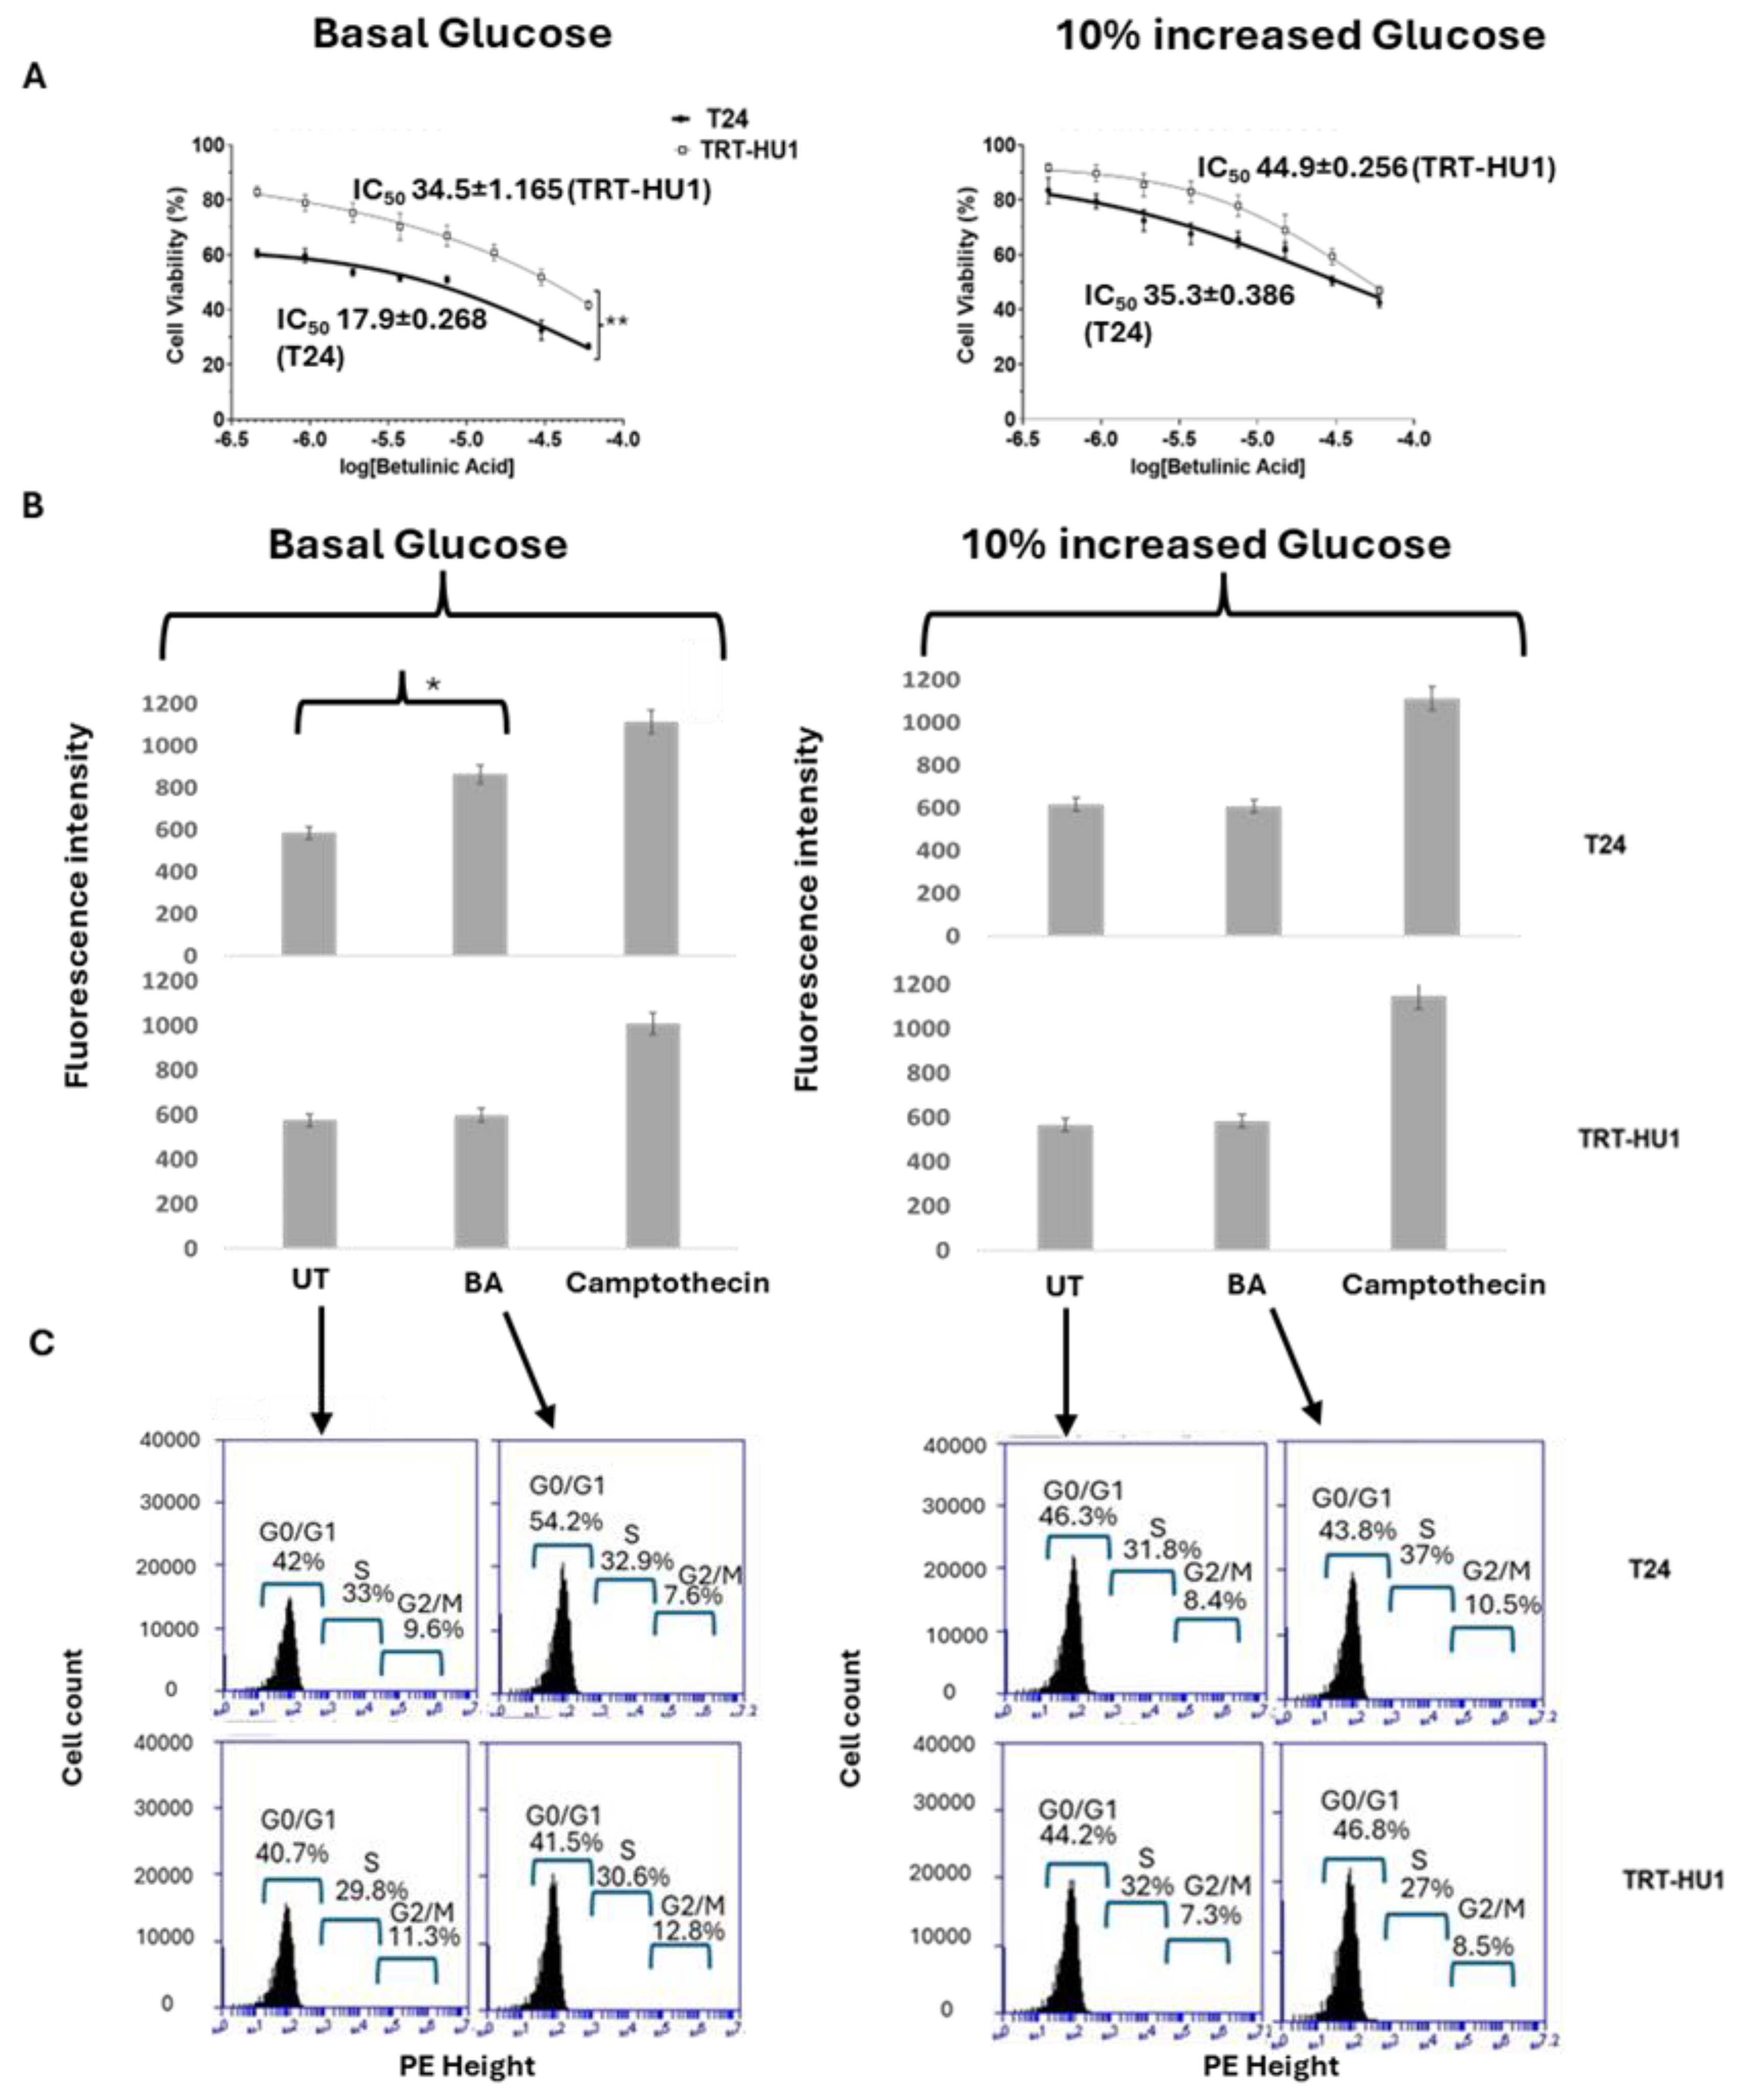
Figure 4.
Lower IC50 of BA in T24 cells grown at basal glucose (panel A) is dependent on BA induced up-regulation of pro-apoptotic genes: Caspase 3(Casp3) (p value ≤0.01), p53(p value ≤0.01), PTEN (p value ≤0.01) and GAPDH (p value ≤0.001) and the downregulation of XIAP gene (p value ≤0.05). While 10% increase in glucose (panel B) from basal levels reversed BA induced upregulation of p53, Casp3 in T24 cells, TRT-HU1 cells were resistant to any BA evoked gene alterations with or without increase in glucose (panels C-D). Gene expression was calculated relative to untreated controls at basal and 10 % increased glucose using 18s as a housekeeping gene.
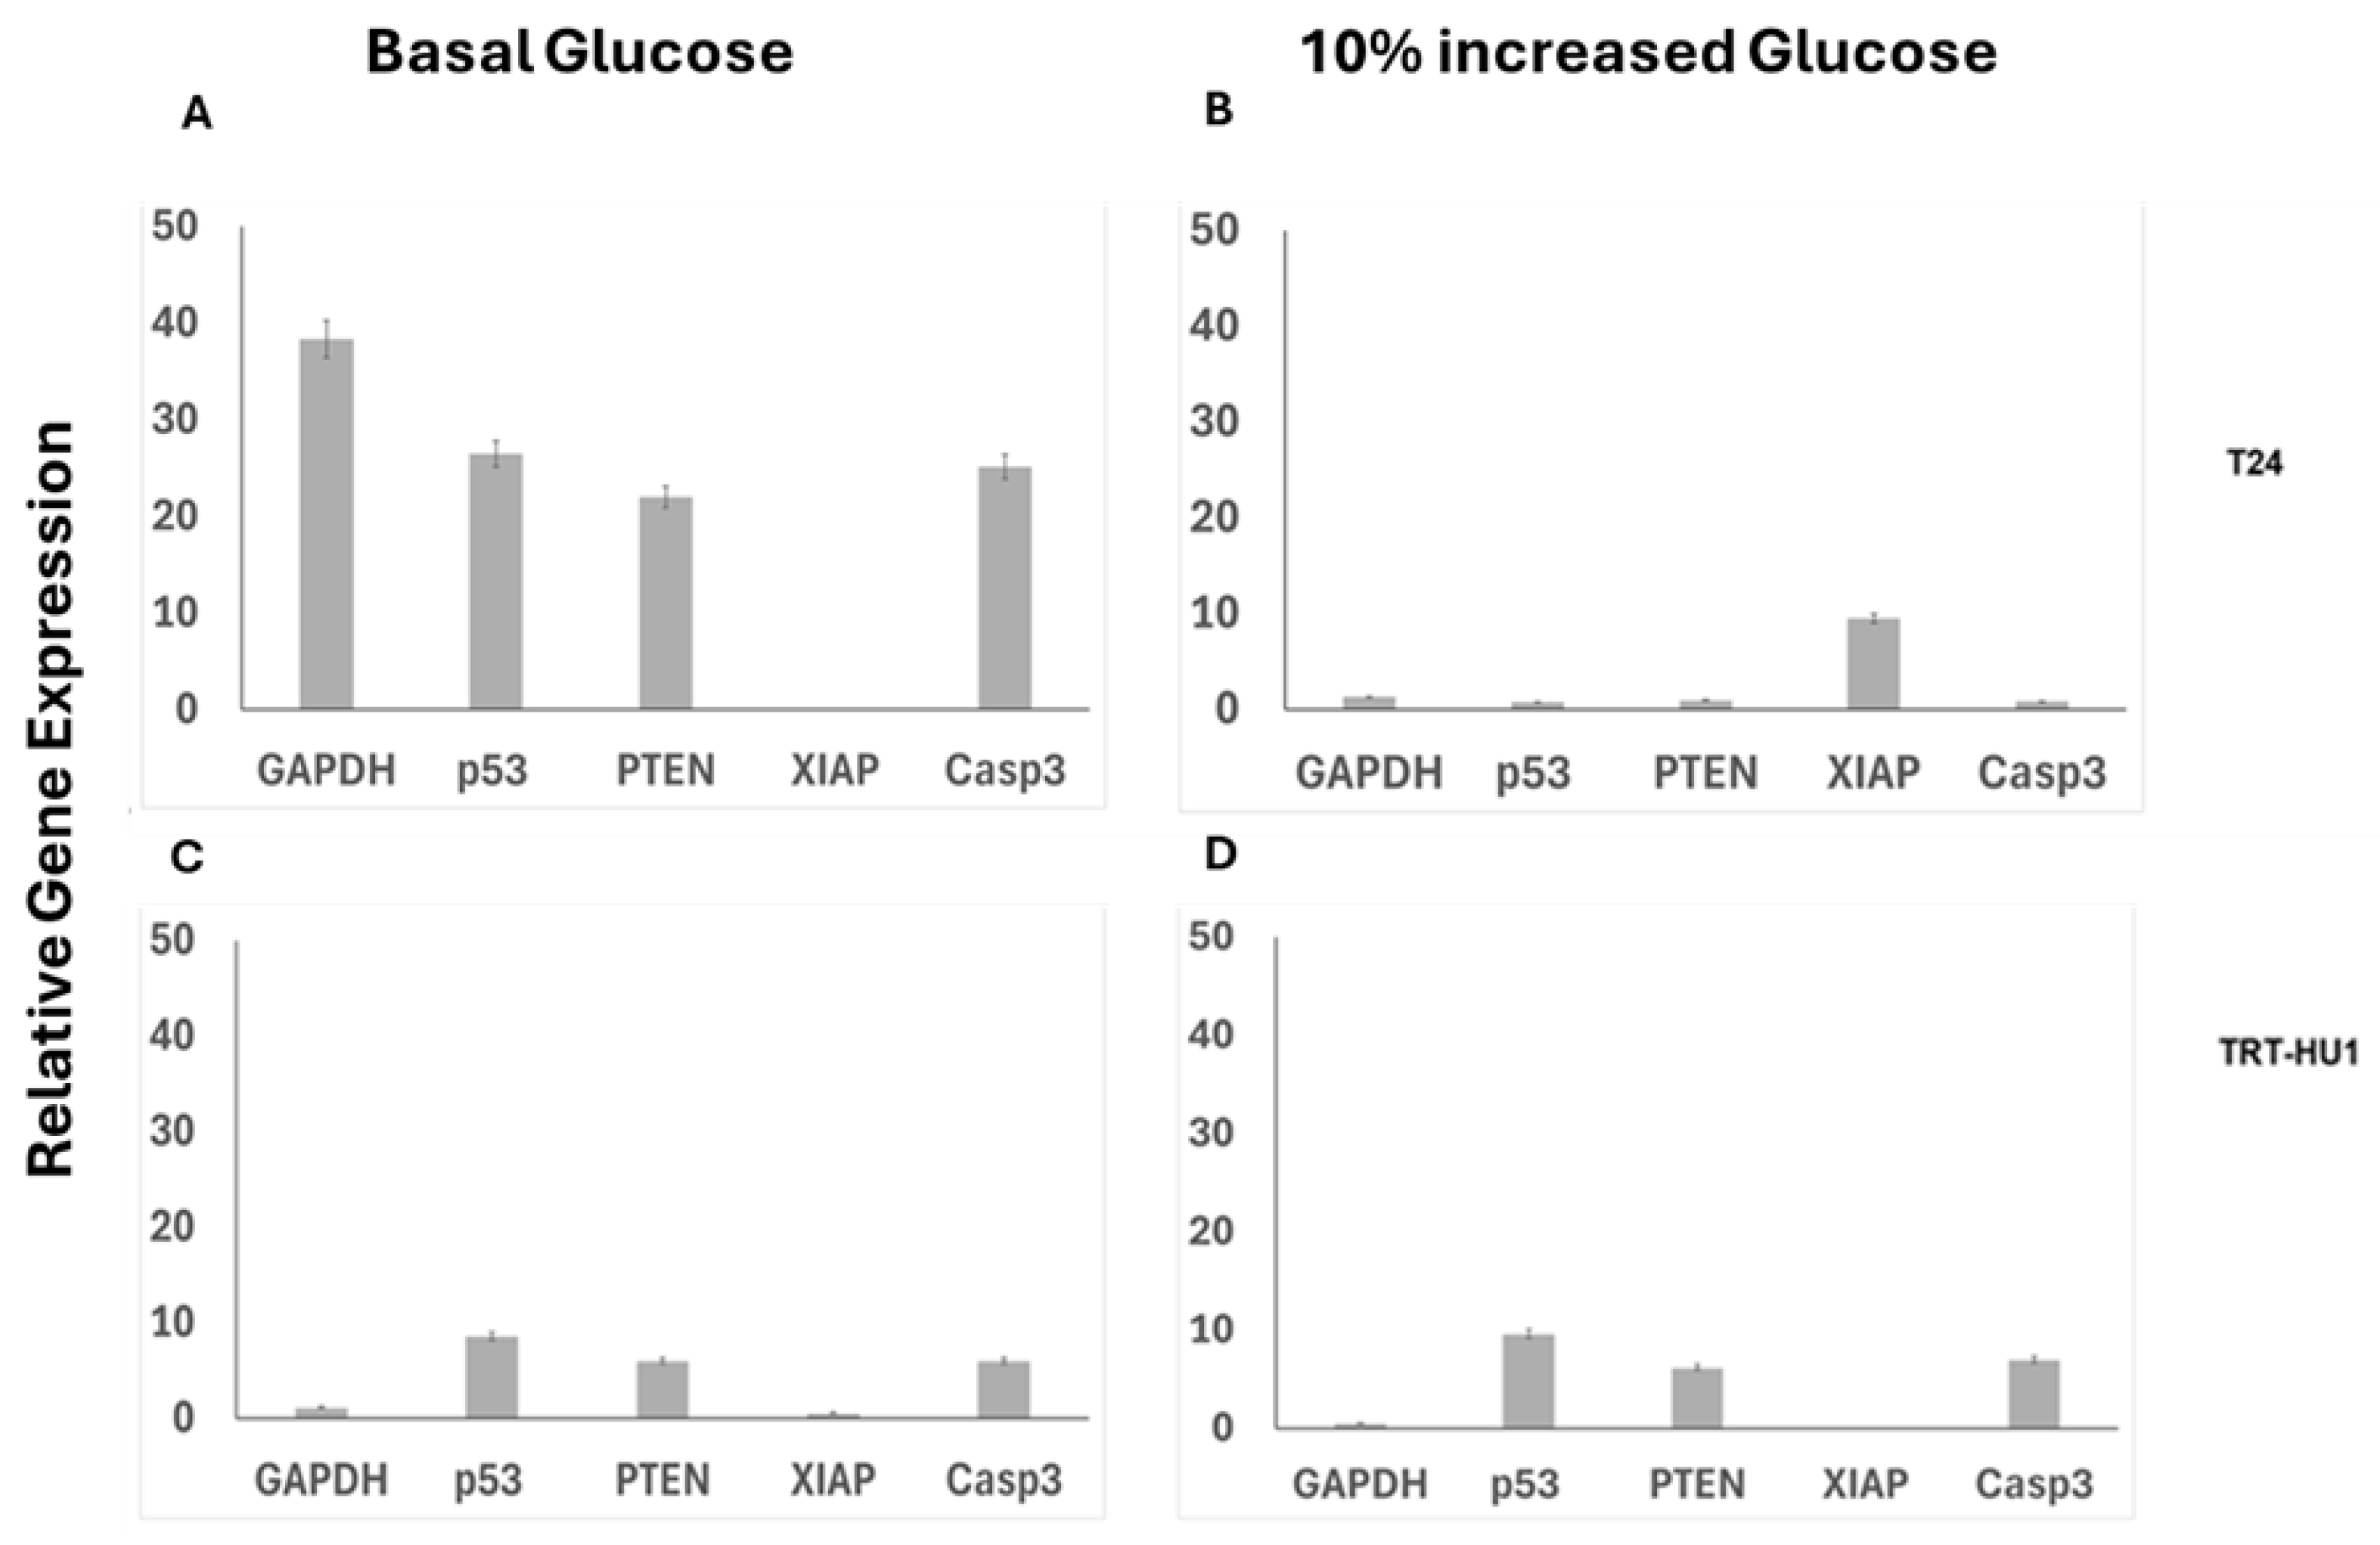
Figure 5.
Glucose scarcity dependent colocalization of the green fluorescence emitted by FITC conjugated to Betulinic acid (BA-FITC; 20µM for 2h) with the red fluorescence emitted by Mito-tracker red in T24 cells (A) is evident from a ~15% decline in Pearson’s correlation coefficient from 0.91 to 0.75 (graph shown in supplementary data) for the colocalization of fluorescence at basal glucose (A) and 10% increased glucose (B), respectively, p value ≤0.01. The coefficient for colocalization, 0.66 and 0.63 in TRT-HU1 benign urothelial cells remained unchanged with 10% increase in glucose from basal levels. Lower mitochondrial localization of BA-FITC in T24 at higher glucose resulted in two- fold higher IC50 of BA-FITC (D) relative to IC50 of BA-FITC at basal glucose(C). .
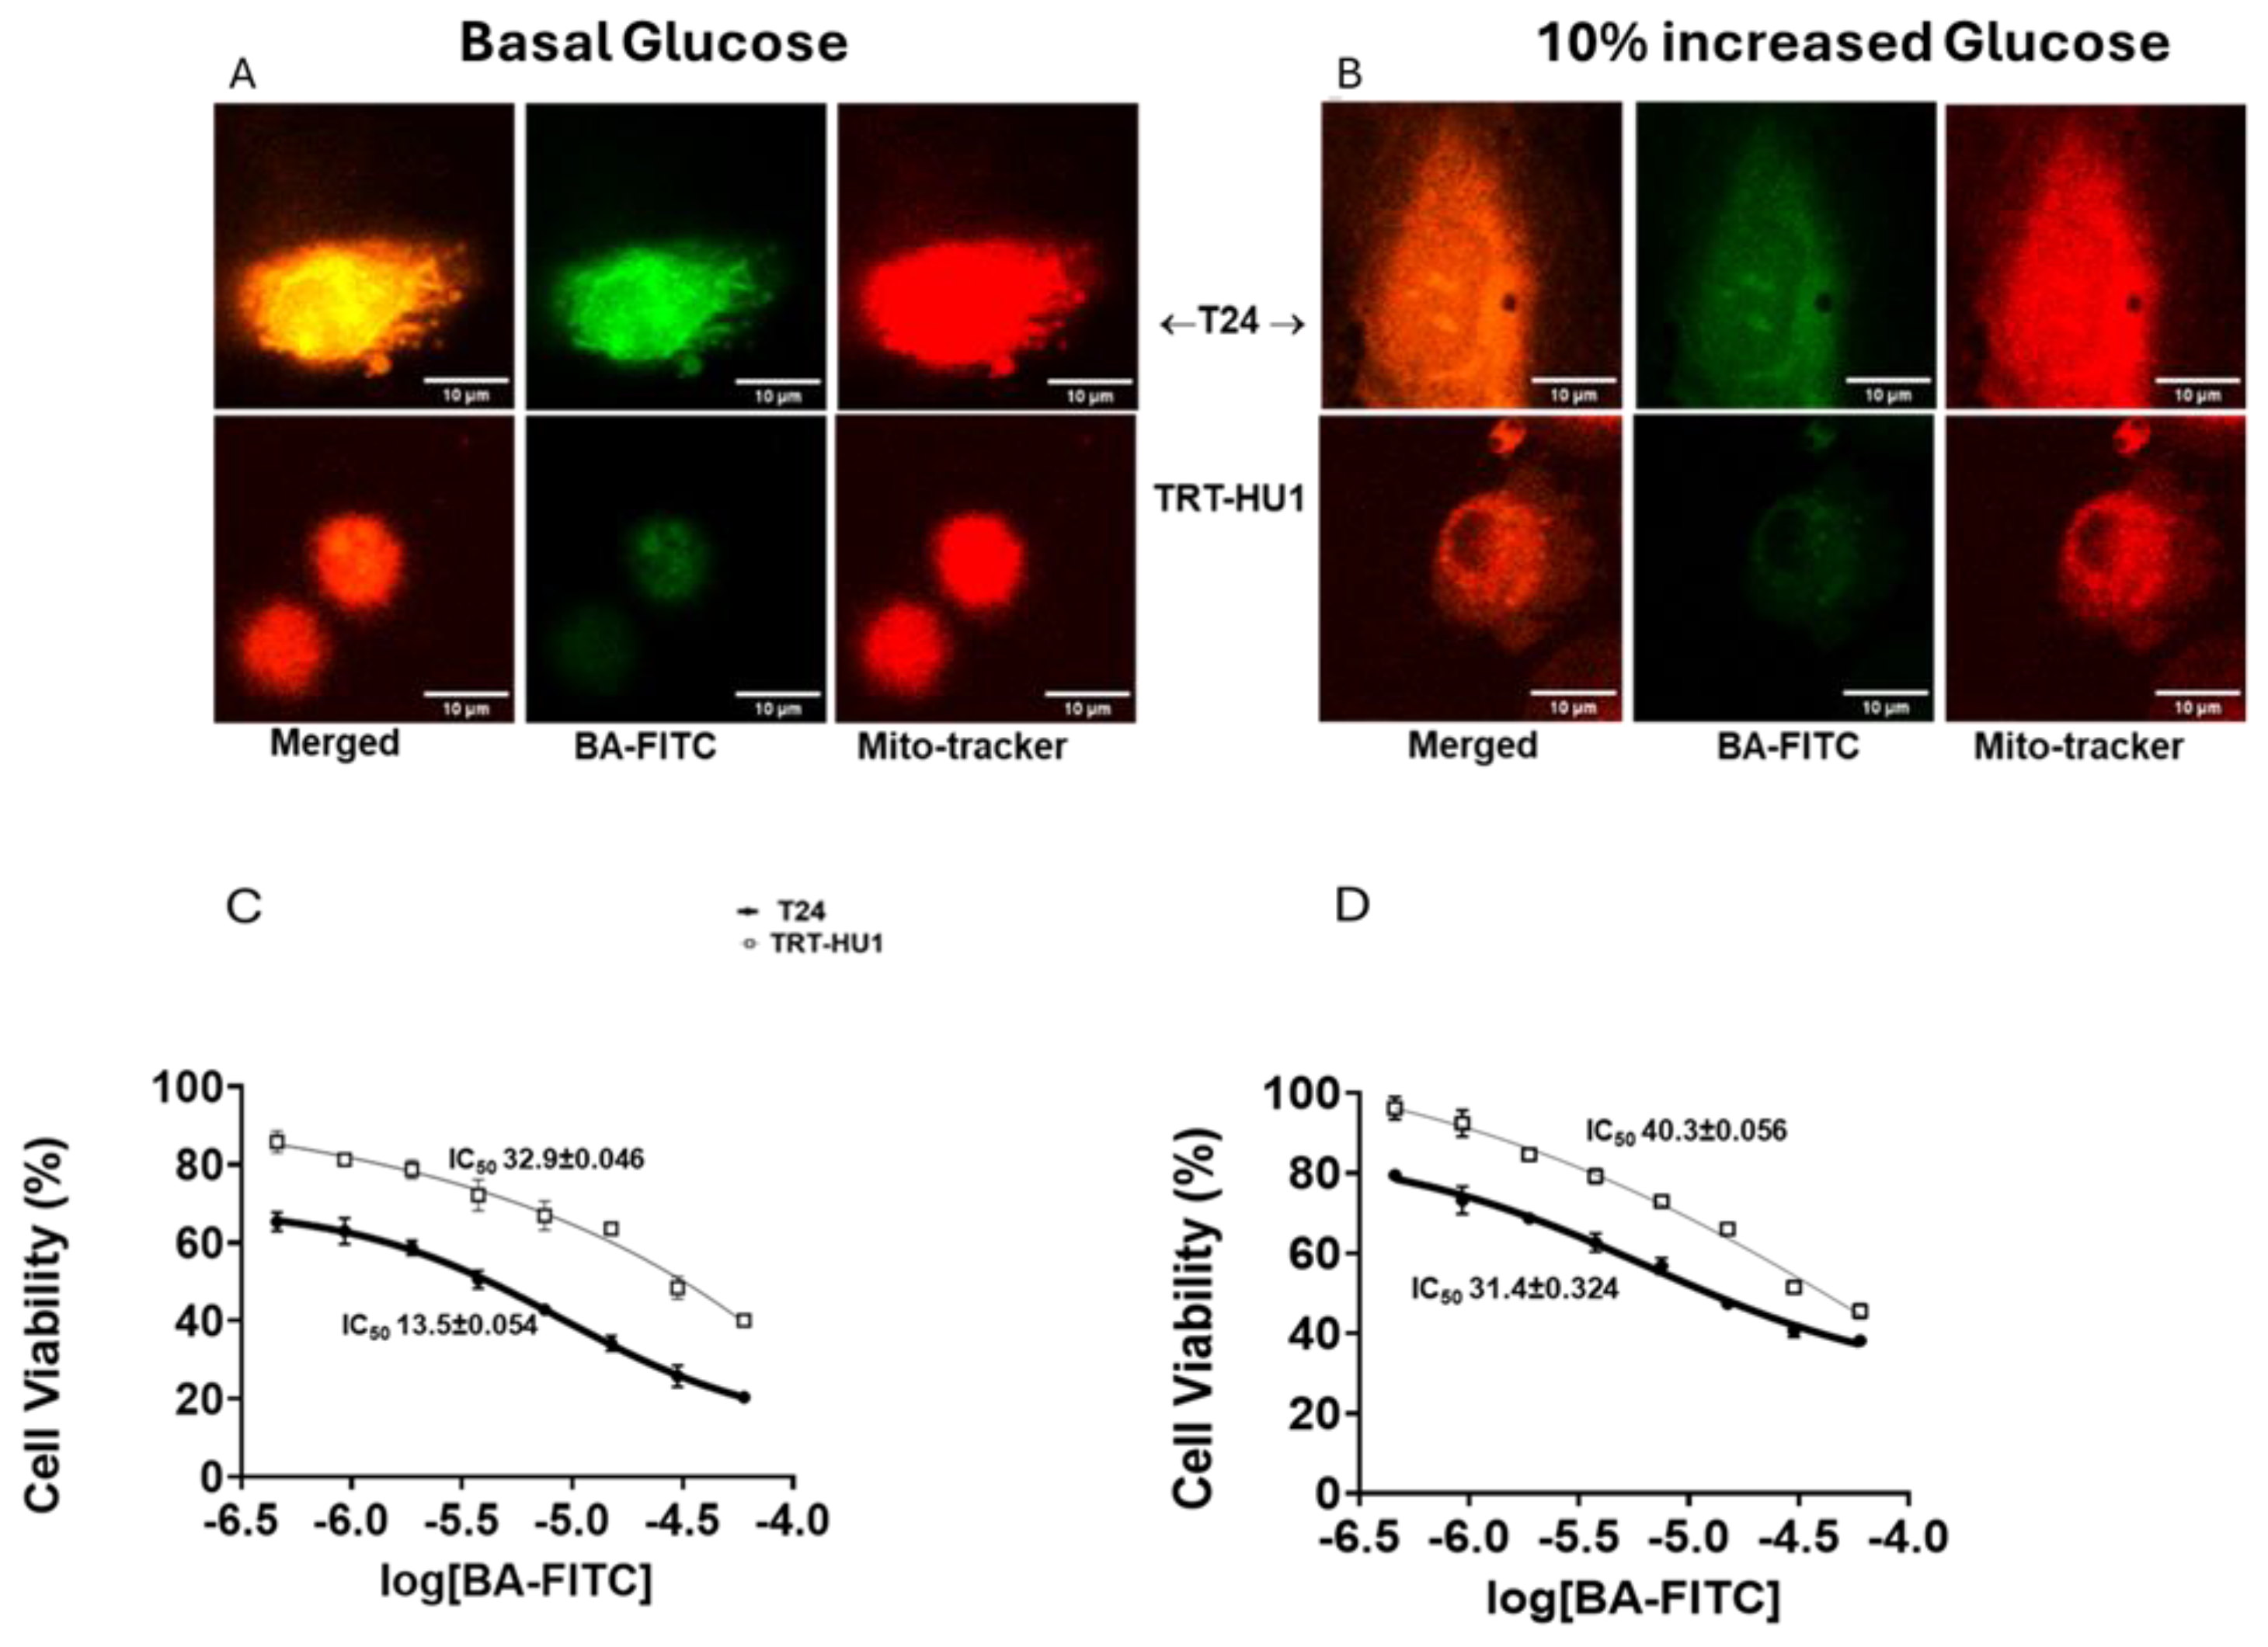
Figure 6.
Brief glucose scarcity was evoked by replacing growth media containing basal or basal+10% increased glucose with unbuffered isotonic solution of pH 7.4. Innately faster proliferation of T24 cell line [ ] than TRT-HUI cells [ ] at basal and basal +10% increased glucose resulted in steeper glycogen depletion (panel A-B) at 60- and 120-min (***p value <0.0001) whereas fatty acid mimetic (BA) slowed glycogen depletion by inhibiting the conversion of glycogen stores into fatty acids at basal (panel C) and at basal+10% increased glucose (panel D). BA evoked cell cycle arrest also slowed proliferation amidst glucose scarcity.
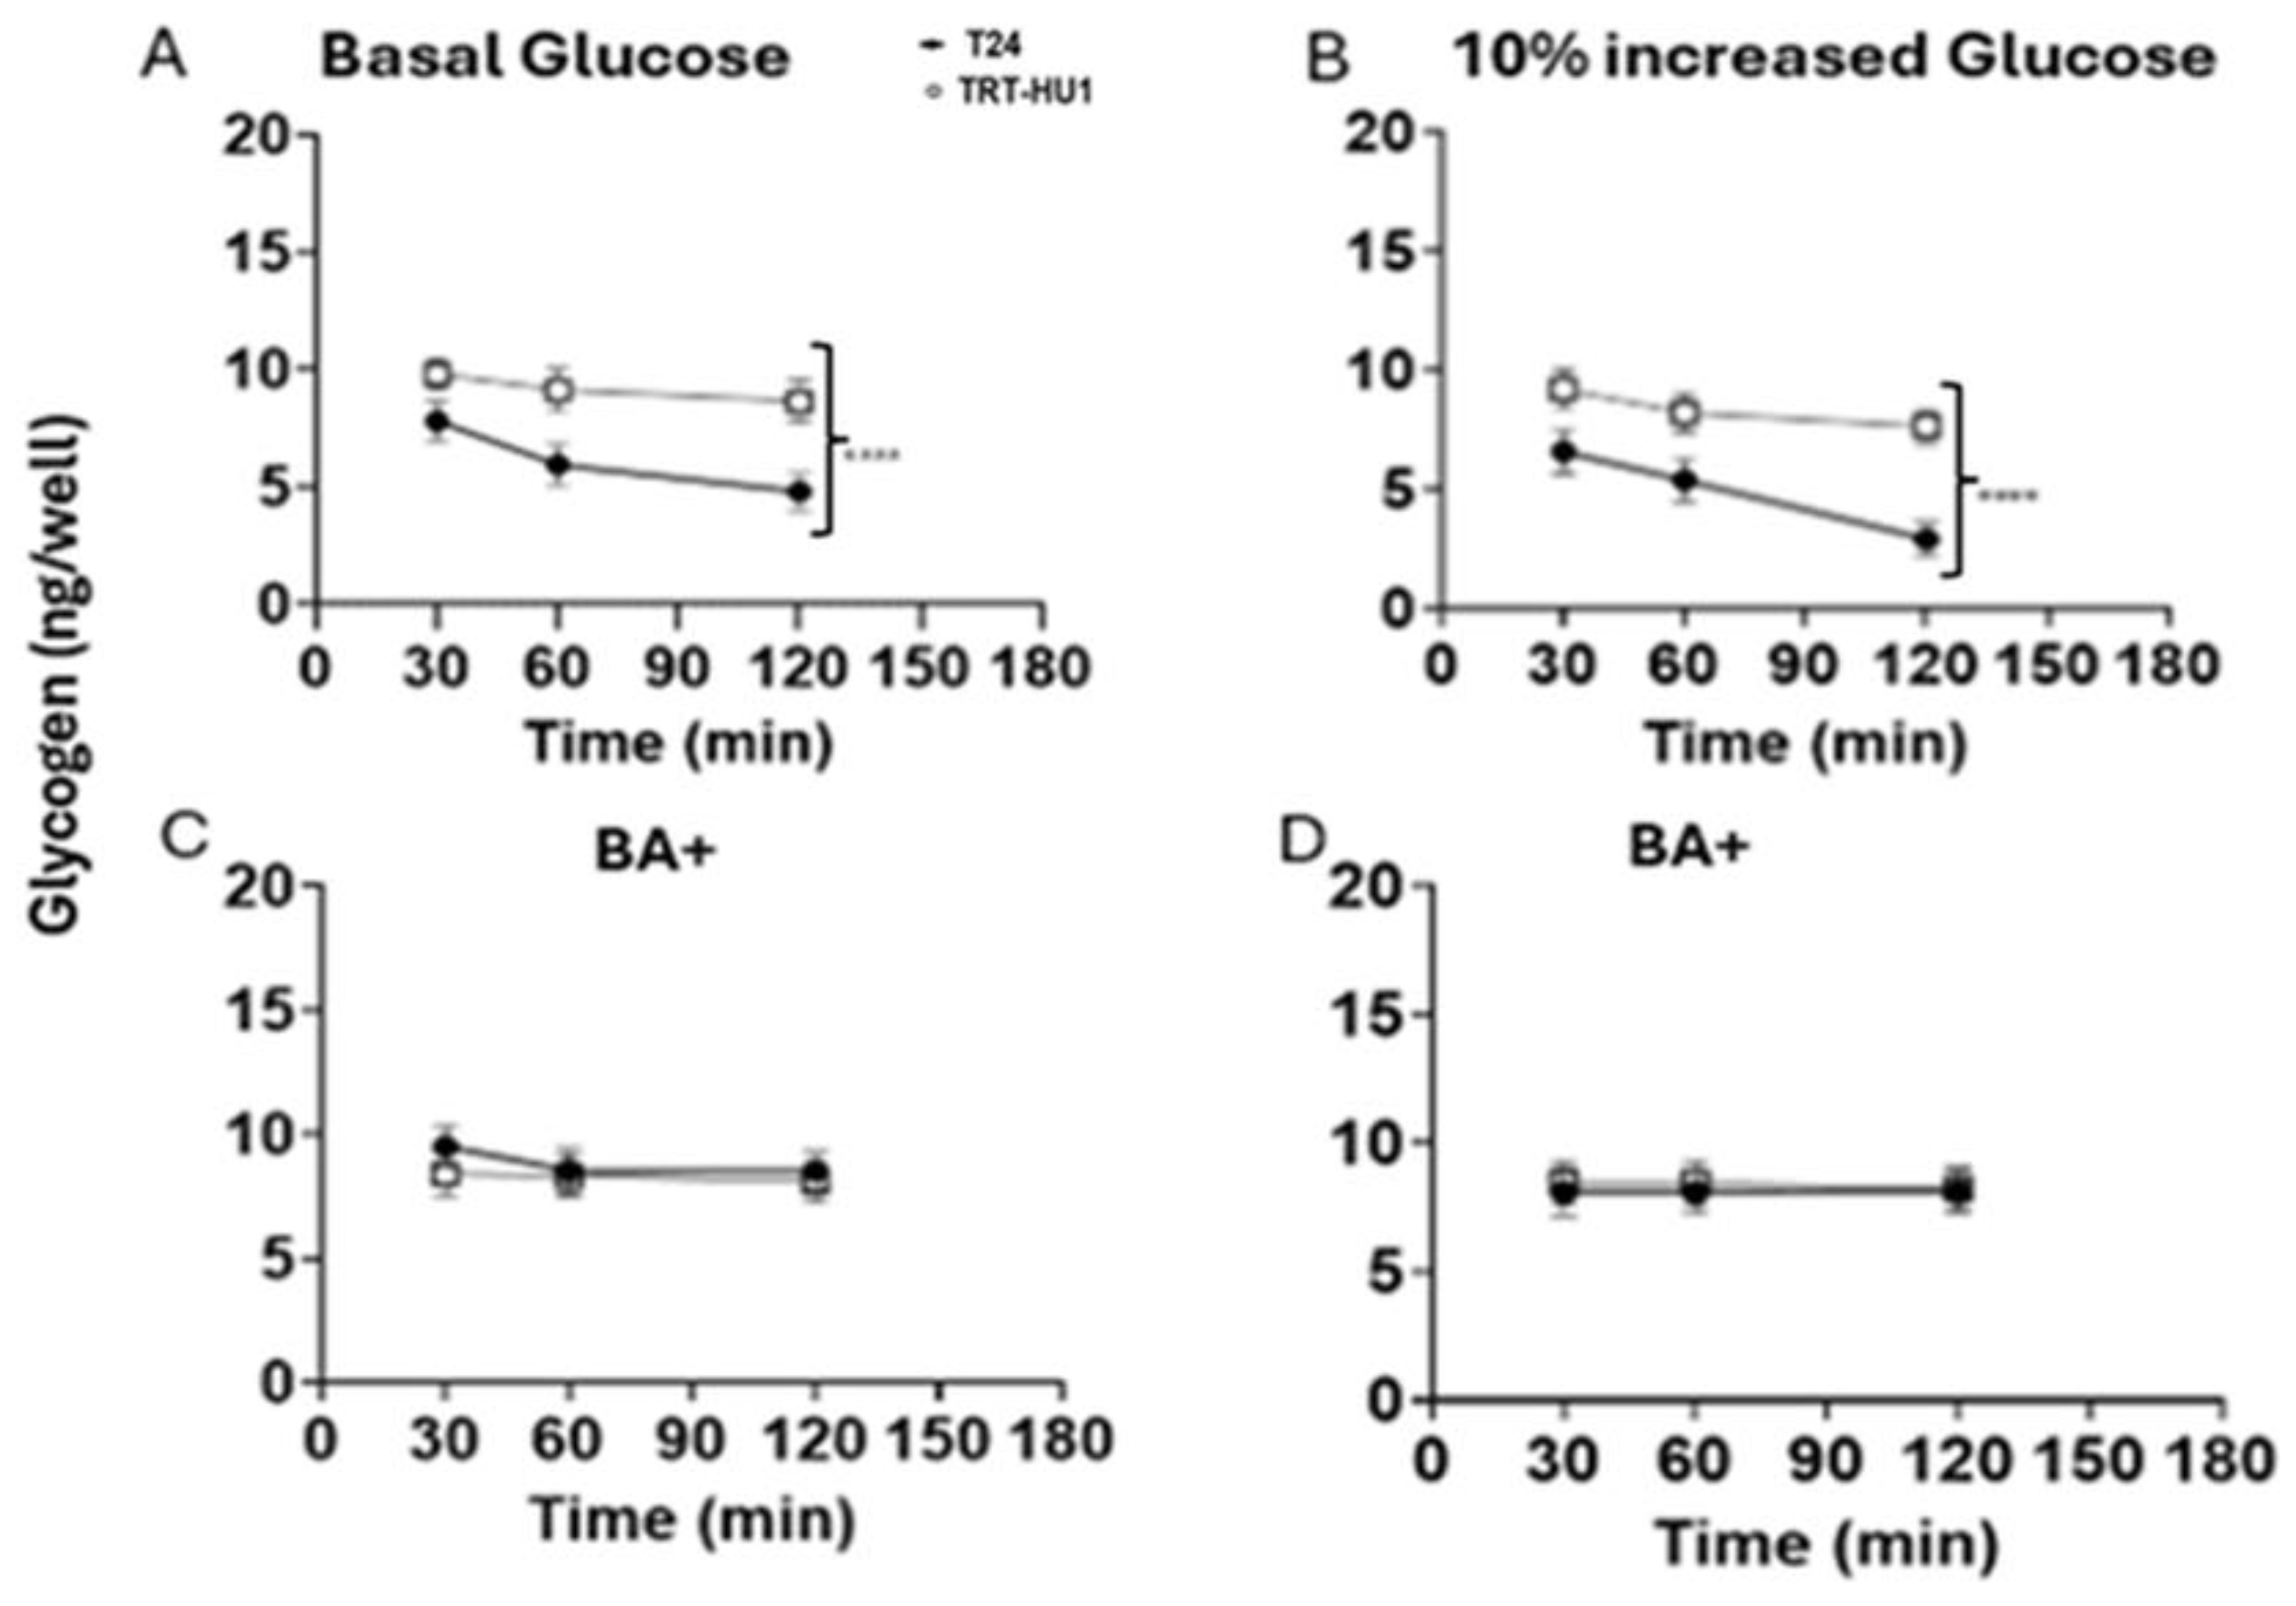
Figure 7.
Brief glucose scarcity was evoked by replacing growth media containing basal or basal+10% increased glucose with unbuffered isotonic solution of pH 7.4. An innately faster proliferation of T24 cell line compared to TRT-HU1cell line resulted in steeper pH decline at 60 and 180 min, p<0.01(panel A). Steeper slope for pH decline in T24 cells [ ] grown at basal +10% increased glucose, p value <0.0001 (panel B) indexes that rapid proliferation amidst glucose scarcity increases lactic acid production (pH decline) in a feed-forward manner whereas flatter slope of pH decline in BA treated T24 and TRT-HU1 cells grown at basal (panel C) and basal+10% increase glucose (panel D) is consistent with reduced glycogenolysis and BA evoked cell cycle arrest reducing lactic acid production.


Table 1.
Two-fold faster doubling time of T24 than TRT-HU1 is dependent on 5-fold higher basal glucose levels of 16mM and 3mM in McCoy’s 5A growth media and Keratinocyte Serum Free media, respectively as an additional 10% glucose increase from basal levels to 17.6mM and 3.3mM significantly decreased the doubling time by >2.8h vs ~ 1h for T24 and TRT-HU1, respectively.
 |
Disclaimer/Publisher’s Note: The statements, opinions and data contained in all publications are solely those of the individual author(s) and contributor(s) and not of MDPI and/or the editor(s). MDPI and/or the editor(s) disclaim responsibility for any injury to people or property resulting from any ideas, methods, instructions or products referred to in the content. |
© 2025 by the authors. Licensee MDPI, Basel, Switzerland. This article is an open access article distributed under the terms and conditions of the Creative Commons Attribution (CC BY) license (http://creativecommons.org/licenses/by/4.0/).
Copyright: This open access article is published under a Creative Commons CC BY 4.0 license, which permit the free download, distribution, and reuse, provided that the author and preprint are cited in any reuse.


