
Submitted:
17 May 2025
Posted:
19 May 2025
You are already at the latest version
Abstract
Huntington's disease (HD) is a severe and progressive neurodegenerative disease for which therapeutic options have so far been confined to symptomatic treatment. Currently, the diagnosis relies on the signs and symptoms shown by patients; however, by that stage, the psychomotor issues have progressed to a point where reversal of the condition is unattainable. Although numerous clinical trials have been actively investigating therapeutic agents aimed at preventing the onset of disease or slowing down the disease progression, there has been a constant need for reliable biomarkers to assess neurodegeneration, monitor disease progression, and assess the efficacy of treatments accurately. Therefore, to discover the key biomarkers associated with the progression of HD, we employed bioinformatics and machine learning (ML) to create a robust pipeline that integrated differentially expressed gene (DEG) analysis with ML to select potential biomarkers. We performed a meta-analysis to identify DEGs using three Gene Expression Omnibus (GEO) microarray datasets from different platforms related to HD-affected brain tissue, applying both relaxed and strict criteria to identify differentially expressed genes. Subsequently, focusing only on genes identified through the inclusive threshold, we employed 19 diverse ML techniques to explore the common genes that contributed to the top three selected ML algorithms and the shared genes that had an impact on the ML algorithms and were observed in the meta-analysis using the stringent condition were selected. Additionally, a receiver operating characteristic (ROC) analysis was conducted on an external dataset to validate the discriminatory power of the identified genes, which led to the selection of GABRD and PHACTR1 as key biomarkers for HD. Our comprehensive methodology, which integrates DEG meta-analysis with ML techniques, enabled a systematic prioritization of these biomarkers, providing valuable insights into their biological significance and potential for further validation in clinical research.
Keywords:
Huntington's disease
; Differentially Expressed Gene
; Machine Learning
; Meta-analysis
1. Introduction
Huntington’s disease (HD) is an autosomal degenerative disorder in brain that progresses with age [1,2], resulted from the mutation in the huntingtin (HTT) gene in chromosome 4p16.3, where an expansion of CAG trinucleotide repeats (more than 35 CAG) in exon1 of the HTT gene onsets the disease by expressing a toxic HTT protein having expanded polyglutamine (polyQ) amino acids [1-3]. The symptoms of HD can be characterized by a triad of progressive motor, cognitive, and psychiatric/behavioral disturbances [1,4], and are typically categorized into three stages, which are presymptomatic, prodromal, and manifest [5]. The presymptomatic stage is a prolonged stage during which individuals do not demonstrate any indications or symptoms regarding HD despite having expanded CAG trinucleotide mutations [5]. Perhaps, individuals with HD often maintain a typical lifestyle, similar to those without HD, until the onset of the prodromal stage, where individuals with expanded CAG begin to exhibit unspecified or potential motor impairments upon examination and minor but notable cognitive alterations [5]. In the manifest stage, individuals display the triad symptoms of HD, including progressive motor, cognitive, and psychiatric/behavioral alterations [5].
HD is diagnosed based on confirmed motor, cognitive, and behavioral signs and symptoms [6]. These signs and symptoms, specifically, the motor function of HD, are most widely assessed using the Unified Huntington’s Disease Rating Scale (UHDRS), which is based on the diagnostic confidence level (DCL) [6]. The DCL value varies from 1 to 4, where a DCL value of 4 indicates 99% confidence that the motor impairments are due to HD [6]. However, a DCL score of 4 reflects the advanced stage of the disease, indicating that by that time the disease has already progressed to the advanced stage [6]. Hence, detecting any early abnormalities and diagnosing HD during the prolonged presymptomatic stage utilizing DCL score is insufficient [6], as during this stage, individuals do not demonstrate any of the triad of HD symptoms, which would appear as notable clinical signs after decades [5]. Thus, owing to the prolonged duration of the presymptomatic stage [5], clinical staging standards could fail to identify any subtle changes during this stage, highlighting the need for a robust and efficient way to monitor the disease onset as well as the progression and stage of the disease.
Recent research has focused on developing an efficient HD staging approach that could precisely diagnose HD from birth until the medical diagnosis [6]. In 2022, Tabrizi et al. proposed an alternative HD diagnosis system, the Huntington’s Disease Integrated Staging System (HD-ISS), which harnesses biomarkers, besides HD pathophysiology for HD staging [6]. In brief, the HD-ISS systems consist of four stages, 0 to 3, where individuals with stage 0 carry the HTT mutation, but no detectable clinical symptoms [6]. Individuals in stage 1 possess early pathological alterations, whereas stage 2 represents a clinical phenotype, and functional deterioration is associated with stage 3 [6]. However, owing to the stringent landmark assessment criteria of the HD-ISS system, which categorizes HD stages by assessing a measure in at least 100 cohorts, no HD biomarkers have been identified till now [6]. This makes it indispensable to develop novel biomarkers that may satisfy the HD-ISS system. Moreover, developing a prognostic biomarker offers not only a way of diagnosing HD during the presymptomatic stage but also an approach to monitor the disease progression, allowing individuals to take necessary actions to prevent and/or slow down the manifestation of HD [7]. They can also be utilized to monitor the efficacy of a therapy, select additional therapy, and monitor recurrent diseases [8-10].
One effective method for identifying HD-related gene-expression signatures is high-throughput transcriptome profiling. Over the decades, many RNA microarray studies on HD patients and controls using induced pluripotent stem cell-derived neurones, peripheral blood, and postmortem brain tissue have been published in the Gene Expression Omnibus (GEO). Indeed, some recent studies have already approached integrative bioinformatics analysis on some of those datasets, particularly from the blood [11,12], to identify the potential HD biomarkers using conventional statistical methods. However, identifying biomarkers from all genomic datasets is often unsuitable through conventional statistical methods [13], particularly due to the unsuitability of these methods to elucidate the intricate relationship among gene expressions [13]. Moreover, the large dimensional datasets are complex to visualize using these methods, making it hard to interpret the results [13]. In order to overcome these limitations, scientists have recently utilized an integration approach of machine learning (ML) algorithms with SHapley Additive exPlanations (SHAP) and nomogram analysis, which can systematically prioritize the genes and hence improve the efficiency of identifying a novel prognostic biomarker [14]. Besides, this integrated approach can also predict if the features (genes) positively or negatively correlate with the disease [14].
In this study, we developed a rigorous, multi-phase pipeline to identify reliable biomarkers for HD, integrating meta-analysis with interpretable ML (Figure 1). We first identified a core collection of consistently dysregulated genes by meta-analysis of publicly accessible three postmortem HD-affected brain tissue microarray datasets from the GEO database using a lenient threshold to capture moderate yet consistent expression changes across samples. Subsequently, 19 supervised ML algorithms comprising tree-based classifiers including Decision Tree (DT), ExtraTrees (ET), Random Forest (RF), Gradient boosting (GB), Catboost (CB), ExtremeGradientBoosting (XGB), Adaptive Boosting (AB), Histogram Gradient Boosting (HGB), Light Gradient Boosting Machine (LGBM), as well as other classifiers consisting of Multi-Layer Perceptron (MLP), K-Nearest Neighbors (KNN), Logistic Regression (LR), Stochastic Gradient Descent (SGD), Support Vector Machine (SVM) with different kernels, Naive Bayes (NB), and Bernoulli Naive Bayes (BNB) have been used on the selected gene list to select features that best distinguish HD cases from controls. Finally, by combining the robustness of meta-analyses (stringent criteria) with the power of ML to choose features with high dimensions, we identified two potential biomarkers that obtained excellent predictive performance in independent validation and were strongly associated with HD risk.
2. Materials and Methods
2.1. Gene Expression Datasets
This study used publicly available gene expression profiles from the NCBI GEO database (https://www.ncbi.nlm.nih.gov/geo/) using the “GEOquery” package from R [15]. Three datasets (GSE3790_GPL96, GSE3790_GPL97, and GSE26927) were considered and generated from distinct sequencing platforms. The GSE3790 dataset contains 404 human brain tissue samples profiled from two different microarray platforms [16,17]. The first platform, GPL96 ([HG-U133A] Affymetrix Human Genome U133A Array), includes 100 HD samples and 101 healthy controls, whereas the second, GPL97 (Affymetrix Human Genome U133B Array), contains 101 HD and 102 healthy brain tissue samples. Lastly, the GSE26927 dataset, generated using the GPL6255 platform (Illumina HumanRef-8 v2.0 Expression BeadChip), includes 20 samples in total, containing an equal number of HD (n=10) and control (n=10) [18,19]. For external validation, we incorporated the GSE9857 dataset [20], which comprises 18 mouse brain tissue samples profiled using the GPL1261 platform Affymetrix Mouse Genome 430 2.0 Array), including 9 samples from HD models and 9 from control mice. All samples from HD were considered diseased (HD) regardless of their subtypes.
2.2. Meta-Analysis
While the datasets were initially normalized and preprocessed according to standard microarray protocols, we additionally applied log transformation to stabilize the variance and enhance cross-sample comparability. Since the datasets originated from different microarray platforms, batch effect correction was performed based on the Combat algorithm of the “sva” R package [21] to minimize platform-specific biases and ensure uniformity across studies. For meta-analysis, expression matrices were harmonized by mapping probe sets to their corresponding gene symbols; in cases where multiple probes mapped to the same gene, the mean expression value was used to generate a unified gene-level profile. Meta-analysis was conducted using the “MetaVolcanoR” [22] package in R, employing Fisher’s p-value combination method to integrate statistical significance across studies. This approach increases analytical power by aggregating independent P-values, enabling robust identification of DEGs across heterogeneous datasets. Two thresholds were used for gene selection. The genes that fulfilled the lenient criteria of an adjusted p-value < 0.05 and an absolute log₂ fold change greater ≥ 0.85 were chosen for ML modelling. Then we applied a stringent criterion of an adjusted p-value < 0.05 and an absolute log₂ fold change > 1, and the genes that fulfilled the condition were selected and further used to identify key genes from the ML analysis.
2.3. Gene Ontology (GO)
The ClusterProfiler [23] package in R was used to analyze the Gene Ontology (GO) terms for the identified DEGs to gain further insight into the biological significance of the selected genes, identifying key biological processes, molecular functions, and cellular components associated with differential gene expression.
2.4. Machine Learning (ML) Modeling
For the ML modeling, we selected the batch effect-corrected combined GSE expression profile as the dataset for ML analysis. We randomly split the dataset into training and testing sets, with 80% of the samples used for training and 20% reserved for testing to evaluate the model’s performance. We selected 19 ML algorithms, leveraging the strengths of various model families to identify the optimal predictive model, ensuring robustness and enhancing the reliability of biomarker identification. We applied grid search hyperparameter tuning based on 10-fold stratified cross-validation in the train set for each algorithm to explore the best set of hyperparameters (Table S1). We computed and examined the AUC (Area Under the ROC Curve) to evaluate the effectiveness of the ML models, along with additional metrics including accuracy (ACC), F1 score, Matthews correlation coefficient (MCC), specificity (SPE), and sensitivity (SEN). To interpret the models, we employed Shapley Additive exPlanations (SHAP) using the Python package “SHAP” [24], which provides both global and local interpretations, enabling us to understand the direction and magnitude of influence for each gene on the predictive outcome.
2.5. External Validation
For external validation, a nomogram was built using the rms package in R using the training set resulting from the ML modelling, which was then tested on GSE9857. The predictive model was developed utilizing genes that overlapped between the machine learning analysis and the meta-analysis performed under a stringent threshold. This approach enables us to assess the selected gene biomarkers’ clinical significance and generalizability. To further evaluate the discriminatory power of the final selected genes in distinguishing between HD and normal samples, ROC curve analysis was performed using the qROC package in R.
3. Results
3.1. Analysis Results of Differentially Expressed Genes
The batch effect was removed from three datasets (GSE3790_GPL96, GSE3790_GPL97, and GSE26927) using ComBat, and the uniformity of the datasets was assessed by using principal components analysis (PCA). The results are plotted in Figure 2a, showing that the batch effect was successfully removed from the datasets. Following this, we conducted the meta-analysis using the R package MetaVolcanoR, where we set the adjusted p-value < 0.05 and absolute log2 fold change ≥ 0.85 to identify the DEGs to consolidate differential expression findings across the cohorts and identify genes consistently dysregulated in HD. We obtained 41 DEGs, as shown in the volcano plot (Figure 2b), of which 10 were down-regulated and the remaining 31 were up-regulated in HD. Additionally, we created a heatmap using these 41 DEGs, which is presented in Figure 2c, which depicts the comparison in expression profiles of each gene between datasets and between the two groups, Control and HD.
3.2. Gene Enrichment Analysis
Next, we examined Gene Ontology (GO) analysis to reveal the functional relevance of identified genes (41 DEGs) in the cellular organization and confirm whether prioritizing candidate genes for ML modeling demonstrates critical cellular activities relevant to HD pathology. As shown in Figure 3a, most of the genes are identified as components of synapses, membrane transport, and ion channel regulators. The GO terms analysis of biological process (BP) shows that regulating monoactomic ion transmembrane transporter activity, neurotransmitter release, dendritic arborization, and action potential are the critical pathways that are significantly dysregulated in HD. Some notable genes associated with these pathways are represented in Figure 3b.
3.3. Machine Learning (ML) Analysis
The 41 genes that met a lenient criteria of adjusted p-value < 0.05 and absolute log₂ fold change ≥ 0.85 from the meta-analysis were input into the ML models for training. A total of 426 samples, containing 238 normal and 186 HD, were randomly divided into training sets (N = 339) and testing sets (N = 87) (Figure S2). We then assessed the classification performance of these ML models on the testing sets (Figure 4a). We chose AUC as the primary evaluation metric for selecting optimal models because it can provide a balanced measure of classification quality, particularly in class imbalance, by considering true and false positives and negatives. The ET model performed very well in categorizing HD and control, obtaining the highest AUC score of 0.867 (Figure 4c) in training and 0.853 (Figure 4d) in testing. Moreover, the MCC of 0.607 in the train set and 0.615 in the test set demonstrates its outstanding performance with minimal difference between the two sets. Besides ET, two other models, CB and XGB, also performed well in classifying the disease from the control. The CB model achieved an AUC of 0.862 (Figure 4c) on the training set and an MCC of 0.587, while on the testing set, it displayed strong discrimination ability with an AUC of 0.854 (Figure 4d). The XGB model attained an AUC of 0.858 (Figure 4d) and an MCC of 0.583 on the test data, while achieving an AUC of 0.870 (Figure 4c) and an MCC of 0.576 during training. We selected these three models to identify significant biomarkers through SHAP analysis.
3.4. Selection of Characteristic Genes from Machine Learning (ML) and Meta-Analysis
We applied the SHAP technique to interpret the predictions of the selected top three ML models (Figure 5a, b, and c), as SHAP values can demonstrate the positive or negative impact of a feature variable on the outcome prediction. We first selected the top 15 genes from each model based on mean absolute SHAP values and compared them to find consistently prioritized genes by all three methods. Notably, NETO2, PAX6, BCL11B, GFAP, GABRD, and PHACTR1 repeatedly appeared among the top predictors (Figure 5d), exhibiting their robust and consistent association with the disease classification. To further investigate how different expression levels of genes contributed positively or negatively to the probability of HD, we computed a SHAP summary plot for each model, presenting the relationship between the expression levels of genes and the degree of high and low SHAP values in the testing dataset. On the SHAP summary plot, feature variables with higher SHAP values were closely associated with an increased risk of developing HD. In the top-performing model ET (Figure 5a), we found that PAX6 shows high feature values x (red dots) clustered on the left side, where SHAP values are negative, which means that the high expression of PAX6 is associated with a lower predicted probability of HD occurring. Conversely, low expression (blue points) corresponded to higher SHAP values and thus increased the model’s predicted probability of HD occurrence. This is seen by other top-performing models (CB, XGB) (Figure 5b and c). The GFAP gene, which is at the top of the XGB model (Figure 5c), shows that high expression levels (red dots) are mainly found in the negative SHAP region, indicating that increased GFAP expression is associated with reducing the risk of HD occurring. Conversely, the feature BCL11B shows the opposite impact, where high expression value is on the positive side of the SHAP region, leading to a significant increase in expression, significantly increasing the model’s prediction of HD occurrence. Other genes follow similar patterns. The high expression value (red points) of GABRD was correlated with positive SHAP values, signifying that an increase in GABRD expression positively influences the model’s prediction of HD. In contrast, lower GABRD expression (blue spots) correlated with negative SHAP values, indicating a reduced risk. A similar expression pattern was also observed for PHACTR1. Subsequently, we selected the 5 robust genes that were found to be present by both ML and meta-analysis with stringent criteria (Figure 5e).
3.5. Construction of a Nomogram and Validation by External Datasets
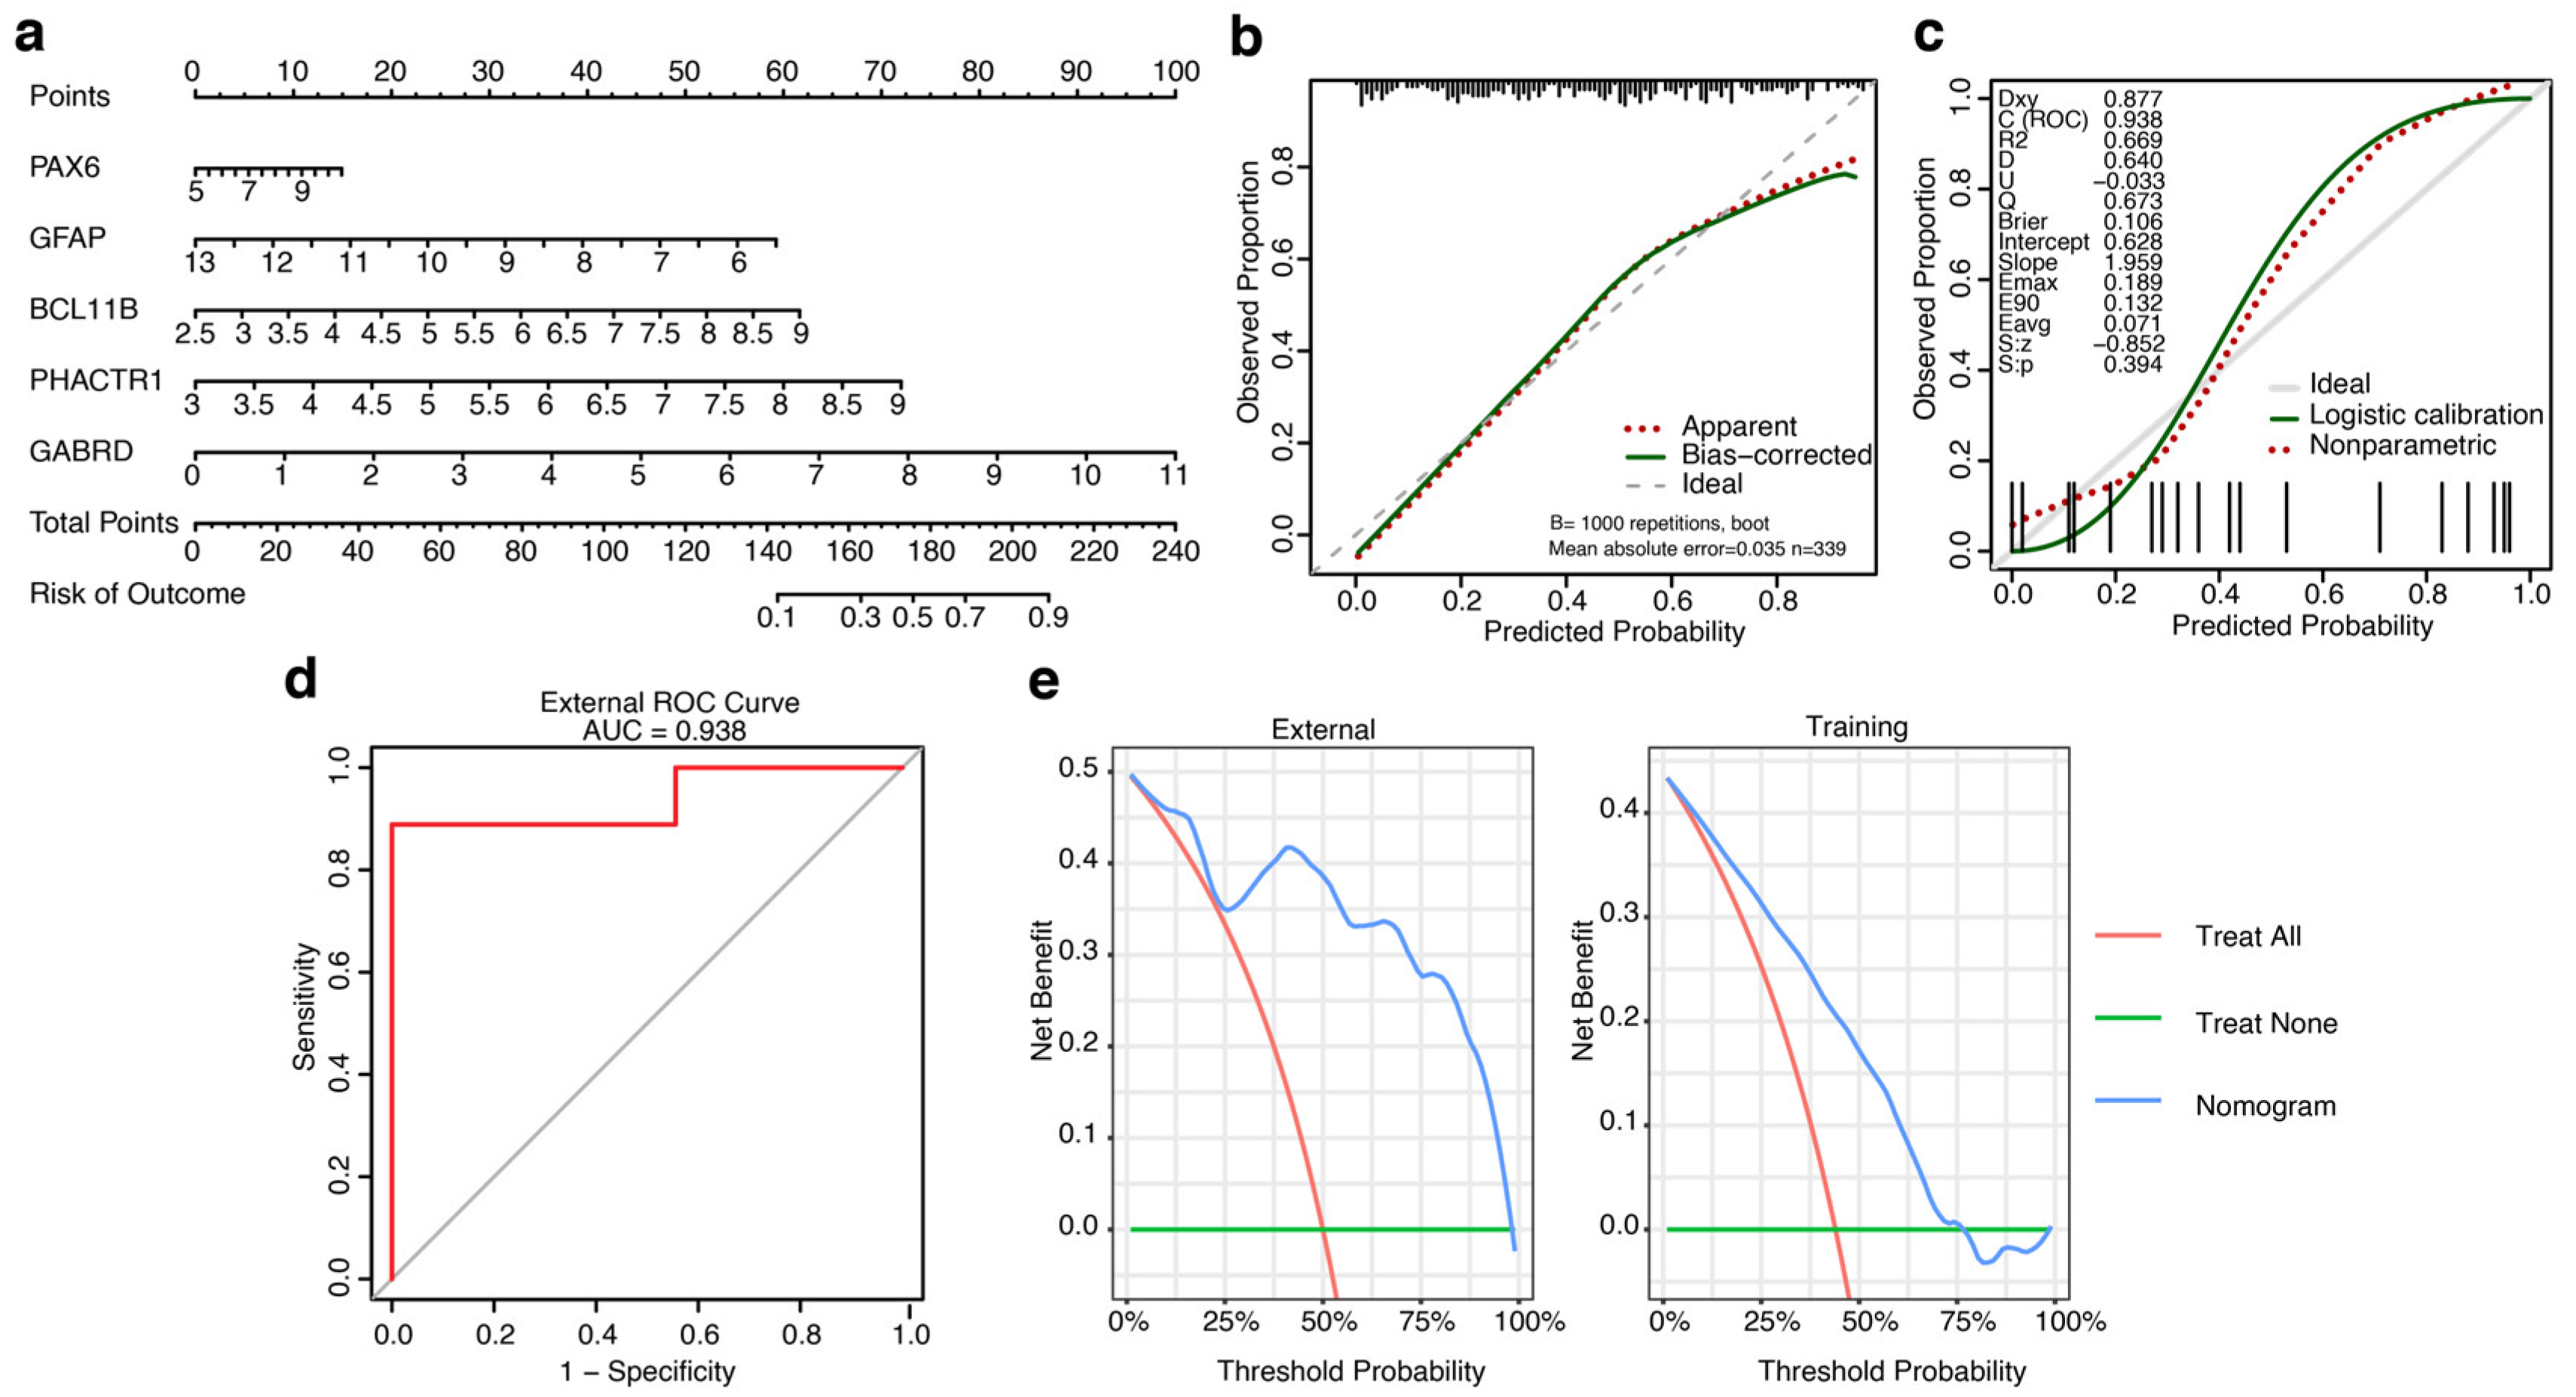
Next, we constructed a nomogram using the training dataset of ML to predict the potential risks of developing HD and assess the predictive capacity of five features identified by ML models, including PAX6, GFAP, BCL11B, PHACTR1, and GABRD. As depicted in Figure 6a, the nomogram model assigns total points ranging from 0 to 260, where a point from 148 to 218 corresponds to 0.1 to 0.9 of the risk of developing HD. The calibration curve was constructed using bootstrapping (resampling = 1000). As illustrated in Figure 6b, the calibration closely follows the ideal curve, suggesting the model’s accuracy in predicting risks of developing HD. The calibration curve demonstrated a p-value (S.p) greater than 0.05 and an AUC of 0.938, verifying the model’s accuracy (Figure 6c). We additionally assessed the accuracy of the model using an external validation dataset, GSE9857, and an ROC curve was constructed. As shown in Figure 6d, the ROC curve had an AUC score of 0.938, further confirming our model’s accuracy. Next, we conducted decision curve analysis (DCA) using the training dataset of ML and the external dataset to evaluate the clinical effectiveness of our constructed model again. As shown in Figure 6e, the DCA curve displayed that the nomogram had good net benefits for clinical use.
We used the external dataset to analyze ROC curves of the five genes to further evaluate the discriminative ability to distinguish between HD and control samples. The outcome shown in Figure S3 demonstrates that each of the five genes displays an AUC higher than 0.60 in the external dataset. Among the five genes, the GABRD and PHACTR1 achieved an AUC of 1.00 and 0.925, respectively. This indicates their superior ability to distinguish HD and normal. Due to their superior discriminative performance in the external validation dataset, we selected GABRD and PHACTR1 as the final biomarkers for HD.
4. Discussion
In this study, we have utilized three HD microarray datasets studied postmortem brain tissue to disclose a potential biomarker with prognostic value that can detect disease progression during the prolonged presymptomatic stage and monitor the treatment efficacy. Although efforts from previous studies on biomarker identification mostly rely on analyzing blood transcriptome profiling, the most reliable way to understand the molecular basis of disease processes specific to a particular tissue is by analyzing RNA expression in postmortem tissue, because of its sensitivity to local pathology, superiority to cell type resolution and lack of systemic confounding [25-27].
To find reliable biomarkers for HD, we used a two-step workflow in this study: first, a thorough meta-analysis of HD microarray datasets; and second, supervised ML. In many disease contexts, meta-analysis of microarray data has increased statistical power and reproducibility, providing a more meaningful understanding of the underlying biological processes [28]. Our findings extend this paradigm to the discovery of HD biomarkers. In addition, this approach addresses sample heterogeneity by employing data aggregation, stringent quality control, and statistical modelling that explicitly considers inter-study variations [29-31]. We used two criteria for sorting the candidate DEGs (a relaxed and stringent), where a relaxed criterion (adjusted p-value < 0.05, and absolute log2 fold change ≥ 0.85), which identifies 41 genes subjected to ML modeling. A lowered threshold (relaxed criterion) ensures the model picks up weak but biologically significant signals, keeping a broader range of potentially informative features. These genes may not meet stringent statistical cut-offs but could contribute meaningfully to classification performance. Perhaps, analysis of GO enrichment suggests that the dysregulation of these 41 genes is responsible for alterations in some essential signaling pathways, including synapse function and dendritic arborization, which are known to exacerbate HD pathophysiology [32-36] and contribute to motor and cognitive symptoms. Furthermore, striatal neurones, which are particularly affected in HD, show alterations in action potentials and membrane potentials, including changes in the patterns of action potential firing and a shift towards the depolarisation of resting membrane potentials, which are also associated with motor and cognitive symptoms [37-39].
To refine these candidates, we leveraged the strength of 19 ML classifiers, as not all models are suitable for all data types. For example, training a deep neural network with high-dimensional data of a few hundred patient samples will likely result in a highly overfitted model. Hence, it is necessary to carefully choose the right types of models a priori and not purely rely on brute force computational power [40]. When estimating a model’s generalization performance from observational data, the variability in biomedical datasets is often high, due to both technical and biological sources of variation. To address this challenge, we evaluated each model using cross-validation to avoid hyperparameter-tuning bias and obtain nearly unbiased performance estimates [41]. AUC selected the top three models from these ML models, providing consistent model evaluation. AUC evaluates the model using all thresholds, effectively addressing the effect of changing prevalence (proportion of positive cases). Models’ feature rankings were interpreted using SHAP, a game-theoretically grounded method that provides consistent, locally accurate attributions for any model class [24]. By intersecting the top features across these three models, we distilled a consensus list of six genes, thereby reducing algorithm-specific selection biases and focusing on features with broad predictive relevance. Next, we reinforced reproducibility by re-applying meta-analysis with a stringent fold-change cut-off of 1.0, yielding 13 DEGs. The intersection of these 13 genes with our six consensus ML-selected genes produced a core set of five candidates. Crucially, this set was subjected to an external validation cohort by building a nomogram and ROC curve analysis, in which the final two biomarkers GABRD and PHACTR1, achieved AUCs of 1.00 and 0.98, respectively, confirming their high discriminative power and generalizability. Such performance in an external cohort underscores the robustness of our integrative approach and parallels outcomes seen in other ML biomarker studies with rigorous external testing.
The GABAAR δ subunit, GABRD, was consistently given priority by the ML models, which aligns with the recognised role of GABAergic dysfunction in the development of HD. A previous study identified that GABRD is abundantly expressed in the cerebellum, cortex, and hippocampus, localized in the cytosol and membranes of the neurons [42]. Santhakumar et al observed that animals deficient in tonic GABA currents had decreased survival after an in vitro excitotoxic challenge with quinolinic acid, indicating a neuroprotective function against excitotoxic damage in the adult striatum [43]. More importantly, in experimental settings, GABRD is identified as a blood biomarker for Alzheimer’s disease (AD) detection by untargeted proteomics profiling, where GABRD-positive neuronal extracellular vesicles represent synaptic dysfunction and neuronal death [42].
On the other hand, PHACTR1, which is implicated in dendritic arborization in the gene enrichment analysis, was repeatedly selected, highlighting novel facets of HD biology that warrant further mechanistic study. PHACTR1 encodes protein phosphatase and actin regulator 1 that binds actin and protein phosphatase 1 (PP1) and plays a critical role in the actin cytoskeleton and dynamics. PHACTR1 has been identified in the synaptosome, co-localizing with the synaptic marker synaptophysin, detectable in dendrites at DIV21, and strongly expressed in differentiated neurons within the adult mouse cerebral cortex [44,45]. Dendritic spine formation and synaptic plasticity are processes known to be impaired in HD, and they are supported by actin dynamics in neurons. Although there is a lack of direct mechanistic studies on PHACTR1 in HD, a recent investigation revealed that PHACTR1 is among a limited number of genes that are more prevalent in the striatum and whose dysregulation correlates with the emergence of somatic CAG repeats and neurodegeneration in HD murine models [46].
Although our study, using an integrated bioinformatics and ML model, discloses GABRD and PHACTR1 as novel key biomarkers for HD, it still has certain constraints. Firstly, our work lacked any in vivo and/or in vitro validation experiments; instead, it exploited data from a public database to identify potential biomarkers. Secondly, further research is yet to be completed to understand intricately how these genes contribute to HD progression and corroborate their viability as diagnostic markers. Thirdly, the selected datasets had a limited sample size and were only collected from the GEO database. Finally, the selected datasets were processed using different platforms, and although we removed the batch effects using the “sva” package, they could still contain some degree of noise.
5. Conclusions
Identifying a novel prognostic biomarker is indispensable not only to diagnose HD during the presymptomatic stage but also to monitor the progression of HD, allowing individuals to take necessary actions to prevent and/or slow down the manifestation of HD. Utilizing an integrated bioinformatics and ML approach, this study discloses two genes, GABRD and PHACTR1, as candidate potential biomarkers for HD. The findings of this study can be further studied using in vitro and clinical testing to understand how these genes contribute to HD and to ascertain their efficiency as prognostic biomarkers.
Supplementary Materials
The following supporting information can be downloaded at the website of this paper posted on Preprints.org, Figure S1: Identification of differentially expressed genes (DEGs) from GSE3790_GPL96, GSE3790_GPL97, and GSE26927 using meta-analysis following stringent criteria; Figure S2: Distribution of HD and Control Samples in Training and Test Sets; Figure S3: ROC curve analysis of five robust genes (a) GABRD, (b) PHACTR1, (c) PAX6, (d) BCL11B, and (e) GFAP, for diagnostic performance; Table S1: Selected hyperparameters for top-performing classifiers.
Author Contributions
The authors confirm their contributions to this manuscript as follows: Conceptualization, N.D. and R.D.; methodology, N.D. and M.A.B.; software, N.D.; validation, N.D. and M.A.B.; formal analysis, N.D. and M.A.B.; investigation, N.D. M.A.B., J.L., and R.D.; resources, R.D.; data curation, N.D. and M.A.B.; writing—original draft preparation, N.D., M.A.B., and R.D.; writing—review and editing, N.D., M.A.B., and R.D.; visualization, N.D., M.A.B., J.L.; and R.D.; supervision, R.D.; project administration, R.D. All authors have read and agreed to the published version of the manuscript.
Funding
This research received no external funding.
Institutional Review Board Statement
Not applicable.
Informed Consent Statement
Not applicable.
Data Availability Statement
All raw data included in this article are accessible to qualified researchers upon request.
Conflicts of Interest
The authors declare no conflicts of interest.
References
- McColgan, P.; Tabrizi, S.J. Huntington’s disease: a clinical review. Eur J Neurol 2018, 25, 24-34. [CrossRef]
- Moss, D.J.H.; Pardiñas, A.F.; Langbehn, D.; Lo, K.; Leavitt, B.R.; Roos, R.; Durr, A.; Mead, S.; Holmans, P.; Jones, L.; et al. Identification of genetic variants associated with Huntington’s disease progression: a genome-wide association study. Lancet Neurol 2017, 16, 701-711. [CrossRef]
- A novel gene containing a trinucleotide repeat that is expanded and unstable on Huntington’s disease chromosomes. The Huntington’s Disease Collaborative Research Group. Cell 1993, 72, 971-983. [CrossRef]
- Nance, M.A. Huntington disease: clinical, genetic, and social aspects. J Geriatr Psychiatry Neurol 1998, 11, 61-70. [CrossRef]
- Waldvogel, H.J.; Kim, E.H.; Thu, D.C.; Tippett, L.J.; Faull, R.L. New Perspectives on the Neuropathology in Huntington’s Disease in the Human Brain and its Relation to Symptom Variation. J Huntingtons Dis 2012, 1, 143-153. [CrossRef]
- Tabrizi, S.J.; Schobel, S.; Gantman, E.C.; Mansbach, A.; Borowsky, B.; Konstantinova, P.; Mestre, T.A.; Panagoulias, J.; Ross, C.A.; Zauderer, M.; et al. A biological classification of Huntington’s disease: the Integrated Staging System. Lancet Neurol 2022, 21, 632-644. [CrossRef]
- Paulsen, J.S.; Long, J.D.; Johnson, H.J.; Aylward, E.H.; Ross, C.A.; Williams, J.K.; Nance, M.A.; Erwin, C.J.; Westervelt, H.J.; Harrington, D.L.; et al. Clinical and Biomarker Changes in Premanifest Huntington Disease Show Trial Feasibility: A Decade of the PREDICT-HD Study. Front Aging Neurosci 2014, 6, 78. [CrossRef]
- Bodaghi, A.; Fattahi, N.; Ramazani, A. Biomarkers: Promising and valuable tools towards diagnosis, prognosis and treatment of Covid-19 and other diseases. Heliyon 2023, 9, e13323. [CrossRef]
- Biomarkers and surrogate endpoints: preferred definitions and conceptual framework. Clin Pharmacol Ther 2001, 69, 89-95. [CrossRef]
- Godfrey, A.; Vandendriessche, B.; Bakker, J.P.; Fitzer-Attas, C.; Gujar, N.; Hobbs, M.; Liu, Q.; Northcott, C.A.; Parks, V.; Wood, W.A.; et al. Fit-for-Purpose Biometric Monitoring Technologies: Leveraging the Laboratory Biomarker Experience. Clin Transl Sci 2021, 14, 62-74. [CrossRef]
- Christodoulou, C.C.; Papanicolaou, E.Z. Integrated Bioinformatics Analysis of Shared Genes, miRNA, Biological Pathways and Their Potential Role as Therapeutic Targets in Huntington’s Disease Stages. Int J Mol Sci 2023, 24. [CrossRef]
- Chakraborty, S. Identification of Blood Based Bio-Marker for Huntington’s disease using in-silico gene expression analysis. bioRxiv 2021, 2021.2003.2026.437248. [CrossRef]
- Ng, S.; Masarone, S.; Watson, D.; Barnes, M.R. The benefits and pitfalls of machine learning for biomarker discovery. Cell Tissue Res 2023, 394, 17-31. [CrossRef]
- Lai, Y.; Lin, X.; Lin, C.; Lin, X.; Chen, Z.; Zhang, L. Identification of endoplasmic reticulum stress-associated genes and subtypes for prediction of Alzheimer’s disease based on interpretable machine learning. Front Pharmacol 2022, 13, 975774. [CrossRef]
- Davis, S.; Meltzer, P.S. GEOquery: a bridge between the Gene Expression Omnibus (GEO) and BioConductor. Bioinformatics 2007, 23, 1846-1847. [CrossRef]
- Hodges, A.; Strand, A.D.; Aragaki, A.K.; Kuhn, A.; Sengstag, T.; Hughes, G.; Elliston, L.A.; Hartog, C.; Goldstein, D.R.; Thu, D.; et al. Regional and cellular gene expression changes in human Huntington’s disease brain. Hum Mol Genet 2006, 15, 965-977. [CrossRef]
- Jones, L.; Goldstein, D.R.; Hughes, G.; Strand, A.D.; Collin, F.; Dunnett, S.B.; Kooperberg, C.; Aragaki, A.; Olson, J.M.; Augood, S.J.; et al. Assessment of the relationship between pre-chip and post-chip quality measures for Affymetrix GeneChip expression data. BMC Bioinformatics 2006, 7, 211. [CrossRef]
- Durrenberger, P.F.; Fernando, F.S.; Magliozzi, R.; Kashefi, S.N.; Bonnert, T.P.; Ferrer, I.; Seilhean, D.; Nait-Oumesmar, B.; Schmitt, A.; Gebicke-Haerter, P.J.; et al. Selection of novel reference genes for use in the human central nervous system: a BrainNet Europe Study. Acta Neuropathol 2012, 124, 893-903. [CrossRef]
- Durrenberger, P.F.; Fernando, F.S.; Kashefi, S.N.; Bonnert, T.P.; Seilhean, D.; Nait-Oumesmar, B.; Schmitt, A.; Gebicke-Haerter, P.J.; Falkai, P.; Grünblatt, E.; et al. Common mechanisms in neurodegeneration and neuroinflammation: a BrainNet Europe gene expression microarray study. J Neural Transm (Vienna) 2015, 122, 1055-1068. [CrossRef]
- Kuhn, A.; Goldstein, D.R.; Hodges, A.; Strand, A.D.; Sengstag, T.; Kooperberg, C.; Becanovic, K.; Pouladi, M.A.; Sathasivam, K.; Cha, J.H.; et al. Mutant huntingtin’s effects on striatal gene expression in mice recapitulate changes observed in human Huntington’s disease brain and do not differ with mutant huntingtin length or wild-type huntingtin dosage. Hum Mol Genet 2007, 16, 1845-1861. [CrossRef]
- Leek, J.T.; Johnson, W.E.; Parker, H.S.; Jaffe, A.E.; Storey, J.D. The sva package for removing batch effects and other unwanted variation in high-throughput experiments. Bioinformatics 2012, 28, 882-883. [CrossRef]
- Prada C, L.D., Nakaya H. MetaVolcanoR: Gene Expression Meta-analysis Visualization Tool. 2020.
- Yu, G.; Wang, L.G.; Han, Y.; He, Q.Y. clusterProfiler: an R package for comparing biological themes among gene clusters. Omics 2012, 16, 284-287. [CrossRef]
- Lundberg, S.M.; Lee, S.-I. A unified approach to interpreting model predictions. In Proceedings of the Proceedings of the 31st International Conference on Neural Information Processing Systems, Long Beach, California, USA, 2017; pp. 4768–4777.
- Sullivan, P.F.; Fan, C.; Perou, C.M. Evaluating the comparability of gene expression in blood and brain. Am J Med Genet B Neuropsychiatr Genet 2006, 141b, 261-268. [CrossRef]
- Cai, C.; Langfelder, P.; Fuller, T.F.; Oldham, M.C.; Luo, R.; van den Berg, L.H.; Ophoff, R.A.; Horvath, S. Is human blood a good surrogate for brain tissue in transcriptional studies? BMC Genomics 2010, 11, 589. [CrossRef]
- Tylee, D.S.; Kawaguchi, D.M.; Glatt, S.J. On the outside, looking in: a review and evaluation of the comparability of blood and brain “-omes”. Am J Med Genet B Neuropsychiatr Genet 2013, 162b, 595-603. [CrossRef]
- Tseng, G.C.; Ghosh, D.; Feingold, E. Comprehensive literature review and statistical considerations for microarray meta-analysis. Nucleic Acids Research 2012, 40, 3785-3799. [CrossRef]
- Ramasamy, A.; Mondry, A.; Holmes, C.C.; Altman, D.G. Key issues in conducting a meta-analysis of gene expression microarray datasets. PLoS Med 2008, 5, e184. [CrossRef]
- Kang, D.D.; Sibille, E.; Kaminski, N.; Tseng, G.C. MetaQC: objective quality control and inclusion/exclusion criteria for genomic meta-analysis. Nucleic Acids Res 2012, 40, e15. [CrossRef]
- Baker, W.L.; White, C.M.; Cappelleri, J.C.; Kluger, J.; Coleman, C.I. Understanding heterogeneity in meta-analysis: the role of meta-regression. Int J Clin Pract 2009, 63, 1426-1434. [CrossRef]
- Galimberti, M.; Nucera, M.R.; Bocchi, V.D.; Conforti, P.; Vezzoli, E.; Cereda, M.; Maffezzini, C.; Iennaco, R.; Scolz, A.; Falqui, A.; et al. Huntington’s disease cellular phenotypes are rescued non-cell autonomously by healthy cells in mosaic telencephalic organoids. Nature Communications 2024, 15, 6534. [CrossRef]
- Bano, D.; Zanetti, F.; Mende, Y.; Nicotera, P. Neurodegenerative processes in Huntington’s disease. Cell Death & Disease 2011, 2, e228-e228. [CrossRef]
- Cha, J.-H.J.; Kosinski, C.M.; Kerner, J.A.; Alsdorf, S.A.; Mangiarini, L.; Davies, S.W.; Penney, J.B.; Bates, G.P.; Young, A.B. Altered brain neurotransmitter receptors in transgenic mice expressing a portion of an abnormal human Huntington disease gene. Proceedings of the National Academy of Sciences 1998, 95, 6480-6485, doi:doi:10.1073/pnas.95.11.6480.
- Smith-Dijak, A.I.; Sepers, M.D.; Raymond, L.A. Alterations in synaptic function and plasticity in Huntington disease. Journal of Neurochemistry 2019, 150, 346-365. [CrossRef]
- Chen, S.; Yu, C.; Rong, L.; Li, C.H.; Qin, X.; Ryu, H.; Park, H. Altered Synaptic Vesicle Release and Ca2+ Influx at Single Presynaptic Terminals of Cortical Neurons in a Knock-in Mouse Model of Huntington’s Disease. Frontiers in Molecular Neuroscience 2018, Volume 11 - 2018. [CrossRef]
- Klapstein, G.J.; Fisher, R.S.; Zanjani, H.; Cepeda, C.; Jokel, E.S.; Chesselet, M.F.; Levine, M.S. Electrophysiological and morphological changes in striatal spiny neurons in R6/2 Huntington’s disease transgenic mice. J Neurophysiol 2001, 86, 2667-2677. [CrossRef]
- Waters, C.W.; Varuzhanyan, G.; Talmadge, R.J.; Voss, A.A. Huntington disease skeletal muscle is hyperexcitable owing to chloride and potassium channel dysfunction. Proc Natl Acad Sci U S A 2013, 110, 9160-9165. [CrossRef]
- Akopian, G.; Barry, J.; Cepeda, C.; Levine, M.S. Altered membrane properties and firing patterns of external globus pallidus neurons in the R6/2 mouse model of Huntington’s disease. J Neurosci Res 2016, 94, 1400-1410. [CrossRef]
- Diaz-Uriarte, R.; Gómez de Lope, E.; Giugno, R.; Fröhlich, H.; Nazarov, P.V.; Nepomuceno-Chamorro, I.A.; Rauschenberger, A.; Glaab, E. Ten quick tips for biomarker discovery and validation analyses using machine learning. PLoS Comput Biol 2022, 18, e1010357. [CrossRef]
- Varma, S.; Simon, R. Bias in error estimation when using cross-validation for model selection. BMC Bioinformatics 2006, 7, 91. [CrossRef]
- Guo, Z.; Tian, C.; Shi, Y.; Song, X.R.; Yin, W.; Tao, Q.Q.; Liu, J.; Peng, G.P.; Wu, Z.Y.; Wang, Y.J.; et al. Blood-based CNS regionally and neuronally enriched extracellular vesicles carrying pTau217 for Alzheimer’s disease diagnosis and differential diagnosis. Acta Neuropathol Commun 2024, 12, 38. [CrossRef]
- Santhakumar, V.; Jones, R.T.; Mody, I. Developmental regulation and neuroprotective effects of striatal tonic GABAA currents. Neuroscience 2010, 167, 644-655. [CrossRef]
- Allen, P.B.; Greenfield, A.T.; Svenningsson, P.; Haspeslagh, D.C.; Greengard, P. Phactrs 1-4: A family of protein phosphatase 1 and actin regulatory proteins. Proc Natl Acad Sci U S A 2004, 101, 7187-7192. [CrossRef]
- Ito, H.; Mizuno, M.; Noguchi, K.; Morishita, R.; Iwamoto, I.; Hara, A.; Nagata, K.-i. Expression analyses of Phactr1 (phosphatase and actin regulator 1) during mouse brain development. Neuroscience Research 2018, 128, 50-57. [CrossRef]
- Handsaker, R.E.; Kashin, S.; Reed, N.M.; Tan, S.; Lee, W.-S.; McDonald, T.M.; Morris, K.; Kamitaki, N.; Mullally, C.D.; Morakabati, N.R.; et al. Long somatic DNA-repeat expansion drives neurodegeneration in Huntington’s disease. Cell 2025, 188, 623-639.e619. [CrossRef]
Figure 1.
Workflow of the study for identifying key biomarkers in Huntington’s disease (HD). The study comprises three main steps: (1) Meta-analysis: Three brain tissue-related GSE datasets from distinct platforms were retrieved using the GEOquery package in R, preprocessed, and batch-corrected. Meta-analysis was performed using limma and MetaVolcanoR under both relaxed and stringent criteria. (2) Machine learning: Normalized batch corrected data is split into training and test sets. 19 ML classifiers were evaluated, and the top three models (based on AUC) were selected. SHAP analysis of these models identified six candidate genes. Five genes are considered robust biomarkers that overlap with candidate genes from ML, with the stringent meta-analysis DEGs. (3) Validation: A nomogram based on the five biomarkers was trained on the training data and validated using an external dataset. ROC curve analysis on the external set was performed, and the selected final biomarkers with strong discriminative power for HD were identified.
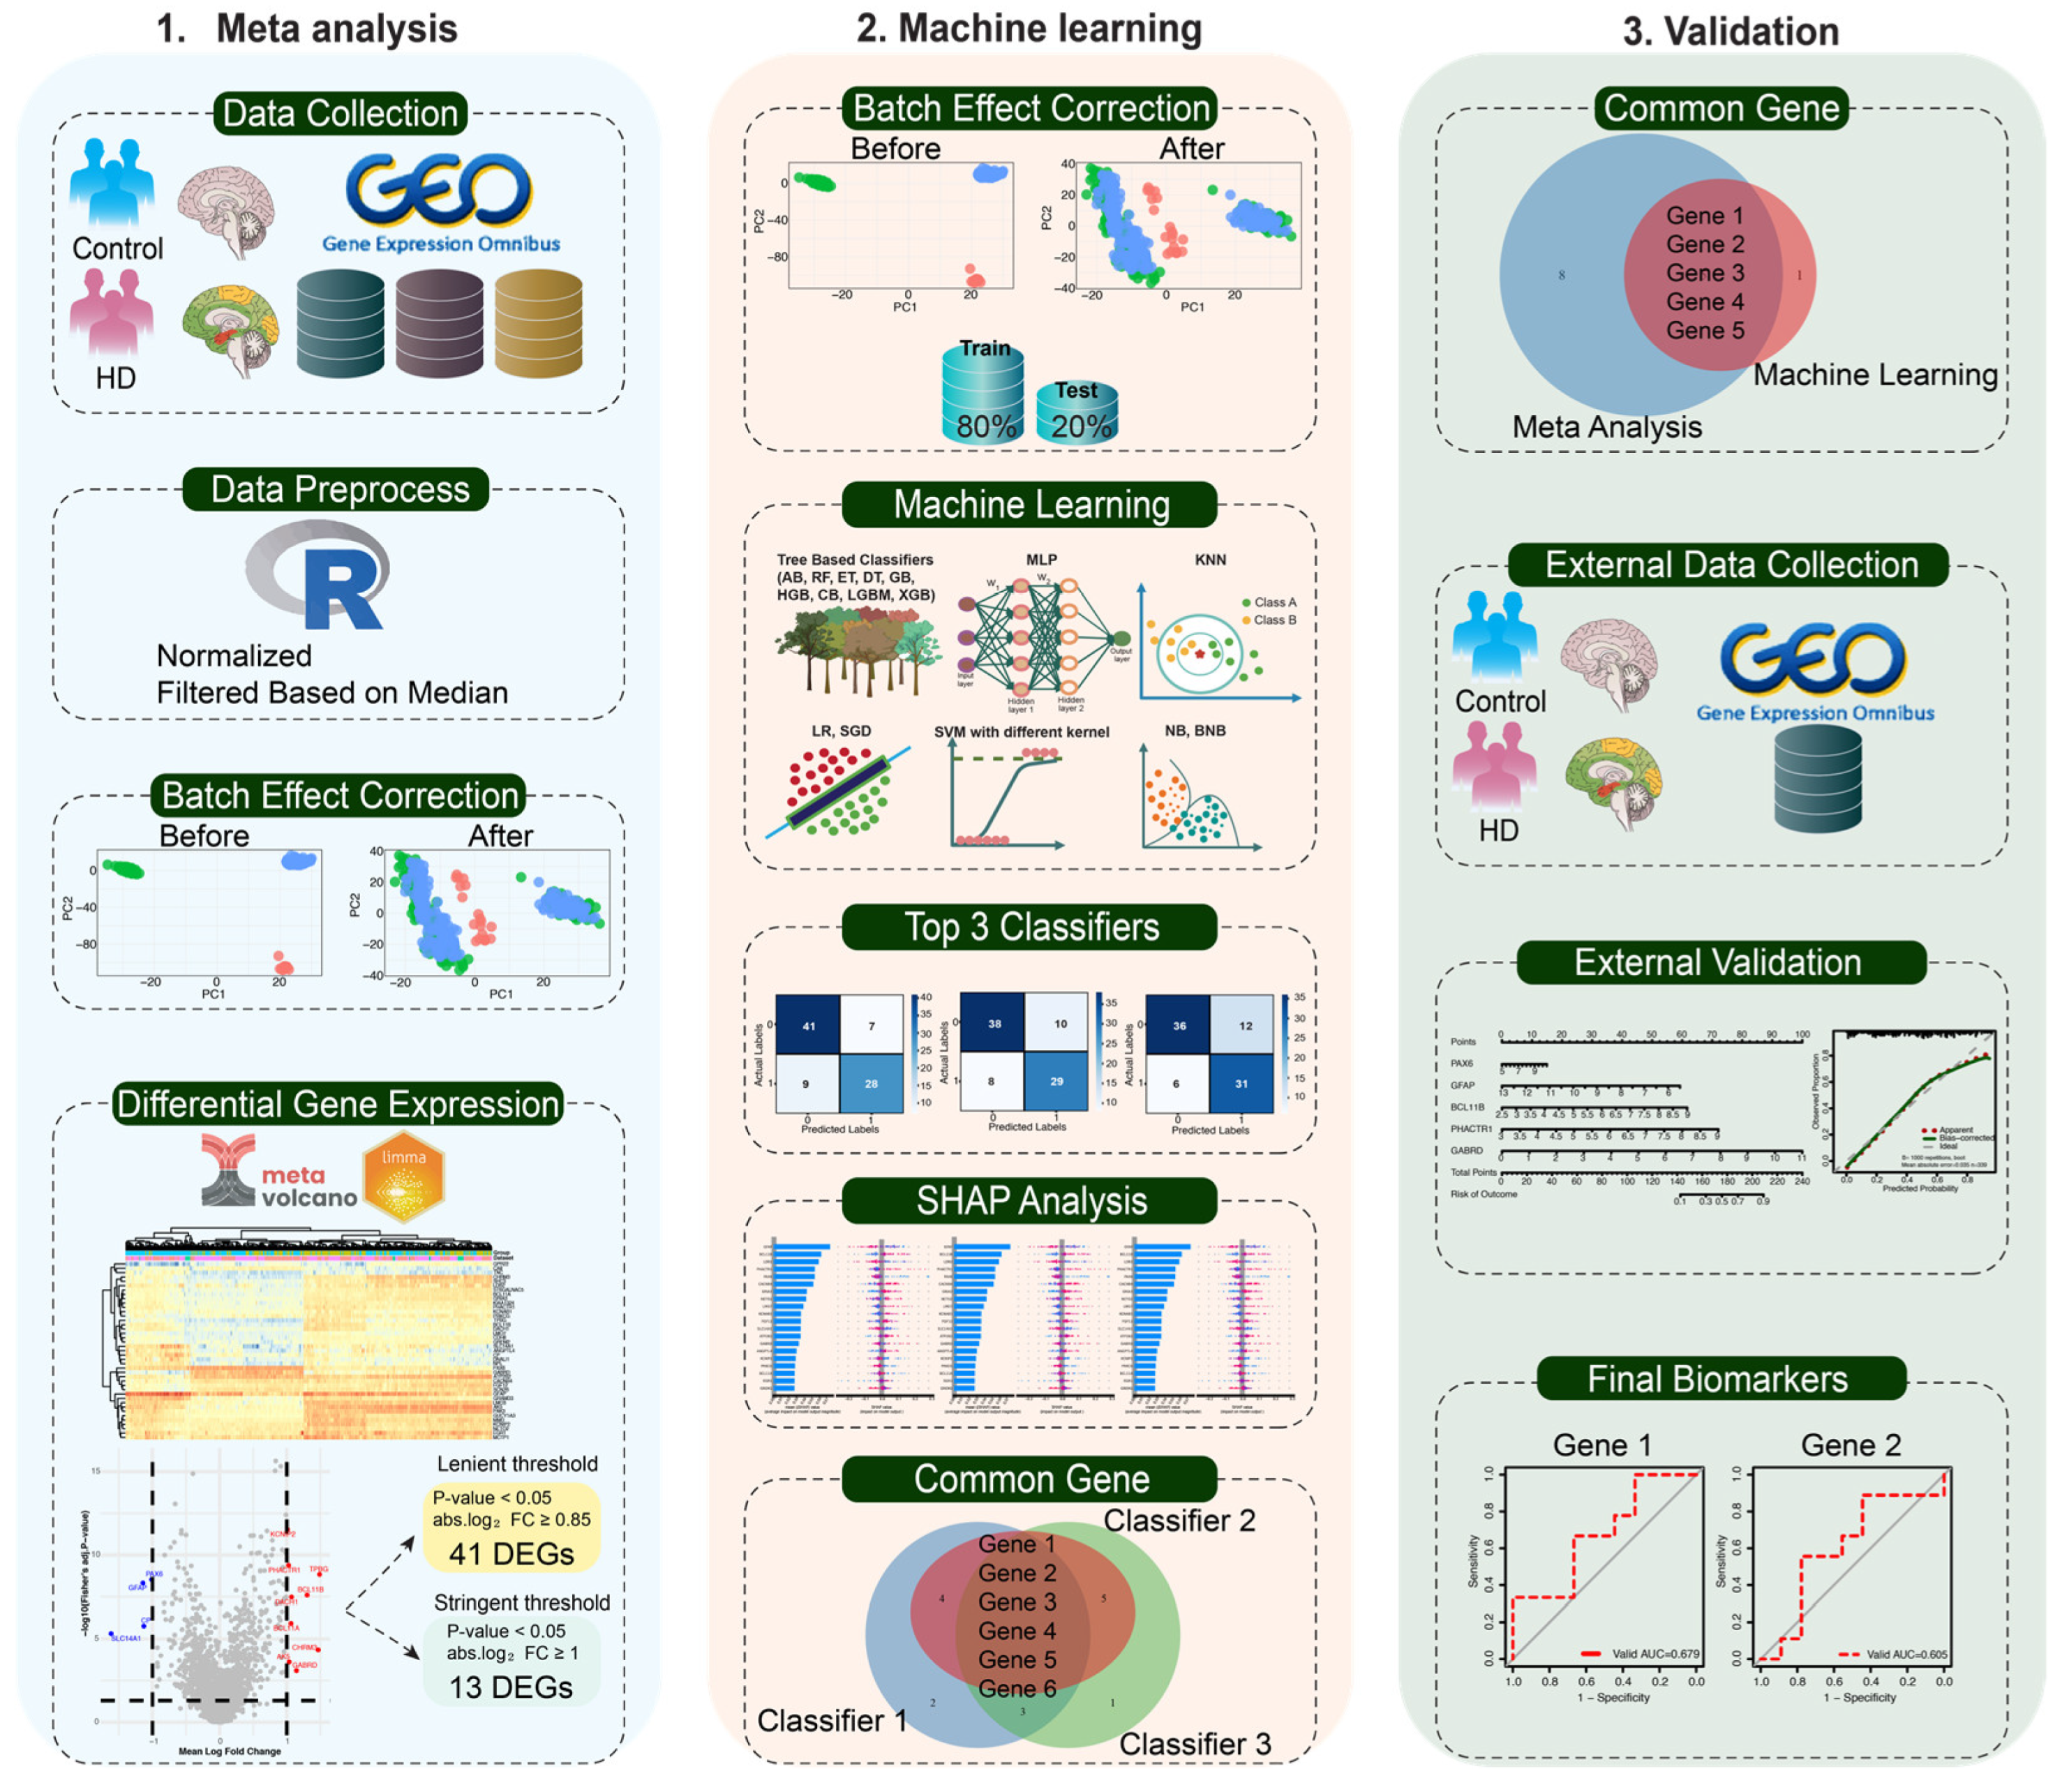
Figure 2.
Meta-analysis involves identifying differentially expressed genes (DEGs) from GSE3790 and GSE26927. (a) Principal component analysis (PCA) plots illustrating the uniformity of datasets before and after batch effect removal, where the upper panel and lower panel represent the PCA plots before and following batch effect removal, respectively. (b) Volcano plot displaying differentially expressed genes (DEGs) of the meta-analysis. Genes were considered significantly differentially expressed with an adjusted p-value (FDR) < 0.05 and an absolute log₂ fold change > 0.85. Genes that are significantly upregulated are represented in red, while downregulated genes are shown in blue, and non-significant genes are highlighted in grey. (c) Heatmap of differentially expressed genes (DEGs) between the normal and HD subjects found in the combined datasets.
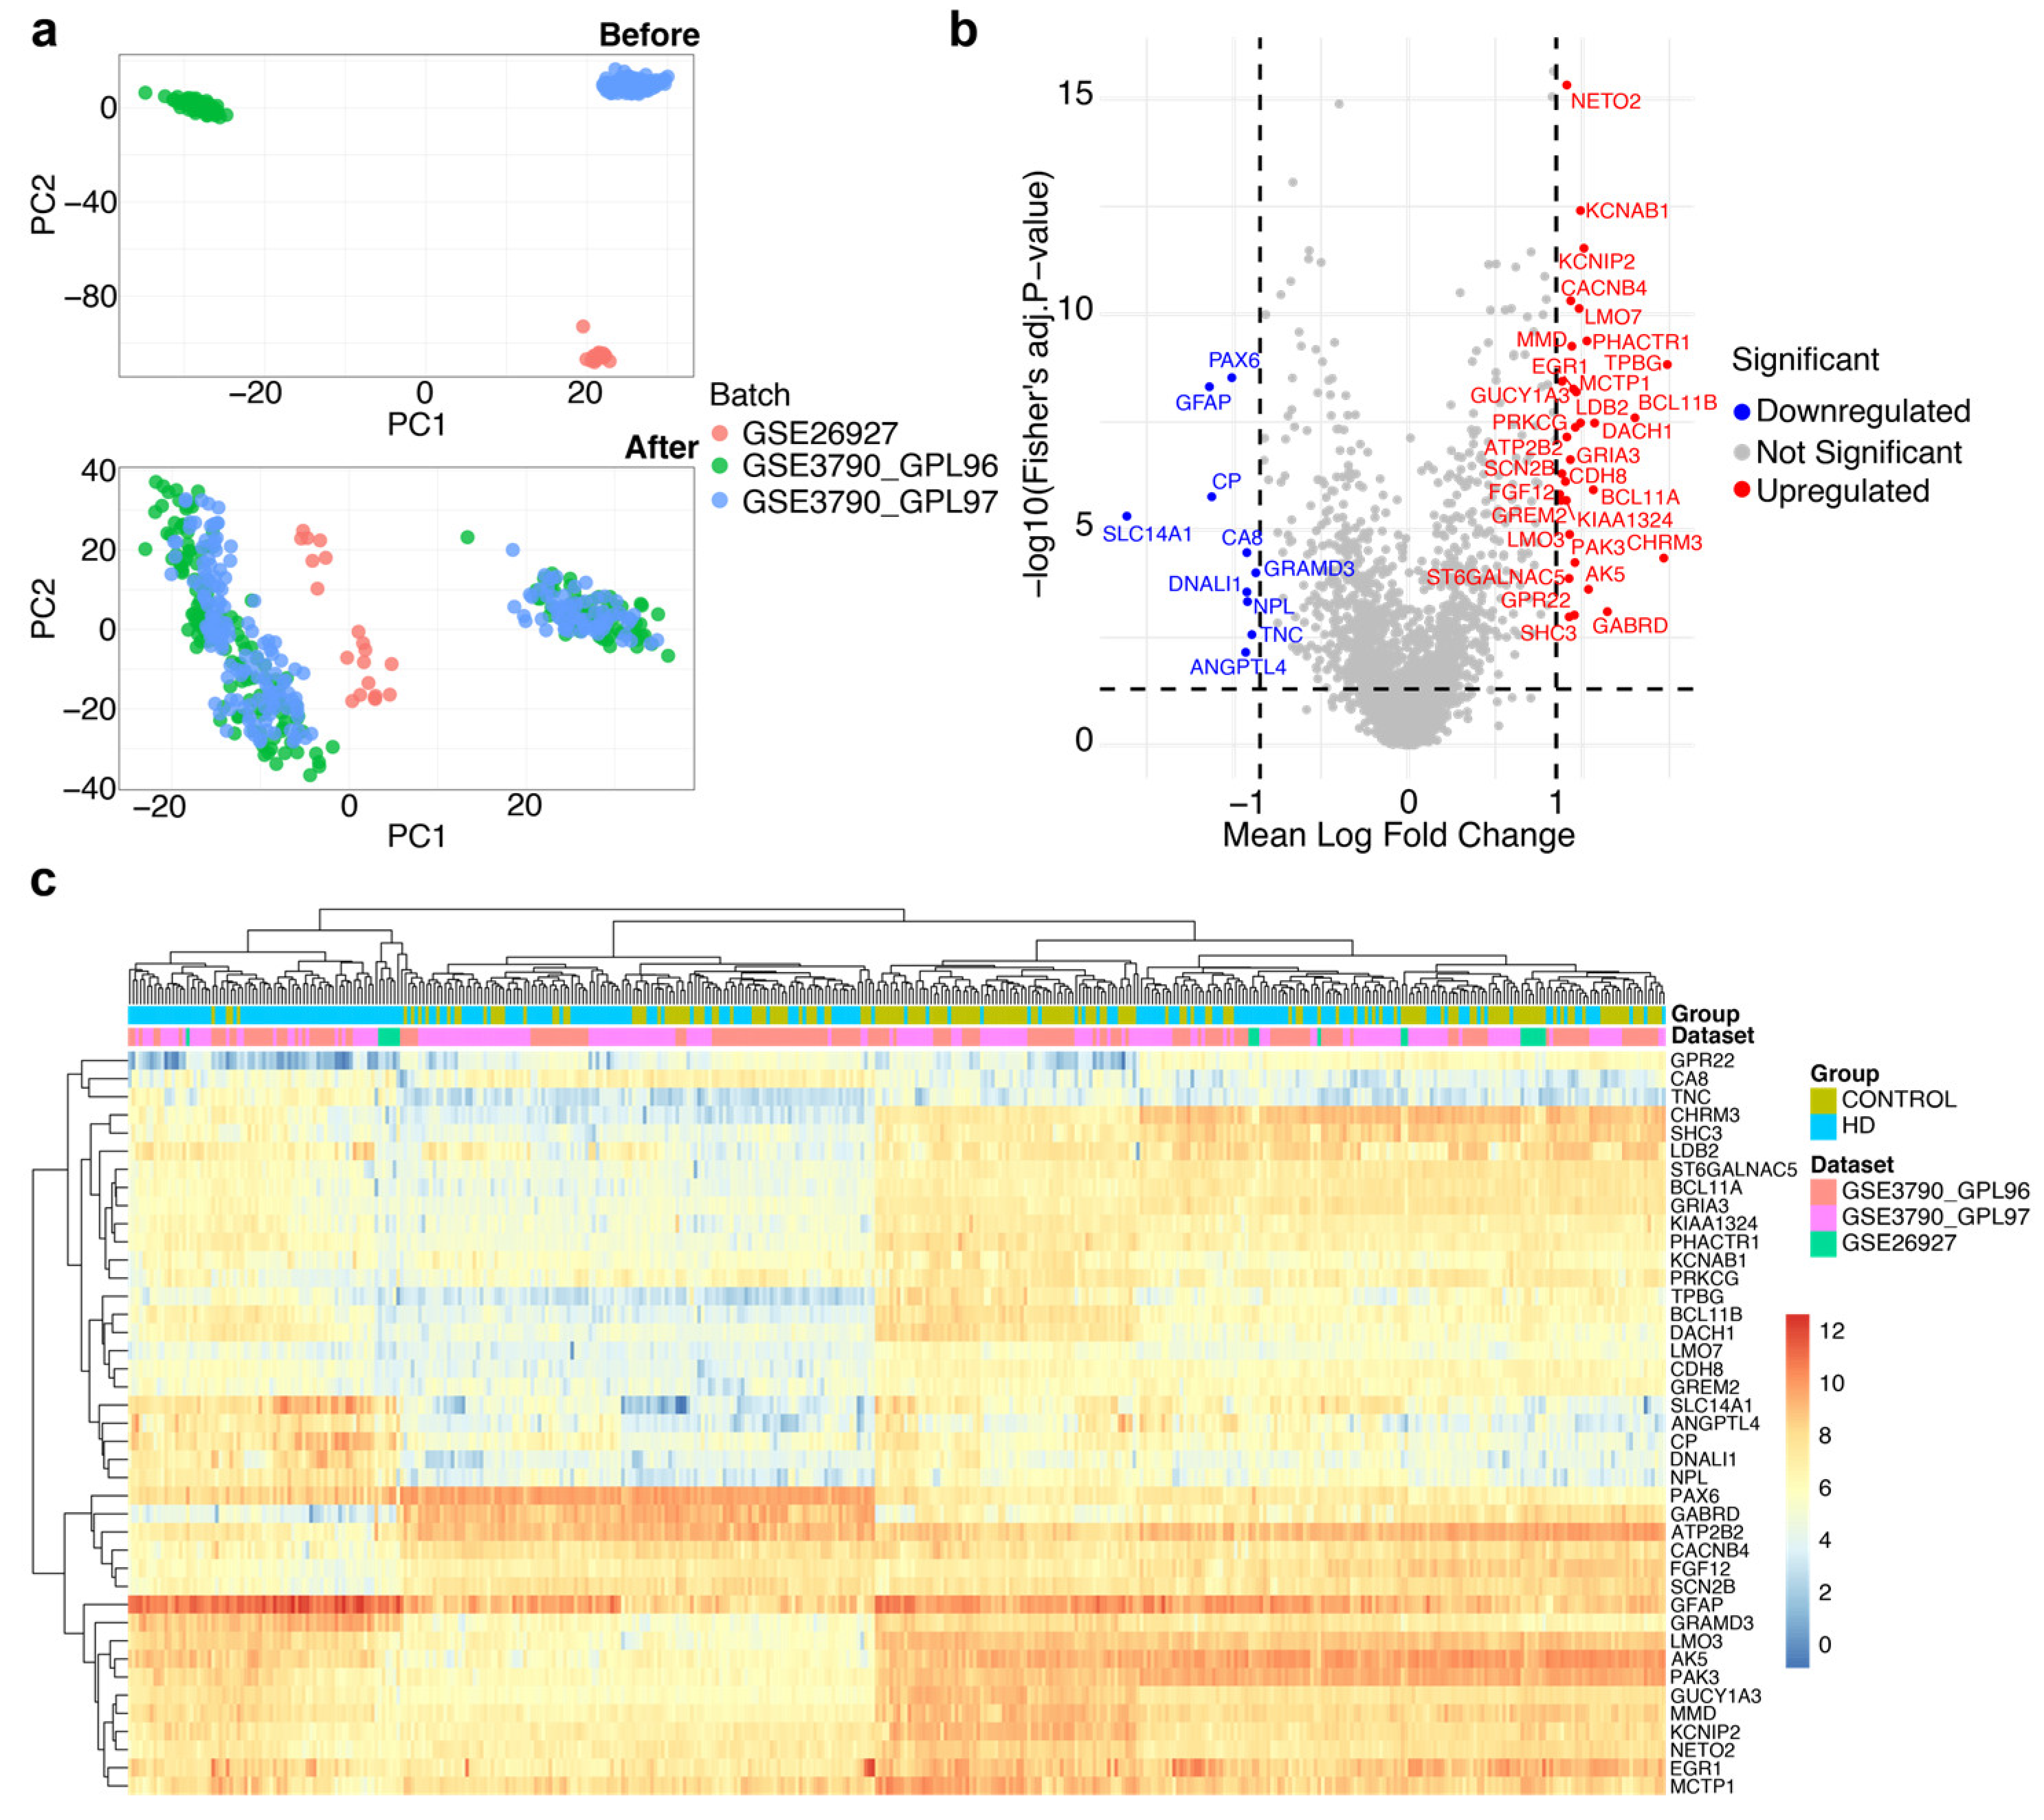
Figure 3.
Gene Ontology (GO) enrichment analysis of 41 DEGs. (a) Gene enrichment analysis of the 41 genes identified the top enriched gene ontology terms, biological process (BP), cellular components (CC), and molecular function (MF).
Figure 3.
Gene Ontology (GO) enrichment analysis of 41 DEGs. (a) Gene enrichment analysis of the 41 genes identified the top enriched gene ontology terms, biological process (BP), cellular components (CC), and molecular function (MF).
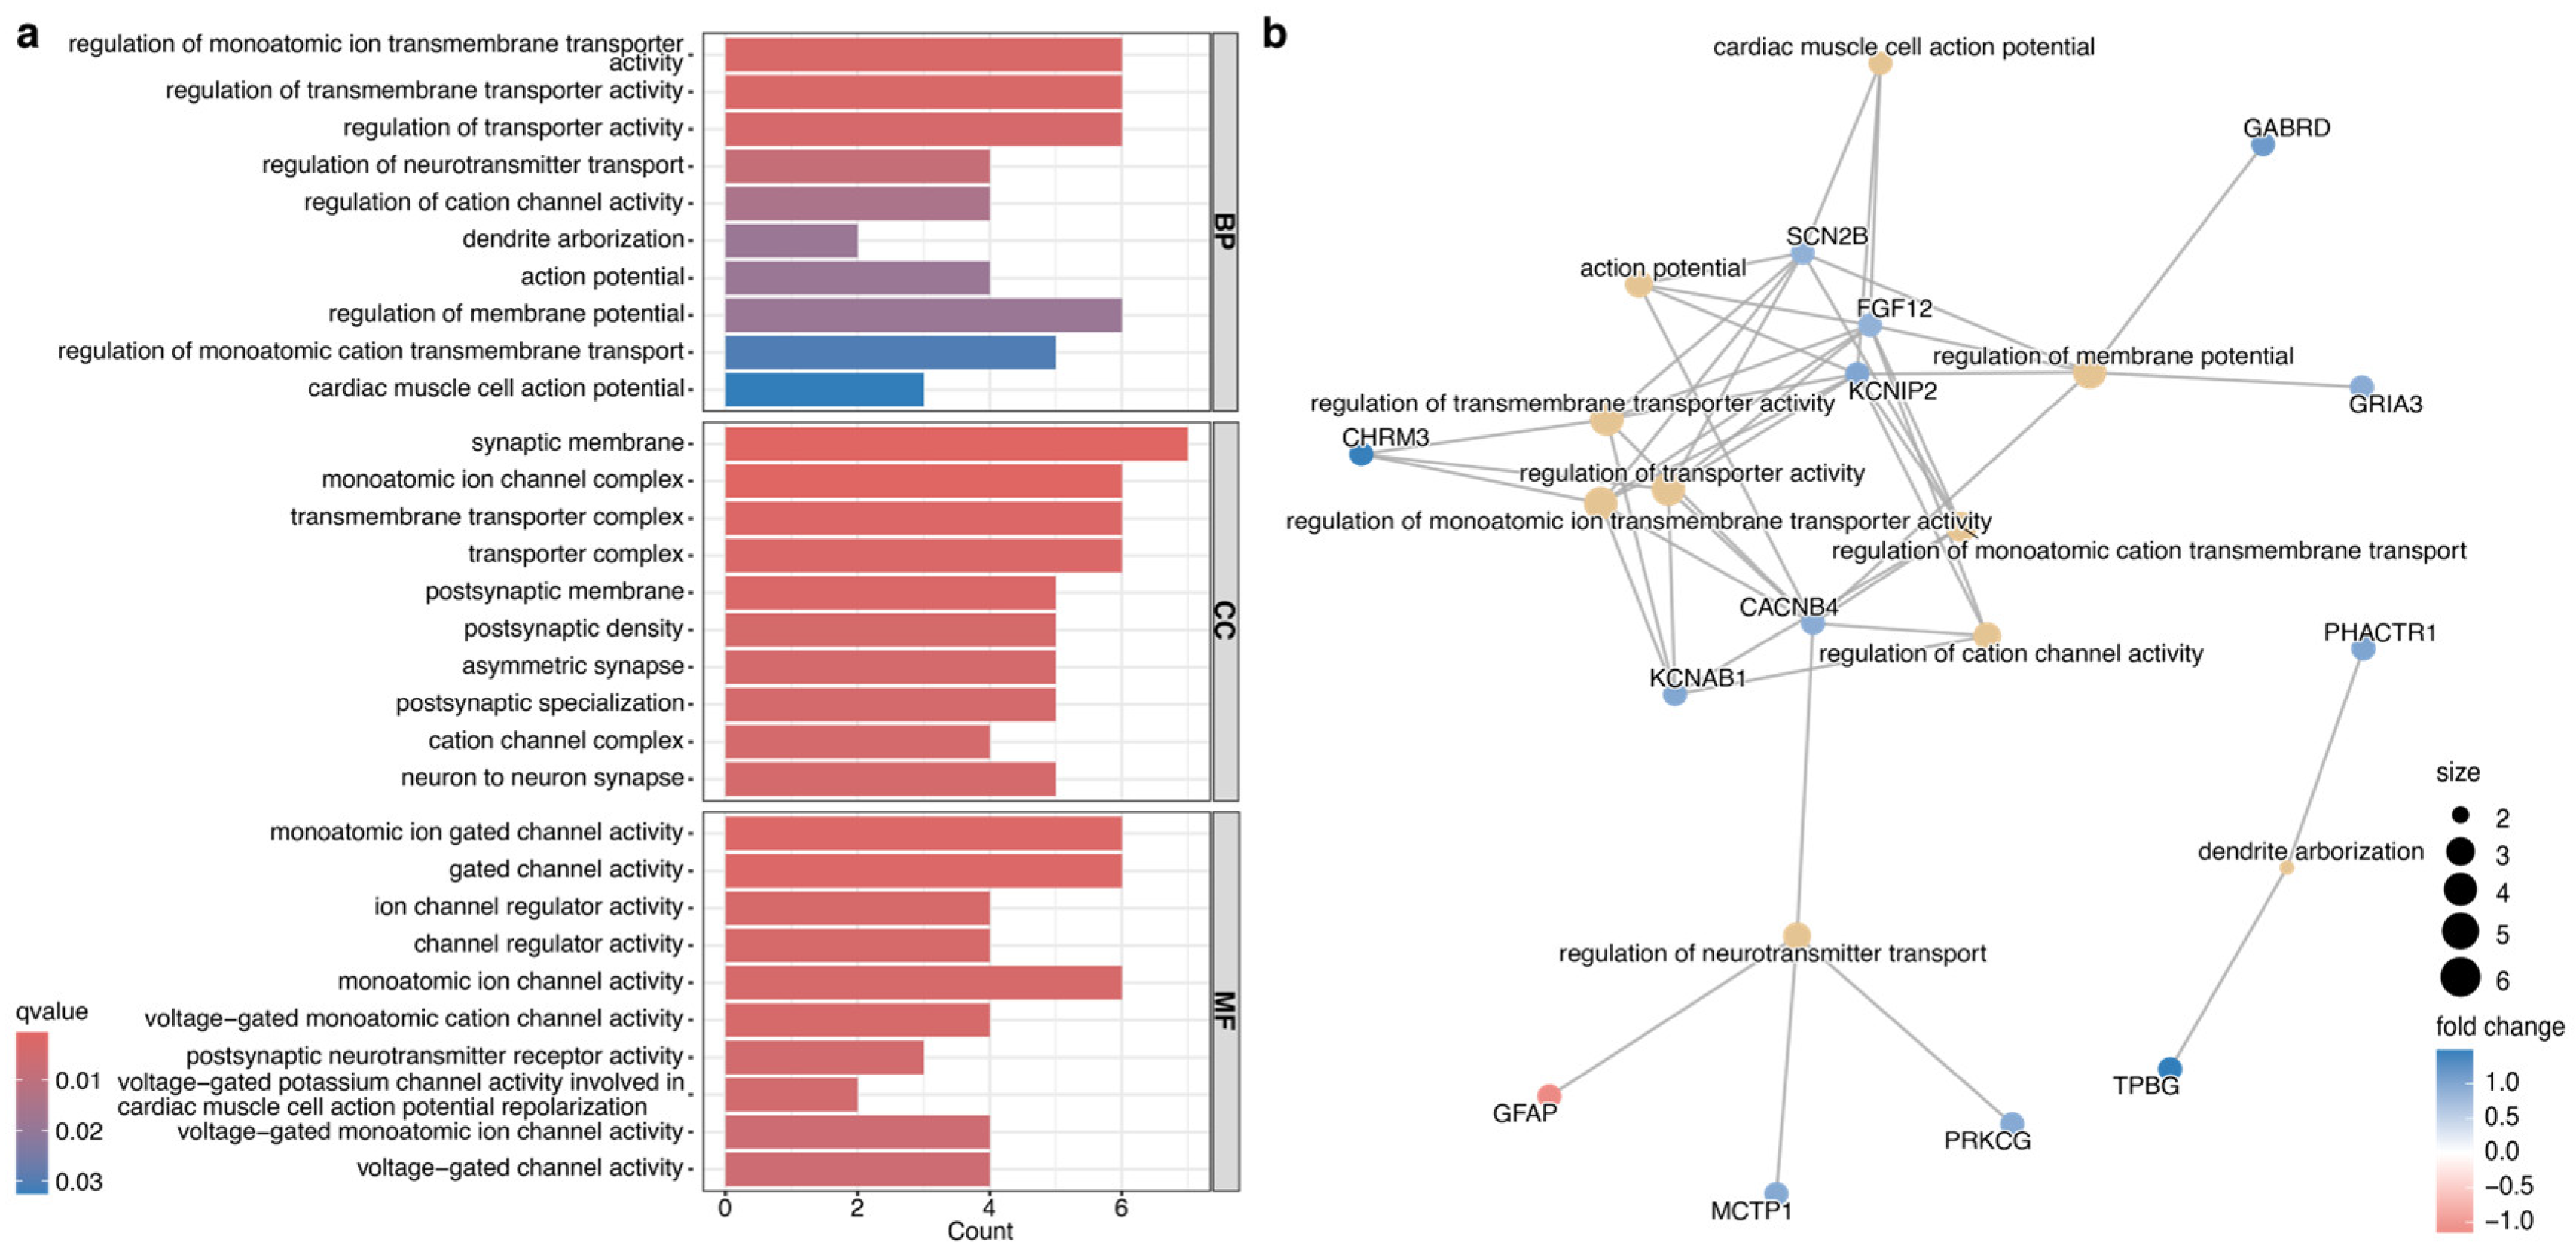
Figure 4.
Performance assessment of 19 machine learning (ML) classifiers and selection of the top three classifiers for biomarker selection. (a) Heatmap showing the performance of 19 ML classifiers on the train and test sets, where each row represents a classifier and each column corresponds to a metric. Color intensity ranging from 0 to 1 (blue to red) reflects the relative performance of each model. (b) Confusion matrices of the top-performing models showcased how accurately each model classified HD and control by comparing the model’s predicted and actual labels. (c, d) The ROC curve of the top-performing classifier on the train and test datasets shows its ability to distinguish between HD and Control.
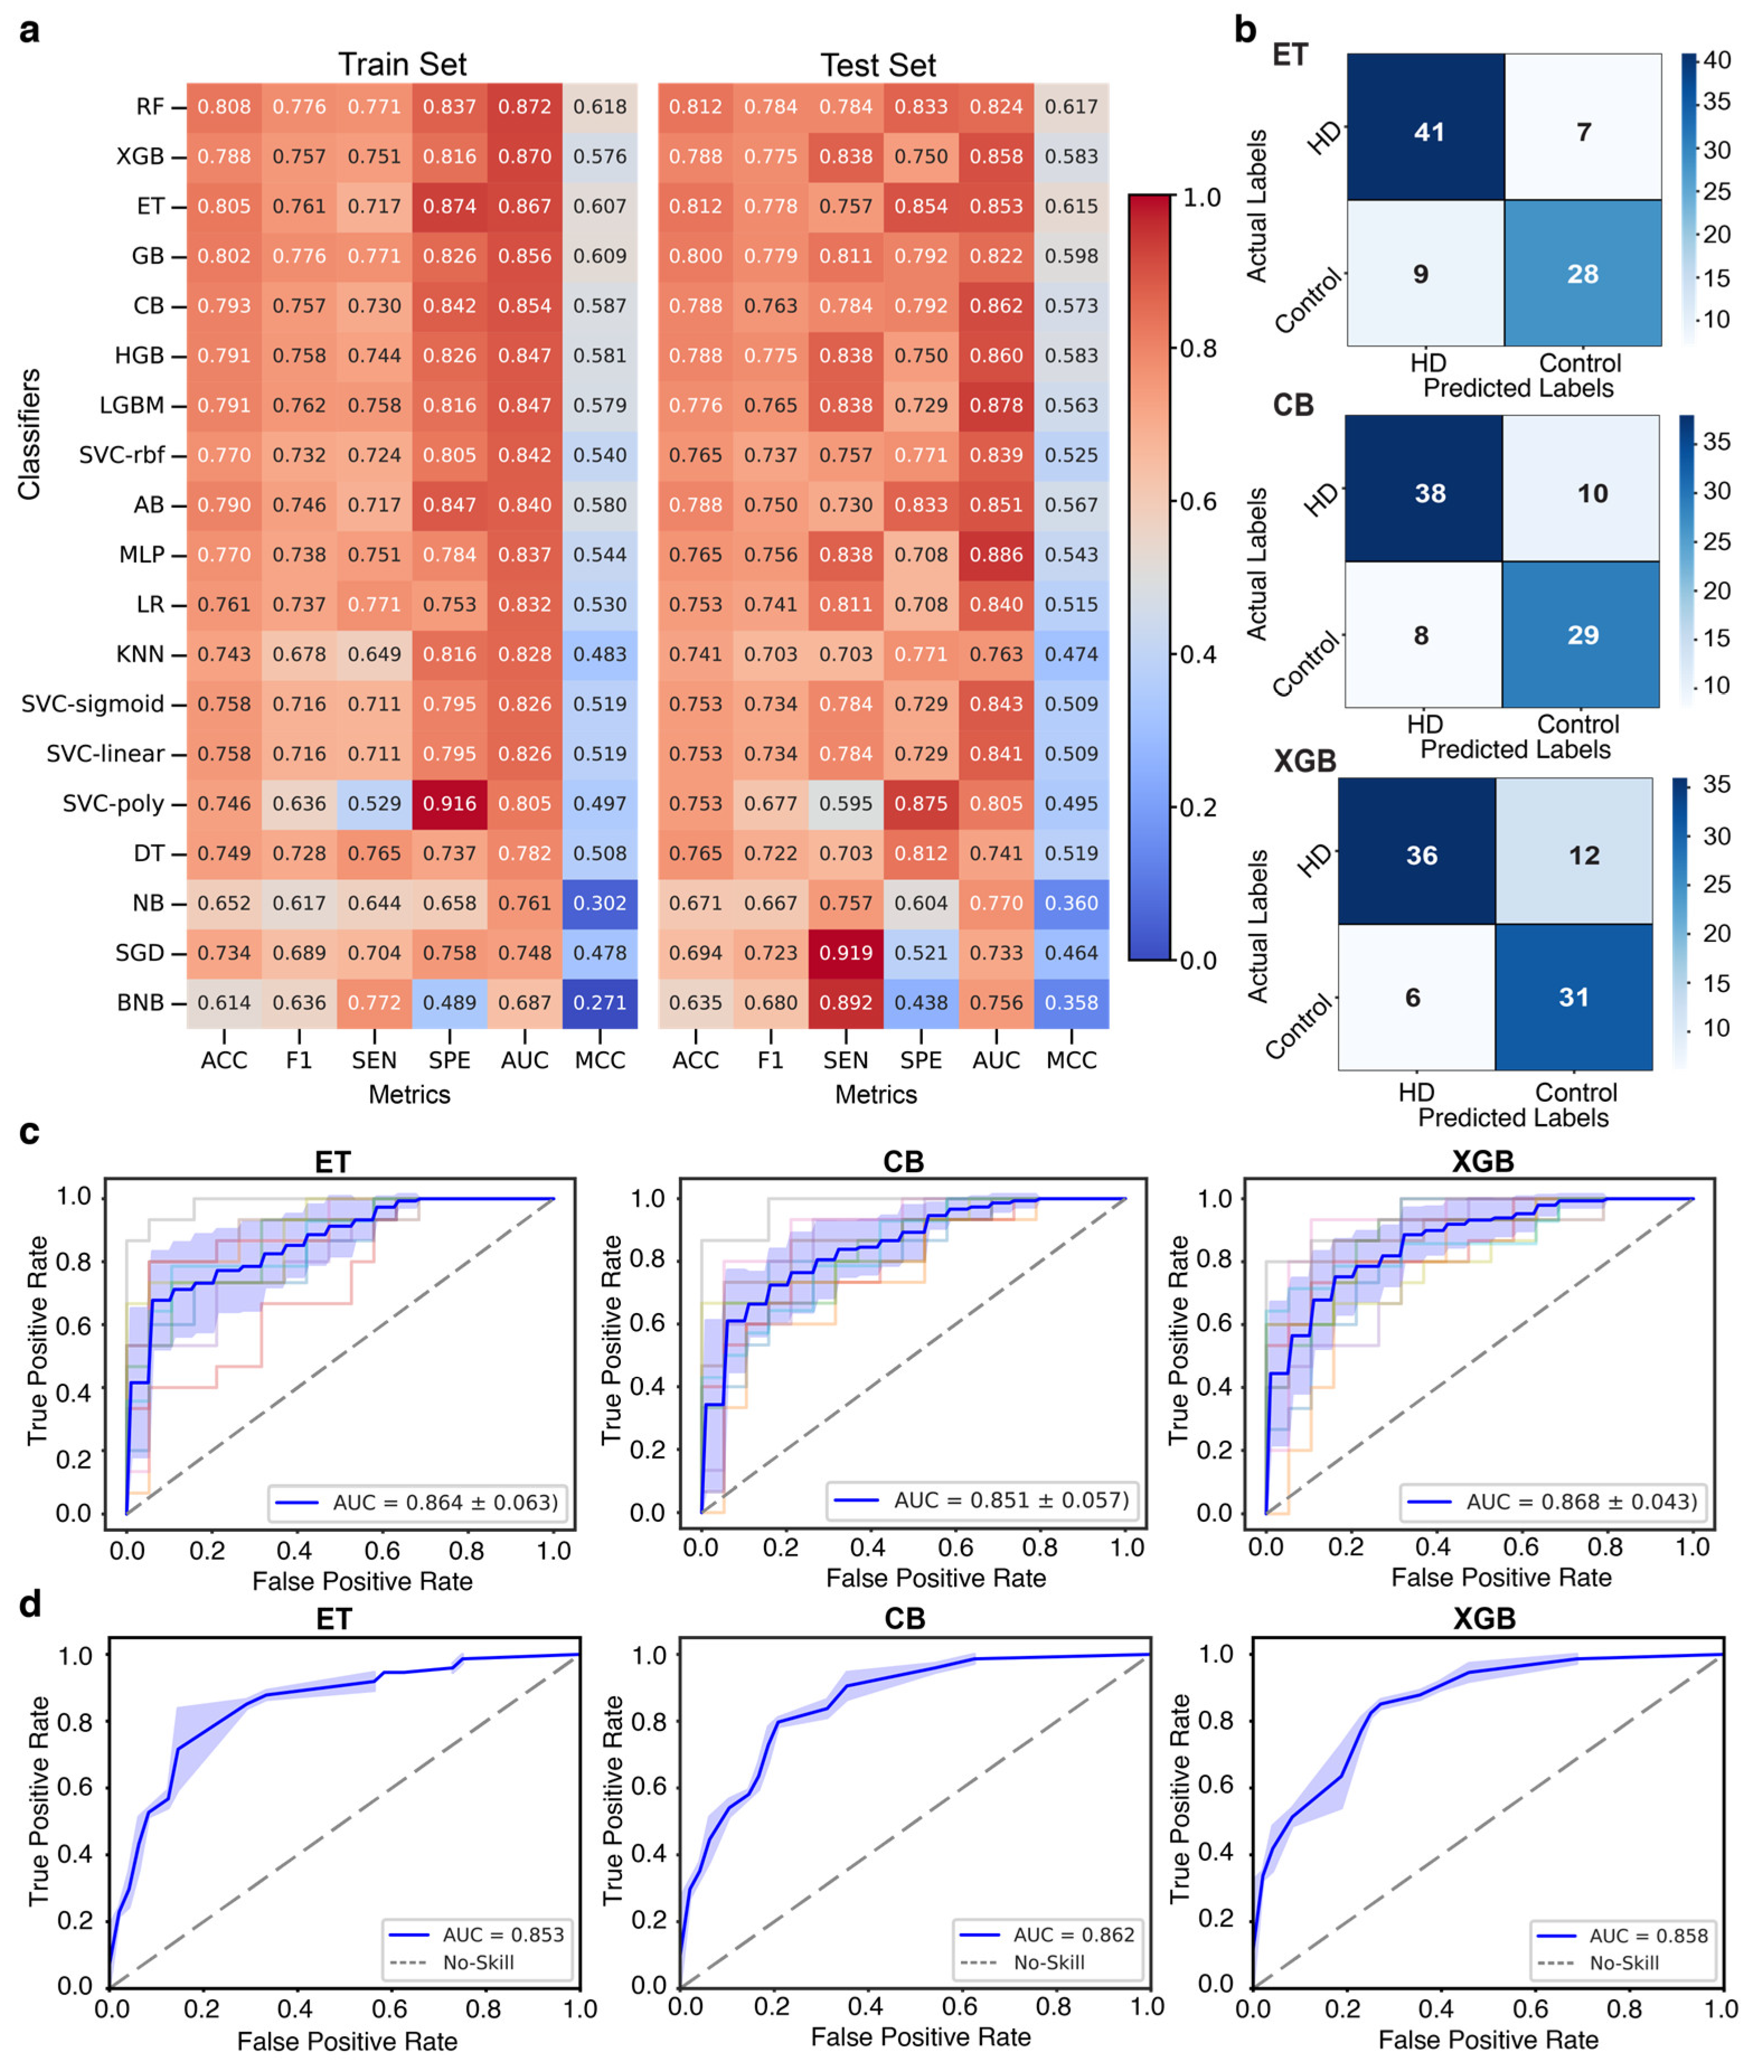
Figure 5.
Identification of five robust biomarkers through the integration of machine learning (ML) and DEG meta-analysis. (a, b,c) SHAP summary plots highlighting the significance of the top 20 genes for three top-performing ML classifiers: (a) ET, (b) CB, and (c) XGB. The SHAP summary plot illustrates the contribution from each gene to the model prediction for HD. The left panel (beeswarm plot) displays individual gene expression contributions, where each dot represents a sample and its corresponding SHAP value. The color gradient indicates gene expression levels, with red denoting high expression and blue indicating low expression. The right panel (bar plot) presents the average absolute SHAP value for each gene, summarizing its overall impact across all samples. The plot showcases the contribution from each gene to the model prediction for HD, where each dot represents a single gene expression value. While the red color represents high expression, the blue color represents low. (d) Six genes were consistently ranked among the top 15 features across all three models in SHAP plots across all three classifiers. (e) Five genes were selected as robust biomarkers as they overlapped with the candidate genes identified by ML and the DEGs found in meta-analysis using strict criteria.
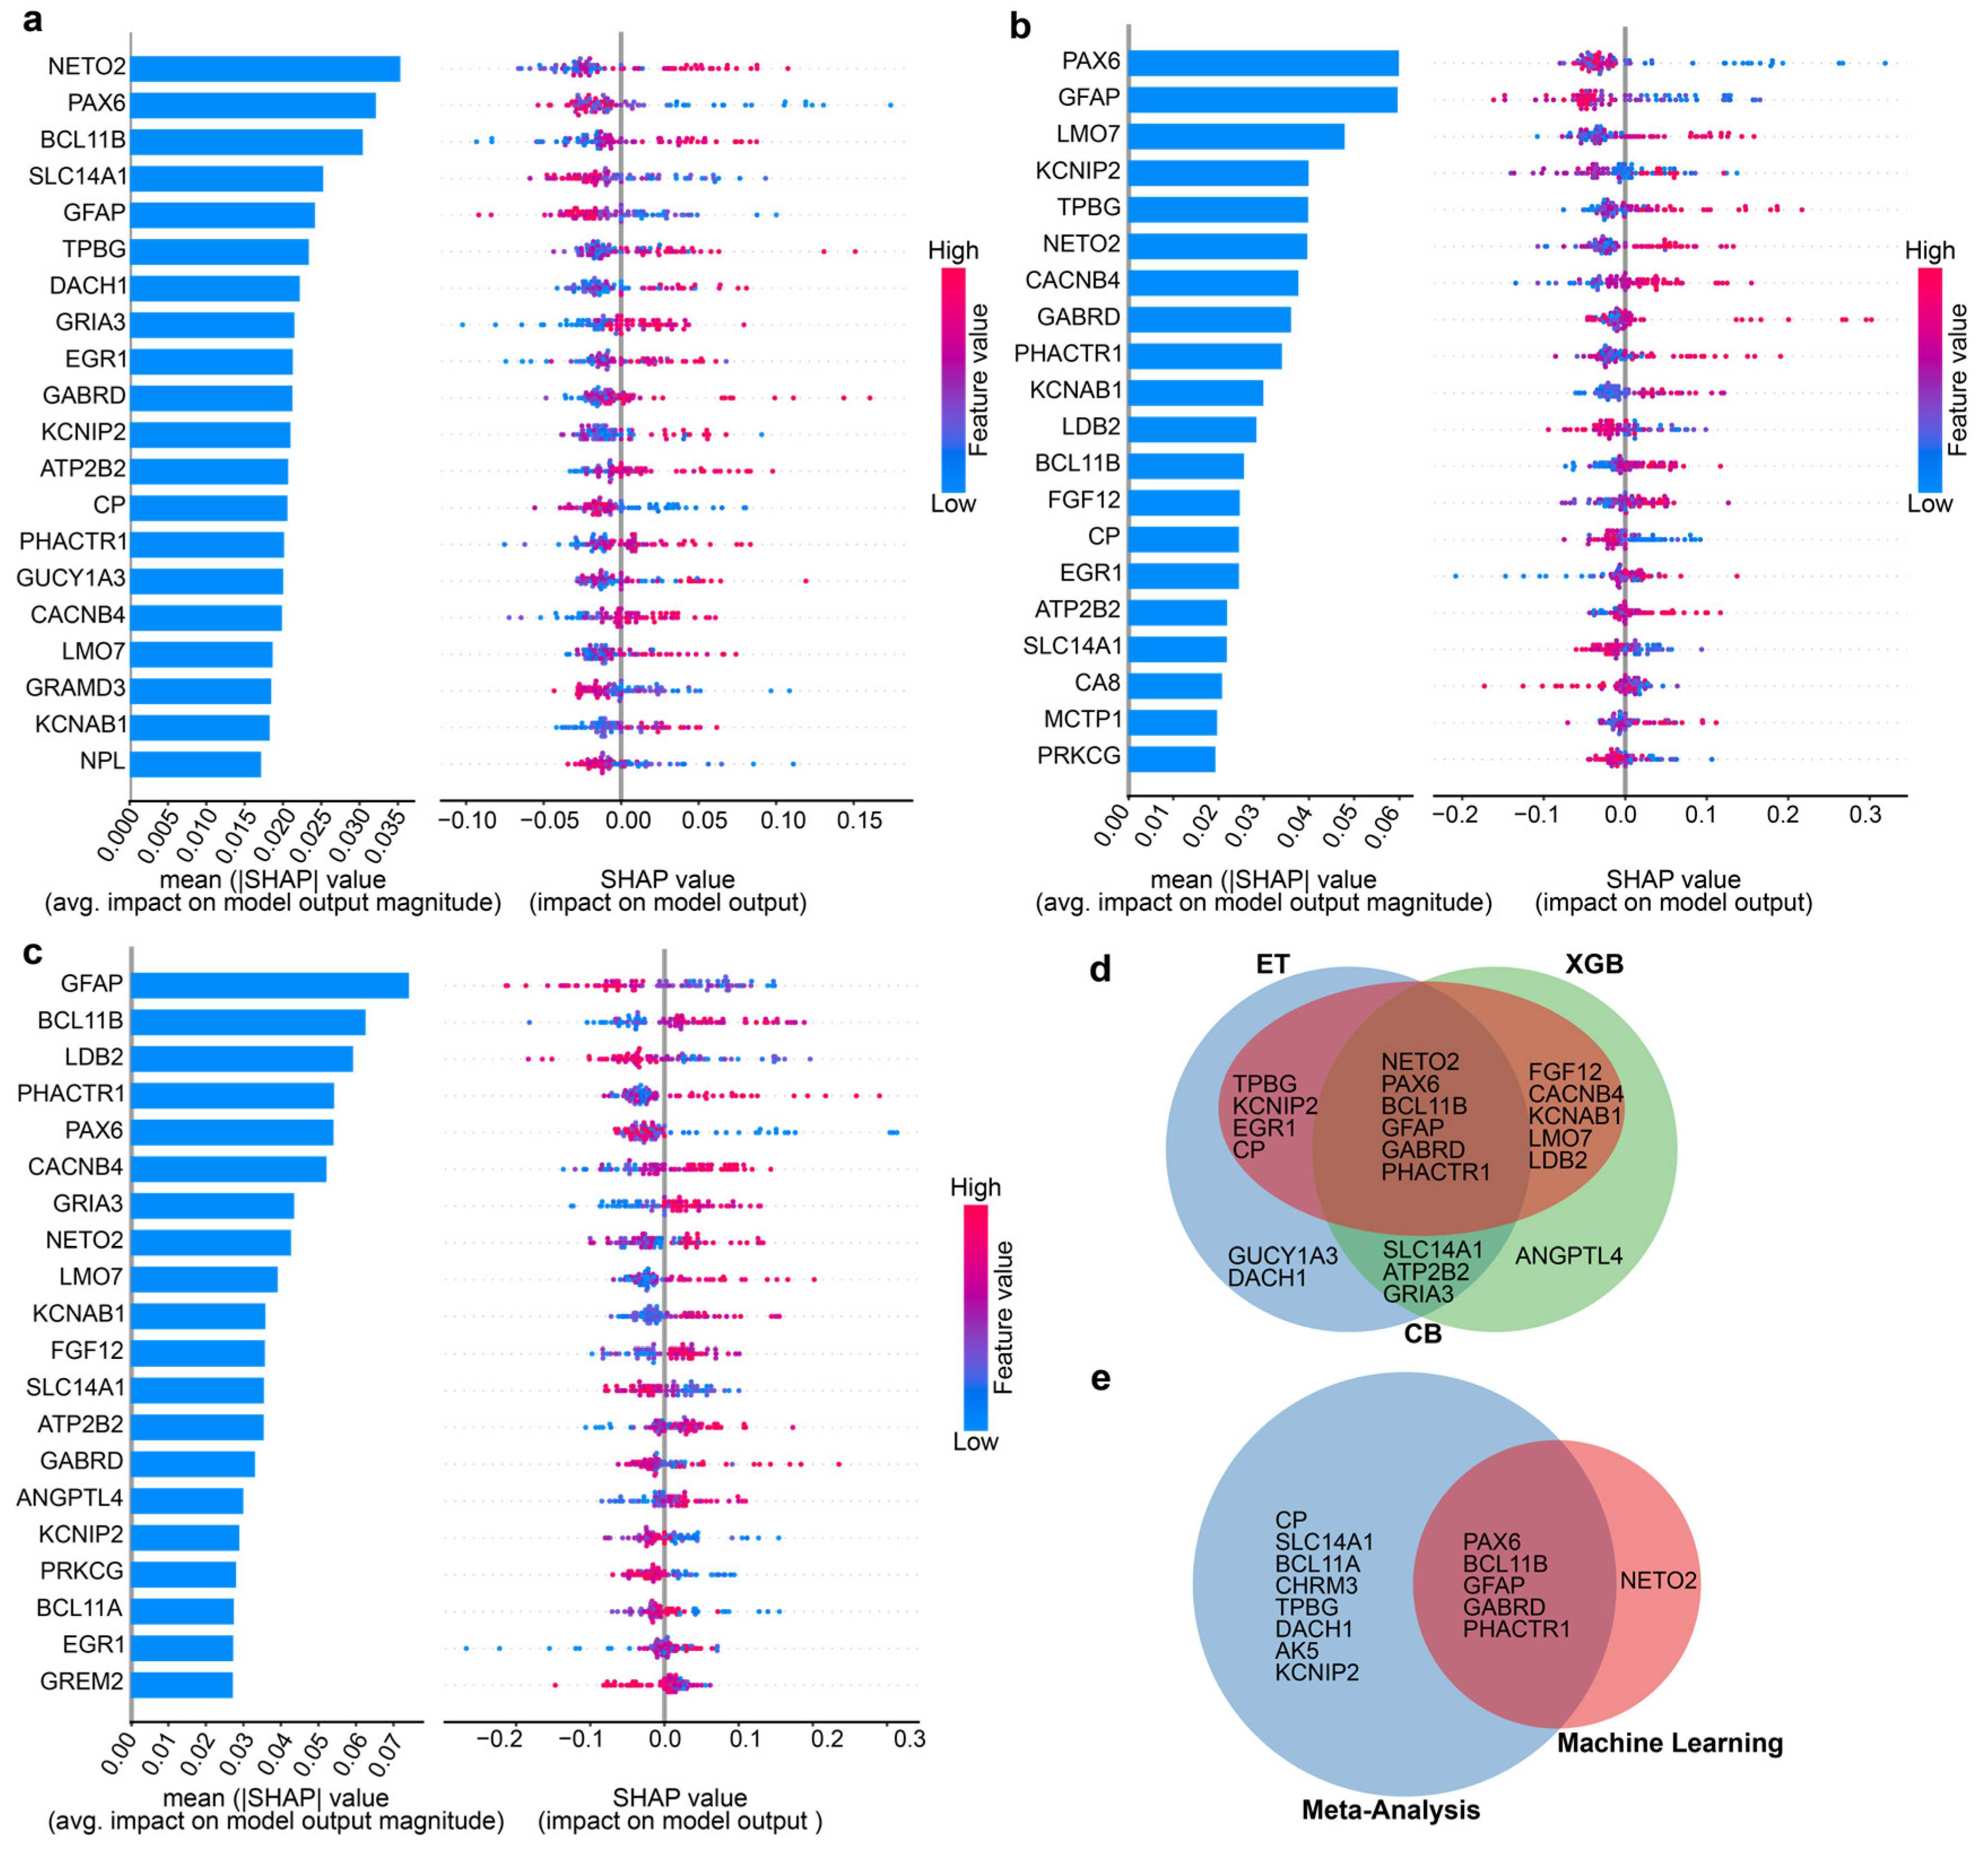
Figure 6.
Construction of a nomogram using the features identified by machine learning (ML) models and validation using the calibration curve and external datasets. (a) Nomogram for predicting the risk of developing HD using five features identified by ML models. First, a point was identified for each feature of a patient using the uppermost rule, and subsequently, all points were summed together to obtain the total number of points, and using the total points, the corresponding predicted probability of developing HD was found using the lowest rule. (b, c) The horizontal axis of calibration curves (b and c) represents the predicted probability of HD, while the vertical axis denotes the observed proportion of events that occurred inside the expected probability range. (d) ROC curve of the nomogram prediction model using the external validation dataset, signifying the validity and reliability of the model. (e) Decision curve analysis (DCA) of the nomogram, where the left panel represents the DCA curve of the external validation dataset and the right panel indicates the DCA curve of the ML training dataset.
Disclaimer/Publisher’s Note: The statements, opinions and data contained in all publications are solely those of the individual author(s) and contributor(s) and not of MDPI and/or the editor(s). MDPI and/or the editor(s) disclaim responsibility for any injury to people or property resulting from any ideas, methods, instructions or products referred to in the content. |
© 2025 by the authors. Licensee MDPI, Basel, Switzerland. This article is an open access article distributed under the terms and conditions of the Creative Commons Attribution (CC BY) license (http://creativecommons.org/licenses/by/4.0/).
Copyright: This open access article is published under a Creative Commons CC BY 4.0 license, which permit the free download, distribution, and reuse, provided that the author and preprint are cited in any reuse.


