
Submitted:
30 August 2024
Posted:
03 September 2024
You are already at the latest version
Abstract
INTRODUCTION:
This study focusses on diagnosis of stages of AD (Alzheimer’s disease) including MCI (Mild Cognitive Impairment) from two data modalities - gene expression and clinical data of ADNI (Alzheimer’s Disease Neuroimaging Initiative ) participants using multiclassification. The gene expression dataset is highly imbalanced and of HDLSS (high-dimensional and low-sample-size) characteristics. This is the only study where multiclassification based AD stage diagnosis is done to identify multiple stages of Alzheimer. We are able to achieve the best multiclassification result in both the modalities and identify new genetic biomarkers.
METHODS:
Combination of XGBoost and SFBS (“Sequential Floating Backward Selection”) methods is used to select features. We are able to select the most effective 95 gene probsets out of 49,386. For clinical study data, 8 most effective biomarkers could be selected using SFBS. For both genomic and clinical data, DL (‘Deep Learning’) classifier is used to identify stages - CN (Cognitive Normal), MCI (Mild Cognitive Impairment), AD (Alzheimer’s Disease / Dementia). Because of high data imbalance in genomic data, border line oversampling is used for model training and original data for validation.
RESULT & DISCUSSION:
With clinical data, we achieved ‘ROC AUC’ scores 0.97, 0.95, 0.94 for CN, MCI, Dementia stage respectively . We achieve ‘ROC AUC’ scores 0.75, 0.74, 0.70 for CN, MCI, Dementia stage respectively and 0.67 for both micro average F1 scores and micro weighted F1 score. This is the best result so far for AD stage diagnosis from gene expression profile data through multiclassification with ADNI data. Results reflect that our multiclassification model can efficiently handle the imbalanced data of HDLSS nature to identify samples of minority class. MAPK14, ZNF835, MID1, HLA-DQA1, TEP1 are some of the new genes found to be associated with AD risk. DRAXIN, HSPA12B, USP47 etc. are found to be AD preventive or suppressor.
Keywords:
disease stage diagnosis
; blood gene expression
; data imbalance
; multiclassification
; F1 score
; AD risk gene
; SHAP
; LIME
1. Introduction
An AD diagnosed person develops amyloid plaque, tau, neurofibrillary in brain. There is loss of connection between the neurons of the brain. Hippocampus is the likely pace where the problem seems to start. But as the neurons die, subsequently other brain parts also get affected. This leads to problems like short-term memory loss in the initial stages. Then happens progressive problems with loss of short-term memory initially. Next, a decline happens in other cognitive faculties followed by behavioral issues. Broadly 3 stages are defined for the progression of this disease. They are CN, MCI and AD. “(MCI) is attractive because it represents a transitional state between normal aging and dementia” [1]. 50-75% of people of age 65 years or above are generally prone to AD. As expectancy of life of people is increasing, AD patient count is also increasing all over the world.
No major cure of AD is established till date [2]. There is tremendous progress in analysis of brain, brain functions, its changes in MCI and AD stages with the clinical applications of MRI (magnetic resonance imaging) and PET (positron emission tomography) have led to tremendous development in brain analysis, understanding brain function and its changes in MCI and AD stages [3,4].
Other approach like genomic data analysis for AD diagnosis can be beneficial. Genetic analysis can predict AD risk in an individual much earlier than clinical symptoms of AD appear. Genetic factors play a major role in 80% AD cases [5]. ‘Genome Wide Association Studies’ (GWAS) is able to discover some AD candidate genes. However, GWAS have majorly failed to produce AD candidate genes with reliability. Thousands of genes are considered as potential AD risk factors [6,7]. But GWAS only discovers genes that are associated with some phenotypes and fail to address the genes functionality causing AD [8]. Gene expression provides the opportunity to biochemical pathway analysis, regulatory mechanisms and cellular functions to find the key AD and MCI genes. Some research utilised gene expression values from brain tissues from biopsy or autopsy-based samples [9,10]. However, various difficulties are involved with such autopsy samples for analysis. But brain dynamics, changes are also expressed in blood and large portion of gene expression in body is also found in PBMCs (Peripheral Blood Mononuclear Cells) [11]. Amyloid precursor protein expression, oxidative damage in RNA and DNA of AD brain tissue are reflected in peripheral blood and as well [12]. So, blood gene expression is getting attention as an appropriate method and diagnose AD and MCI [13,14].
With availability of biomarker datasets in public space, Machine learning (ML) is becoming a major support in diagnosis of a disease and the stage. ML is now widely used in disease diagnosis with increasing availability of AD datasets. The clinical biomarker AD dataset is categorized into brain structural integrity measurement with MRI ROI, primary cognitive tests, measurement of cell metabolism with FDG PET ROI average, amyloid-beta load measurement in brain with AV45 PET ROI average, biomarkers for measuring tau load in the brain, axon related microstructural parameter measurement with DTI ROI, CSF biomarkers for measuring tau levels and amyloid in cerebrospinal fluid and others like demographic information, APOE status with count of APOE4 allele etc. APOE4 allele increases the risk of late onset Alzheimer [5].
1.1. Related Work
A lot of earlier research on AD diagnosis was done with clinical data using ML techniques. Primary issues in the earlier research were lack of sufficient and authentic data samples and less accuracy achieved [20]. For the other data modality, some important research on AD with genome expression data has been already done with ML techniques [9,13,14,15,16,17,18]. We have reviewed several papers on use of gene expression data for Alzheimer disease diagnosis and listed some recent studies [2017 – 2022] in table-1 for identification of AD from gene expression data.

Table 1.
Review of blood gene expression research in 2017 - 2022.
| Study | Data source | Feature selection | Classifier | Results |
|---|---|---|---|---|
| Li et al. (2017) [15] | ANM1 and ANM2 | student’s t-test | Ref-REO | AUC: 0.733 (ANM2: test set) AUC: 0.775 (ANM1: test set) |
| Li et al., (2018) [16] | ANM1 and ANM2 | LASSO regression | Majority voting of RF,SVM, RR | AUC: 0.866 (ANM2: test set) AUC: 0.864 (ANM1: test set) |
| Lee H. et al., (2020) [9] | ANM1, ANM2, ADNI | VAE, TF genes. | Binary classification logistic regression (LR), (L1-LR), SVM, RF, and DNN. | AUC: 0.657, 0.874, and 0.804 for ADNI, ANMI and ANM2, respectively. |
| C. Park. Et al., (2020) [17] | Gene expression: GSE33000 and GSE44770 methylation data: GSE80970 |
Integrate DEGs and DMPs by inter-section | DNN (Deep Neural Network) | 0.823 is the average accuracy |
| Kalkan H. et al., (2022) [18] | GSE63060, GSE63061, GSE140829 | LASSO regression | CNN on transformed image representation. | AUC of 0.875 for the AD vs. CTL. AUC of 0.664 for the MCI vs. AD. AUC of 0.619 for the MCI vs. CTL. |
Datasets from NCBI and ADNI have been used in most of the research on AD diagnosis using statistical, machine learning and deep neural networks. To highlight performance, researchers used only binary classification for AD identification and mostly focussed on identifying AD, omitted diagnosis of ‘MCI’ stage. But MCI is an important stage [1]. Performance output of some of the earlier research is promising with AUC score around 80% when balanced dataset GEO datasets are used for model training / test. However, results are not promising when train and test dataset is ADNI. In research of Lee H. et al. [9] with ADNI data, for CN vs AD binary classification, the AUC achieved was 0.657 for internal validation (ADNI data for train and test/validation). The score is far less when compared with other results. Primary reason for this low score is that multiple challenges are associated with ADNI gene expression data. ADNI gene expression data is of ‘HDLSS’ in nature [19]. It has 49,386 gene probes / gene transcripts (or features), has only 744 samples and is imbalanced as well as reflected in Table 2. So, when the model is constructed and validated with same ADNI data, performance is low. The authors have worked with novel feature selection and modelling approach, however they have ignored the fact that low sample size and inherent data imbalance impact the learning of the model.
1.2. Key contribution
In this work, we have two key contributions. First, We are able to achieve multi classification based ROC performance score on ADNI genomic data which is much better score than AUC score 0.657 from binary classification with internal validation of earlier research as mentioned in section 1.1. Second, we have done stage diagnosis from two different data modalities of ADNI participants – blood gene expression profile and clinical data. We constructed two separate models and compared the performances.
Gene expression profile of ADNI subjects is used for model training and test, multiple challenges associated with the dataset as mentioned earlier like HDLSS characteristics, data imbalance appear. We have applied appropriate techniques to handle such challenges and improved performance score in diagnosis of stages – CN, MCI and AD. Additionally, we are able to identify new genes responsible (or repellent) to AD. From the second modality of ADNI clinical dataset, we have found most effective biomarkers for diagnosis and achieved best known ‘F1 score’, ‘ROC AUC’ of multiclassification in AD stage diagnosis. We have analysed the results of both the models built on the two modalities of ADNI subjects.
2. Material and Methods
2.1. Dataset Selection and Exploration
In our research, we have worked on two modalities of ADNI data – blood gene expression profile and clinical study datasets available in “Laboratory of Neuro Imaging” website. The 744 ADNI participants contributing to gene expression samples are subset of the 2400 participants contributing to clinical study samples.
The Gene expression profiling data is from blood samples of 744 ADNI participants. The samples were collected in different ADNI phases, and the Affymetrix Human Genome (HG) U219 Array was used for expression profiling. The samples were passed through different QC processes and ultimately samples from 744 participants were chosen for further analysis. Each sample from these 744 participants consists of total 49,386 probe sets.
Collecting stage diagnosis information of the participants was challenging and borrowed from ADNI clinical / study data by using collection phase / date, patient ID information that are common to both study/clinical and gene expression profile. The participants of genome expression profiling are subset of study / clinical data participants.
Table 2.
Gender, race and age-wise distribution of AD, CN and Dementia of ADNI blood gene expression dataset.
Table 2.
Gender, race and age-wise distribution of AD, CN and Dementia of ADNI blood gene expression dataset.
| Diagnosis (count) |
Gender | Race | Age | |||||
|---|---|---|---|---|---|---|---|---|
| Male | Female | White | Black | Asian | Others | Age < 65 | Age >= 65 | |
| CN (total=246) |
117 | 129 | 226 | 16 | 2 | 2 | 7 | 239 |
| MCI (total=382) |
216 | 166 | 356 | 11 | 5 | 10 | 66 | 316 |
| Dementia (total=116) |
75 | 43 | 108 | 3 | 4 | 1 | 6 | 110 |
‘ADNIMERGE’ is the clinical study dataset used as the other data modality in our work. The ADNIMERGE data is collected in several phases and consists of baseline and periodic samples. In this work, we have collected baseline samples of from 2400 participants out of which 892 participants belongs to CN, 1821 belongs to MCI and 413 participants belong to AD / Dementia category.
2.2. Data Pre-Processing and Feature Selection
ADNI clinical dataset is straightforward compared to gene expression profile, the other modality. We apply SFBS algorithm for feature selection. We choose 25 biomarkers out of 116, based on our study on some earlier work on AD diagnosis. Then we applied SFBS (Sequential Floating Backward Selection) technique that selected 8 essential features out of 25 as shown Figure 1 and Table 3.
For gene expression data, quality controls steps have already been applied and then 744 samples have been finally chosen. So, we directly applied pre-processing / cleaning on the gene expression dataset. Normalization / scaling of data was done using ‘MinMax’ scaler. After pre-processing, there were 744 samples / rows and 48,158 gene transcripts or features. This is ‘curse of dimensionality’ because of very high dimension [21]. It results in very high overfitting. Again, order of 50,000 leads to computational efficiency as well. Some earlier research applied feature selection techniques like VAE (Variational Auto Encoder), LASSO, RFE (recursive feature elimination) [9,16]. For auto encoder techniques, we need to provide number of features to be minimized and selected features are in encoded representation.
In our work, we have selected the essential features in two steps. First, we have calculated the feature score of each feature using XGBoost algorithm and ranked 48,158 genes as per scores. Then applied SFBS algorithm on the top 300 gene transcripts. SFBS automatically selected 95 features / transcript genes from 300 transcripts as shown in Figure 2.
As shown in Figure 3, the graph of top 40 features, geneprobe /transcript ‘SCGB1D4 : 11737959_at’ is at the bottom of the graph with highest score. In shap summary plot, ‘SCGB1D4 : 11737959_at comes as most effective one followed by ‘ASXL3 : 11737082_a_at’, are found to be ‘ASXL3 : 11737082_a_at’, ‘MAPK14 : 11742204_a_at’, ‘TMEM30B : 11756750_a_at’, ‘SQLE : 11717731_at’ (Figure 3) among others. The score graph plot lists them within top 25.
Some of current research are using ‘SHAP’ explainability and feature selection tool with its visualization and other features [22]. Using the XGBoost algorithm based model, we apply SHAP method to know impact of each feature / gene transcript on model output. We have used SHAP summary plot for overall impact of the transcripts for classification in Figure 4.
We have done correlation analysis of the transcripts with diagnosis. Based on feature score and correlation score together, we have listed gene transcripts with AD risk or as AD suppressor as listed in Table 4.
2.3. AD Stage Diagnosis Model Construction
We have used deep learning approach for model construction for both data modalities. Deep learning is a better classifier techniques than many of other ML based classifiers [25]. However, as per nature of both the modalities of clinical and genomic data, we have used separate approaches for deep learning model constructions.
The ‘Deep learning’ model built for clinical study data analysis is simple. There are 2000 samples of clinical data, enough for constructing the model. We have divided the available 2400 samples for train data and validation data with 25 % of data as validation data. We have trained different DL model instances after randomly splitting the available 2000 samples data into train and test datasets in 75% and 25 % multiple times. The hyperparameters used during training are as mentioned in Table 5. Performance of each of the best five DL model instances is listed in the next section.
The genomic dataset is of HDLSS and imbalanced in nature. Dataset is of high dimension and consists of 384 samples of MCI, 280 of CN and only 116 of Dementia as referred in Table 2. There is a high imbalance of samples between MCI and Dementia category. ‘Dementia’, the minority class is hard to predict as there are fewer samples and so less learning opportunity than that of majority samples. Problem associated with imbalanced dataset is that, most of the learning methods are biased towards the majority class, so most of the minority samples are not modelled well [23]. Though intense work happened to resolve issues with imbalanced learning, still there are many short comings [24]. No research have been done yet on classification of imbalanced gene expression data. The main problem of imbalanced classification is that because of fewer samples of minority category, the model cannot properly learn decision boundary [26].
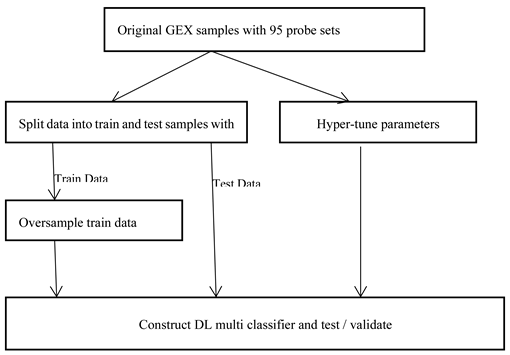
As shown in following Figure 6, there can be broadly two approaches when constructing deep learning model from imbalance data. As the overall sample size is small and imbalanced as well, we preferred data augmentation approach over other approaches like weighted or ensemble modelling. Application of oversampling for obtaining a more balanced dataset is an effective approach. Minority sample data is duplicated before fitting the model. However, random oversampling increases the likelihood of overfitting occurrence as it makes exact minority class sample copies [23]. We are using oversampling techniques where additional minority samples are synthetically generated which is a kind of data augmentation. One of the most popular method is ‘Synthetic Minority Oversampling Technique’, or SMOTE for short [27]. We are using a popular extension ‘Boderline SMOTE’ where misclassified minority samples are selected for oversampling instead of blind oversampling. The samples at border line and the nearby ones tend to be misclassified more than the ones that are far from borderline, and so more important for classification [28].
As shown in Figure 7. below, we are doing oversampling on the training dataset, not on the validation dataset. Reason is that it is necessary to do evaluation of the model with a dataset that represents the problem domain. Model evaluation with a dataset with deleted or synthesized examples would most likely provide an optimistic performance estimation [26].
3. Performance Result
We have used ‘ROC AUC, F1 score (micro and weighted average) to measure the model performance of multiclassification. ‘accuracy’, a popular performance metric is recognized as poor metric in model performance measurement with imbalanced data [26]. So, we are not using it. A variety of metrics have been used when learning from imbalanced data The most common one is receiver operation characteristics (ROC) analysis, and the area under the ROC curve [29,30].
Other popular metrics used in imbalanced learning are based on precision and recall. F1-measure equally weights precision and recall. This variant is often used as performance metric while learning from imbalanced data [26]. For multi-class classification, averaging methods for F1 score calculation is adopted, with a set of different average scores (weighted, micro, macro). ‘Weighted-average F1 score’ is calculated by taking the mean of all per-class F1 scores and considering each class’s instance as well. ‘Micro average F1 score’ is calculated based on sums of the True Positives (TP), False Negatives (FN), and False Positives (FP). The ‘macro-averaged F1 score’ is the arithmetic mean of the per-class (with equal weight) F1 scores. ‘Macro weighting’ gives information about model performance if class imbalance is not considered [31]. We have used ‘micro averaged F1 score’ and ‘weighted average F1 score’.
For clinical data, we are using 25 % of the samples for validation purpose while it is 35% for original Genome expression samples. Some prevalent performance measurement techniques like cross validation is not used here. The genomic dataset has 744 samples and clinical study has 2400 samples. Dividing the samples further among ‘n’ number of different model instances for cross validation, would significantly reduce the data for model training. A deep learning classifier requires relatively larger data when compared with other classifiers. So, instead of using cross validation, we have resampled train and test data several times to construct different model instances. We have listed the five best performing model instances for both data modalities.
We have listed performances of 5 instances of gene expression models in Table 5 and Figure 7. ROC AUC of the best model instance (for gene expression) is 0.75, 0.74, 0.70 for CN, MCI, AD category respectively. Best ‘micro averaged weighted F1 score’ and ‘weighted average F1 score is 0.67 and 0.66 respectively for the model trained with original data while it is 0.67 for both F1 scores for the other. For clinical study data, the ROC AUC scores are 0.97,0.94,0.94 which is quite promising as shown in Figure 8 and Table 6.
4. Discussion and Conclusion
Different performance scores of the models built on clinical data modality, are quite promising. This essentially means effectiveness of our feature selection and model construction approach. Without depending on 116 biomarkers, only 8 biomarkers can lead to an accurate diagnosis of AD stages. This can be an excellent support for physicians in the laboratory.
For the model build on the other data modality, the gene expression, performance is less comparatively. There are several reasons for this. First, the number of samples of gene expression data is quite less compared to that of clinical study dataset. Second, the dataset is associated with multiple challenges as discussed. The third reason is that many pathways are involved with genomic data.
With effective feature selection technique and imbalanced data handling combination, we could find 95 effective gene transcripts / probes out of 49,386 and improve ‘ROC AUC’ score from 0.675 of earlier research (of Lee H. et al., 2020) in CN vs AD binary classification to 0.75 in CN (vs other class) in multiclassification. An increment of 8.5% is promising. While none of the earlier studies on Alzheimer disease with blood gene expression data considered ‘F1 score’ for performance analysis, our research utilised ‘F1 score’ in multiclassification and achieved the best score of 0.67 for ‘weighted average’ and ‘micro average’ F1 score. The overall results indicate our feature selection techniques could appropriately select 95 effective gene transcripts. From these 95 gene transcripts, we could infer nature of some of the genes from AD perspective using SHAP and correlation analysis. The categories are broadly AD suppressor gene, moderate AD risk gene and AD risk gene.
This study did not find a role of known ‘AD risk’ allele of APP (amyloid precursor protein), PS1 (presenilin 1), PS2 (presenilin 2), and apolipoprotein E (ApoE) for this disease. One possible reason is that if these gene alleles are not expressed sufficiently, they are not active and cannot cause AD even if they have associated AD risk. This again substantiate the fact that Alzheimer’s disease is caused by different factors like gene expression, gene regulation, oxidation stress, cell metabolism. In Figure 10, lime plot shows different genes leading to dementia – TEP1, SQLE, HLA-DQA1, TTC28, ZNF835. When analysed the contributing genes of a dementia test sample using LIME, we observed LIME results tally with it.
To summaries, we built a multiclassification model for diagnosis of stages including intermediate stage of AD (MCI) from two data modalities of clinical study data and blood gene expression profiles. Multiple challenges have been taken care and we achieved an F1 score and ‘ROC AUC’ which is the best result known so far in multiclassification of the stages of AD. Additionally, as low cost is associated with for this diagnosis unlike PET, MRI and other costly diagnostic approaches, it is expected to be affordable. We have listed different ‘AD risk’ genes and ‘AD suppressor genes’ that can be investigated further in future research. This research can further be extended with fusion of clinical study data and the genomic dataset as a future scope. Analysis on refection of genomic biomarkers to clinical AD biomarkers, AD symptoms can be another interesting work in future.
References
- Angelucci F, Spalletta G, di Iulio F, Ciaramella A, Salani F, Colantoni L, Varsi AE, Gianni W, Sancesario G, Caltagirone C, Bossù P. Alzheimer’s disease (AD) and Mild Cognitive Impairment (MCI) patients are characterized by increased BDNF serum levels. Curr Alzheimer Res. 2010 Feb;7(1):15-20. PMID: 20205668. [CrossRef]
- Cummings, JL., Morstorf, T., Zhong, K.: Alzheimer’s disease drug development pipeline: Few candidates, frequent failures. Alzheimer’s Res Ther (2014).
- Willette, V. D. Calhoun, J. M. Egan, D. Kapogiannis, and A. s. D. N. Initiative, “Prognostic classification of mild cognitive impairment and Alzheimer s disease: MRI independent component analysis,” Psychiatry Research: Neuroimaging, vol. 224, no. 2, pp. 81-88, 2014.
- H. Gorji and J. Haddadnia, “A novel method for early diagnosis of Alzheimer’s disease based on pseudo Zernike moment from structural MRI,” Neuroscience, vol. 305, pp. 361-371, 2015.
- Tanzi RE. The genetics of Alzheimer disease. Cold Spring Harb Perspect Med. 2012 Oct 1;2(10):a006296. PMID: 23028126; PMCID: PMC3475404. [CrossRef]
- Shen L, Jia J. An Overview of Genome-Wide Association Studies in Alzheimer’s Disease. Neurosci Bull. 2016;32(2):183–190. [CrossRef]
- “Genetics.” Alzheimer’s Disease and Dementia, www.alz.org/alzheimers-dementia/what-is-alzheimers/causes-and-risk-factors/genetics.
- Marian AJ. Molecular genetic studies of complex phenotypes. Transl Res. 2012;159:64–79. [CrossRef]
- Lee T, Lee H. Prediction of Alzheimer’s disease using blood gene expression data. Sci Rep. 2020 Feb 26;10(1):3485. PMID: 32103140; PMCID: PMC7044318. [CrossRef]
- Patel H, Dobson RJB, Newhouse SJ. A Meta-Analysis of Alzheimer’s Disease Brain Transcriptomic Data. J Alzheimers Dis. 2019;68(4):1635-1656. PMID: 30909231; PMCID: PMC6484273. [CrossRef]
- Liew CC, Ma J, Tang HC, Zheng R, Dempsey AA. The peripheral blood transcriptome dynamically reflects system wide biology: A potential diagnostic tool. J Lab Clin Med. 2006;147:126–32.
- Saykin AJ, Shen L, Foroud TM; et al. Alzheimer’s Disease Neuroimaging Initiative.
- biomarkers as quantitative phenotypes: Genetics core aims, progress, and plans. Alzheimers Dement. 2010;6(3):265–273. [CrossRef]
- P. Fehlbaum-Beurdeley et al., “Toward an Alzheimer’s disease diagnosis via high-resolution blood gene expression,” Alzheimer’s & Dementia, vol. 6, no. 1, pp. 25-38, 2010.
- K. Lunnon et al., “A blood gene expression marker of early Alzheimer’s disease,” Journal Of Alzheimer’s Disease, vol. 33, no. 3, pp. 737-753, 2013.
- Li, H. et al. Identification of molecular alterations in leukocytes from gene expression profiles of peripheral whole blood of Alzheimer’s disease. Sci. Rep. 7, 14027 (2017).
- Li, X. et al. Systematic analysis and biomarker study for Alzheimer’s disease. Sci. Rep. 8, 17394 (2018).
- Park, J. Ha and S. Park, “Prediction of Alzheimer’s disease based on deep neural network by integrating gene expression and DNA methylation dataset”, Expert Syst. Appl., vol. 140, pp. 112873, 2020.
- Kalkan H, Akkaya UM, Inal-Gültekin G, Sanchez-Perez AM. Prediction of Alzheimer’s Disease by a Novel Image-Based Representation of Gene Expression. Genes (Basel). 2022 Aug 8;13(8):1406. PMID: 36011317; PMCID: PMC9407775. [CrossRef]
- Shen, Liran and Qingbo Yin. “The classification for High-dimension low-sample size data.” Pattern Recognit. 130 (2020): 108828.
- Sarma, M., Chatterjee, S. (2020). Identification and Prediction of Alzheimer Based on Biomarkers Using ‘Machine Learning’. In: Bhattacharjee, A., Borgohain, S., Soni, B., Verma, G., Gao, XZ. (eds) Machine Learning, Image Processing, Network Security and Data Sciences. MIND 2020. Communications in Computer and Information Science, vol 1241. Springer, Singapore. [CrossRef]
- Catchpoole DR, Kennedy P, Skillicorn DB, Simoff S (2010) The curse of dimensionality: A blessing to personalized medicine. J Clin Oncol 28: 723-724.
- Marcilio, Wilson Estecio and Danilo Medeiros Eler. “From explanations to feature selection: Assessing SHAP values as feature selection mechanism.” 2020 33rd SIBGRAPI Conference on Graphics, Patterns and Images (SIBGRAPI) (2020): 340-347.
- Fernández, A.; García, S.; Galar, M.; Prati, R.C.; Krawczyk, B.; Herrera, F. Learning from Imbalanced Data Sets; Springer International Publishing: Cham, Switzerland, 2018; pp. 197–226.
- Krawczyk, B. Learning from imbalanced data: Open challenges and future directions. Prog Artif Intell 5, 221–232 (2016). [CrossRef]
- Ahmed, S.F., Alam, M.S.B., Hassan, M. et al. Deep learning modelling techniques: Current progress, applications, advantages, and challenges. Artif Intell Rev 56, 13521–13617 (2023). [CrossRef]
- Brownlee, J. Imbalanced Classification with Python. (2020).
- Chawla, N. V. et al. (2002). SMOTE: Synthetic Minority Over-Sampling Technique. Journal of Artificial Intelligence Research, 16, 321-357. [CrossRef]
- Han, H., Wang, WY., Mao, BH. (2005). Borderline-SMOTE: A New Over-Sampling Method in Imbalanced Data Sets Learning. In: Huang, DS., Zhang, XP., Huang, GB. (eds) Advances in Intelligent Computing. ICIC 2005. Lecture Notes in Computer Science, vol 3644. Springer, Berlin, Heidelberg. [CrossRef]
- Cardenas and J. Baras, “B-ROC curves for the assessment of classifiers over imbalanced data sets,” in Proceedings of the Twenty-First National Conference on Artificial Intelligence (Boston, MA, USA), pp. 1581–1584, AAAI Press, 2006.
- P. Flach, J. Hernandez-Orallo, and C. Ferri, “A coherent interpretation of AUC as a measure of aggregated classification performance,” in Proceedings of the 28th Inter-national Conference on Machine Learning (ICML-11) (New York, NY, USA), pp.657–664, Omnipress, 2011.
- David Harbecke, Yuxuan Chen, Leonhard Hennig, and Christoph Alt. 2022. Why only Micro-F1? Class Weighting of Measures for Relation Classification. In Proceedings of NLP Power! The First Workshop on Efficient Benchmarking in NLP, pages 32–41, Dublin, Ireland. Association for Computational Linguistics.
- Bloch, L., Friedrich, C.M. & for the Alzheimer’s Disease Neuroimaging Initiative. Machine Learning Workflow to Explain Black-Box Models for Early Alzheimer’s Disease Classification Evaluated for Multiple Datasets. SN COMPUT. SCI. 3, 509 (2022). [CrossRef]
- Wu Q, Boueiz A, Bozkurt A, Masoomi A, Wang A, DeMeo DL, Weiss ST, Qiu W. Deep Learning Methods for Predicting Disease Status Using Genomic Data. J Biom Biostat. 2018;9(5):417. Epub 2018 Dec 11. PMID: 31131151; PMCID: PMC6530791.
- J. Bins and B. A. Draper, “Feature selection from huge feature sets,” Proceedings Eighth IEEE International Conference on Computer Vision. ICCV 2001, Vancouver, BC, Canada, 2001, pp. 159-165 vol.2. keywords: {Computer vision;Principal component analysis;Probes;Computer science;Supervised learning;Particle measurements;Size measurement;Data mining;Object recognition;Biometrics}. [CrossRef]
Figure 1.
SFBS graph of selection of 8 clinical features biomarkers.
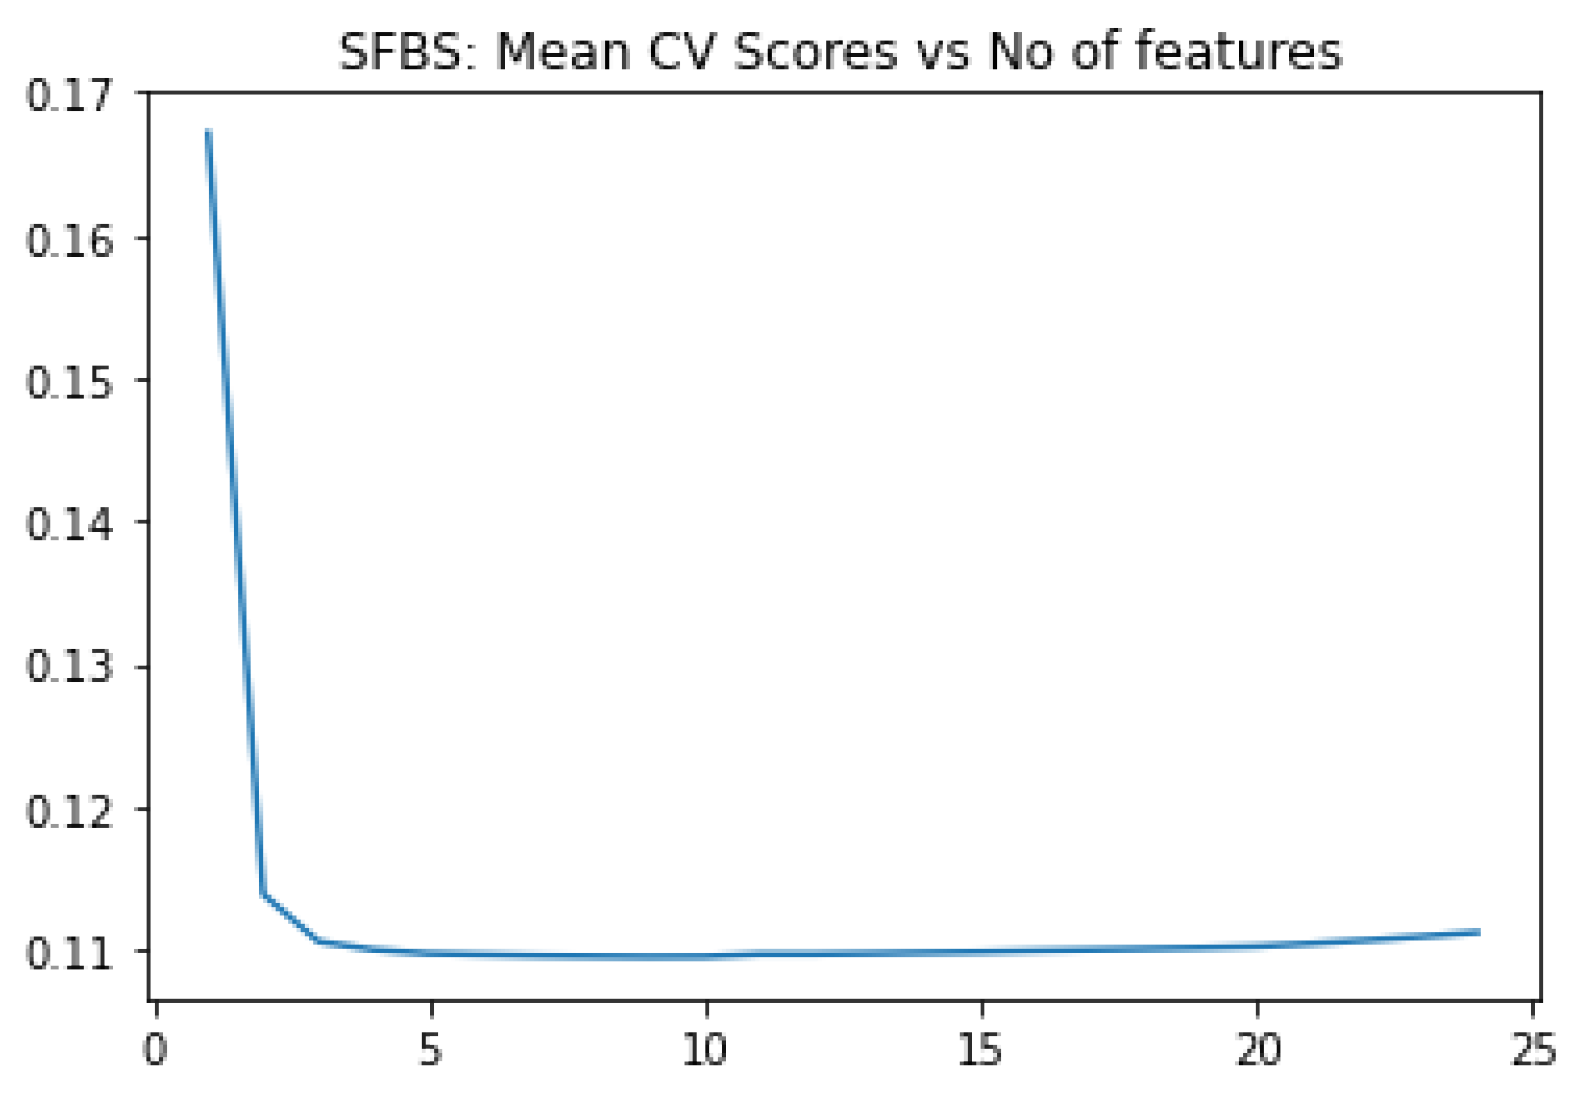
Figure 2.
SFBS graph of selection of 95 gene features / gene probsets.
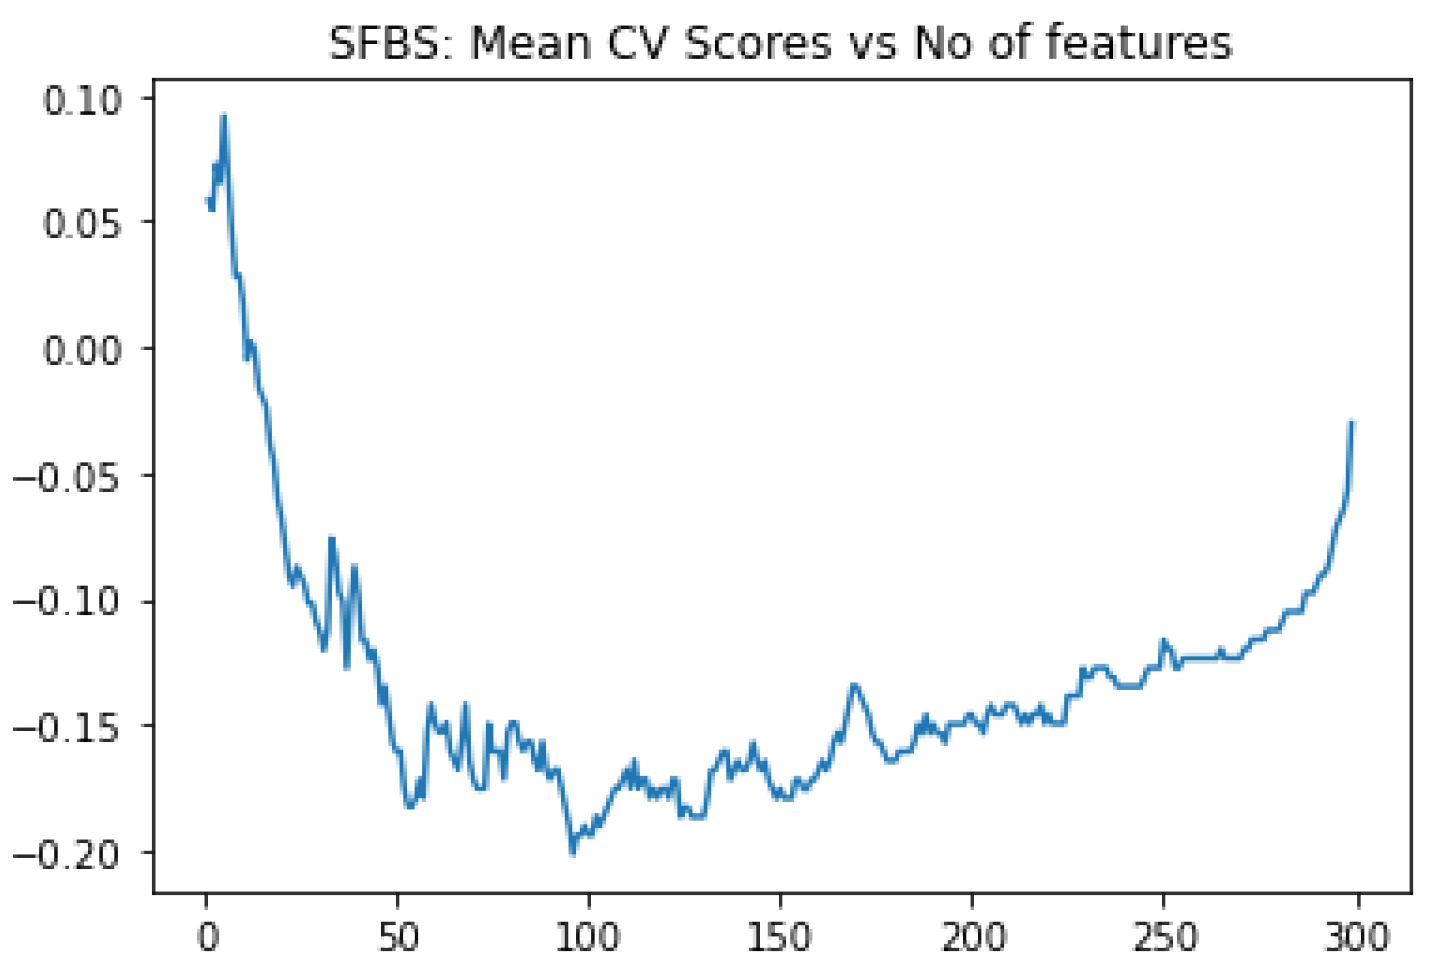
Figure 3.
Top 40 features / gene transcripts out of 95 ranked as per feature score.
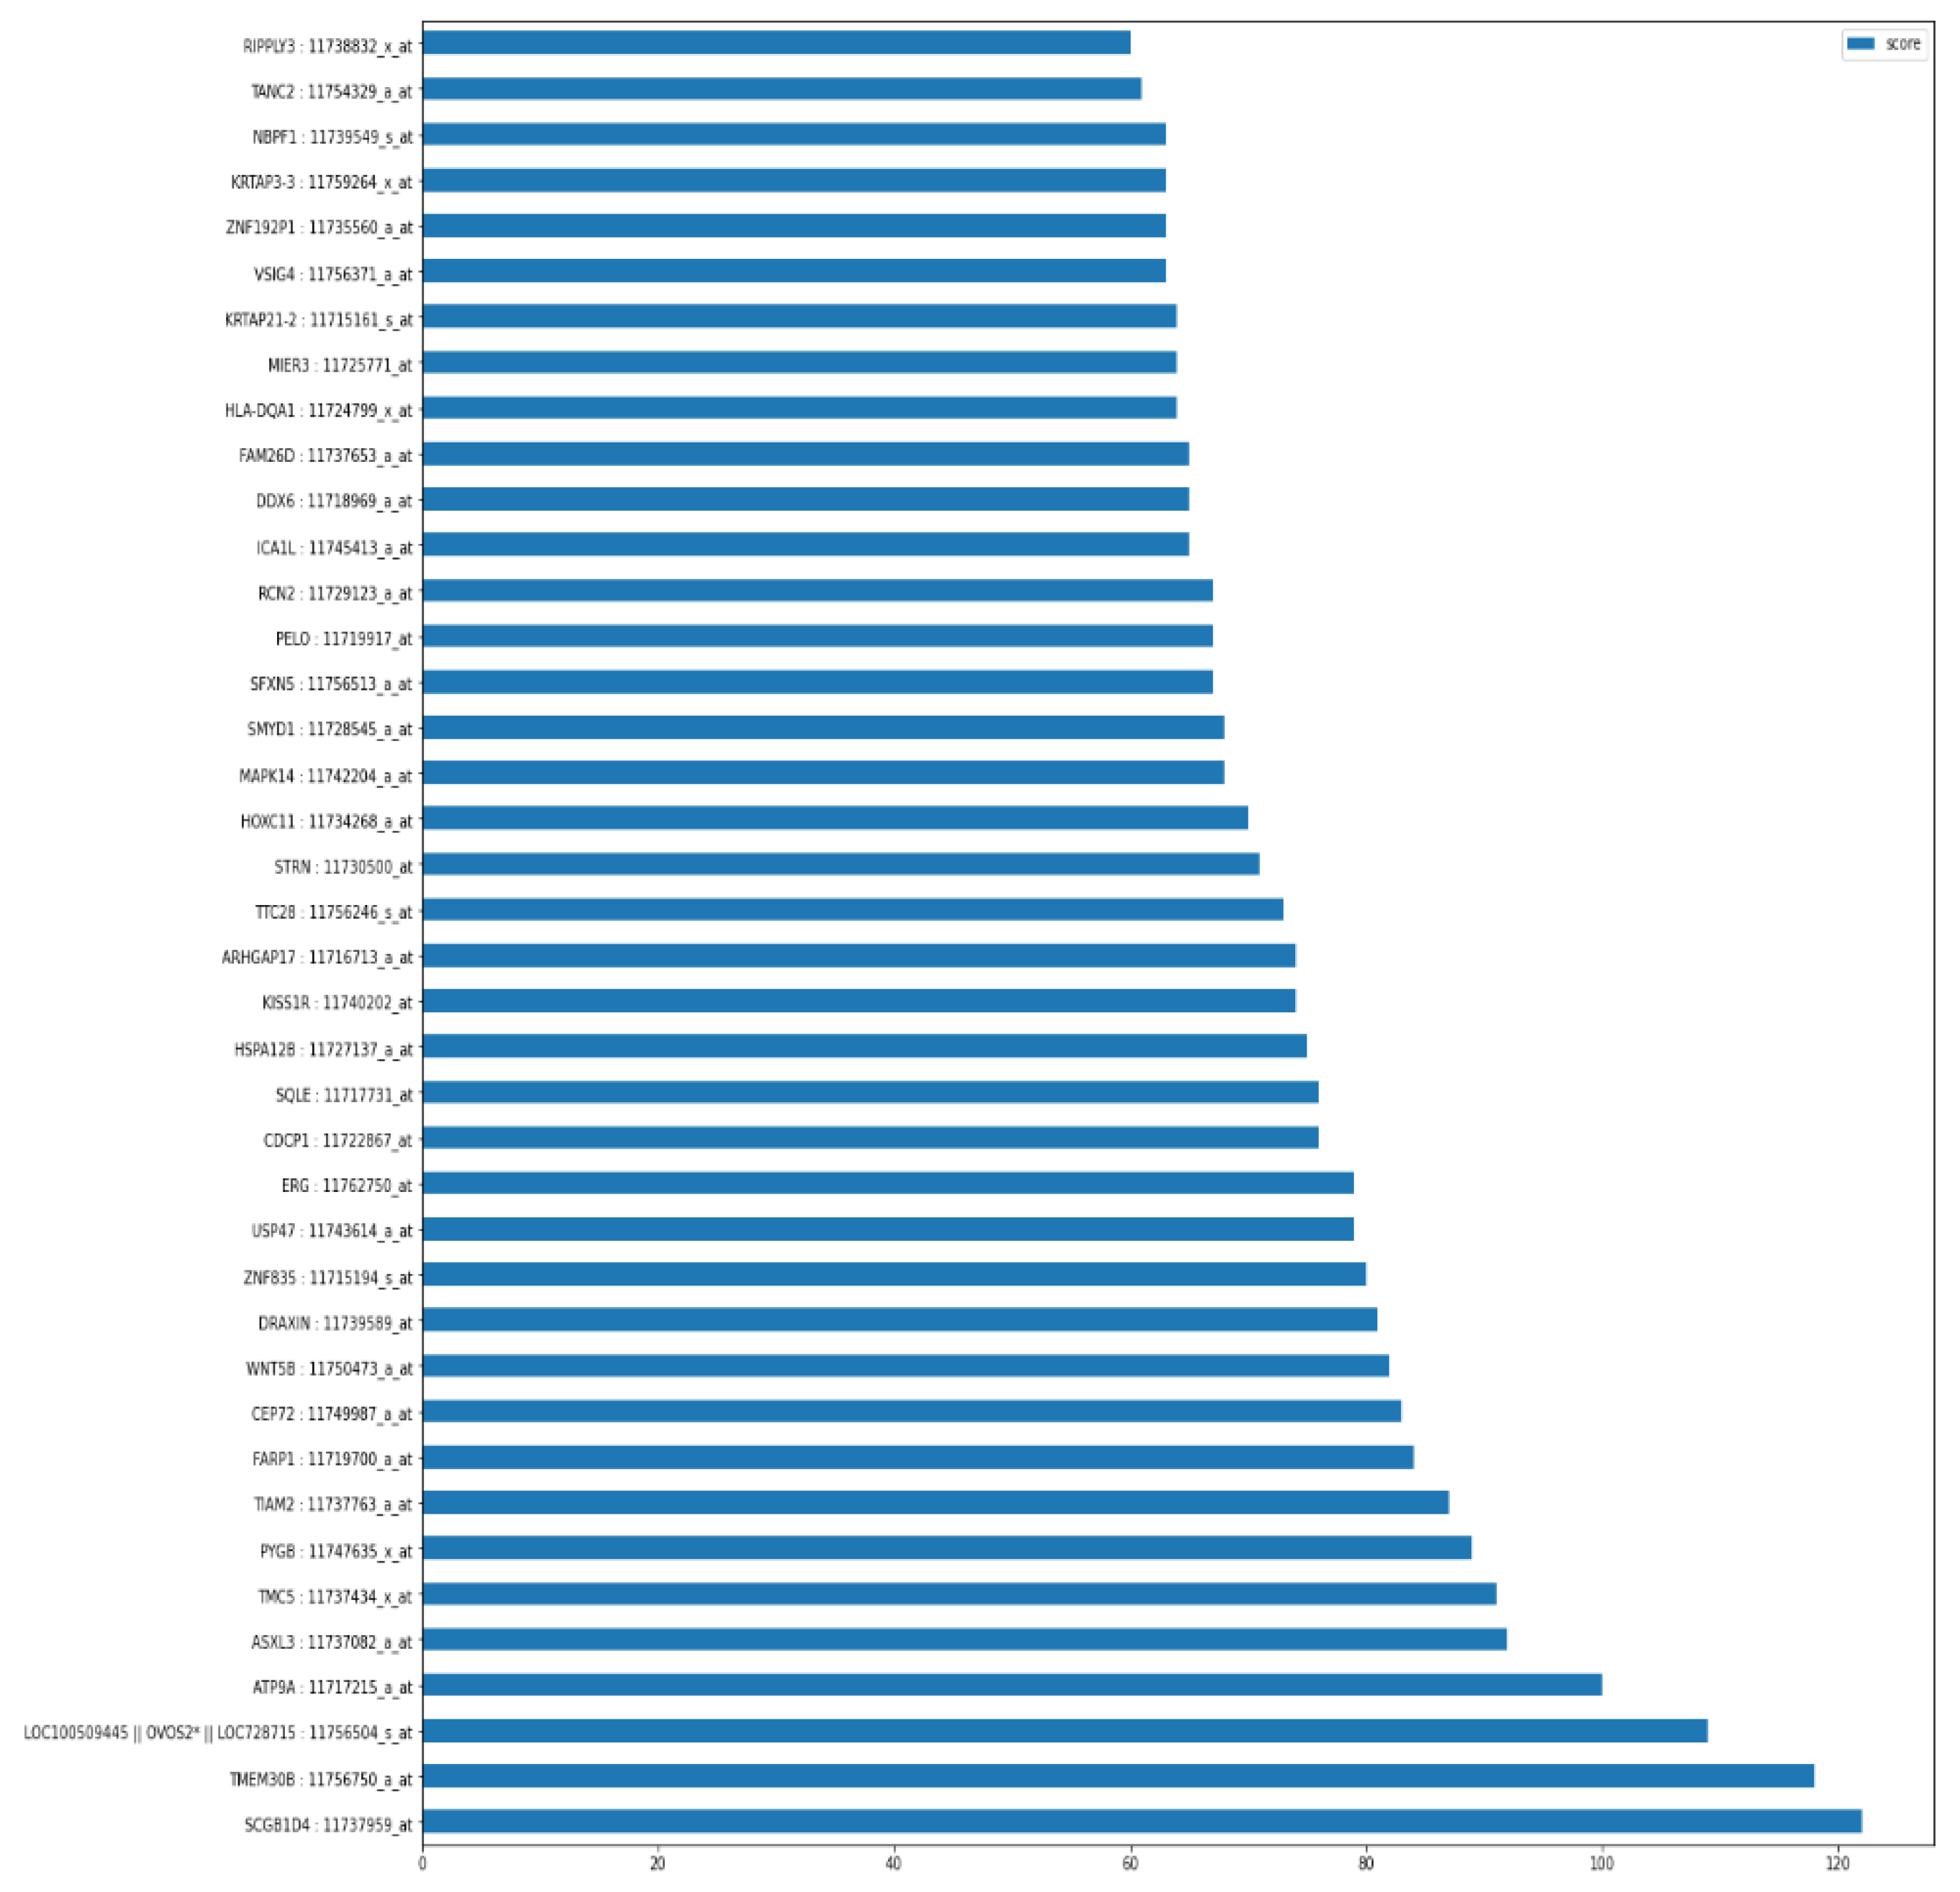
Figure 4.
SHAP summary plot showing impacts of gene transcript on each class.
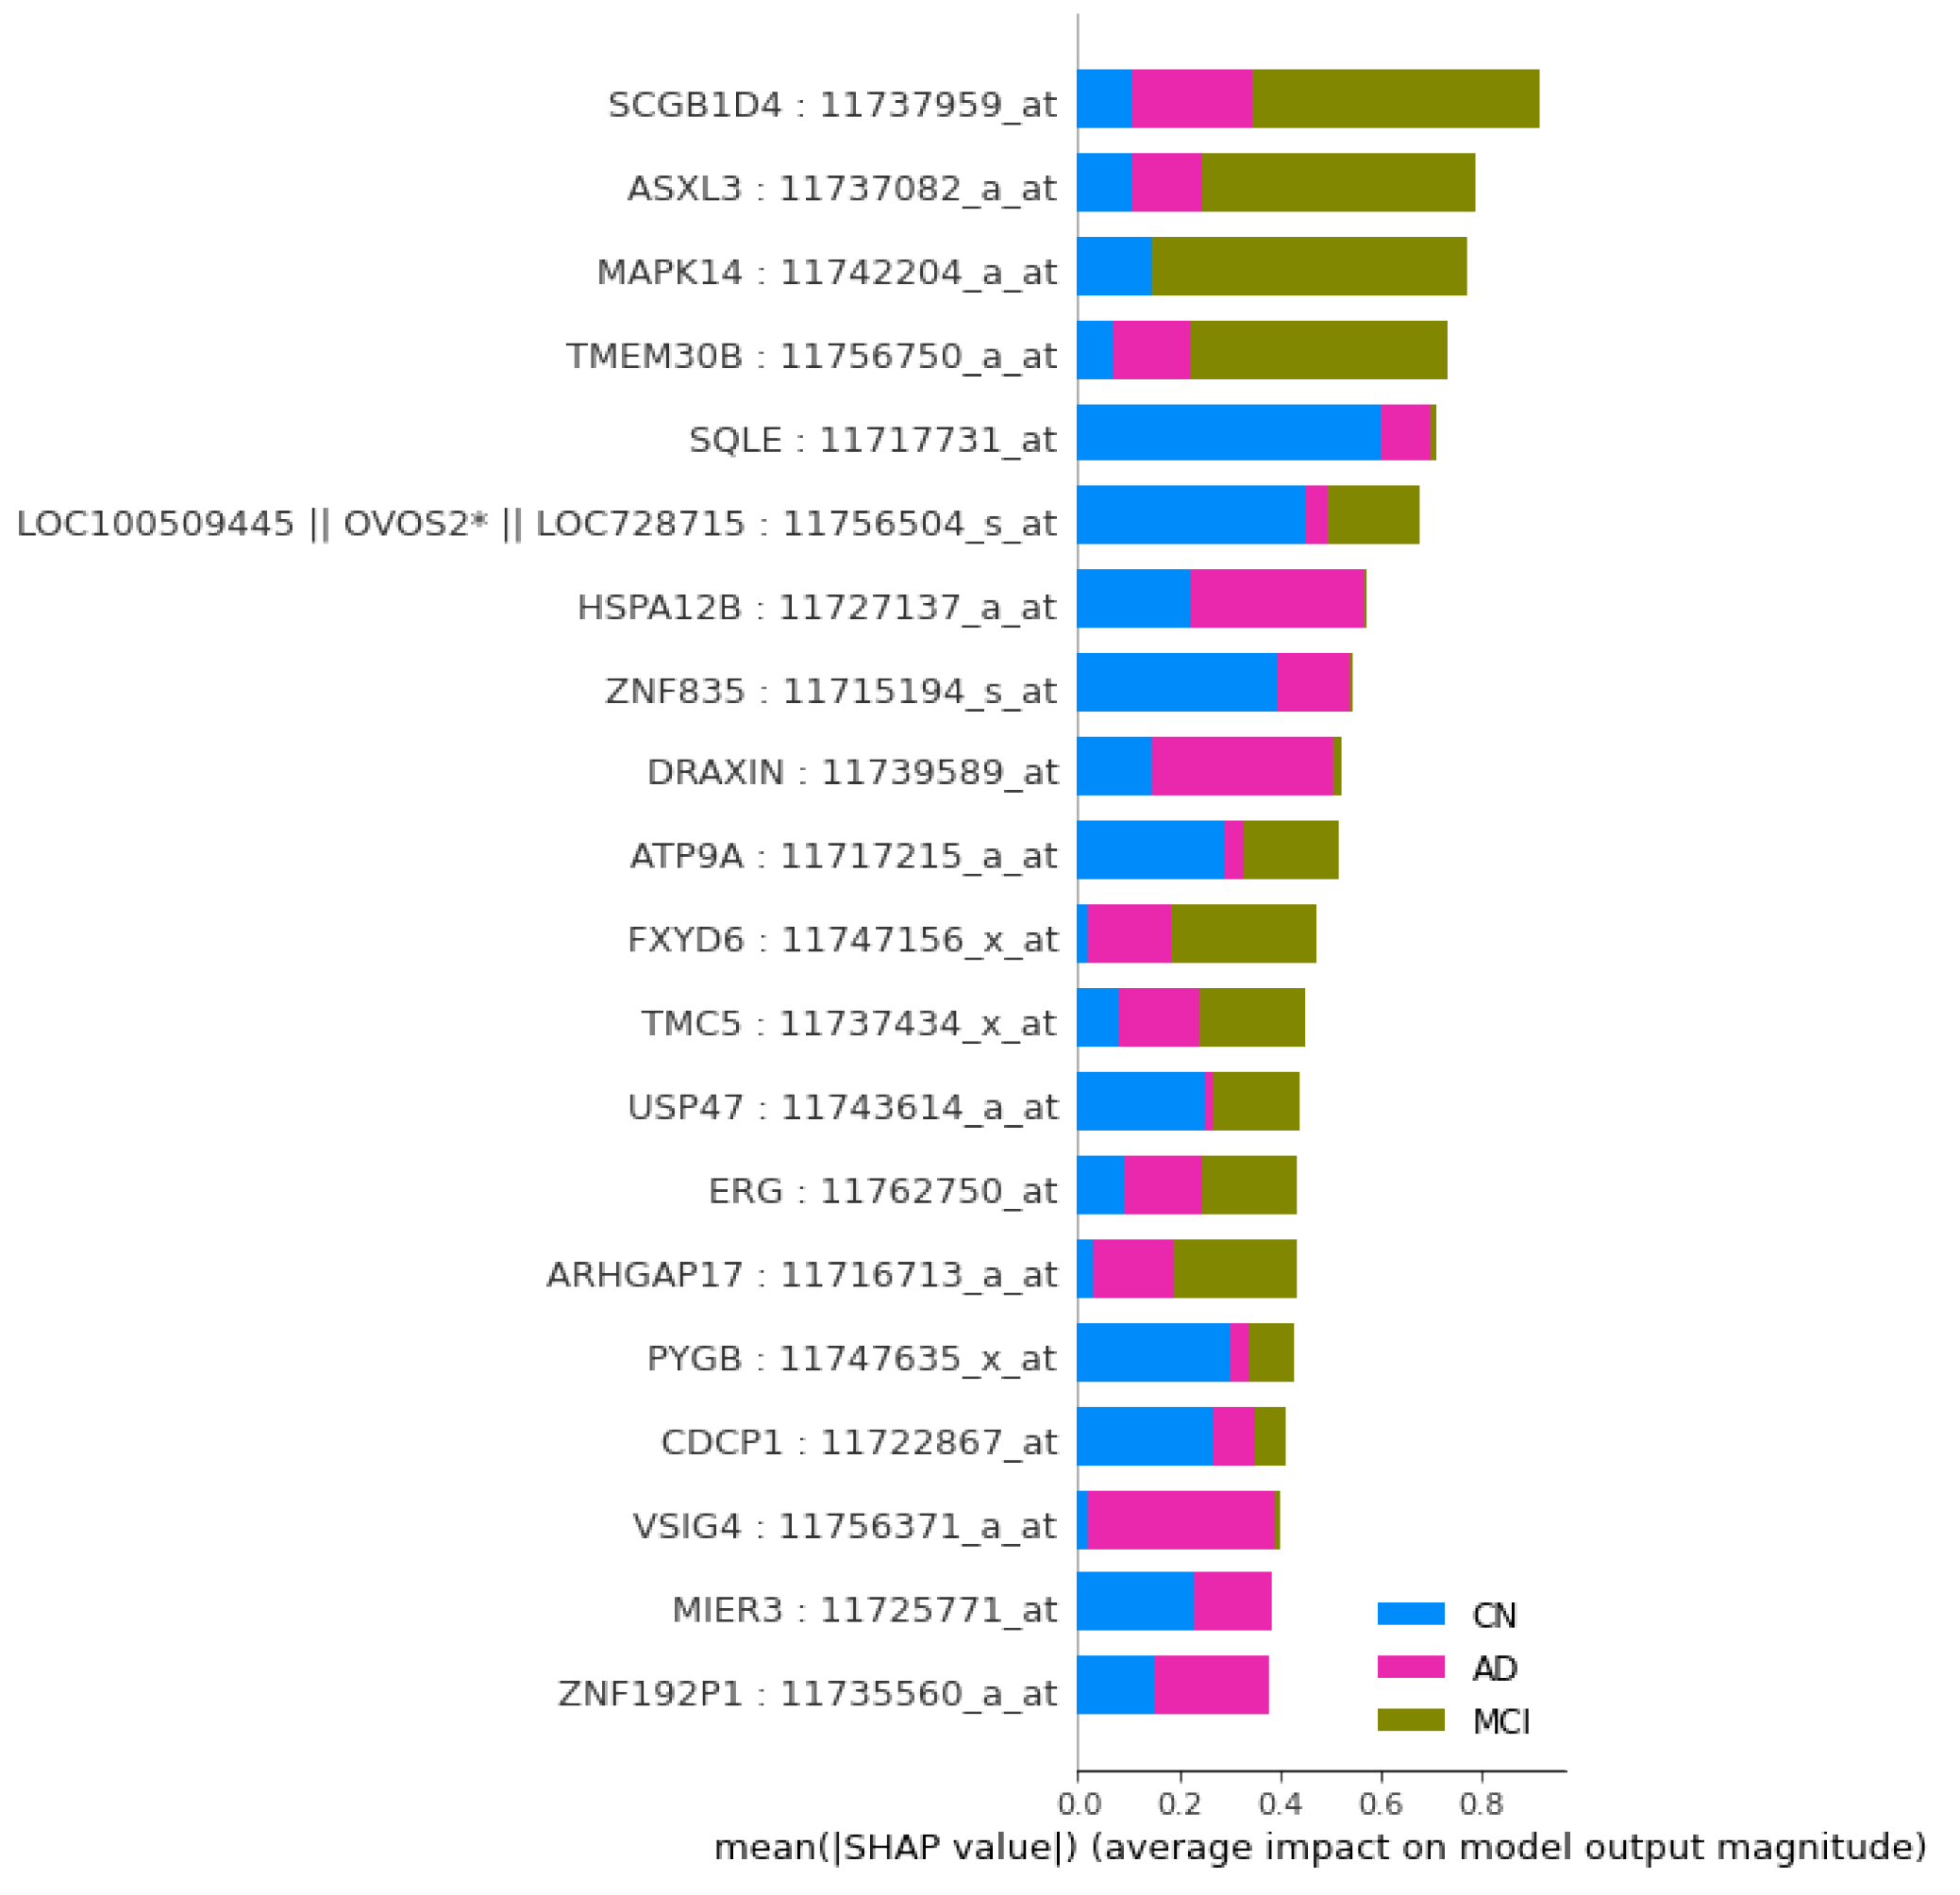
Figure 6.
Handling of Genome expression data for model construction.
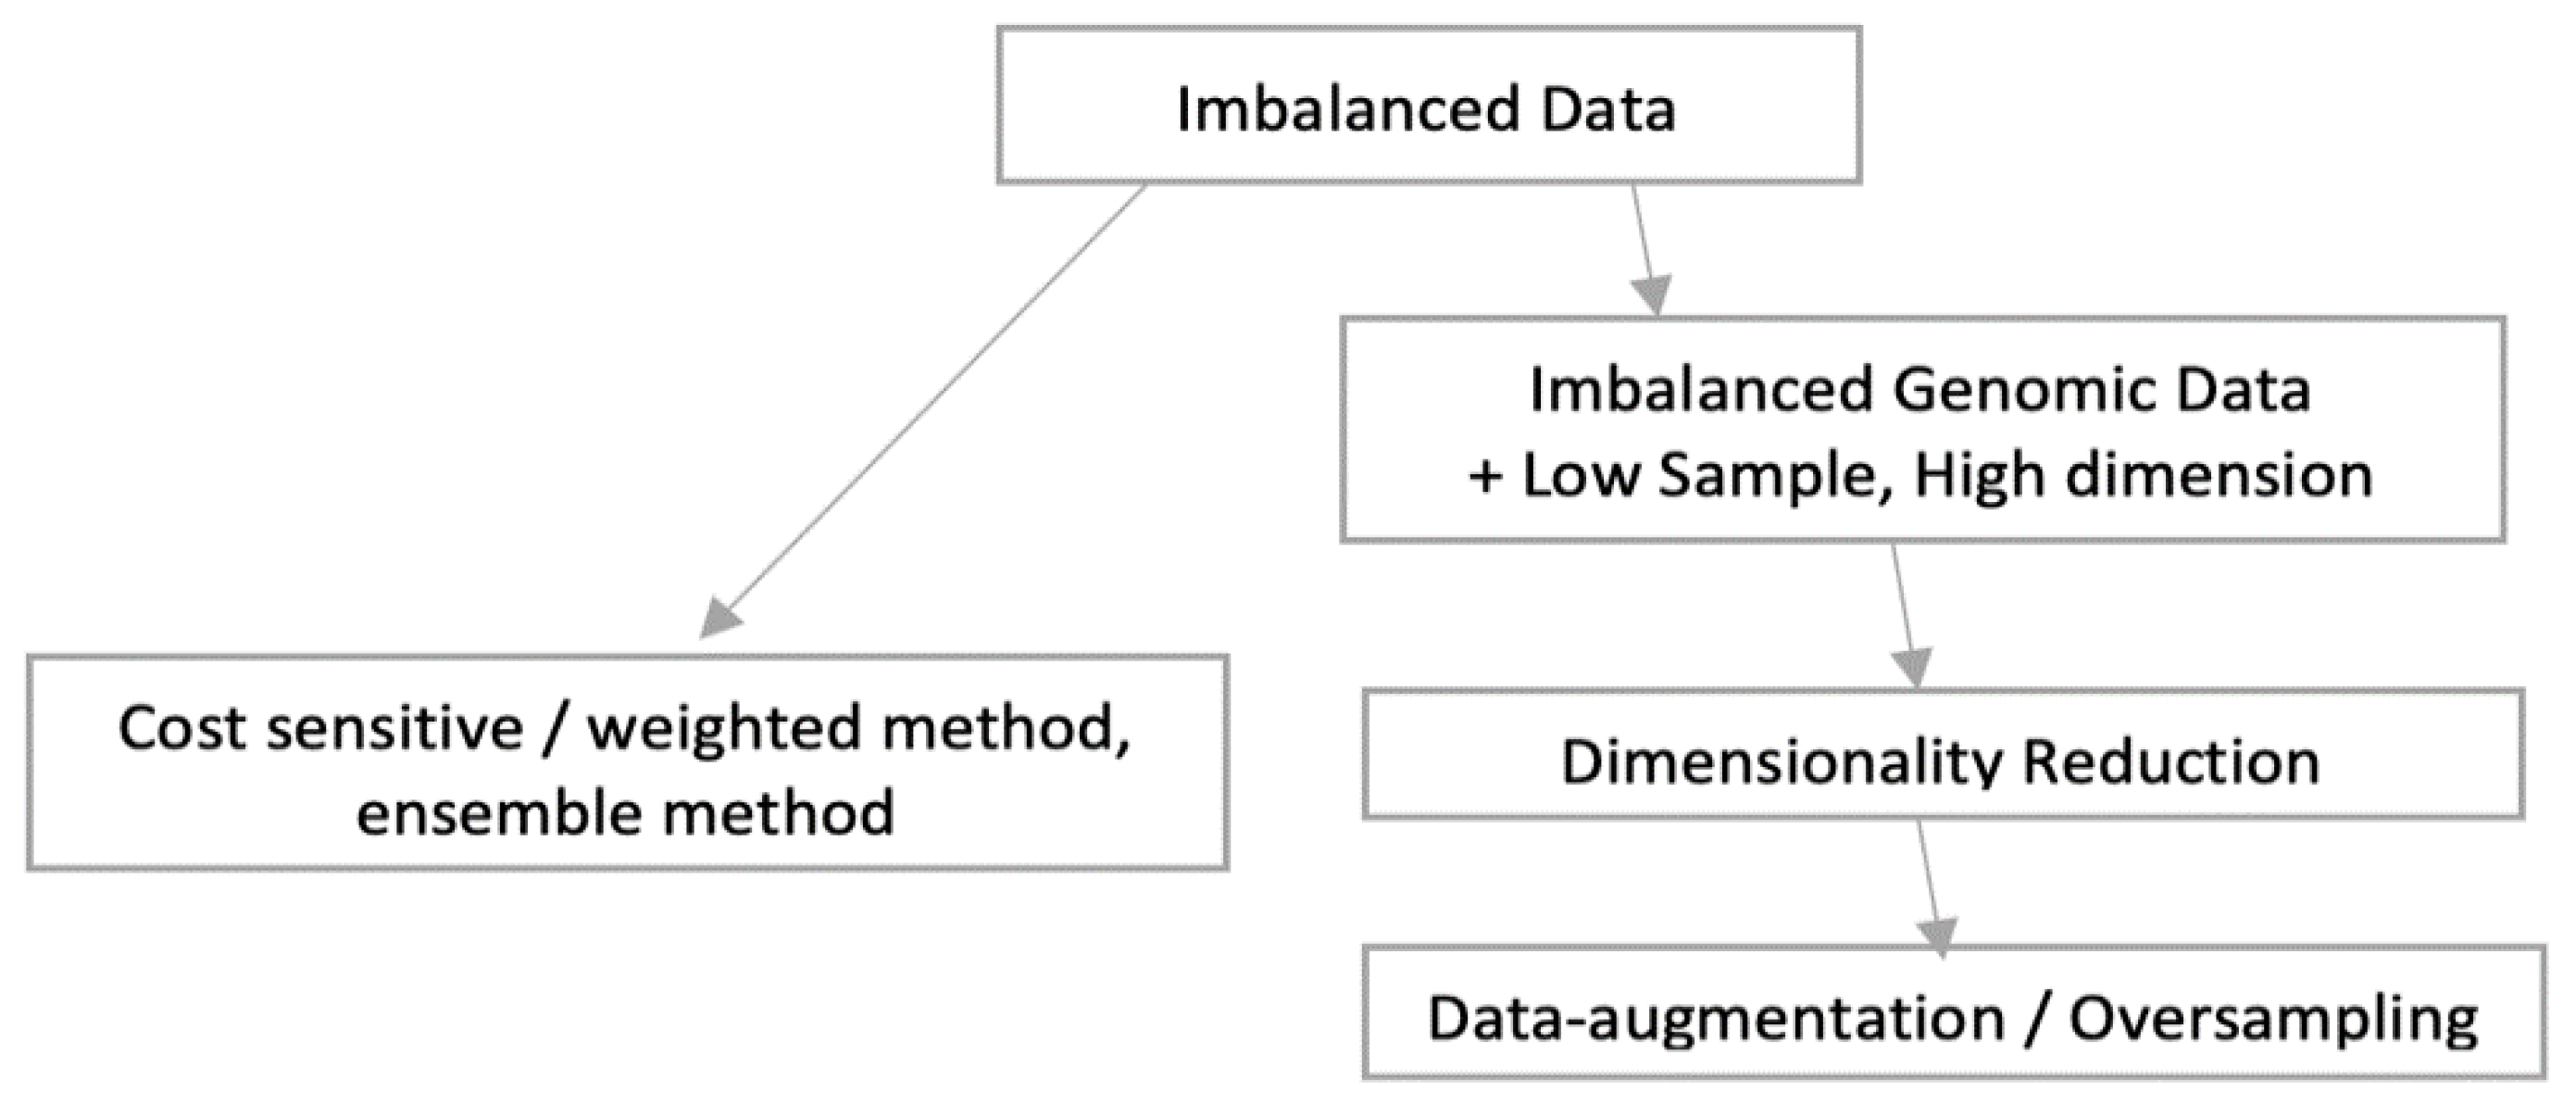
Figure 8.
ROC and confusion matrix of Gene expression DL model.
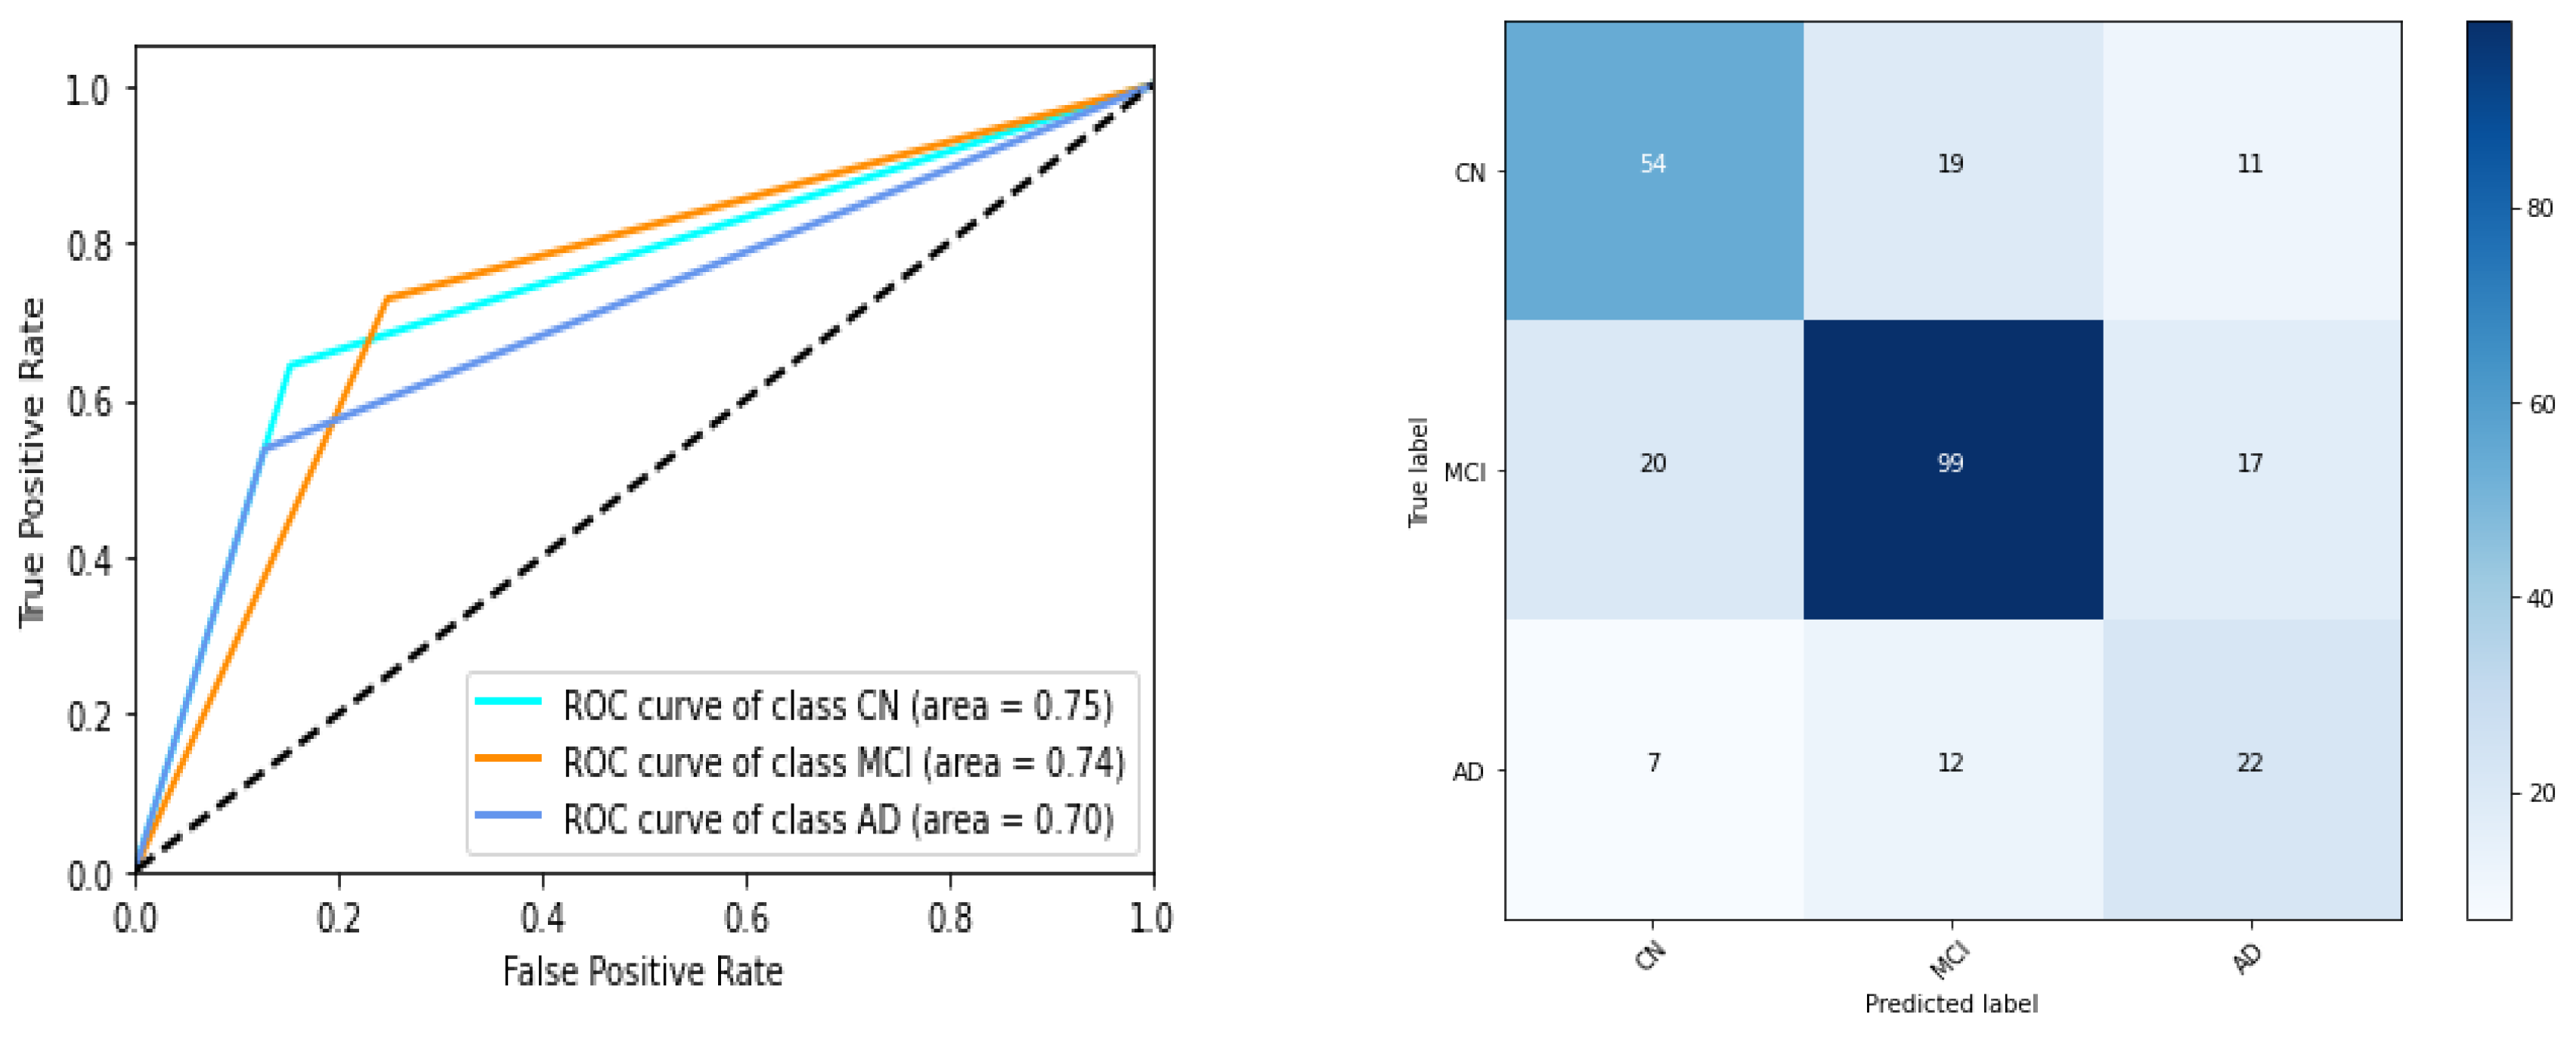
Figure 9.
ROC and confusion matrix of DL model on clinical study data.
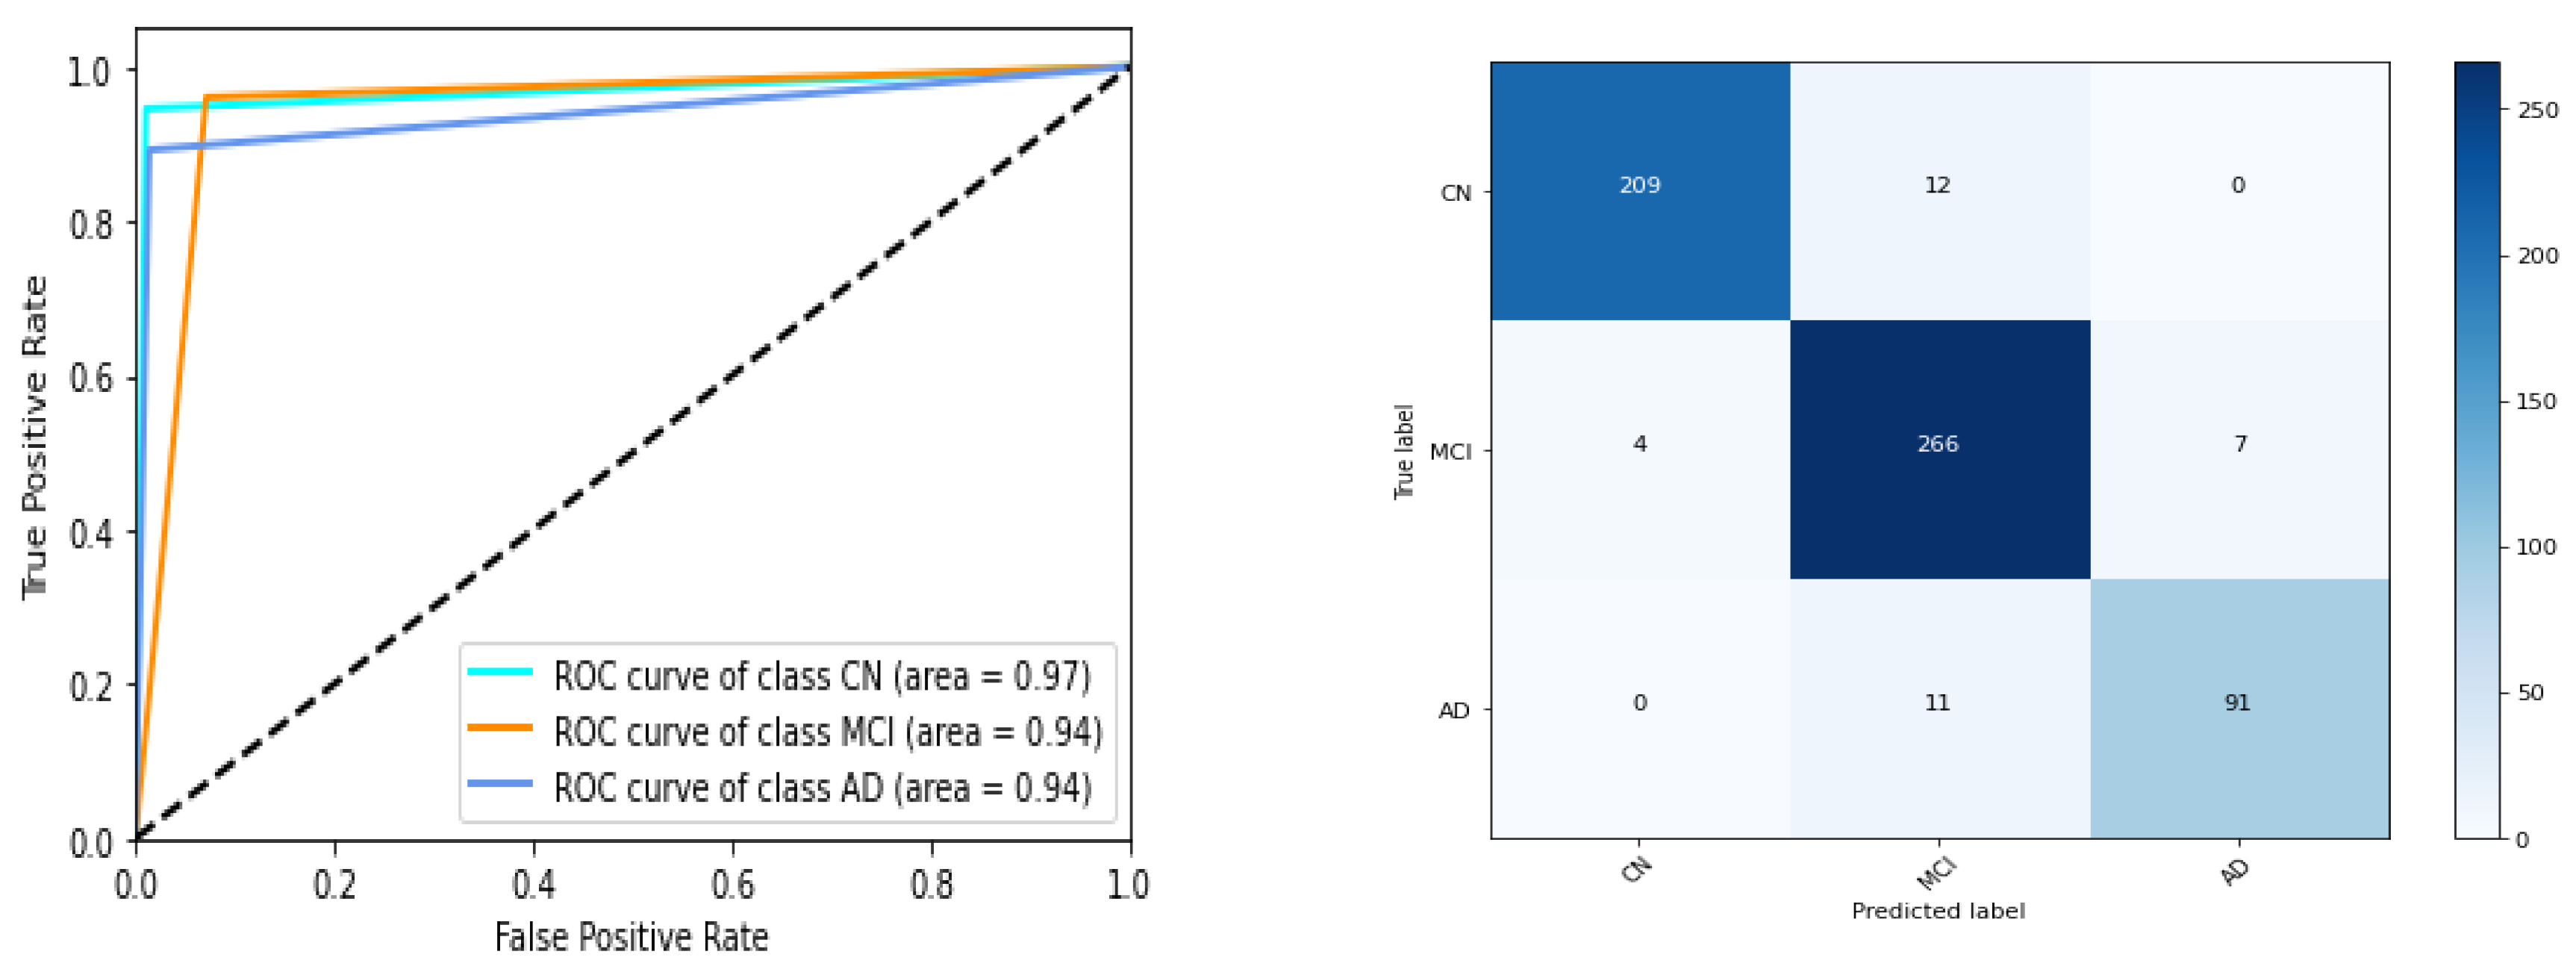
Figure 10.
LIME plot showing contributing genes expressions leading to dementia.
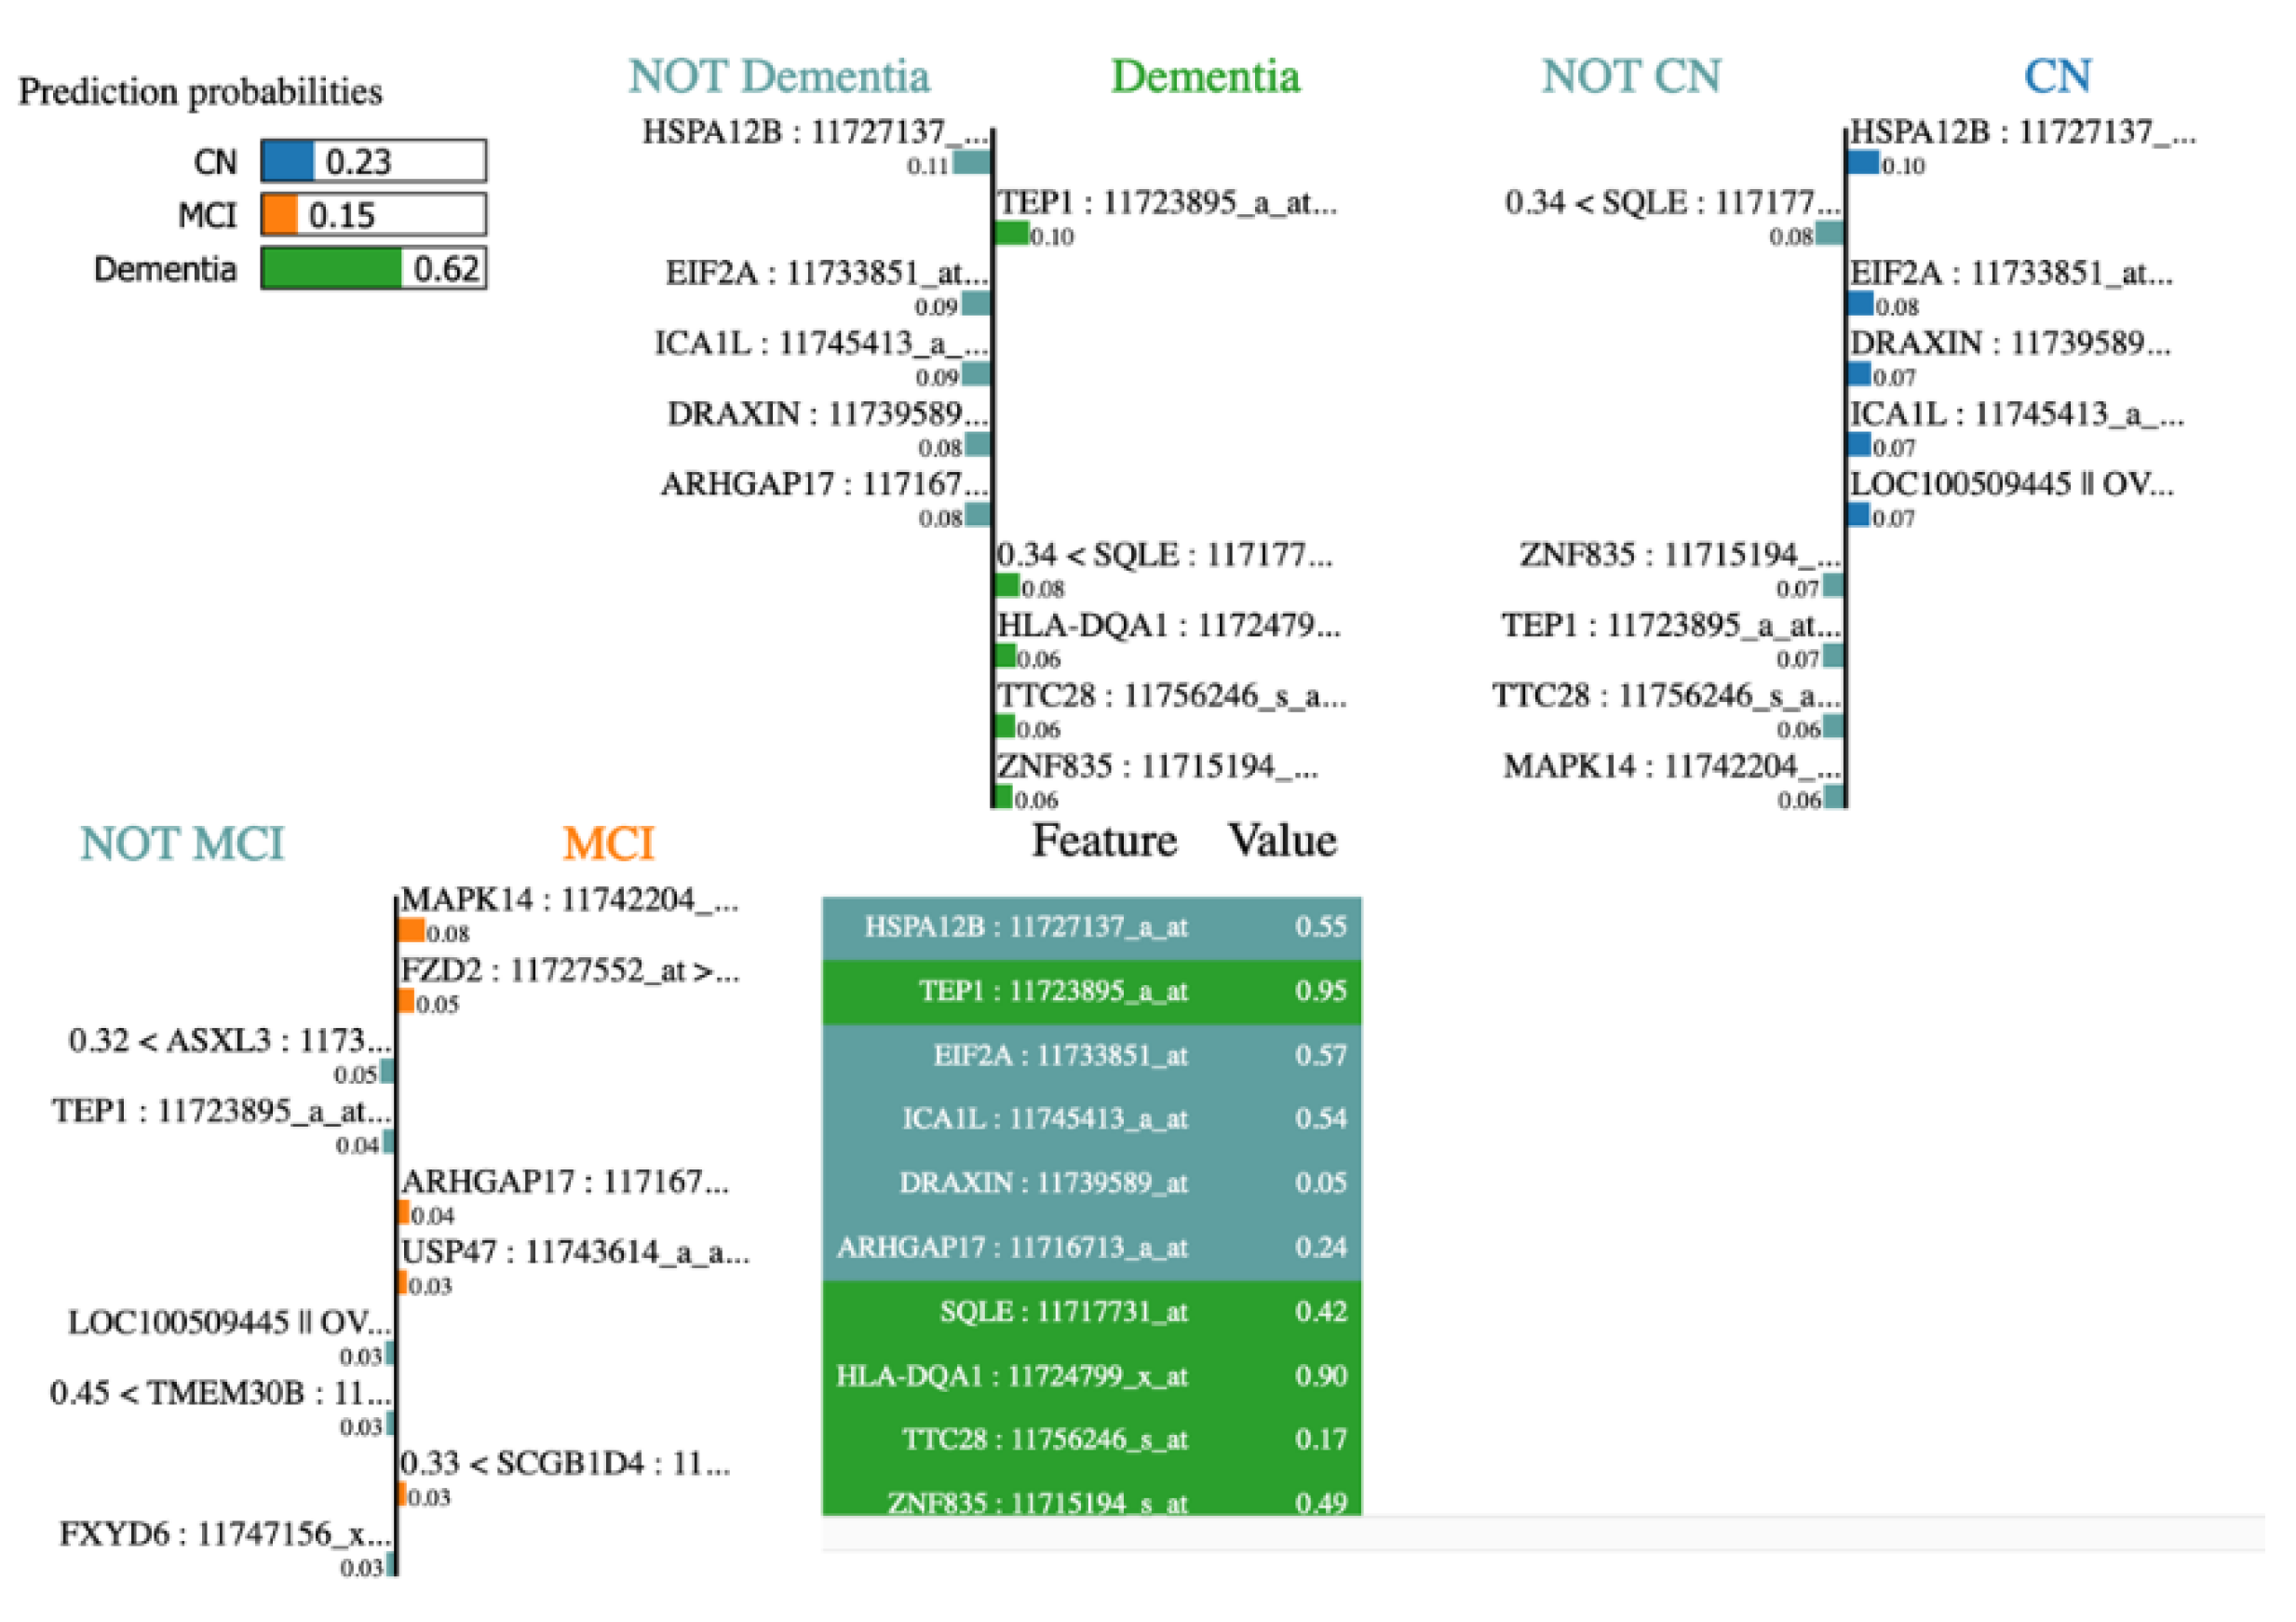
Table 3.
Selected eight ADNI clinical study biomarkers.
| Feature name | Feature description |
|---|---|
| APOE4 | Number of ɛ4 allele |
| PTMARRY | Marital status. |
| FDG | Cell metabolism measurement, reduced for AD patients. |
| Hippocampus | Hippocampus measurement. |
| WholeBrain | Whole Brain measurement. |
| mPACCdigit | Modified Preclinical Alzheimer Cognitive Composite with Digit. |
| LDELTOTAL | The logical memory delayed recall total. |
| CDRSB | Clinical Dementia Rating Scale - Sum of Boxes. |
Table 4.
AD risk and AD repellent gene transcripts.
| Transcript of gene | Feature score | Corr. score | Gene nature |
|---|---|---|---|
| MAPK14 | 68.0 | 0.186508 | AD risk |
| CCPG1 | 50.0 | 0.146056 | AD risk |
| OVOS2 | 109.0 | 0.098956 | AD risk |
| ASXL3 | 92.0 | 0.108009 | AD risk |
| USP47 | 79.0 | -0.159388 | AD suppressor |
| ATP9A | 100.0 | -0.122405 | AD suppressor |
| ATP9A | 100.0 | -0.122405 | AD suppressor |
| SCGB1D4 | 122.0 | -0.065516 | AD suppressor |
| CDCP1 | 76.0 | -0.086064 | AD suppressor |
| KISS1R | 74.0 | -0.088843 | AD suppressor |
Table 5.
Hyperparameters for deep model for clinical data analysis.
| Hyper tuning parameter | Parameter value |
|---|---|
| Optimizer | Adam optimizer |
| Cost or loss function | categorical cross_entropy |
| Learning rate | 0.001 |
| Batch size | 5 |
| Epochs | 4000 |
| No of layers | 2 |
| Activation function – layer 1 | RELU |
| Activation function – layer 2 | Softmax |
| Dropout rate | 0.20 |
Table 6.
Results of DL model from gene expression data.
| Disease stage wise ROC AUC | micro average F1 score | weighted average F1 score | ||
|---|---|---|---|---|
| CN | MCI | Dementia | ||
| 0.75 | 0.74 | 0.70 | 0.67 | 0.67 |
| 0.74 | 0.73 | 0.63 | 0.65 | 0.64 |
| 0.74 | 0.71 | 0.62 | 0.64 | 0.63 |
| 0.70 | 0.67 | 0.68 | 0.64 | 0.63 |
| 0.67 | 0.71 | 0.67 | 0.64 | 0.62 |
Table 7.
Results of DL model from clinical study data.
| Disease stage wise ROC AUC | micro average F1 score | weighted average F1 score | ||
|---|---|---|---|---|
| CN | MCI | Dementia | ||
| 0.97 | 0.94 | 0.94 | 0.94 | 0.94 |
| 0.98 | 0.94 | 0.92 | 0.95 | 0.94 |
| 0.97 | 0.95 | 0.92 | 0.95 | 0.95 |
| 0.98 | 0.94 | 0.93 | 0.94 | 0.94 |
| 0.97 | 0.93 | 0.90 | 0.93 | 0.93 |
Disclaimer/Publisher’s Note: The statements, opinions and data contained in all publications are solely those of the individual author(s) and contributor(s) and not of MDPI and/or the editor(s). MDPI and/or the editor(s) disclaim responsibility for any injury to people or property resulting from any ideas, methods, instructions or products referred to in the content. |
© 2024 by the authors. Licensee MDPI, Basel, Switzerland. This article is an open access article distributed under the terms and conditions of the Creative Commons Attribution (CC BY) license (http://creativecommons.org/licenses/by/4.0/).
Copyright: This open access article is published under a Creative Commons CC BY 4.0 license, which permit the free download, distribution, and reuse, provided that the author and preprint are cited in any reuse.


