
Submitted:
16 May 2025
Posted:
19 May 2025
You are already at the latest version
Abstract
This article presents a method for detecting temperatures distribution of two Silicon Carbide (SiC) MOSFETs parallelized. Two Thermally Sensitive Electrical Parameters (TSEP), namely the on-state resistance (Rdson) and the threshold voltage (Vth), are introduced. Comparison of temperatures interpolated by Vth and Rdson shows disparity which can lead to individual junction temperature detection. Vth instability and its measurement are discussed for SiC devices. Experimental results show that depending on the instability of the Vth and the sensitivity of the two TSEPs at certain temperatures, the combination of different TSEPs could be a solution to extract maximum junction temperature of parallelized devices.
Keywords:
SiC MOSFET
; parallelization
; thermal imbalance
; threshold voltage
; On resistance
1. Introduction
In power electronics, SiC MOSFETs can advantageously replace Si ones, thanks to various intrinsic characteristics, such as higher temperature applications, higher frequency switching and higher voltage operation [2,3]. A major drawback of this material is the difficulty in manufacturing wafers with limited imperfections, which leads to the need of manufacturing smaller dies compared to Si ones to get the same die per wafer yield [2]. Hence, parallelizing (same gate, drain and source connections) dies is mandatory for high current applications. This comes with other problems such as risk of current and thermal imbalance, which both can lead to dysfunction. During the design phase, as newer power modules start to use double sided architectures [4], the thermal measurements of dies become very complex with traditional methods (IR camera, thermocouple). Thus, the use of TSEP becomes mandatory. Despite their importance, no current method allows detecting thermal imbalance in parallelized dies using TSEPs [5]. Actually, only a global temperature is extracted from TSEPs.
Another drawback of using SiC MOSFETs is their Vth shift which is a subject of discussion between industrials and researchers (see Figure 1). Nevertheless, Vth is a key parameter because its instability plays a part in current imbalance during operation, and because it is an interesting TSEP. To mitigate the impact of Vth shift after stresses, conditioning methods have been developed [6] such as JEDEC guidelines [7] explaining circuits allowing precise measurement of Vth. The conditioning is usually achieved by applying a positive or negative voltage at the gate of the MOSFET while short-circuiting its drain and source, to remove carrier trapping. Measurement is then performed by short-circuiting gate and drain and by forcing a small current (see Figure 2) through it. The resulting voltage is the Vth, which is known to be sensitive to the temperature variation of the die. In this work, the comparison of the temperature extrapolated by Vth and Rdson is investigated to determine imbalances in SiC MOSFETs junction temperature.
The SiC MOSFETs studied during tests and simulations are SCT070W120G3-4AG from STMicroelectronics.
2. Methodology
2.1. Simulations
Rdson and Vth have been studied to determine which temperature they provide when there is a temperature imbalance between two MOSFETs. The simulations have been conducted with LTSpice software and the manufacturer models have been used for MOSFET. In each study, the procedure is as follows: an electrical circuit is set up, allowing the measurement of a certain TSEP. Figure 3 shows the setups for Rdson and Vth measurements. In each case, the junction temperature of the two MOSFETs, which is the same, is the variable of the simulation. Hence, by simulating the measurement of Vth and Rdson when the junction temperature varies, it is possible to obtain a relation between those parameters presented in Figure 4.
Once these two equations have been determined, the simulations are repeated, this time incorporating temperature imbalances between the two MOSFETs (see Figure 5). The mean temperature of the two MOSFETs is kept constant at 100 ° C, with a step of of 5 ° C until it reaches 30 ° C.
At each point of thermal imbalance, Vth and Rdson are measured. With measurement and equations, it is possible to interpolate a temperature via Rdson and Vth, named and . Figure 6(a) shows the interpolated temperatures via the two TSEPs for different temperature imbalances between the two MOSFETs. It appears that seems to be always very near the average temperature of the two MOSFETs, when the seems to be an hybrid between the maximum temperature and the mean temperatue (but still closer to the mean one). Then, the difference between the temperature extrapolated by Vth and Rdson (named ) is plotted as a function of the thermal imbalance of the two MOSFETs in Figure 6(b). It appears that they are linked by a quadratic law.
With thoses simulations it appears that it could be possible to determine individual temperature of two MOSFETs totally parallelized, when no individual informations are obtainable, only via measurement of those two TSEPs : the Rdson would allow the determination of the mean temperature of the devices, and the difference between and would determine the imbalance.
2.2. Test Bench
The objective of the bench is to perform quick measurements of Rdson and Vth with conditioning before the Vth measurement to detect thermal imbalance. The time between Vth measurement and Rdson one must be as short as possible to be sure to measure the same temperature. The test bench can be separated in two parts: the fluidic and electric one. Tests have been conducted on the DepTH-LAB platform [8] at Icam Toulouse.
2.2.1. Fluidic Part
The fluidic part can be seen in Figure 7(a). The exposed pad of the MOSFET is in contact with heat sinks via TIMs. Fluids flow through heat sinks to extract thermal power dissipation and impose the casing temperatures. As each heat sink is connected to a different cryostat, each casing temperature can be monitored separately. Flowrates, inlet and outlet temperatures are controlled. In addition, two thermocouples (T-types) are placed under each MOSFET to measure the temperature as close as possible to the Tcase. The two cryostats used are RP205E from LAUDA (with P20.275.50 oil) and Unistat 510 from HUBER (with M20.195/235.20 oil). Oils used allow the liquid temperature (and so casing temperature of MOSFETs) to reach 200°C maximum, for high temperature tests.
2.2.2. Electrical Part
As it can be seen in Figure 7(b), the electric part of the bench can be separated into three subparts: current sources and switches (green), 4 states driver (red) and configuration changes + measurements (conditioning and Rdson to Vth configuration) (blue).
Each test can be split into the following steps shown in Figure 8
During the Rdson step, a voltage Vgsmax is applied to the gate (15V). A constant current Id is injected into the drain (typically 10A per MOSFET). The voltage is measured across the drain and the kelvin source to obtain Vdsk, and Rdson is calculated from the voltage and current. Switch S1 is then opened to cut the current Ip.
During the Conditioning step, successive voltages are applied to the gate in order to precondition the MOSFETs and ensure that the Vth measurements are repeatable. In this study, a voltage of 15 V is applied for 1 second during this phase.
During the Vth step step, the gate and drain are short-circuited by closing S3. A small current Ivth is injected into the drain-gate by closing S2. The current flows through the gate first, until the charging of the capacitor Cgs closes the channel. When it does, the current flows through the drain and the voltage stabilises. We can then measure the Vgs or Vds (they are short-circuited) to obtain the Vth.
Commands for all switches are managed by an Arduino Uno microcontroller with direct manipulation of ports to achieve a minimum instruction execution time (time between two switch operations) of 50 ns.
Measurement acquisition is done with a MSO58N of TEKTRONIX. The voltage probe for Vds is a TEKTRONIX TPP0500B and the power current is measured with a TEKTRONIX TCP0030A current probe. The current Ivth is generated by a SMU (Keithley 2612) and the current Ip by an EA-PS 2042-20B.
3. Results
3.1. Ivth Choice
First, all ten SiC MOSFETs had their Vth and Rdson measured individually (see Figure 9). It was here arbitrary decided to use 10mA for the Vth current in order to compare Vth between MOSFETs. Since MOSFETS 9 and 10 were the ones with the best matching Vth (3.524V and 3.526V), they were the two MOSFETs chosen to be parallelized.
It must be noted that it seems to be a correlation between Vth and Rdson, with a high variability.
An important parameter of this setup is the choice of the current used to measure the threshold voltage. As it is defined as the minimum voltage to apply on the gate and drain to get a certain current in the drain, its value can change depending on the current selected. JEDEC guidelines do not indicate values to use, hence every MOSFET manufacturer uses a different value: 1 mA for STMicroelectronics, 6.4 for Rohm, 3.3 for INFINEON. As no information on why this current is used is given neither by the manufacturers nor by JEDEC, a study of the optimal Ivth is proposed. A much wider range of currents will be covered than is usual in industry, from 1 µA to 1 ampere, to get a proper idea of the ideal value. Each measurement is subjected to a conditioning voltage of 15V for one second. Each time, it’s the Vth of two parallelized MOSFETs at the same temperature that is measured. As the method used to get the Vth relies on the loading of the capacity Cgs under a constant current to get the canal of the MOSFET closed, there is a loading time before the Vth is obtained (see Figure 10(a)). It appears that the higher the current is, the faster the measure will be (see Figure 10(b)). Vth is considered obtained, when Vgs reachs its maximum value.
Having the shortest possible capacitance charging time is extremely important in tests: as Vth is measured without power injection, the measurement must be taken immediately after an injection. If the loading time is too long, the cooling of the chip during will not be negligible, making the measurement and its comparison with Rdson irrelevant.
Nonetheless, charging time of the Vth is not the only parameter to consider. Curves of Figure 10(a) are obtained for three junctions temperatures : 105, 130 and 155 °C. Considering the Vth is linear with the temperature, a sensitivity is extracted from each curve of Figure 11(a) and then plotted on Figure 11(b). It seems that the Vth is more sensible to temperature variations when the current is higher than 1 mA. Under this value, the sensitivity stays constant around -4.75 mV/°C.
Another important parameter that must be noted when choosing the Ivth is the temperature measured when an imbalance is present. As shown in the Figure 12, the current should be the lowest to get a good sensitivity on the imbalance of temperature between the two MOSFETs.
This last parameter (sensitivity to thermal imbalance) is in direct opposition of the first two (sensitivity to temperature and time to charge Cgs). Hence, a compromise must be found between measurement accuracy of the temperature imbalance and measurement speed. For this study, the current selected is 10 mA per MOSFET. With two MOSFETs parallelized, the gate charge time should be of only 32µs with a sensitivity of 5.5mV/°C.
3.2. Imbalance Measurement
The first objective was to demonstrate the feasibility of temperature imbalance detection. It was decided to perform long gate saturation to suppress traps and Vth instability before each measurement (1 second).
Figure 13 describes the scenario used to measure Rdson and Vth successively, after a one second conditioning (+15V on the gate, 0V Vds). In this tests, the of each MOSFET is considered equal to the temperature of its casing, as there is no noticeable self-heating during the scenario.
The two MOSFETs were each heated to 100°C. A test was performed and then the temperature of one MOSFET was increased to create a thermal imbalance. Measurements are performed and then thermal imbalance is increased again. Those tests are shown on Figure 14 for SCT070W120G3-4AG. It can be clearly seen that there is a correlation between temperature imbalance between the two MOSFETs and the square root of the temperature difference interpolated with Rdson and Vth. Simulations and tests show exactly the same sensitivity.
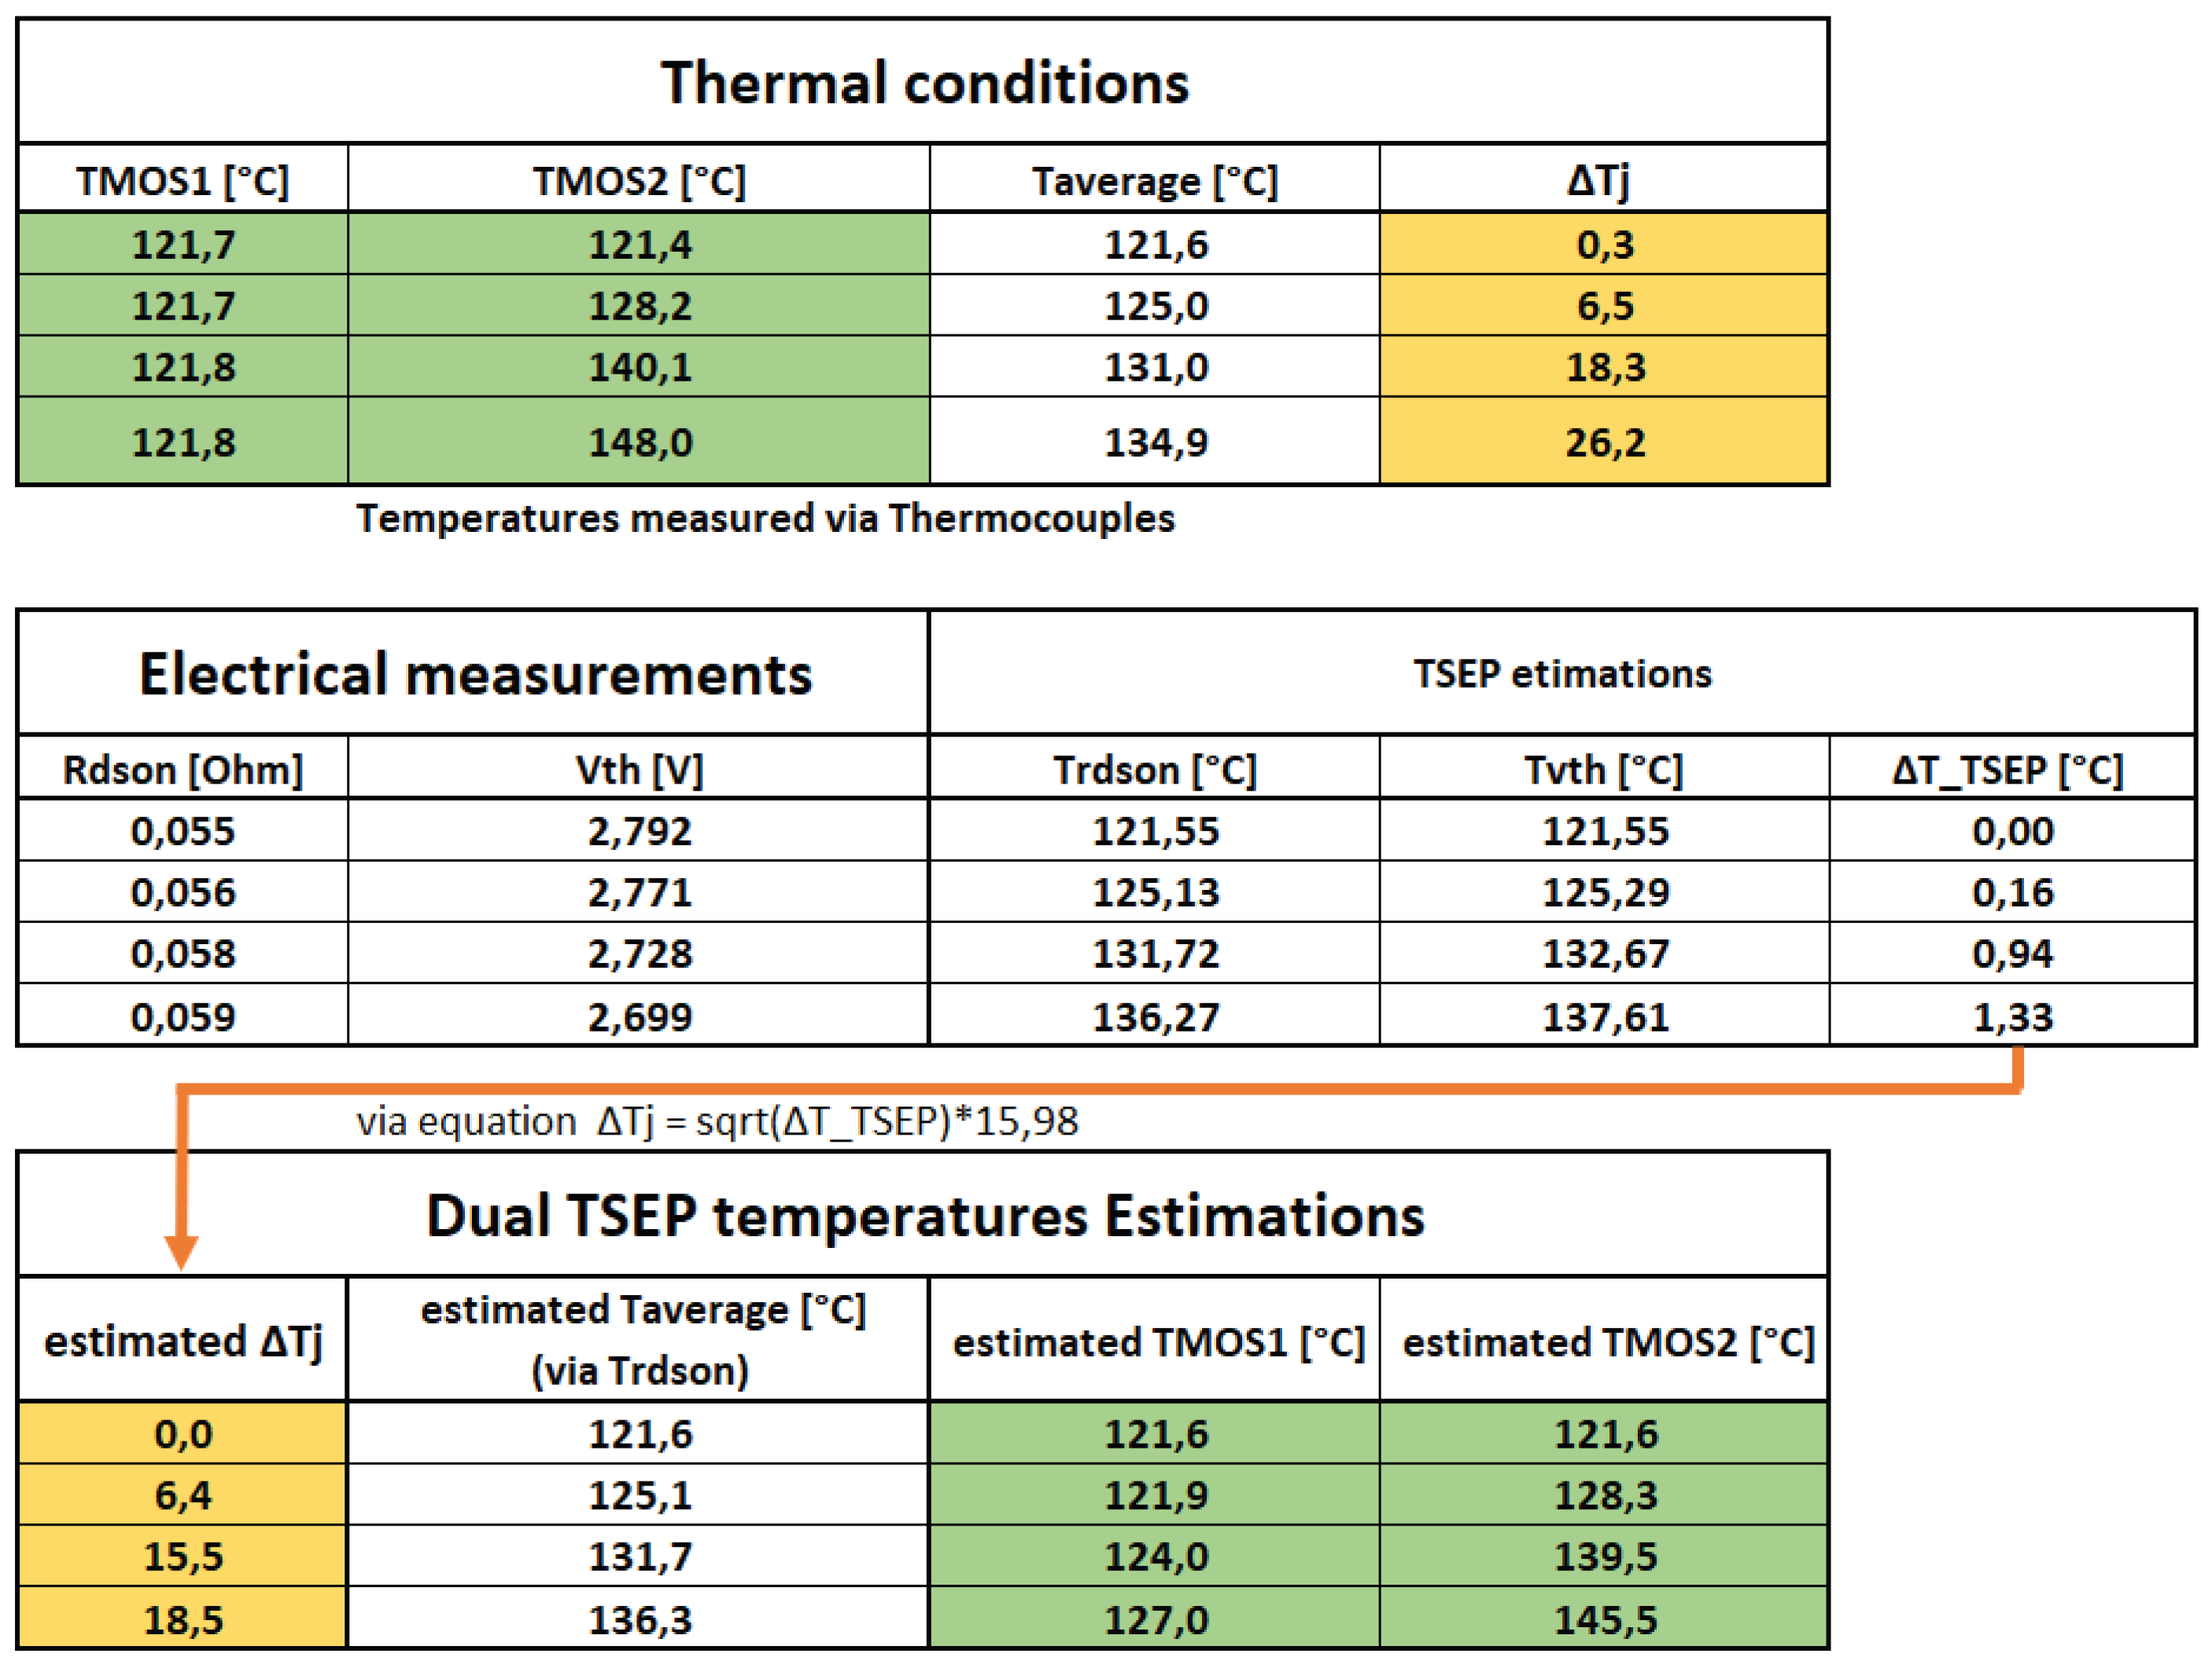
With this correlation, new tests were performed (Figure 15). This time, T1, T2, Vth and Rdson were measured. Vth and Rdson permitted a TRdson and TVth estimation, and the difference between these two values, using the equation given by Figure 14, makes it possible to get an idea of the imbalance of temperature between the two MOSFETs. As the temperature interpolated by Rdson is near the average temperature of the two MOSFETs, it was then possible to get an evaluation of the individual temperature of the two MOSFETs, even if totally parallelized.
4. Discussion
First of all, the choice of the Vth measurement current, when the drain-gate short circuit and current injection method is used, deserves particular attention. In a conventional application, when a single MOSFET is studied, or when unbalance is not an issue, the choice of Vth should be based on high current values. However, care must be taken to ensure that the power dissipation of the measurement remains negligible or is taken into account. If Tj max detection is desired, a compromise will have to be found. 10mA seems to be an ideal value, allowing tests to be carried out in a short time while measuring a hybrid temperature between and .
Simulations and tests show very good similarities. in Figure 14, even if tests are noisy the two interpolated curves only have a 1.6% difference.
SiC results presented are the very first of an ongoing test campaign and should be regarded as a work in progress. Currently, only offline measurements have been conducted, without accounting for self-heating. Need of optimized conditioning before measurement has not been studied.
Nonetheless, those first results are promising: as seen in Figure 15, it is possible to detect temperature imbalance in simple cases. It must be noted that even if the imbalance is underestimated, it is much more precise than a single measurement of Rdson or Vth. New tests must be carried out at different casing temperatures to determine whether the results are reproducible or not. More importantly, tests with junction temperature increased by self-heating will be achieved as it is the goal of any TSEP.
Moreover, it should be noted that as the Vth is unstable, even with proper conditioning, only important imbalance of temperature will be estimated, as smaller ones could be caused by natural fluctuation of Vth. Finally, this entire study was carried out using precisely matched MOSFETs which have exactly the same Vth at the same temperature. It is likely that MOSFETs with different electrical characteristics would not allow this method to be used. As a preliminary analysis, it is reasonable to assume that temperature imbalances in excess of at least 15°C will be observable using this method.
5. Conclusion
A non-intrusive test has been developed to acquire the individual temperature of SiC MOSFETs in the case of total parallelization, using the Vth and Rdson TSEPs. Simulations conducted with LTSpice manufacturer models show good correlation with test results. First results on two SiC MOSFETs of STMicroelectronics are promising, and new tests are planned, this time with self-heating of the dies.
Author Contributions
Conceptualization, Louis ALAUZET; Investigation, Louis ALAUZET; Methodology, Louis ALAUZET; Software, Louis ALAUZET; Supervision, Jean-Pierre FRADIN; Writing – original draft, Louis ALAUZET; Writing – review and editing, Patrick TOUNSI and Jean-Pierre FRADIN.
Abbreviations
The following abbreviations are used in this manuscript:
| SiC | Silicon Carbide |
| TSEP | Thermal Sensitive Electrical Parameter |
| Vth | Thresold Voltage |
| Rdson | On state resistance |
| Junction temperature | |
| Temperature estimated via Vth measurement | |
| Temperature estimated via Rdson measurement | |
| - |
References
- Louis, A.; Patrick, T.; Jean-Pierre, F. Sensorless Dual TSEP Implementation for Junction Temperature Measurement in Parallelized SiC Mosfets. In Proceedings of the 2024 30th International Workshop on Thermal Investigations of ICs and Systems (THERMINIC); 2024; pp. 1–4. [Google Scholar] [CrossRef]
- Buffolo, M.; Favero, D.; Marcuzzi, A.; De Santi, C.; Meneghesso, G.; Zanoni, E.; Meneghini, M. Review and Outlook on GaN and SiC Power Devices: Industrial State-of-the-Art, Applications, and Perspectives. IEEE Transactions on Electron Devices 2024, 71, 1344–1355. [Google Scholar] [CrossRef]
- She, X.; Huang, A.Q.; Lucía, Ó.; Ozpineci, B. Review of Silicon Carbide Power Devices and Their Applications. IEEE Transactions on Industrial Electronics 2017, 64, 8193–8205. [Google Scholar] [CrossRef]
- Liu, M.; Coppola, A.; Alvi, M.; Anwar, M. Comprehensive Review and State of Development of Double-Sided Cooled Package Technology for Automotive Power Modules. IEEE Open Journal of Power Electronics 2022, 3, 271–289. [Google Scholar] [CrossRef]
- Li, H.; Zhao, S.; Wang, X.; Ding, L.; Mantooth, H.A. Parallel Connection of Silicon Carbide MOSFETs—Challenges, Mechanism, and Solutions. IEEE Transactions on Power Electronics 2023, 38, 9731–9749. [Google Scholar] [CrossRef]
- Peters, D.; Aichinger, T.; Basler, T.; Rescher, G.; Puschkarsky, K.; Reisinger, H. Investigation of threshold voltage stability of SiC MOSFETs. In Proceedings of the 2018 IEEE 30th International Symposium on Power Semiconductor Devices and ICs (ISPSD); 2018; pp. 40–43. [Google Scholar] [CrossRef]
- JEDEC. JEP183A: Guidelines for Measuring the Threshold Voltage (VT) of SiC MOSFETs. 2023.
- Icam, s.d.T. DEPth-lab platform presentation : https://en.icam.fr/research/depth-lab/, 2022.
Figure 1.
Vth shift after stress applied to gate [7].
Figure 1.
Vth shift after stress applied to gate [7].
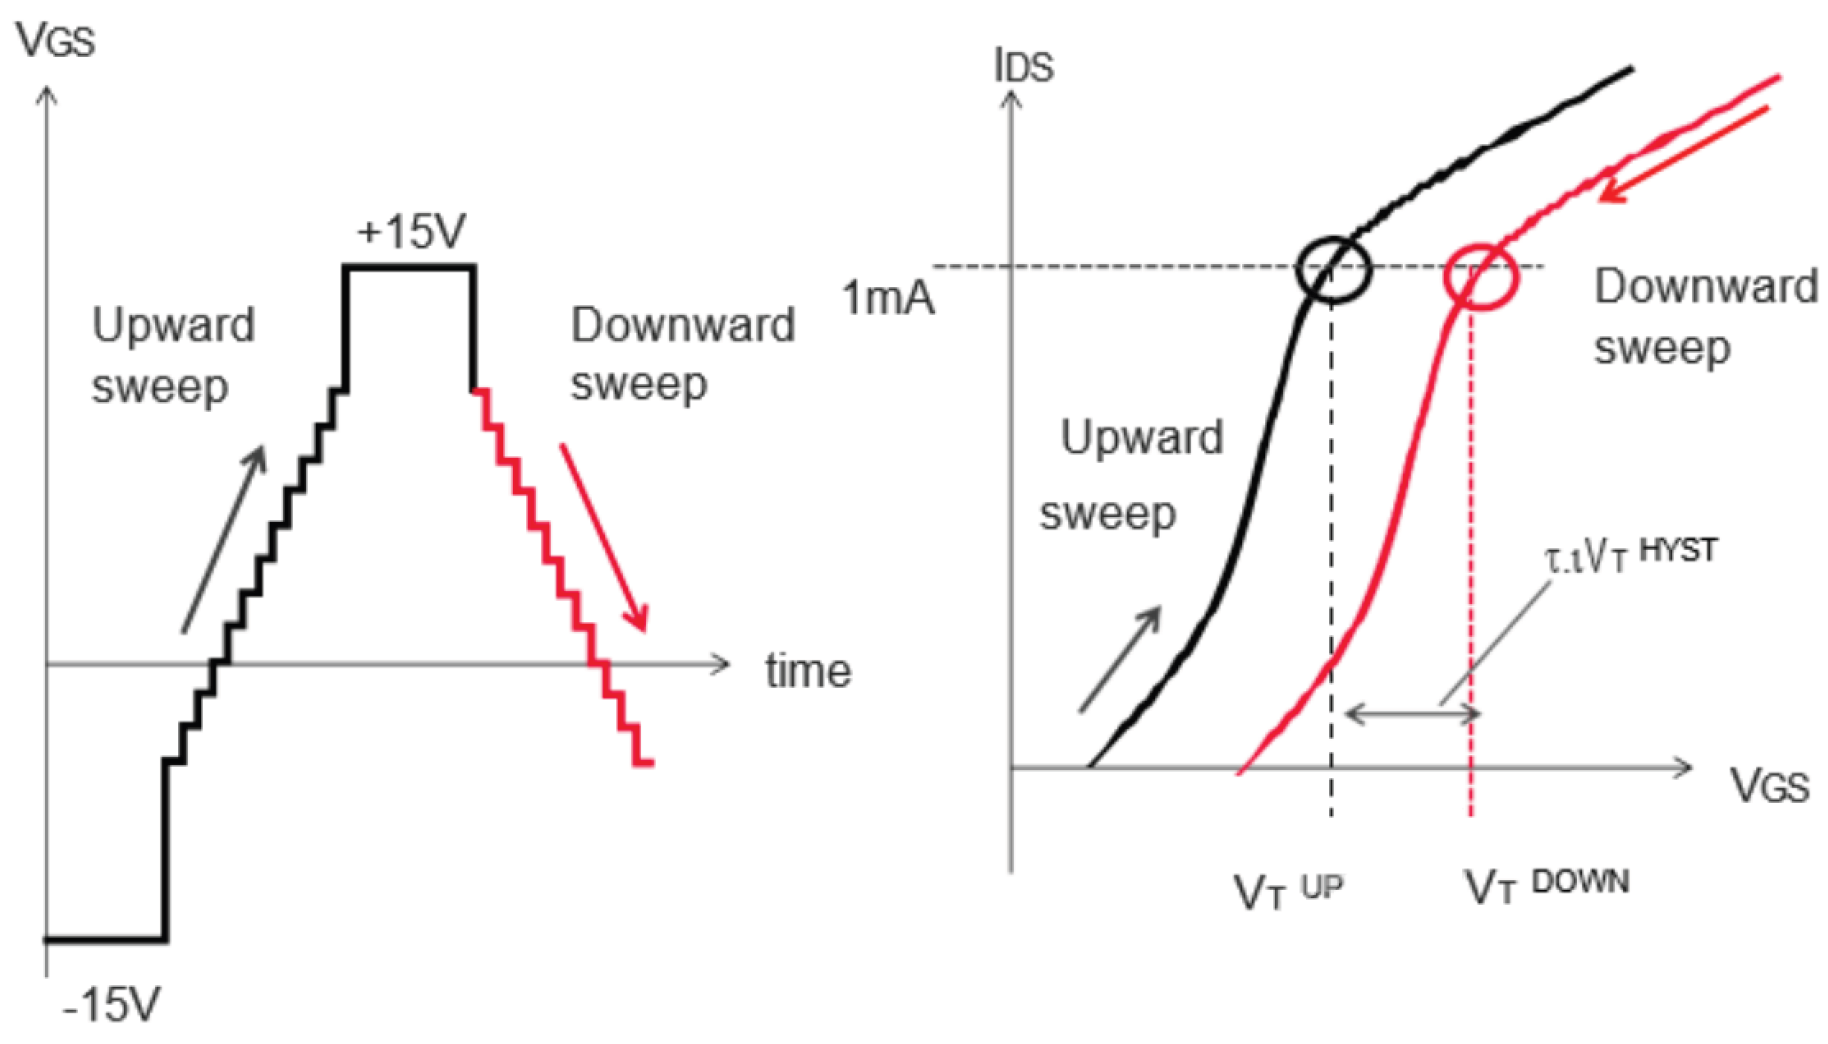
Figure 2.
JEDEC conditioning and Vth measurement method [7].
Figure 2.
JEDEC conditioning and Vth measurement method [7].
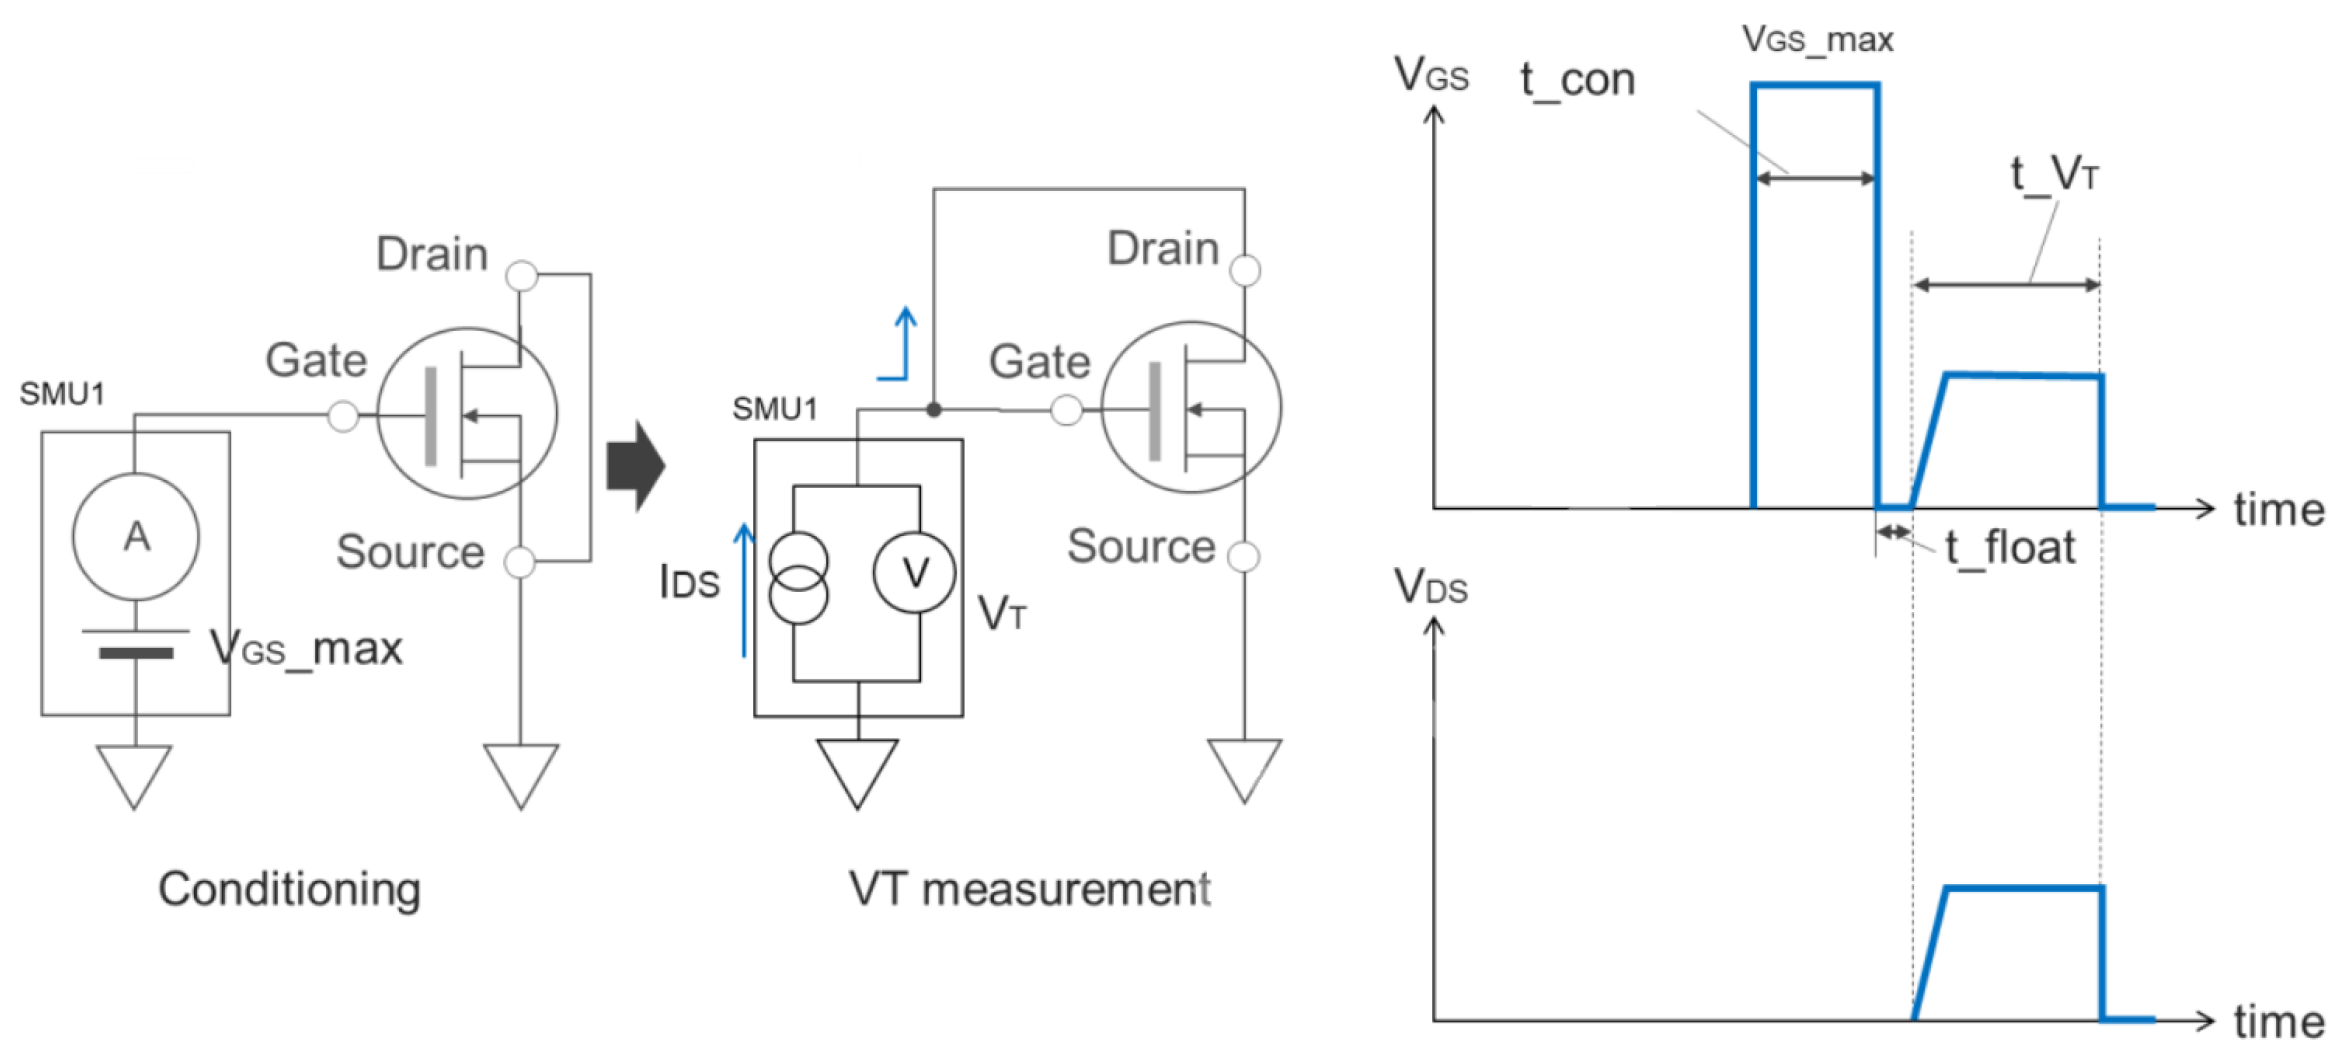
Figure 3.
LTSpice simulations used to extract Rdson = f(T) (a) and Vth=f(T) (b).
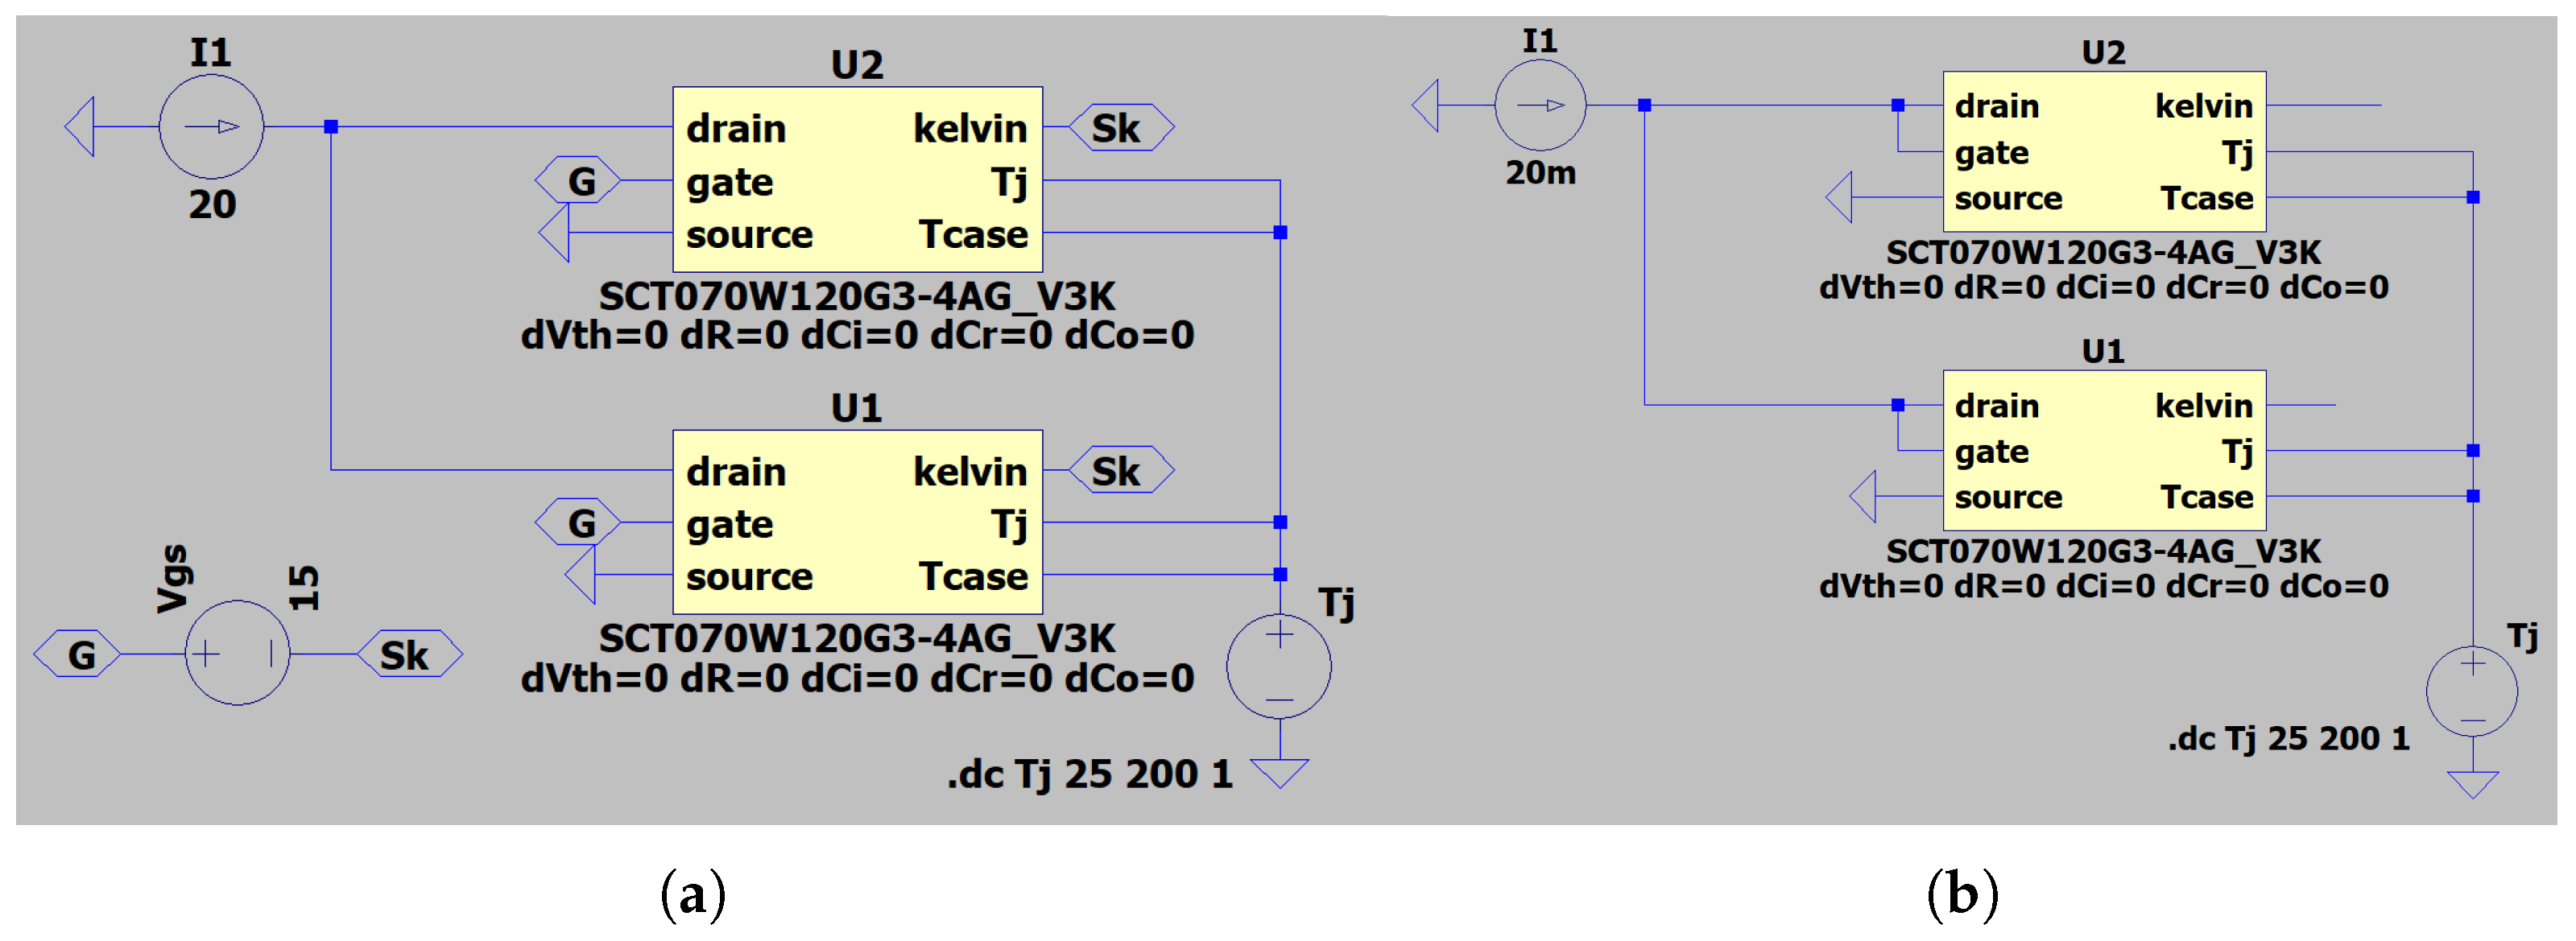
Figure 4.
Simulated correspondence between Rdson and TJ (a), Vth and Tj (b)resulting from Figure 3.
Figure 4.
Simulated correspondence between Rdson and TJ (a), Vth and Tj (b)resulting from Figure 3.
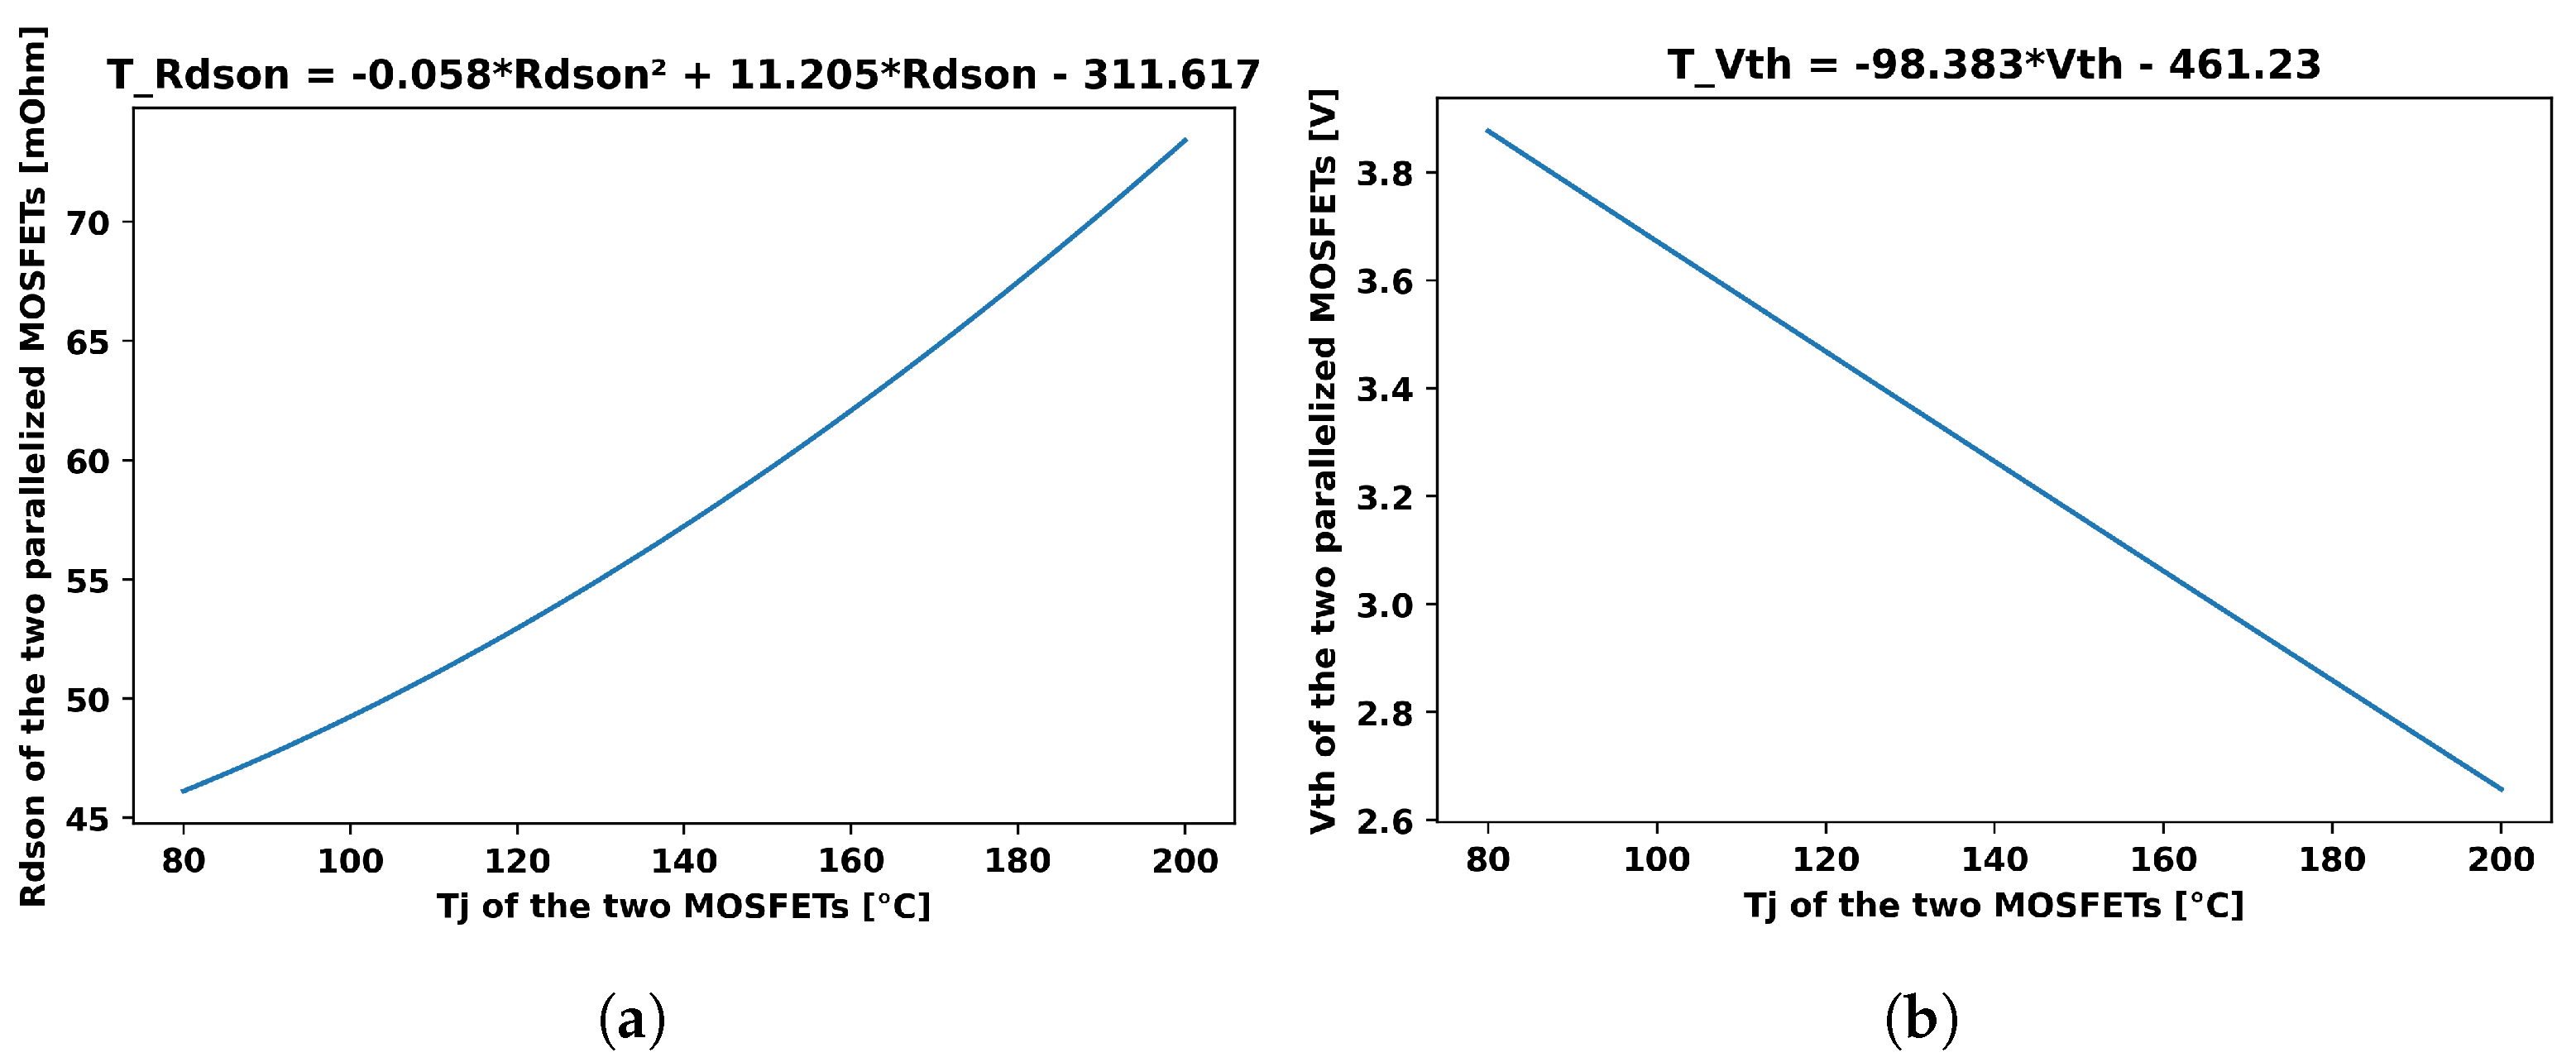
Figure 5.
LTSpice simulations used to get Rdson (a) and Vth (b) when a thermal imbalance occurrs (here = 30°C).
Figure 5.
LTSpice simulations used to get Rdson (a) and Vth (b) when a thermal imbalance occurrs (here = 30°C).
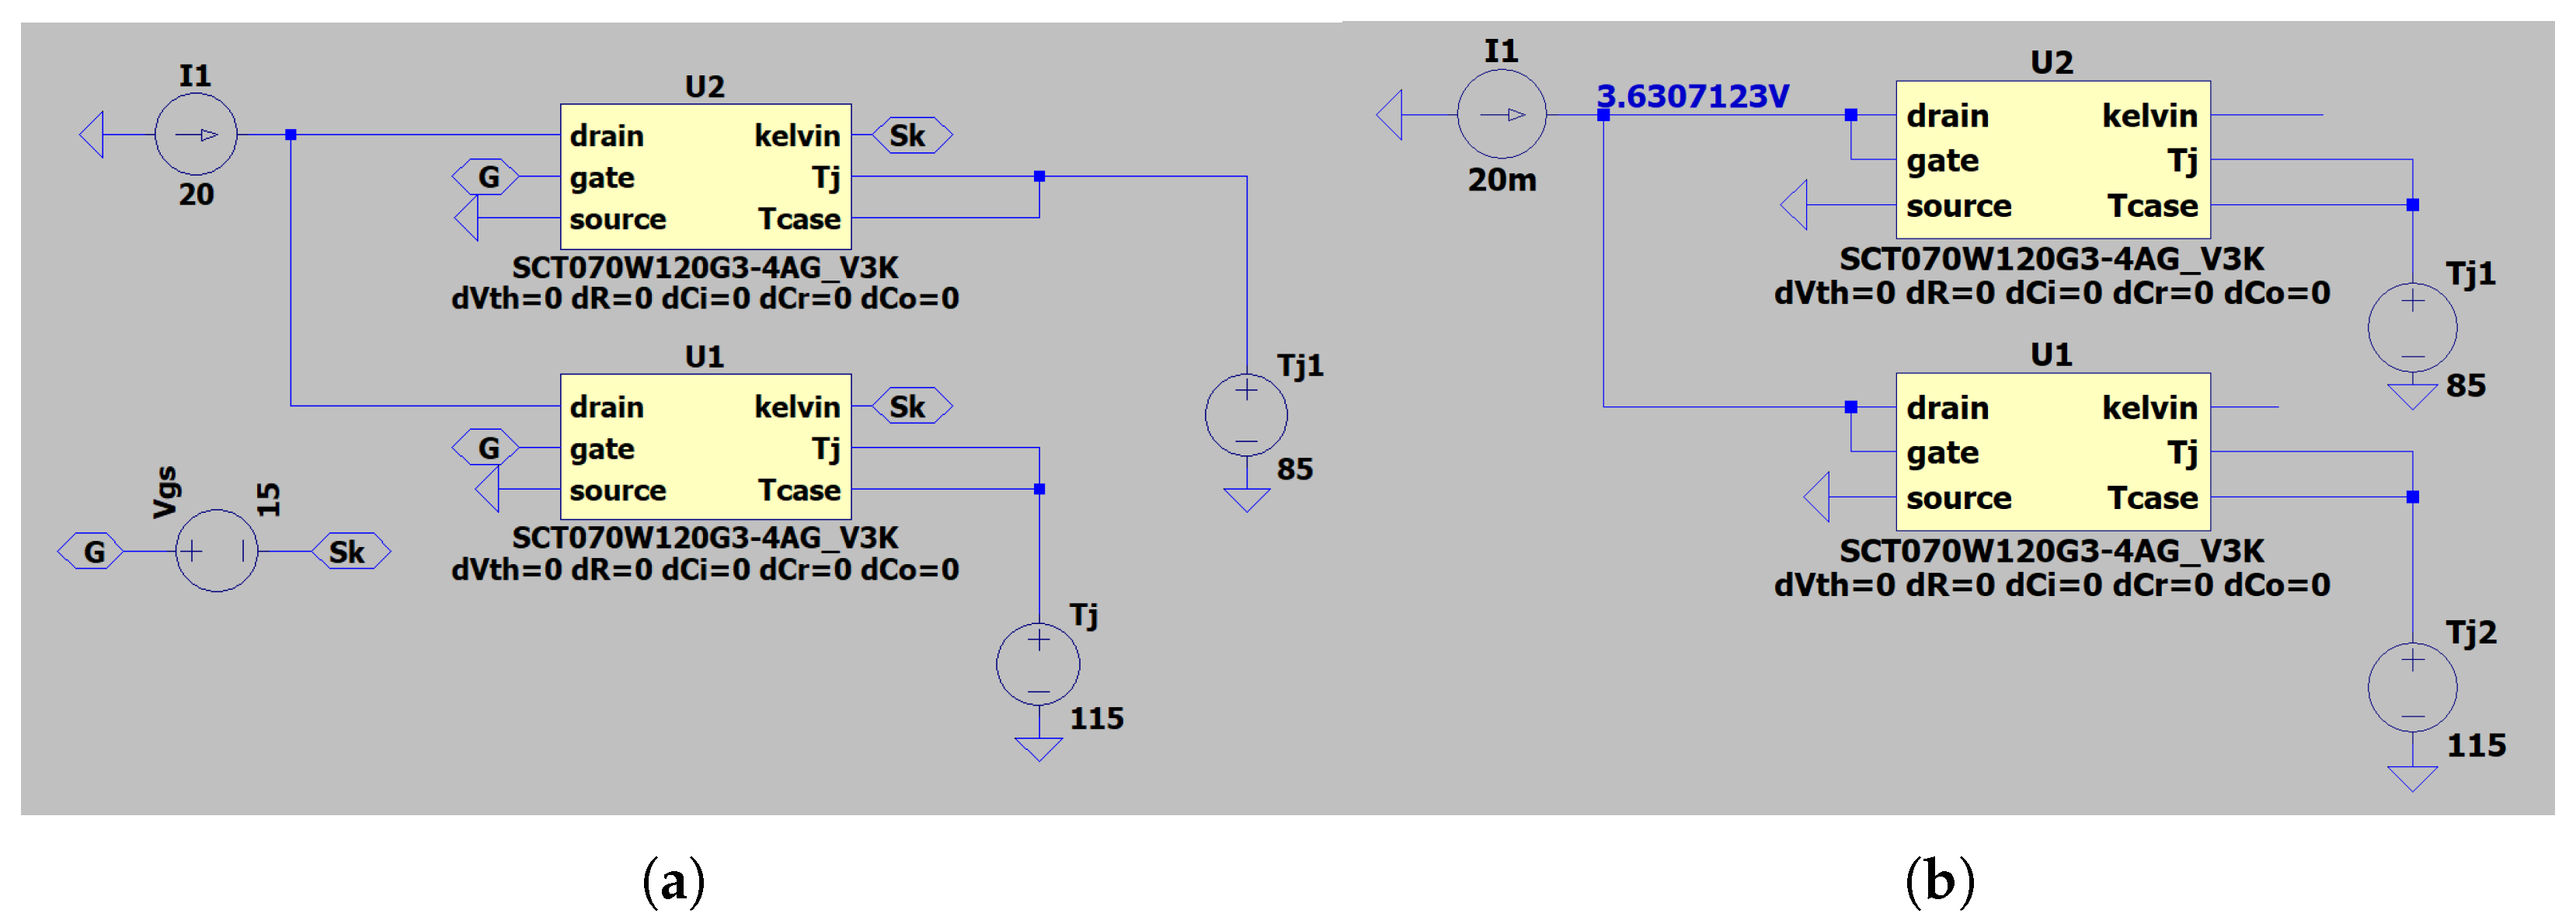
Figure 6.
Temperature interpolated by simulated TSEP (via equations of Figure 4) for different thermal imbalances (a) and difference between temperatures interpolated by Vth and Rdson as a function of the thermal imbalance (b).
Figure 6.
Temperature interpolated by simulated TSEP (via equations of Figure 4) for different thermal imbalances (a) and difference between temperatures interpolated by Vth and Rdson as a function of the thermal imbalance (b).
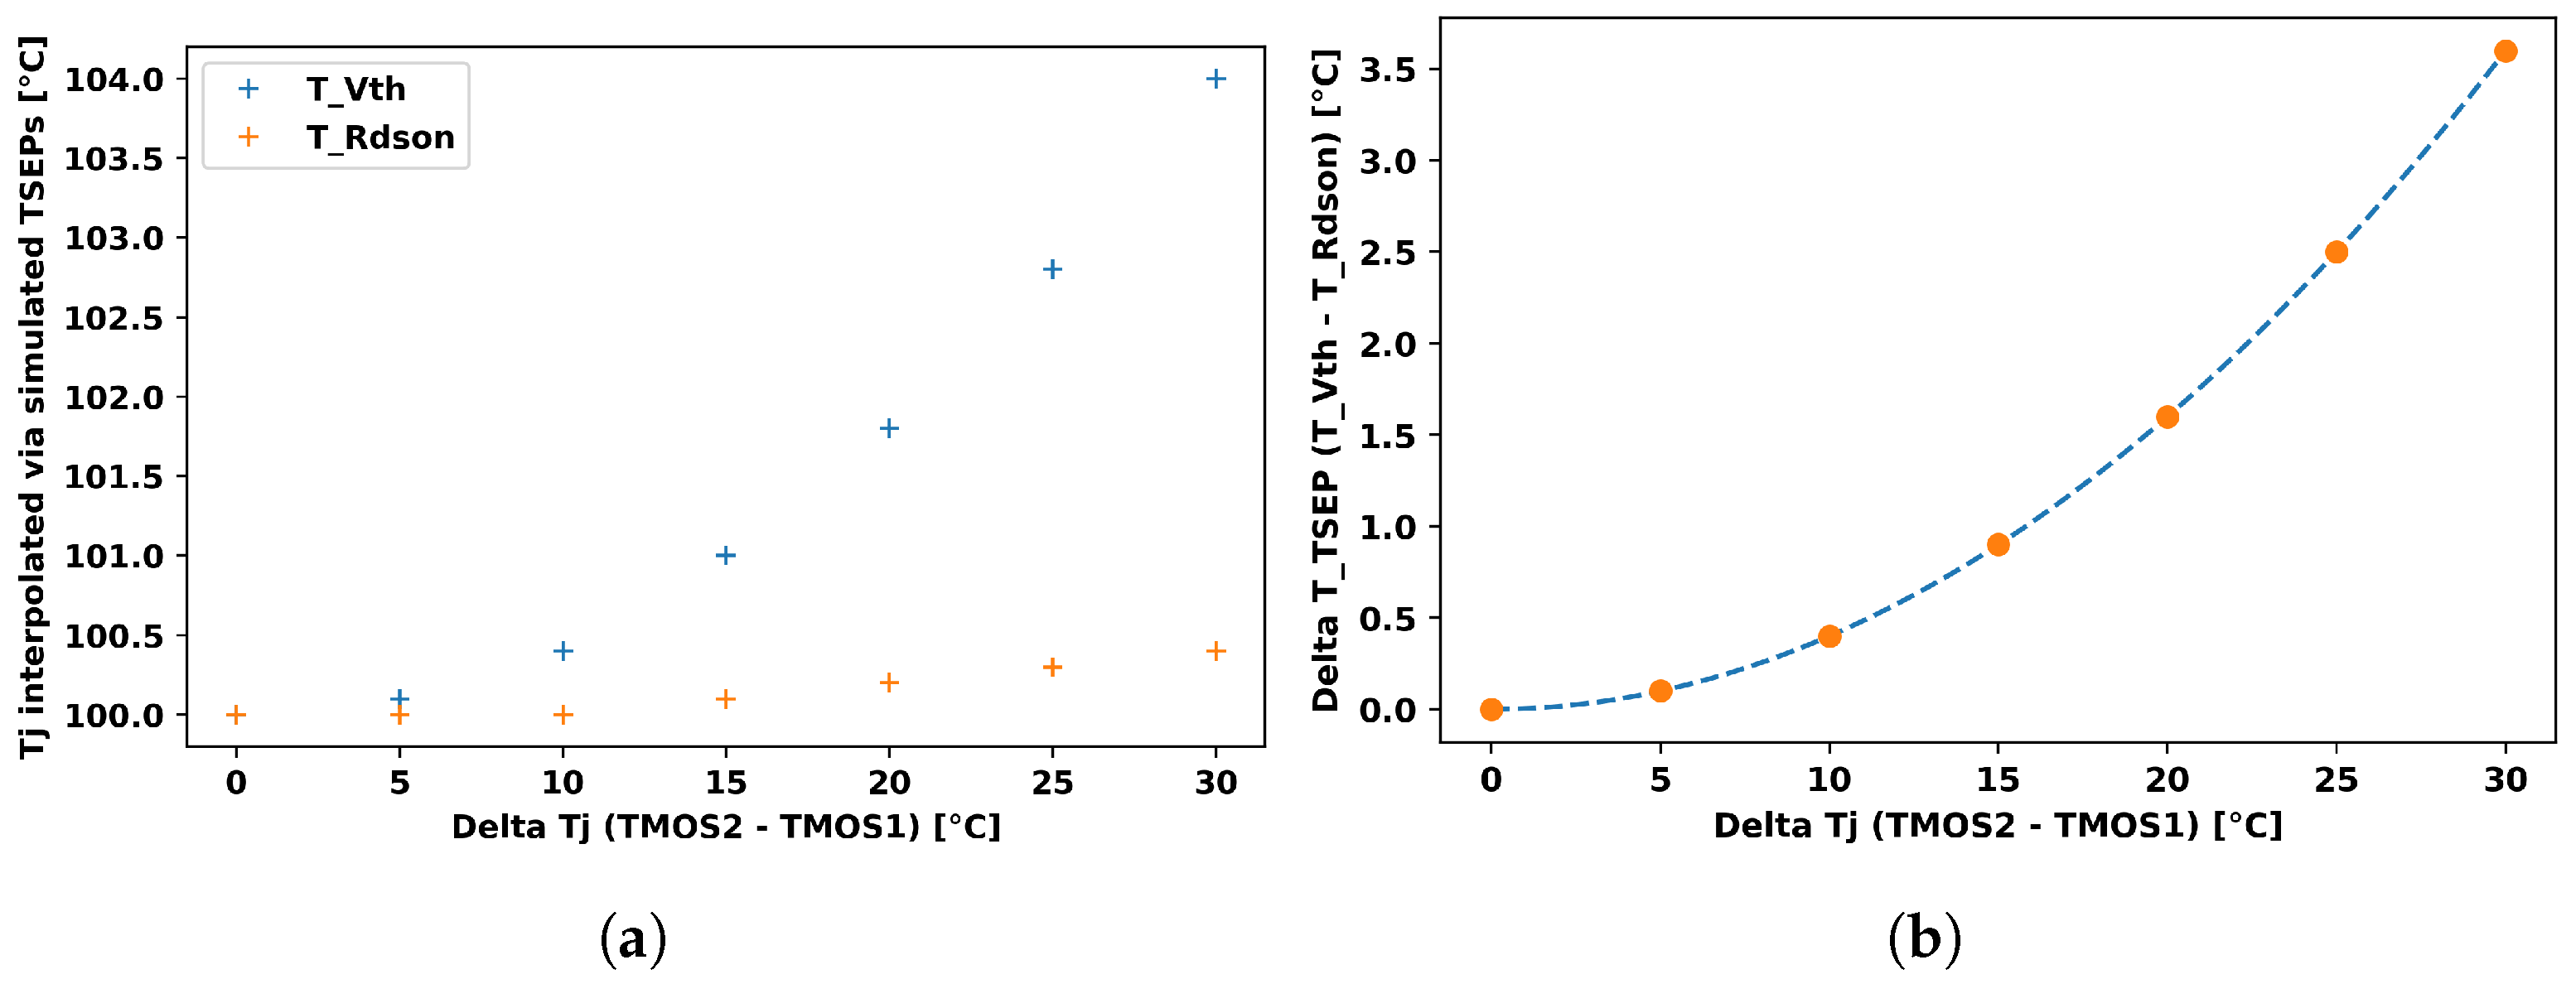
Figure 7.
fluidic part of the bench (a) and simplified command part (b).
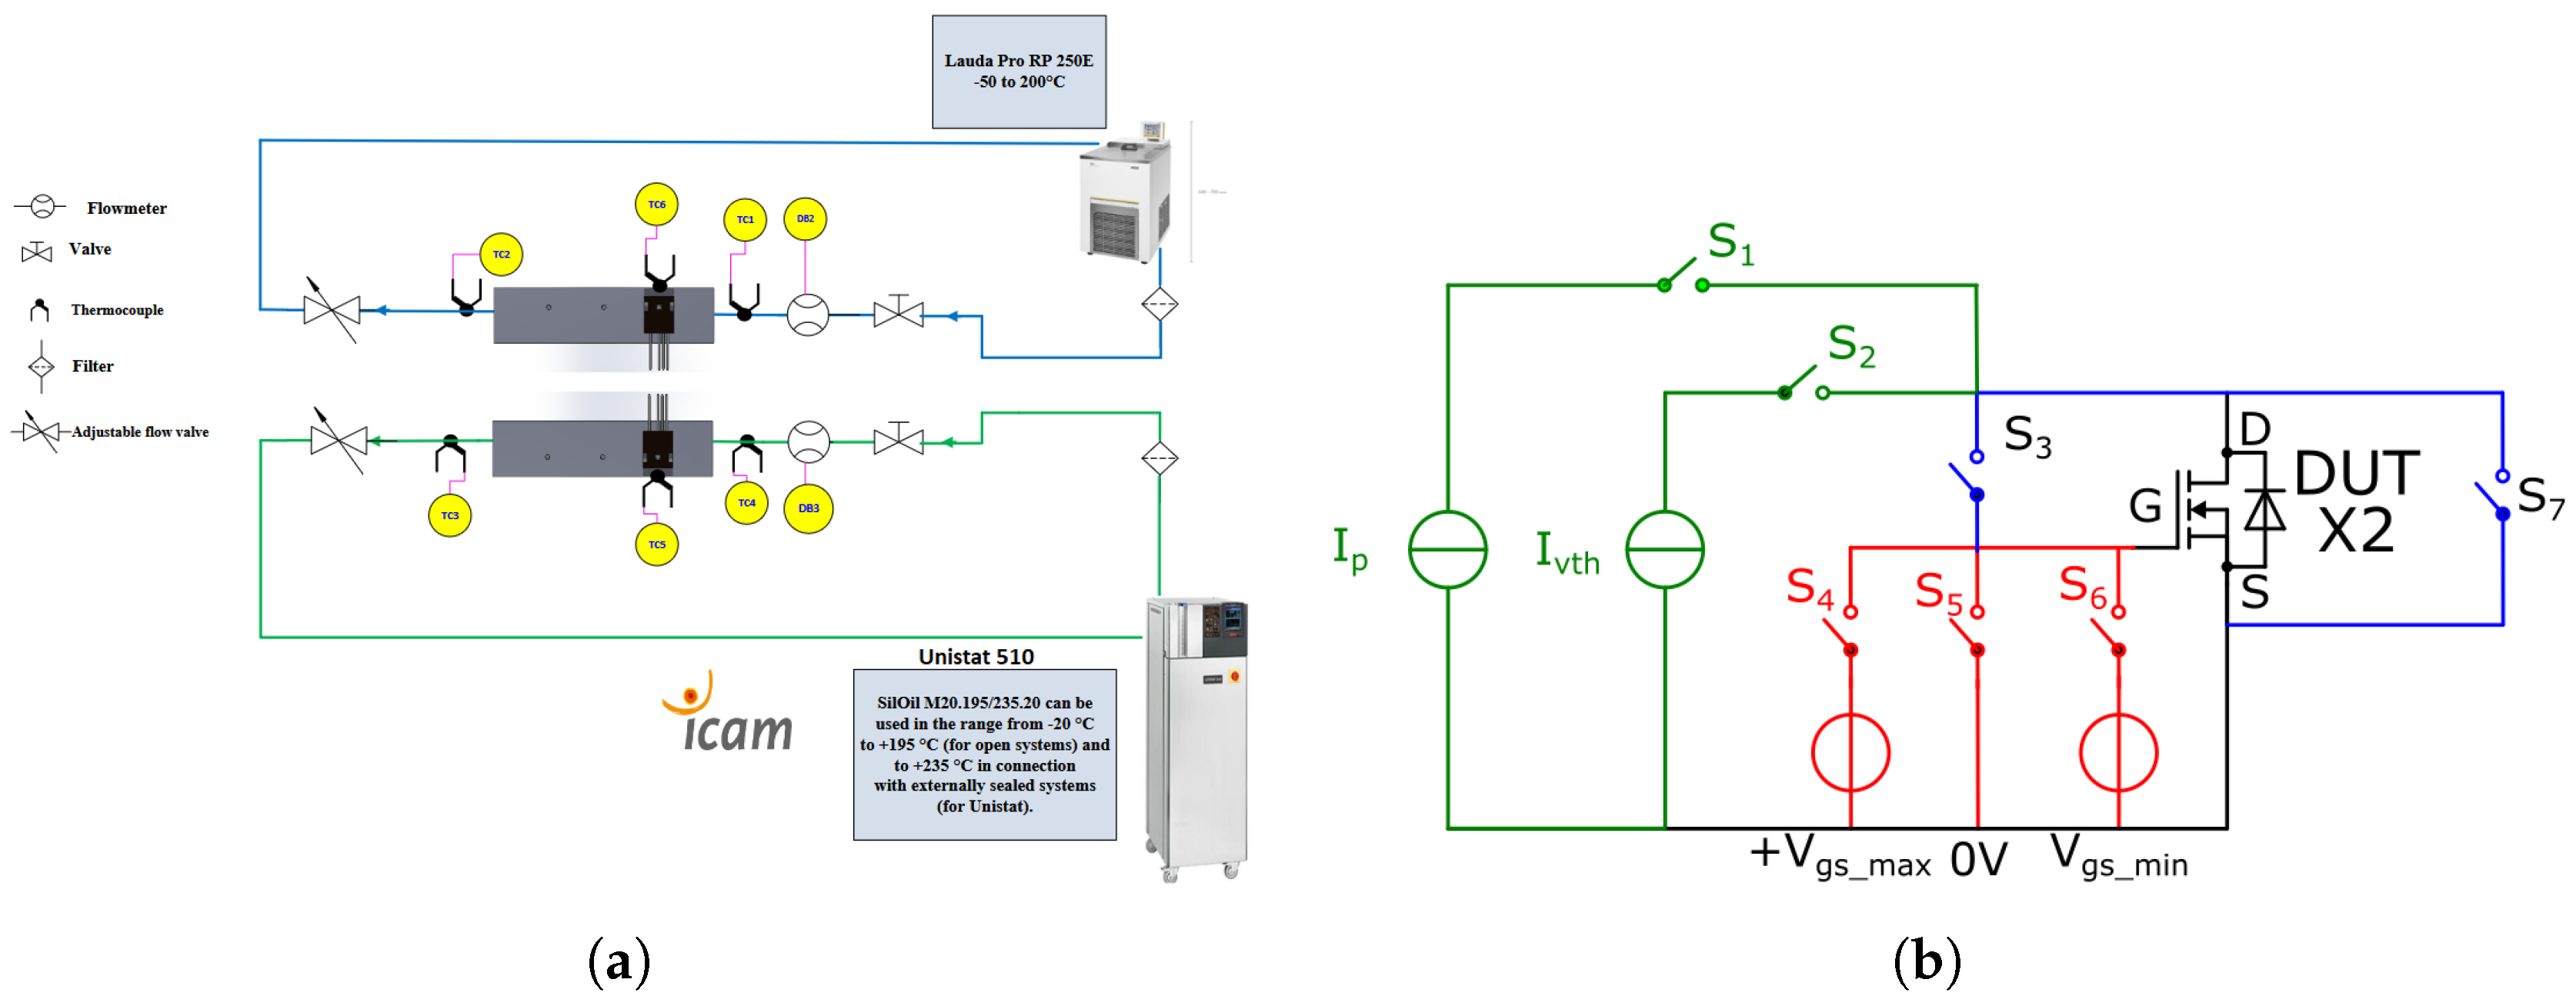
Figure 8.
temporal steps of the electric part of the bench.
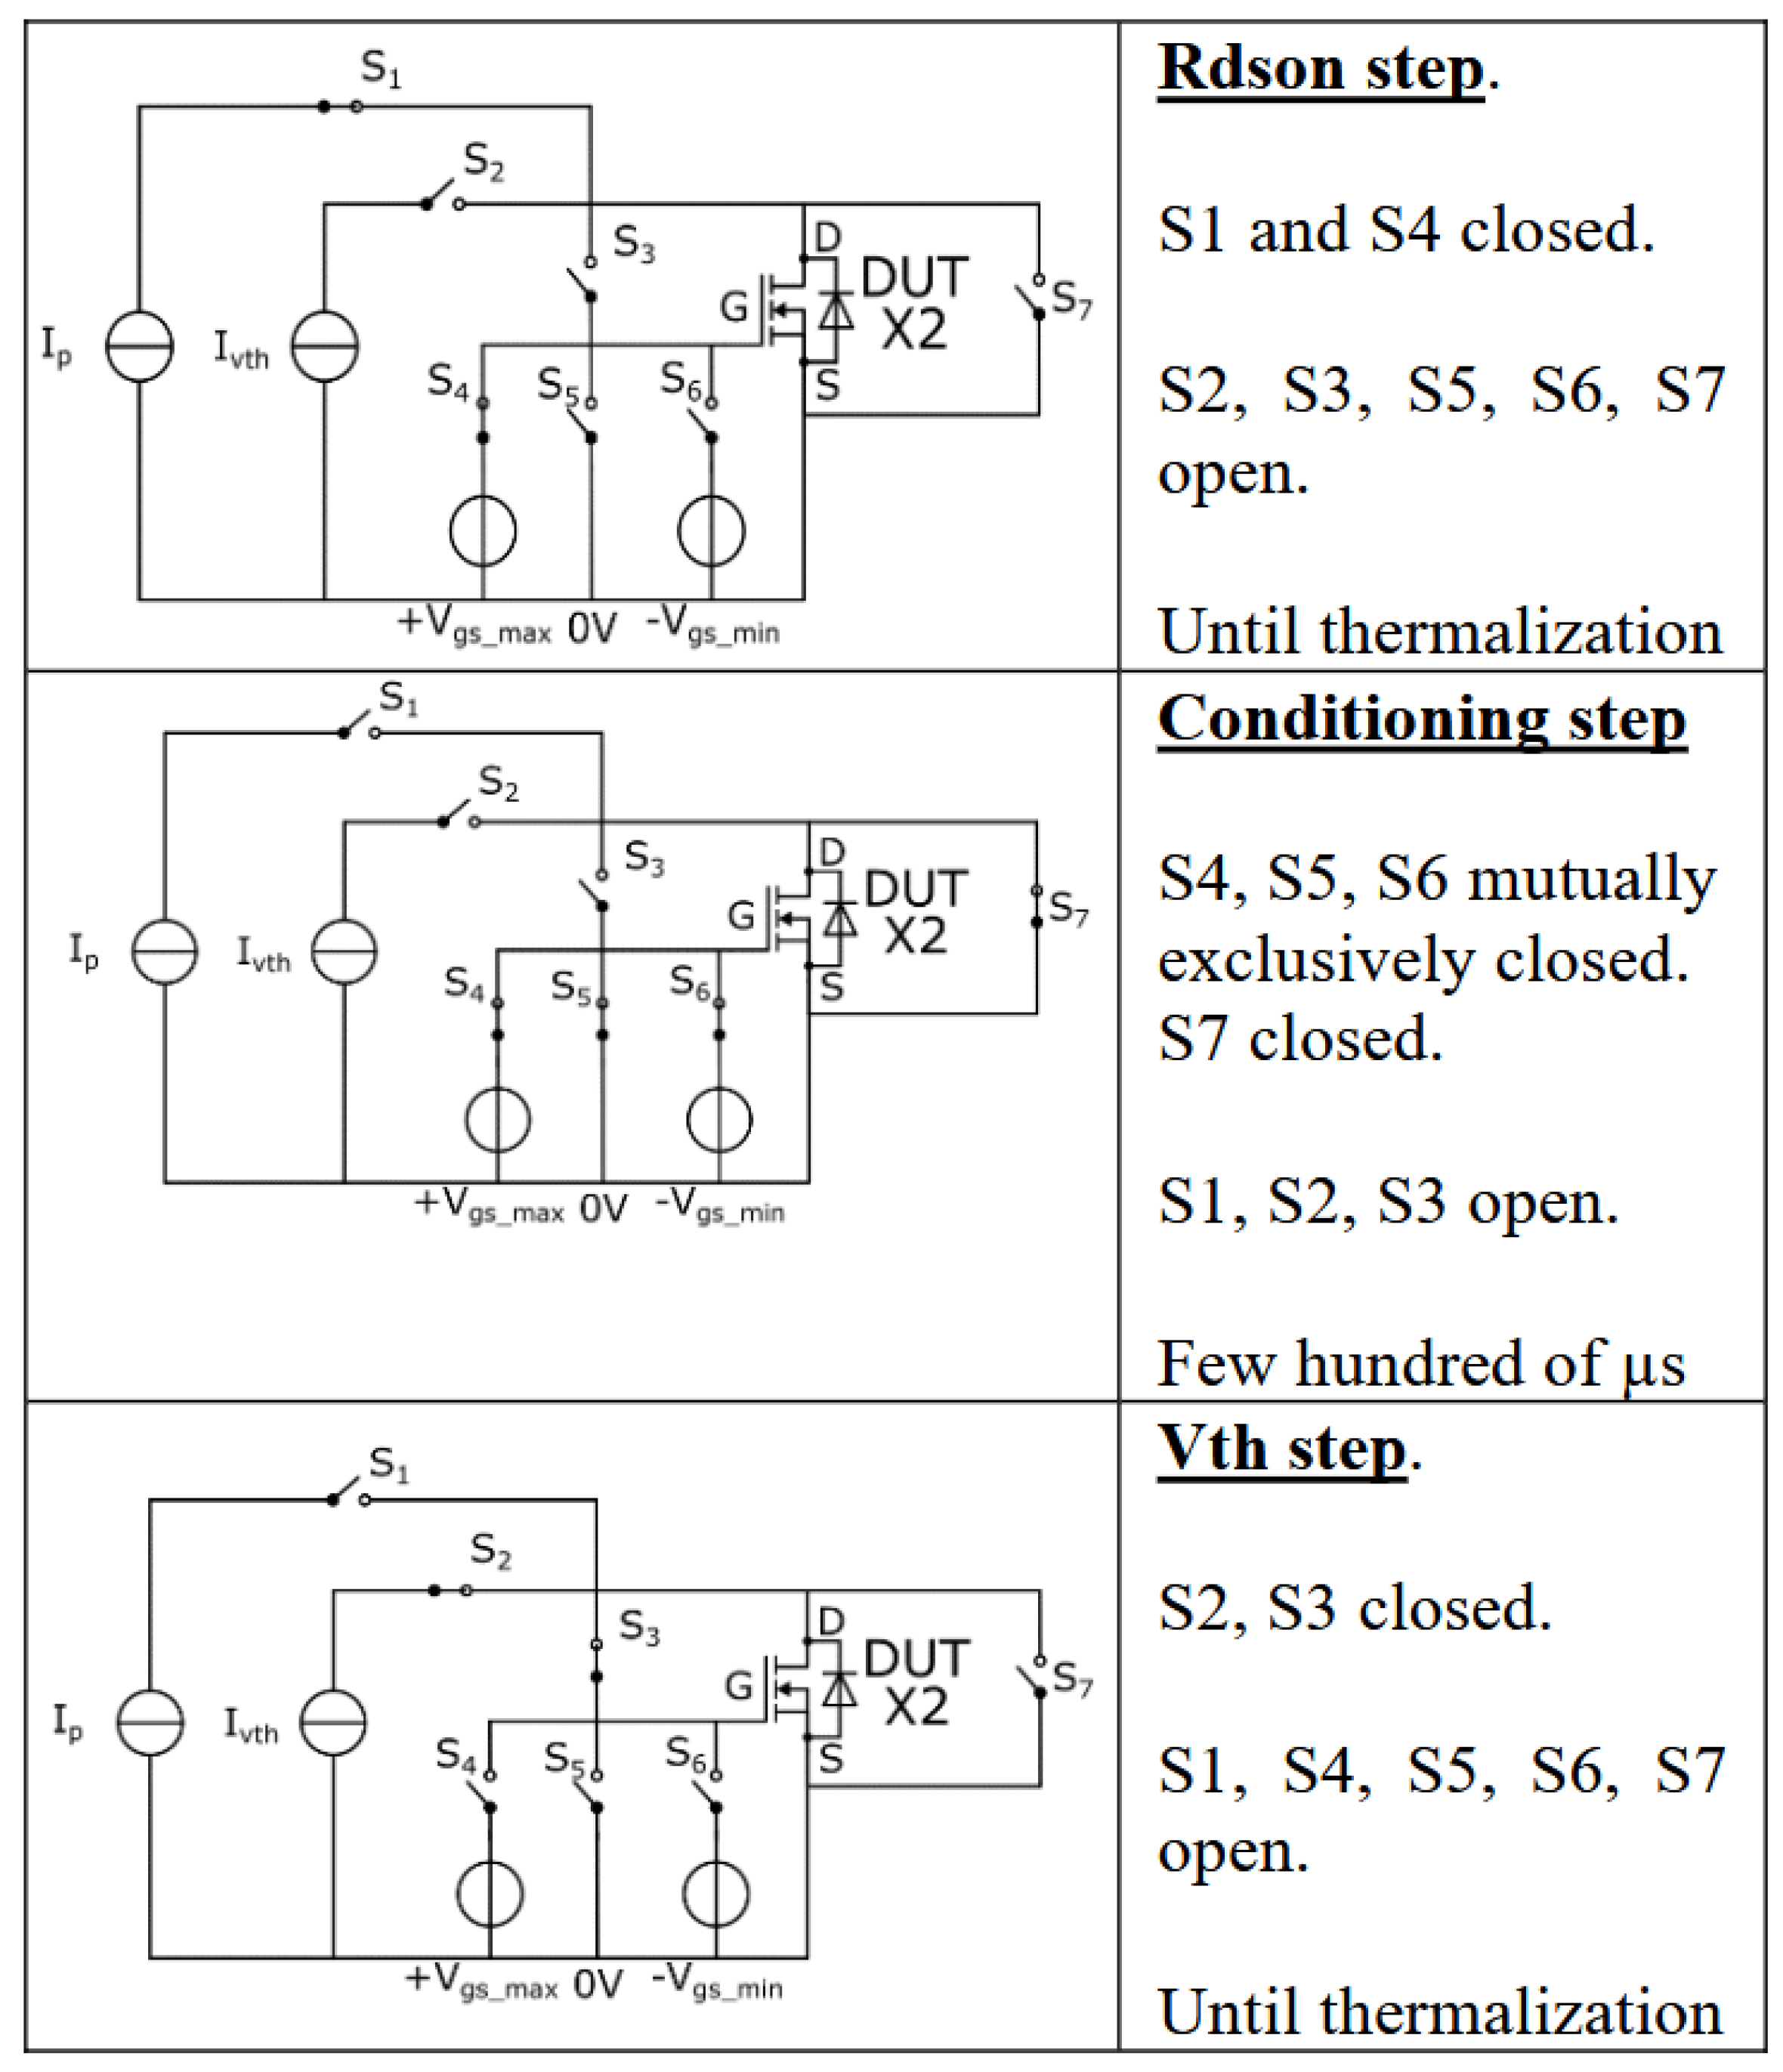
Figure 9.
Vth dispersion on twenty MOSFETs tested, and correlation between Vth and Rdson.
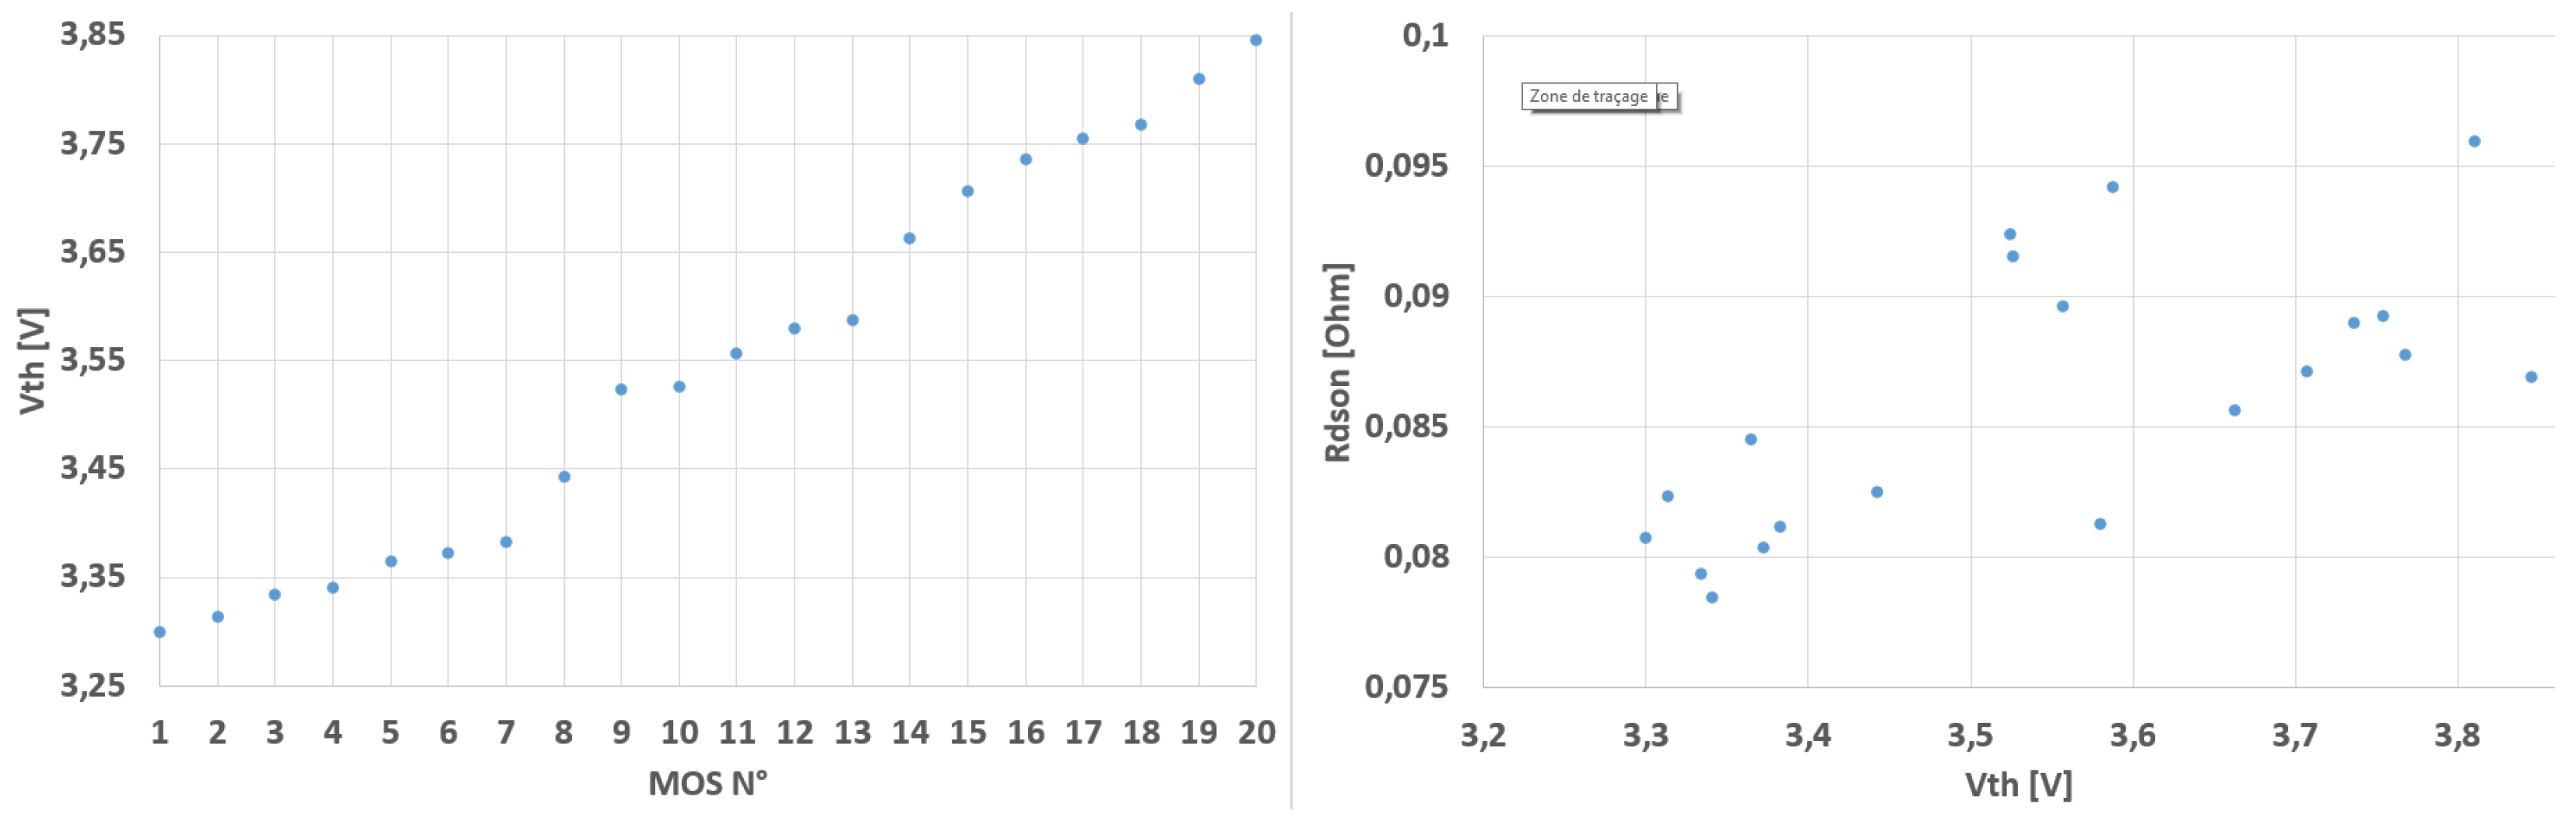
Figure 10.
Vgs curves for different currents as a function of time during a Vth measurement (a) and extracted charging time of Cgs as a function of Ivth (b).
Figure 10.
Vgs curves for different currents as a function of time during a Vth measurement (a) and extracted charging time of Cgs as a function of Ivth (b).
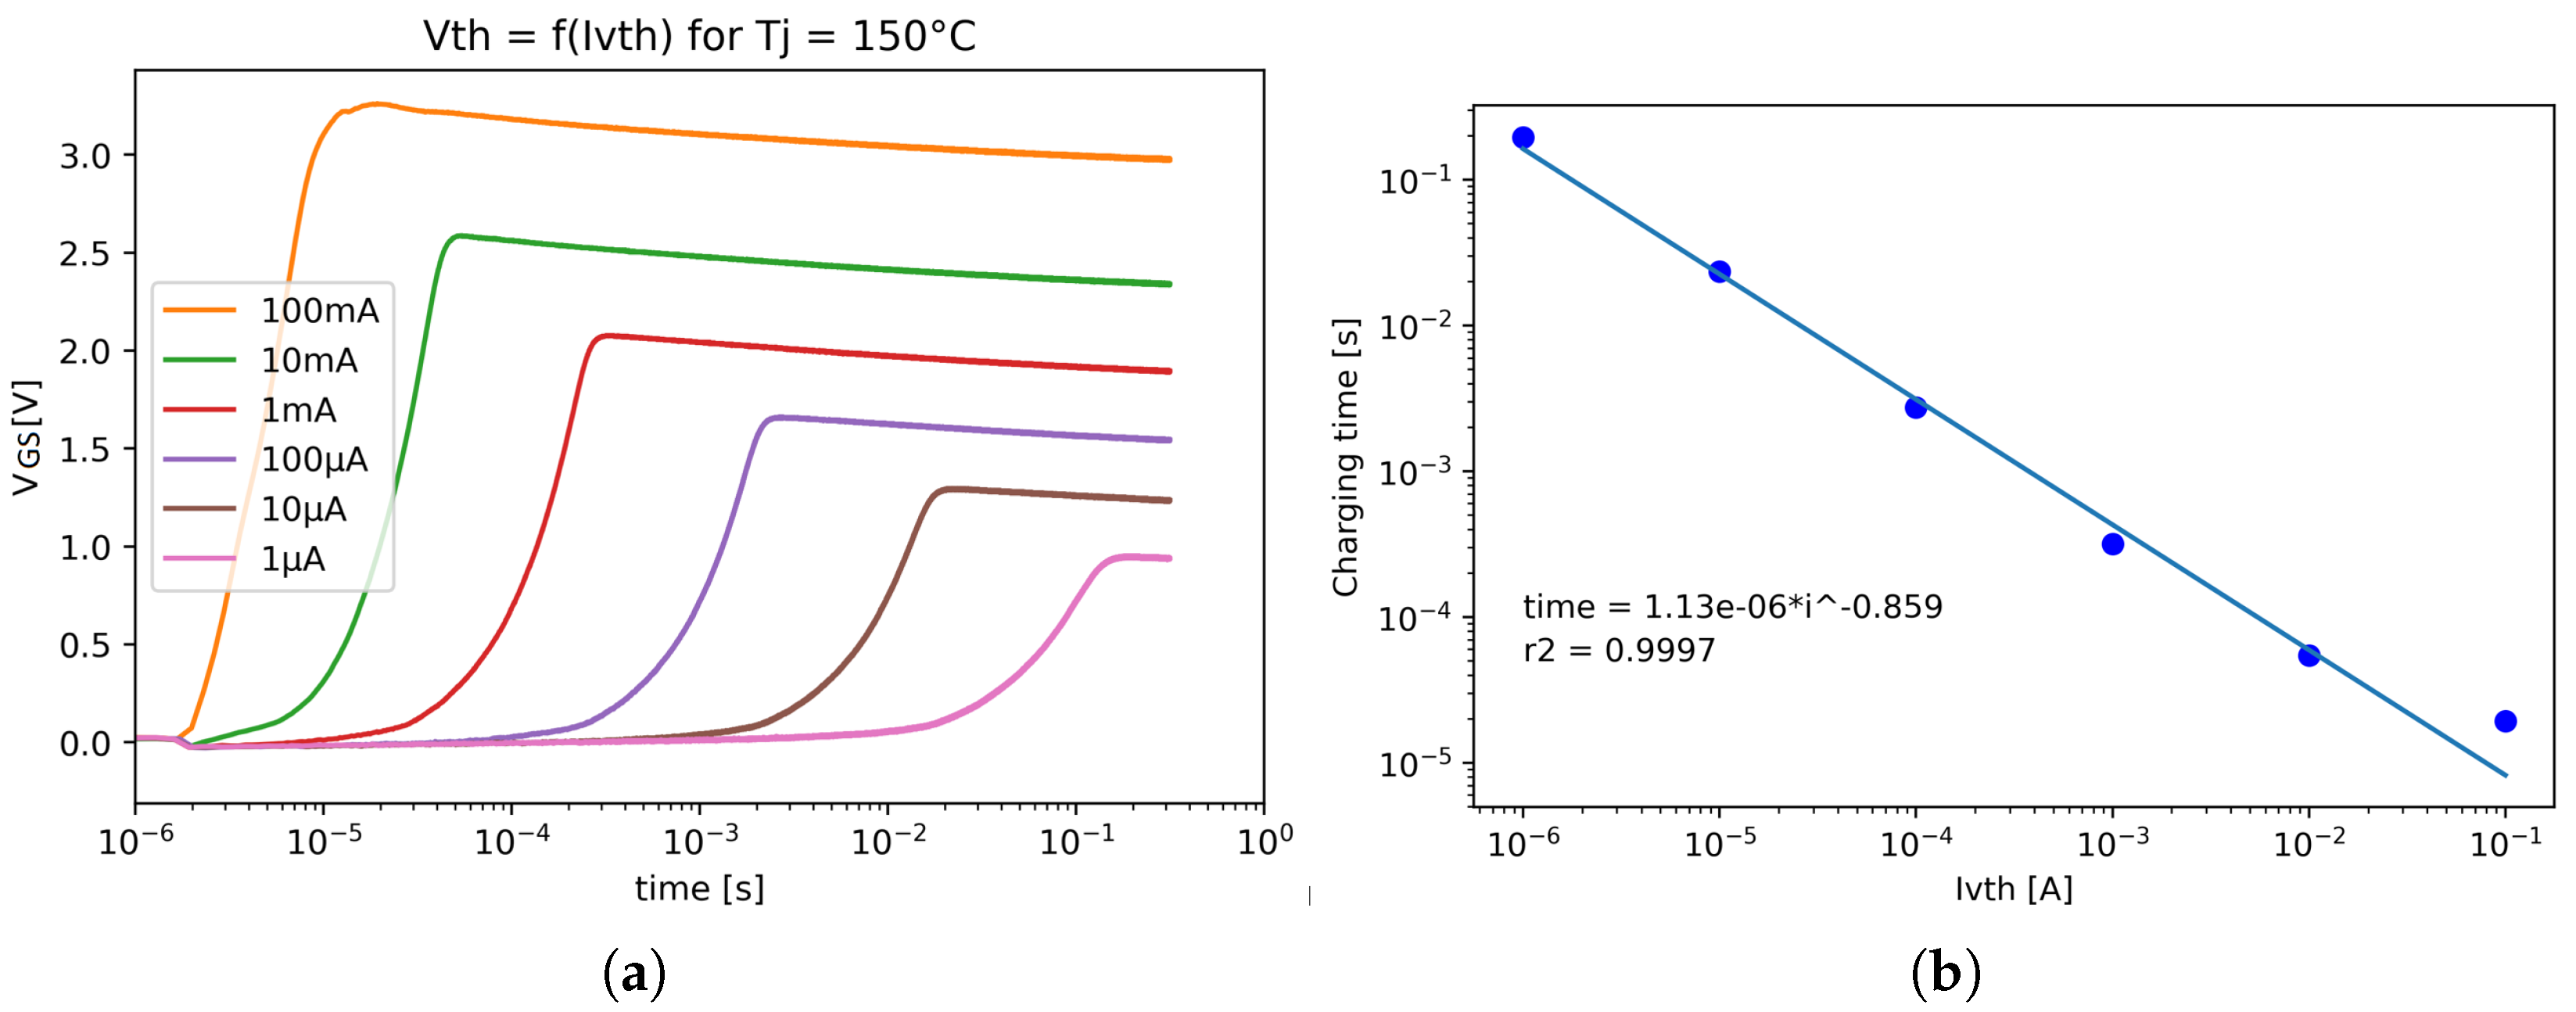
Figure 11.
Measured Vth for different Ivth and temperature (a) and extracted thermal sensitivity of Vth = f(Ivth) (b).
Figure 11.
Measured Vth for different Ivth and temperature (a) and extracted thermal sensitivity of Vth = f(Ivth) (b).
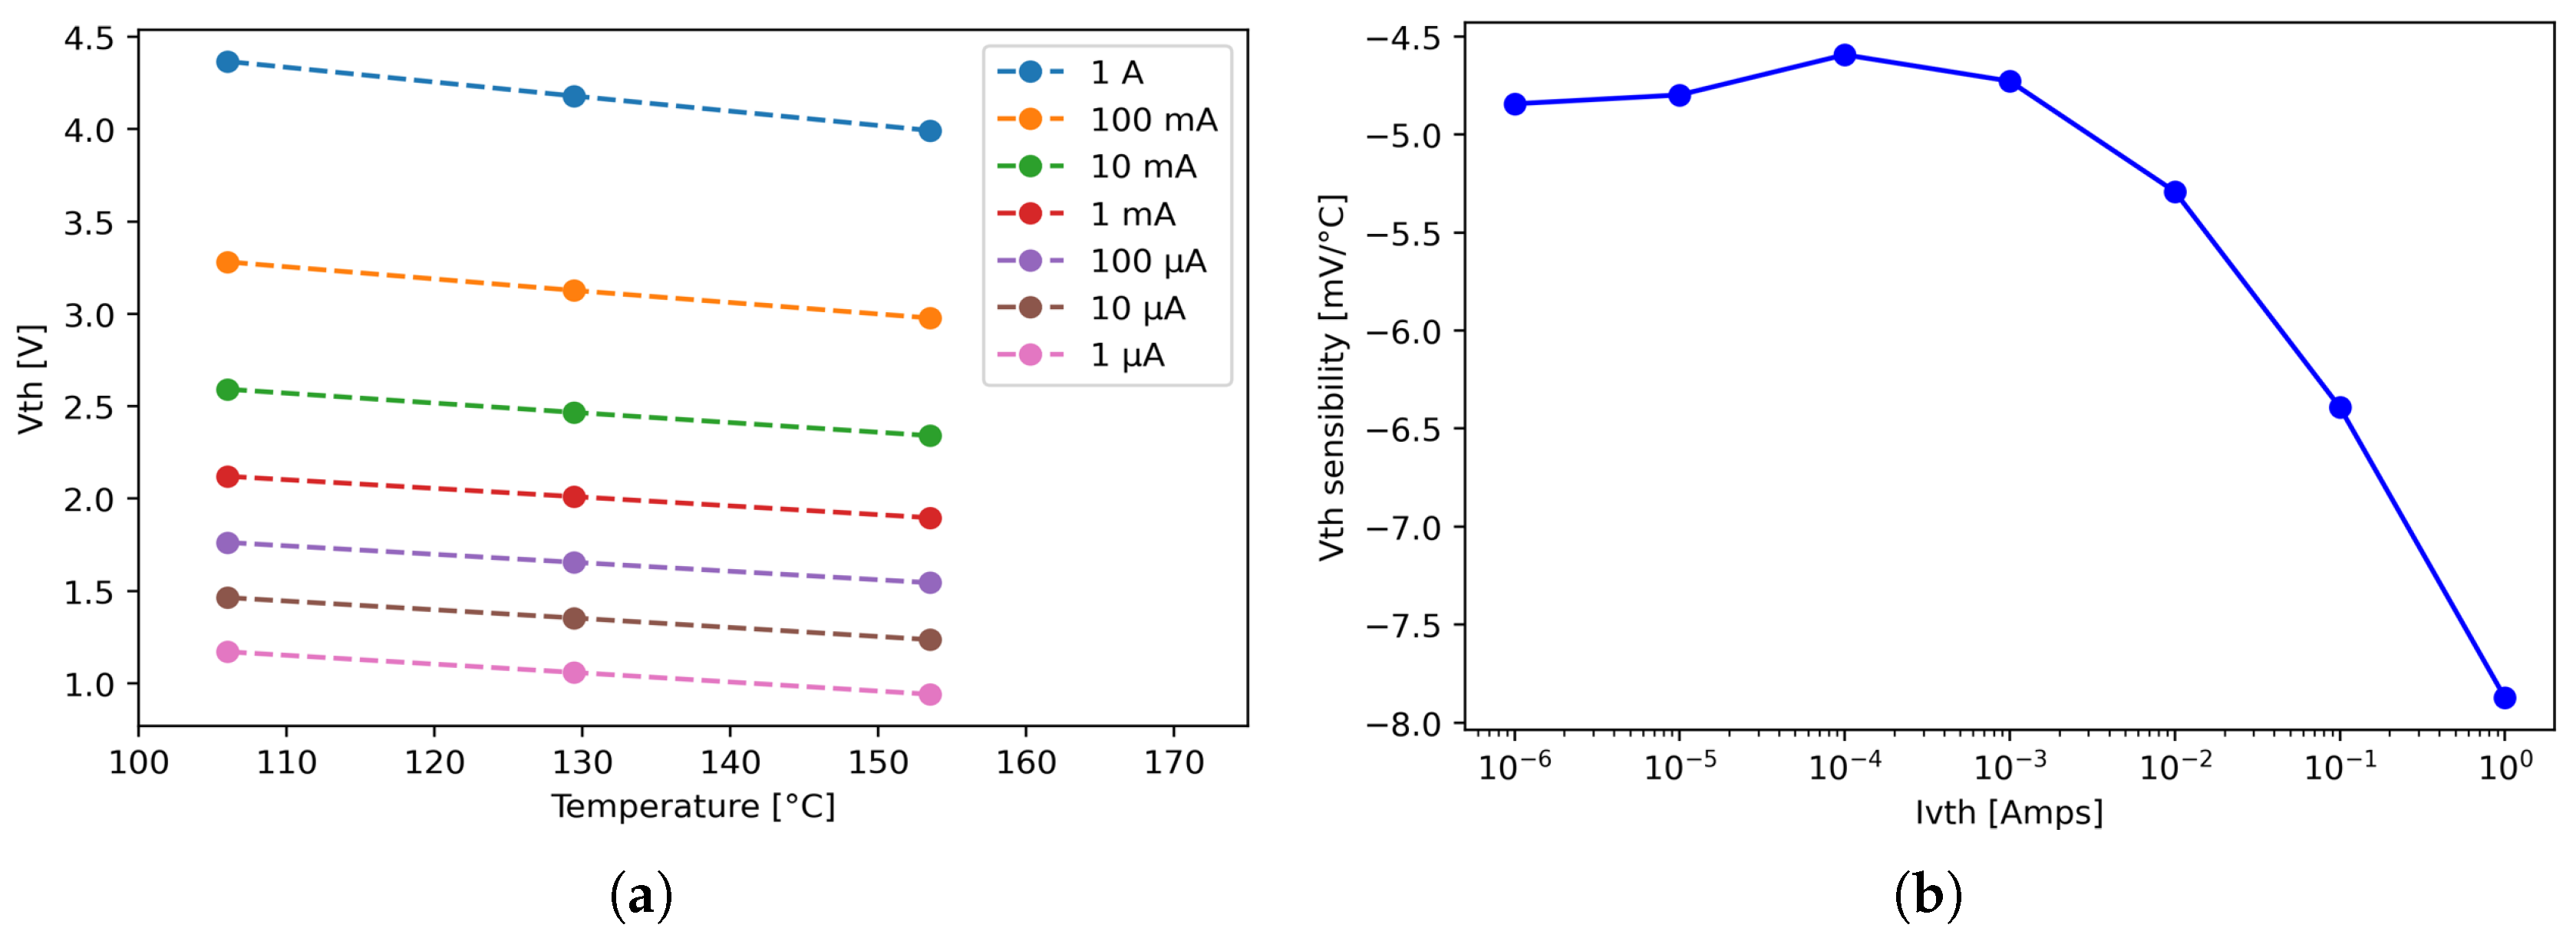
Figure 12.
Difference between the extrapolated temperature of the two parallelized MOSFET via Vth and their mean temperature as a function of the temperature imbalance of the two MOSFET for multiple Ivth. Mean temperature is obtained via Thermocouples.
Figure 12.
Difference between the extrapolated temperature of the two parallelized MOSFET via Vth and their mean temperature as a function of the temperature imbalance of the two MOSFET for multiple Ivth. Mean temperature is obtained via Thermocouples.
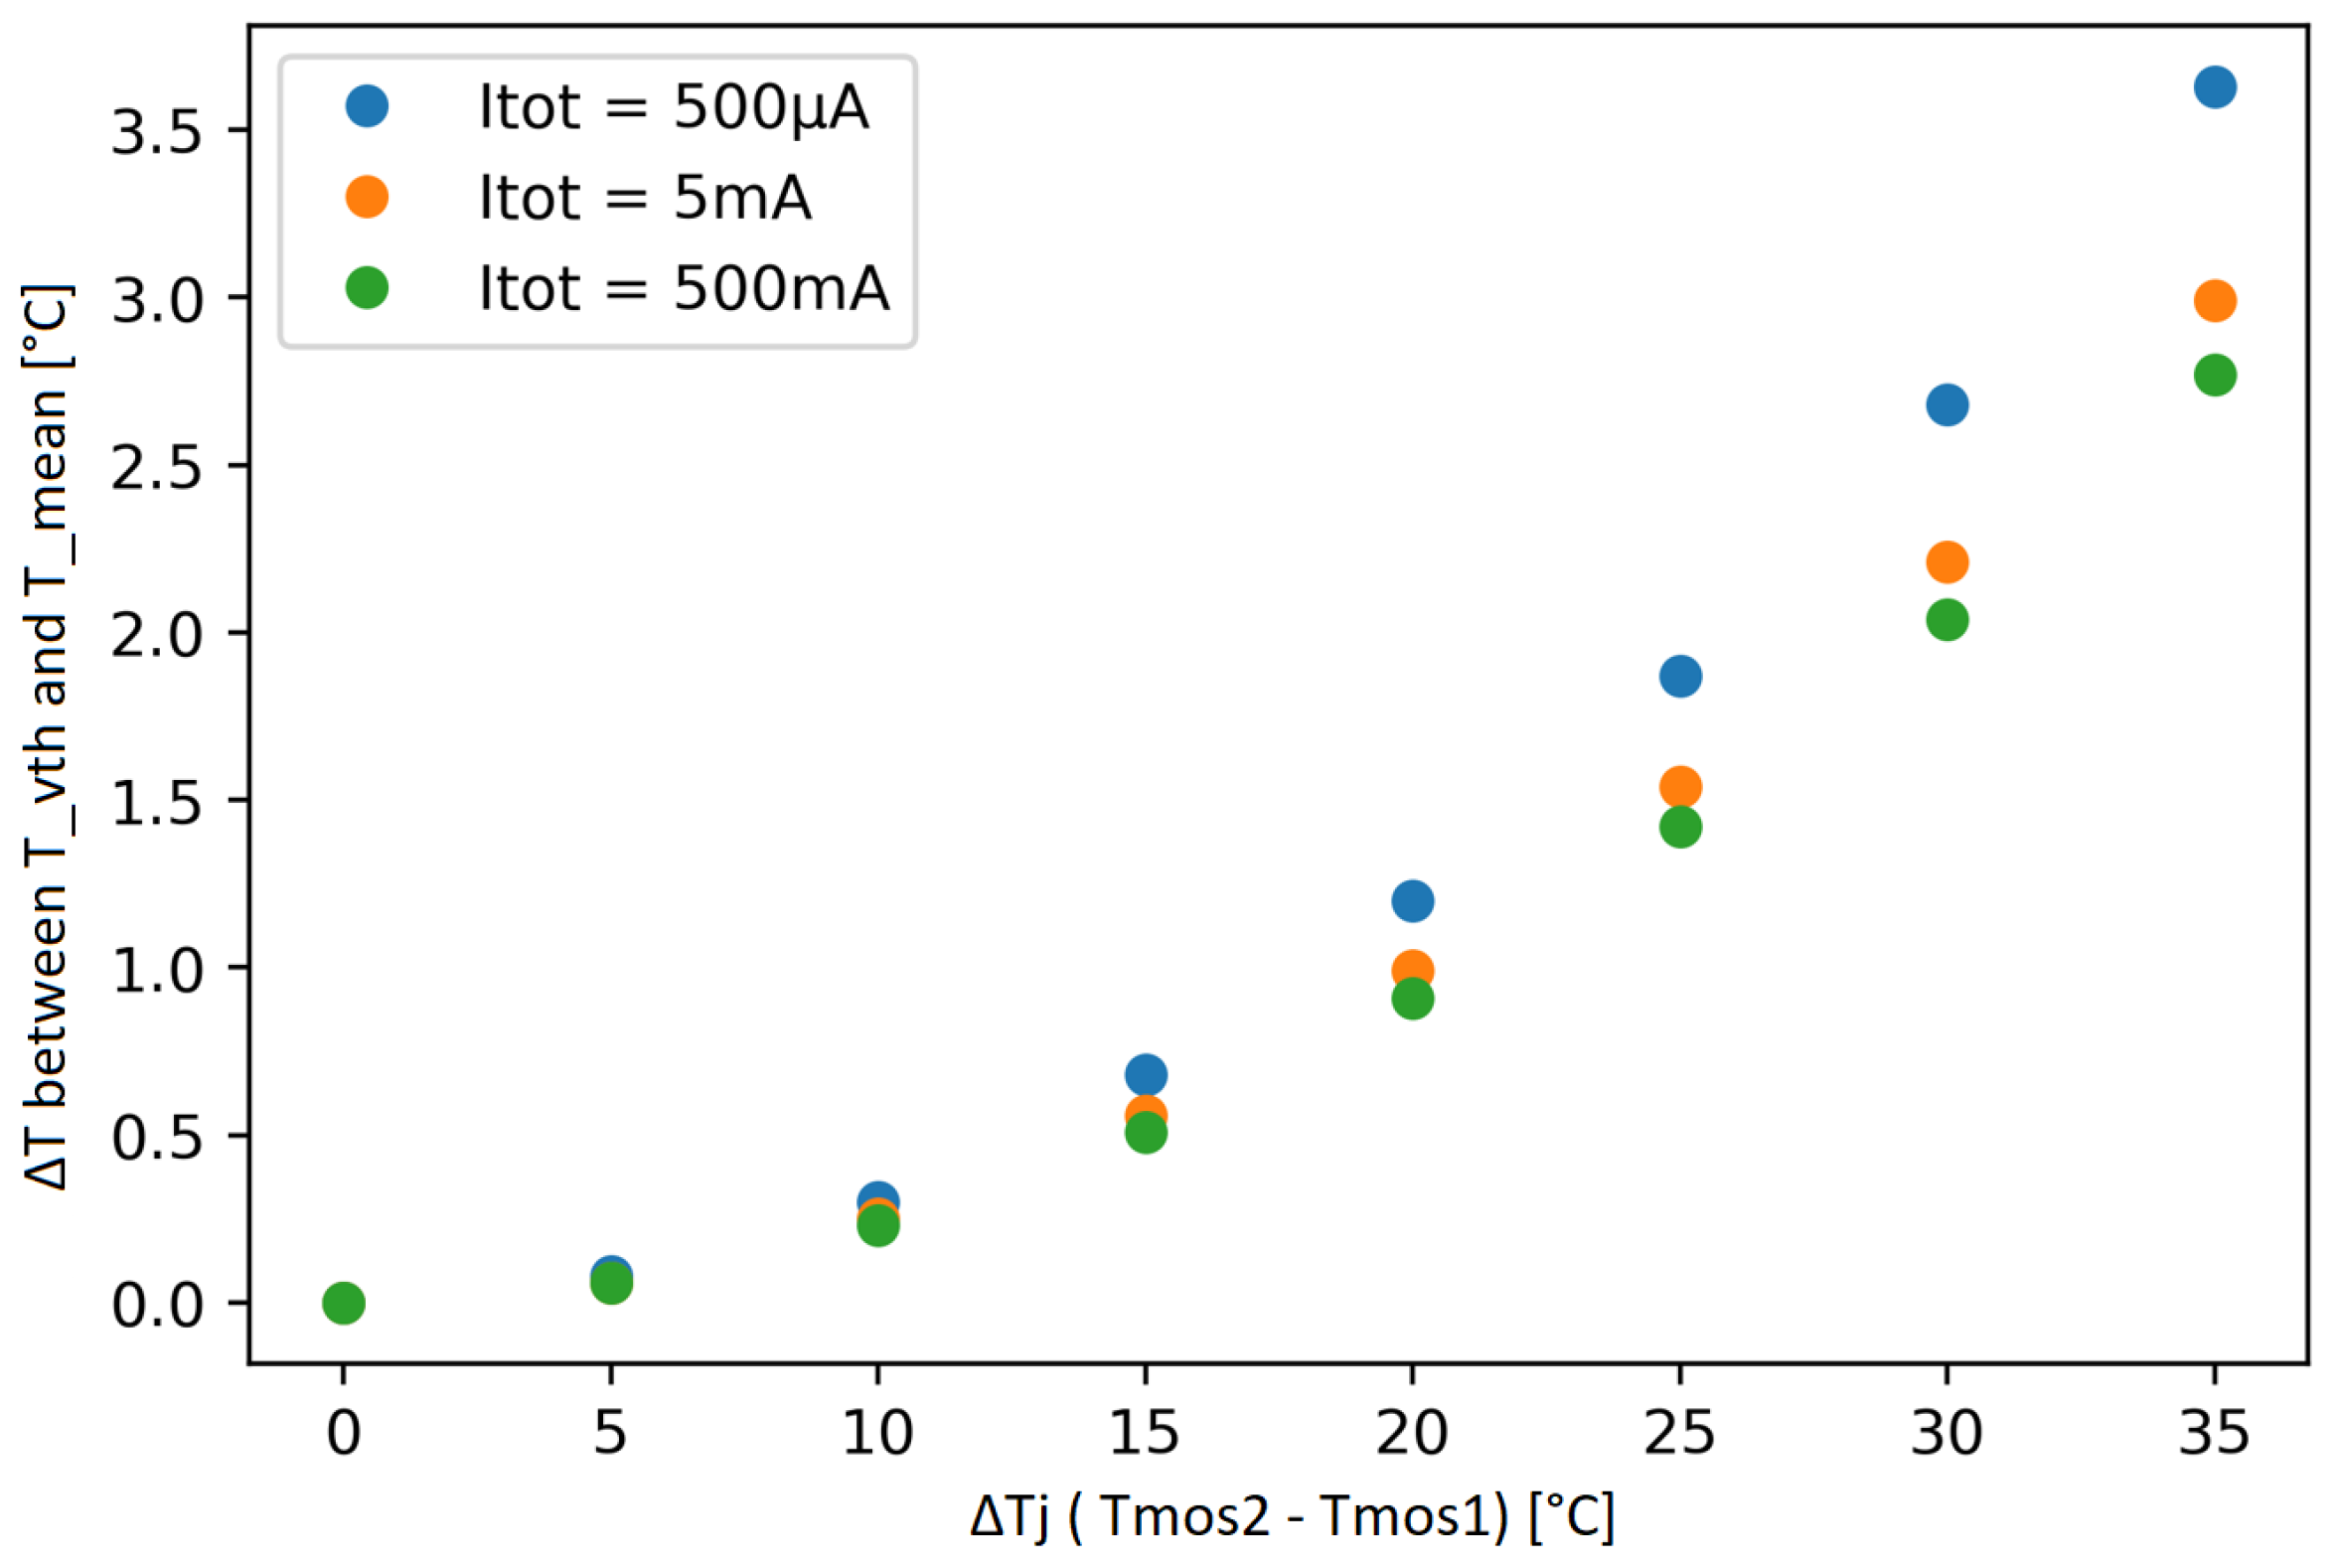
Figure 13.
Typical scenario for Rdson/Vth Tj comparison.
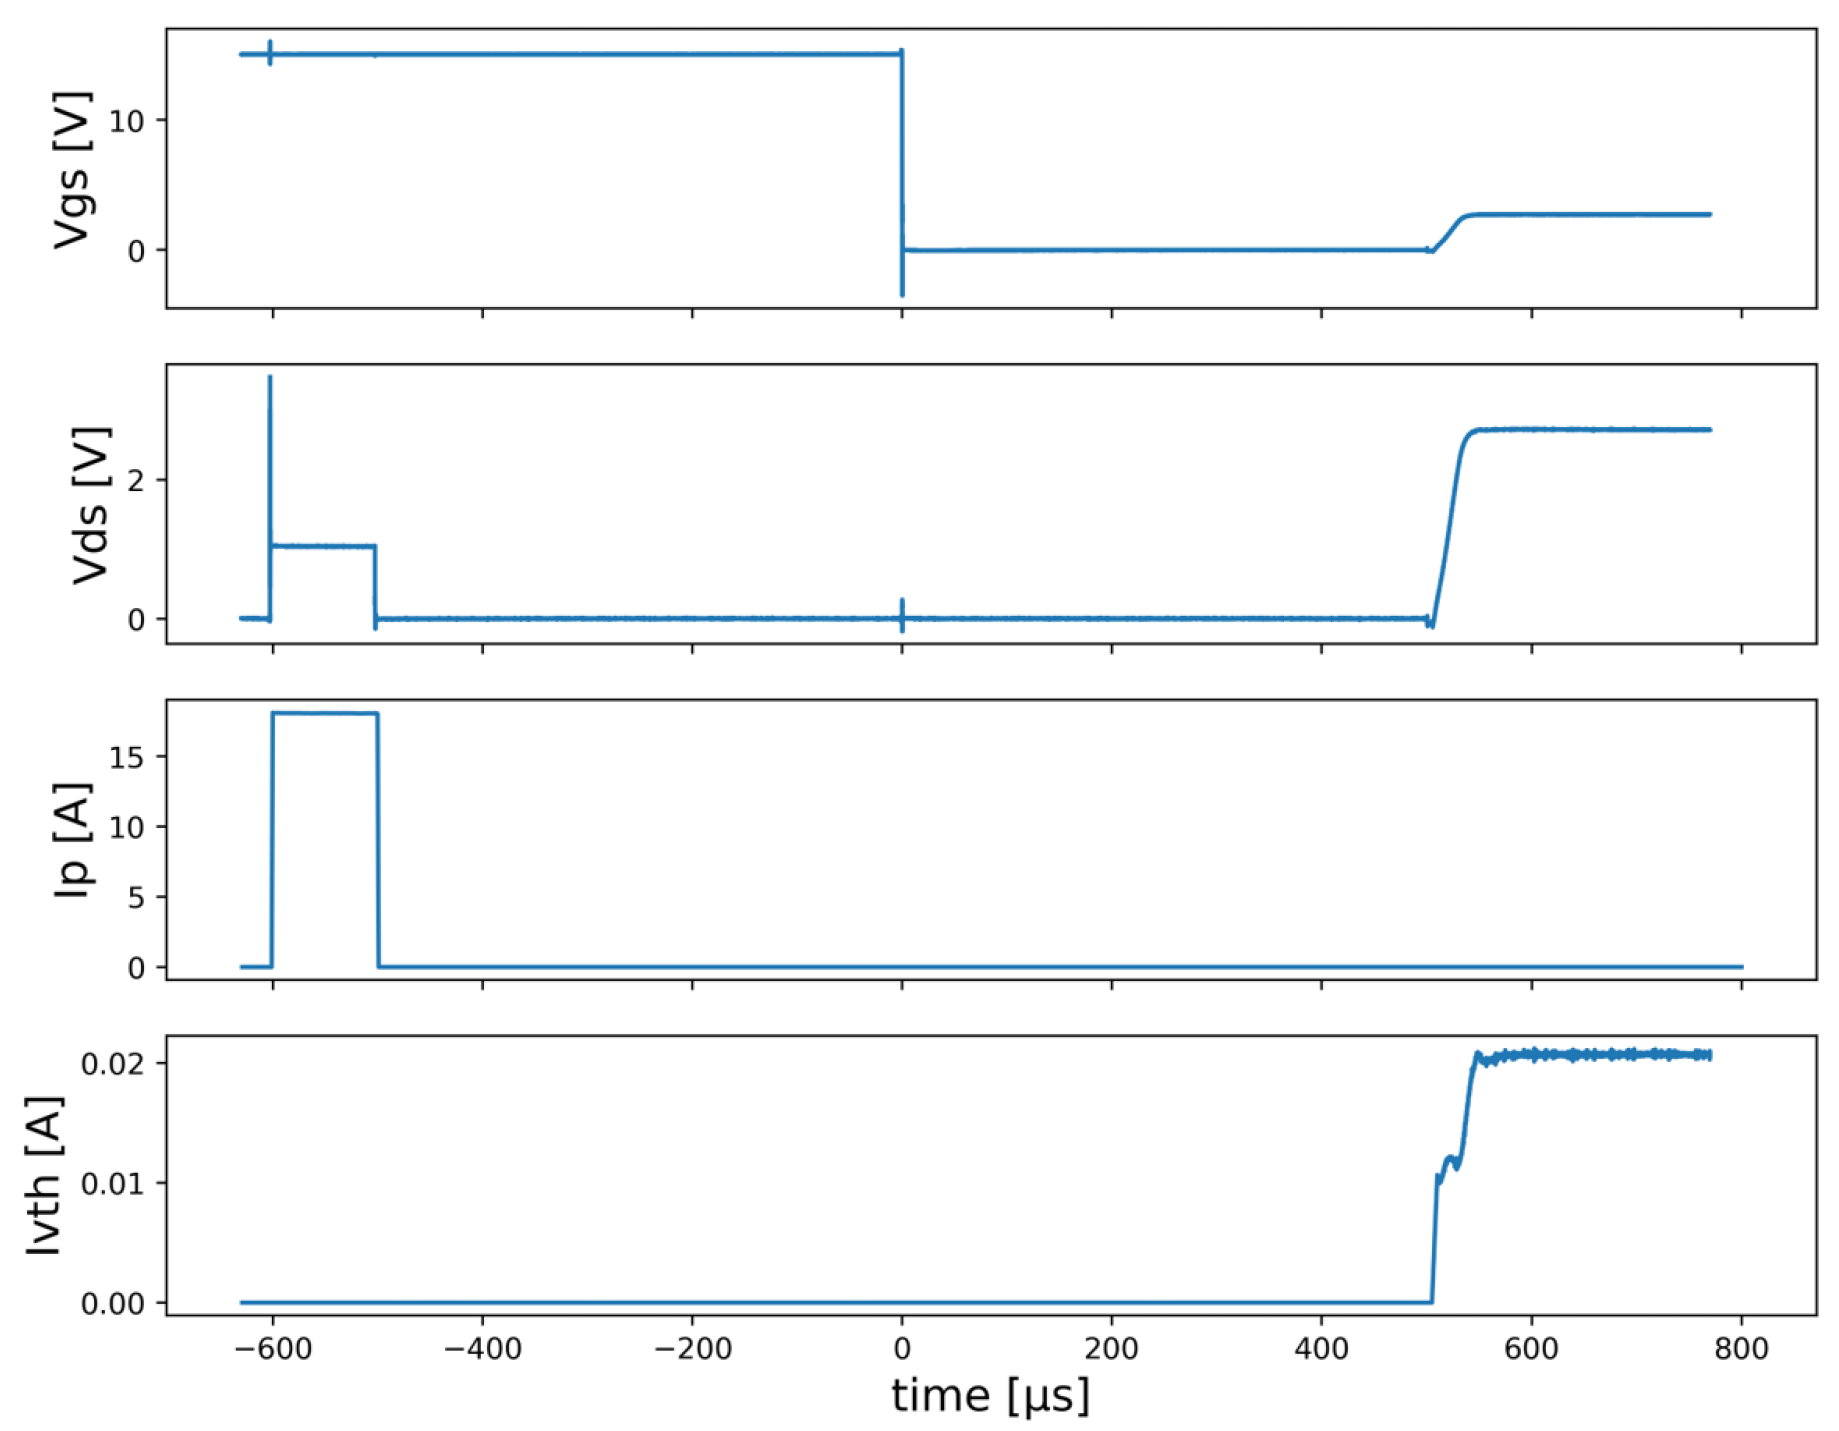
Figure 14.
Relationship between square root of imbalance of Tj measured with Rdson and Vth and imbalance between MOSFET1 and MOSFET2, compared with the LTSpice simulation.
Figure 14.
Relationship between square root of imbalance of Tj measured with Rdson and Vth and imbalance between MOSFET1 and MOSFET2, compared with the LTSpice simulation.
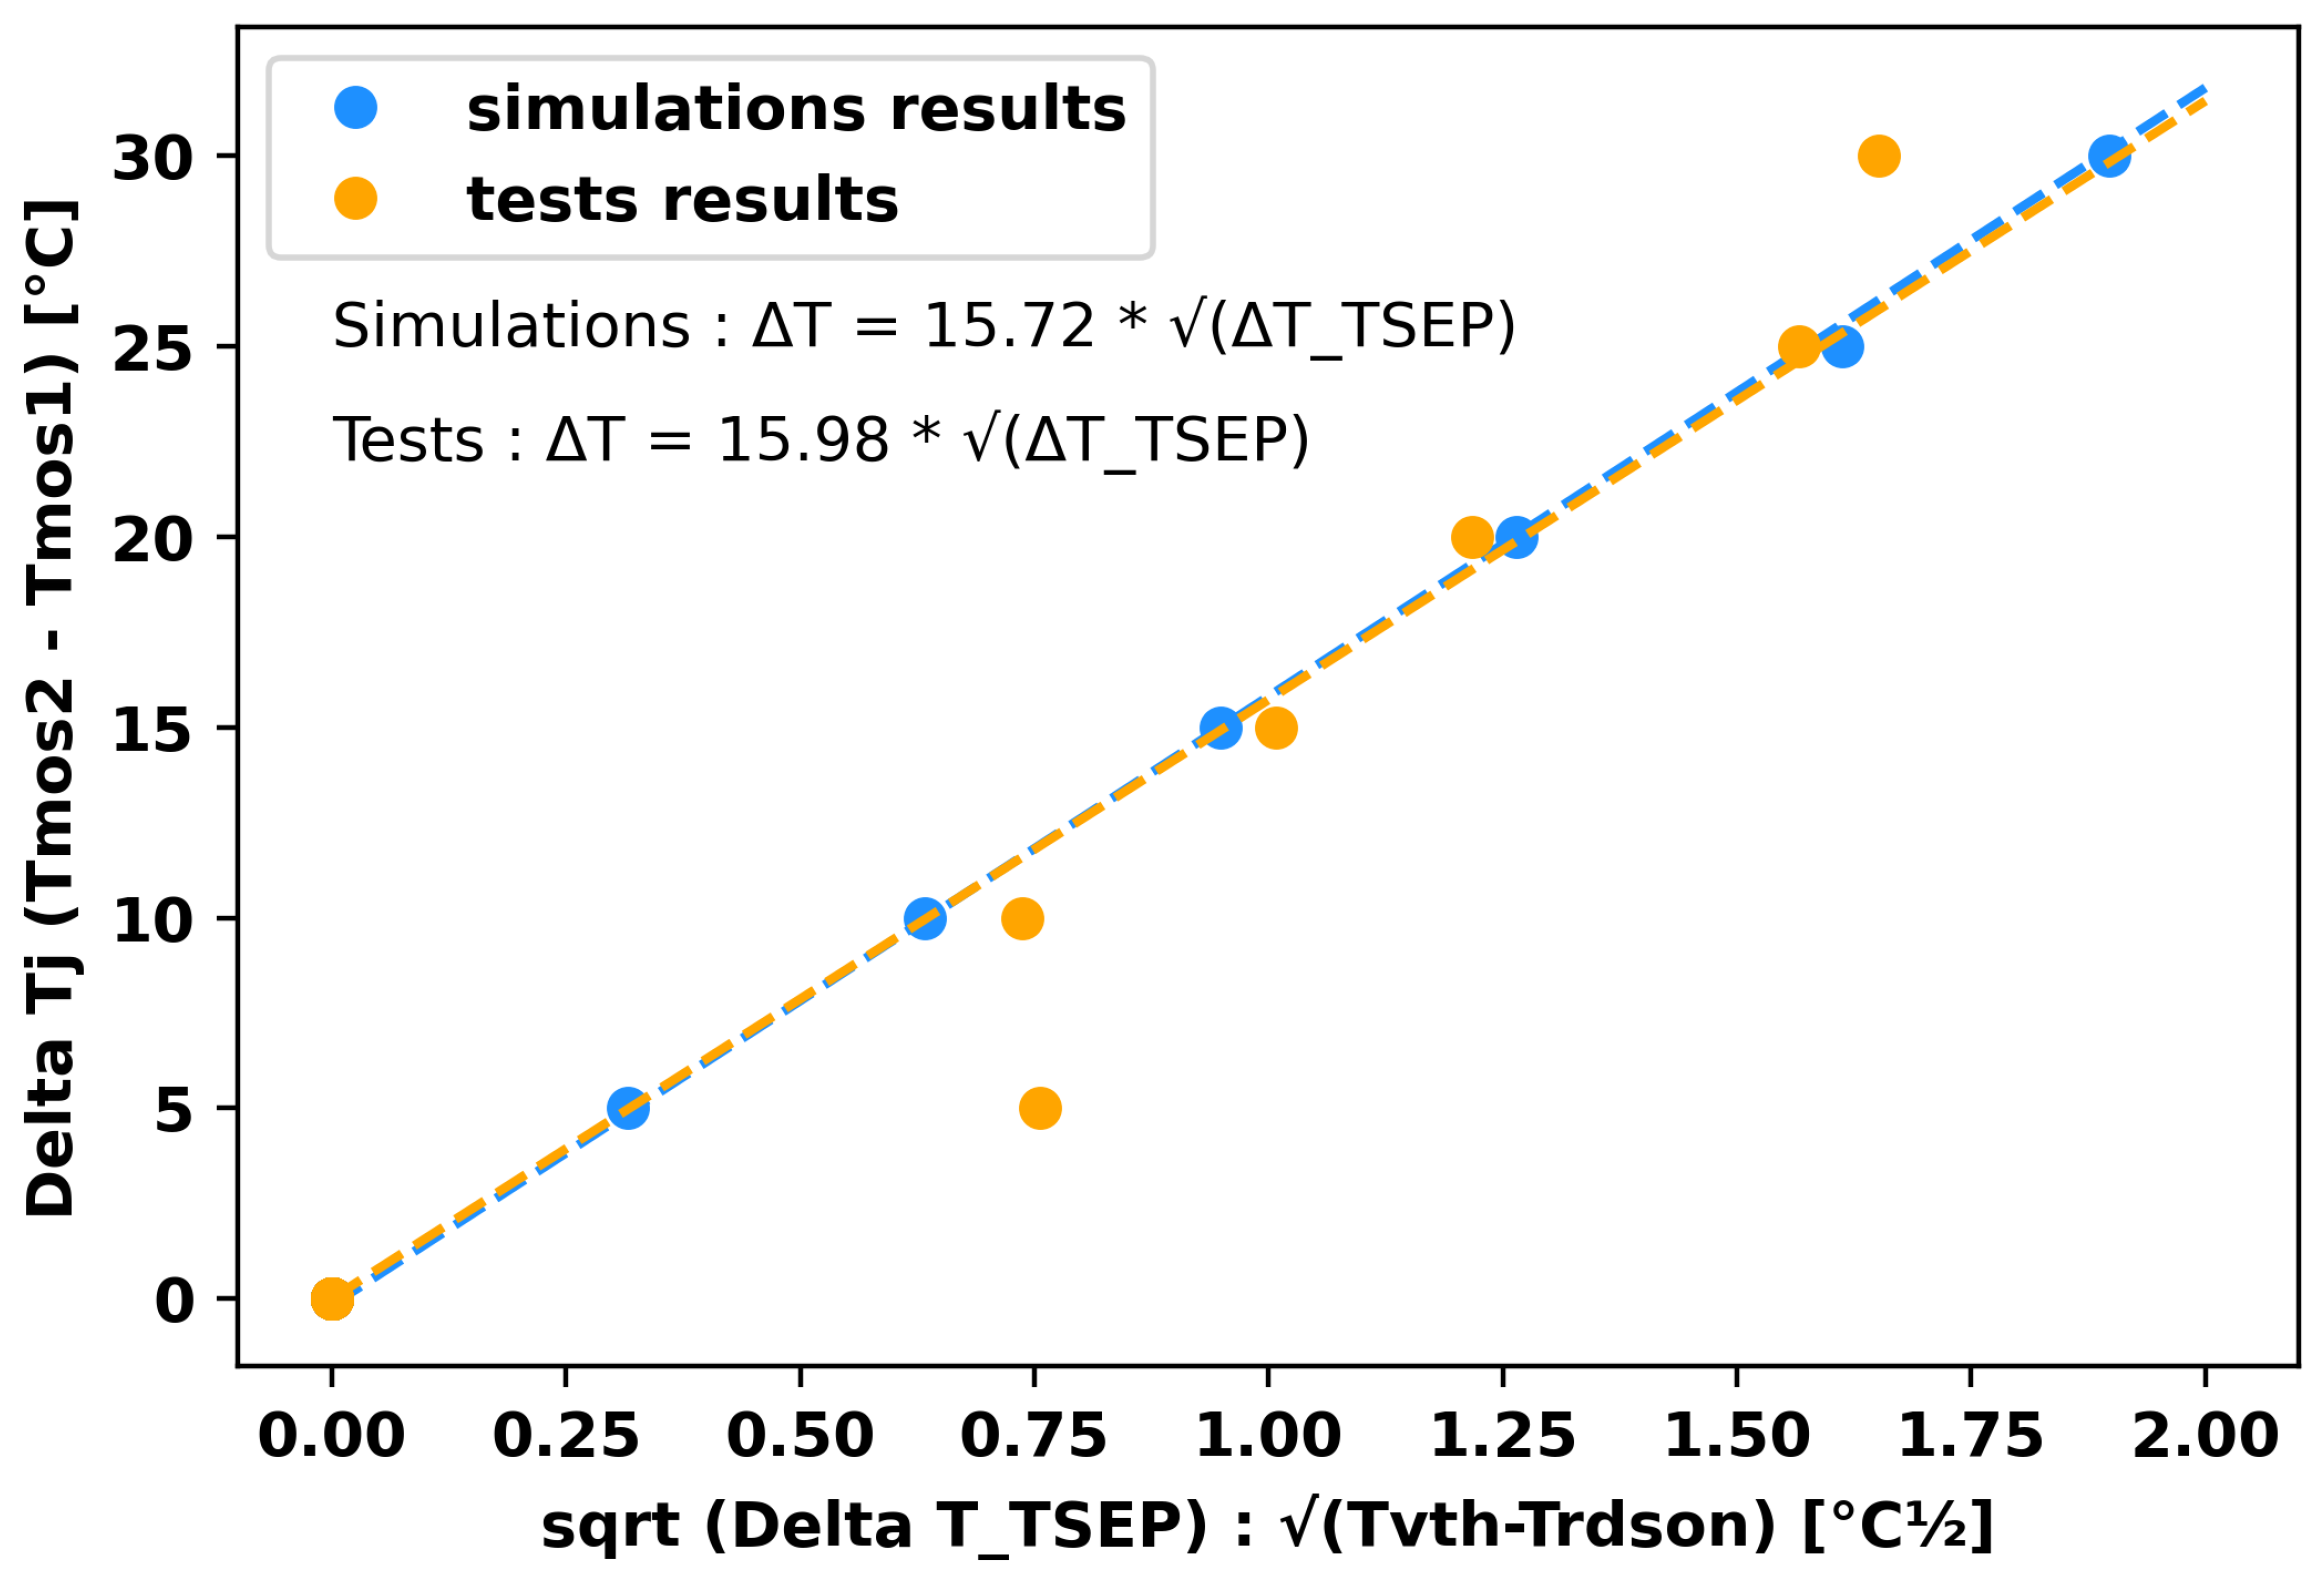
Figure 15.
First SiC Results.
Disclaimer/Publisher’s Note: The statements, opinions and data contained in all publications are solely those of the individual author(s) and contributor(s) and not of MDPI and/or the editor(s). MDPI and/or the editor(s) disclaim responsibility for any injury to people or property resulting from any ideas, methods, instructions or products referred to in the content. |
© 2025 by the authors. Licensee MDPI, Basel, Switzerland. This article is an open access article distributed under the terms and conditions of the Creative Commons Attribution (CC BY) license (http://creativecommons.org/licenses/by/4.0/).
Copyright: This open access article is published under a Creative Commons CC BY 4.0 license, which permit the free download, distribution, and reuse, provided that the author and preprint are cited in any reuse.


