Submitted:
16 May 2025
Posted:
16 May 2025
You are already at the latest version
Abstract
This report is on Co- and Ti-substituted M-type barium and strontium hexagonal ferrites that are reported to be single phase multiferroics due to transition from Neel type ferrimagnetic order to a spiral spin structure that is accompanied by a ferroelectric polarization in an applied magnetic field. The focus here is the nature of magnetoelectric (ME) interactions in bilayers of ferroelectric PZT and Co- and Ti-substituted BaM and SrM. The ME coupling in the ferrite-PZT bilayers arise due to the transfer of magnetostriction induced mechanical deformation in a magnetic field in the ferrite resulting in an induced electric field in PZT. Polycrystalline Co and Ti doped ferrites, Ba (CoTi)x Fe12-2xO19, (BCTx), and Sr (CoTi)x Fe12-2xO19 (SCTx) (x = 0-4) were found to be free of impurity phases free all x-values except for SCTx that had a small amount of α-Fe2O3 in the x-ray diffraction patterns for x ≤ 2.0. The magnetostriction for the ferrites increased with applied filed H to a maximum value of around 2 to 6 ppm for H ~ 5 kOe. BCTx/SCTx samples showed ferromagnetic resonance (FMR) for x = 1.5 - 2.0 and the estimated anisotropy field was on the order of 5 kOe. The magnetization increased with the amount of Co and Ti doping and it decreased rapidly with x for x > 1.0. Measurements of ME coupling strengths were done on bilayers of BCTx/SCTx platelets bonded to PZT. The bilayer was subjected to an AC and DC magnetic field H and the magnetoelectric voltage coefficient (MEVC) was measured as a function of H and frequency of the AC field. For BCTx-PZT the maximum value of MEVC at low-frequency was ~5 mV/cm Oe and a 40-fold increase at electromechanical resonance (EMR). SCTx-PZT composites also showed a similar behavior with the highest MEVC value of ~14 mV/cm Oe at low frequencies and ~200 mV/cm Oe at EMR. All the bilayers showed ME coupling for zero magnetic bias due to the magneto-crystalline anisotropy field in the ferrite that provided a built-in bias field.
Keywords:
hexagonal ferrites
; ferroelectric
; multiferroic
; magnetoelectric
; composite
1. Introduction
Ferrimagnetic hexagonal ferrites are of importance for studies on the nature of magnetic ordering and for a variety of applications for microwave and millimeters wave devices, information storage, and permanent magnets [1,2,3,4]. The unique combination of high Curie temperature, high magneto-crystalline anisotropy field, and insulating properties makes hexagonal ferrites desirable materials for these applications [5,6]. The crystal structure of hexaferrites contains cubic spinel (S-) blocks and two types of hexagonal R and T blocks. Depending on the arrangement of the S, R and/or T-blocks, the ferrites are classified into several types including, M-type (AFe12O19), W-type (AM2Fe16O27), X-type (A2M2Fe28O46), Y-type (A2M2Fe12O22), Z-type (A3M2Fe24O41), and U-type (A4M2Fe36O60), where A is a divalent alkali metal ion (Ba or Sr) and M is usually a divalent or 3d transition metal ion such as Zn, Mg, Co etc. [7].
Some of the hexaferrites showing ferrimagnetic order are reported to transition to a noncollinear spiral magnetic order under substitutions for A-type or Fe3+ions. When subjected to a moderate magnetic field they could acquire a transverse-conical spin component that facilitates a magnetic field-driven ferroelectric polarization and are therefore multiferroics [8]. This has prompted extensive investigations on the nature of coupling between the magnetic and ferroelectric orderings in the multiferroic hexagonal ferrites. Multiferroic nature in hexaferrites was first observed in Y-type Ba0.5Sr1.5Zn2Fe12O22 [9], and then in Y-type Ba2Mg2Fe12O22 [10,11,12] at low temperatures. Kitagawa et al. [13] reported on cross coupling between the ferroic orderings at room temperature in Z-type Sr3Co2Fe24O41 [14] which is a type-II multiferroic since the ferroelectricity is magnetic field driven [8]. It is important to note that for some threshold magnetic fields the spiral spin structure could become collinear, destroying the induced ferroelectric polarization.
Studies also reveal existence of a conical spin structure and ferroelectric polarization in several M-type hexagonal ferrites [15,16,17,18,19,20,21,22,23]. Neutron diffraction studies on barium ferrite, BaFe12O19 (BaM), showed evidence for conical spin structure at 1.2 K and the potential to be a type-II multiferroic at low temperatures [15]. When substitution is made at Fe site by Sc and Mg, BaM shows longitudinal conical spin structure at ~30 K [17]. Similarly, Co-Ti substituted BaM and SrM also showed conical spin structure at room temperature [16,19,20]. The coupling between the magnetic and ferroelectric subsystems in Sr(Co,Ti)xFe12-2xO19 (SCTx) x=2 studied by measuring the change in the remnant magnetization Mr under an electric field E showed a 3 % fractional change in Mr for E = 13 kV/cm. Electric field control of magnetization in Co and Ti substituted Sr-hexaferrite was reported by Wang et al., and thin films of the ferrite showed a change in magnetization under the application of a DC electric field [18]. Vittoria et. al. [23] showed that magnetoelectric coefficient of a hexaferrite best described as a tensor proportional to the product of magnetostriction and piezoelectric strain tensors.
This report is on strain mediated ME effects in Co and Ti substituted M-type ferrites and PZT. The efforts so far on multiferroic nature of M or Y-type hexaferrites is dedicated to spin induced polarization with the application of moderate magnetic field or E-induced variation in the magnetization. Since the ferrites are expected to be magnetostrictive, one anticipates a strong ME effect in their composite with a piezoelectric. Although hexaferrites have a much smaller magnetostriction λ compared to nickel ferrite or cobalt ferrite [24,25], the very high magneto-crystalline anisotropy in the hexaferrites is expected to result in a self-magnetic bias and strong ME coupling in a composite with PZT under zero external bias [26].
Results of our studies on bilayers of PZT and M-type Ba and Sr ferrites with Co and Ti substitutions, Ba(CoTi)xFe12-2xO19 (BCTx) and Sr(CoTi)xFe12-2xO19 (SCTx) (x = 0-4.0), are discussed. Vendor supplied PZT and ferrites prepared by ceramic techniques were used. Polycrystalline ferrites were characterized in terms of structural parameters by x-ray diffraction and scanning electron microscopy (SEM). Magnetization M measurements showed increase in M up to x=1.0 and then a monotonic decrease for x > 1.0. Magnetostriction was found to be significantly higher than for SrM or BaM. A large magneto-crystalline anisotropy field in the ferrites was inferred from FMR observed in samples with x > 2. Ferrite-PZT bilayers made by bonding techniques were used for studies on the direct-ME (DME) effect, i.e., the influence of magnetic fields on ferroelectric order parameters. The ME voltage coefficient (MEVC) was measured at low-frequencies and at electromechanical resonance (EMR). ME coupling under self-bias and strengthening of the coupling strengths at EMR were evident from the measurements on the bilayers. Further details are provided in the sections that follow.
2. Experiment
Polycrystalline Co- and Ti-substituted M-type hexaferrites, BCTx and SCTx (x=0-4.0, in steps of 0.5), were synthesized by traditional solid state reaction techniques. Precursor materials viz, Ba/SrCO3, CoCO3, TiO2 and Fe2O3 were mixed in a wet ballmill for 8h. The slurry was air dried and presintered at 900 °C for 6 h followed by a second ballmilling for 8 h. After drying, the powder was mixed with a binder. Disc shaped samples, 15 mm in diameter, were pressed in a die under a uniaxial pressure of 2 MPa. The final sintering was carried out in air at 1200-1250 °C for 6 h.
The crystal structure and phase purity were investigated with a powder X-ray diffractometer. The morphological features of the samples were studied using a scanning electron microscope (SEM). Magnetization of the samples as a function of magnetic field up to 5 kOe was measured at room temperature with a Faraday susceptibility balance. Magnetostriction λ was measured on thin rectangular platelets of the samples by attaching a strain gage. The in-plane λ parallel to the applied magnetic field direction was measured with a strain indicator. Ferromagnetic resonance (FMR) measurements were conducted on thin rectangular platelets of the composites. The samples were placed in an S-shaped coplanar wave guide with an external field H parallel to the plane of the sample. We used a vector network analyser to record profiles of the scattering matrix S21 vs. frequency for a series of H.
Ferrite-PZT bilayers for measurements of direct-ME effects were made by bonding vendor supplied PZT (APC-850, American Piezo Ceramics, PA, USA) with a thin layer of a two-part epoxy (M-bond 500, Vishay, USA). The ME voltage coefficient (MEVC) of the bilayer composites was measured by applying a DC field H with an electromagnet and an AC magnetic field h of frequency f generated with a pair of Helmholtz coils. The magnetic fields were parallel to each other and either parallel or perpendicular to the sample plane. The ME voltage (V) generated across PZT was measured with a lock-in-amplifier. The ME voltage coefficient MEVC = (V/t h) where t is the thickness of PZT was measured as function of H as well as the frequency f of AC field.
3. Results
3.1. Structural Characterization and Morphological Features
X-ray diffraction patterns for BCTx and SCTx are shown in Figure 1a,b, respectively. The intensity peaks for BCTx in Figure 1a were identified with the M-type hexagonal ferrite BaM (shown in the bottom pane) and did not reveal any impurity phases. For SCTx the patterns in Figure 1b (and Figure S1 in the Supplement) show, in addition to peaks due to M-type ferrite, a weak peak corresponding to α-Fe2O3 for x ≤ 2.0. Similar impurities in SrM were also reported for samples prepared by different techniques [27]. For x>2.0, however, the XRD patterns are free of any impurity phase and dilution of the Fe3+ content by Co2+ and Ti4+ may be the cause of absence of α-Fe2O3. The weight fraction of the impurity phase, α-Fe2O3, was 4.74% for SCT0.0 and 4.56% for SCT2.0. Bulk α-Fe2O3 is an antiferromagnet and the small amount of it in SCTx is unlikely to influence the magnetic order parameters of the hexaferrite [28,29].
Figure 2 shows representative SEM images of surface features for the BCTx/SCTx samples. Pure BaM/SrM (x=0.0) shows very small grains (~1 μm). Figure 2b–d for BCTx also show needle shaped grains with the grain size increasing with increasing x.
For SCTx samples, very small grains (~1 μm) are seen in Figure 2e for x=0. With increasing x, the images show both small and large grains (~15 μm) and SCTx samples have a larger grain compared to BCTx.
3.2. Magnetization
We used a Faraday susceptibility balance to measure the room-temperature magnetization M of the samples as a function of magnetic field H. Figure 3 shows the data for BCTx. Although saturation of M is expected to occur at fields as high as 20 kOe for BaM [30] the figure show M vs H M for the maximum available field of 5 kOe in our Faraday balance. In Figure 3 one observes the typical ferromagnet-like behavior with an increase in M with H for x = 0.5 and 4πM value for H = 5 kOe increases from 3.29 kG for BCT0.5 to 4.22 kG for BCT1.0. With further increase in x the magnetization shows a rapid decrease, from 3.38 kG for BCT1.5 to 0.38 for BCT2.5 that is caused by replacing Fe3+ with the dopants Co, a low magnetic moment 3d ion, and nonmagnetic Ti. For x > 1.5, the dramatic fall off in M-values is due to transition in the magnetic structure from ferrimagnetic Neel type to spiral spin structure.
Similar magnetization data for SCTx are shown in Figure 4. For SCT0.5 the M-H loop mostly overlaps with that of SCT0.0 (or pure SrM). When doping is increased to x = 1.0 a higher 4πM of 3.61 kG is measured at H = 4.5 kOe, compared to 2.54 kG at H = 4.5 kOe for SCT0.5. The site preference of the dopants, Co and Ti, causes this increase in M [31,32]. Mössbauer spectroscopy measurements have shown that Co2+ has a preference to occupy the octahedral 4f2 crystallographic site when substituted for Fe3+. The occupation of Co2+ in 4f2 sites will reduce the amount of magnetic moment directed opposite to the net moment direction causing an increase in the total magnetic moment [33]. As the doping increases the Fe sites get replaced by nonmagnetic Ti as well as magnetic Co creating a magnetic arrangement wherein net magnetic moment decreases. The contribution from α-Fe2O3 impurities for x ≤ 2.0 is insignificant as its magnetization is rather small [28].
3.3. Magnetostriction
The magnetostriction λ of BaM/SrM is rather low, ~ 1 ppm for H values on the order of 3 kOe, and the piezomagnetic coefficient q is also very small, making them not suitable for obtaining strong ME coupling in a composite with a ferroelectric [34,35]. It is to be noted that for SCTx (x ≤ 2.0) α-Fe2O3 impurities with λ~8 ppm [29] will not enhance the overall magnetostriction since its weight fraction too small (<5%). The H-dependence of λ for BCTx/SCTx samples are shown in Figure 6 (and Supplementary Figure S2). The data are for λ measured parallel to in-plane H for a rectangular platelet. For BCT0.5 λ is positive (Supplementary Figure S2). All other BCTx compositions show negative magnetostriction with no systematic variation of the magnetostriction over the composition range. The highest magnetostriction, - 6 ppm, is measured for BCT1.0 at 2.5 kOe as shown in Figure 5a. SrM shows a negative magnetostriction of -3 ppm, (Supplementary Figure S2). However, a positive magnetostriction for SrM single crystal was reported in the past [24]. With increase in the Co and Ti content λ increases to – 4 ppm for SCT3.0 at 2.5 kOe (Figure 5f).
3.4. Ferromagnetic Resonance
FMR measurements were done on thin rectangular platelets of the ferrites to determine the magnetocrystalline anisotropy. The samples were placed in an S-shaped coplanar waveguide and excited with microwave power from a VNA. With a static magnetic field H applied parallel to sample plane, profiles of the scattering matrix S21 as a function of frequency f and H were recorded. In BCTx samples FMR was observed only for a narrow composition, for x = 1.5 – 2.0, as shown in Figure 6a,b. For x < 1.0, BCTx samples showed absorption peaks for f > 40 GHz (Supplementary Figure S3) and we identified them with the excitation of a magneto-dielectric mode for the following reason. Estimates on the rate of change of the mode frequency fr with H yielded ~1.5 MHz/Oe for BCT0.5. For FMR modes, however, one expects a value close to the gyromagnetic ratio γ ~ 2.7 – 3.0 MHz/Oe [35]. The slow rate of increase in fr with H for modes above 40 GHz indicates that they are magneto-dielectric modes [36] and are not considered here for further analysis.
The FMR mode frequency fr as a function of H for BCT1.5 and BCT2.0 are plotted in Figure 6c,d, respectively. We fitted the data to the Kittel equation.
Here, H is the applied magnetic field along the sample length (x-direction), Nx, Ny and Nz are the demagnetization factors along the length, width, and thickness of the platelet, respectively, and 4πMeff = 4πM+HA, where 4πMeff is the effective magnetization of the specimen and HA is magnetocrystalline anisotropy. For estimates of HA from 4πMeff one has to use the value of 4πM at H corresponding to fr since the samples do not show saturation of M for H up to 5 kOe as seen in Figure 4. Figure 6c,d shows the fitting of mode frequency fr versus H for values for γ, 4πMeff, and HA listed in Table 1.
Similar S21 vs f profiles for SCTx (1.5≤x≤2.0) are shown in Figure 7a,b and in the supplementary Figure S4 for x < 1.5 and x > 2.0. The magnetic parameters obtained from fitting of fr vs H data for SCTx are listed in Table 1. In addition to FMR for the above x-values, magneto-dielectric modes were observed at frequencies above 40 GHz [36,37]. It is important to note here that HA is indeed an in-plane anisotropy field in the polycrystalline samples of Co and Ti substituted BaM and SrM. Single crystal SrM and BaM have uniaxial anisotropy fields of 17-18 kOe and one may infer from the in-plane HA values in Table 1 for BCTx and SCTx that a majority of the randomly oriented grains in the samples have the hexagonal c-axis perpendicular to sample plane [20,38,39]. It is also noteworthy that HA value increases with increasing x value for both BCTx and SCTx for 1.5 ≤x ≤2.0 and the highest HA = 8.02 kOe is obtained for BCT2.0.
3.5. ME Effects in Bilayers of BCTx/SCTx and PZT
The most important aspect of this report is the studies on strain mediated direct-ME effects, i.e., influence of applied magnetic fields on ferroelectric order parameters, in bilayers of the ferrites and PZT. Bilayers of ferrite-PZT were made with vendor supplied pre-poled PZT (APC PZT #850) with silver electrodes. Rectangular platelets of the ferrite (10 mm x 5 mm x 0.5 mm) were bonded to PZT (12 mm x 5 mm x 0.3 mm) with a thin layer (~ 5 μm) of a 2-part epoxy. The sample was placed in a metal box to eliminate RF and any other source of noise. A pair of Helmholtz coils inside the box was used to generate an AC magnetic field h at frequency f and an electromagnet was used to apply a static field H, with both fields parallel to each other. The ME voltage V produced across the thickness of PZT was measured with a lock-in amplifier. The magnetoelectric voltage coefficient MEVC = V/(h×t) where t is the thickness of the PZT was measured as function of H or f for the following conditions: α31 for H and h parallel to the sample length (direction 1) and V measured across PZT (direction 3) and α33 for both magnetic fields perpendicular to bilayer plane and V measured across PZT thickness.
The variation in α31 and α33 with H are shown in Figure 8 and Figure 9, respectively, for BCTx (x=0, 2.0, 4.0)-PZT for h = 1 Oe at 100 Hz. Data for other BCTx-PZT bilayers are shown in Supplementary Figure S5. Significant features in the data in Figure 8 and Figure 9 are as follows. (i) The composites show a relatively large MEVC under zero external bias, i.e., H = 0. (ii) The MEVC vs H shows hysteresis and remanence, and (iii) BCTx-PZT composites show a much smaller maximum MEVC, as much as two orders of magnitude, compared to spinel ferrite-ferroelectric composites [40].
In the case of ferromagnetic transition metals and alloys and spinel ferrites the magnetostriction λ at low H-values is proportional to M2 and both λ and q will increase slowly from near-zero value with increasing H. Therefore, MEVC which is directly proportional to q will be very small or zero for H = 0 [40]. The non-zero values of MEVC in Figure 8 and Figure 9 for BCTx-PZT could be attributed to the large HA values in the BCTx that act as a built-in magnetic bias leading to a large MEVC. It is worth noting that all the BCTx-PZT composites show zero-bias MEVC as seen in the data of Figure 8 and Figure 9 (and Supplementary Figure S5). There is also asymmetry in the MEVC vs H data except for α31 for BCT2.0-PZT (Figure 8c) that also has the highest MEVC ~ 5.7 mV/cm Oe. One anticipates a smaller α33 compared to α31 due to demagnetization associated with DC and AC magnetic fields perpendicular to the bilayer plane. However, the data in Figure 8 and Figure 9 do not indicate the expected weakening in the magnitude of α33.
Results of similar MEVC vs H data for bilayers of SCTx-PZT are shown in Figure 10 and Figure 11. The bilayer of SCT0.0-PZT shows monotonically increasing α31with H (Figure 10a) and an almost constant, H-independent α33 as seen in the data of Figure 11a. The MEVC values for SCT0.0-PZT are higher than reported values for bilayers of single crystalline SrM and PZT [24]. For the SCT2.0-PZT α31 increases with H to a maximum of 14 mV/cm Oe, the highest value for the bilayers studied in this work (Figure 10b and Supplementary Figure S6). The large piezomagnetic coefficient q of SCT2.0 results in the highest MEVC for SCT2.0-PZT bilayer. Data on α33 vs. H in Figure 11b shows a decrease in the MEVC value compared α31 due to demagnetization effects for out-of-plane magnetic fields. All of the SCTx-PZT show a similar lowering of α33 values with respect to their α31 value, (Supplementary Figure S6).
Studies on the dependence of MEVC on the frequency f of the AC magnetic field is important since one expects significant enhancement in the MEVC values when f coincides with the frequency of the acoustic resonance modes [40]. We carried out MEVC measurement at the electromechanical resonance (EMR) in the BCTx/SCTx-PZT samples. The EMR mode frequencies were first measured by f-dependence of the capacitance of the bilayer with an LCR meter. Then the MEVC α31 of the bilayers was measured as a function of f in the vicinity of the EMR for each sample. A bias magnetic field corresponding to the maximum in low-frequency MEVC was applied during these measurements. Data on α31 vs f for BCTx/SCTx-PZT bilayers are shown in Figure 12 (and in Supplementary Figure S7). A significant enhancement of MEVC compared to low-frequency values was measured for all the samples. Among the BCTx-PZT bilayers the highest MEVC of 205 mV/cm Oe at EMR was measured for BCT0.5-PZT and is a factor of 40 higher than for the low-frequency α31. Similarly, among the SCTx-PZT bilayers the highest MEVC of 204 mV/cm Oe at EMR was measured for SCT2.0-PZT. The enhancement of MEVC at EMR is more prominent in SCTx-PZT samples than BCTx-PZT samples as seen in the Supplementary Figure S7. The maximum values of MEVC at low-frequency and at EMR are shown in the Supplementary Figure S8.
4. Discussion
It is well established that Co and Ti doped BaM and SrM with conical spin structure are multiferroic showing cross coupling between the magnetic and ferroelectric subsystems [8]. The primary focus of this study was to investigate the ME coupling arising due to magnetostriction induced mechanical deformation in applied magnetic fields in composites of PZT and Co-Ti substituted BaM/SrM. Incorporation of the Co and Ti in BaM/SrM does not in most cases lead to impurity phases, except for in SCTx for x < 2.0 with less than 5 wt.% of α-Fe2O3. The polycrystalline samples are found to have a uniaxial magnetocrystalline anisotropy field HA for x < 2.0 and an in-plane HA for higher x-values. The large uniaxial anisotropy (>15 kOe) in single crystal BaM and SrM [3] reduces to an in-plane HA in polycrystalline BCTx/SCTx for x > 2.0. This reduction in anisotropy is also evident in the magnetisation 4πM vs. H data in Figure 4. Within the limited range of H-values there is an ease for M to reach towards saturation as x is increased from BCT0.0/SCT0.0 to BCT4.0/SCT4.0.
Samples of BCTx/SCTx show only a moderate value of magnetostriction, much smaller than for bilayers of PZT and spinel ferrites such as nickel ferrite (NFO) or cobalt ferrite (CFO), but higher than for samples with BaM or SrM. Thus, the overall strengths of the direct-ME coupling in bilayers of BCTx/SCTx with PZT are one to two orders of magnitude smaller than for NFO/CFO-PZT [40], but a large magneto-crystalline anisotropy field gives rise to significant zero-bias MEVC in BCTx/SCTx-PZT. At frequencies corresponding to longitudinal acoustic modes, MEVC values show enhancement by a factor of 40 or so compared to low-frequency values. Since the ME effect in composites arises from the mechanical coupling between the piezoelectric and magnetic phases, the ME response can be significantly amplified when the piezoelectric component experiences resonance, particularly electromechanical resonance [40]. Guerra et al. [42] have reported on particulate composites comprising BaM and PZT and an MEVC of ~95 mV/cm Oe near EMR whereas our samples show twice the value. Single crystal SrM-PZT bilayer was reported to show MEVC ~5 mV/cm Oe around 3 kOe [24], much smaller than for our SCTx-PZT samples.
The origin of magnetic control of ferroelectricity in doped multiferroic BaM and SrM is well established but the nature of strong of magneto-crystalline anisotropy and moderate magnetostriction in polycrystalline samples of Co-Ti substituted BaM/SrM need to be understood. Key finding of this study on BCTx/SCTx-PZT are the ME coupling under zero external bias and MEVC as high as ~200 mV/cm Oe at EMR mode frequencies. In this regard studies on HA and magnetostriction for Co/Ti doping higher than 4.0 in BaM/SrM is of interest for enhancing the strengths of ME coupling at low-frequencies and at EMR and also strengthening the zero-bias ME effects.
5. Conclusions
The nature of magneto-electric interactions has been studied in bilayers of Co-Ti substituted M-type barium and strontium hexagonal ferrites and PZT. Even though BCTx and SCTx are single phase multiferroics showing coupling between magnetic and ferroelectric order parameters, studies on ME coupling due to magnetostriction in the ferrites and piezoelectric effects in PZT had not been addressed so far. Samples of BCTx prepared by solid state reaction techniques are free of impurity phases, whereas minor amount of α-Fe2O3 phase was present in SCTx only for x < 2.0. SEM images show small, irregular shaped grains and needles like structures and an increase in the grain size was observed with increase in x. Magnetostriction at room temperature values for H up to 5 kOe were much higher than reported values for single crystal BaM and SrM. Magnetization data for H up to 5 kOe indicated an initial increase M with x up to 1.0, but a sharp decrease in M was measured for higher x-values. The magneto-crystalline anisotropy of the samples estimated by FMR revealed a switch from out-of-plane to in-plane HA as the amount of Co-Ti substitution was increased with an in-plane HA of 5 kOe for SCT1.5 and 2.0. Low-frequency and resonance ME voltage coefficient measurements were done on bilayers of BCTx/SCTx-PZT. The maximum values of low-frequency MEVC ranged from a minimum of 2 mV/cm Oe to a maximum of 14 mV/cm Oe, and are two orders of magnitude smaller than for spinel ferrite-PZT composites. A key observation in this study is the zero-bias field ME effects that could be attributed to a large HA in the ferrites that acts as a built-in bias. The MEVC was as high as 200 mV/cm Oe when the frequency of the AC magnetic field coincides with acoustic resonance modes in the composites.
Supplementary Materials
The following supporting information can be downloaded at the website of this paper posted on Preprints.org. Figure S1. Rietveld refinement of the XRD pattern of (a) SCT0.0 and (b) SCT2.0. Both the systems contain hexagonal M-type ferrite phase with P63/mmc space group symmetry (shown in green Braggs’ positions) and α-Fe2O3 phase with R-3c space group symmetry (shown in purple Braggs’ positions). Figure S2. Magnetic field dependence of the magnetostriction of (a) BCTx and (b) SCTx samples. Figure S3. S21 vs. f profiles of different BCTx samples at selected magnetic fields. Figure S4. S21 vs. f profiles of different SCTx samples at selected magnetic fields. Figure S5. MEVC for BCTx-PZT bilayers for in-plane and out of plane magnetic fields. Figure S6. MEVC for SCTx-PZT bilayers for in-plane and out of plane magnetic fields. Figure S7. MEVC plots of (a) BCTx-PZT and (b) SCTx-PZT bilayer composite samples as a function of frequency near EMR. In the inset of (b) the variation of the capacitance of PZT layer attached to the SCT2.0-PZT bilayer is shown. Figure S8. Zero-bias MEVC, MEVC at EMR and maximum achievable MEVC in field scan for SCTx-PZT bilayer composites. Table S1. Fitting parameters of the FMR absorption for BCTx and SCTx samples.
Author Contributions
S.S., S.A., S.M., and R.B. were involved in sample synthesis and structural, magnetic, and magneto-electric characterization. S.S., M.R.P., M.J., and G.S. contributed to data analysis, manuscript preparation, project management, and funding acquisition. All authors have read and agreed to the published version of the manuscript.
Data Availability Statement
All data generated or analyzed during this study are included in this published article [and its Supplementary Information Files].
Acknowledgments
The research at Oakland University was supported by grants from the National Science Foundation (ECCS-2415328, ECCS-EAGER-2236879) and the Air Force Research Laboratory (Award No. FA9550-23RXCOR001). Efforts at the University of Connecticut were supported by the NSF (ECCS-EAGER-2236879). The research at AFRL was supported by a grant from the Air Force Office of Scientific Research (AFOSR Award No. FA9550-23RXCOR001).
Conflicts of Interest
There are no conflicts of interest.
References
- Tkachenko, M.V.; Ol’khovik, L.P.; Kamzin, A.S. Magnetic ceramics based on hydroxyapatite modified by particles of M-type hexagonal ferrite for medical applications. Phys. Solid State 2011, 53, 1588–1593. [Google Scholar] [CrossRef]
- Belous, A.G.; Solovyova, E.D.; Solopan, S.O.; Yelenich, O.V.; Bubnovskaya, L.N.; Osinsky, S.P. Properties and potential applications of ferromagnetic nanostructures in medicine and microwave engineering. Solid State Phenomena 2015, 230, 95–100. [Google Scholar] [CrossRef]
- Pullar, R.C. Hexagonal ferrites: a review of the synthesis, properties and applications of hexaferrite ceramics. Progr. Mater. Sci. 2012, 57, 1191–1334. [Google Scholar] [CrossRef]
- Wohlfarth, E.P. (Ed.) Ferromagnetic Materials, North-Holland Publishing Company: Amsterdam, Netherlands, 1980; Volume 2.
- Smit, J.; Wijn, H.P.J. Ferrites; Phillips Technical Library: Eindhoven, Netherlends, 1959. [Google Scholar]
- Sugimoto, M. The past, present, and future of ferrites. J. Am. Ceram. Soc. 1999, 82, 269–280. [Google Scholar] [CrossRef]
- Brawn, R.B. The crystal structure of a new group of ferromagnetic compounds. Philips Res. Rep. 1957, 12, 491–548. [Google Scholar]
- Kimura, T. Magnetoelectric hexaferrites. Annu. Rev. Condens. Matter Phys. 2012, 3, 93–110. [Google Scholar] [CrossRef]
- Kimura, T.; Lawes, G.; Ramirez, A.P. Electric polarization rotation in a hexaferrite with long-wavelength magnetic structures. Phys. Rev. Lett. 2005, 94, 137201. [Google Scholar] [CrossRef]
- Ishiwata, S.; Taguchi, Y.; Murakawa, H.; Onose, Y.; Tokura, Y. Low-magnetic-field control of electric polarization vector in a helimagnet. Science 2008, 319, 1643–1646. [Google Scholar] [CrossRef]
- Taniguchi, K.; Abe, N.; Ohtani, S.; Umetsu, H.; Arima, T.H. Ferroelectric polarization reversal by a magnetic field in multiferroic Y-type hexaferrite Ba2Mg2Fe12O22. Appl. Phys. Express 2008, 1, 031301. [Google Scholar] [CrossRef]
- Ishiwata, S.; Okuyama, D.; Kakurai, K.; Nishi, M.; Taguchi, Y.; Tokura, Y. Neutron diffraction studies on the multiferroic conical magnet Ba2Mg2Fe12O22. Phys. Rev. B 2010, 81, 174418. [Google Scholar] [CrossRef]
- Kitagawa, Y.; Hiraoka, Y.; Honda, T.; Ishikura, T.; Nakamura, H.; Kimura, T. Low-field magnetoelectric effect at room temperature. Nat. Mater. 2010, 9, 797–802. [Google Scholar] [CrossRef]
- Soda, M.; Ishikura, T.; Nakamura, H.; Wakabayashi, Y.; Kimura, T. Magnetic Ordering in Relation to the Room-Temperature Magnetoelectric Effect of Sr3Co2Fe24O41. Phys. Rev. Lett. 2011, 106, 087201. [Google Scholar] [CrossRef] [PubMed]
- Kumar, K.; Mishra, S.K.; Singh, S.; Baev, I.; Martins, M.; Orlandi, F.; Manuel, P.; Pandey, D. Evidence for Conical Magnetic Structure in M-Type BaFe12O19 Hexaferrite: A Combined Single-Crystal X-ray Magnetic Circular Dichroism and Neutron Diffraction Study. Phys. Status Solidi (RRL) 2021, 15, 2000506. [Google Scholar] [CrossRef]
- Ebnabbasi, K.; Mohebbi, M.; Vittoria, C. Room temperature magnetoelectric effects in bulk poly-crystalline materials of M-and Z-type hexaferrites. J. Appl. Phys. 2013, 113, 17C703. [Google Scholar] [CrossRef]
- Aleshko-Ozhevskii, O.P.; Sizov, R.A.; Cheparin, V.P.; Yazmin, I.I. Helicoidal Antiphase Spin Ordering in Hexagonal Ferrites with Magnetoplumbite Structure. J. Exp. Theor. Phys. Lett. 1968, 7, 207. [Google Scholar]
- Wang, L.; Wang, D.; Cao, Q.; Zheng, Y.; Xuan, H.; Gao, J.; Du, Y. Electric control of magnetism at room temperature. Sci. Rep. 2012, 2, 223. [Google Scholar] [CrossRef]
- Batlle, X.; Obradors, X.; Rodríguez-Carvajal, J.; Pernet, M.; Cabanas, M.V.; Vallet, M. Cation distribution and intrinsic magnetic properties of Co-Ti-doped M-type barium ferrite. J. Appl. Phys. 1991, 70, 1614–1623. [Google Scholar] [CrossRef]
- Kreisel, J.; Vincent, H.; Tasset, F.; Pate, M.; Ganne, J.P. An investigation of the magnetic anisotropy change in BaFe12-2xTixCoxO19 single crystals. J. Magn. Magn. Mater. 2001, 224, 17–29. [Google Scholar] [CrossRef]
- Feng, M.; Shao, B.; Wu, J.; Zuo, X. Ab initio study on magnetic anisotropy change of SrCoxTixFe12-2xO19. J. Appl.Phys. 2013, 113, 17D909. [Google Scholar] [CrossRef]
- Zare, S.; Izadkhah, H.; Vittoria, C. Magnetoelectric hexaferrite thin film growth on oxide conductive layer for applications at low voltages. J. Magn. Magn. Mater. 2016, 412, 255–258. [Google Scholar] [CrossRef]
- Vittoria, C.; Somu, S.; Widom, A. Tensor properties of the magnetoelectric coupling in hexaferrites. Phys. Rev. B 2014, 89, 134413. [Google Scholar] [CrossRef]
- Mathe, V.L.; Srinivasan, G.; Balbashov, A.M. Magnetoelectric effects in bilayers of lead zirconate titanate and single crystal hexaferrites. Appl. Phys. Lett. 2008, 92, 122505. [Google Scholar] [CrossRef]
- Cullity, B.D.; Graham, C.D. Introduction to Magnetic Materials; John Wiley & Sons, Inc.: Hoboken, NJ, USA, 2009. [Google Scholar]
- Saha, S.; Acharya, S.; Popov, M.; Sauyet, T.; Pfund, J.; Bidthanapally, R.; Jain, M.; Page, M.R.; Srinivasan, G. A Novel Spinel Ferrite-Hexagonal Ferrite Composite for Enhanced Magneto-Electric Coupling in a Bilayer with PZT. Sensors 2023, 23, 9815. [Google Scholar] [CrossRef] [PubMed]
- Jing, Y.; Jia, L.; Zheng, Y.; Zhang, H. Hydrothermal synthesis and competitive growth of flake-like M-type strontium hexaferrite. RSC Adv. 2019, 9, 33388–33394. [Google Scholar] [CrossRef]
- Bødker, F.; Hansen, M.F.; Koch, C.B.; Lefmann, K.; Mørup, S. Magnetic properties of hematite nanoparticles. Phys. Rev. B 2000, 61, 6826. [Google Scholar] [CrossRef]
- Urquhart, H.M.; Goldman, J.E. Magnetostrictive effects in an antiferromagnetic hematite crystal. Phys. Rev. 1956, 101, 1443. [Google Scholar] [CrossRef]
- Hu, Z.; Stenning, G.B.; Koval, V.; Wu, J.; Yang, B.; Leavesley, A.; Wylde, R.; Reece, M.J.; Jia, C.; Yan, H. Terahertz faraday rotation of SrFe12O19 hexaferrites enhanced by Nb doping. ACS Appl. Mater. Interfaces 2022, 14, 46738–46747. [Google Scholar] [CrossRef]
- Liu, C.; Kan, X.; Hu, F.; Liu, X.; Feng, S.; Hu, J.; Wang, W.; Rehman, K.M.U.; Shezad, M.; Zhang, C.; et al. Characterizations of magnetic transition behavior and electromagnetic properties of Co-Ti co-substituted SrM-based hexaferrites SrCoxTixFe12-2xO19 compounds. J. Alloys Compd. 2019, 784, 1175–1186. [Google Scholar] [CrossRef]
- Lechevallier, L.; Le Breton, J.M.; Teillet, J.; Morel, A.; Kools, F.; Tenaud, P. Mössbauer investigation of Sr1-xLaxFe12-yCoyO19 ferrites. Phys. B: Condens. Matter 2003, 327, 135–139. [Google Scholar] [CrossRef]
- Williams, J.M.; Adetunji, J.; Gregori, M. Mössbauer spectroscopic determination of magnetic moments of Fe3+ and Co2+ in substituted barium hexaferrite, Ba(Co,Ti)xFe(12-2x) O19. J. Magn. Magn. Mater. 2000, 220, 220–124. [Google Scholar] [CrossRef]
- Kuntsevich, S.P.; Mamalai, Y.A.; Palekhin, V.P. Fiz. Tverd. Tela Leningrad. 1980; 22, 2192. [Google Scholar]
- Ustinov, A.B.; Tatarenko, A.S.; Srinivasan, G.; Balbashov, A.M. Al substituted Ba-hexaferrite single-crystal films for millimeter-wave devices. J. Appl. Phys. 2009, 105, 023908. [Google Scholar] [CrossRef]
- Sheen, J. Comparisons of microwave dielectric property measurements by transmission/reflection techniques and resonance techniques. Meas. Sci. Technol. 2009, 20, 042001. [Google Scholar] [CrossRef]
- De Bitetto, D.J. Anisotropy fields in hexagonal ferrimagnetic oxides by ferrimagnetic resonance. J. Appl. Phys. 1964, 35, 3482–3487. [Google Scholar] [CrossRef]
- Zhuravlev, V.A.; Naiden, E.P.; Shestakov, A.S.; Erkaev, P.V. Ferromagnetic Resonance Spectra in Hexaferrites of Sr(CoxTix)Fe12-2xO19 System Obtained by the SHS Method. Russ. Phys. J. 2013, 55, 1229–1231. [Google Scholar] [CrossRef]
- Sánchez, Y.; Briceño, S.; Larionova, J.; Long, J.; Guari, Y.; Silva, P. Temperature dependence of the ferromagnetic resonance (FMR) for MnxCo1-xFe2O4 (0≤x≤1) nanoparticles. J. Mater. Res. 2021, 36, 3329–3338. [Google Scholar] [CrossRef]
- Nan, C.W.; Bichurin, M.I.; Dong, S.; Viehland, D.; Srinivasan, G. Multiferroic magnetoelectric composites: Historical perspective, status, and future directions. J. Appl. Phys. 2008, 103, 031101. [Google Scholar] [CrossRef]
- Saha, S.; Acharya, S.; Popov, M.; Sauyet, T.; Pfund, J.; Bidthanapally, R.; Jain, M.; Page, M.R.; Srinivasan, G. A Novel Spinel Ferrite-Hexagonal Ferrite Composite for Enhanced Magneto-Electric Coupling in a Bilayer with PZT. Sensors 2023, 23, 9815. [Google Scholar] [CrossRef]
- Guerra, J.D.; Betal, S.; Pal, M.; Garcia, J.E.; Oliveira, A.J.; M'Peko, J.C.; Hernandes, A.C.; Guo, R.; Bhalla, A.S. Magnetoelectric response in (1-x)PbZr0.65Ti0.35O3-xBaFe12O19 multiferroic ceramic composites. J. Am. Ceram. Soc. 2015, 98, 1542–1547. [Google Scholar] [CrossRef]
Figure 1.
X-ray diffraction patterns for (a) BCTx and (b) SCTx. The stick patterns for BaM (blue) is shown in the bottom pane of (a). Patterns for SrM (green) and α-Fe2O3 (red) are shown in the bottom pane of (b). Peaks of α-Fe2O3 in SCTx for x≤2.0 are denoted by the asterisk symbol in (b).
Figure 1.
X-ray diffraction patterns for (a) BCTx and (b) SCTx. The stick patterns for BaM (blue) is shown in the bottom pane of (a). Patterns for SrM (green) and α-Fe2O3 (red) are shown in the bottom pane of (b). Peaks of α-Fe2O3 in SCTx for x≤2.0 are denoted by the asterisk symbol in (b).
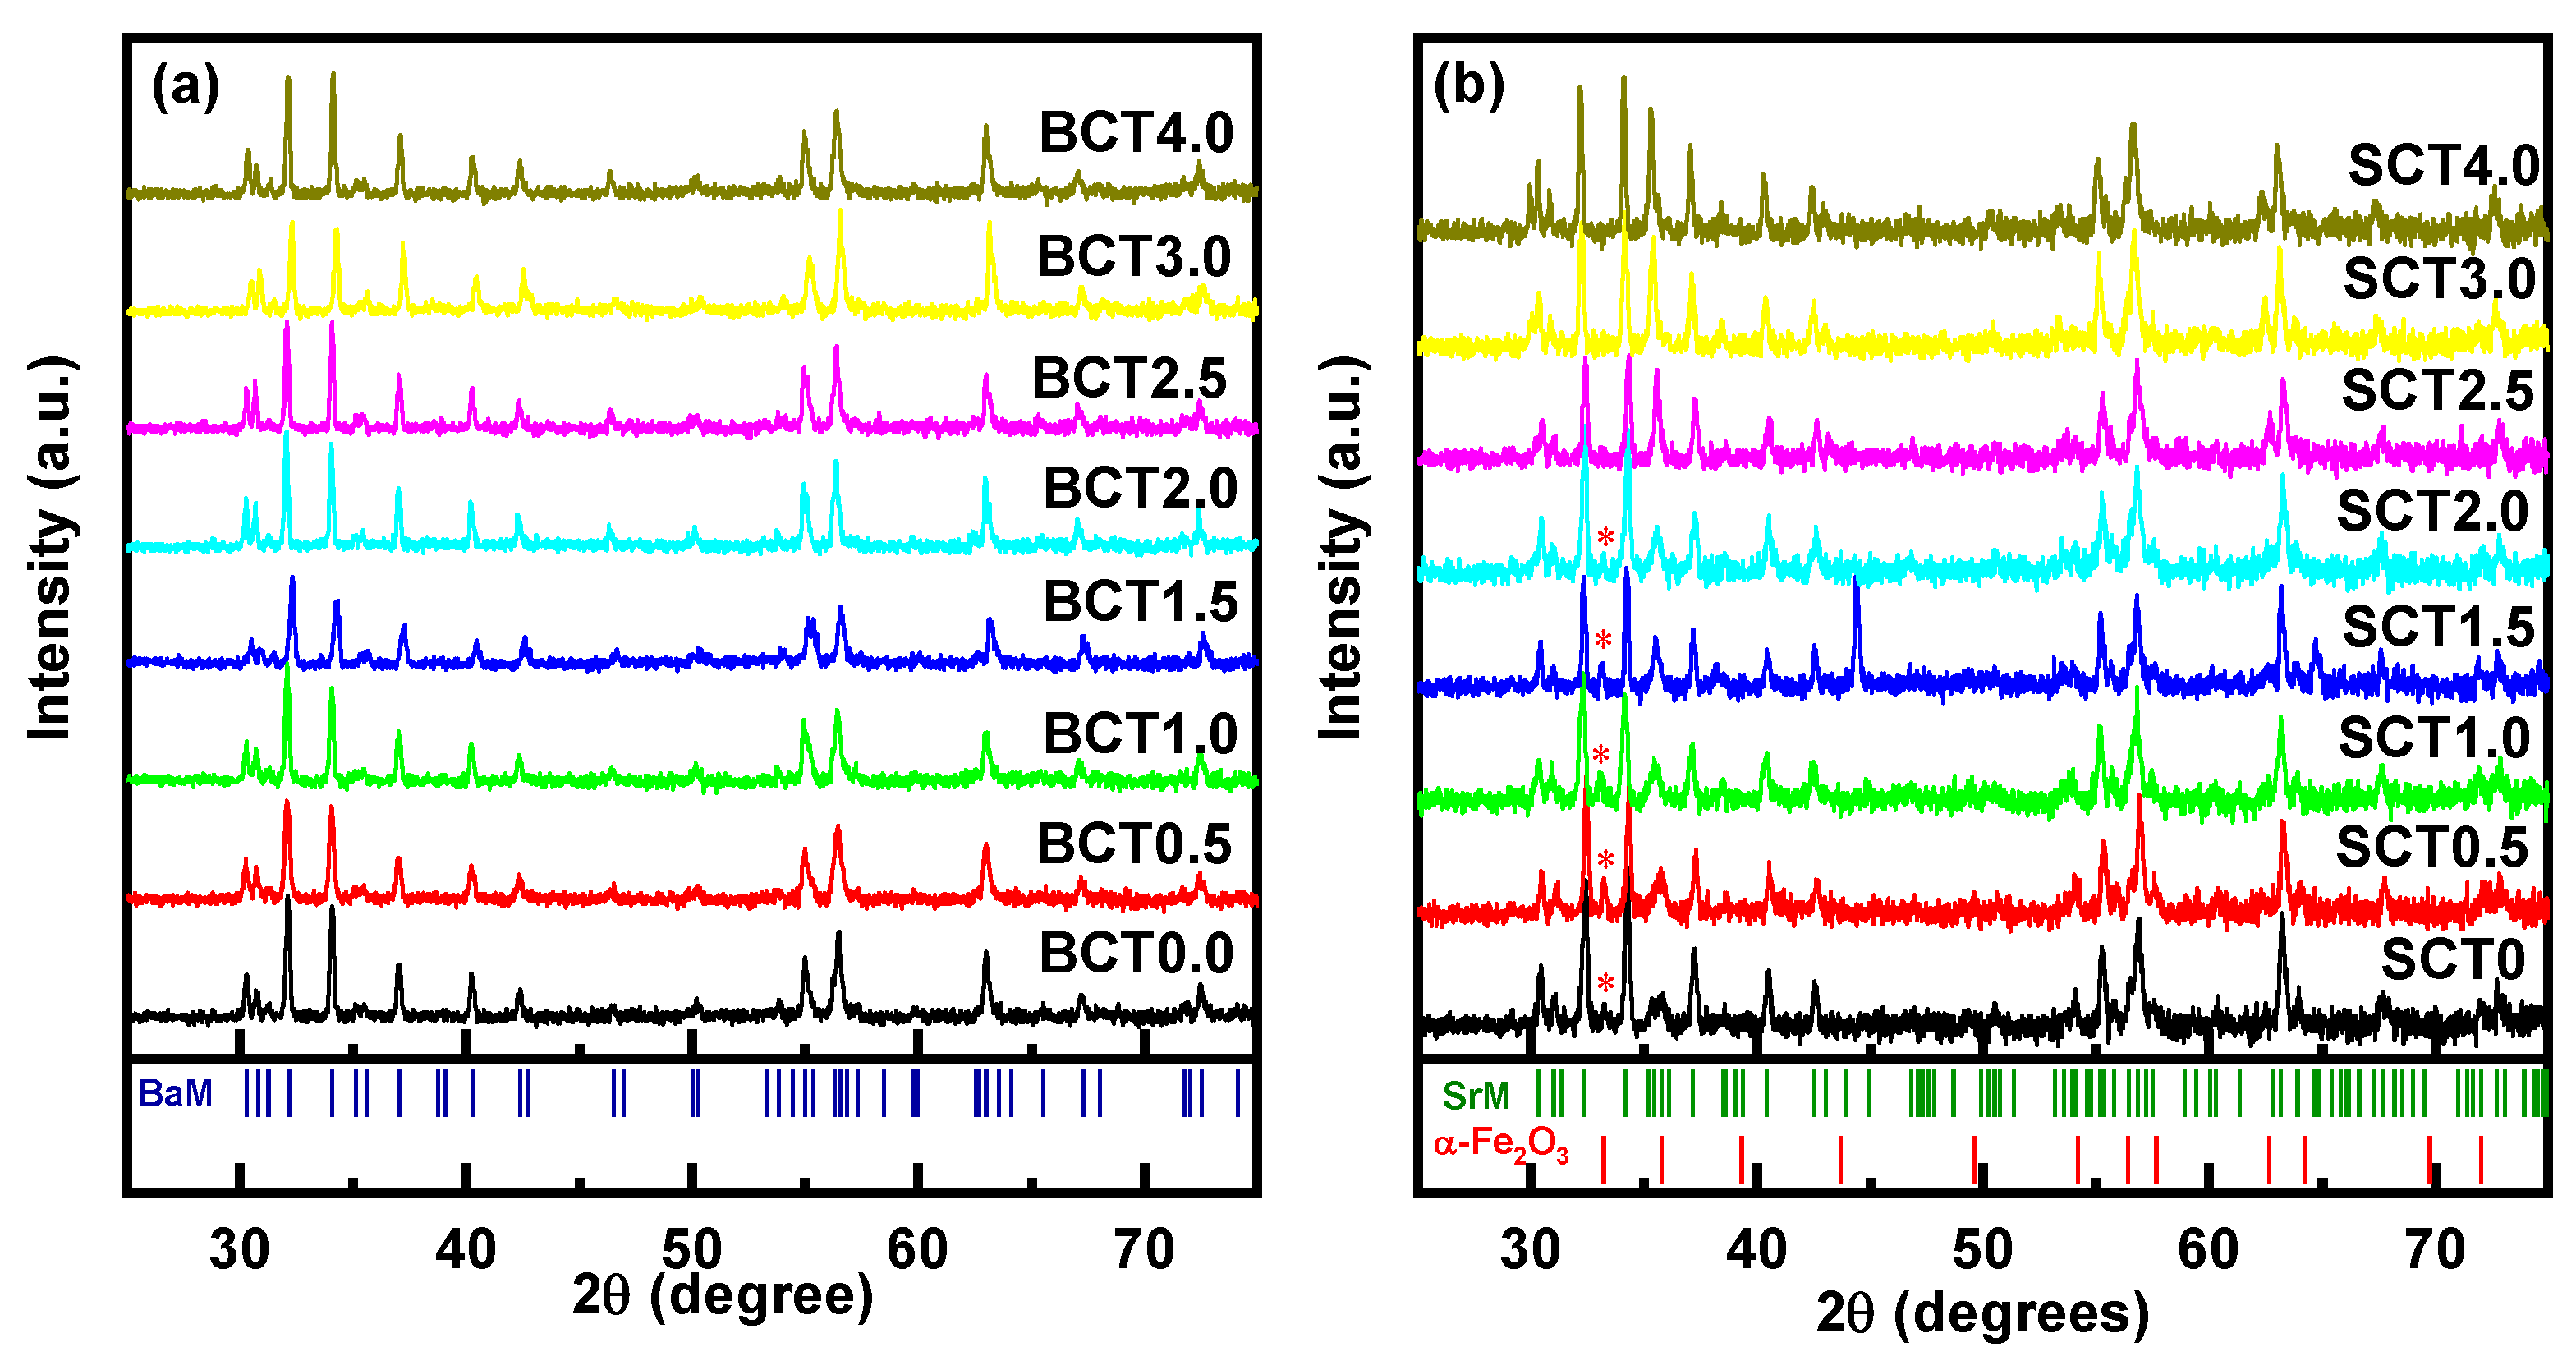
Figure 2.
SEM images of grains in (a–d) for polycrystalline BCTx and (e–h) for SCTx (x=0.0,1.0, 2.0 and 4.0).
Figure 2.
SEM images of grains in (a–d) for polycrystalline BCTx and (e–h) for SCTx (x=0.0,1.0, 2.0 and 4.0).
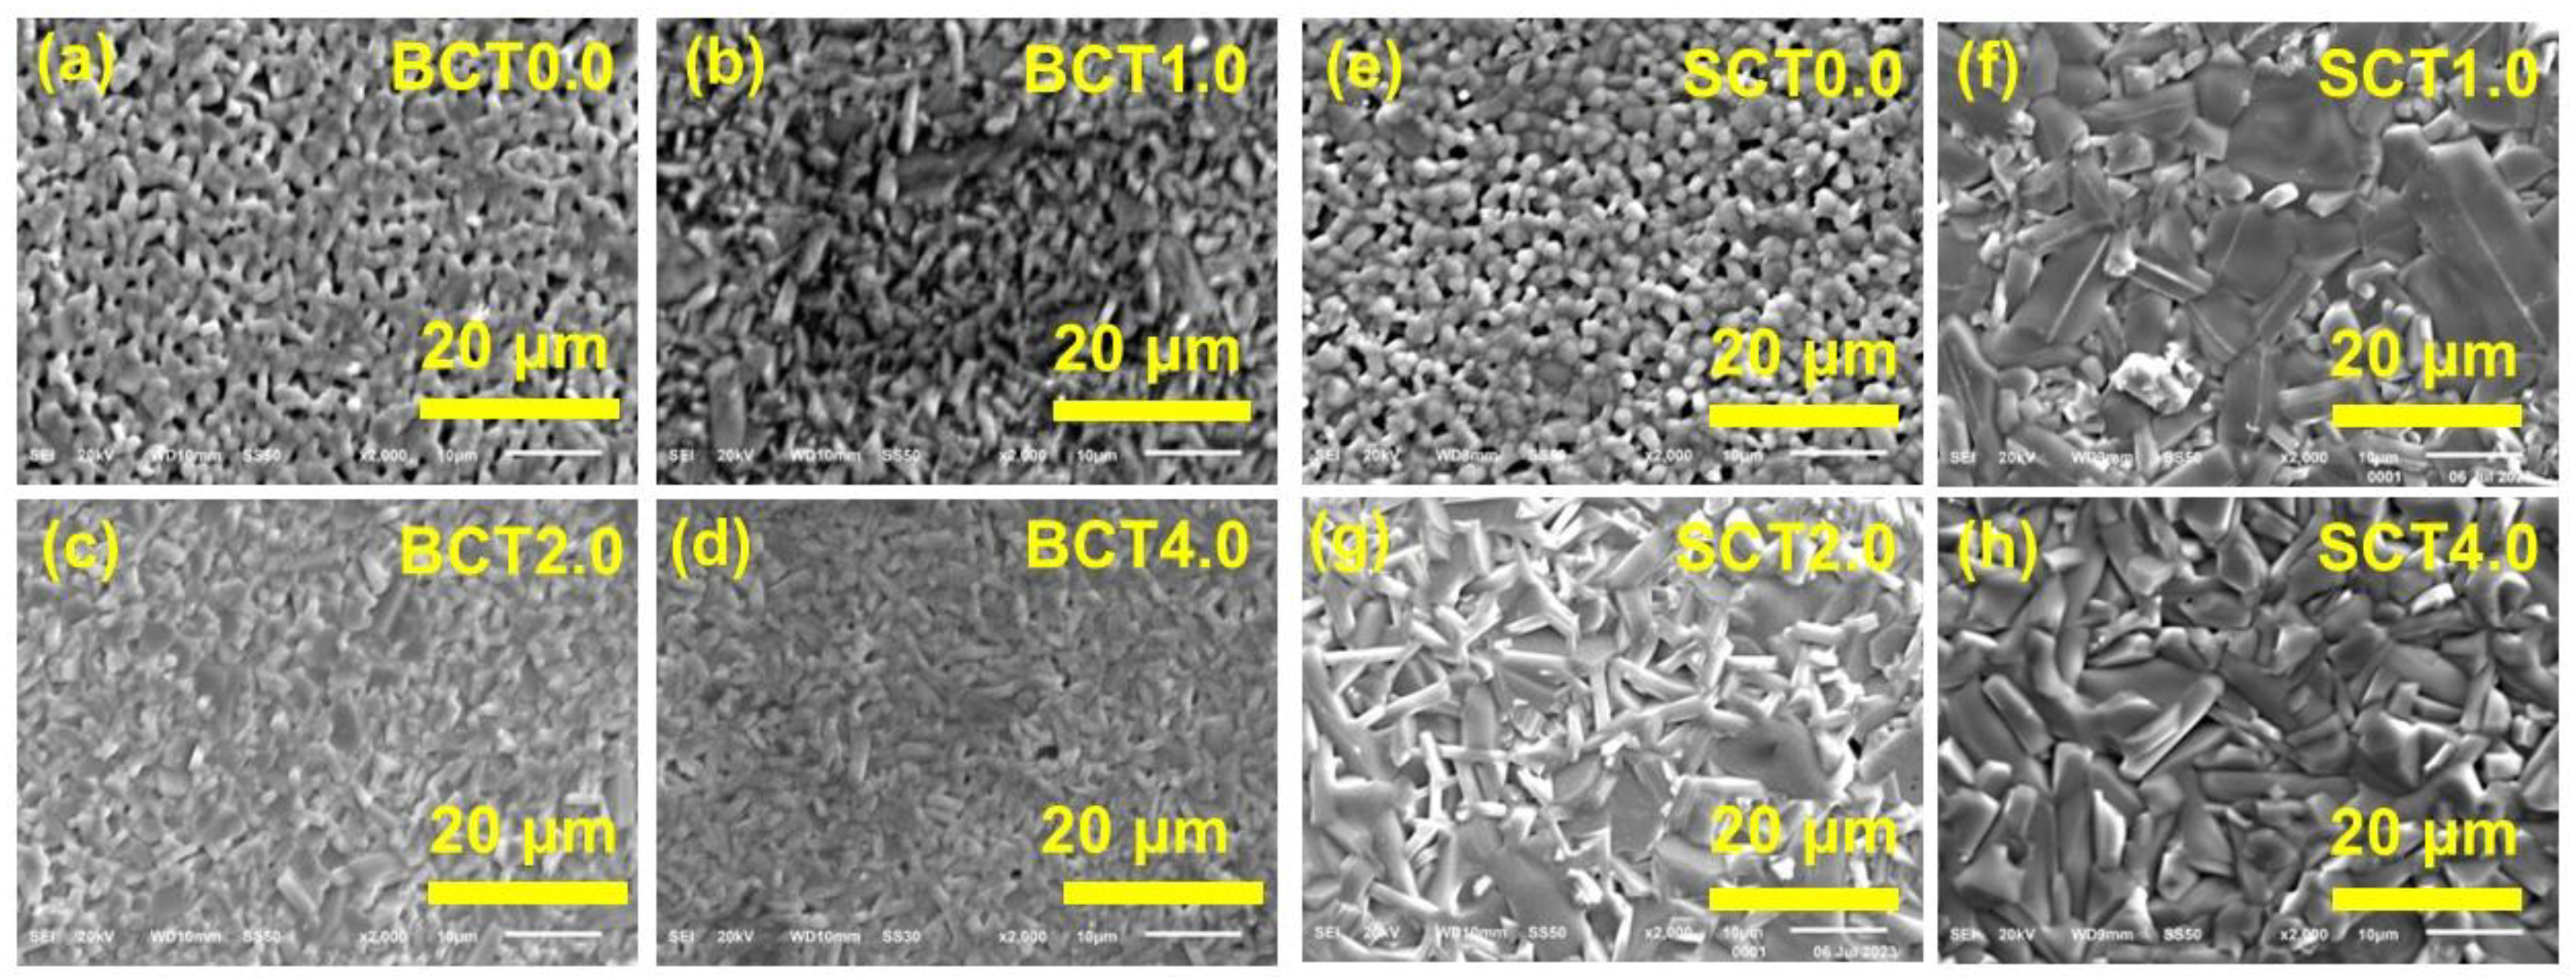
Figure 3.
Magnetization 4πM vs. H data for BCTx for x = 0.5-1.5 (left) and x = 2.0-4.0 (right).
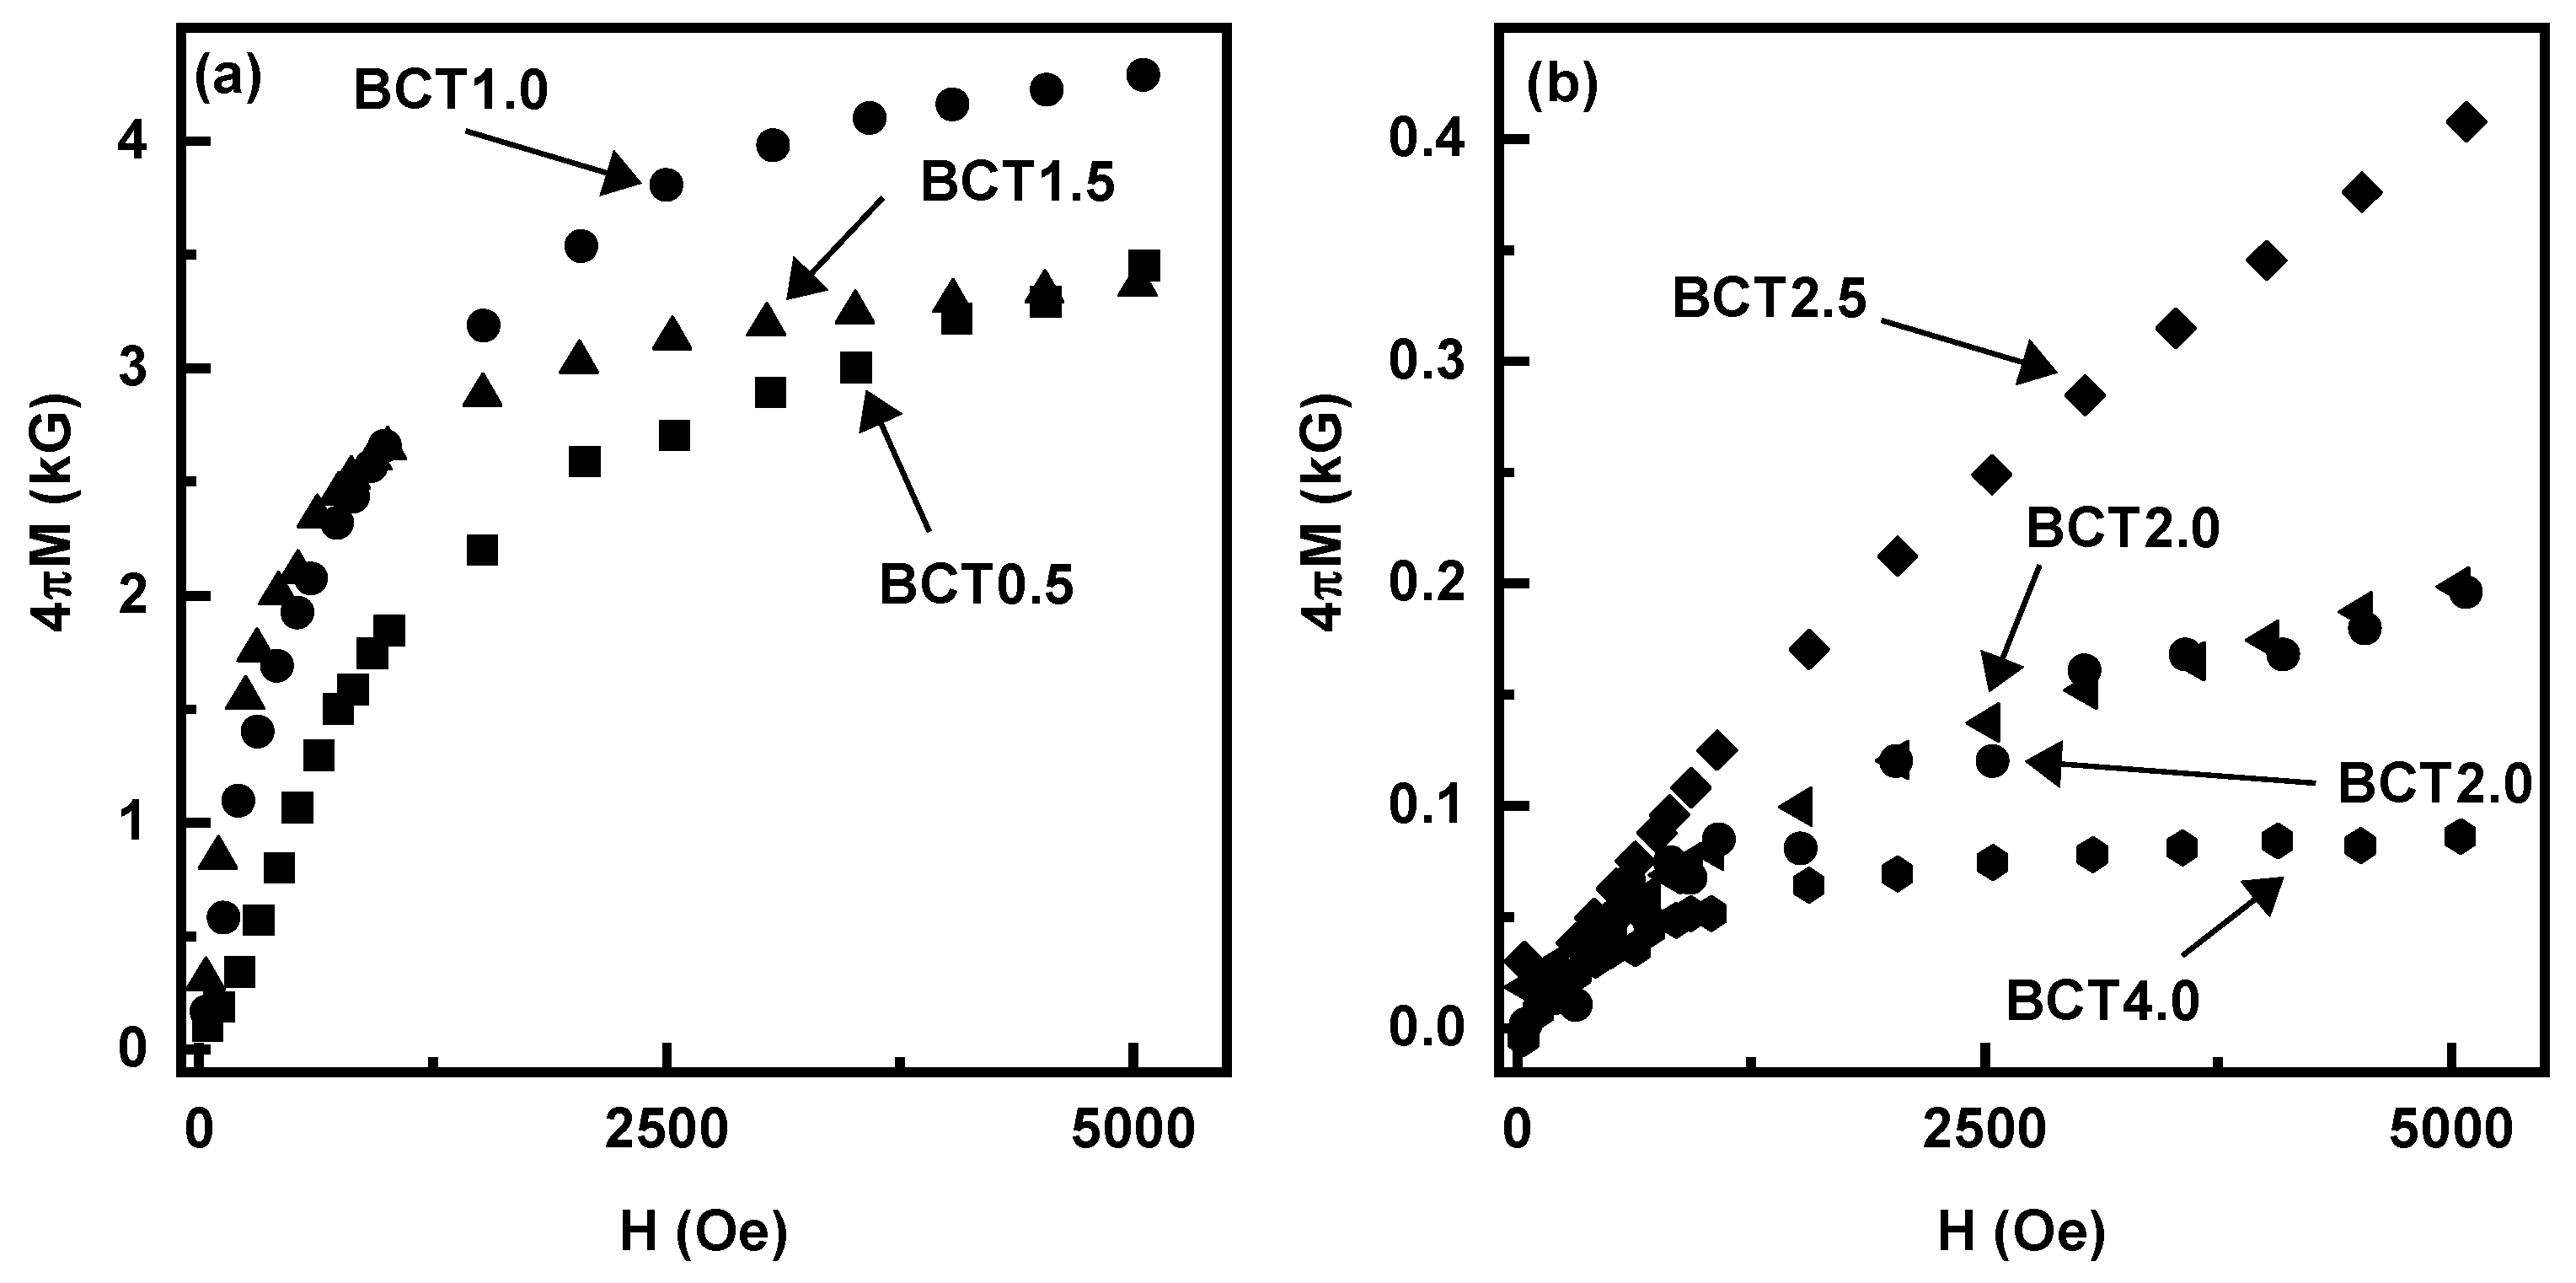
Figure 4.
Magnetization 4πM vs. H curves for SCTx for x = 0.5-4.0.
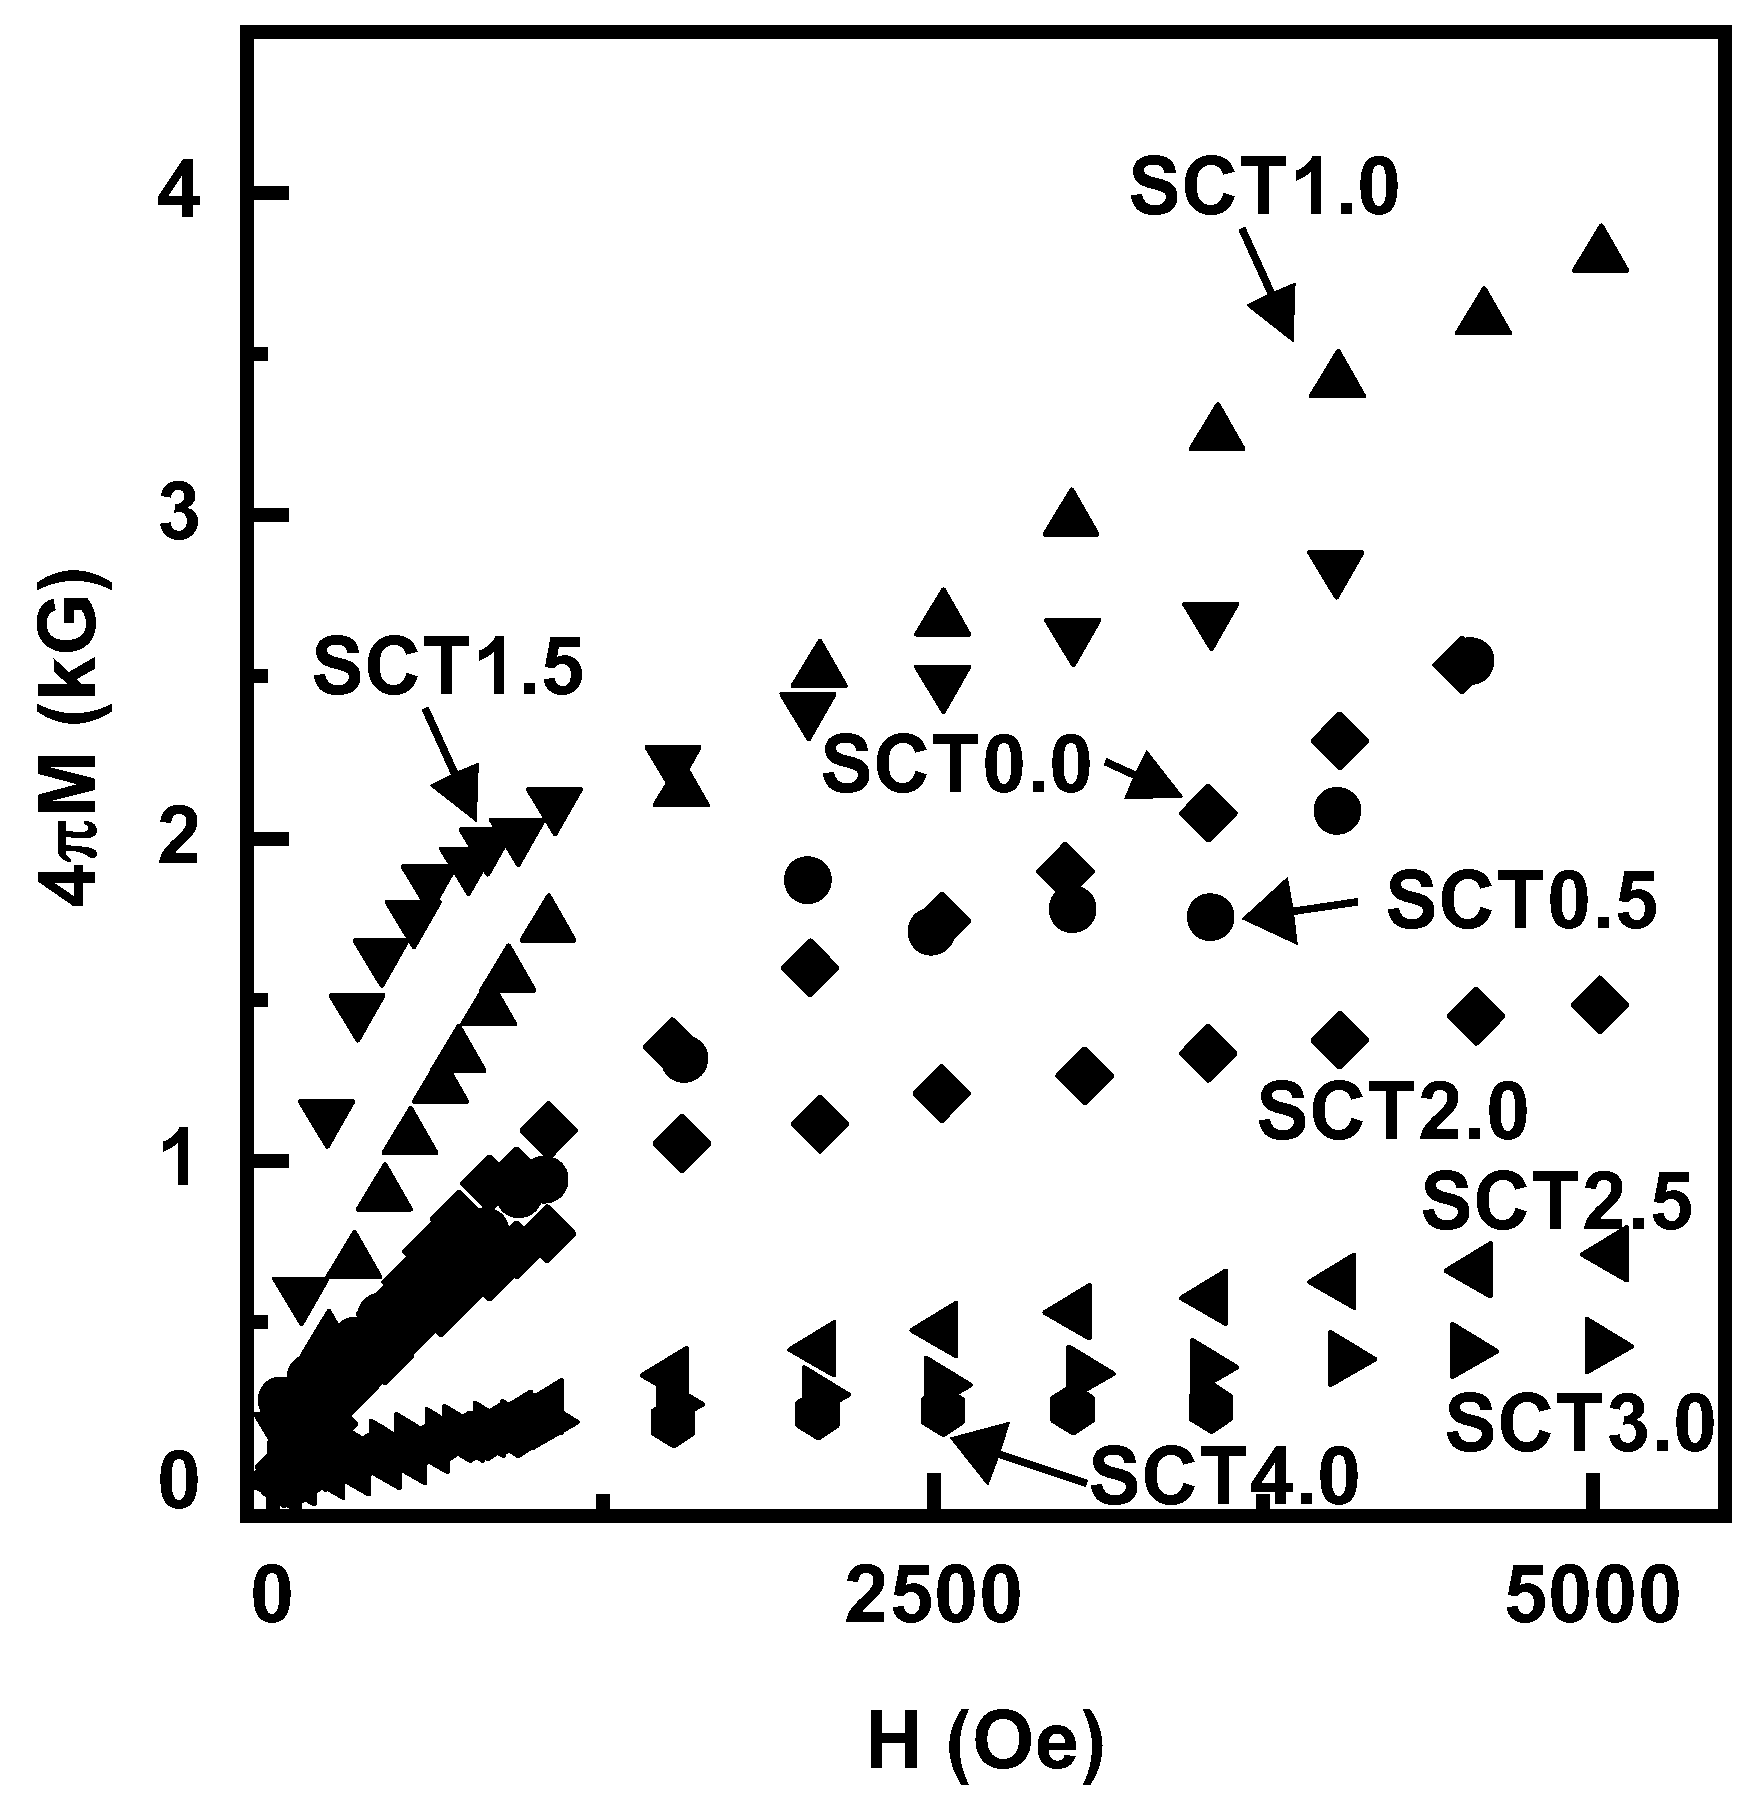
Figure 5.
Magnetostriction vs. H for (a–c) BCTx and (d–f) SCTx samples. The data are for measurements parallel to the applied in-plane magnetic field.
Figure 5.
Magnetostriction vs. H for (a–c) BCTx and (d–f) SCTx samples. The data are for measurements parallel to the applied in-plane magnetic field.
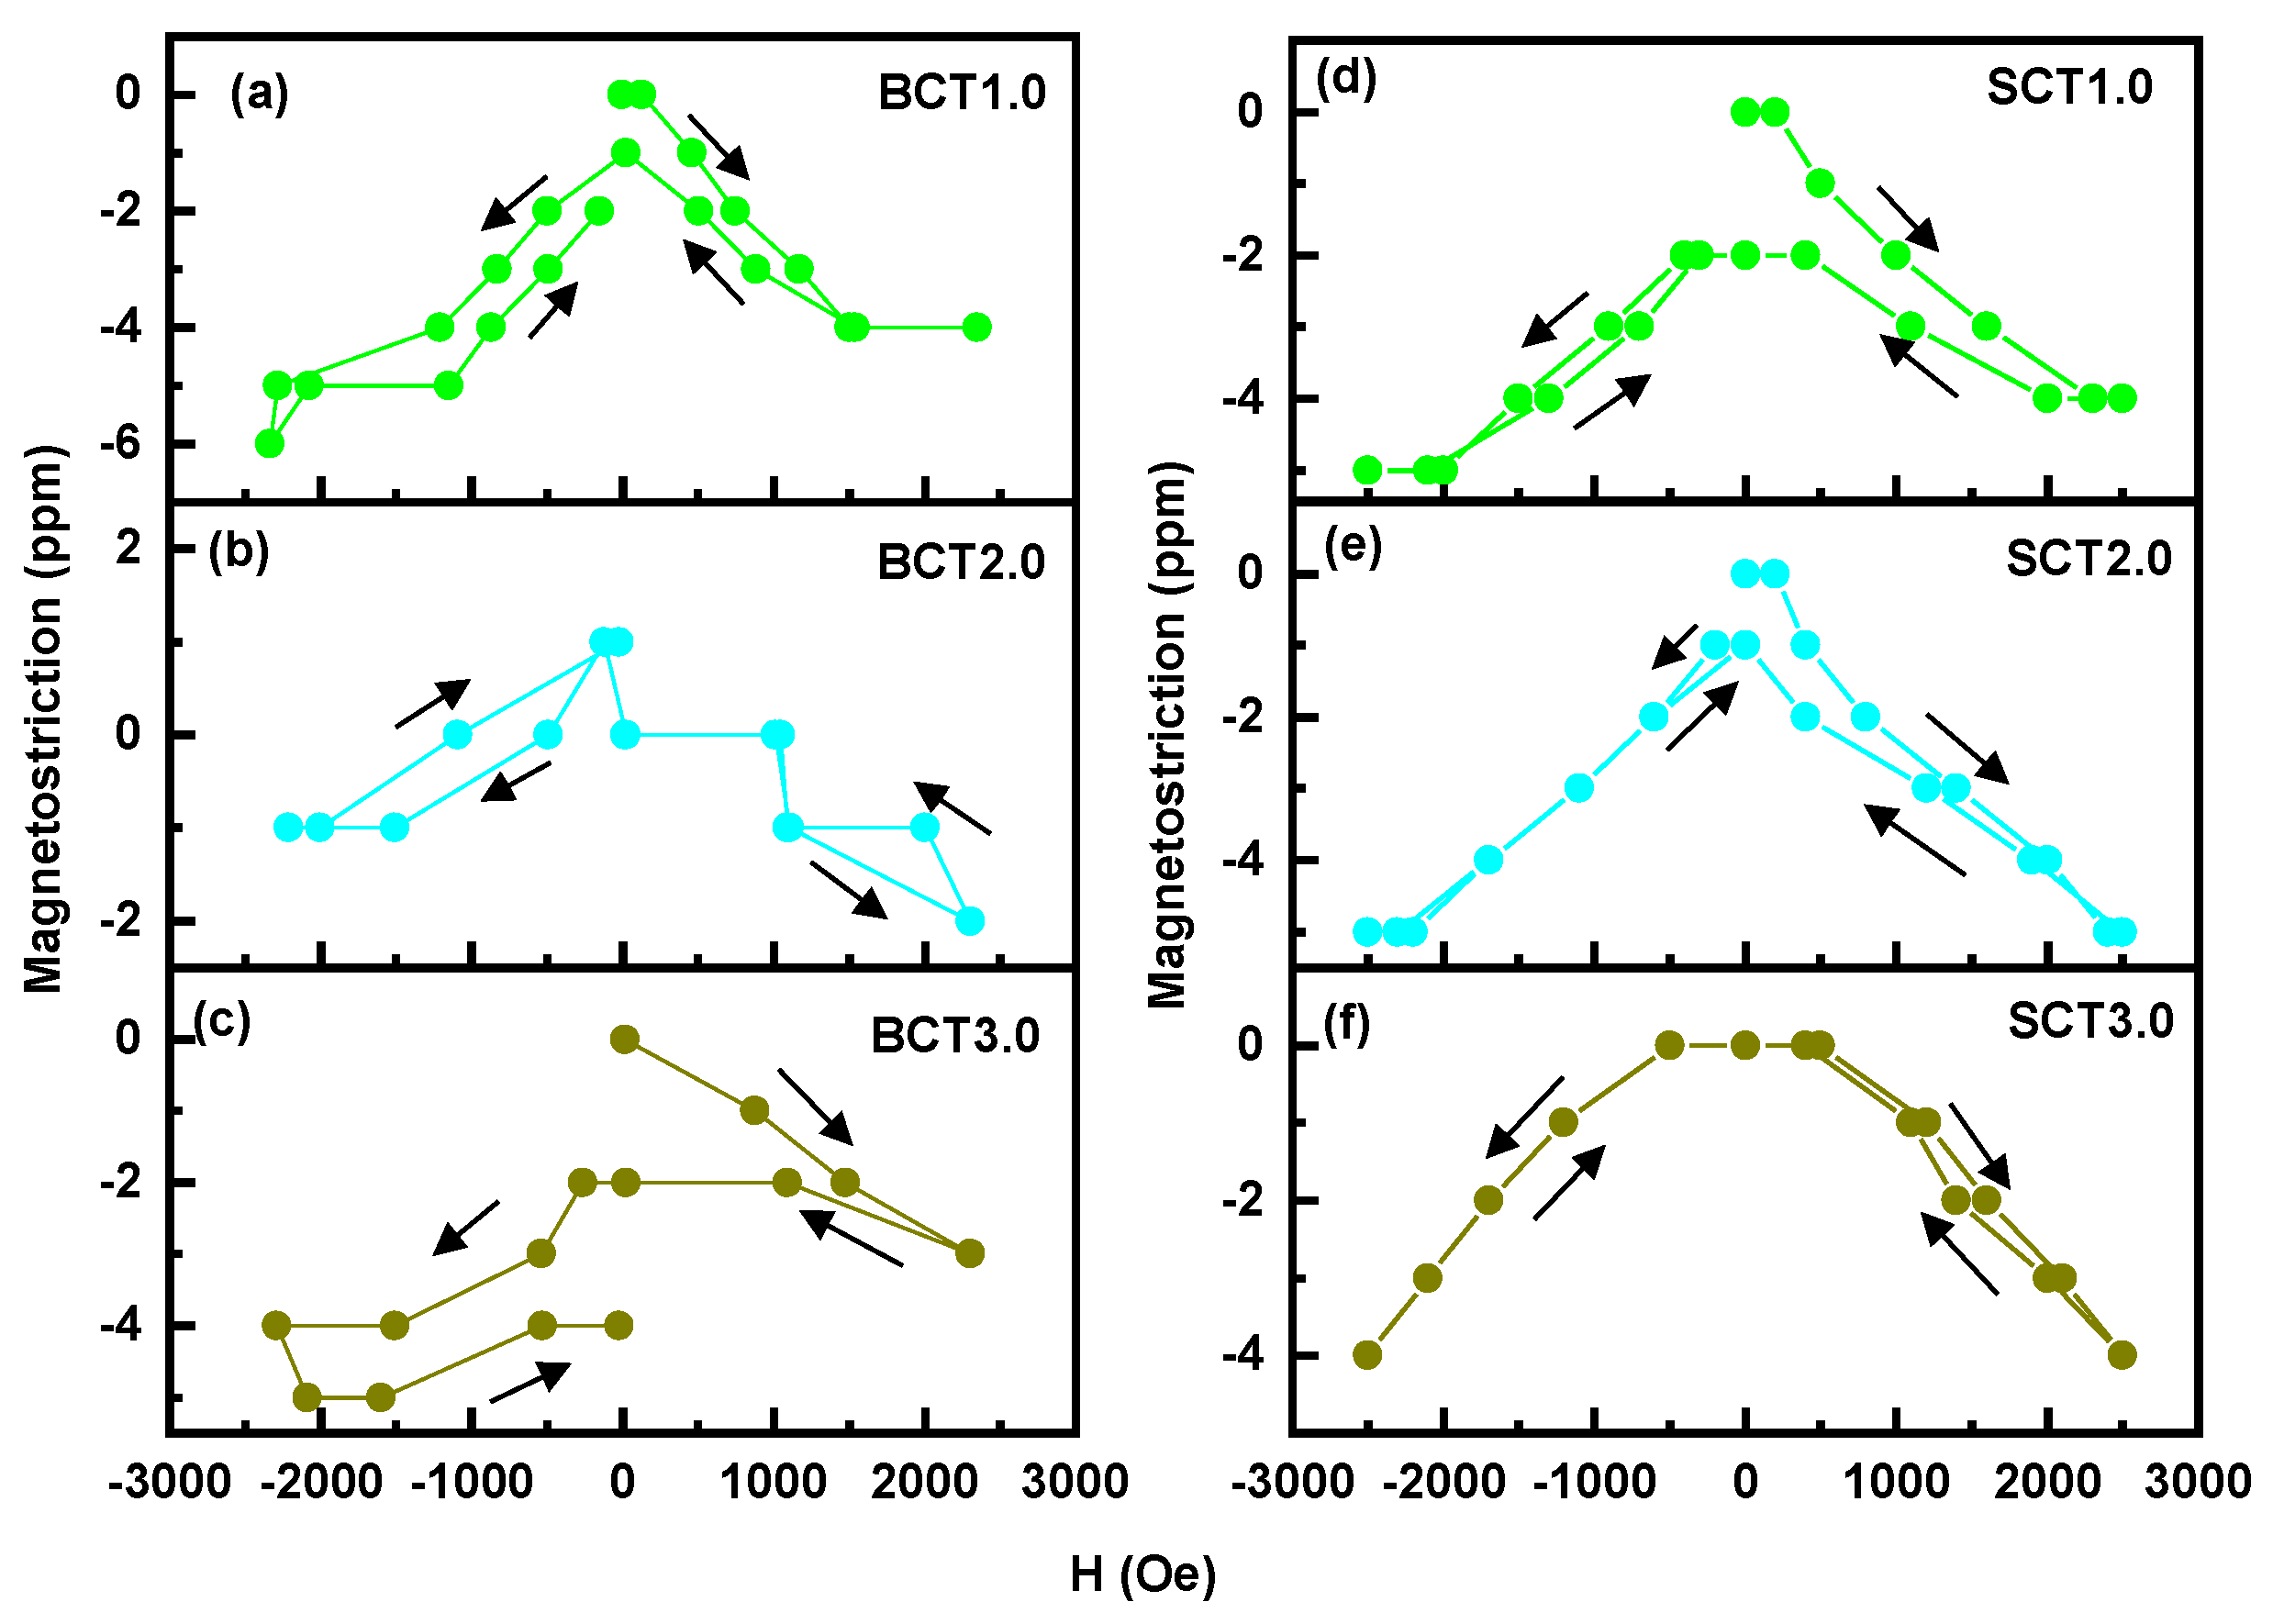
Figure 6.
Profiles of S21 vs f showing resonance in (a) BCT1.5 and (b) BCT2.0. The profiles are for in-plane H. Fitting of the FMR data on fr vs H to Eq. (1) are shown in (c) and (d).
Figure 6.
Profiles of S21 vs f showing resonance in (a) BCT1.5 and (b) BCT2.0. The profiles are for in-plane H. Fitting of the FMR data on fr vs H to Eq. (1) are shown in (c) and (d).
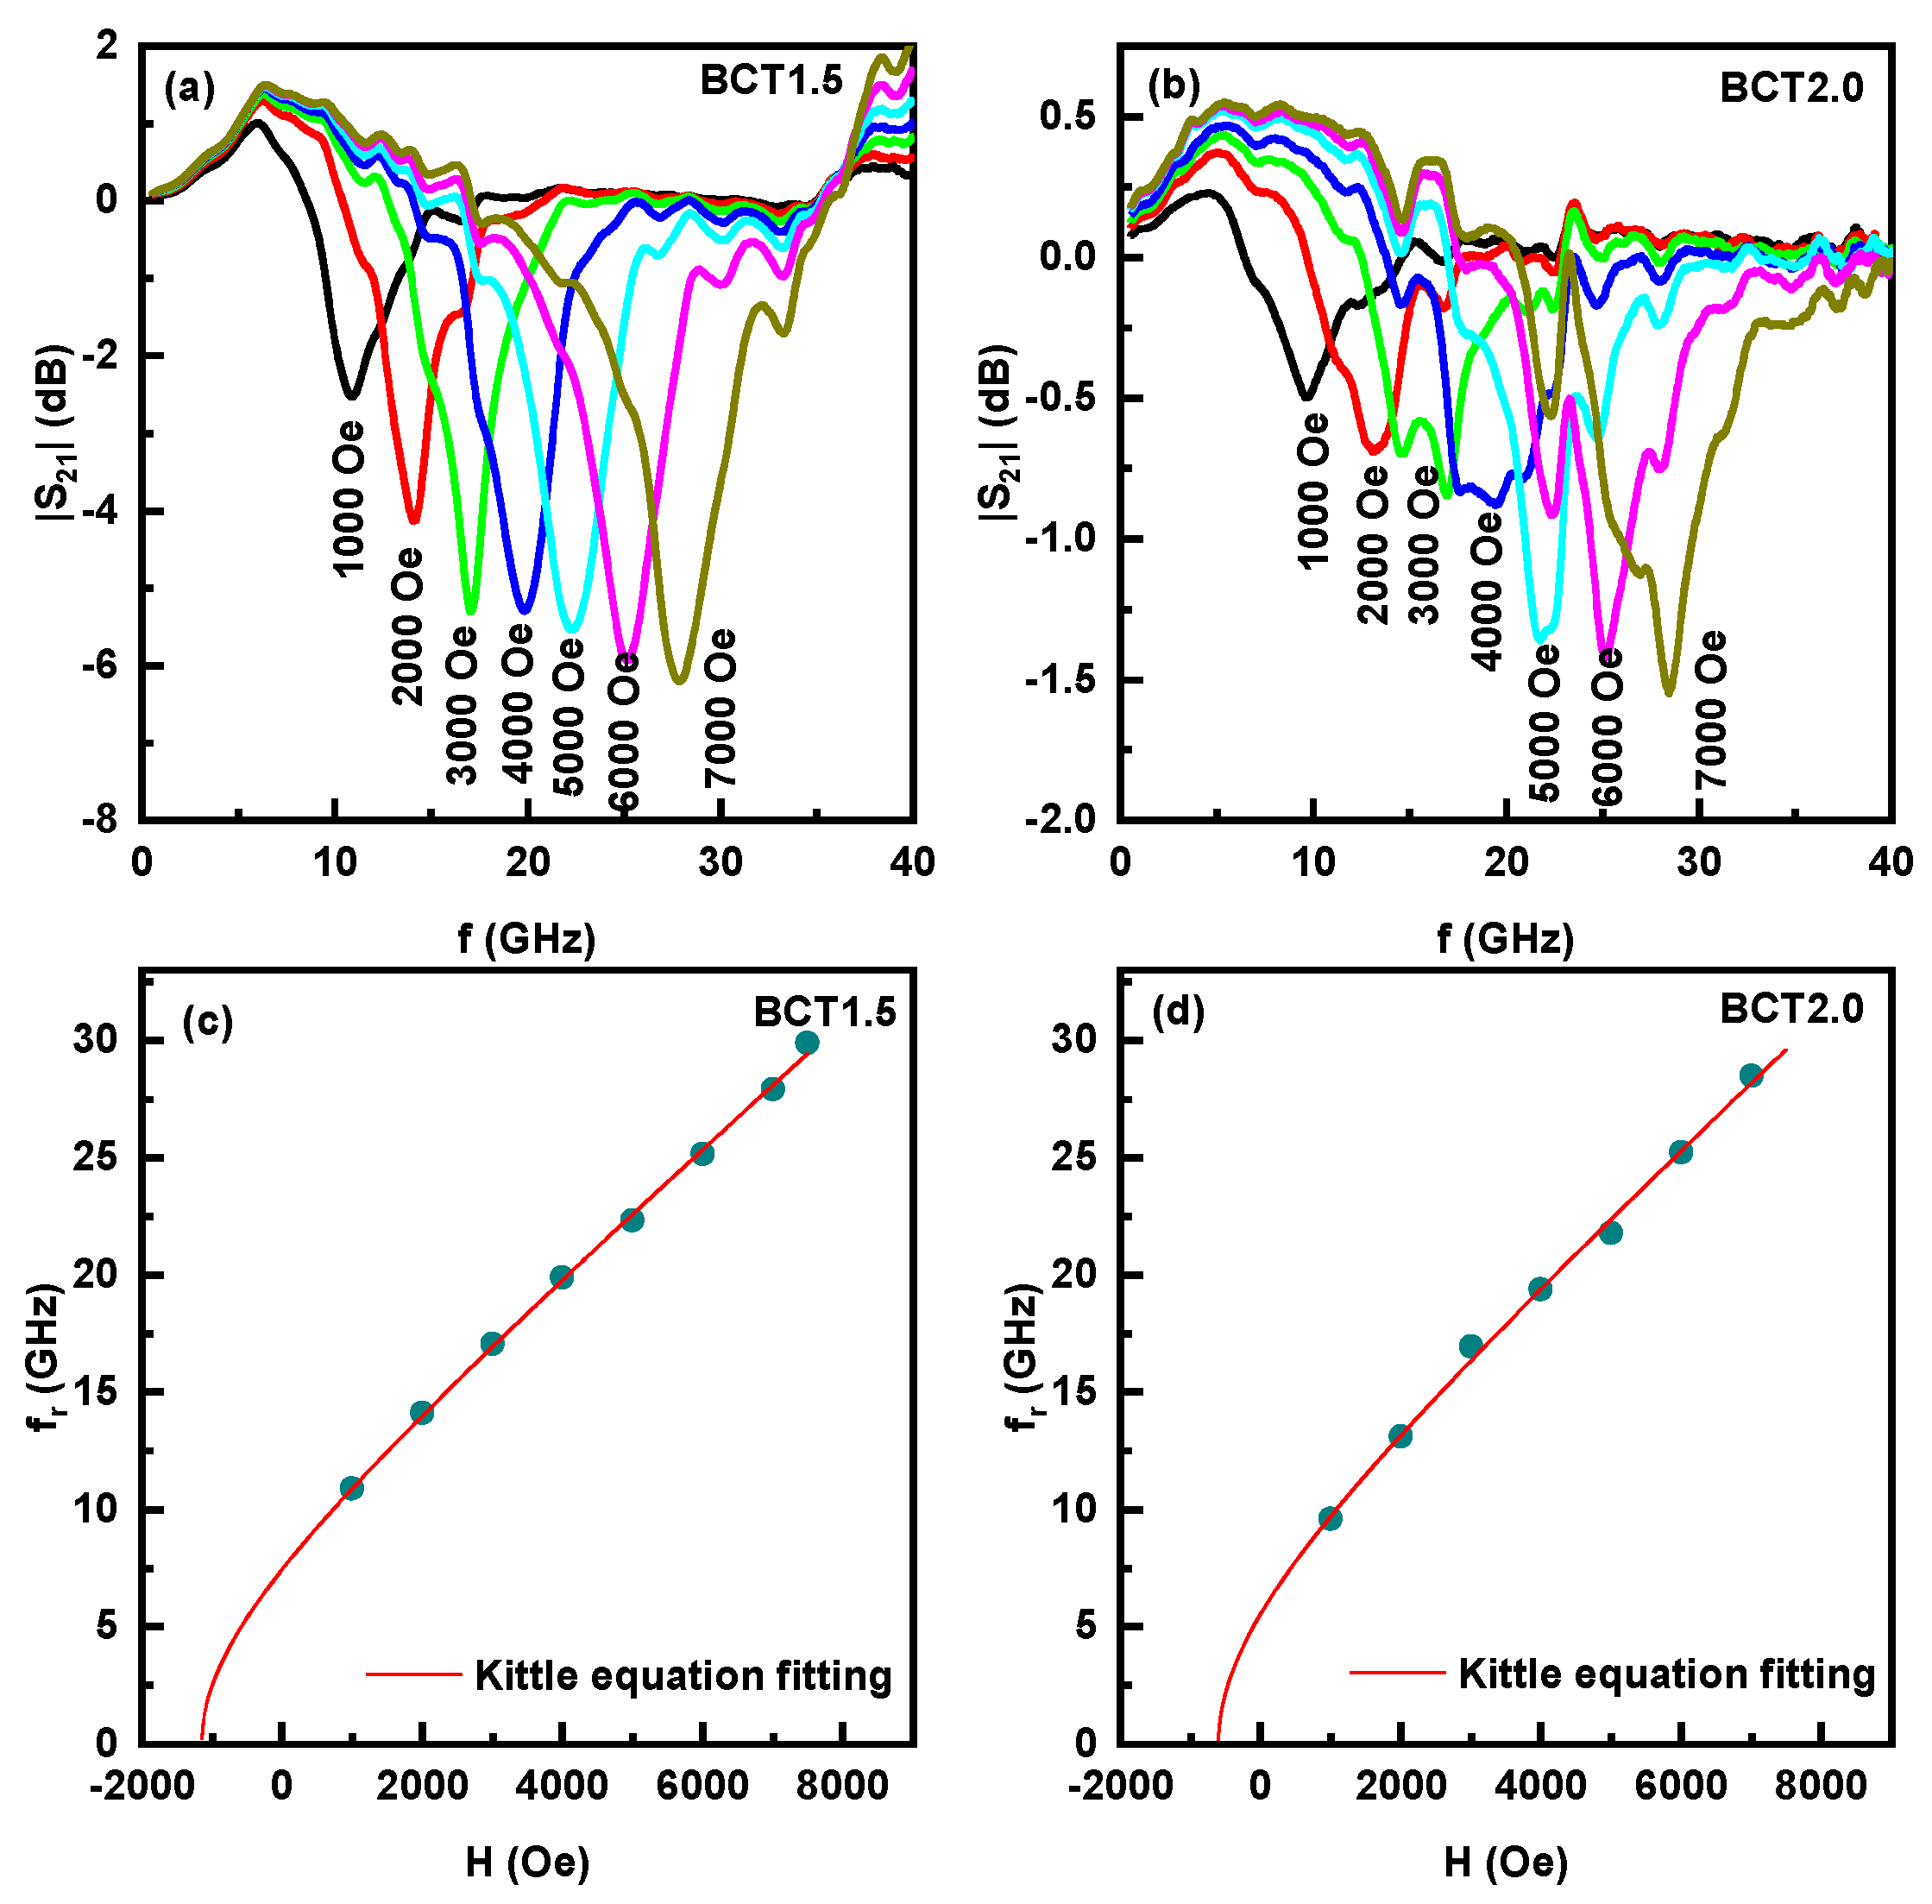
Figure 7.
Profiles of S21 vs f showing resonance in (a) SCT1.5 and (b) SCT2.0 for in-plane static magnetic fields. Fitting of the FMR data on fr vs H to Eq. (1) are shown in (c) and (d).
Figure 7.
Profiles of S21 vs f showing resonance in (a) SCT1.5 and (b) SCT2.0 for in-plane static magnetic fields. Fitting of the FMR data on fr vs H to Eq. (1) are shown in (c) and (d).
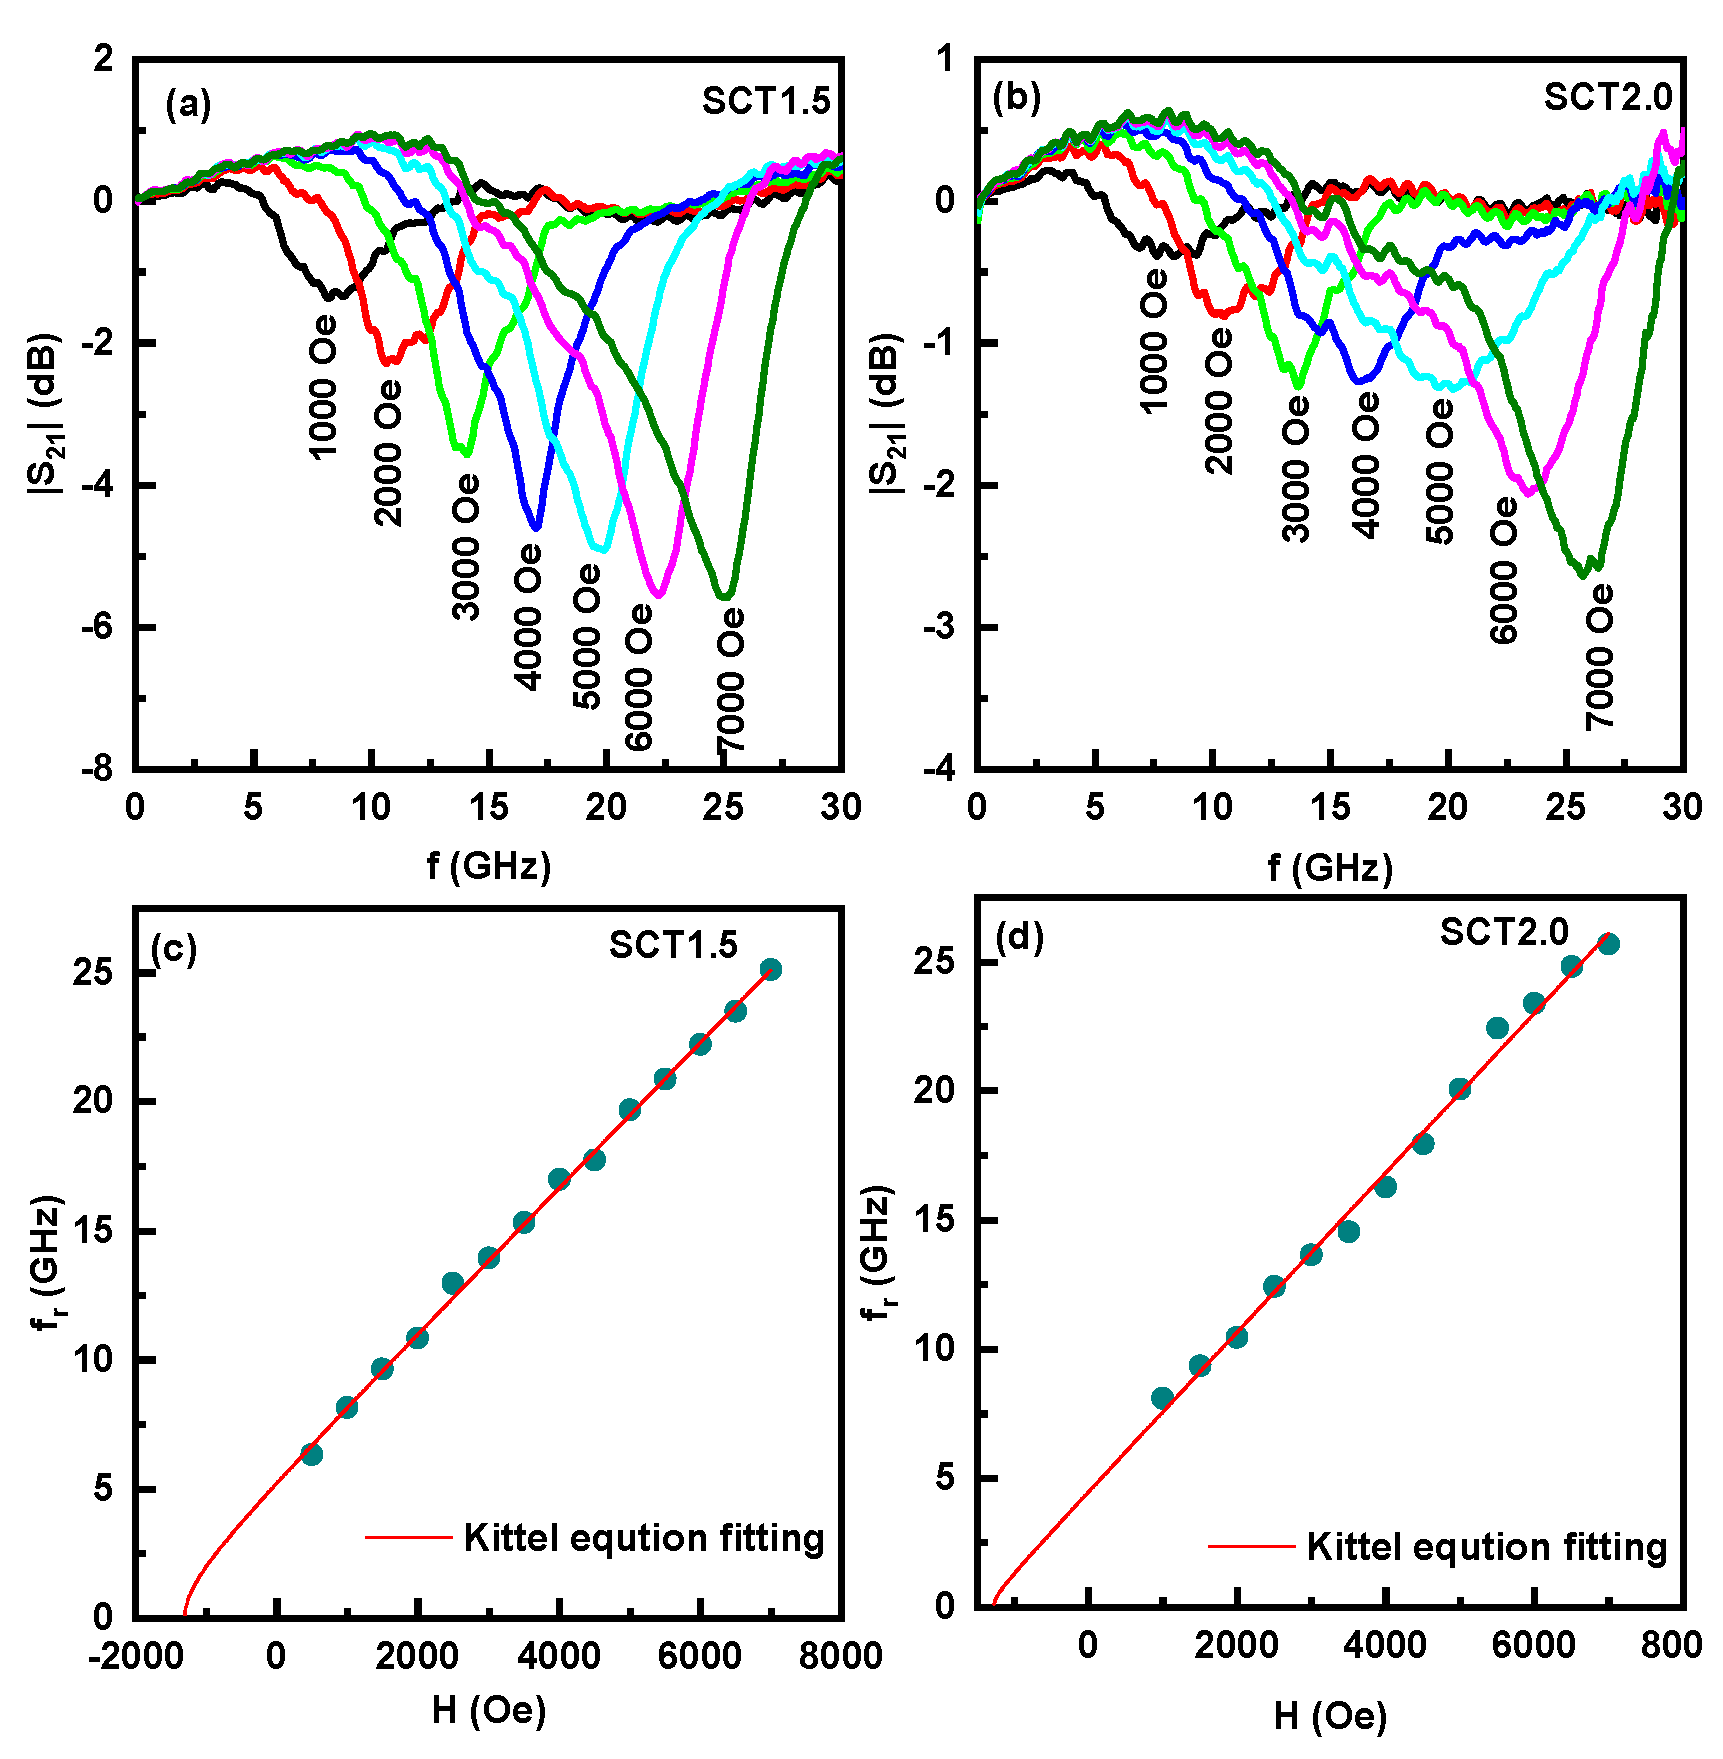
Figure 8.
α31 vs. H for the PZT-BCTx (x=0.0, 2.0, 4.0) bilayers.
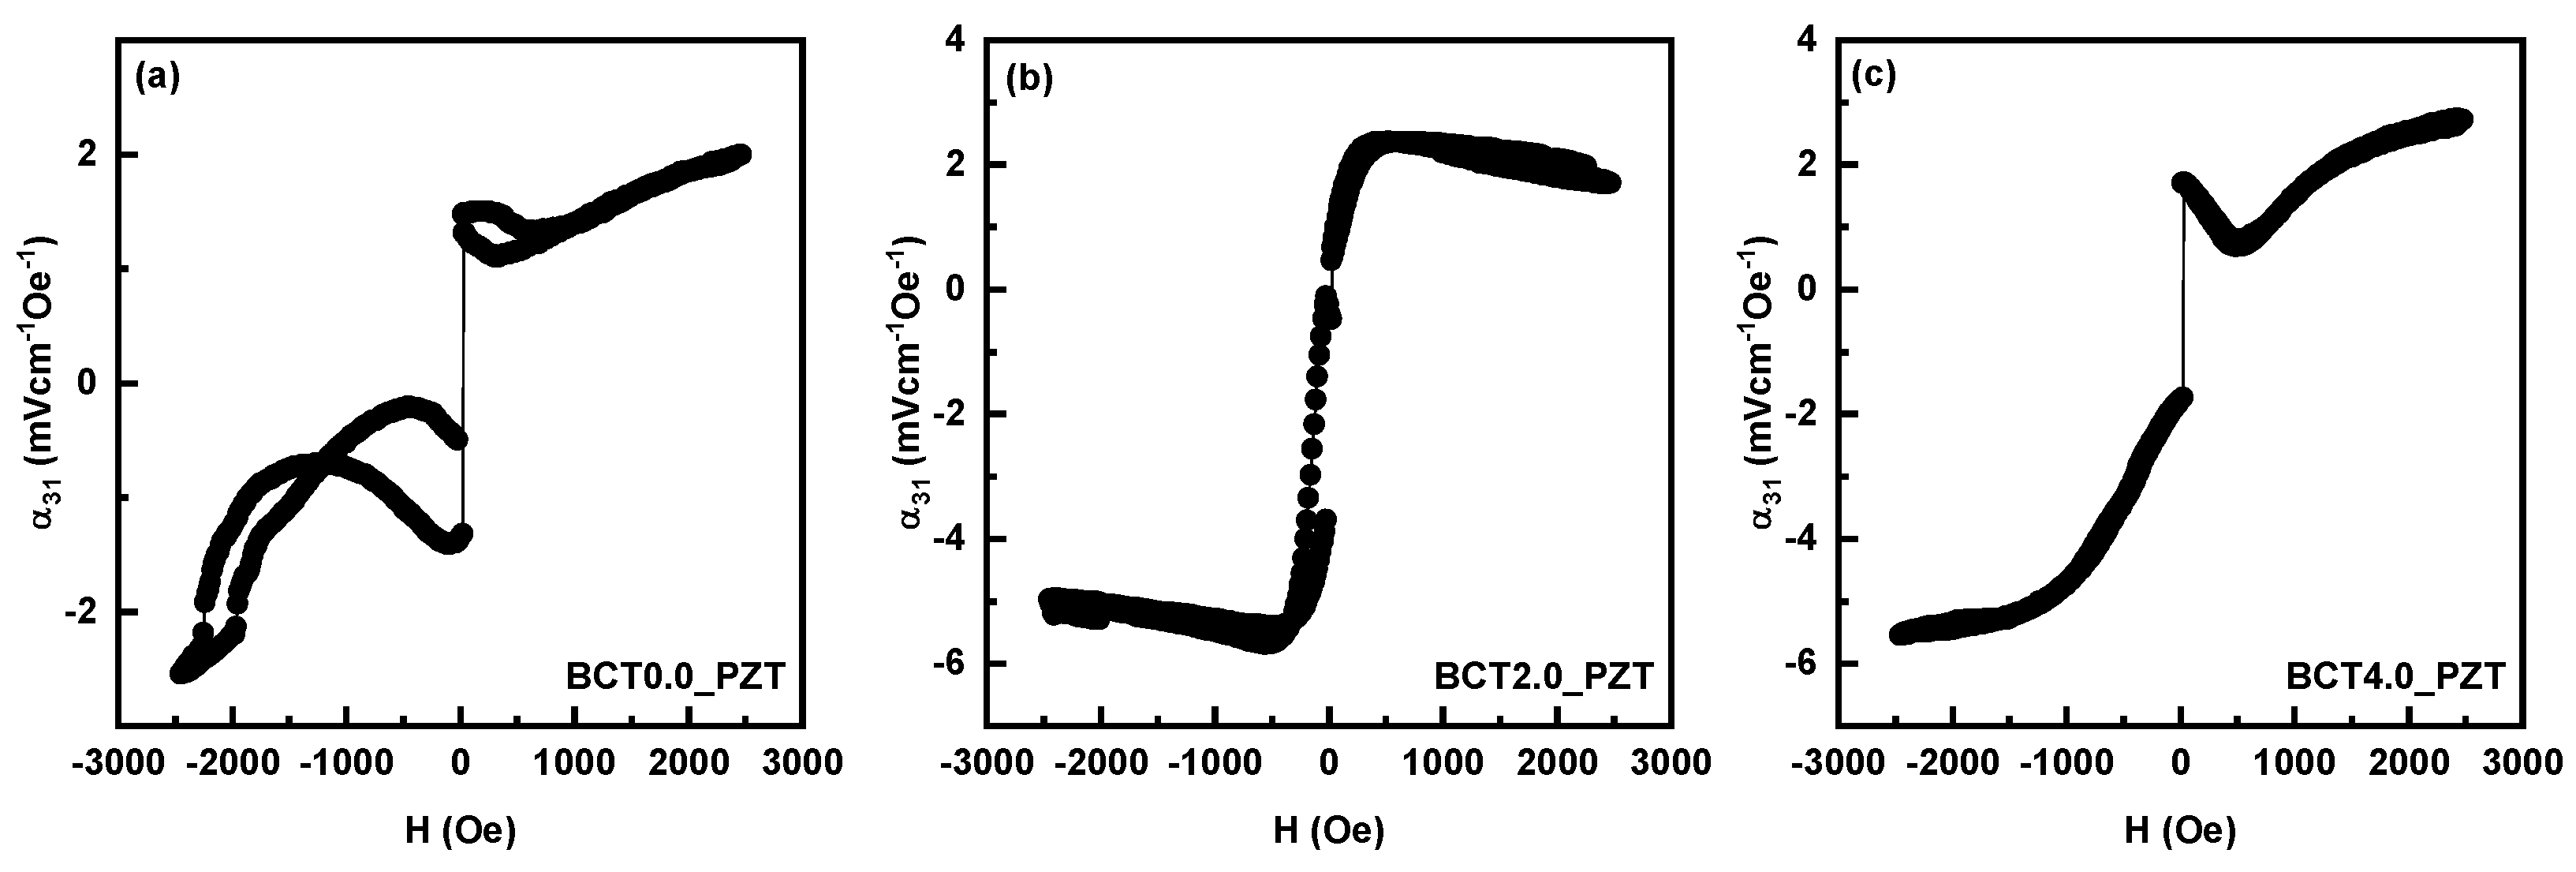
Figure 9.
α33 vs. H for PZT- BCTx (x=0.0, 2.0, 4.0) bilayers.
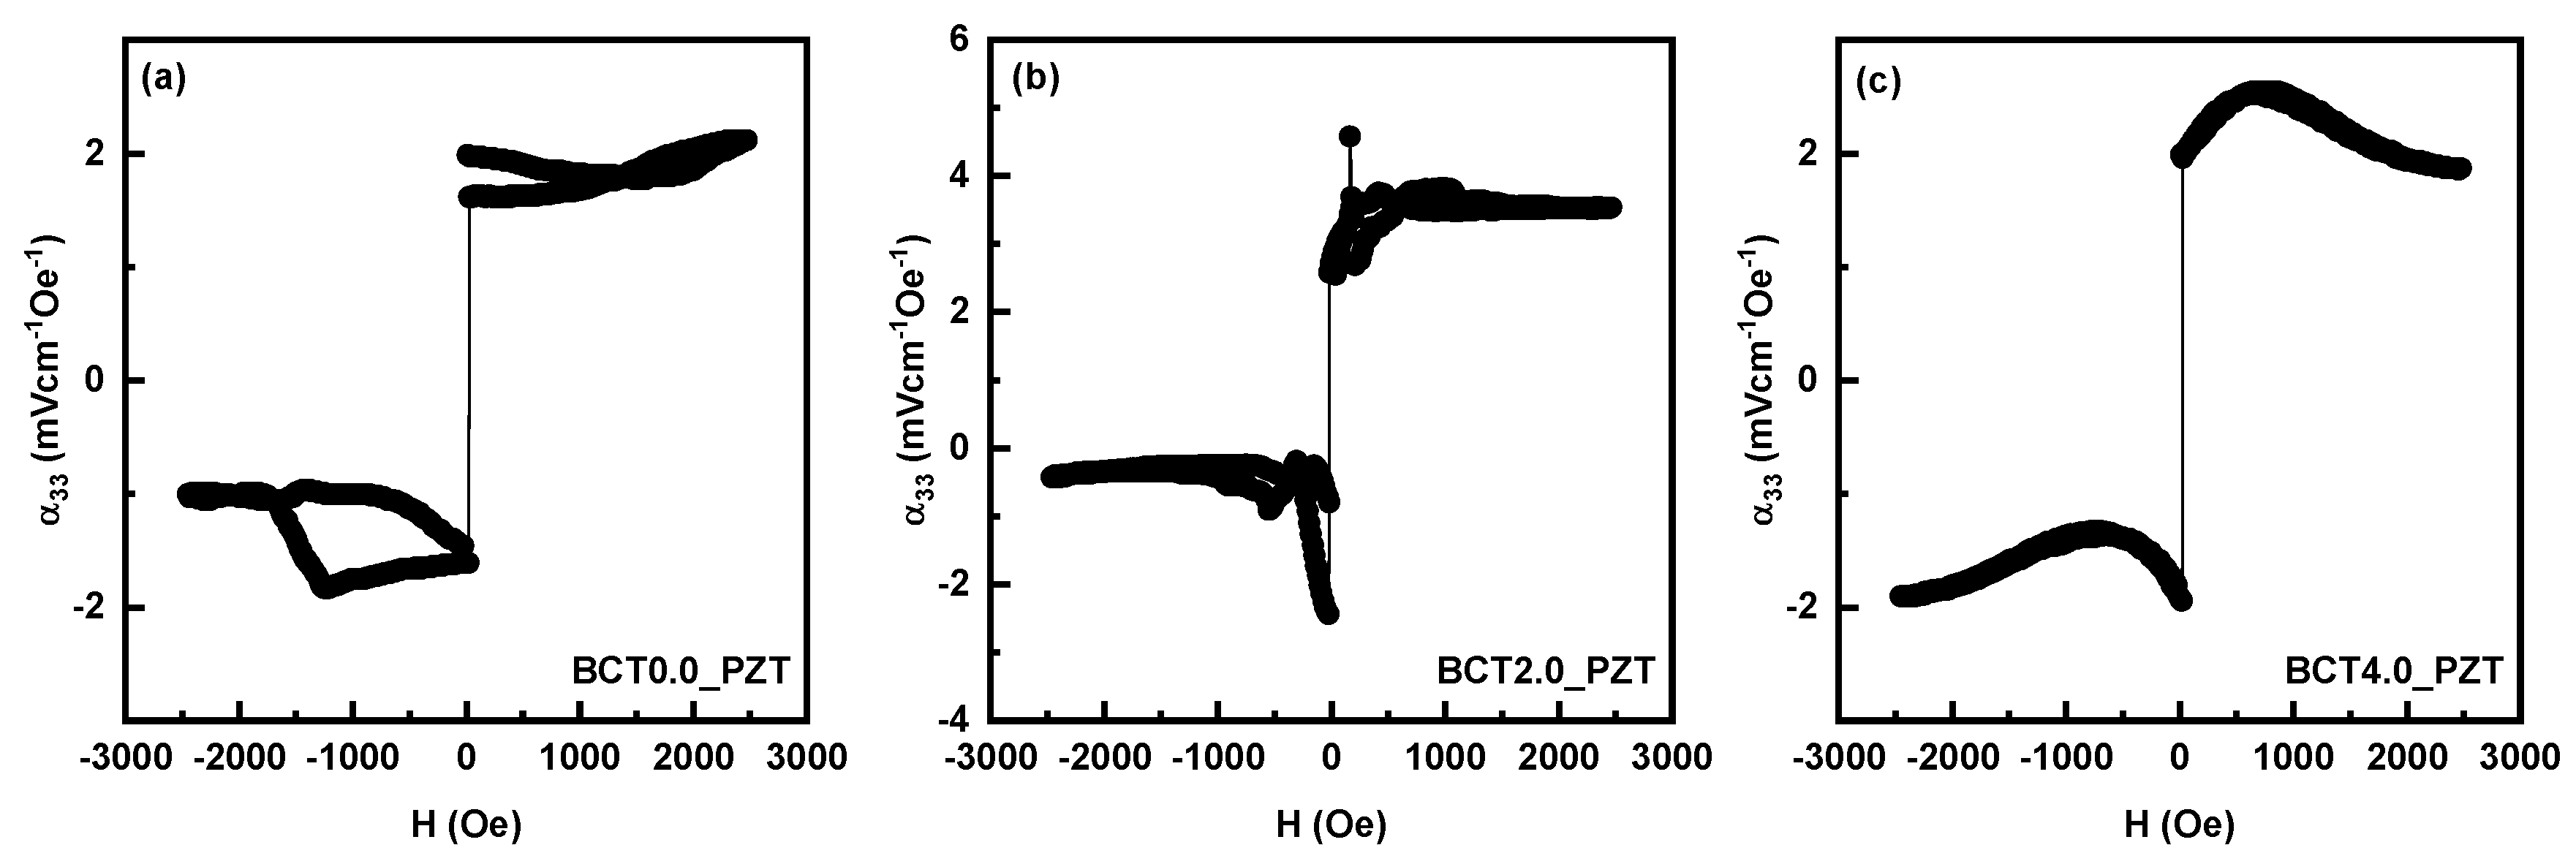
Figure 10.
α31 vs. H for PZT- SCTx (x=0.0, 2.0, 4.0) bilayers.
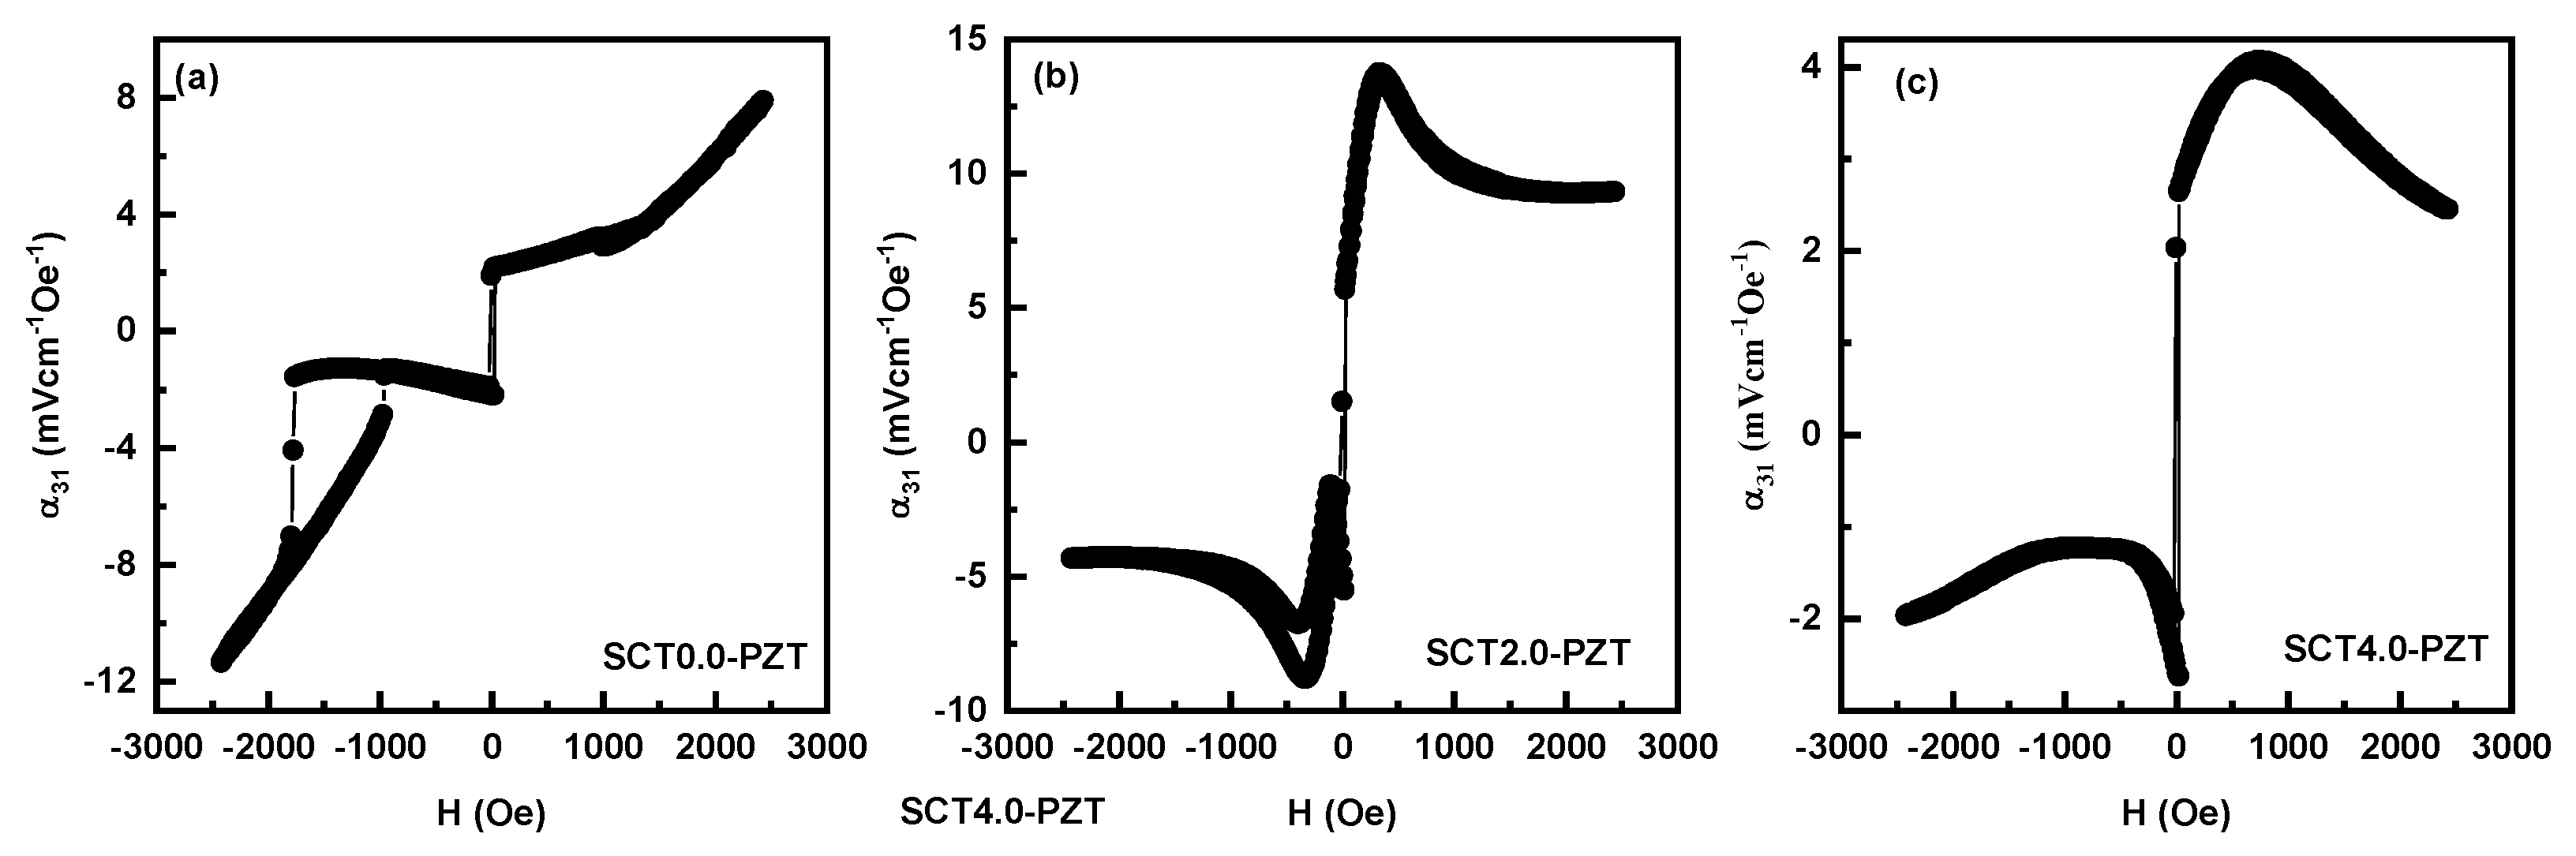
Figure 11.
α33 vs. H for PZT-SCTx (x=0.0, 2.0, 4.0) bilayers.
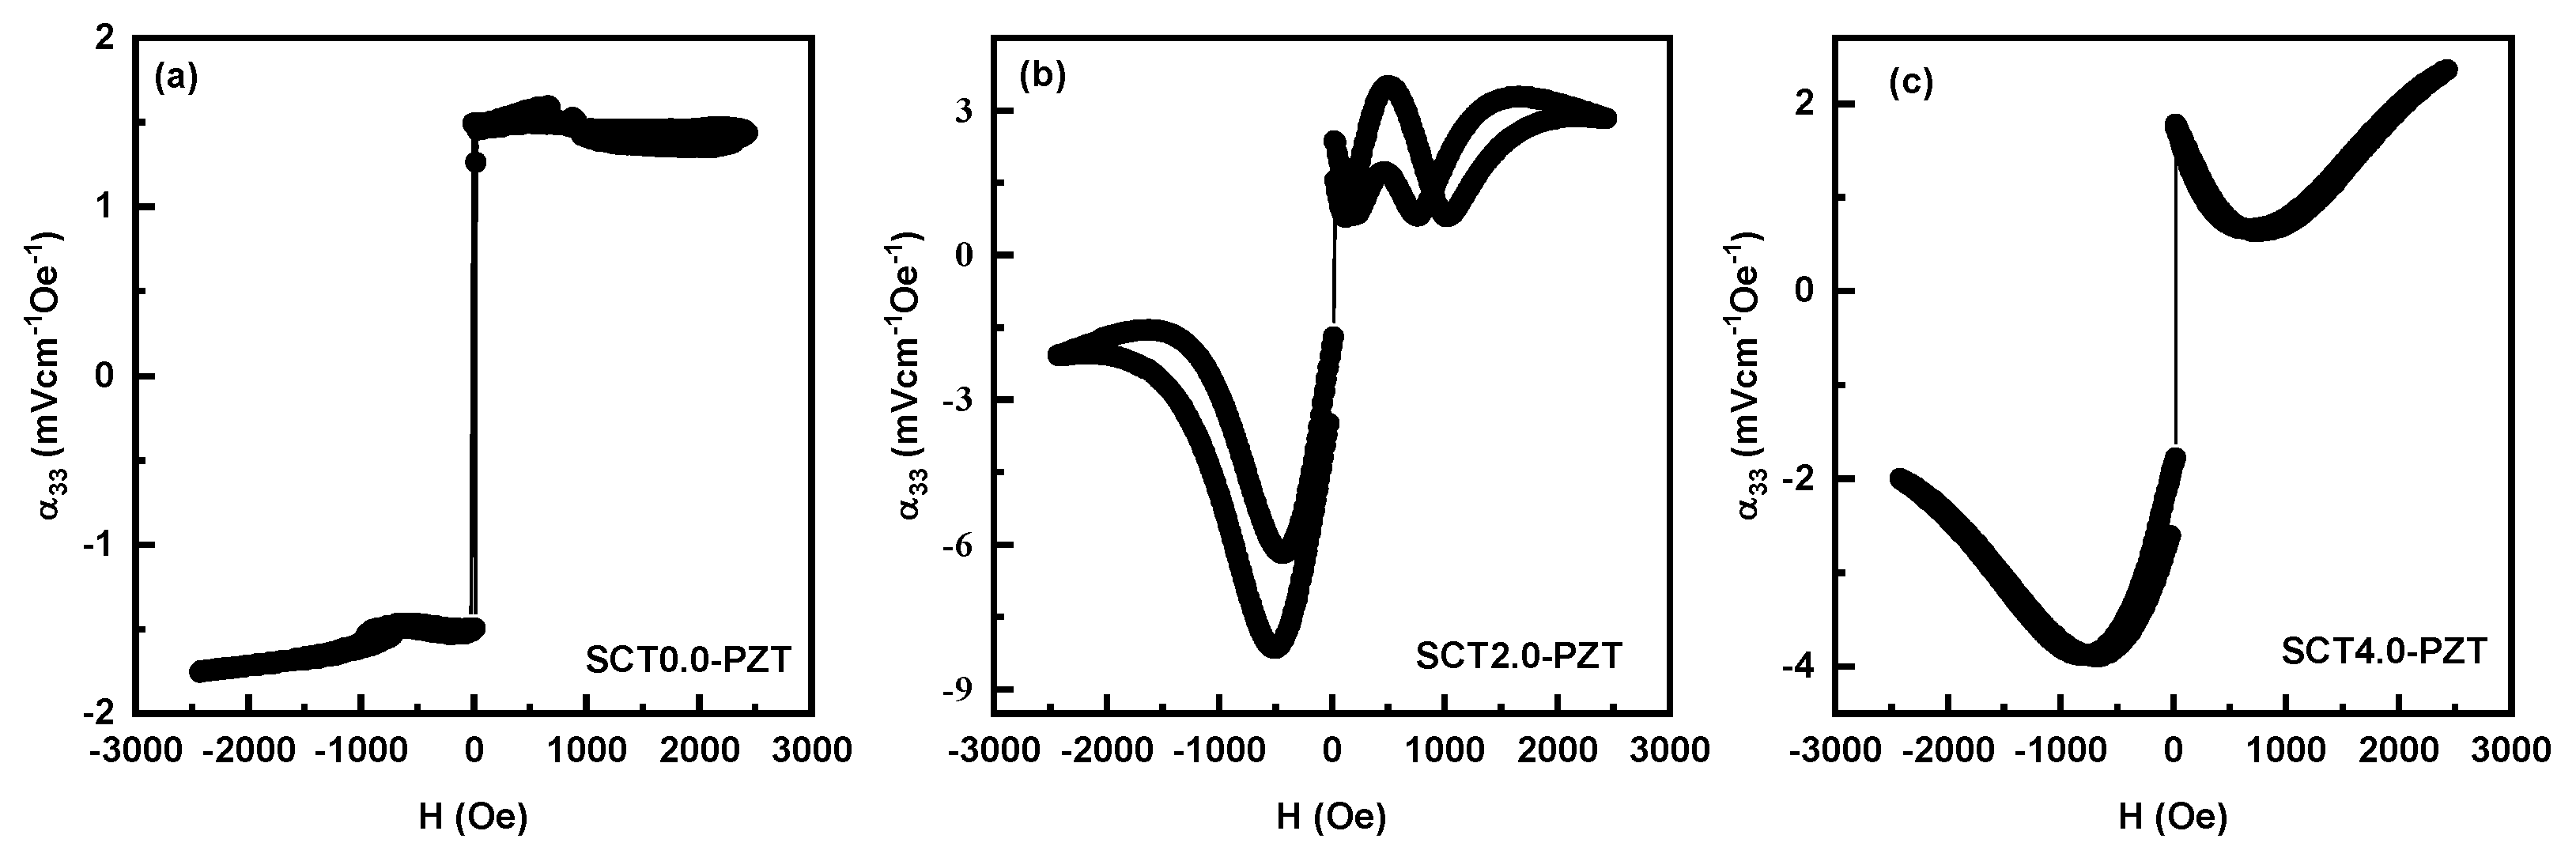
Figure 12.
MEVC as a function of frequency of the AC magnetic field for bilayers of (Left) BCTx-PZT and (Right) SCTx-PZT. The peak values occur at the frequency of longitudinal acoustic modes in the bilayers.
Figure 12.
MEVC as a function of frequency of the AC magnetic field for bilayers of (Left) BCTx-PZT and (Right) SCTx-PZT. The peak values occur at the frequency of longitudinal acoustic modes in the bilayers.
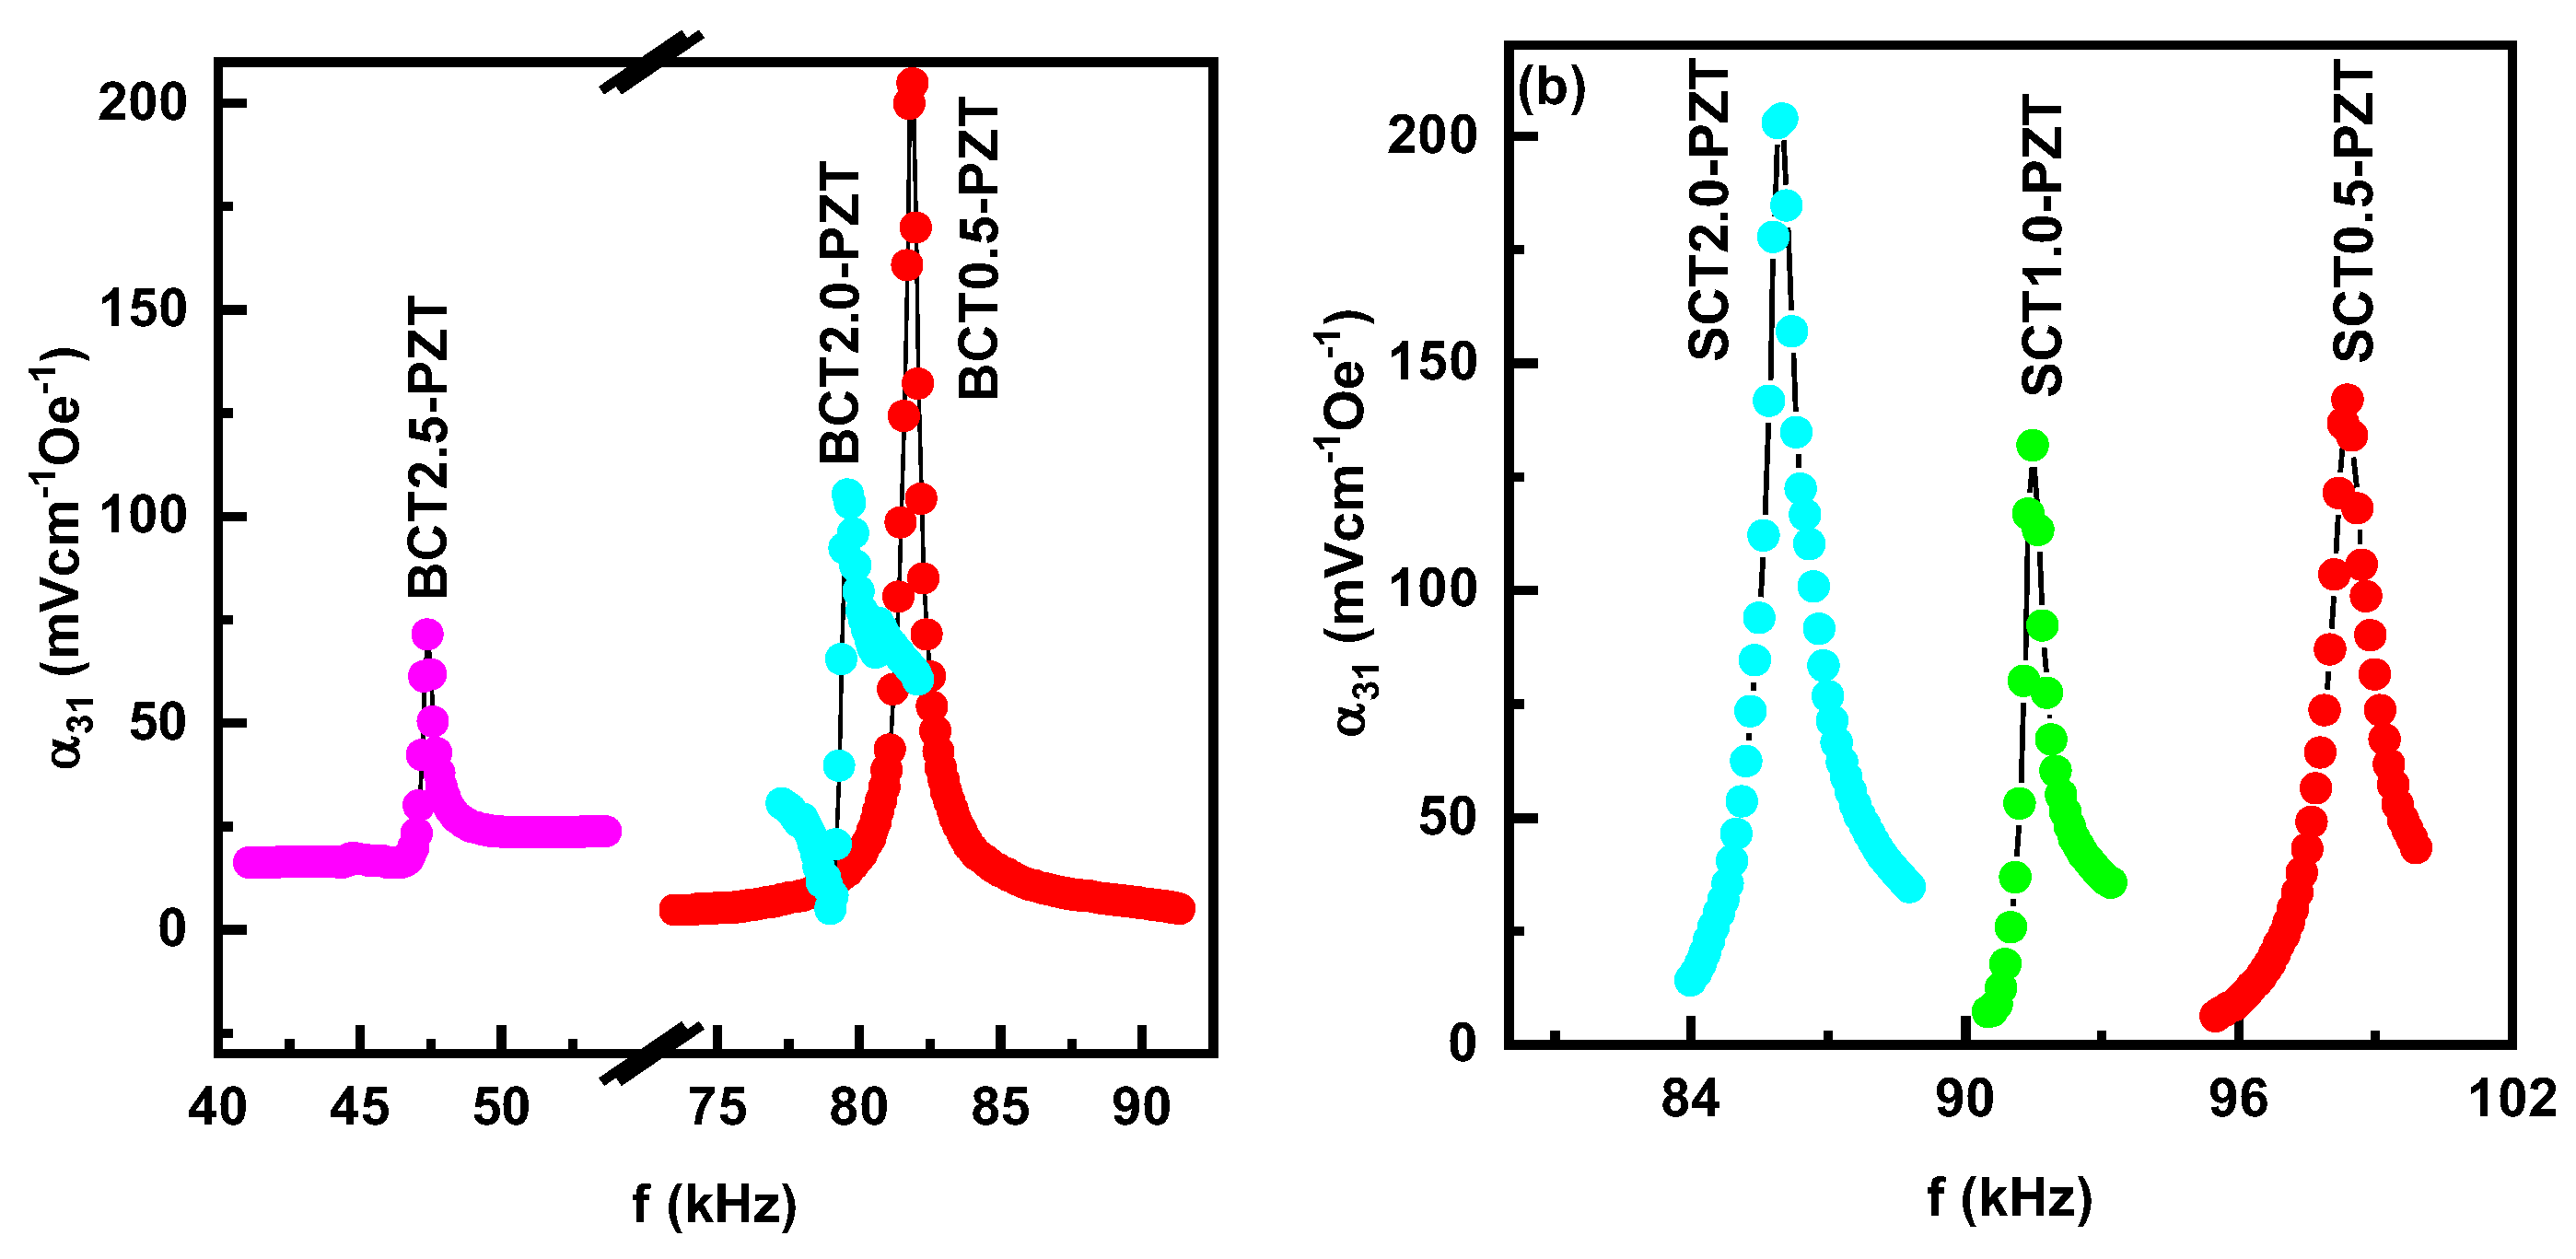

Table 1.
Fitting parameters of the FMR absorption for BCTx and SCTx samples.
| Sample | Fitting parameters | |||
| γ (MHz/Oe) | 4πMeff (kG) | 4πM (kG) from Figure 4 | HA (kOe) |
|
| BCT1.5 | 2.63 | 9.46 | 3.29 | 6.17 |
| BCT2.0 | 2.75 | 8.19 | 0.17 | 8.02 |
| SCT1.5 | 2.80 | 7.74 | 2.84 | 4.90 |
| SCT2.0 | 3.08 | 6.37 | 1.27 | 5.10 |
Disclaimer/Publisher’s Note: The statements, opinions and data contained in all publications are solely those of the individual author(s) and contributor(s) and not of MDPI and/or the editor(s). MDPI and/or the editor(s) disclaim responsibility for any injury to people or property resulting from any ideas, methods, instructions or products referred to in the content. |
© 2025 by the authors. Licensee MDPI, Basel, Switzerland. This article is an open access article distributed under the terms and conditions of the Creative Commons Attribution (CC BY) license (http://creativecommons.org/licenses/by/4.0/).
Copyright: This open access article is published under a Creative Commons CC BY 4.0 license, which permit the free download, distribution, and reuse, provided that the author and preprint are cited in any reuse.


