
Submitted:
16 May 2025
Posted:
19 May 2025
You are already at the latest version
Abstract
Recent advances in robotic technologies boosted the collaboration between humans and robots to unimaginable levels a few years ago. Humans and robots share the same workspace, thus collaborating to tackle very different tasks. Robotic support can relieve humans from accomplishing tiring and dangerous activities, and productivity can be improved. On the other hand, sharing the workspace might cause anxiety in humans: collaborating with a robot can increase the level of stress and cognitive load, as the robot’s intention may not be understood. This paper measures attention, cognitive load, and stress levels when a collaborative robotic arm is used to support humans in an assembly task. Moreover, the impact of sound alerts to manifest the robot’s intentions is evaluated by user tests.
Keywords:
brain-computer interfaces
; collaborative robotics
; cognitive load
; stress
; sound alerts
1. Introduction
The last industrial revolution is changing both the nature of industrial plants and the organization of manufacturing processes. In particular, the demand for more flexible and efficient production lines is strictly related to new paradigms of interaction between human operators and robots. Robots able to share the same workspace with human operators are called collaborative robots or cobots. Four different levels of collaboration can be defined [1]:
- synchronized: in this case, human operators and robots share the same workspace but at different times;
- coexistence: humans and robots can share the same workspace at the same time, but they do not interact;
- cooperation: humans and robots work in the same workspace at the same time, and they interact;
- collaboration: humans and robots interact to execute a task together.
The research presented in this paper focuses on the fourth, the more challenging and profitable, level of collaboration. On the other hand, a close proximity between human operators and robots can also involve safety issues. In order to reduce risks when humans and robots work closely together, the International Organization for Standardization (ISO) provides some regulations. The document ISO/TS 15066:2016 [2] defines requirements for industrial robots and the concept of collaboration in the European Union. It is important to note that the collaboration between a human operator and a robot is not determined by the robot itself but is defined by the task and the working space. The design of the workspace, therefore, plays a key role in human-robot collaboration (HRC) [3]. Human operators can accept to work with cobots only if there are no safety concerns [4].
The collaboration between agents (the term agent can be used to denote a human operator or a cobot) develops in two different dimensions: the ability of an agent to control a process (usually called know-how) and the ability of an agent to cooperate (usually called know-how-to-cooperate) [5]. These two dimensions can be enhanced if agents are able to recognize each other’s intentions; in this way, agents can adapt/modify their actions according to the behavior of other agents [6]. The levels of stress and cognitive load of human agents can grow when they are unable to understand and predict the actions of the other agents. Therefore, mental conditions have to be monitored in HRC.
Two different approaches can be adopted to monitor mental conditions: indirect and direct. The direct approach is based on questionnaires submitted to the user after completing a task. Questionnaires aim to gather the user’s point of view from a subjective perspective; the NASA-TLX questionnaire [7] is probably the most used one. Indirect methods can leverage cardiac response, electroencephalogram (EEG), electrodermal activity (EDA), electromyogram (EMG), facial expression recognition, skin potential response (SPR), pupil size measure, and multimodal measures. Interested readers can find a survey in [8].
The evaluation of the users’ mental conditions when working with a cobot has already been investigated, thus validating the theory that a strict collaboration between robots and humans can induce stress, anxiety, and high cognitive loads in these last. The research presented in [9] is strictly related to the proposed one, as the stress induced by robot collaboration in assembly tasks is measured by SPR. The relationships between human-cobot distance and the cobot’s speed with the level of stress are measured. More recently, the pupil tracking approach was used to measure stress and cognitive load in [10]; the human operator wore glasses with eye-tracking technology, and the pupil diameter was measured. The pupil size can reveal data on cognitive load, degree of attention, and anxiety. Moreover, the areas where the user placed visual attention were also recorded, in order to know what was attracting the attention.
BCIs can collect signals of brain activity; signals are then processed and used to interact with an external device (for instance, a computer or a robotic limb). BCIs are usually categorized into noninvasive, partially invasive, and invasive. The different classifications depend on how physically close the electrodes are to the brain tissue. Interested readers can find a survey of BCIs in [11]. Even if the main goal of a BCI is to allow the user to interact with an external device, the recorded brain activity also enables an indirect evaluation of stress, attention, and cognitive load.
The proposed research has a twofold objective: 1) measuring the level of stress and cognitive load of a human operator when interacting with a cobot to accomplish a specific task by an affordable and ergonomic brain-computer interface (BCI) and 2) evaluating if sound alerts can be used to effectively communicate the cobot’s intentions, thus reducing the user’s stress and cognitive load.
In the proposed research, the brain activity is measured by the MN8 Emotiv device [12], an affordable 2-channel EEG headphones, while the user cooperates with a robotic arm to accomplish a collaborative assembly task. BCI devices capture different frequency bands: delta () waves from 0.5 to 4 Hz, theta () waves from 4 to 8 Hz, alpha () from 8 to 12 Hz, and beta () waves from 15 to 25 Hz [13]. These last waves can be further classified into Low (12-16 Hz) and High (16-25 Hz). Higher frequencies can also be measured, called waves. The relationships among the frequency bands can be used to infer the user’s mental conditions. The proposed research has classified four states for attention, cognitive load, and stress. The attention has been divided into relaxed, low focus, moderate focus, and high focus. Stress has been divided into calm, mild stress, elevated stress, and anxiety. Finally, the cognitive workload has been divided into relaxed, moderate effort, high load, and mental fatigue.
Two research questions are investigated:
- RQ1: Can stress, mental workload, and attention be objectively evaluated by an affordable and ergonomic device like the MN8?
- RQ2: Can acoustic signals denoting the cobot’s intention relieve stress and mental workload?
Six people were involved in tests, and both an indirect measure by the MN8 BCI and a direct evaluation by the NASA-TLX questionnaire were carried out. Results show that acoustic signals announcing the cobot’s movements can reduce stress and mental workload, and objective results qualitatively measured by the BCI interface only partially match the subjective evaluations gathered by questionnaires.
The paper is organized as follows: Section 2 reviews the approach used to classify mental states as well as the exercises proposed to determine both the lower levels (calm and relaxation) and the upper level (high stress and mental fatigue), whereas Section 3 presents the protocol used for tests and obtained results, which are analyzed and discussed in Section 4.
2. Materials and Methods
Correlations among different frequency bands (, , , , and ) have been deeply studied in the literature [14]. Table 1 shows how band frequencies and their relationships can be used to describe cognitive behavior [15].
The BCI electrode placement is standardized and regulated by an international system called “10-20”. The 10-20 system is characterized as follows [16]:
- the nasion and inion are used as anatomical landmarks;
- the total distance D between the landmarks is used to place the electrodes: the distances between electrodes are either 10% or 20% of D;
- the capital letters “F”, “T”, “C”, “P”, and “O” are used to denote frontal, temporal, central, parietal, and occipital lobes, respectively;
- on the right hemisphere are placed electrodes denoted by even numbers, whereas on the left hemisphere are placed electrodes denoted by odd numbers;
- A "Z" capital letter denotes electrodes placed in the midline.
The international 10-10 system is an extension of 10-20. New electrodes improve the skull coverage concerning the 19 ones defined in 10-20. New electrodes are labeled by two capital letters, for instance: “FC” (frontal-central), “FT” (frontal-temporal), “CP” (central-parietal), and “PO” (parietal-occipital). In particular, “AF” labels frontopolar and frontal electrodes. The 10-10 system identifies 75 positions and renames some electrodes, such as T3 and T4 (renamed T7 and T8) and T5 and T8 (renamed P7 and P8). Figure 1 shows the placement of the electrodes according to the international system 10-10.
2.1. The MN8 Device
The MN8 device gathers brain activity by two channels equivalent to the T7 and T8 electrodes (placed just above the ears) [17]. Raw electroencephalogram (EEG) data measured by T7 and T8 are converted in power bands by the EmotivPRO software; an example is provided in Figure 2; the upper part of the figure plots the raw data for both ears (represented in V per sample), whereas the histogram shows the power band , , Low , High , and . The represented mental behavior corresponds to high attention (notice the high power associated with waves) and low stress (see the low power associated with the High waves). The conversion pipeline from raw EEG data to power bands can be summarized as follows: 1) raw data are high-pass filtered, 2) the DC component is removed, 3) new sample windows are created by using a Hamming window of 256 samples that slides 16 samples, and 4) power bands are computed by Fast Fourier Transform (FFT) and then normalized; more details can be found at the web page of the EmotivePRO software [18].
In this research, power bands have been used to classify mental conditions according to the following associations resulting from the power band relationships presented in Table 1:
- waves: Used to compute the cognitive workload → higher values are associated to a higher workload;
- waves: Used to determine the stress → lower values are associated to a higher stress;
- Low waves: Used to evaluate a moderate focus → higher values are associated with higher attention and cognitive load;
- High waves: Used to evaluate anxiety and stress → higher values are associated with higher anxiety or stress;
- waves: Not directly used in this research, but they might evaluate the cognitive workload when complex information is processed.
2.2. Exercises for Mental State Classification
Classification of multiple mental states by passive BCIs is a challenging task [19]. Usually, ad-hoc tests are proposed to users to induce a specific mental condition. For instance, arithmetic tests of different levels are alternated with relaxing sessions in [19]. A similar approach is implemented in [20]; arithmetic and the Stroop [21] tests induce different stress levels and are alternated with relaxation sessions. Finally, custom questions are used to adapt the stress tests to participants. This protocol proved very effective as it can induce stress in a measurable and repeatable way.
The research presented in [22] classifies attention levels into four categories: baseline, reading, math, and sustained attention. The baseline state is obtained by keeping the eyes closed for several seconds. Users are asked to read a text to reach the second state silently. The math state is measured by asking users to do a mathematical task, which is displayed on the screen mentally. The last state is obtained by performing the SART test [23].
Smitha et. al. aimed to identify positive and negative stress (eustress and distress, respectively) according to the user’s EEG. The Stroop test induces stress by the following protocol: a one-minute rest session begins the test, after which the compilation of a survey, a 20-second inter-stimulus session, and a one-minute stress session are repeated. It has been noted that multitasking tests mainly induce distress.
2.3. The Proposed Protocol
The proposed protocol is similar to the ones mentioned above, shown in Figure 3. Users have to fill out a preliminary questionnaire used to collect age and level of knowledge of the technologies used. During the second step, users have to keep their eyes closed, and relaxing music is played: this session is necessary to determine the baseline representing low cognitive and emotional brain activation. After a short interval, a stress session is performed: the Stroop, the SART, and arithmetic tests are submitted; brain activity is compared with that measured during the relaxing sessions, and wrong answers are recorded to identify critical moments in tests. This step is necessary to determine the upper levels of mental activation, thus allowing the system to define a four-level scale for attention/focus, stress, and cognitive load (Figure 5 represents the four levels of each mental condition).
After a short break, the collaborative robot session is executed. The system recording the EEG data is also connected to the cobot. In particular, the cobot sends signals of start moving and stop moving each time the robotic arm starts and stops. These signals allow the system to identify potentially critical time intervals and to emit an acoustic alert when the robotic arm starts moving. The PC connected via Bluetooth to the BCI device shares a private network with the cobot; a thread of the application receiving EEG data is running in the background to receive signals from the cobot.
The test is completed by administering the NASA-TLX questionnaire. All the raw EEG recorded data are processed offline after the tests. First, power bands are computed, then mental conditions are determined. In particular, the attention is computed by considering and waves, whereas the stress is computed as the ratio:
and the cognitive workload is computed by considering the ratio:
Finally, the raw EEG data are eliminated, and graphs like those shown in Figure 5 are plotted.
3. Results
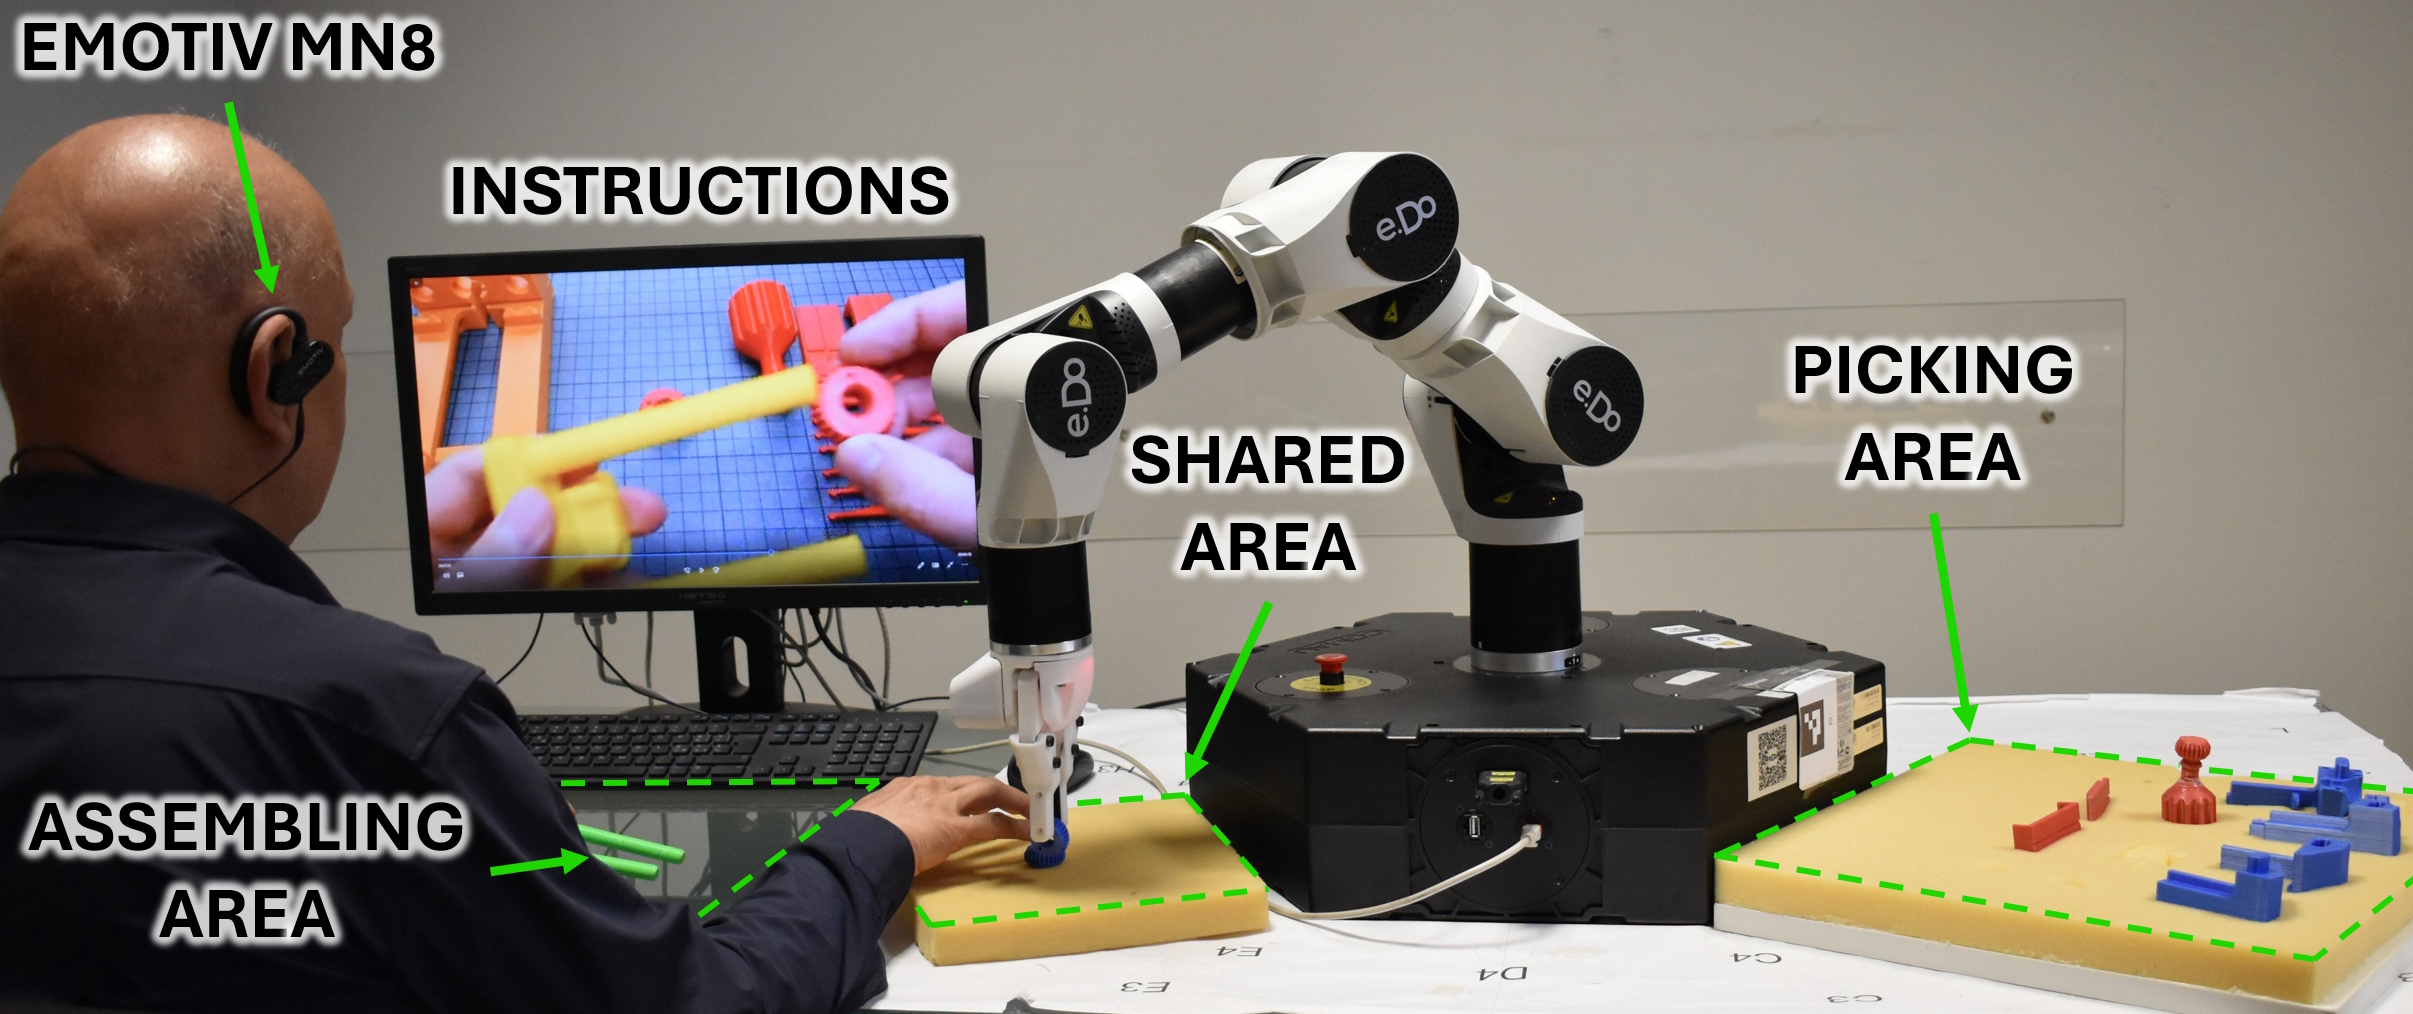
Users had to assemble a vise composed of 12 pieces [25]. The first two pieces were already available in the shared workplace, whereas the other ones were picked and placed in the same place by a collaborative robotic arm (e.g., e.Do by COMAU [26]). The cobot followed three different paths, selected randomly to bring the objects; the delay between one piece and the next was also variable. Instructions on assembling the vise were displayed on a monitor.
Six people were involved in experimental tests, and the MN8 device detected the brain activity. Users were randomly divided into two groups: the first group performed the experiments without acoustic signals, whereas the second group performed the same test with acoustic aids.
Before the tests, the experimental protocol was explained to the users, and they signed the informed consent. It was clearly specified that raw EEG data would be immediately deleted after the conversion into power bands, and all recorded information would be anonymously stored. Therefore, people were labeled user_1, ..., user_6. In particular, users 1, 4, and 6 performed the tests with acoustic alerts, whereas users 2, 3, and 5 did not benefit from sound aids.
All the people were volunteers, M.Sc. and Ph.D. students in the computer engineering courses at Politecnico di Torino, Italy. All of them were aware of the concept of collaborative robotics. Five males and one female participated in the tests. The average age was 27,1 years (standard deviation equal to 2,3). Just two of them have previously used BCIs (users_1 and user_2).
Figure 4 shows the test setup: a user is wearing the MN8 device, and the picking area is visible at the right of e.Do robot; the user shares the releasing area to the left of the robot.
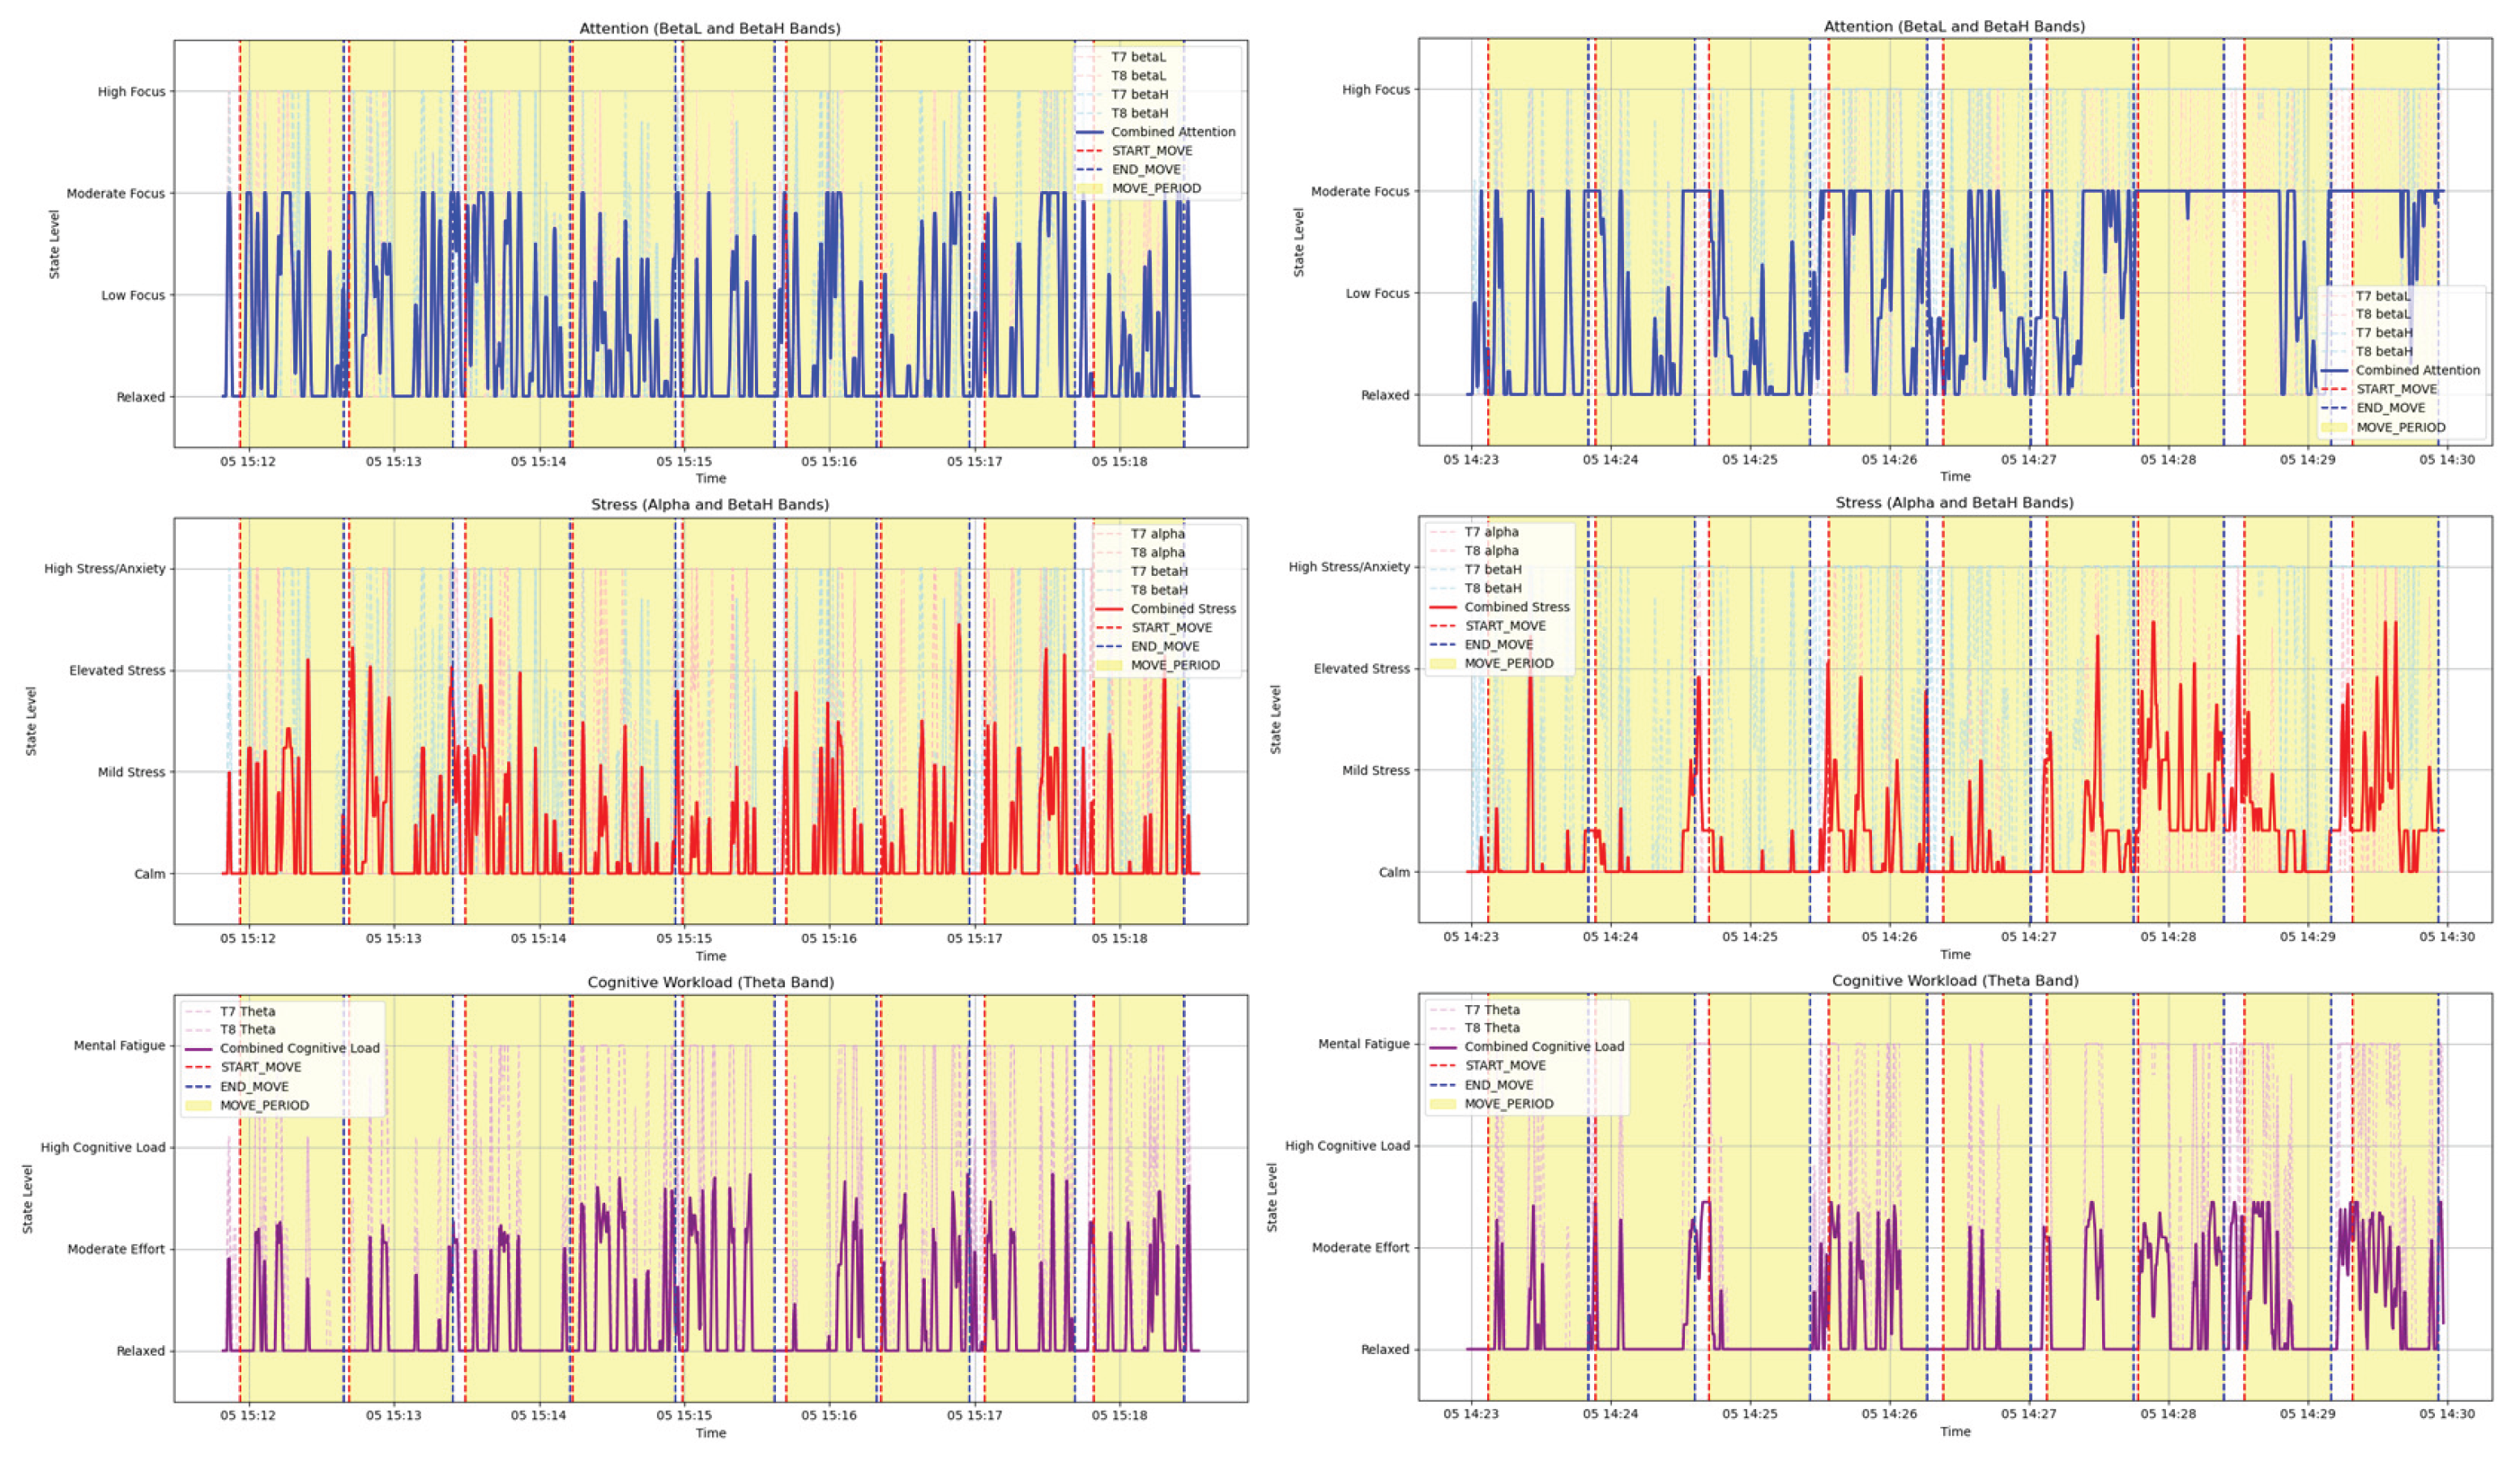
For example, results obtained for the user_1 and user_2 are presented in Figure 5 (one user per group). These results are almost identical to those recorded for the other users of the same groups. The three graphs in the left part of Figure 5 represent attention/focus, stress, and cognitive load for the user_2 who did not benefit from acoustic aids. The graphs in the right part show results for the user_1 who took advantage of acoustic signals. It is essential to notice that the yellow background areas between pairs of dotted red and dotted blue lines represent the motion of the cobot. The four classification levels are indicated on the ordinates, whereas the axis of abscissas shows the time of the experiment.
Figure 5.
Example of graphs generated for each user. The left graph shows attention, stress, and cognitive load for the user_2 belonging to the first group. In contrast, the right graph represents the user_1 situation that took advantage of acoustic alerts denoting the start of each cobot movement.
Figure 5.
Example of graphs generated for each user. The left graph shows attention, stress, and cognitive load for the user_2 belonging to the first group. In contrast, the right graph represents the user_1 situation that took advantage of acoustic alerts denoting the start of each cobot movement.
Users were asked to complete the NASA-TLX questionnaire at the end of each test to compare objective measures with subjective insights. the NASA-TLX scores for the two groups are shown in Figure 6: the left histogram plots the scores for the users of group 1 (users 2, 3, and 5), whereas the right histogram plots the result for the second group (users 1, 4, and 6) that took advantage of the acoustic alerts.
4. Discussion
The answer to RQ1 is complex. Indeed, the three considered mental conditions (attention, stress, and cognitive load) can be objectively evaluated, but the MN8 device cannot be used to gather accurate quantitative measures, and the obtained findings can only be considered qualitative and categorized by levels. Raw EEG data obtained by the two electrodes T7 and T8 do not allow an accurate computation of the power bands, thus not supporting a quantitative measure of the mental conditions.
Although very preliminary, results obtained when users did not benefit from acoustic alerts are much “noisier” (see left graphs in Figure 5). As expected, the stress level grows immediately after each dotted red line. The comparison between users of the two groups outlines that the attention/focus is steadier when acoustic alerts are available. Moreover, the levels of stress and mental workload are significantly reduced. Therefore, a positive answer to RQ2 can be given.
On the other hand, data collected by the BCI are only partially coherent with the subjective evaluation obtained by the questionnaire. Histograms in Figure 6 indicate a higher average level of frustration for users 2, 3, and 5 (without acoustic alerts), which means a higher stress level. This is coherent with the stress level measures by the BCI. On the other hand, users 1, 4, and 6 experienced a higher average level of mental demand, which can be associated with a higher mental workload. This is not coherent with the cognitive level detected by the BCI. Moreover, acoustic alerts have also been understood to point to the rhythm of assembly operations, thus increasing the temporal demand.
Unexpectedly, sound alerts minimized the physical demand; users 2, 3, and 5 had to move many more times than users 1, 4, and 6, as they were not ready to share the workspace with the robotic arm. This can be another factor contributing to the users’ stress.
4.1. Limitations
The findings of this research, although very promising, have some limitations. First, the number of users involved in tests is limited: two groups of three users each cannot be considered sufficient for an exhaustive statistical analysis. Moreover, selected users have a computer science background that can help them cope with advanced technologies like BCIs. Assembly domain experts should also be involved in more specific and realistic tests.
The device selected for this research (the MN8 Emotiv) is very easy to wear, and its ergonomics is comparable to “classic” earphones. Moreover, this device can easily be used by people wearing glasses. For this reason, all the users involved in the tests did not experience any problems. On the other hand, just two electrodes/channels are provided (T7 and T8), limiting the accuracy of the recorded brain waves and thus restricting the measures, as said before, to qualitative values.
Raw EEG data are collected and elaborated offline at the end of the test. This approach does not allow for dynamically adapting the cobot’s behavior to the user’s mental conditions. For instance, when stress and cognitive load grow, the cobot should slow down; on the contrary, when the user’s attention is high, the cobot could maximize its speed, thus allowing the human operator to obtain the best performance from collaboration.
Finally, the selected scenario is only partially representative of possible human-robot collaborations. More dynamic setups should be considered: the human operators should be able to move, thus leaving and entering over and over from the shared workspace. Possible interferences between the human operator and the robot would be more difficult to predict and manage, potentially inducing greater stress and cognitive load. Figure 5 shows that the three mental conditions evaluated might not reach the maximum levels, and more challenging setups could be arranged.
5. Conclusions
This paper evaluates the mental workload and stress when human operators share the workplace with collaborative robots. Even if only a qualitative evaluation is provided and the number of users involved in tests is limited, the obtained results clearly show how an affordable and ergonomics BCI interface can be used to detect stress and cognitive load, thus qualitatively monitoring human performance. Moreover, acoustic signals denoting the cobots’ intentions can mitigate stress and cognitive load and improve focus and attention.
Future work will aim to extend the aid set for users. Acoustic signals can be substituted or complemented by visual information: the robotic arm trajectories might be displayed if the user wears augmented reality (AR) glasses, thus clearly representing the space volumes occupied by the cobot. Furthermore, the cobot’s intentions could also be represented by graphic metaphors (e.g., arrows), thus enhancing the level of comprehension between human operators and machines.
Author Contributions
Conceptualization, A.S. and F.M; methodology, A.S. and F.M.; software, C.C.; validation, C.C. and F.M.; formal analysis, C.C., F.M., and A.S.; investigation, F.M. and A.S.; resources, A.S.; data curation, C.C. and F.M.; writing—original draft preparation, A.S. and F.M.; writing—review and editing, A.S. and F.M.
Funding
This research received no external funding.
Institutional Review Board Statement
This study did not require ethical approval.
Informed Consent Statement
Informed consent was obtained from all subjects involved in the study.
Data Availability Statement
No new data are available.
Conflicts of Interest
The authors declare no conflicts of interest.
Abbreviations
The following abbreviations are used in this manuscript:
| BCI | Brain-computer interface |
| cobot | Collaborative robot |
| EDA | Electrodermal Activity |
| EEG | Electroencephalogram |
| EMG | Electromyogram |
| FFT | Fast Fourier transform |
| HRC | Human-robot collaboration |
| ISO | International Organization for Standardization |
| MDPI | Multidisciplinary Digital Publishing Institute |
| SART | Sustained attention to response task |
| SPR | Skin potential response |
References
- Müller, R.; Vette, M.; Geenen, A. Skill-based dynamic task allocation in Human-Robot-Cooperation with the example of welding application. Procedia Manuf. 2017, 11, 13–21. [Google Scholar] [CrossRef]
- ISO/TS 15066:2016 Robots and robotic devices — Collaborative robots. Available online: https://www.iso.org/standard/62996.html (accessed on 2 April 2025).
- Pacaux-Lemoine, M.P.; Flemisch, F. Layers of shared and cooperative control, assistance and automation. Cogn. Technol. Work. 2019, 21, 579–591. [Google Scholar] [CrossRef]
- Pacaux-Lemoine, M. P.; & Trentesaux, D. Ethical risks of human-machine symbiosis in industry 4.0: insights from the human-machine cooperation approach. IFAC-PapersOnLine 2019, 11, 19–24.
- Pacaux-Lemoine, M. P.; & Flemisch, F. Layers of Shared and Cooperative Control, assistance and automation. IFAC-PapersOnLine 2016, 49, 159–164.
- Schneemann, F.; Diederichs, F. Action prediction with the jordan model of human intention: A contribution to cooperative control. Cogn. Technol. Work. 2019, 21, 579–591. [Google Scholar] [CrossRef]
- The NASA Task Load Index (TLX) v. 1.0 Manual (1986): https://humansystems.arc.nasa.gov/groups/TLX/downloads/TLX.pdf (accessed on 2 April 2025).
- Lu, L.; Xie, Z.; Wang, H.; Li, L.; Xu, X. Mental stress and safety awareness during human-robot collaboration-Review. Applied ergonomics 2022, 105, 103832. [Google Scholar] [CrossRef] [PubMed]
- Arai, T.; Kato, R.; Fujita, M. Assessment of operator stress induced by robot collaboration in assembly. CIRP annals 2010, 59(1), 5–8. [Google Scholar] [CrossRef]
- Mariscal, M.A.; Ortiz Barcina, S.; García Herrero, S.; López Perea, E. M. Working with collaborative robots and its influence on levels of working stress. International Journal of Computer Integrated Manufacturing 2024, 37(7), 900–919. [Google Scholar] [CrossRef]
- Mridha, M.F.; Das, S.C.; Kabir, M.M.; Lima, A.A.; Islam, M.R.; Watanobe, Y. Brain-Computer Interface: Advancement and Challenges. Sensors 2021, 21, 5746. [Google Scholar] [CrossRef] [PubMed]
- The MN8 Emotiv device. Available online: https://www.emotiv.com/products/mn8 (accessed on 2 April 2025).
- Nayak C.S.; Anilkumar A.C. EEG Normal Waveforms. https://www.ncbi.nlm.nih.gov/books/NBK539805/ (accessed on 2 April 2025).
- Puma, S.; Matton, N.; Paubel, P.V.; Raufaste, E.; El-Yagoubi, R. Using theta and alpha band power to assess cognitive workload in multitasking environments. International journal of psychophysiology 2018, 123, 111–120. [Google Scholar] [CrossRef] [PubMed]
- Fernandez Rojas, R.; Debie, E.; Fidock, J.; Barlow, M.; Kasmarik, K.; Anavatti, S.; Garratt, M.; Abbass, H. Electroencephalographic workload indicators during teleoperation of an unmanned aerial vehicle shepherding a swarm of unmanned ground vehicles in contested environments. Frontiers in neuroscience 2020, 14, 40. [Google Scholar] [CrossRef] [PubMed]
- Homan, R.W.; Herman, J.; Purdy, P. Cerebral location of international 10-20 system electrode placement. Electroencephalography and Clinical Neurophysiology 1987, 66(4), 376–82. [Google Scholar] [CrossRef] [PubMed]
- Ackerman, E.; Strickland, E. Are You Ready for Workplace Brain Scanning?: Leveraging brain data will make workers happier and more productive, backers say. IEEE Spectrum 2022, 59(12), 46–52. [Google Scholar] [CrossRef]
- EmotivPro web page. Available online: https://www.emotiv.com/products/emotivpro (accessed on 2 April 2025).
- Bagheri, M.; Power, S.D. Simultaneous Classification of Both Mental Workload and Stress Level Suitable for an Online Passive Brain–Computer Interface. Sensors 2022, 22(2), 535. [Google Scholar] [CrossRef] [PubMed]
- Jun G.; Smitha, K.G. EEG based stress level identification». In Proceedings of the IEEE International Conference on Systems, Man, and Cybernetics (SMC), 2016, pp. 003270–-003274.
- Stroop, J.R. Studies of interference in serial verbal reactions. Journal of Experimental Psychology 1935, 18, 643–662. [Google Scholar] [CrossRef]
- Mohammadpour, M.; Mozaffari, S. Classification of EEG-based attention for brain computer interface. In Proceedings of the 3rd Iranian conference on intelligent systems and signal processing (ICSPIS), 2017, 34–37.
- Rizzo, R.; Knight, S.P.; Davis, J.R.; Newman, L.; Duggan, E.; Kenny, R.A.; Romero-Ortuno, R. Longitudinal study on sustained attention to response task (SART): Clustering approach for mobility and cognitive decline. Geriatrics 2022, 7(3), 51. [Google Scholar] [CrossRef] [PubMed]
- Smitha, K.G.; Xin, N.Y.; Lian, S.S.; Robinson, N. Classifying subjective emotional stress response evoked by multitasking using EEG. In Proceedings of IEEE International conference on systems, man, and cybernetics (SMC), 2017, 3036–3041.
- The Vise Web Site. Available online: https://www.thingiverse.com/thing:2064269 (accessed on 2 April 2025).
- e.DO Website. Available online: https://edo.cloud/ (accessed on 2 April 2025).
Figure 1.
The 10-10 international system.
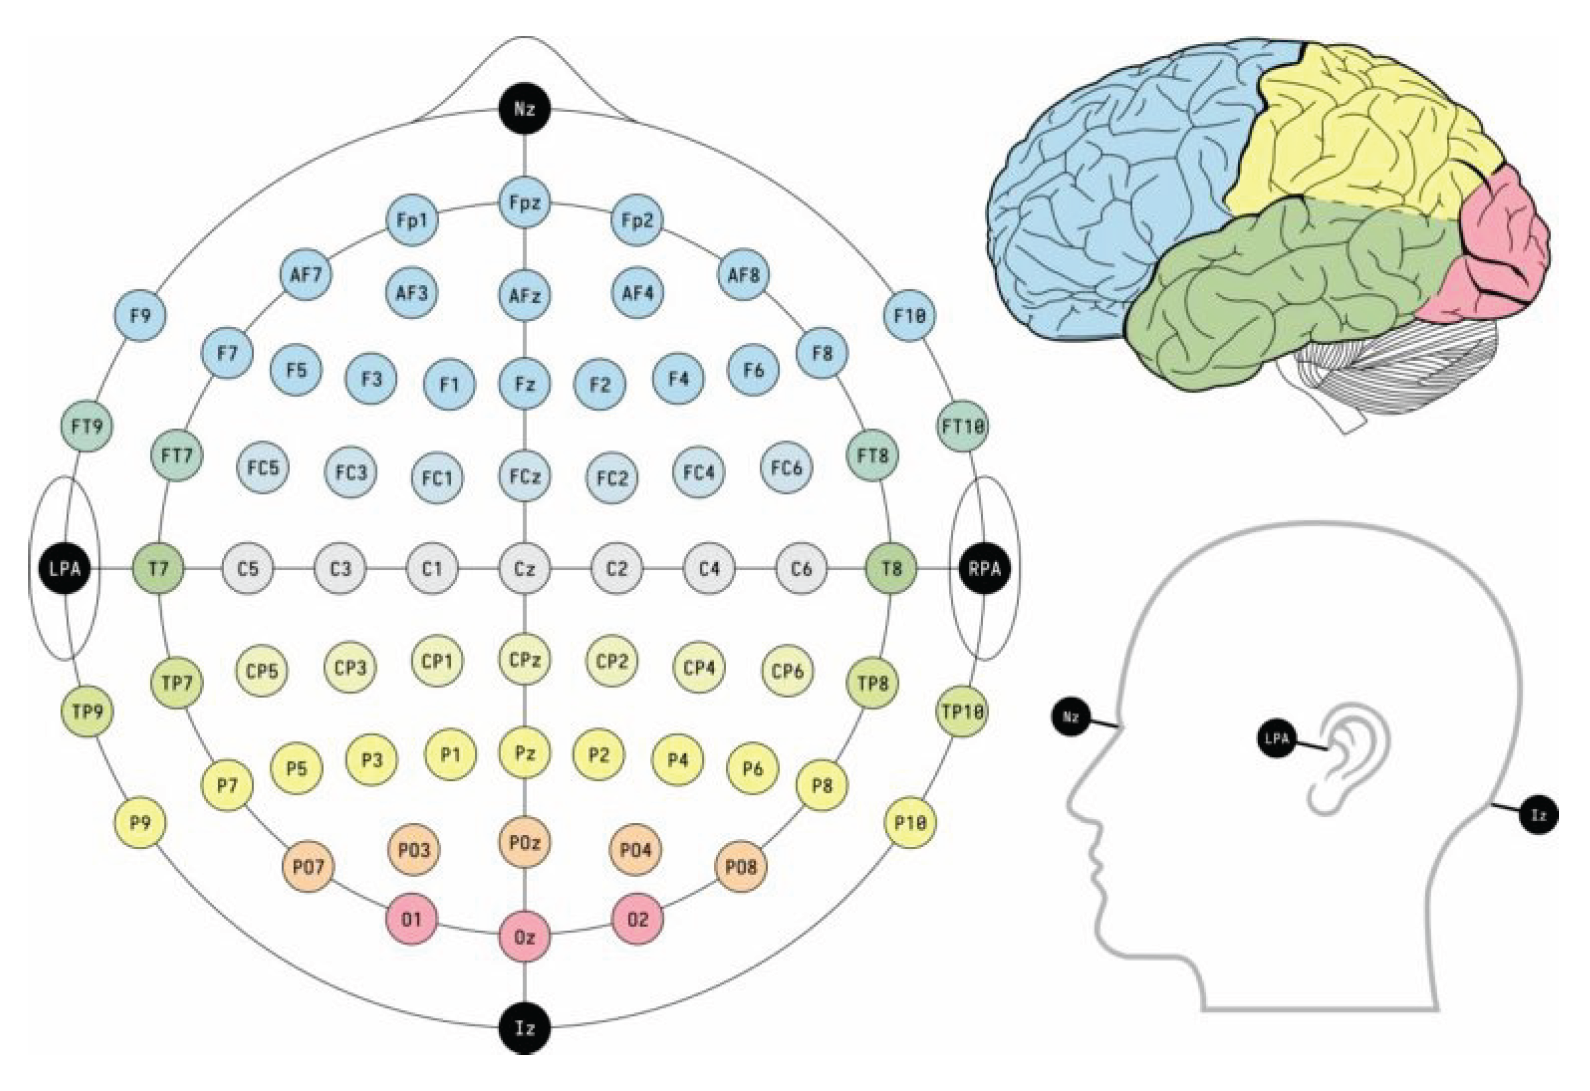
Figure 2.
EEG raw data are converted into power bands. In particular, this picture represents high attention and low cognitive stress.
Figure 2.
EEG raw data are converted into power bands. In particular, this picture represents high attention and low cognitive stress.
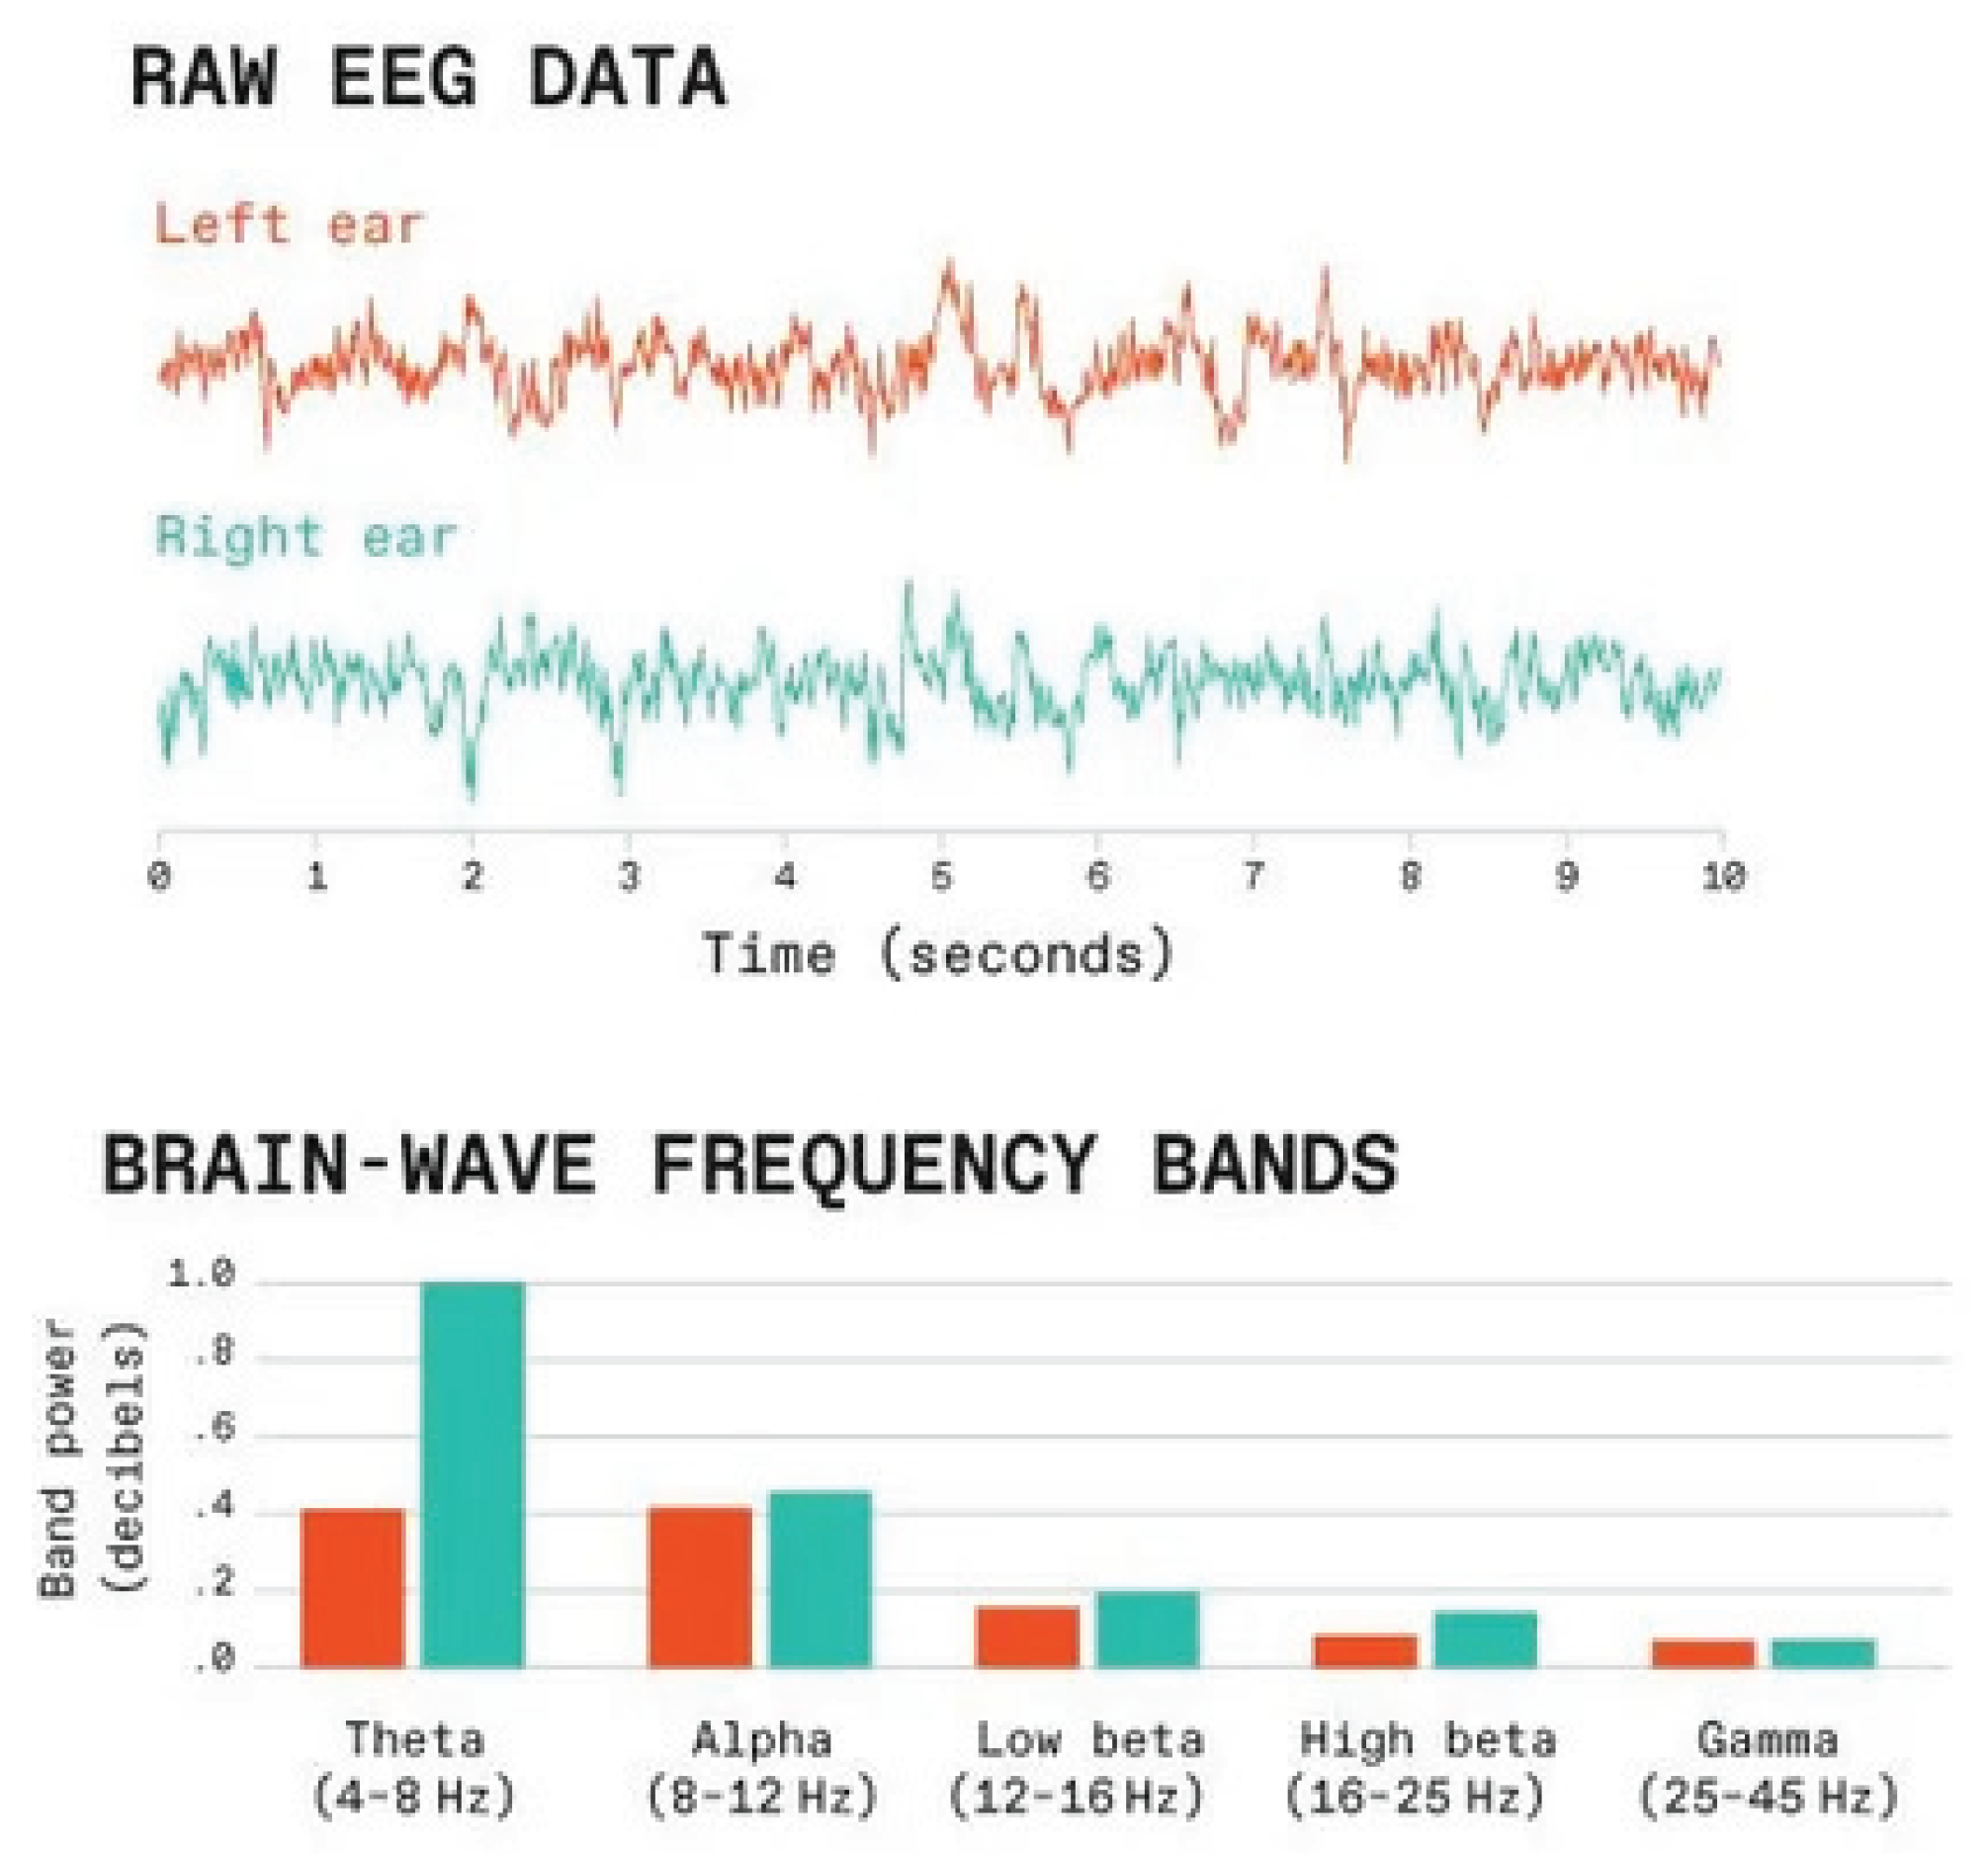
Figure 3.
The test protocol: an initial questionnaire is filled out to gather statistical information, then a relaxing session, a stress session, and the collaborative session with the cobot follow. The NASA-TLX is filled out during the last step.
Figure 3.
The test protocol: an initial questionnaire is filled out to gather statistical information, then a relaxing session, a stress session, and the collaborative session with the cobot follow. The NASA-TLX is filled out during the last step.
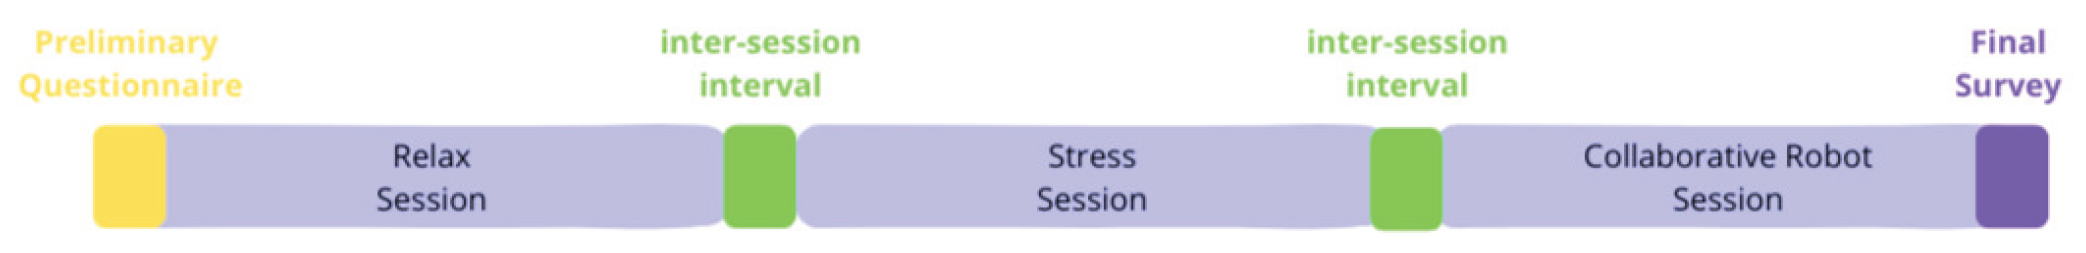
Figure 4.
The test setup: a user is wearing the MN8 device, and the picking area is visible at the right of e.Do robot; the user shares the releasing area to the left of the cobot.
Figure 4.
The test setup: a user is wearing the MN8 device, and the picking area is visible at the right of e.Do robot; the user shares the releasing area to the left of the cobot.
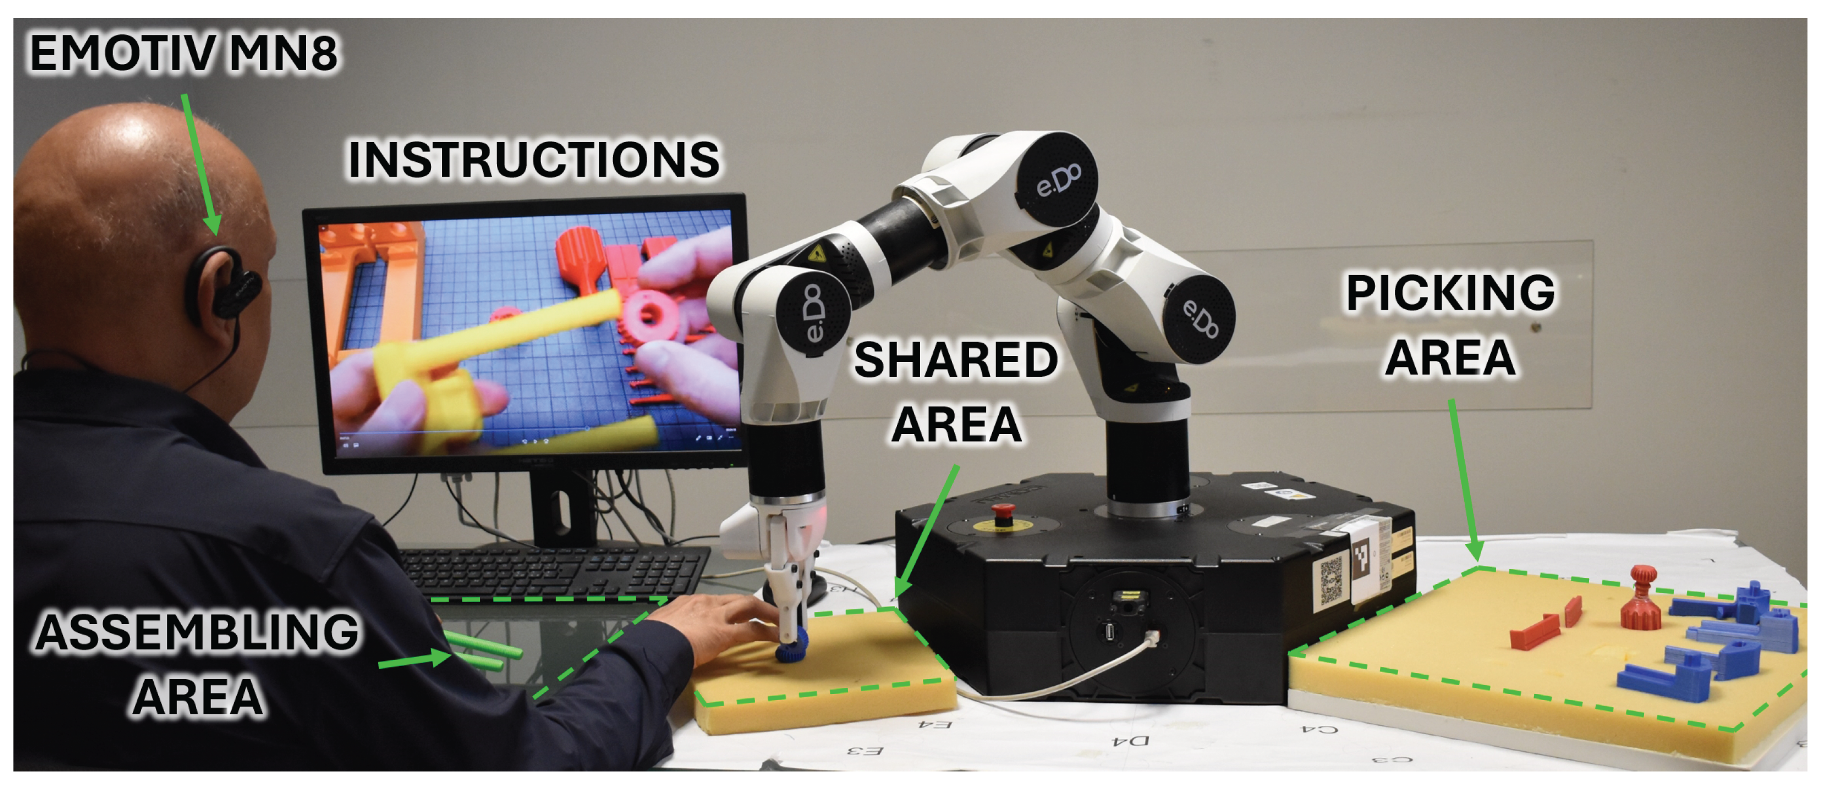
Figure 6.
The six dimensions of the NASA-TLX questionnaire: the left histogram plots the scores for the users of group 1, whereas the right histogram plots the result for the second group that took advantage of the acoustic alerts.
Figure 6.
The six dimensions of the NASA-TLX questionnaire: the left histogram plots the scores for the users of group 1, whereas the right histogram plots the result for the second group that took advantage of the acoustic alerts.
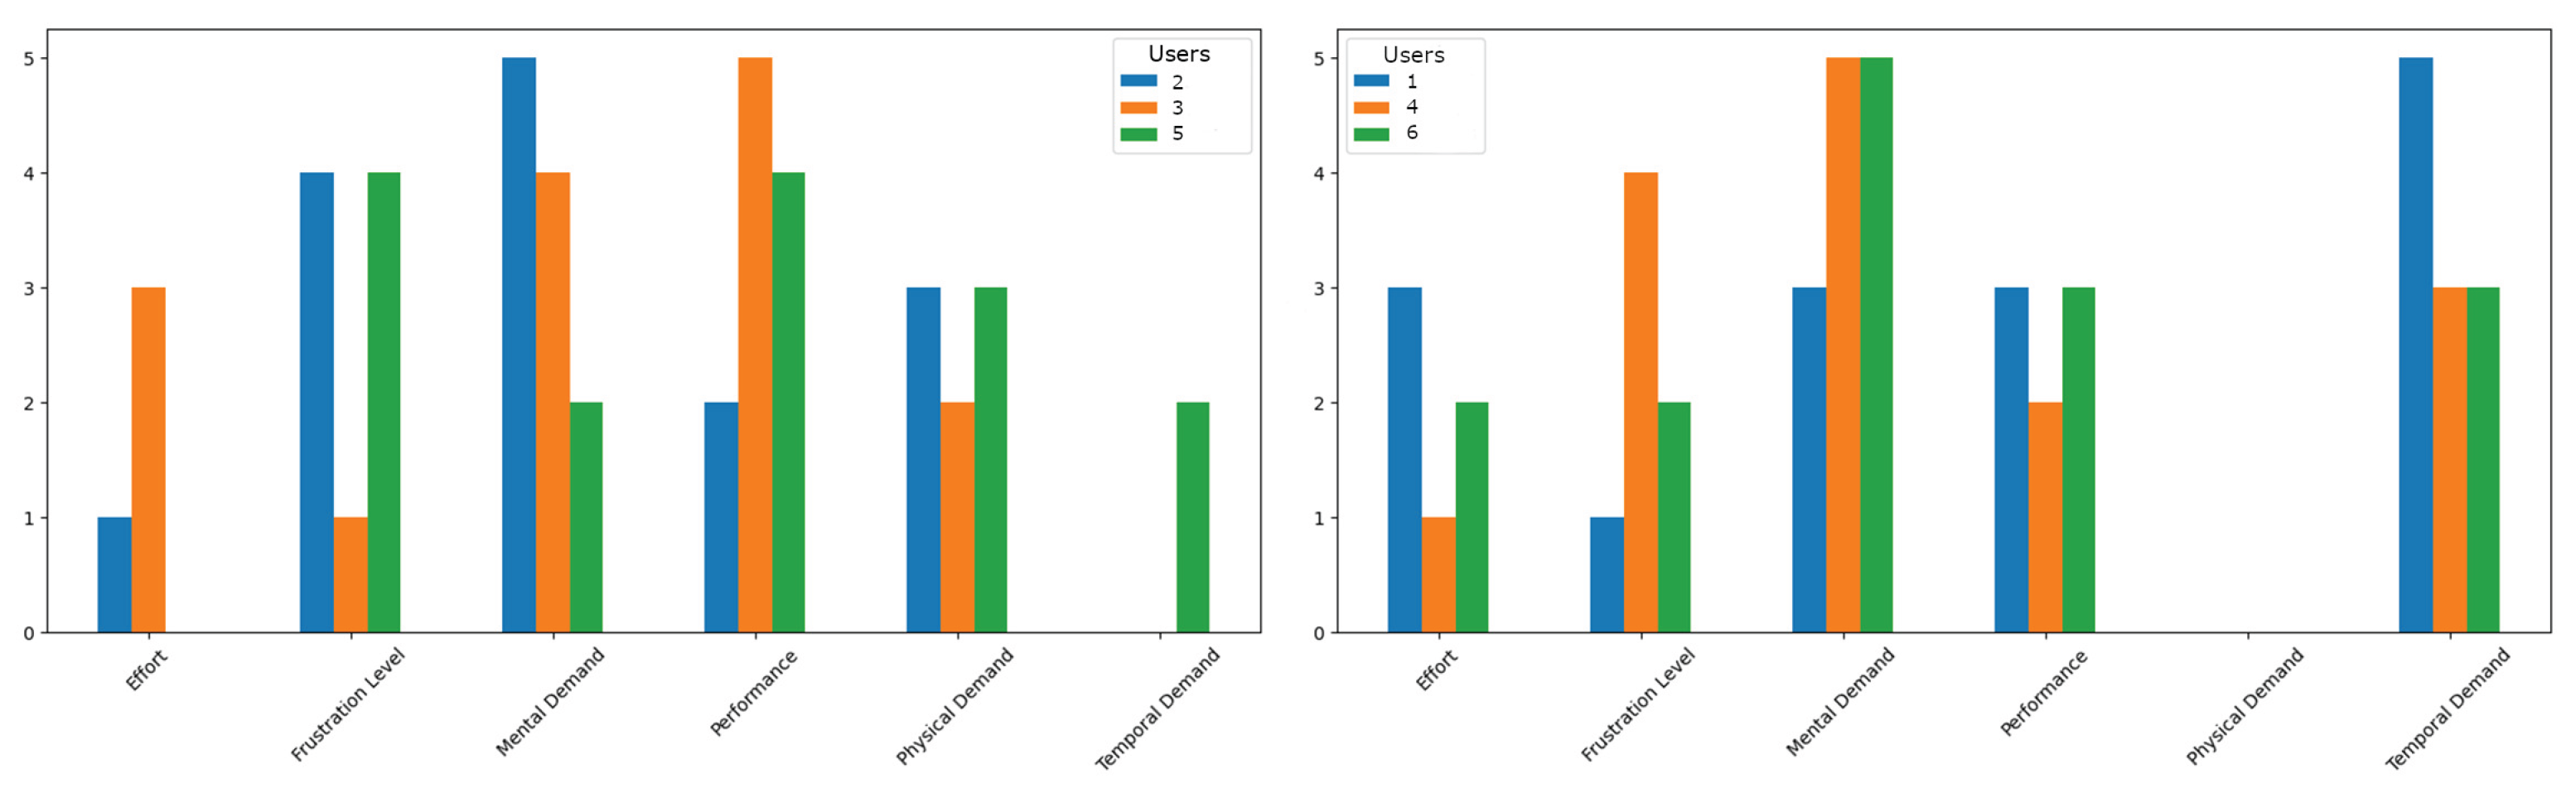

Table 1.
A summary of the correlations among frequency bands related to the mental workload known in the literature.
Table 1.
A summary of the correlations among frequency bands related to the mental workload known in the literature.
| Index | Cognitive behavior | Description |
|---|---|---|
| mental workload, focus, attention | waves amplitude grows for tasks requiring extended focus and attention | |
| mental workload, fatigue, and attention | waves amplitude grows when the user keeps their eyes closed; a growing power is associated with lower mental alertness and readiness | |
| mental workload, focus, and visual attention | waves amplitude grows when the user is focused and performs mental tasks; these waves also indicate visual attention | |
| mental effort, attention, and vigilance | this index has been used to denote readiness, commitment, mental focus, and cognitive workload | |
| workload, mental effort | this index is based on the assumption that grows when the user is relaxed and grows when the user is focused and aware | |
| work memory, attention, and drowsiness | this index is based on the assumption that when the readiness and the commitment grow, the waves power grows and the waves power decreases |
Disclaimer/Publisher’s Note: The statements, opinions and data contained in all publications are solely those of the individual author(s) and contributor(s) and not of MDPI and/or the editor(s). MDPI and/or the editor(s) disclaim responsibility for any injury to people or property resulting from any ideas, methods, instructions or products referred to in the content. |
© 2025 by the authors. Licensee MDPI, Basel, Switzerland. This article is an open access article distributed under the terms and conditions of the Creative Commons Attribution (CC BY) license (http://creativecommons.org/licenses/by/4.0/).
Copyright: This open access article is published under a Creative Commons CC BY 4.0 license, which permit the free download, distribution, and reuse, provided that the author and preprint are cited in any reuse.


