
Submitted:
16 May 2025
Posted:
16 May 2025
You are already at the latest version
Abstract
This study explores the synthesis, characterization, and extraction efficiency of hydrophobic natural deep eutectic solvents (NADES), along with the allergen-modulating potential of extracted bioactive compounds. Six NADES were synthesized using binary combinations of camphor, thymol, eugenol, and menthol (1:1 molar ratio) and characterized using FTIR, TGA, DFT, and MD simulations. Bioactive compounds were extracted from Thujopsis dolabrata wood biomass via ultrasonic-assisted extraction and analyzed using GC-MS. Molecular docking was performed to assess their allergen-modulating interactions with Amb a 1 and Cry j 1. All NADES exhibited single-stage decomposition (110–125°C) except camphor-menthol, which recrystallized. FTIR and simulations confirmed strong hydrogen bonding in eugenol-based NADES, particularly menthol-eugenol. Extraction identified 47 bioactive compounds, with 4,5α-Epoxy-3-methoxy-17-methyl-7α-(4-phenyl-1,3-butadienyl)-6β,7β-(oxymethylene) morphinan as the most abundant (9.31–11.16%). It exhibited the highest binding affinity (Cry j 1: -8.60 kcal/mol, Amb a 1: -7.40 kcal/mol) and lowest inhibition concentration (Cry j 1: 0.49 µM, Amb a 1: 3.74 µM), suggesting strong allergen-modulating potential. Hydrophobic interactions and hydrogen bonding drove protein-ligand binding. These findings highlight NADES as effective, sustainable solvents for extracting bioactive compounds with allergen-modulating potential.
Keywords:
Thujopsis dolabrata
; natural deep eutectic solvents
; molecular dynamics simulations
; phytochemicals
1. Introduction
Medicinal plants have served as the foundation of traditional healthcare systems for millennia, serving as reservoirs of bioactive compounds with diverse therapeutic properties (Ikpa & Maduka, 2020). These plants synthesize phytochemicals including alkaloids, terpenoids, flavonoids, steroids, tannins, and phenolics in their flowers, bark, seeds, stems, leaves, and roots, which confer antioxidant, anti-inflammatory, antimicrobial, and immunomodulatory effects (Huang et al., 2025; Ullah et al., 2020, Parham et al., 2020, Kalyniukova et al., 2021). Approximately 75–80% of the global population relies on plant-based medicines for primary healthcare (Maduka et al., 2024), underscoring their enduring relevance. Among these plants, Thujopsis dolabrata (T. dolabrata) has a historical use in treating respiratory ailments, skin infections, and inflammatory conditions. Its essential oils and extracts, rich in hinokitiol, thujopsene, and cedrene, exhibit potent antimicrobial, antifungal, and anti-allergic activities (Maduka et al., 2024).
Pollen allergy (pollinosis), a seasonal allergic rhinitis triggered by airborne allergens such as Cry j 1 (the major allergen of Japanese cedar, Cryptomeria japonica) and Amb a 1 (the dominant allergen of ragweed, Ambrosia artemisiifolia), represents a growing global health crisis. In Japan, Cry j 1-driven pollinosis has reached epidemic proportions, affecting 38.8% of the population by 2019, a stark rise from 16.2% in 1998 (Lin et al., 2023). Similarly, Amb a 1-induced allergies plague millions in North America and Europe, with ragweed pollen seasons intensifying due to climate change (Zbîrcea et al., 2023; Wopfner, et al., 2009). Both allergens trigger chronic symptoms; rhinorrhea, sneezing, and ocular irritation by binding to IgE antibodies and activating mast cells and eosinophils, severely impairing quality of life (QOL) (Lin et al., 2023; Traidl-Hoffmann et al., 2021). Despite their socioeconomic impact, current therapies (e.g., antihistamines, corticosteroids) offer only symptomatic relief and fail to neutralize allergenicity or prevent immune sensitization (Kalyniukova et al., 2021; Bonini et al., 2022). This underscores the urgency to develop therapies targeting Cry j 1 and Amb a 1 directly, such as plant-derived compounds that inhibit allergen-antibody interactions or suppress inflammatory cascades (Maduka et al., 2024; Lin et al., 2023). The success of Todomatsu oil in mitigating Cry j 1 allergenicity (Lin et al., 2023) and the exploratory findings on Hiba wood’s mast cell-inhibitory effects (Maduka et al., 2023) highlight the untapped potential of coniferous phytochemicals. Similarly, studies on ragweed-allergy therapies emphasize the role of plant phenolics in destabilizing Amb a 1 structure or blocking its epitopes (Jahn-Schmid et al., 2016; Egger et al., 2021). However, translating these discoveries into treatments requires optimized extraction methods to isolate bioactive compounds efficiently while preserving their functional integrity.
The efficacy of plant-based therapies hinges on the extraction and isolation of bioactive phytochemicals. Conventional extraction methods employ organic solvents like ethanol, methanol, and chloroform, which are criticized for their toxicity, environmental persistence, and high energy demands ((Nortjie et al., 2022, Thakur & Pathania, 2020; Srivastava et al., 2024). In response, deep eutectic solvents (DES) are a promising alternative to conventional organic solvents and gained popularity because they are green, non-toxic, biodegradable, and recyclable (Fourmentin et al., 2020). Eutectic solvents can be defined as a mixture of two or more compounds whose eutectic melting temperature (Tf) is lower than that calculated assuming ideal behavior (Tidf) (Martins et al., 2018). When the difference (Tidf − Tf) is notably high, these mixtures are classified as deep eutectic solvents (Smith et al., 2014). DESs are formed through the combination of a hydrogen bond donor (HBD) and a hydrogen bond acceptor (HBA) in specific ratios and composition windows. Based on their composition, DESs are categorized into five types: Type I (quaternary ammonium salt with metal chloride), Type II (quaternary ammonium salt with metal chloride hydrate), Type III (quaternary ammonium salt with organic compounds such as carboxylic acids or alcohols), Type IV (metal chloride hydrate with organic compounds), and Type V (non-ionic organic molecular HBDs and HBAs) (Rafati et al., 2025; Omar & Sadeghi, 2023). Type V DESs, which incorporate chelating polar groups and natural extracts such as terpenes or fatty acids, are particularly advantageous due to their non-ionic nature (Omar & Sadeghi, 2023).
Terpenes and terpenoids have recently emerged as promising components for forming type V hydrophobic deep eutectic solvents (HDESs) (Rafati et al., 2025; Rodríguez-Llorente et al., 2020; Martins et al., 2019). As naturally occurring compounds, their combinations can be classified as natural DESs (NADESs), which are generally considered environmentally friendly (Martins et al., 2018; Liu et al., 2018; Paiva et al., 2014). Our study utilized three monoterpenoids (camphor, thymol, and dl-menthol) and one phenylpropanoid (eugenol) commonly associated with terpenoids due to its presence in essential oils. Camphor (1,7,7-trimethylbicyclo [2,2,1]heptan-2-one), derived from laurel tree wood distillation, possesses a bicyclic hydrophobic region responsible for its biological properties including insecticidal, antiviral, anticancer, and analgesic activities (Zielińska-Błajet et al., 2021; Padilla et al., 2024). Despite its toxicity (lethal dose: 50–500 mg/kg in adults), regulatory agencies like FDA limit its concentration to 11% in products (Santos & Cabot, 2015). Thymol (5-Methyl-2-(propan-2-yl)phenol) and dl-menthol (5-Methyl-2-(propan-2-yl)cyclohexan-1-ol) both contain alcohol groups but differ in aromaticity, with thymol being aromatic while menthol is not. Extracted from thyme and mint respectively, both compounds are FDA-classified as Generally Recognized as Safe (GRAS) food additives with low toxicity (Padilla et al., 2024). Beyond their widespread use in food and cosmetics for their aroma and flavor, they exhibit anti-inflammatory, antimicrobial, and antioxidant properties, enhancing permeation capacity in pharmaceutical formulations (Escobar et al., 2020; Kamatou et al., 2013). Eugenol, a pale-yellow oily liquid found in essential oils like clove, is a phenylpropanoid with an allyl group substituted on guaiacol. This compound serves as a key ingredient in pharmaceutical, food, and cosmetic products, though at restricted concentrations (Nejad et al., 2017). Its applications include use as a local antiseptic and anesthetic, with documented antimicrobial, anti-inflammatory, analgesic, and antioxidant activities (Nejad et al., 2017). Despite concerns about potential dermatitis and allergic reactions from skin contact, eugenol has received FDA GRAS classification as a food additive (Nejad et al., 2017; Nisar et al., 2021).
Previous research has explored the extraction potential of various binary mixtures including thymol:menthol (Martins et al., 2019; Van Osch et al., 2019), thymol:camphor (Martins et al., 2019; Rafati et al., 2025), thymol:eugenol (Osiecka et al., 2024), and camphor:menthol (Goswami et al., 2024). However, to the best of our knowledge, the NADESs comprising menthol:eugenol and camphor:eugenol combinations remain unexplored. This study aimed to explore ultrasound-assisted extraction (UAE) combined with natural deep eutectic solvents (NADES) as green solvents for the sustainable recovery of compounds from Thujopsis dolabrata wood biomass. We present the first application of NADES for wood biomass extraction, evaluating several low-viscosity hydrophobic DESs for their extraction efficacy. Our investigation included two novel formulations—menthol:eugenol and camphor:eugenol—alongside established combinations (thymol:menthol, thymol:camphor, thymol:eugenol, and camphor:menthol). The physicochemical properties of these DESs were comprehensively characterized using Fourier-transform infrared spectroscopy (FTIR) and thermogravimetric (TG) analysis, while molecular dynamics (MD) simulations and quantum mechanical (QC) calculations provided insights into their molecular structure and formation mechanisms. Additionally, molecular docking analysis was conducted to evaluate the potential of the extracted compounds in suppressing allergens, specifically targeting Cry j1 and Amb a 1. Finally, the findings in this study bridge phytotherapy and green chemistry, advancing plant-based solutions for global health challenges while aligning with eco-friendly industrial practices.
2. Materials and Methods
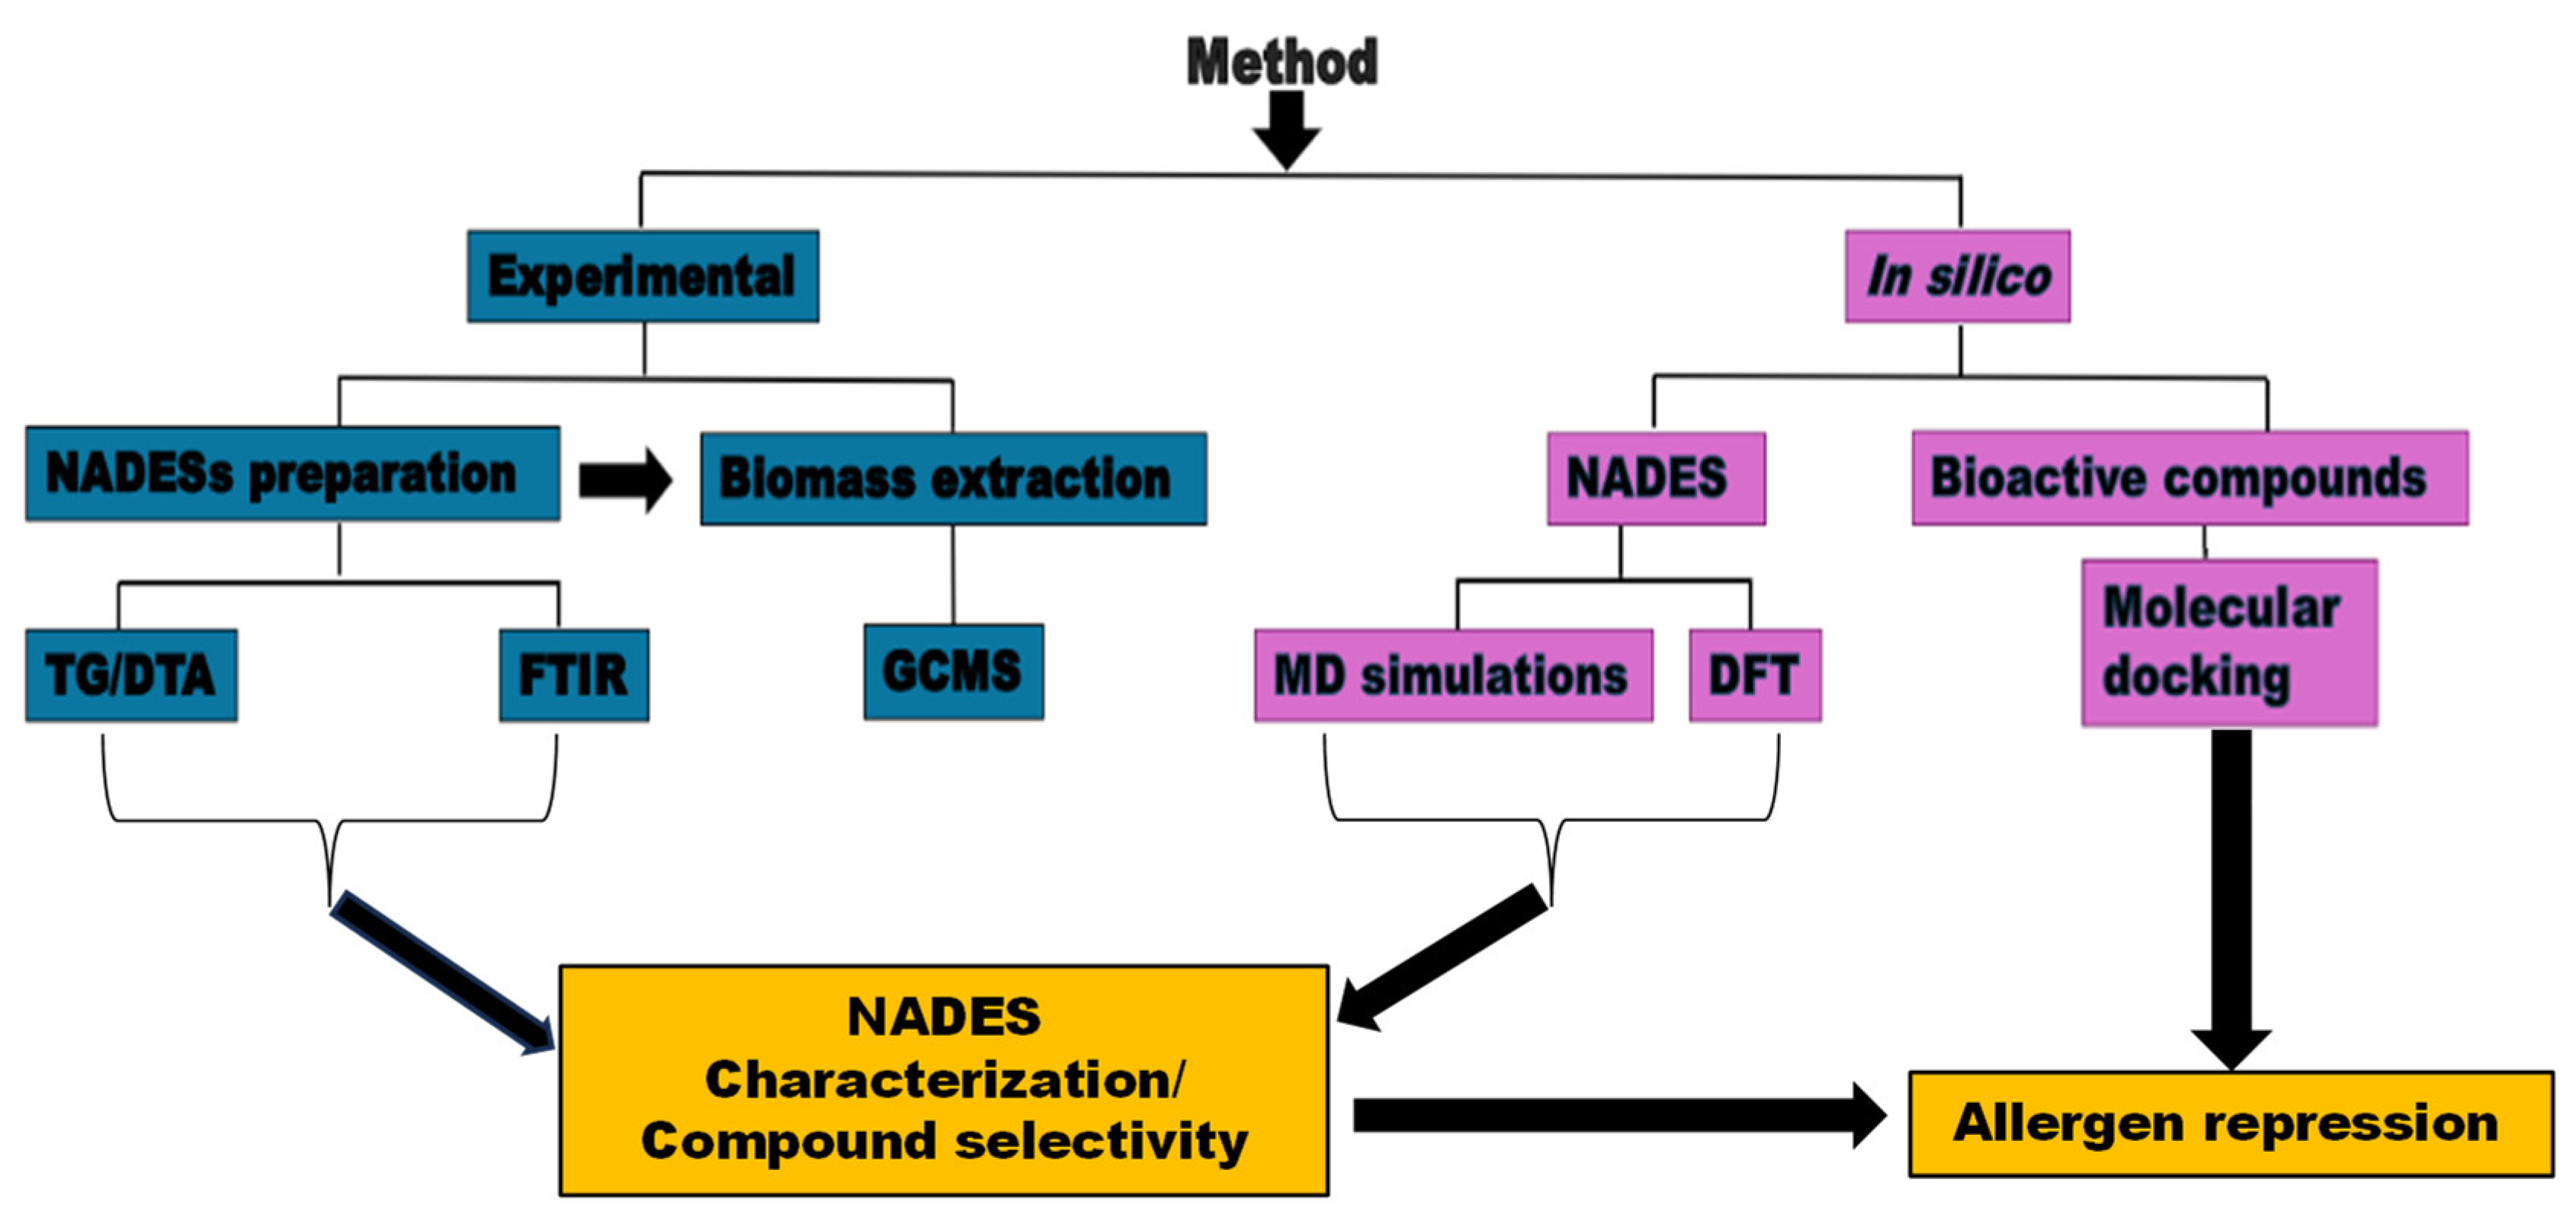
Figure 1.
Schematic flowchart of current study, NADES preparation, characterization, extraction and potential allergen repressing investigation.
Figure 1.
Schematic flowchart of current study, NADES preparation, characterization, extraction and potential allergen repressing investigation.
2.1. Experimental
2.1.1. Chemicals/ Reagents
The chemicals reagents: Thymol, DL-Menthol, Camphor, and Eugenol were supplied by Fujifilm wako pure chemical corporation, Japan (Table 1). Pulverized Hiba (Thujopsis dolabrata) wood biomass was collected from Aomori prefecture, Japan.
2.1.2. Synthesis of the Natural Deep Eutectic Solvents
NADES were prepared using the heating-stirring method with a magnetic stirrer according to previously reported methodology (Boudesocque-Delaye et al., 2024). In this study, HBA-HBD at 1:1 molar ratio was mixed in a glass vessel. The mixture was heated at 50 ◦C with a rotational speed of 500 rpm until a clear and homogeneous solution is obtained.
2.1.3. NADES Characterization
The NADES and its individual components were studied using Fourier Transform infrared spectroscopy (FTIR) Jasco Technologies FTIR spectrophotometer 6100 FTIR equipped with a ZnSe-ATR system. The sample to be analyzed was placed over the light path, the respective interference was measured as a transform for wavenumber from 450 to 4000 cm−1 at a resolution of 4 cm−1.The samples were tested in their original phases (solid and liquid phases). TGA is a technique used to study the thermal stability and decomposition behavior of materials as a function of temperature. The thermal stability of the NADES was investigated using a thermogravimetric analyzer Shimadzu DTG-60. The NADES with a mass of 10 ± 0.2 mg sealed in a 70 μL aluminum oxide pan was heated from 30 °C to 400 °C with a heating rate of 10 °C/min in a nitrogen atmosphere with a flow rate of 100 mL/min.
2.1.4. Ultrasonic Assisted Extraction Principle
The extraction procedure was done by extracting 200mg of biomass by 2 g of NADES for 30 min using an ultrasonic bath 40kHz (Desktop Ultrasonic Cleaner (Sono Cleaner, 200D) Kaijo Corporation) at 35 °C, similar to Boudesocque-Delaye et al. (2024). The resulting extracts were centrifuged at 1000 rpm for 5 minutes, after which the supernatant was carefully collected and filtered using a 5 µm PTFE syringe filter before GC-MS analysis.
2.1.5. Determination of Components of the Extract
The analysis was performed using a 0.25 mm i.d. × 30 m InertCap 17 column (GL Sciences Inc., Shinagawa-ku, Tokyo, Japan) with a 0.25 µm film thickness, coupled to an HP6890 gas chromatograph interfaced with an HP5973 mass spectrometer (Model Agilent 5973N, Agilent Technologies, Inc., Santa Clara, CA, USA, 1999). The initial column temperature was set at 50 °C and maintained for three minutes before being ramped to 280 °C at a rate of 10 °C/min, followed by a further increase to 300 °C for 10 minutes. Mass spectrometric detection was performed in scan mode. The injector volume was 1 µL, operated in split mode (10:1), with an injector temperature of 250 °C. High-purity helium (99.99%) was used as the carrier gas at a flow rate of 1 mL/min. Electron ionization (EI) was set at 70 eV, with a scan time of 0.2 s, and a fragment mass range of 40–600 m/z. Data collection and processing were conducted using HP ChemStation software (G1701EA E.02.02.1431) installed on the Agilent 5973N GC-MS system.
2.2. In Silico Methods
2.2.1. Density Functional Theory Calculations
Avogadro (Hanwell et al., 2012) program was used to build the initial structures of the HBA and HBD monomers. The HBD/HBA was developed at a mole ratio of 1:1. The DFT calculations for components and NADES dimers were carried out through geometrical optimizations at B3LYP/6-31G(d) (Naseem et al., 2023) theoretical level using Guassian software (G09) (Frisch et al., 2013). Topological analysis of intermolecular interactions was carried out by applying the quantum theory of atoms in molecules (Bader’s QTAIM theory) (Bader, 1985) with MultiWFN software. (Tian Lu and Chen, 2012) The QTAIM analysis of intermolecular forces was carried out considering electron density (ρe) and Laplacian of the electron density (∇2ρe) of bond critical points (BCPs, type (3, −1) in QTAIM). Likewise, non-covalent interaction analysis (NCI) analyses (Johnson et al., 2010) were also plotted for the optimized clusters. The electron localization function (ELF) was used to calculate the core–valence bifurcation index (CVB) (Fuster et al., 2000).
2.2.2. Molecular Dynamics Simulations
Molecular dynamics (MD) simulations were performed using the Forcite module within BIOVIA Materials Studio (Davila et al., 2012). Cubic simulation boxes containing 200 molecules in total (100 hydrogen bond acceptors (HBA) and 100 hydrogen bond donors (HBD)) were generated using the Amorphous Cell module in BIOVIA Materials Studio (Rodríguez et al., 2025) to achieve an initial density of 1 g cm⁻³ (Ihmels et al., 2001), periodic boundary conditions were applied in all directions for all simulated systems. The molecular geometries of the NADES components were optimized using the COMPASS II force field. The initial simulation boxes underwent equilibration using an NPT ensemble at 0.1 MPa, and at 298 K for 100 ps. Following equilibration, production simulations were conducted under the NVE ensemble for 1 ns, using a 1 fs timestep and saving frames every 500 steps. Atomic charges were assigned automatically, while van der Waals interactions were computed using an atom-based approach, and electrostatic interactions were calculated using the Ewald summation method (Essmann et al., 1995). To further minimize the system’s total energy and achieve a more stable initial configuration, annealing was applied before commencing molecular dynamics simulations. the Nose-Hoover thermostat (Hoover, 1985) was employed for temperature control and the Parrinello-Rahman barostat (Parrinello and Rahman, (1981) for the desired pressure.
2.2.3. Molecular Docking Simulation
The allergen repressing potentials of the NADES extracted compounds were evaluated by molecular docking of the compounds on the surface of the receptor proteins of two major pollen allergens Amb a 1 (AlphaFold DB: E1XUM0) (ragweed) and Cry j 1 (AlphaFold DB: P18632) (Japanese cedar) retrieved simultaneously from the AlphaFold Protein Structure Database (https://alphafold.ebi.ac.uk/). The structures of the compounds were obtained in SDF format from thePubChem database (https://pubchem.ncbi.nlm.nih.gov/), and converted to PDBQT format in Open Babel of PyRx The blind docking approach was conducted by docking the compounds against the chain A of the proteins in Autodock Vina in PyRx software version 0.8 (Enyoh et al., 2022a). The docking modes and docking binding energy (∆G) are the foundational findings in the docking procedure. Hydrogen bonding and other hydrophobic interactions between the compounds-allergen receptor complexes was visualized using Biovia Discovery studio 4.5 (Lin et al., 2023b). The inhibition constant (μM) of the compounds to receptor proteins was computed as described by Iman et al. (2015), presented in equation (1), where Rcal is 1.98719, and T is the temperature (298 K).
2.3. Statistical Analysis
OriginLab Pro 8 was employed to analyze and plot the data.
3. Results and Discussion
3.1. NADES Synthesis and Characterization
The synthesis of NADESs is based on cheap, abundant and recyclable biomaterials. The types and ratios of the HBA and HBD can directly influence the properties of the NADES synthesized. The NADESs components used in this research are presented in Table 1. A total of 6 NADES were prepared in this study by combining the HBA and HBD in the ratio 1:1 for all NADES. While the NADES not related to eugenol were all colorless, a faint yellow color was observed in the NADES containing eugenol (Figure 2a). Four (4) days after the NADES synthesis, the Camphor-Menthol NADES recrystallized (Figure 2b), the crystallization corroborated with previous report by Rodríguez-Ramos et al. (2024) who reported the recrystallization of Camphor-Menthol NADES of ratio (1:1) when cooled. Some other researchers have also reported the synthesis of some of the NADES using same composition e.g., thymol-menthol (Harifi-Mood et al., 2023; Van Osch et al., 2019), thymol-camphor (Rodríguez-Ramos et al., 2024; Padilla et al., 2024), thymol-eugenol (Bechis et al., 2024), camphor-menthol (Goswami et al., 2024), to the best of the authors knowledge, this study is the first time preparation of NADES combination of camphor-eugenol and menthol-eugenol.
The thermal stability of the hydrophobic NaDESs and their components were analyzed using the TG/DTA analyzer and the TG curves are shown in Figure 3 a and b. The result revealed single stage decomposition for all the TG curves. The on-set decomposition temperature (Tonset), and the peak decomposition temperature have been presented in Table 2. The onset decomposition temperature indicates the maximum temperature at which compounds can maintain their liquid state without decomposition and can also be used to characterize their range of use as solvents (Harifi-Mood & Sarafrazi, 2023). As presented on the Table 2, the onset decomposition temperature values for the synthesized NaDES showed varying results ranging from (110 – 125) oC. Figure 3b shows how the onset decomposition temperature (Tonset) of the NADES varies from that of the pure components. While the NADES showed Tonset values that are in between the values of a higher component Tonset and a lower component Tonset, the Tonset values of menthol-eugenol and thymol-eugenol were lower than the values of their components. The thermal behaviors in the NADES suggest that strong intermolecular interactions like hydrogen bond may have enhanced its thermal and chemical properties, which may lower the free energy in the case of menthol-eugenol and thymol-eugenol NADES and may consequently improve their extraction capabilities.
To further verify the structural alterations in NADES, the FTIR spectra of different NADES were obtained, with a focus on the O-H stretching, which is closely related to hydrogen bonding (Figure 3c). Apart from camphor, other pure components of the NADES had O-H stretching vibration bands. The O-H band in the NADES appeared between 3200 - 3600 cm−1, and the C=O stretching vibrations were observed around 1700 cm−1 and 1750 cm−1. Although slightly noticeable in the figure, blue shift was observed in the O-H vibrational band of the NADES in comparison to the pure components, The shifting of the bands also indicated the strength of the intermolecular hydrogen bonding (Fattahi et al., 2022). Thus, the NADES had weaker intermolecular hydrogen bonding compared to the pure components. The alignment of the OH-stretching band of the Eugenol-NADES at the Eugenol’s O-H bands may suggest a redistribution of hydrogen bonding, where the other components (thymol, menthol, and camphor) adapt to the environment set by eugenol. The broader peaks observed in the eugenol-NADES compared to the pure eugenol may indicate multiple hydrogen bonding modes and a stronger hydrogen bonding network (Wu et al., 2024). This property may be due to the strength of the eugenol’s hydrogen bonding capacity influencing their -OH bands to shift towards eugenol’s -OH band, and the dynamic nature of the NADES resulting in the shared hydrogen bonding network. The reduction in peak intensity of the C=O stretching vibration of camphor in the NADES also shows that Camphor interacted as a HBA in the formulated NADES. Although the shift in the OH stretching absorption band was not very noticeable, overall FTIR spectra was able to identify the presence of hydrogen bonding in the NADES.
3.2. Phytochemical Composition
The use of hydrophobic NADES for extraction of bioactive compounds has gained wide audience due to their sustainability and low toxicity during compounds isolation (Van Osch et al., 2019; Rafati et al., 2025; Kianpoor & Sadeghi., 2024). In this study, the extraction of the components in the biomass was an inline process involving maceration and sonification assisted extraction of the accurately measured Hiba wood biomass sample using the hydrophobic NADES. Five (5) NaDES were employed for the extraction from the six initially synthesized solvents. The camphor-menthol NaDES was left out due to its recrystallization. The GC–MS analysis of the NADES extracts revealed the presence of various bioactive compounds. The chromatograms (Figure 4) of all extracts showed that their composition is influenced by the NADES used as the solvent. A total of 47 unique components (Table 3) were identified from the combined components of the extracts in the GCMS analysis, which were identified in the Wiley GC-MS spectra database library search program in the HP ChemStation software using the retention indexes and reference compounds. In all the extracts, 4,5α-Epoxy-3-methoxy-17-methyl-7α-(4-phenyl-1,3-butadienyl)-6β,7β-(oxymethylene) morphinan was identified as the most abundant compound with a retention time of (28.273 min) and % peak area and peak ratio of; Camphor-eugenol (9.31, 43.61), Menthol-Eugenol (10.243, 47.08), Menthol-Thymol (10.28, 33.05), Camphor-Thymol (10.876, 69.43), and Thymol-Eugenol (11.160, 50.87) respectively. The components were classified into seven main groups: Alkane related compounds, Polycyclic Aromatic Compound derivative, Alkaloids, Terpenes and Terpenoids, Fatty Acids and Esters, Phenolic Compounds, and Steroids (Table 3, and Figure 5 (A-E)). Using principal component analysis (PCA) the extraction performance and compound selectivity of the NADES was predicted (Figure 5F). The PCA results, derived from the % peak area composition of the compounds identified by the GCMS analysis showed that the solvents demostrated distinct patterns in their extraction performance and compound selectivity. All the solvents exhibited high overall extraction efficiency as indicated by their strong positive loadings on PC1, suggesting their ability to extract dominant compound classes effectively. However, the Camphor-Thymol, and Eugenol -Thymol exhibit unique compound selectivity, as reflected by the positive loadings on PC2, indicating their suitabilty for applications targeting specific groups. This differentiation underscores the complementary roles of these NADES in optimizing extraction proceses baseed on desired outcomes, whether for maximizing yield or isolating specialized compounds.
3.3. In Silico Simulation
3.3.1. Density Functional Theory (DFT)
Frontier Molecular orbital Analysis
A comprehensive analysis of intermolecular interactions and structural characteristics of fluid systems is essential for accurately characterizing the properties of the investigated NADES at the nanoscopic level (Rozas et al., 2023). Particular emphasis should be placed on the hydrogen bonding interactions between the hydrogen bond acceptor (HBA) and hydrogen bond donor (HBD), as these govern the fundamental properties of NADES (Naseem et al., 2023). The DFT approach employing a minimal cluster model was utilized to investigate the hydrogen bonding properties of the system. The results quality largely depends upon the selected computational methods, proficiency, and time. The cluster model was constructed by considering the structures of the HBA: HBD components in a 1:1 dimer. The dimer structures, along with the individual component molecules, were optimized, and their geometries were subsequently used to compute relevant geometric, energetic, and electronic properties. The (frontier molecular orbitals) FMOs reveal information about the molecule’s chemical reactivity, and the frontier orbital distribution shows where the active sites are present (Zahid et al., 2021). In this study, the FMOs of the HBA: HBD pairs and the that of the components (HBA or HBD before the NADES systems were formed) were calculated and compared and the changes occurring in the HBA–HBD hydrogen bonds were observed (Figure 6). The corresponding energy gaps were compared and have been presented (Table 4). Analyzing the location of the frontiers orbitals in the pure components as presented in Figure S1, the result revealed that excluding the LUMOs of eugenol and thymol (with orbitals away from the vicinity of the donor or acceptor), the HOMOs and LUMOs of the pure components was located within the vicinity of the donor (OH-group) or the acceptor (O-atoms) in the molecular sites. Similar to the LUMOs of eugenol and thymol components, the LUMOs of the generated NADES was not located in the vicinity of the donor / acceptor molecular sites (Figure 6). In contrast to the LUMOs, all the HOMOs were located within the donor (OH-group) sites of the NADES generated. The values of the HOMO–LUMO energy gaps for pure components range from 4.27 – 8.85 eV (Table 4). Menthol showed the highest gap (8.85 eV), suggests greater stability and lower reactivity, while eugenol has the lowest gap (4.27 eV), indicating higher reactivity. This trend aligns with their expected chemical behaviors, where eugenol, with a smaller gap, may participate more readily in electron transfer processes compared to menthol. The difference in the HOMO-LUMO energy gap of the NADES was within the range of (3.83 – 4.29) eV (Table 6). The energy gap recorded was in this order; Camphor-Eugenol < Thymol-Eugenol < Menthol-Eugenol < Camphor-Thymol < Menthol-Thymol for the generated NADES. The smaller HOMO–LUMO gap differences for the Eugenol-related NADES indicate stronger electronic interactions, enhancing solvent stability. Larger differences suggest weaker interactions, affecting hydrogen bonding and solvation properties (Jangir et al., 2020). This finding also corroborated with the FTIR result in this study, which suggested the eugenol related NADES may possess stronger HBD potentials compared to the other components, this is also observed in the HOMO-LUMO orbitals in Figure 6. Apart for the high energy gap value of camphor component, the energy gap values of the pure components resemble the generated NADES. This indicates that the primary electronic properties of the component pairs resemble those of the individual components of the pairs and since NADES are physically mixed systems, rather than chemically bonded new compounds, their frontier molecular orbitals (HOMO/LUMO) remain similar to the original components.
The quantum chemical parameters, including chemical potential (μ), chemical hardness (η), chemical softness (σ), electronegativity (χ), and electrophilicity index (ω), were calculated based on the frontier molecular orbital energies (HOMO and LUMO) as presented in Table 4. The chemical potential (μ) is the chemical energy per mole of a substance and is calculated using equation (suppl. Equ(1)) The reactivity of the molecular system is decreased with the chemical potential’s decrease, so the structures’ stability is increased (Naseem et al., 2023). The chemical potential values derived from the Frontier Molecular Orbitals (FMO) indicate that the NADES mixtures generally exhibit intermediate stability between their pure components, except for camphor, which has the lowest reactivity (-7.25 eV), and eugenol, which has the highest (-5.30 eV), suggesting its greater tendency to donate electrons. The observed trend suggests that hydrogen bonding interactions in the NADES mixtures lead to an electronic stabilization effect, bringing their chemical potential closer to that of the more electronegative component in each pair. The differences in chemical potential between the NADES mixtures and their pure components suggest that the electronic properties of the mixtures are influenced by the dominant component in each pair. Most NADES exhibit chemical potential values that fall between their respective HBD and HBA components, indicating that hydrogen bonding interactions stabilize the system without drastically altering individual electronic properties. However, the Camphor-based NADES (Cam-Eug: -6.72 eV, Cam-Thy: -7.07 eV) are less stable than pure camphor (-7.25 eV), suggesting that camphor’s rigid structure weakens electron delocalization when mixed. In contrast, Eugenol-based NADES (Men-Eug: -6.91 eV, Thy-Eug: -7.01 eV) shift closer to eugenol’s higher reactivity (-5.30 eV), likely due to its electron-donating nature, which influences the overall electronic structure of the mixture. This observation corroborates with the FTIR spectra where the Eugenol-NADES exhibited broader -OH peaks that shifted towards the pure eugenol -OH environment. Chemical hardness (ƞ) can be related to molecular stability (Ishaq et al., 2021). A low hardness value indicates the electron donating ability of molecules, as given by (suppl. equation (5)) (Parsaee et al., 2016), which illustrates a molecule’s barrier to exchanging electron density with its surroundings. The NADES mixtures exhibited lower chemical hardness than their hardest pure component, indicating increased polarizability and electronic flexibility. Eugenol, with the highest hardness (3.62 eV), significantly reduces hardness in mixtures such as Cam-Eug (1.92 eV) and Thy-Eug (1.99 eV), making them more reactive. Camphor (2.51 eV) and menthol (2.87 eV) contribute to relatively higher hardness in Cam-Thy (2.13 eV) and Men-Thy (2.14 eV), maintaining greater stability. Overall, the reduced hardness of NADES compared to their pure components suggests enhanced charge delocalization and intermolecular interactions. On the other hand, the chemical softness (S) indicates the aptitude of the molecule to capture electrons, as calculated using equation (Suppl. Equation (6)) (Parsaee et al., 2016). High polarizability is correlated with softness, which assesses the ease of electron transfer (Lashgari et al., 2018), and the NADES mixtures generally exhibit higher softness than their hardest pure component. Eugenol, with the lowest softness (1.81 eV⁻¹), significantly reduces the softness of its mixtures, such as Cam-Eug (0.96 eV⁻¹) and Thy-Eug (0.99 eV⁻¹), making them less polarizable. In contrast, camphor (1.26 eV⁻¹) and menthol (1.43 eV⁻¹) contribute to relatively higher softness in Cam-Thy (1.07 eV⁻¹) and Men-Thy (1.07 eV⁻¹), suggesting moderate reactivity. Overall, the increased softness of NADES compared to some of their pure components implies enhanced electronic adaptability and charge delocalization, facilitating intermolecular interactions. Electronegativity (Χ) reflects the tendency of a molecule to attract electrons, which may be calculated using equation (suppl. equation (7)) (Khan et al., 2021). The NADES mixtures exhibit values influenced by their constituent components, indicating balanced charge distribution. Arranging the NADES in decreasing order of electronegativity gives: Men-Thy (7.10 eV) > Cam-Thy (7.07 eV) = Thy-Eug (7.01 eV) > Men-Eug (6.91 eV) > Cam-Eug (6.72 eV), showing that mixtures containing thymol generally have a higher electron-attracting ability. The electrophilicity index (ω) quantifies the overall electrophilic nature of a molecule, measuring how much power is lost as a result of the greatest electron transfer between a donor and an acceptor. The electrophilicity index was described in equation (suppl. equation (8)) (Parr et al., 1999). The NADES mixtures show varying levels of electrophilicity, with the highest value for Thy-Eug (12.35 eV), indicating a stronger electrophilic character compared to other mixtures. The electrophilicity index values for Cam-Eug (11.80 eV), Cam-Thy (11.72 eV), and Men-Thy (11.74 eV) suggest moderately high electrophilic behavior, while Men-Eug (11.53 eV) shows slightly lower electrophilicity. In contrast, the pure components like eugenol (3.89 eV) have significantly lower electrophilicity, highlighting their weaker electron-accepting nature compared to the NADES mixtures, which have higher electrophilicity due to the interaction between donor and acceptor components.
- Investigation of hydrogen bond interactions in the NADES system (QTAIM, NCI, and IRI analysis)
The electron density distribution of a molecular system is the physical manifestation of the forces acting within the molecular system, while its Laplacian (∇²ρ) reveals electron accumulation and depletion, providing a basis for Lewis’s electron pair model and distinguishing covalent, ionic, and weak interactions (Bader, 1990). Quantum Theory of Atoms in Molecules (QTAIM) offers a powerful framework for analyzing intermolecular interactions using electron density (ρe) and its Laplacian (∇²ρe) at bond critical points (BCPs) (Popelier et al., 2000, Kumar et al., 2016). Based on QTAIM analysis, intermolecular interactions were examined using bond critical points (BCPs, type (3, -1)), along with electron density (ρe) and its Laplacian of the electron density (∇²ρe) (Lu & Chen, 2021). All the HBA–HBD pairs were identified by the presence of a bond path connecting the donor (OH) and acceptor (O) atoms, confirming BCP formation. The detailed topological properties are summarized in Table 5. Bader and Essen (1984) stated that high electron density (ρ > 0.1 a.u.) at the bond critical point (BCP) and a negative Laplacian (∇²ρ < 0) are characteristic of covalent bonds, indicating electron concentration at the BCP (Bader et al., 1996). For hydrogen-bonded interactions, the electron density ρe at the BCP is much smaller, typically around 10⁻² a.u. or less (Kumar et al., 2016). The electron density (ρe) values for the NADES were found to range between (0.023 and 0.039) a.u., indicating moderate electron concentration at the bond critical points (BCPs), typical of hydrogen bonding interactions. The Laplacian (∇²ρe) values ranged from (0.074 to 0.117) a.u., suggesting that these interactions exhibit electron depletion, which is a hallmark of weaker, non-covalent bonds like hydrogen bonds. Hydrogen bonding was further analyzed using the electron localization function (ELF), from which the core-valence bifurcation (CVB) index was calculated. The CVB index, defined as CVB = ELF(C-V) − ELF(DH-A), is used to differentiate hydrogen bonds by examining the bifurcation between the core and valence domains of electron localization, where D is the donor, H is hydrogen, A is the acceptor, and ELF(C-V) and ELF(DH-A) represent the bifurcation values between the core and valence domain and between the donor hydrogen and acceptor, respectively (Emamian et al., 2019; Fan et al., 2021). The CVB index for weak hydrogen bonds is positive, while for relatively strong hydrogen bonds, it is typically negative, and it decreases as the strength of the interaction increases (Fan et al., 2021). The CVB indices suggest that the menthol-eugenol pair has the strongest hydrogen bond, with the most negative CVB value (-0.050), indicating a more localized electron distribution. In contrast, the other pairs exhibited weaker hydrogen bonds, as indicated by their positive CVB values. This result corroborated with the RDF result from the molecular dynamics simulations.
Non-covalent interaction (NCI) analysis and interaction region indicator (IRI) analysis were used to further investigate the intermolecular interactions in the generated NADES. The NCI method, also known as the reduced density gradient (RDG) method, is a powerful tool for studying weak interactions and is closely related to AIM topology analysis, as both provide insights into interatomic interactions within a chemical system (Fan et al., 2021; Lu & Chen, 2021; Yao et al., 2022). The NCI and IRI analyses of the HBA–HBD pairs confirm the presence of hydrogen bonds in the O(HBA)–OH(HBD) regions. Scatter plots of the reduced density gradient (RDG) vs. electron density (ρ) reveal that strongly attractive interactions (e.g., hydrogen bonds) appear in the blue region (high ρ), weak van der Waals interactions in the green region (low ρ), and repulsive steric clashes in the red region (high ρ) (Yao et al., 2022). A greater blue intensity signifies stronger hydrogen bonding or electrostatic effects in specific regions. To clearly visualize the correlation between RDG isosurfaces and spikes, 2D scatter plots were generated using corresponding colors. The RDG vs. electron density (ρ) plots for the NADES systems revealed multiple spikes in the low-density, low-gradient regions, indicating the presence of non-covalent interactions (NCIs) (Figure 7). Among the NADES systems, the Menthol-Eugenol mixture exhibited the highest number of spikes in the blue region, suggesting stronger hydrogen bonding interactions compared to the other NADES. This observation aligns with the results of the CVB index, further supporting the enhanced hydrogen bonding capability of the Menthol-Eugenol system.These findings were based on analyzing interaction spots along interatomic lines, with additional spots in the HBA–HBD regions linked to van der Waals-like interactions, which contribute to the stability of the interacting pairs as observed from NCI and IRI analyses. However, this study’s limitations stem from a trade-off between computational cost and efficiency, leading to the selection of a smaller basis set that may compromise accuracy.
3.3.2. Molecular Dynamics Simulations of the NADES
Mean Square Displacement (MSD) and Diffusion Coefficient
To achieve a deeper understanding of the NADESs microstructure and address the molecular interactions responsible for their formation, MD simulations were performed on the mixtures of pure components with a molar ratio of 1:1, at 298.15 K. In order to determine how freely molecules move within the mixture, which provides insights into the viscosity, stability, and dynamic behavior of NADES, the Mean Square Displacement (MSD) was calculated. The MSD measures how far a particle travels from its starting point over time (Klix et al., 2015). The MSD which can effectively represent how much space a particle explores as it follows its unpredictable path can be calculated using the following equation (Enyoh et al., 2024).
where the pointed brackets denote the overall average value, N denotes the number of particles, rn(0) denotes the initial position of the particles, and rn(t) denotes the position of the particles at time t. The diffusion coefficient can also be calculated by the following equation.
The results obtained from the MSD analysis confirmed normal diffusion behavior across all NADES systems, which is shown by linear MSD increases with simulation time (Figure 8B). Significant mobility variations were observed among the five formulations, with diffusion coefficients following the order: menthol_eugenol > thymol_eugenol > camphor_eugenol > menthol_thymol > camphor_thymol (Figure 8C). The menthol_eugenol system demonstrated superior molecular mobility (MSD reaching 4.98 nm² at 500 ps; D = 9.7×10⁻⁴ m²/s), while camphor_thymol exhibited the lowest mobility (MSD plateauing at 2.86 nm² at 500 ps; D = 6.14×10⁻⁴ m²/s). These findings highlight the critical role of hydrogen bond donor-acceptor (HBD-HBA) pairing in governing transport properties in NADES formulations (Farooq et al., 2020). The thymol_menthol system exhibited interesting biphasic behavior, with MSD initially rising sharply before being surpassed by camphor_eugenol and thymol_eugenol systems. This pattern reveals a competition between short-term hydrogen bond dissociation processes and long-term steric hindrances imposed by thymol’s bulkier aromatic ring structure. Molecular mobility constraints appear to originate from multiple structural features (Pádua et al., 2007). Thymol’s methyl group sterically hinders bond reformation, while camphor’s rigid bicyclic framework restricts conformational flexibility (Quesada-Moreno et al., 2022). These structural factors stabilize transient molecular clusters that impede long-range motion. In systems containing eugenol, the hydroxyl group enables transient hydrogen bonding, while its extended conjugated system likely contributes to localized π–π interactions that further modulate diffusion behavior. Despite eugenol’s hydrogen bond lability, camphor_eugenol demonstrates lower mobility due to camphor’s rigid framework limiting overall system flexibility.
Radial Distribution Functions (RDFs)
The fluid structuring was characterized through Radial Distribution Functions (RDFs) for relevant hydrogen bonding sites. RDFs also known as pair correlation functions, quantify the probability of finding specific atom pairs at particular radial distances in molecular dynamics simulations. The RDF, denoted as g(r), precisely measures the likelihood of locating an atom pair within a defined range of radial distance. This function serves as a fundamental tool for analyzing molecular organization and intermolecular interactions in simulated systems, providing critical insights into local structural ordering and the spatial distribution of molecules relative to one another. The normalized RDF for atom pairs i and j is mathematically defined within a spherical shell of radius r and thickness dr (Enyoh et al., 2022).
where Ni, j(r) is the number of occurrences of atom pairs between r and r + dr.
In Natural Deep Eutectic Solvent, the RDF profiles for O–H interactions systems provide critical insights into their structural organization by analyzing oxygen-hydrogen atom distribution patterns. According to established principles, RDF peaks occurring at distances 2 Å and 3Å presumably refer to the intermolecular hydrogen-bonding forces for the relatively simple systems. Conversely, peaks at distances > 3.5 Å reflect non-bonded interactions such as electrostatic and van der Waals forces, which constitute weaker, longer-range interactions (Perkins et al., 2014, Enyoh et al., 2022b). The values of RDFs analysis, g(r), obtained after evaluating the molecular dynamics simulation data are displayed in Figure 8A. The RDF profiles for O–H interactions revealed striking differences in hydrogen bonding behavior across the NADES systems. Menthol_eugenol, which demonstrated the highest diffusion coefficient, also exhibited a tall, sharp RDF peak centered at approximately 2.5–3 Å. This feature indicates strong, directional O–H···O hydrogen bonds. The narrow width of this peak suggests a homogeneous, dynamic hydrogen bond network characterized by rapid bond breaking and reforming, facilitating efficient molecular rearrangements. This structured fluidity effectively balances local cohesion with global mobility, resembling behavior observed in ionic liquids with labile ion pairs (Sun et al., 2012). In contrast, systems including camphor_eugenol, camphor_thymol, and menthol_thymol displayed weaker intensity, but broader RDF peaks spanning 2–3 Å, indicating weaker or more heterogeneous interactions. The weak intensity for similar types of NADES was also observed by Fan et al., (2021). Camphor-based systems exhibited broader peaks which may be due to steric constraints imposed by camphor’s rigid bicyclic structure, which inhibits optimal hydrogen bonding configurations (Mahdy et al., 2022). Thymol-containing systems showed transient hydrogen bonds that may dissociate less efficiently than those in the menthol_eugenol system. The weak RDF peaks observed in menthol_thymol highlight how thymol’s methyl group may introduce steric bulk that hinders molecular reconfiguration and bond reformation (Rodríguez et al., 2025). The superior diffusion and dynamic hydrogen bonding in menthol-eugenol NADES make it ideal for rapid, efficient extraction of bioactive compounds, while systems like camphor-thymol, with slower diffusion but stable interactions, may better preserve heat-sensitive or labile molecules during prolonged extraction processes.
3.3.3. Molecular Docking Approach: Allergen repressing Potential of the Bioactive Compounds
Pollen allergies represent a significant global health concern, with Japanese cedar (Cryptomeria japonica) pollen allergen Cry j1 and short ragweed (Ambrosia artemisiifolia) pollen allergen Amb a1 being major contributors to seasonal allergic rhinitis. These proteins enter the respiratory system through inhalation and initiate a complex immune cascade. Upon exposure, they bind to specific IgE antibodies on mast cells, triggering degranulation and release of inflammatory mediators, ultimately leading to characteristic allergic symptoms (Kusano et al., 2014, Fujimura et al., 2015; Bordas-Le Floch et al., 2015). The molecular basis of their allergenicity lies in their protein structure and surface epitopes, which are crucial for immune recognition and subsequent inflammatory response such as nasal congestion, sneezing, and itching (Lorenz et al., 2015). Essential oils and plant extracts have been studied for their potential in mitigating allergenicity. Certain compounds found in essential oils exhibit anti-inflammatory and immunomodulatory properties that can suppress allergic reactions. Notably, Lin et al. (2023) demonstrated that Todomatsu oil (Abies sachalinensis) effectively reduces pollen allergenicity through multiple mechanisms, including direct protein interaction and inflammatory pathway modulation. Similarly, Hiba wood (Thujopsis dolabrata) extracts have shown allergen-suppressing properties, through their ability to inhibit mast cell degranulation and IL-4 secretion in IgE-sensitized RBL-2H3 cells (Maduka et al., 2023; Kim et al., 2013), though research in this area remains exploratory. The molecular docking analysis of natural compounds against the major pollen allergens Amb a 1 (AlphaFold DB: E1XUM0) (ragweed) and Cry j 1 (AlphaFold DB: P18632) (Japanese cedar) provides critical insights into their potential as inhibitors for allergen repression. Using AutoDock Vina in PyRx software version 0.8. for blind docking, the study evaluated binding affinities (ΔG), inhibition constants (IC), and residue-level interactions, revealing distinct binding profiles for the two allergens. Binding energies and inhibition constants were calculated following established protocols (Iman et al., 2015). The molecular docking results presented on Table 6 and Figure 9 revealed significant variations in binding energies (Amb a 1 ΔG: -4.5 to -7.4 kcal/mol, and Cry j 1 ΔG: -4.8 to -8.6 kcal/mol) across the tested compounds. The docking results indicated that 4,5-Alpha-Epoxy-3-Methoxy-17-Methyl-7-Alpha-(4-Phenyl-1,3-Butadienyl)-6-Beta,7-Beta-(Oxymethylene)Morphinan exhibited the highest binding energy with Cry j 1 (-8.60 kcal/mol) and Amb a 1 (-7.40 kcal/mol). This suggests a strong affinity for the allergenic proteins, potentially interfering with their ability to induce allergic responses. Other compounds with comparable binding energies include Pregn-20-en-3-ol,20-methyl-,(3β,5α)- with binding energies of -7.90 kcal/mol (Cry j1) and -6.60 kcal/mol (Amb a1). Lanosta-7,9(11)-diene-3,18,20-triol binding energies of -7.1 kcal/mol(Cry j1),and -6.90 kcal/mol(Amb a1), Deoxycaesaldekarin C and other compounds had moderate binding energies. Although Cry j1 and Amb a1 belong to the same allergen family, their binding sites show distinct characteristics. The Amb a1 binding pocket demonstrates a higher proportion of polar residues capable of forming hydrogen bonds, while the Cry j1 binding site shows a more balanced distribution of polar and hydrophobic regions. This difference is reflected in the interaction patterns of the compounds, with more diverse hydrogen bonding networks observed in Amb a1 complexes (Suppl. Figure S2 and S3) The binding interactions showed distinct patterns for each allergen. For Cry j 1, the morphinan compound formed strong hydrogen bonds with THR320 and carbon hydrogen bonds with GLY339 and GLY338, supplemented by a π-cation interaction with LYS335 (Figure 10b). These interactions occur within a binding pocket characterized by both polar and hydrophobic regions, allowing for optimal ligand accommodation. The binding site’s mixed character enables both hydrogen bonding networks and hydrophobic contacts, contributing to the compound’s high affinity. Amb a 1 on the other hand had interactions with the compound forming key hydrogen bonds with ASP194 and GLN192, while establishing π-alkyl interactions with TRP225 and ALA248 (Figure 10a). This binding profile suggests that Amb a 1’s binding site also favors compounds capable of forming diverse interaction types, particularly those that can balance polar and hydrophobic contacts.
The inhibition constant is the concentration required to produce half maximum inhibition (Enyoh et al., 2022), and therefore, the lower the constants, the higher the inhibition, the results are also presented in Figure 9 and Table 6. The inhibition constants (ICµM) for Cry j 1 (0.49 - 500.95) µM and Amb a 1 (3.74 - 301.84) µM were inversely correlated with binding energy, indicating that stronger binders had lower inhibition constants. The inhibition constants further supported the findings, with the morphinan compound showing particularly low values (Cry j 1: 0.49 µM; Amb a 1: 3.74 µM). These values indicate strong binding affinity and suggest potential therapeutic relevance. Other compounds showing promising inhibition constants included Pregn-20-en-3-ol,20-methyl-,(3β,5α)- and Lanosta-7,9(11)-diene-3,18,20-triol, although their values were notably higher than the morphinan compound. The regression analysis provided valuable insights into the structure-activity relationships. Amb a 1 showed a stronger correlation between binding energy and inhibition constant (R² = 0.77794) compared to Cry j 1 (R² = 0.62811), suggesting more predictable binding behavior. This difference likely reflects the distinct architectures of their binding sites, with Amb a 1 showing more consistent structure-activity relationships. From a medicinal theoretical standpoint, the interaction between of the compounds with the allergens can be described as follows. The morphinan derivative had strong inhibition of Cry j 1 (IC: 0.49 µM) versus Amb a 1 (IC: 3.74 µM) reflecting Cry j 1’s compatibility with polycyclic alkaloids, a class known to modulate histamine receptors (Javeed et al., 2024). The pregnane structure in Pregn-20-en-3-ol,20-methyl-,(3β,5α)- may enhance Glucocorticoid-like effects in the compound and which we suggest it could help stabilize mast cells, which would reduce the release of histamine and other inflammatory mediators during allergic reactions (Oppong et al., 2013). These findings align with prior studies emphasizing Cry j 1’s broader ligand adaptability due to its flexible β-helix fold, which accommodates diverse hydrophobic moieties (Kusano et al., 2023). Some other top-performing compounds also exhibit promising medicinal relevance. Lanosta-7,9(11)-diene-3,18,20-triol, a lanostane-type triterpenoid, can suppress mast cell degranulation and Th2 cytokine release, mechanisms central to allergic inflammation (Su et al., 2020). Its interaction with SER 204 and LYS 257 in Amb a 1 suggests potential disruption of IgE epitopes, critical for allergen recognition. Although, the study’s limitations include reliance on static docking without dynamic stability assessments. Future work should integrate molecular dynamics simulations to validate binding poses and explore entropy contributions. Nevertheless, the current data position 4,5.Alpha.-Epoxy-3-Methoxy-17-Methyl7.Alpha.-(4-Phenyl-1,3-Butadienyl)-6.Beta.,7.Beta.-(Oxymethylene)Morphinan, Pregn-20-en-3-ol,20-methyl-,(3β,5α)-, and Lanosta-7,9(11)-diene-3,18,20-triol as lead candidates for in vitro and in vivo testing. Their dual action (blocking allergen epitopes and leveraging anti-inflammatory properties) could pave the way for multi-target therapies against pollen-induced allergies.

Table 6.
The binding interaction and amino acid residue analysis of the docking between the components of the extract and the receptor proteins.
Table 6.
The binding interaction and amino acid residue analysis of the docking between the components of the extract and the receptor proteins.
| s/n | Compound | Structure | Pub chem id | Amb a 1 (B.E) Kcal/mol |
Cry j 1 (B.E) Kcal/mol |
Amb a 1 IC (µm) |
Cry j 1 (I.C) µm |
Cry j 1 Bonding: Interaction site | Amb a 1 Bonding: Interaction site |
| 1 | Pregn-20-en-3-ol,20-methyl-,(3β,5α)- | 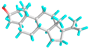 |
22296144 | -6.6 | -7.9 | 14.44 | 1.61 | ALK: LEU 283 VDW: GLN 318, TYR 336, ILE 341, HIS 260, ASN 340, TYR 342, ALA 347, PHE 348, GLU 285, THR 320 |
CHB: ALA 368, LYS 77, ALA 78 VDW: GLY 74, GLY 369, PHE 75, GLY 229, THR 228, SER 204, ASP 205 |
| 2 | 3-Phenylpropionic acid,5-methoxy-2-[3,4-dimethoxyphenyl]- |  |
628993 | -5.6 | -6.6 | 78.18 | 14.44 | CVB: THR 320, SER 284, TYR 336 CHB: GLU 285 π-T: TYR 336 ALK/π-ALKLYS 335, LEU 283, ILE 341, TYR 342 VDW: ASN 340, GLN 318, GLU 285, SER 319 |
CHB: ASP 194, HIS 191, GLU 131 π-S: TRP 225, MET 157 π-π-T: HIS 199 ALK/π-ALK: ALA 248, ARG 190 VDW: ASN 224, THR 201, ASP 196, GLY 195, THR 155, SER 193 |
| 3 | 4,5.Alpha.-Epoxy-3-Methoxy-17-Methyl7.Alpha.-(4-Phenyl-1,3-Butadienyl)-6.Beta.,7.Beta.-(Oxymethylene)Morphinan | 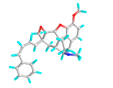 |
- | -7.4 | -8.6 | 3.74 | 0.49 | CHB: GLY 339, GLY 338 CVB: THR 320 π-CAT: LYS 335 ALK/π-ALK:ILE 341, VAL 350, HIS 260 VDW: THR 342, PHE 348, GLY 285, LEU 283, GLN 318, TYR 336, ASN 340 |
CHB: ASP 194, GLN 192, THR 201 π-ALK: TRP 225, ALA 248 π-CAT: MET 157 VDW: HIS 191, HIS 199, ASN 224, HIS 253 |
| 4 | 7,9-di-tert-butyl-1-oxaspiro[4.5]deca-6,9-diene-2,8-dione |  |
545303 | -5.9 | -6.0 | 47.10 | 39.79 | CVB: ILE 341, TYR 342 ALK: LEU 283 VDW: HIS 260, GLU 285, THR 320, ASN 340, GLY 339, GLY 338, TYR 336 |
CVB: THR 201 π-ALK: ALA 248, TRP 225 VDW: ASN 158, MET 157, HIS 199, ASN 224, ASP 218, ASP 194, ASP 196, LEU 245 |
| 5 | 9-O-Pivaloyl-N-acetylcolchinol | 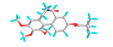 |
634928 | -6.0 | -7.0 | 39.79 | 7.35 | CVB: GLU 285 CHB: PHE 348 π-π-T: HIS 260, VAL 350, ILE 341, LEU 283 VDW: TYR 342, ASN 340, TYR 336, GLN 318, LYS 335, GLN 321, THR 320 |
CVB: THR 201 π-π: TRP 225 π-ALK: ALA 248 |
| 6 | Deoxycaesaldekarin C | 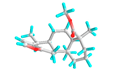 |
572829 | -6.5 | -7.0 | 17.10 | 7.35 | CVB: THR 320, TYR 342 ALK/π-ALK: ALA 347, LEU 283, ILE 341 VDW: GLU 285, GLN 318, TYR 336, ASN 340 |
ALK: ALA 78, LYS 77, ALA 368 π-AN: ASP 205 VDW: GLY 74, GLY 369, THR 228, HIS 259, GLY 229, PHE 75, GLU 365 |
| 7 | Ethyl (2E,6E,10E)-3,7,11,15-tetramethylhexadeca-2,6,10,14-tetraenoate |  |
5366011 | -5.2 | -6.3 | 153.61 | 23.97 | CVB: LYS 132, GLN 169 ALK/π-ALK: HIS 167, PHE 130, VAL 134, PHE 161, ALA 108, ILE 157, ARG 133 VDW: ASN 158, GLU 164, PRO 165, TYR 106, VAL 166, ARG 177 |
CHB: LYS 77, GLN 309 π-ALK: ALA 78, PHE 75, LEU 362, ARG 341, PRO 360 VDW: GLY 74, ALA 368, GLU 365, GLY 228, ASP 204, HIS 80 |
| 8 | Hexadecanoic acid, 1-(hydroxymethyl)-1,2-ethanediyl |  |
99931 | -4.9 | -4.8 | 254.94 | 301.84 | CVB: ILE 341, TYR 342 ALK/π-ALK: LEU 283, TYR 336 VDW: LEU 283, TYR 336 GLN 318, ALA 347, VAL 350, THR 320, GLY 339, ASN 340, GLN 285, PHE 348 |
CVB: GLN 309 (ester and OH) ALK: LEU 362, LEU 307, PRO 360, ARG 341 VDW: GLN 284, ALA 373, MET 371, GLN 372, MET 370, ASP 359 |
| 9 | Lanosta-7,9(11)-diene-3,18,20-triol |  |
91695604 | -6.9 | -7.1 | 8.70 | 6.21 | CVB: PHE 348 UDD: PHE 348 ALK/π-ALK: LEU 283, TYR 336 VDW: GLN 318, SER 284, GLU 285, THR 320, GLY 338, ILE 341, GLY 339, ASN 340, TYR 342, ASN 349, ALA 347 |
CHB: SER 204 ALK: LYS 257 AC-AC: ASP 205 VDW: HIS 259, GLU 365, THR 228, GLY 229, PHE 75, ALA 78, GLY 369, ALA 368 |
| 10 | Methyl 1-anthraquinonesulfenate |  |
349031192 | -6.0 | -7.0 | 39.79 | 7.35 | CVB: ILE 341 ALK/π-ALK: LEU 283, ILE 341 π-HB: THR 320 VDW: GLN 318, SER 284, HIS 260, GLU 285, TYR 342, ASN 340, GLY 339, TYR 336 |
CHB: GLN 309, LEU 362 π-S: LEU 307 π-ALK: ARG 341, PRO 360 VDW: ASP 359, GLN 343, MET 370, ASN 367, VAL 361 |
| 11 | Monostearin | 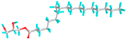 |
24699 | -4.7 | -5.2 | 357.37 | 153.61 | CVB: GLU 285, VAL 350 CHB: HIS 260 VDW: ASN 340, GLY 339, TYR 342, GLN 321, GLN 318, THR 320, ASN 349 ALK/π-ALK: ILE 341, LEU 283, TYR 336 |
CVB: THR 155, ASP 194, HIS 199 ALK/π-ALK: MET 157, TRP 225 VDW: GLY 195, GLY 369, GLU 365, THR 228 |
| 12 | Skatole | 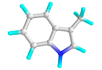 |
6736 | -4.5 | -5.3 | 500.95 | 129.74 | π-CAT: LYS 132 VDW: ARG 133, GLU 164 π-S: ILE 157 π-π-T: PHE 161 ALK/π-ALK: VAL 166, TYR 106 |
CHB: ASP 205 π-ALK: ALA 78, ALA 368, PHE 75, HIS 259 VDW: GLY 369, GLY 229, THR 228, GLU 365 |
| 13 | Squalene |  |
638072 | -4.7 | -5.8 | 357.37 | 55.77 | ALK/π-ALK: TYR 336, LEU 283, ILE 341, TYR 342, ALA 347 VDW: GLN 318, GLY 339, THR 320, PHE 348, VAL 350, ASN 340, GLU 285, HIS 260 |
ALK: LEU 307, PRO 360, MET 370, LEU 362, ARG 341, ALA 373 VDW: MET 371, GLN 372, GLN 309, ASP 359, GLN 343 |
Alkyl: ALK, π-cation: π-CAT, π-alkyl: π-ALK, π-anion: π-AN, Conventional Hydrogen Bond: CVB, Carbon Hydrogen Bond: CHB, π-donor- Hydrogen Bond: π-HBπ-π-T-shaped: π-π-T, π-sigma: π-S, π-π stacked: π-π, Van Der Waals: VDW, Unfavorable Acceptor-Acceptor: AC-AC, Unfavorable Donor-Donor: UDD.
4. Conclusion
In this study, hydrophobic NADES were formulated using four terpene-related components (camphor, eugenol, menthol, and thymol) in a 1:1 molar ratio. These NADES were characterized through both experimental and simulation methods and applied as solvents for extracting bioactive compounds from Hiba wood biomass. Molecular docking analysis further evaluated the allergen-repressing potential of the extracted compounds. The findings demonstrated that the NADES are stable for essential oil extraction, with intermolecular hydrogen bonding playing a key role in their formation, particularly in the Menthol-Eugenol NADES, which exhibited the strongest hydrogen bonding. The selective extraction process highlighted the NADES’ ability to target specific bioactive compounds, and molecular docking suggested that 4,5-Alpha-Epoxy-3-Methoxy-17-Methyl-7-Alpha-(4-Phenyl-1,3-Butadienyl)-6-Beta,7-Beta-(Oxymethylene)Morphinan could be a promising lead compound for allergen inhibition. Future research should explore the efficacy of these bioactive compounds in allergy repression through in vitro and in vivo studies.
Supplementary Materials
The following supporting information can be downloaded at the website of this paper posted on Preprints.org.
Author Contributions
Tochukwu Oluwatosin Maduka: Conceptualization, Methodology, Data curation, Formal analysis, Software, Validation, Writing – original draft. Qingyue Wang: Supervision, Funding acquisition, Project administration, Writing- Reviewing and Editing. Christian Ebere Enyoh: Writing – review & editing. Miho Suzuki: review and editing, Weiqian Wang: review and editing, and Md Sohel Rana: review and editing.
Funding
This study was partially supported by the Special Funds for Basic Research (B) (No.22H03747, FY2022-FY2024) of Grant-in-Aid for Scientific Research of Japanese Ministry of Education, Culture, Sports, Science and Technology (MEXT).
Data Availability Statement
The data used in this research are in the manuscript and supplementary files, further information can be provided upon request.
Conflicts of Interest
The authors declare that they have no known competing financial interests or personal relationships that could have appeared to influence the work reported in this paper.
References
- Bader R F W 1990 In Atoms in Molecules: A Quantum Theory (Oxford: Clarendon Press); (b) Bader R F W 1985 Acc. Chem. Res. 18 9; (c) Bader R F W 1991 Chem. Rev. 91 893.
- Bader, R F W; Johnson, S; Tang, H T; Popelier, P L A. Phys. Chem. 1996; 100, 15398.
- Bader, R. F.; Essén, H. The characterization of atomic interactions. The Journal of chemical physics 1984, 80(5), 1943–1960. [Google Scholar] [CrossRef]
- Bitwell, C.; Indra, S. S.; Luke, C.; Kakoma, M. K. A review of modern and conventional extraction techniques and their applications for extracting phytochemicals from plants. Scientific African 2023, 19, e01585. [Google Scholar] [CrossRef]
- Bordas-Le Floch, V.; Groeme, R.; Chabre, H.; Baron-Bodo, V.; Nony, E.; Mascarell, L.; Moingeon, P. New insights into ragweed pollen allergens. Current allergy and asthma reports 2015, 15(11), 63. [Google Scholar] [CrossRef] [PubMed]
- Boudesocque-Delaye, L.; Ardeza, I. M.; Verger, A.; Grard, R.; Théry-Koné, I.; Perse, X.; Munnier, E. Natural Deep Eutectic Solvents as a Novel Bio-Based Matrix for Ready-to-Use Natural Antioxidants-Enriched Ingredients: Extraction and Formulation Optimization. Cosmetics 2024, 11(1), 17. [Google Scholar] [CrossRef]
- Bubalo, M. C.; Vidović, S.; Redovniković, I. R.; Jokić, S. New perspective in extraction of plant biologically active compounds by green solvents. Food and Bioproducts Processing 2018, 109, 52–73. [Google Scholar] [CrossRef]
- Choi, Y. H.; van Spronsen, J.; Dai, Y.; Verberne, M.; Hollmann, F.; Arends, I. W.; Verpoorte, R. Are natural deep eutectic solvents the missing link in understanding cellular metabolism and physiology? Plant physiology 2011, 156(4), 1701–1705. [Google Scholar] [CrossRef]
- Dai, Y.; Van Spronsen, J.; Witkamp, G. J.; Verpoorte, R.; Choi, Y. H. Natural deep eutectic solvents as new potential media for green technology. Analytica chimica acta 2013, 766, 61–68. [Google Scholar] [CrossRef]
- Dávila, M. J.; Alcalde, R.; Atilhan, M.; Aparicio, S.; PρT measurements and derived properties of liquid 1-alkanols; Hoover, W.G. Canonical dynamics: equilibrium phase-space distributions. The Journal of Chemical Thermodynamics Phys. Rev. A 2012, 47 31, 241–259 1695. [Google Scholar] [CrossRef]
- Emamian, S.; Lu, T.; Kruse, H.; Emamian, H. Exploring nature and predicting strength of hydrogen bonds: a correlation analysis between atoms-in-molecules descriptors, binding energies, and energy components of symmetry-adapted perturbation theory. Journal of computational chemistry 2019, 40(32), 2868–2881. [Google Scholar] [CrossRef]
- Enyoh, C. E.; Wang, Q.; Wang, W.; Chowdhury, T.; Rabin, M. H.; Islam, R.; Xiao, K. Sorption of per-and polyfluoroalkyl substances (PFAS) using Polyethylene (PE) microplastics as adsorbent: Grand canonical Monte Carlo and molecular dynamics (GCMC-MD) studies. International Journal of Environmental Analytical Chemistry 2024, 104(12), 2719–2735. [Google Scholar] [CrossRef]
- Enyoh, C.E.; Wang, Qingyue; Wang, Weiqian; Chowdhury, Tanzin; Rabin, Mominul Haque; Islam; Md Rezwanul, Yue; Guo, Yichun; Lin; Xiao, Kai. Sorption of per-and polyfluoroalkyl substances (PFAS) using polyethylene (PE) microplastics as adsorbent: grand canonical Monte Carlo and molecular dynamics (GCMC-MD) studies. Int. J. Environ. Anal. Chem. 2022b. [Google Scholar] [CrossRef]
- Enyoh, CE; Wang, Q.; Ovuoraye, PE; Maduka, TO. Toxicity evaluation of microplastics to aquatic organisms through molecular simulations and fractional factorial designs. Chemosphere 2022, 308, 136342. [Google Scholar] [CrossRef] [PubMed]
- Escobar, A.; Perez, M.; Romanelli, G.; Blustein, G. Thymol bioactivity: A review focusing on practical applications. Arabian Journal of Chemistry 2020, 13(12), 9243–9269. [Google Scholar] [CrossRef]
- Essmann, U.; Perera, L.; Berkowitz, M. L.; Darden, T.; Lee, H.; Pedersen, L. G. A smooth particle mesh Ewald method. The Journal of chemical physics 1995, 103(19), 8577–8593. [Google Scholar] [CrossRef]
- Fan, C.; Liu, Y.; Sebbah, T.; Cao, X. A theoretical study on terpene-based natural deep eutectic solvent: relationship between viscosity and hydrogen-bonding interactions. Global Challenges 2021, 5(3), 2000103. [Google Scholar] [CrossRef]
- Fan, C.; Liu, Y.; Sebbah, T.; Cao, X. A theoretical study on terpene-based natural deep eutectic solvent: relationship between viscosity and hydrogen-bonding interactions. Global Challenges 2021, 5(3), 2000103. [Google Scholar] [CrossRef]
- Farooq, M. Q.; Odugbesi, G. A.; Abbasi, N. M.; Anderson, J. L. Elucidating the role of hydrogen bond donor and acceptor on solvation in deep eutectic solvents formed by ammonium/phosphonium salts and carboxylic acids. ACS Sustainable Chemistry & Engineering 2020, 8(49), 18286–18296. [Google Scholar]
- Fattahi, N.; Shamsipur, M.; Nematifar, Z.; Babajani, N.; Moradi, M.; Soltani, S.; Akbari, S. Novel deep eutectic solvent-based liquid phase microextraction for the extraction of estrogenic compounds from environmental samples. RSC advances 2022, 12(23), 14467–14476. [Google Scholar] [CrossRef]
- Fourmentin, S.; Gomes, M. C.; Lichtfouse, E. (Eds.) Deep eutectic solvents for medicine, gas solubilization and extraction of natural substances; Springer Nature, 2020; Vol. 56. [Google Scholar]
- Frisch, M. J.; Trucks, G. W.; Schlegel, H. B.; Scuseria, G. E.; Robb, M. A.; Cheeseman, J. R.; Scalmani, G.; Barone, V.; Mennucci, B.; Petersson, G. A.; Nakatsuji, H.; Caricato, M.; Li, X.; Hratchian, H. P.; Izmaylov, A. F.; Bloino, J.; Zheng, G.; Sonnenberg, J. L.; Hada, M.; Fox, D. J. Gaussian 09, Revision D.01; Gaussian, Inc, 2013. [Google Scholar]
- Fujimura, T.; Fujinami, K.; Ishikawa, R.; Tateno, M.; Tahara, Y.; Okumura, Y.; Ohta, H.; Miyazaki, H.; Taniguchi, M. Recombinant Fusion Allergens, Cry j 1 and Cry j 2 from Japanese Cedar Pollen, Conjugated with Polyethylene Glycol Potentiate the Attenuation of Cry j 1-Specific IgE Production in Cry j 1-Sensitized Mice and Japanese Cedar Pollen Allergen-Sensitized Monkeys. International archives of allergy and immunology 2015, 168(1), 32–43. [Google Scholar] [CrossRef]
- Fuster, F.; Sevin, A.; Silvi, B. Topological analysis of the electron localization function (ELF) applied to the electrophilic aromatic substitution E.C. Ihmels, Jr Gmehling, Densities of toluene, carbon dioxide, carbonyl sulfide, and hydrogen sulfide over a wide temperature and pressure range in the sub-and supercritical state. The Journal of Physical Chemistry A Ind. Eng. Chem. Res. 2000, 104((4) 40), 852-858 4470–4477. [Google Scholar]
- García-Roldán, A.; Piriou, L.; Jauregi, P. Natural deep eutectic solvents as a green extraction of polyphenols from spent coffee ground with enhanced bioactivities. Frontiers in Plant Science 2023, 13, 1072592. [Google Scholar] [CrossRef] [PubMed]
- Goswami, A.; Rahman, S. N. R.; Sree, A.; Shunmugaperumal, T. Solubility of cinnarizine in natural deep eutectic solvent (camphor+ menthol) and correlation with different solubility models. Fluid Phase Equilibria 2024, 578, 114008. [Google Scholar] [CrossRef]
- Hanwell, M. D.; Curtis, D. E.; Lonie, D. C.; Vandermeersch, T.; Zurek, E.; Hutchison, G. R. Avogadro: an advanced semantic chemical editor, visualization, and analysis platform R.F.W. Bader, Atoms in molecules. Journal of cheminformatics Acc. Chem. Res. 2012, 4 18, 1-17 9–15. [Google Scholar]
- Huang, M. M.; Yiin, C. L.; Lock, S. S. M.; Chin, B. L. F.; Othman, I.; Chan, Y. H. Natural deep eutectic solvents (NADES) for sustainable extraction of bioactive compounds from medicinal plants: Recent advances, challenges, and future directions. Journal of Molecular Liquids 2025, 127202. [Google Scholar] [CrossRef]
- Ikpa, C. C. B.; Maduka, T. O. D. Antimicrobial Properties of Methanol Extract of Dacryodes edulis Seed and Determination of Phytochemical Composition Using FTIR and GCMS. Chemistry Africa 2020, 3(4), 927–935. [Google Scholar] [CrossRef]
- Iman, M.; et al. “Computational prediction of drug binding energies and pharmacological properties.”. Journal of Molecular Modeling 2015, 21(6), 1–12. [Google Scholar]
- Ishaq, M.; Gilani, M. A.; Ahmad, F.; Afzal, Z. M.; Arshad, I.; Bilad, M. R.; Khan, A. L. Theoretical and experimental investigation of CO2 capture through choline chloride based supported deep eutectic liquid membranes. Journal of Molecular Liquids 2021, 335, 116234. [Google Scholar] [CrossRef]
- Jangir, A. K.; Mandviwala, H.; Patel, P.; Sharma, S.; Kuperkar, K. Acumen into the effect of alcohols on choline chloride: L-lactic acid-based natural deep eutectic solvent (NADES): A spectral investigation unified with theoretical and thermophysical characterization. Journal of Molecular Liquids 2020, 317, 113923. [Google Scholar] [CrossRef]
- Javeed, A.; Sarfraz, M.; Bhutta, N. K.; Han, B. Alkaloids as natural anti-allergy agents: A mini review. Allergy Medicine 2024, 100014. [Google Scholar] [CrossRef]
- Johnson, E. R.; Keinan, S.; Mori-Sánchez, P.; Contreras-García, J.; Cohen, A. J.; Yang, W. Revealing noncovalent interactions. Journal of the American Chemical Society 2010, 132(18), 6498–6506. [Google Scholar] [CrossRef]
- Kalyniukova, A.; Holuša, J.; Musiolek, D.; Sedlakova-Kadukova, J.; Płotka-Wasylka, J.; Andruch, V. Application of deep eutectic solvents for separation and determination of bioactive compounds in medicinal plants. Industrial Crops and Products 2021, 172, 114047. [Google Scholar] [CrossRef]
- Kamatou, G. P.; Vermaak, I.; Viljoen, A. M.; Lawrence, B. M. Menthol: A simple monoterpene with remarkable biological properties. Phytochemistry 2013, 96, 15–25. [Google Scholar] [CrossRef]
- Khan, P.; Jamshaid, M.; Tabassum, S.; Perveen, S.; Mahmood, T.; Ayub, K.; Gilani, M. A. Exploring the interaction of ionic liquids with Al12N12 and Al12P12 nanocages for better electrode-electrolyte materials in super capacitors. Journal of Molecular Liquids 2021, 344, 117828. [Google Scholar] [CrossRef]
- Kianpoor, A.; Sadeghi, R. Novel hydrophobic acetanilide-based deep eutectic solvents. Preparation, properties, their applications in liquid–liquid extraction. Chemical Engineering Science 2024, 288, 119866. [Google Scholar] [CrossRef]
- Kim, C. H.; Lee, T.; Oh, I.; Nam, K. W.; Kim, K. H.; Oh, K. B.; Mar, W. Mast cell stabilizing effect of (−)-Elema-1, 3, 11 (13)-trien-12-ol and Thujopsene from Thujopsis dolabrata is mediated by Down-regulation of Interleukin-4 secretion in antigen-induced RBL-2H3 cells. Biological and Pharmaceutical Bulletin 2013, 36(3), 339–345. [Google Scholar] [CrossRef]
- Klix, C. L.; Maret, G.; Keim, P. Discontinuous shear modulus determines the glass transition temperature. Physical Review X 2015, 5(4), 041033. [Google Scholar] [CrossRef]
- Kumar, P. S. V.; Raghavendra, V.; Subramanian, V. Bader’s theory of atoms in molecules (AIM) and its applications to chemical bonding. Journal of Chemical Sciences 2016, 128, 1527–1536. [Google Scholar] [CrossRef]
- Kusano, S.; Kukimoto-Niino, M.; Satta, Y.; Ohsawa, N.; Uchikubo-Kamo, T.; Wakiyama, M.; Ikeda, M.; Terada, T.; Yamamoto, K.; Nishimura, Y.; Shirouzu, M.; Sasazuki, T.; Yokoyama, S. Structural basis for the specific recognition of the major antigenic peptide from the Japanese cedar pollen allergen Cry j 1 by HLA-DP5. Journal of molecular biology 2014, 426(17), 3016–3027. [Google Scholar] [CrossRef]
- Kusano, S.; Ueda, S.; Oryoji, D.; Toyoumi, A.; Hashimoto-Tane, A.; Kishi, H.; Yokoyama, S. Contributions of the N-terminal flanking residues of an antigenic peptide from the Japanese cedar pollen allergen Cry j 1 to the T-cell activation by HLA-DP5. International immunology 2023, 35(9), 447–458. [Google Scholar] [CrossRef]
- Lashgari, A.; Ghamami, S.; Govindarajan, M.; Salgado-Morán, G.; Montes Romero, P.; Gerli Candia, L. A theoretical quantum study of the electronic properties of mentoxy dichloro phosphorous (C10H19OPCl2). Journal of the Chilean Chemical Society 2018, 63(1), 3887–3897. [Google Scholar] [CrossRef]
- Lin, Y.; Xiao, K.; Wang, Q.; Lu, S.; Wang, W.; Seguchi, A. Research on Repressing Allergen Cry j 1 Released from Japanese Cedar Pollen Using Todomatsu Oil. Atmosphere 2023, 14(6), 991. [Google Scholar] [CrossRef]
- Lin, Y.; Xiao, K.; Wang, W.; Lu, S. ) Study on Lowering the Group 1 Protease Allergens from House Dust Mites by Exposing toTodomatsu Oil Atmosphere. Atmosphere 2023b, 14, 548. [Google Scholar] [CrossRef]
- Liu, Y.; Friesen, J. B.; McAlpine, J. B.; Lankin, D. C.; Chen, S. N.; Pauli, G. F. Natural deep eutectic solvents: properties, applications, and perspectives. Journal of natural products 2018, 81(3), 679–690. [Google Scholar] [CrossRef] [PubMed]
- Lorenz, A. R.; Scheurer, S.; Vieths, S. Food allergens: molecular and immunological aspects, allergen databases and cross-reactivity. Chemical immunology and allergy 2015, 101, 18–29. [Google Scholar] [CrossRef]
- Lu, T.; Chen, Q. Interaction region indicator: a simple real space function clearly revealing both chemical bonds and weak interactions. Chemistry-Methods 2021, 1(5), 231–239. [Google Scholar] [CrossRef]
- Lu, T.; Chen, F. Multiwfn: A multifunctional wavefunction analyzer. Journal of computational chemistry 2012, 33(5), 580–592. [Google Scholar] [CrossRef]
- Mahdy; AHS; Zayed; SE; Abo-Bakr, AM; Hassan, EA. Camphor: Synthesis, reactions and uses as a potential moiety in the development of complexes and organocatalysts. Tetrahedron 2022, 121, 132913. [Google Scholar] [CrossRef]
- Martins, M. A. R.; Pinho, S. P.; Coutinho, J. A. P. Insights into the nature of eutectic and deep eutectic mixtures. Journal of Solution Chemistry 2018. [Google Scholar] [CrossRef]
- Martins, M. A.; Silva, L. P.; Schaeffer, N.; Abranches, D. O.; Maximo, G. J.; Pinho, S. P.; Coutinho, J. A. Greener terpene–terpene eutectic mixtures as hydrophobic solvents. ACS sustainable chemistry & engineering 2019, 7(20), 17414–17423. [Google Scholar]
- Martins, M. A.; Silva, L. P.; Schaeffer, N.; Abranches, D. O.; Maximo, G. J.; Pinho, S. P.; Coutinho, J. A. Greener terpene–terpene eutectic mixtures as hydrophobic solvents. ACS sustainable chemistry & engineering 2019, 7(20), 17414–17423. [Google Scholar]
- Naseem, Z.; Shehzad, R. A.; Jabeen, S.; Tahir, S.; Mushtaq, F.; Zahid, M.; Iqbal, J. Quantum chemical investigation of choline chloride-based deep eutectic solvents. Chemical Physics 2023, 571, 111936. [Google Scholar] [CrossRef]
- Naseem, Z.; Shehzad, RA; Jabeen, S.; Tahir, S.; Mushtaq, F.; Zahid, M.; Iqbal, J. Quantum chemical investigation of choline chloride-based deep eutectic solvents. Chemical Physics 2023, 571, 111936. [Google Scholar] [CrossRef]
- Nejad, S. M.; Özgüneş, H.; Başaran, N. Pharmacological and toxicological properties of eugenol. Turkish journal of pharmaceutical sciences 2017, 14(2). [Google Scholar]
- Nisar, M. F.; Khadim, M.; Rafiq, M.; Chen, J.; Yang, Y.; Wan, C. C. Pharmacological properties and health benefits of eugenol: A comprehensive review. Oxidative medicine and cellular longevity 2021, 2021(1), 2497354. [Google Scholar] [CrossRef] [PubMed]
- Nortjie, E.; Basitere, M.; Moyo, D.; Nyamukamba, P. Extraction methods, quantitative and qualitative phytochemical screening of medicinal plants for antimicrobial textiles: a review. Plants 2022, 11(15). [Google Scholar] [CrossRef] [PubMed]
- Omar, K. A.; Sadeghi, R. Database of deep eutectic solvents and their physical properties: A review. Journal of Molecular Liquids 2023, 384, 121899. [Google Scholar] [CrossRef]
- Oppong, E.; Flink, N.; Cato, A. C. Molecular mechanisms of glucocorticoid action in mast cells. Molecular and cellular endocrinology 2013, 380(1-2), 119–126. [Google Scholar] [CrossRef]
- Osiecka, D.; Vakh, C.; Makoś-Chełstowska, P.; Kubica, P. Plant-based meat substitute analysis using microextraction with deep eutectic solvent followed by LC-MS/MS to determine acrylamide, 5-hydroxymethylfurfural and furaneol. Analytical and Bioanalytical Chemistry 2024, 416(5), 1117–1126. [Google Scholar] [CrossRef]
- Padilla, N.; Delso, I.; Bergua, F.; Lafuente, C.; Artal, M. Characterization of camphor: Thymol or dl-menthol eutectic mixtures; Structure, thermophysical properties, and lidocaine solubility. Journal of Molecular Liquids 2024, 405, 125069. [Google Scholar] [CrossRef]
- Pádua, AA; Costa Gomes, MF; Canongia Lopes, JN. Molecular solutes in ionic liquids: a structural perspective. Accounts of chemical research 2007, 40(11), 1087–1096. [Google Scholar] [CrossRef]
- Paiva, A.; Craveiro, R.; Aroso, I.; Martins, M.; Reis, R. L.; Duarte, A. R. C. Natural deep eutectic solvents–solvents for the 21st century. ACS Sustainable Chemistry & Engineering 2014, 2(5), 1063–1071. [Google Scholar]
- Parham, S.; Kharazi, A. Z.; Bakhsheshi-Rad, H. R.; Nur, H.; Ismail, A. F.; Sharif, S.; Berto, F. Antioxidant, antimicrobial and antiviral properties of herbal materials. Antioxidants 2020, 9(12), 1309. [Google Scholar] [CrossRef] [PubMed]
- Parr, R. G.; Szentpály, L. V.; Liu, S. Electrophilicity index. Journal of the American Chemical Society 1999, 121(9), 1922–1924. [Google Scholar] [CrossRef]
- Parrinello, M.; Rahman, A. Polymorphic transitions in single crystals: A new molecular dynamics method. Journal of Applied physics 1981, 52(12), 7182–7190. [Google Scholar] [CrossRef]
- Parsaee, Z.; Mohammadi, K.; Ghahramaninezhad, M.; Hosseinzadeh, B. A novel nano-sized binuclear nickel (II) Schiff base complex as a precursor for NiO nanoparticles: synthesis, characterization, DFT study and antibacterial activity. New Journal of Chemistry 2016, 40(12), 10569–10583. [Google Scholar] [CrossRef]
- Perkins, S. L.; Painter, P.; Colina, C. M. Experimental and computational studies of choline chloride-based deep eutectic solvents. Journal of Chemical & Engineering Data 2014, 59(11), 3652–3662. [Google Scholar]
- Popelier, P. L. A.; Aicken, F. M.; O’Brien, S. E. Atoms in molecules; Prentice Hall; Manchester, 2000; Vol. 188. [Google Scholar]
- Quesada-Moreno, M. M.; Fatima, M.; Medel, R.; Pérez, C.; Schnell, M. Sniffing out camphor: the fine balance between hydrogen bonding and London dispersion in the chirality recognition with α-fenchol. Physical Chemistry Chemical Physics 2022, 24(21), 12849–12859. [Google Scholar] [CrossRef]
- Rafati, S.; Ebrahimi, N.; Sadeghi, R. New family of type V natural hydrophobic deep eutectic solvents based on thymol-acetamide/acetanilide: Characteristics, intermolecular interactions and applications in liquid–liquid extraction. Separation and Purification Technology 2025, 359, 130583. [Google Scholar] [CrossRef]
- Rodríguez, Y. F.; Benito, C.; Aparicio, S.; Trenzado, J. L. Unveiling the high-pressure behavior of thymol+ carvone NADES: A combined experimental-computational approach. The Journal of Supercritical Fluids 2025, 215, 106408. [Google Scholar] [CrossRef]
- Rodríguez-Llorente, D.; Cañada-Barcala, A.; Álvarez-Torrellas, S.; Águeda, V. I.; García, J.; Larriba, M. A review of the use of eutectic solvents, terpenes and terpenoids in liquid–liquid extraction processes. Processes 2020, 8(10), 1220. [Google Scholar] [CrossRef]
- Rozas, S.; Zamora, L.; Benito, C.; Atilhan, M.; Aparicio, S. A study on monoterpenoid-based natural deep eutectic solvents. Green Chemical Engineering 2023, 4(1), 99–114. [Google Scholar] [CrossRef]
- Santos, C. D.; Cabot, J. C. Persistent effects after camphor ingestion: a case report and literature review. The Journal of Emergency Medicine 2015, 48(3), 298–304. [Google Scholar] [CrossRef] [PubMed]
- Smith, E. L.; Abbott, A. P.; Ryder, K. S. Deep eutectic solvents (DESs) and their applications. Chemical reviews 2014, 114(21), 11060–11082. [Google Scholar] [CrossRef] [PubMed]
- Srivastava, R.; Bhardwaj, N.; Jain, S. K.; Metya, A. K.; Parambil, J. V. Unveiling the potential of acetic acid-based hydrophobic natural deep eutectic solvents for phytochemical extraction. Journal of Molecular Liquids 2024, 408, 125314. [Google Scholar] [CrossRef]
- Su, H. G.; Peng, X. R.; Shi, Q. Q.; Huang, Y. J.; Zhou, L.; Qiu, M. H. Lanostane triterpenoids with anti-inflammatory activities from Ganoderma lucidum. Phytochemistry 2020, 173, 112256. [Google Scholar] [CrossRef]
- Sun, X.; Luo, H.; Dai, S. Ionic liquids-based extraction: a promising strategy for the advanced nuclear fuel cycle. Chemical reviews 2012, 112(4), 2100–2128. [Google Scholar] [CrossRef]
- Thakur, M.; Pathania, D. Environmental fate of organic pollutants and effect on human health. In Abatement of Environmental Pollutants; Elsevier, 2020; pp. 245–262. [Google Scholar]
- Ullah, A.; Munir, S.; Badshah, S. L.; Khan, N.; Ghani, L.; Poulson, B. G.; Jaremko, M. Important flavonoids and their role as a therapeutic agent. Molecules 2020, 25(22), 5243. [Google Scholar] [CrossRef]
- Van Osch, D. J.; Dietz, C. H.; Van Spronsen, J.; Kroon, M. C.; Gallucci, F.; van Sint Annaland, M.; Tuinier, R. A search for natural hydrophobic deep eutectic solvents based on natural components. ACS Sustainable Chemistry & Engineering 2019, 7(3), 2933–2942. [Google Scholar]
- Wopfner, N.; Jahn-Schmid, B.; Schmidt, G.; Christ, T.; Hubinger, G.; Briza, P.; Schwarzenbacher, R. The alpha and beta subchain of Amb a 1, the major ragweed-pollen allergen divergent reactivity at the IgE and T-cell level. Molecular immunology 2009, 46(10), 2090–2097. [Google Scholar] [CrossRef]
- Wu, K.; Zhang, H.; Lou, X.; Wu, X.; Wang, Y.; Zhao, K.; Xia, X. Analysis of NADES and its water tailoring effects constructed from inulin and L-proline based on structure, physicochemical and antifreeze properties. International Journal of Biological Macromolecules 2024, 277, 134049. [Google Scholar] [CrossRef]
- Yao, J.; Xiao, L.; Li, C.; Wang, B.; Chen, Y.; Yan, X.; Cui, Z. Exploration of the multiscale interaction mechanism between natural deep eutectic solvents and silybin by QC calculation and MD simulation. Journal of Molecular Liquids 2022, 363, 119768. [Google Scholar] [CrossRef]
- Zahid, S.; Rasool, A.; Ans, M.; Yaseen, M.; Iqbal, J. Quantum chemical approach of donor− π–acceptor based arylborane–arylamine macrocycles with outstanding photovoltaic properties toward high-performance organic solar cells. Energy & Fuels 2021, 35(18), 15018–15032. [Google Scholar]
- Zbîrcea, L. E.; Buzan, M. R.; Grijincu, M.; Babaev, E.; Stolz, F.; Valenta, R.; Păunescu, V.; Panaitescu, C.; Chen, K. W. Relationship between IgE Levels Specific for Ragweed Pollen Extract, Amb a 1 and Cross-Reactive Allergen Molecules. International journal of molecular sciences 2023, 24(4), 4040. [Google Scholar] [CrossRef]
- Zielińska-Błajet, M.; Pietrusiak, P.; Feder-Kubis, J. Selected monocyclic monoterpenes and their derivatives as effective anticancer therapeutic agents. International journal of molecular sciences 2021, 22(9), 4763. [Google Scholar] [CrossRef] [PubMed]
Figure 2.
a) visuals of the synthesized NADES, b) After 4 days.
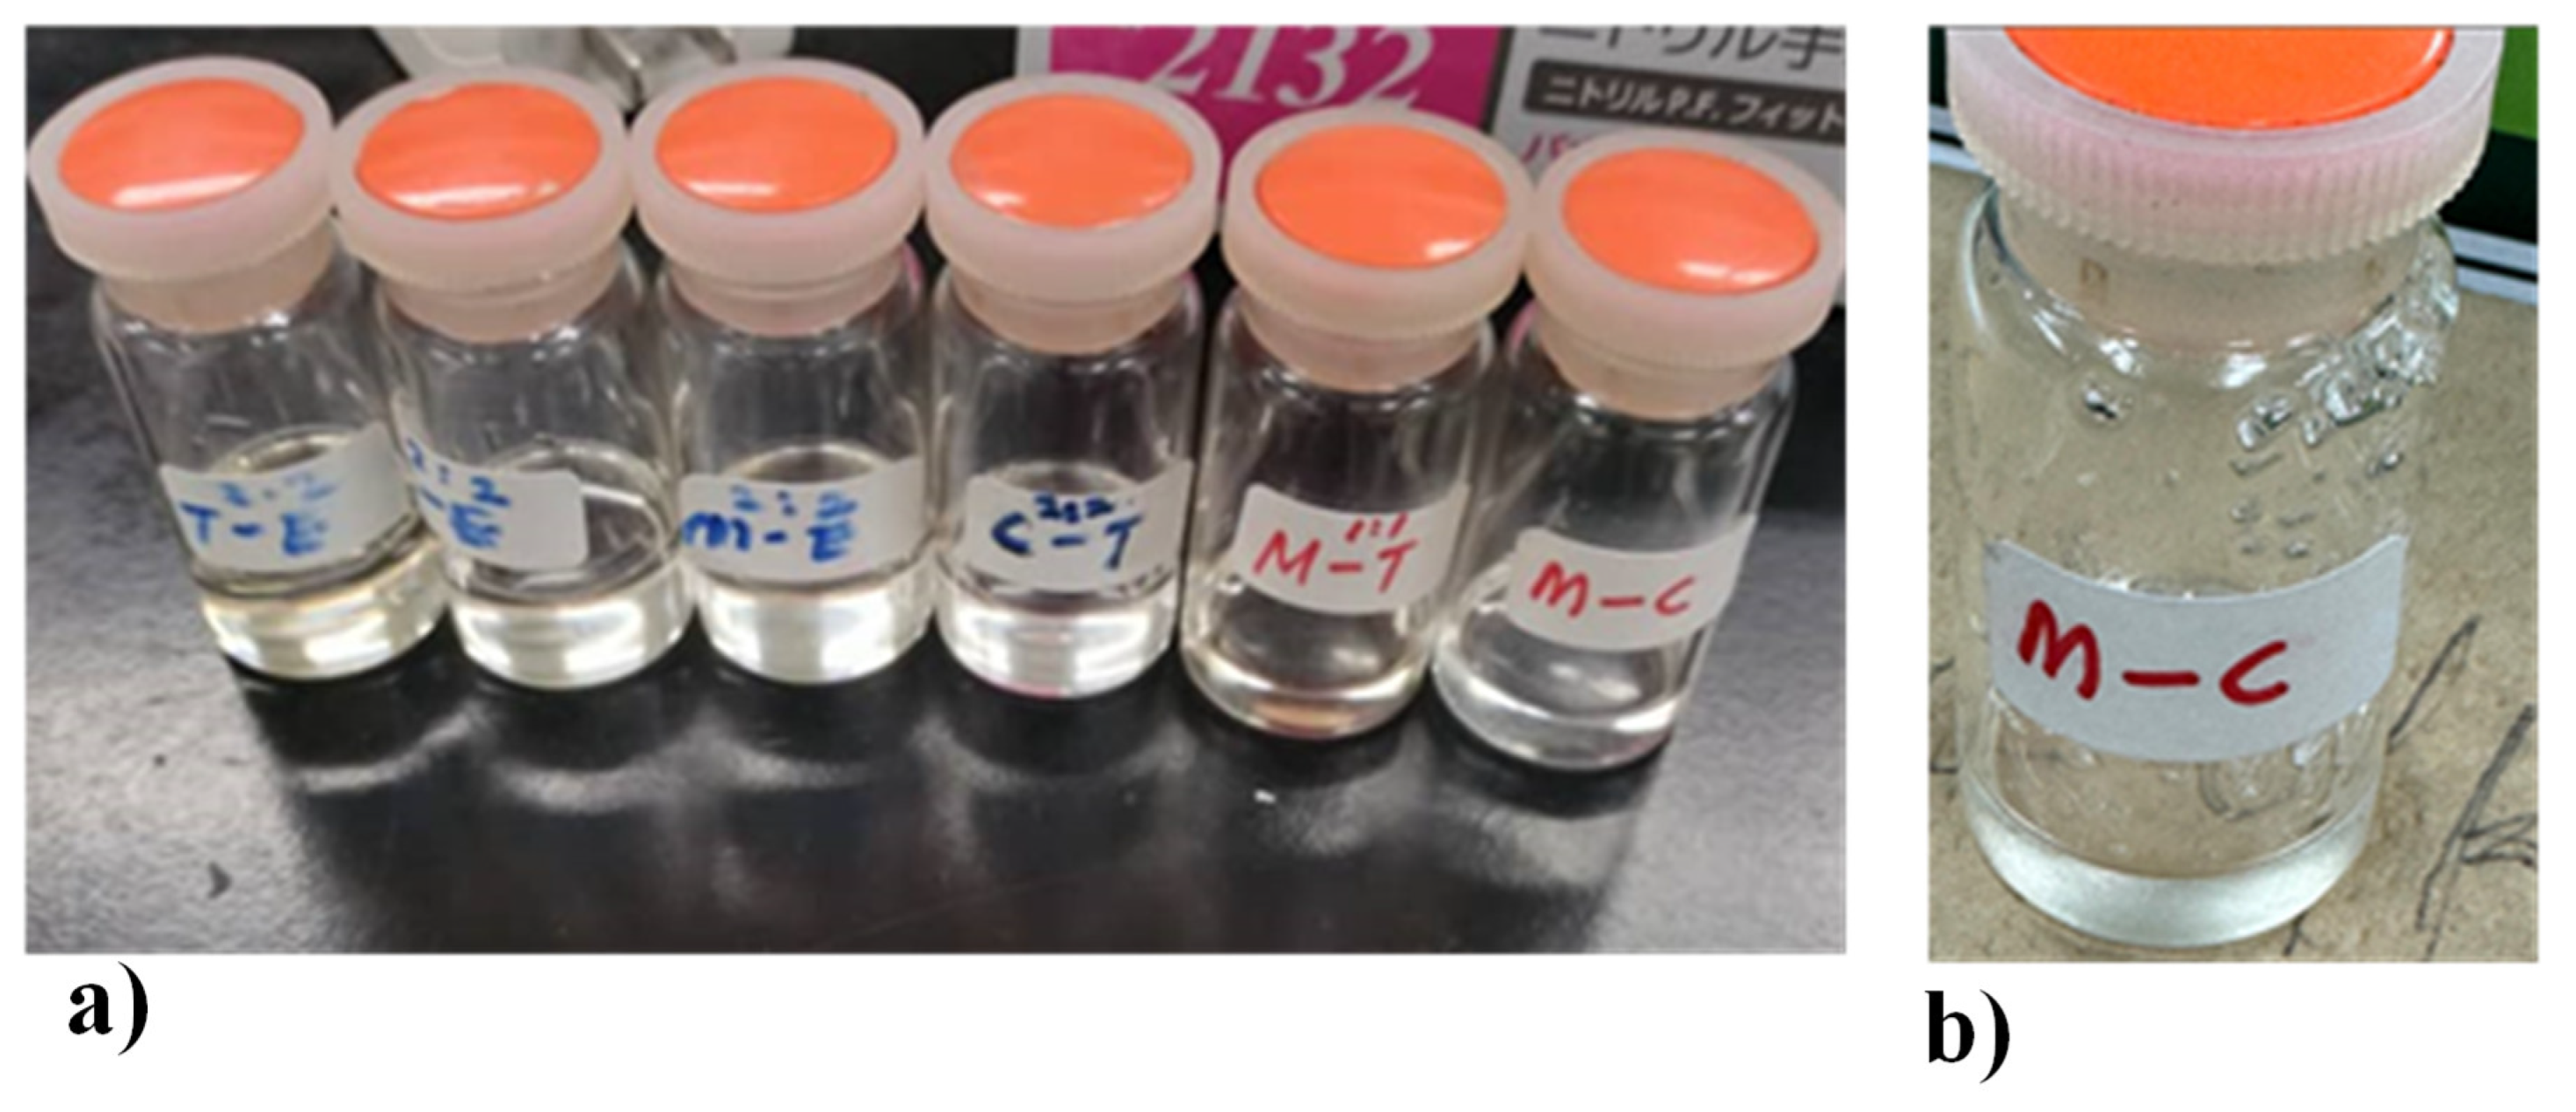
Figure 3.
a) TGA curves of the NADES, b) Comparison between the Tonset (onset temperature) of the NADES and the pure components, c) FTIR spectra of the NADES and the pure components.
Figure 3.
a) TGA curves of the NADES, b) Comparison between the Tonset (onset temperature) of the NADES and the pure components, c) FTIR spectra of the NADES and the pure components.
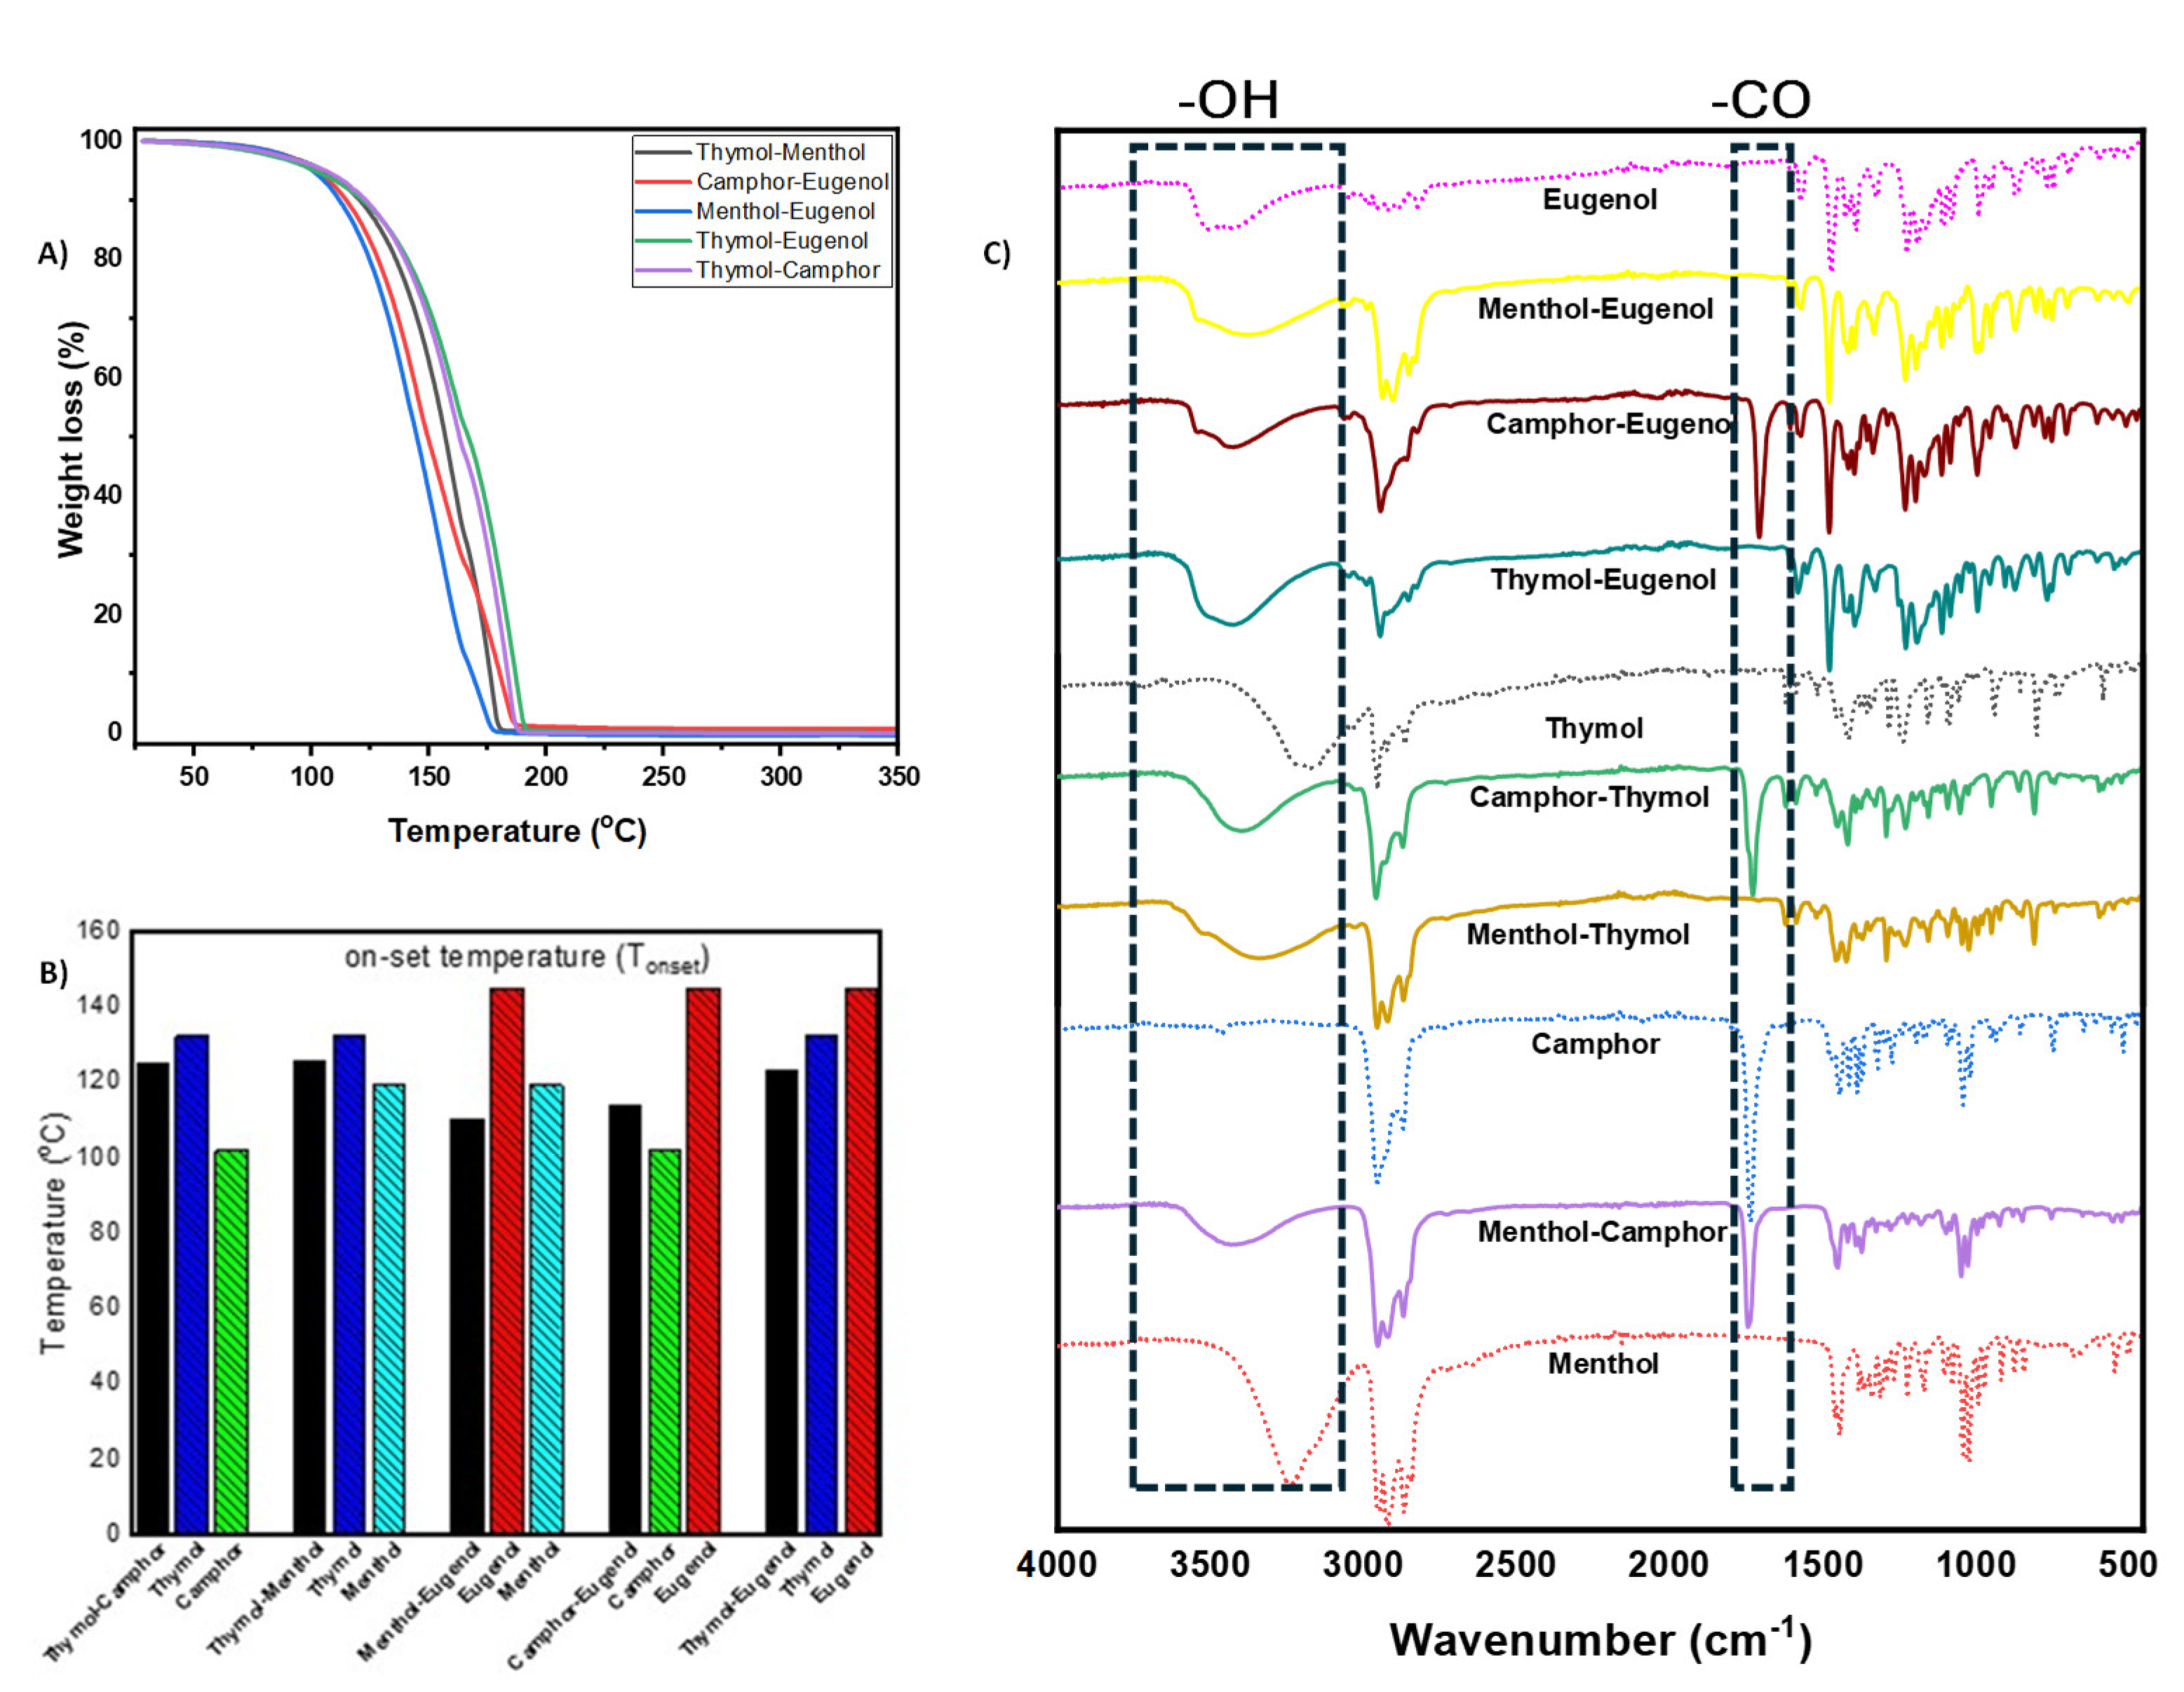
Figure 4.
TIC obtained from the GCMS analysis of the hydrophobic NADES extract of T. dolabrata wood biomass (A) Camphor-Eugenol, (B) Menthol-Thymol, (C) Menthol-Eugenol, (D) Thymol-eugenol, (E) Camphor-Thymol.
Figure 4.
TIC obtained from the GCMS analysis of the hydrophobic NADES extract of T. dolabrata wood biomass (A) Camphor-Eugenol, (B) Menthol-Thymol, (C) Menthol-Eugenol, (D) Thymol-eugenol, (E) Camphor-Thymol.
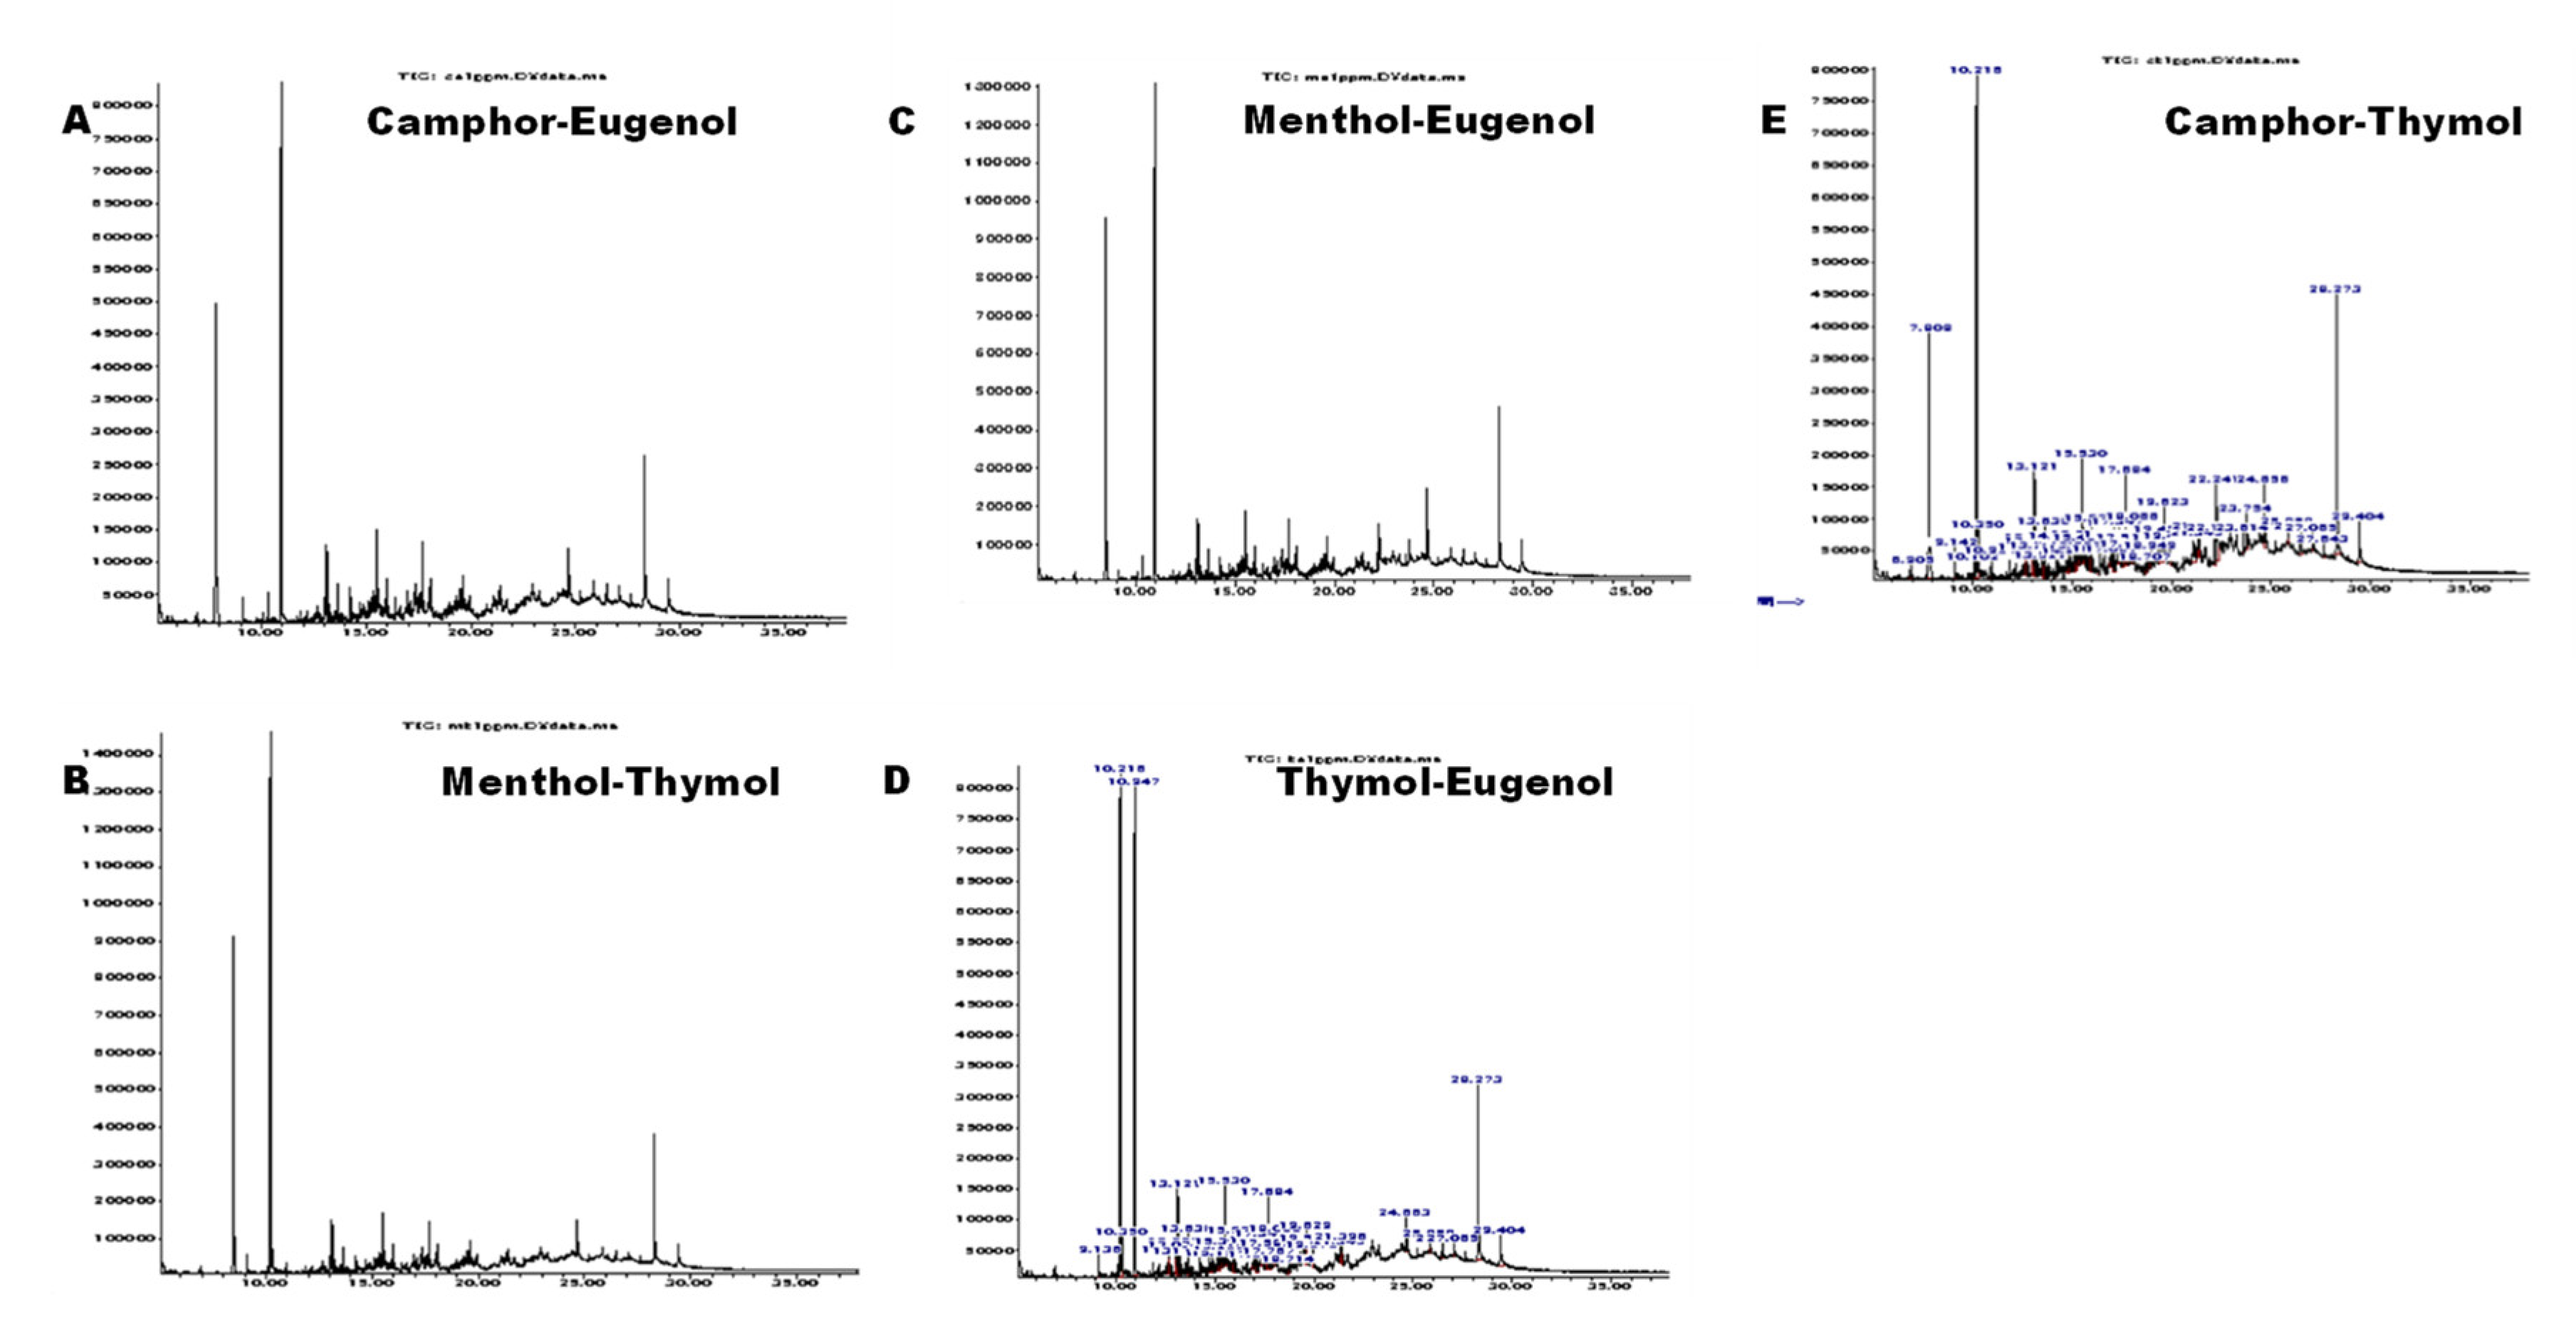
Figure 5.
(a-e) The NaDES extracts composition plotted as components against abundance (% peak area and ratio) graph, (f) PCA biplot explains the extraction efficiency of the synthesized hydrophobic NaDES.
Figure 5.
(a-e) The NaDES extracts composition plotted as components against abundance (% peak area and ratio) graph, (f) PCA biplot explains the extraction efficiency of the synthesized hydrophobic NaDES.
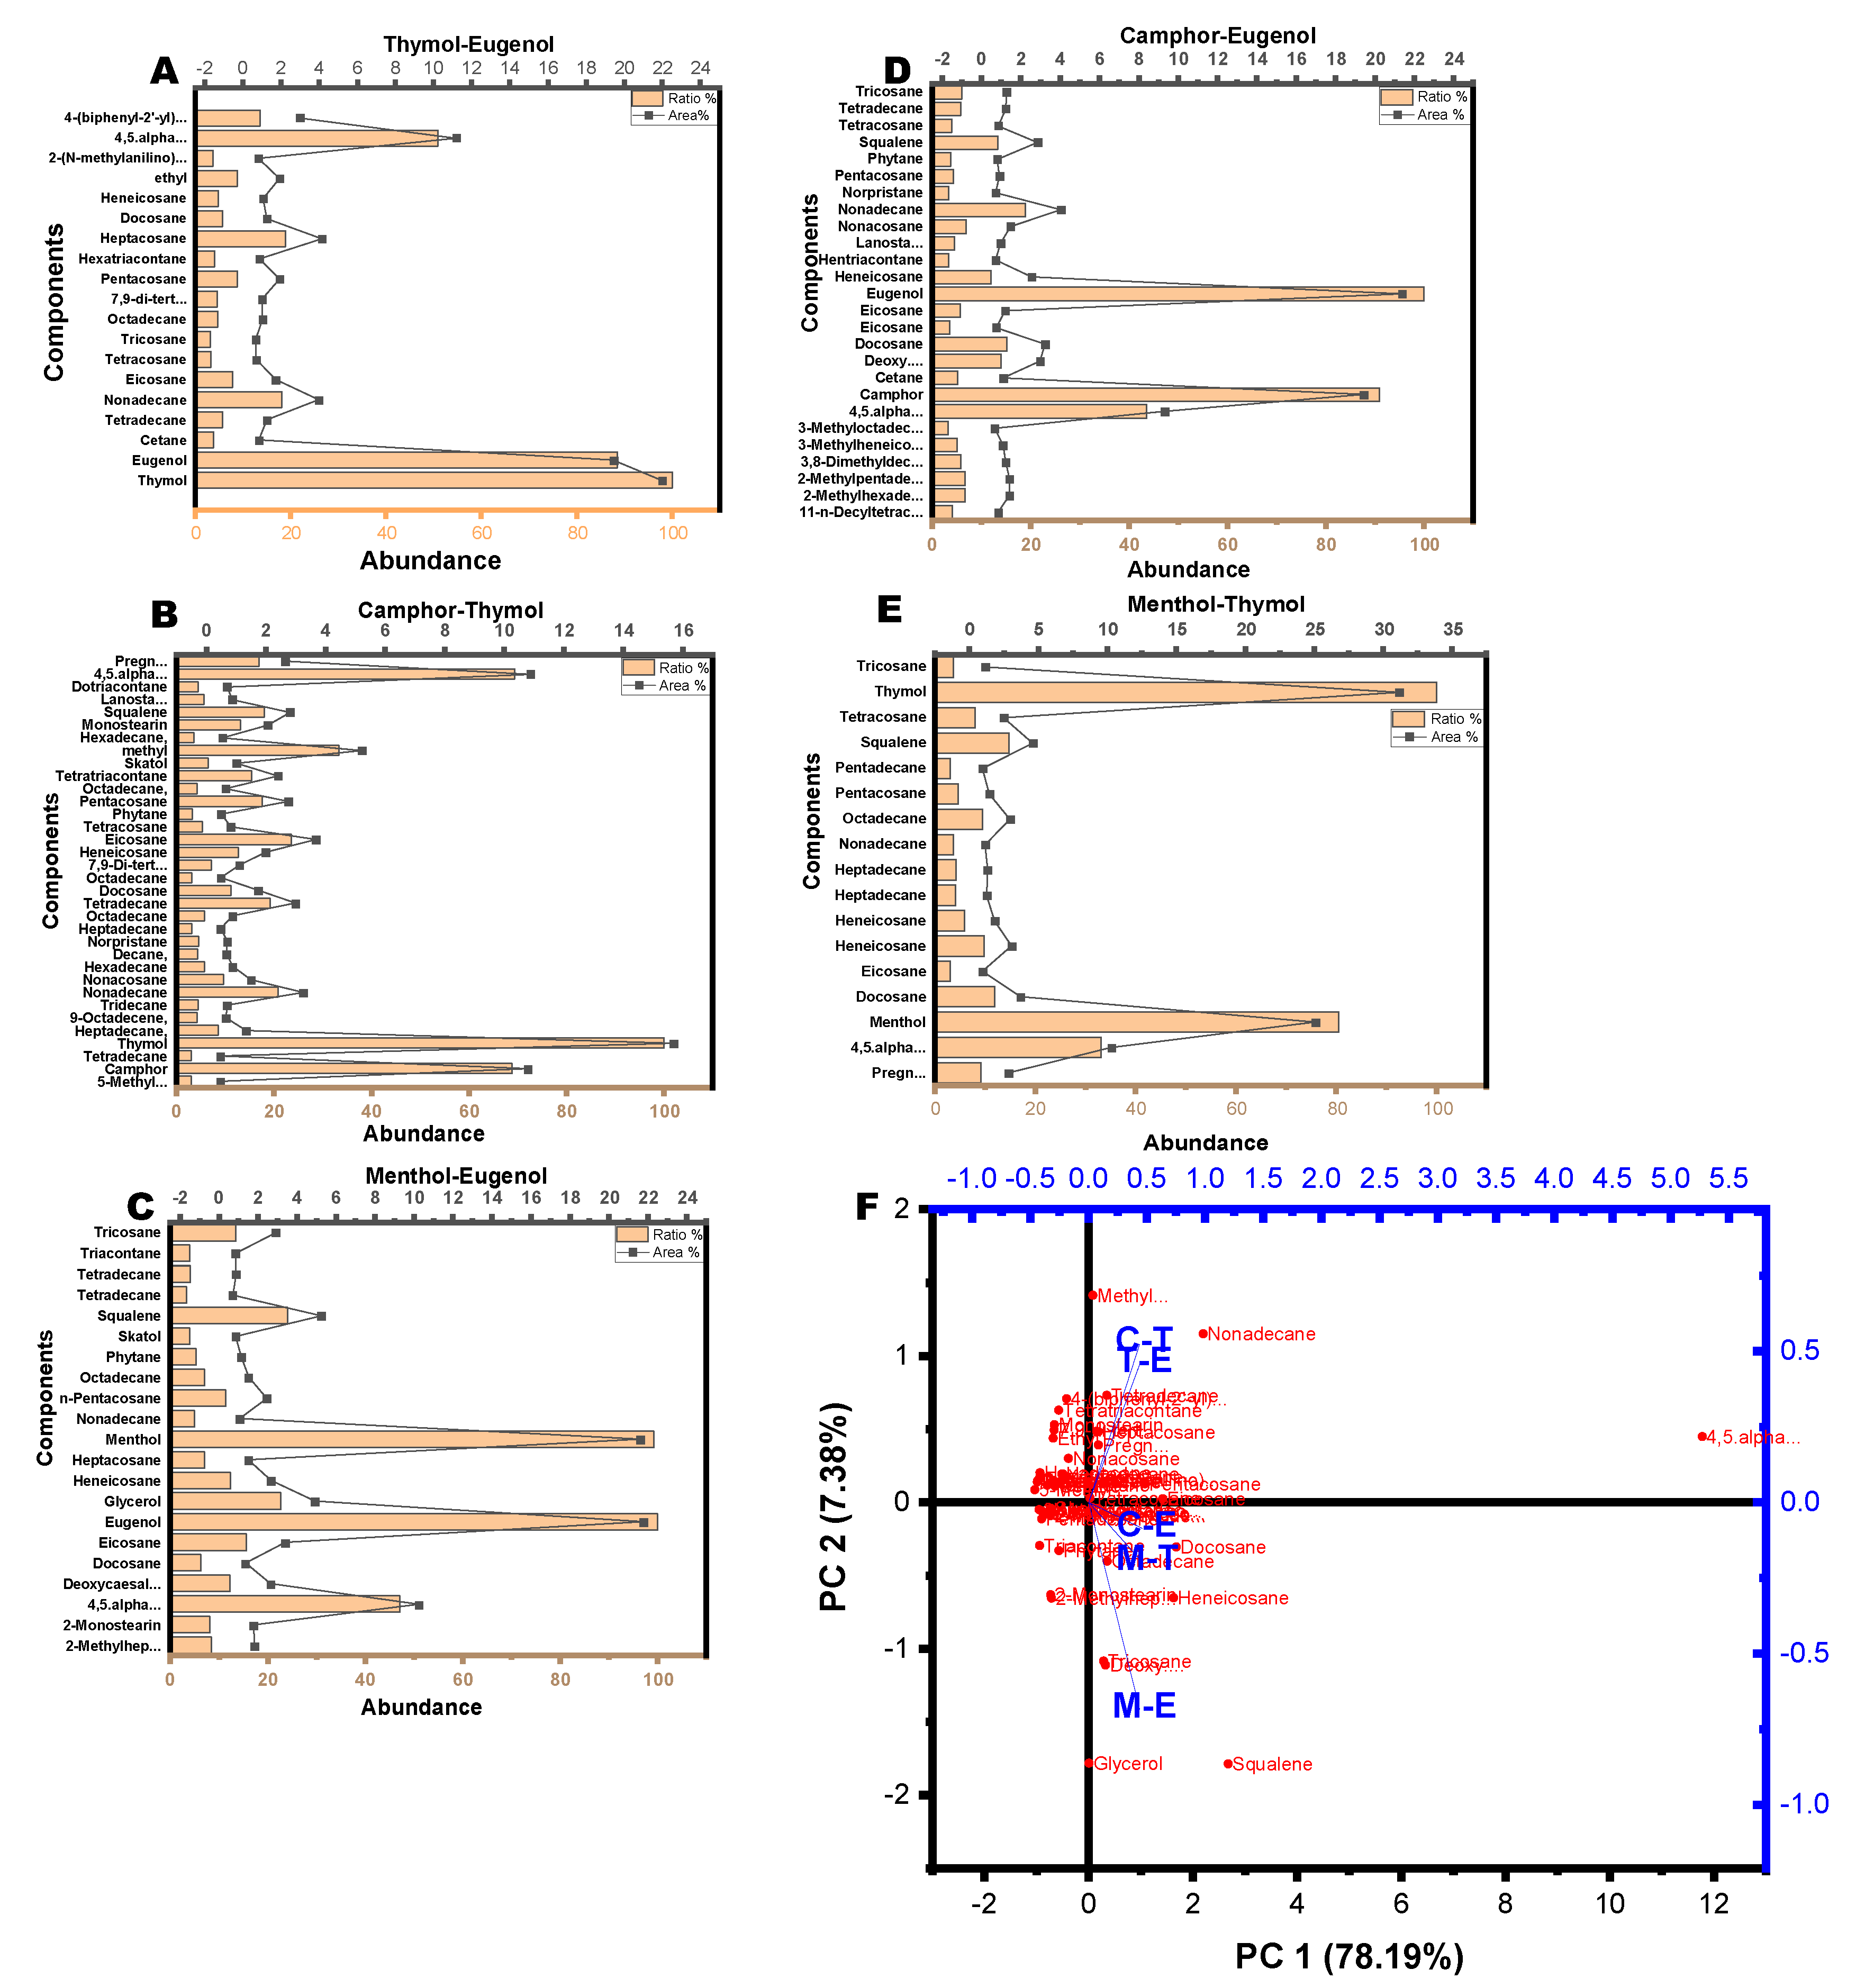
Figure 6.
(a-e) The HOMO-LUMO diagrams of the simulated NADES, f) Plot of the energy difference of the HOMO-LUMO of the pure components and the NADES.
Figure 6.
(a-e) The HOMO-LUMO diagrams of the simulated NADES, f) Plot of the energy difference of the HOMO-LUMO of the pure components and the NADES.
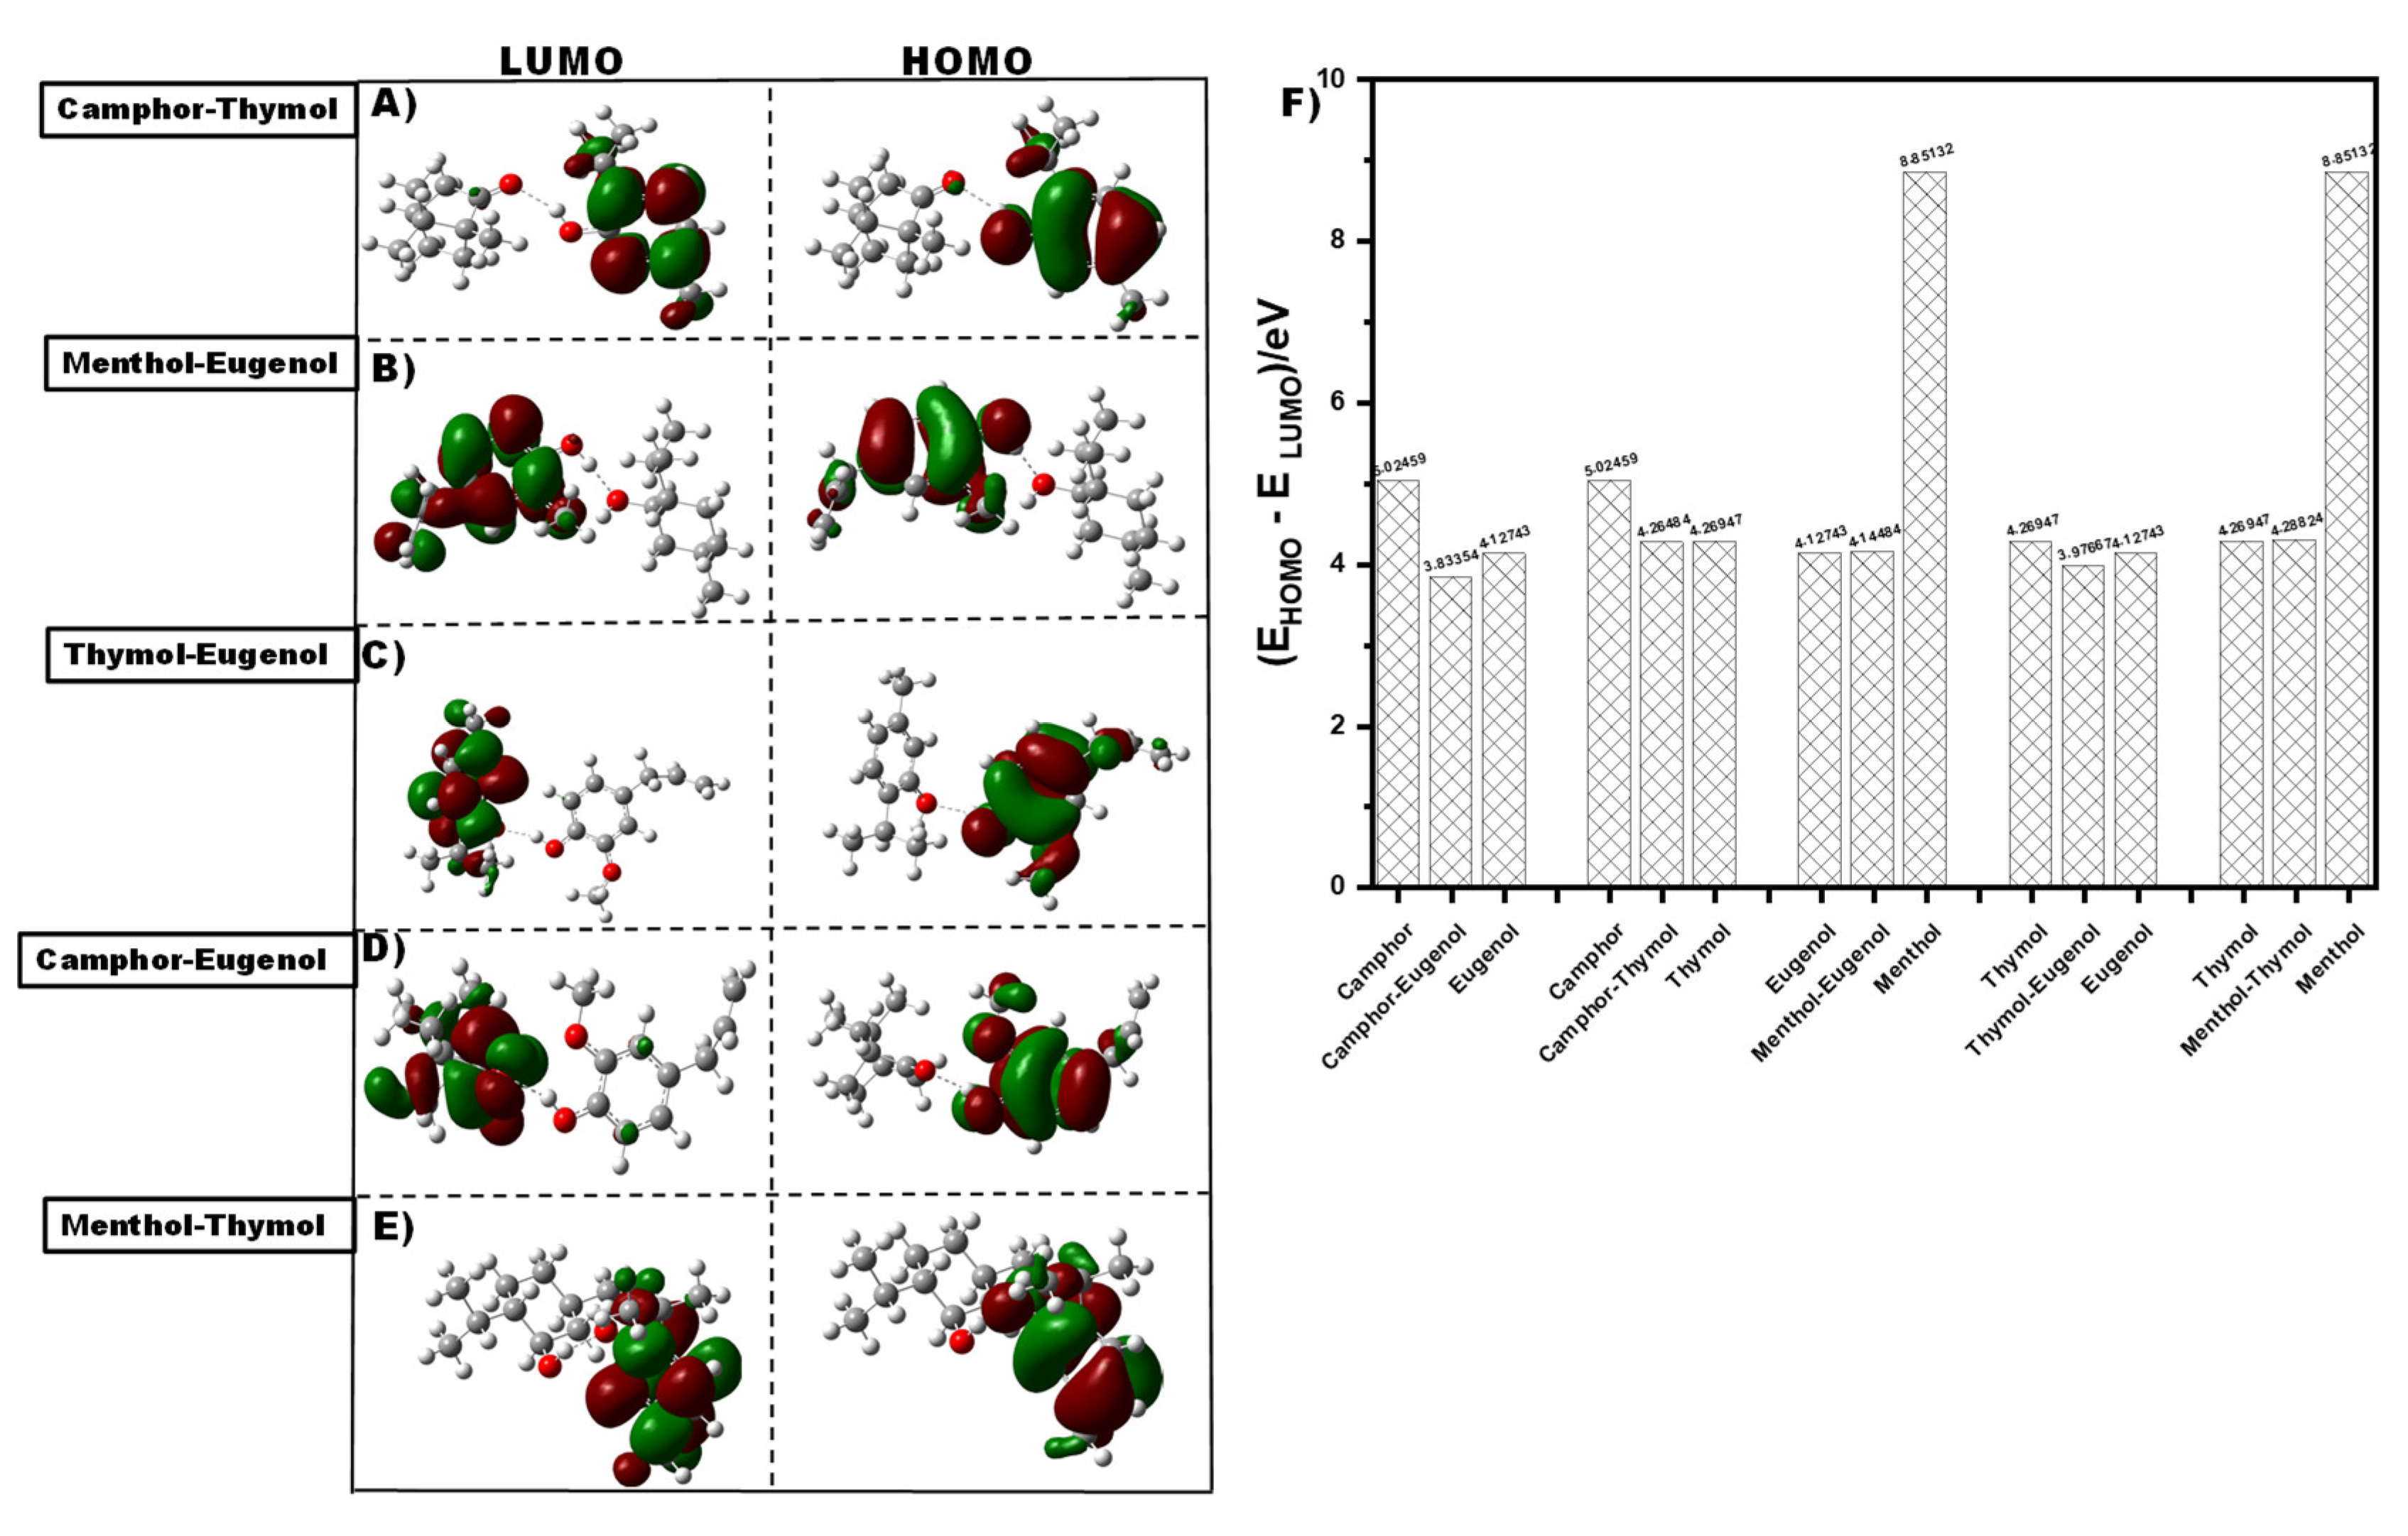
Figure 7.
(A-E) Plots of the RDG vs sign(λ2)ρ, (F – I) the gradient isosurfaces; IRI (left), and RDG (right) for the different NADES.
Figure 7.
(A-E) Plots of the RDG vs sign(λ2)ρ, (F – I) the gradient isosurfaces; IRI (left), and RDG (right) for the different NADES.
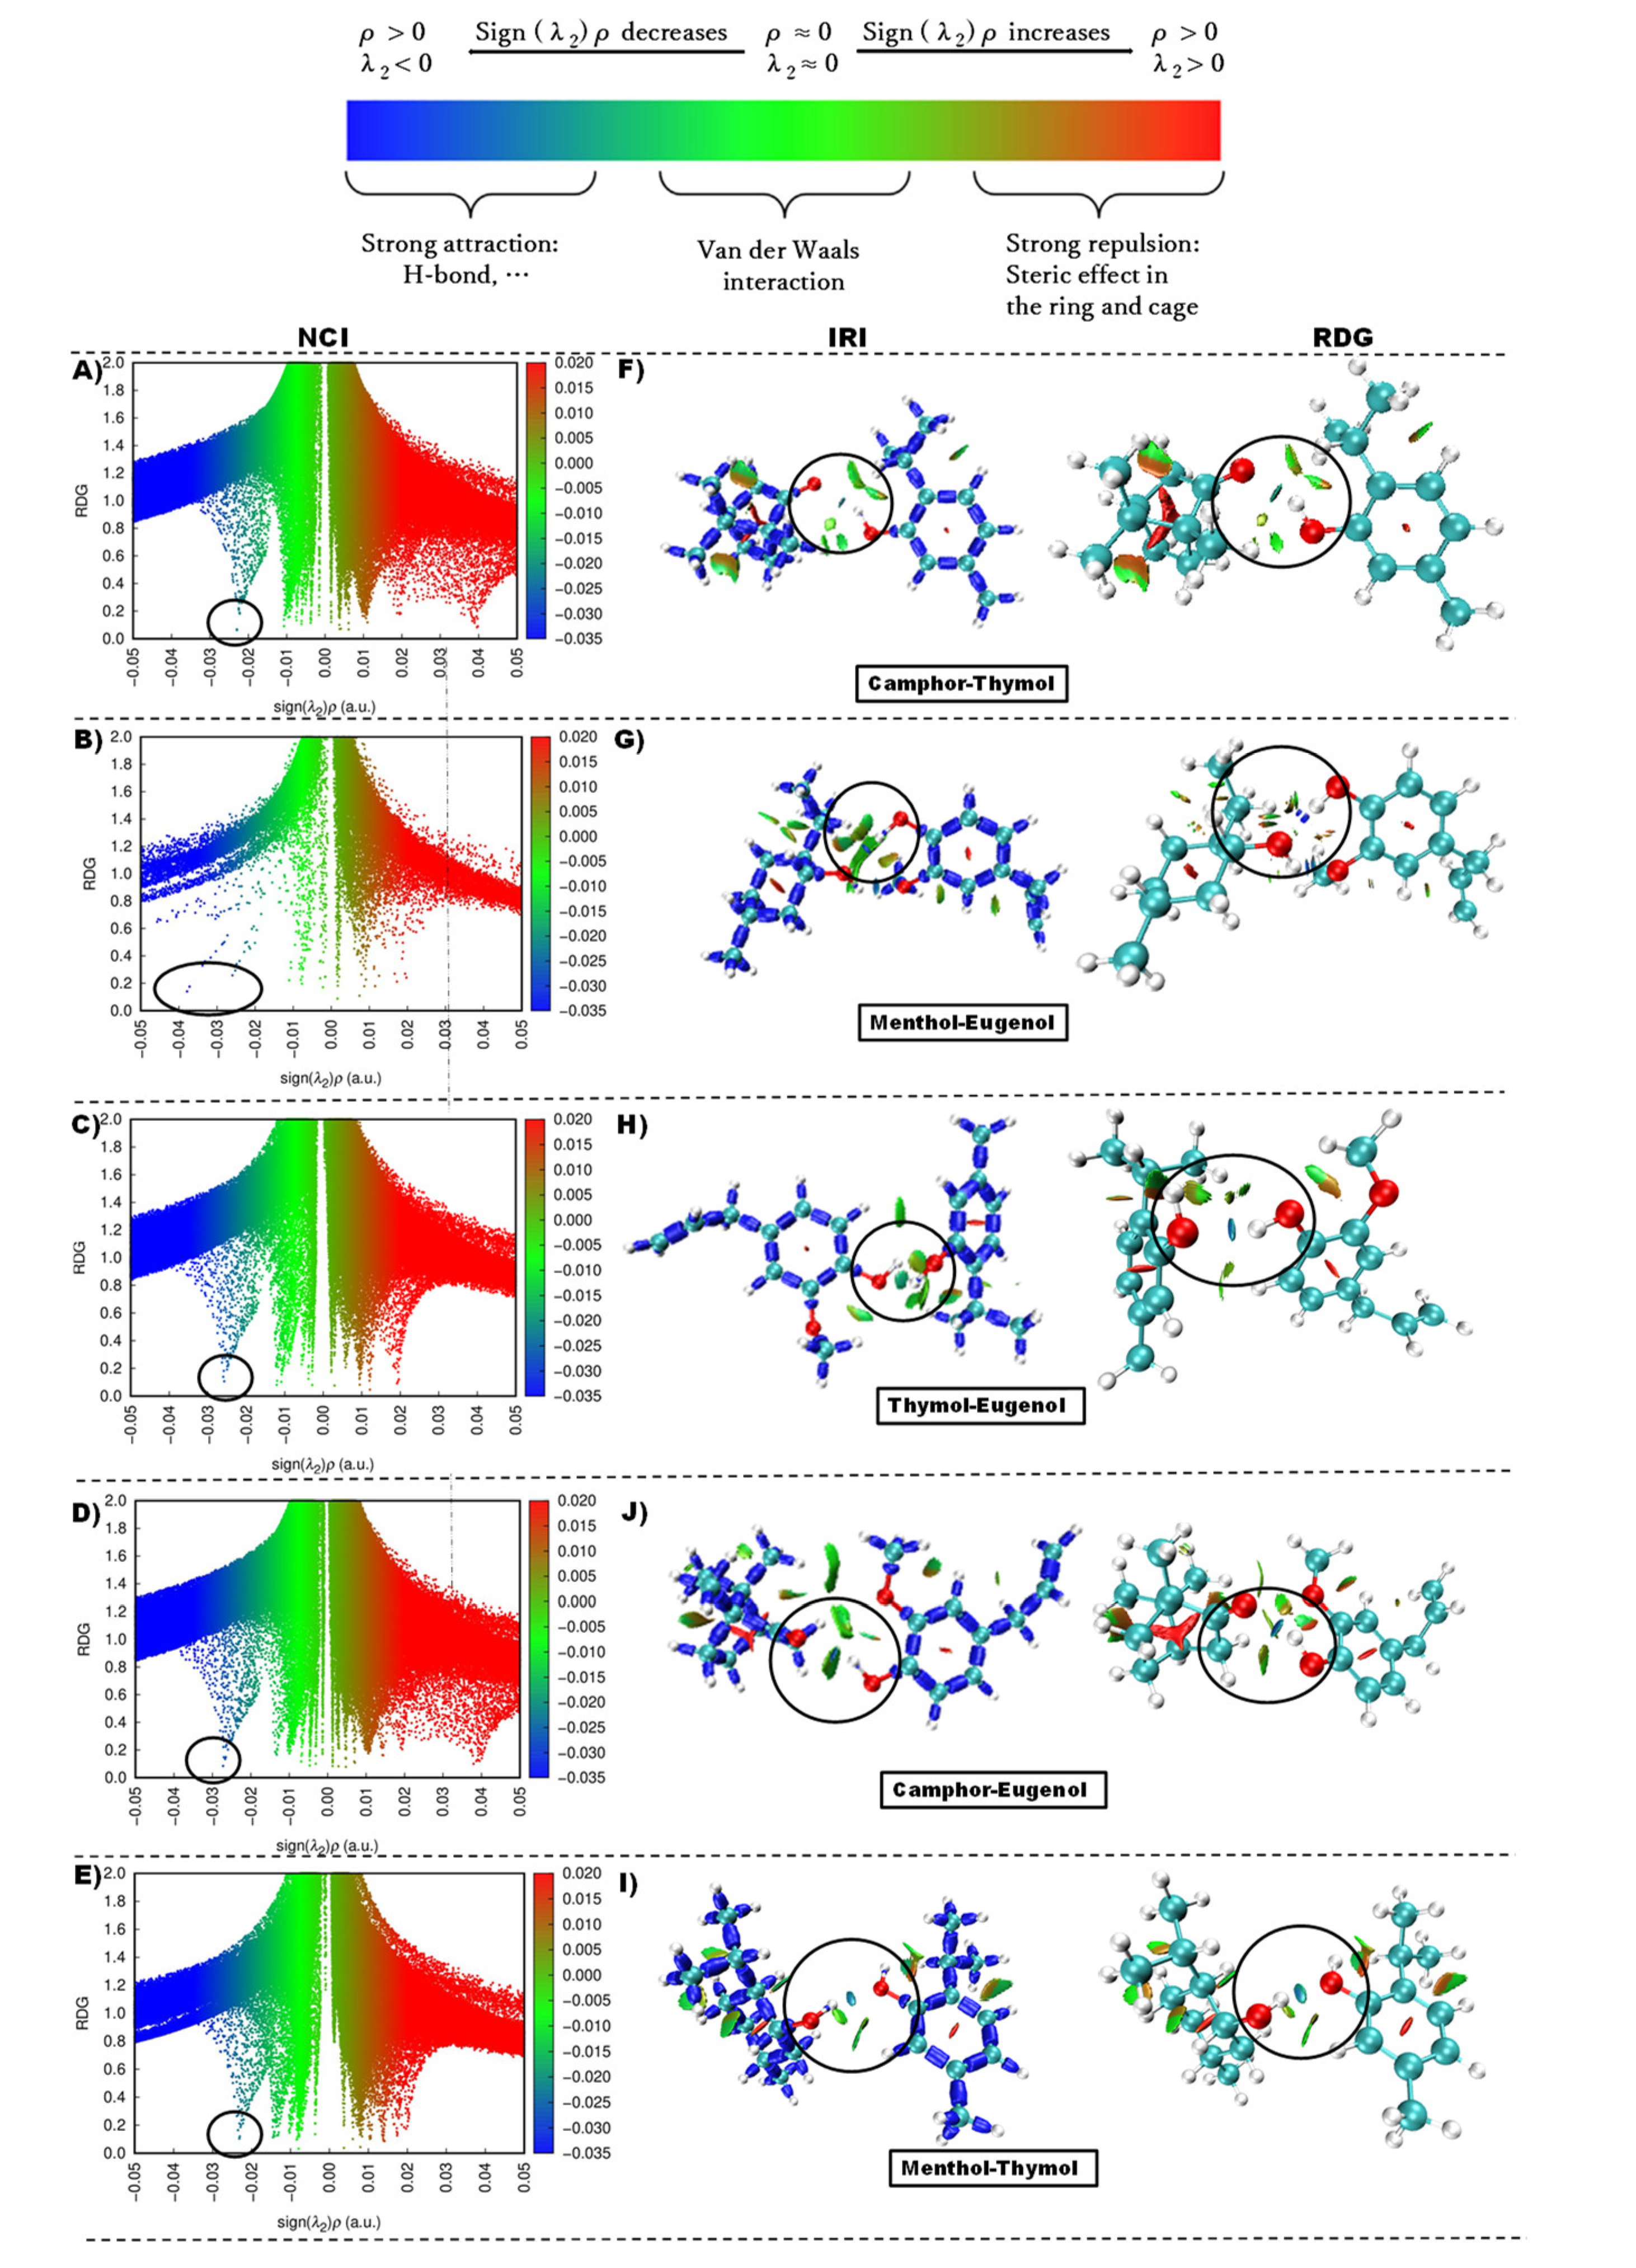
Figure 8.
molecular dynamics analysis of the simulated NADES showing A) Atom–atom radial distribution functions (RDF) B) Mean square displacement and C) diffusion coefficient components of the different natural deep eutectic solvents at 1 bar and 298 K.
Figure 8.
molecular dynamics analysis of the simulated NADES showing A) Atom–atom radial distribution functions (RDF) B) Mean square displacement and C) diffusion coefficient components of the different natural deep eutectic solvents at 1 bar and 298 K.
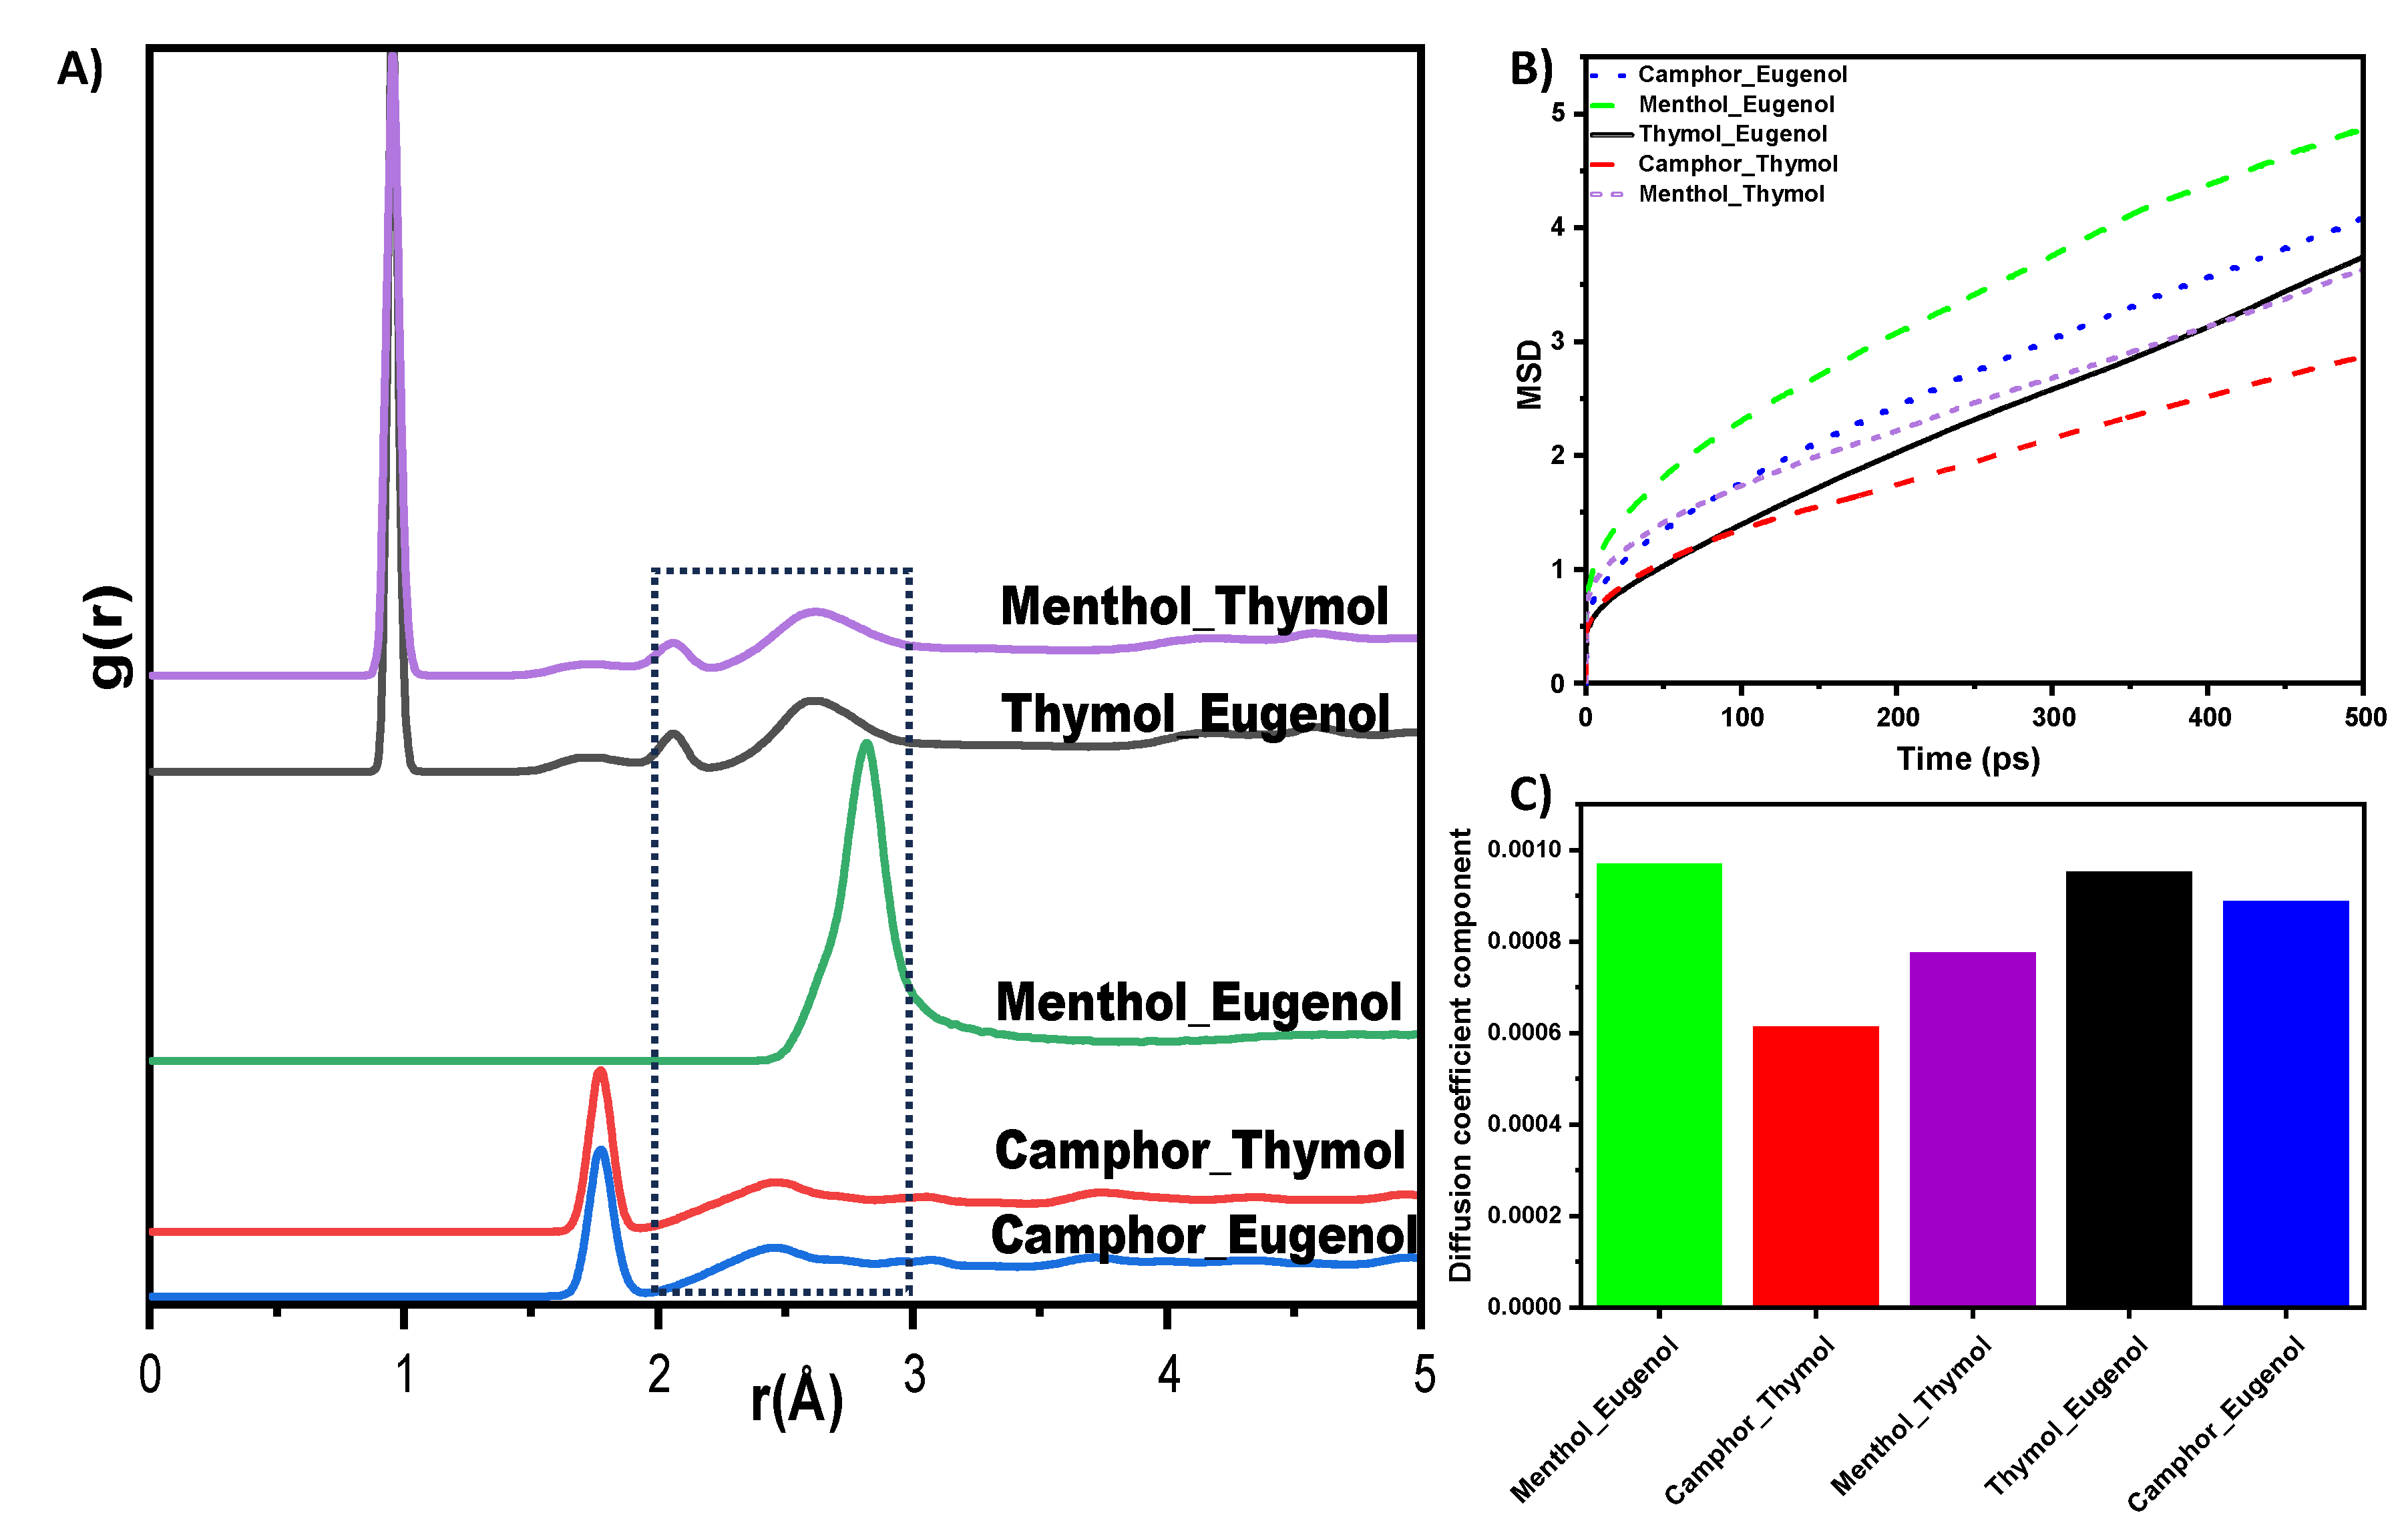
Figure 9.
Inhibitory potency of NADES extract components toward (a) Cry j 1 and (b) Amb a1. (left) Binding energy (B.E.) of docking and inhibition constant of each extracted component to the allergens and (right) their regression analysis.
Figure 9.
Inhibitory potency of NADES extract components toward (a) Cry j 1 and (b) Amb a1. (left) Binding energy (B.E.) of docking and inhibition constant of each extracted component to the allergens and (right) their regression analysis.
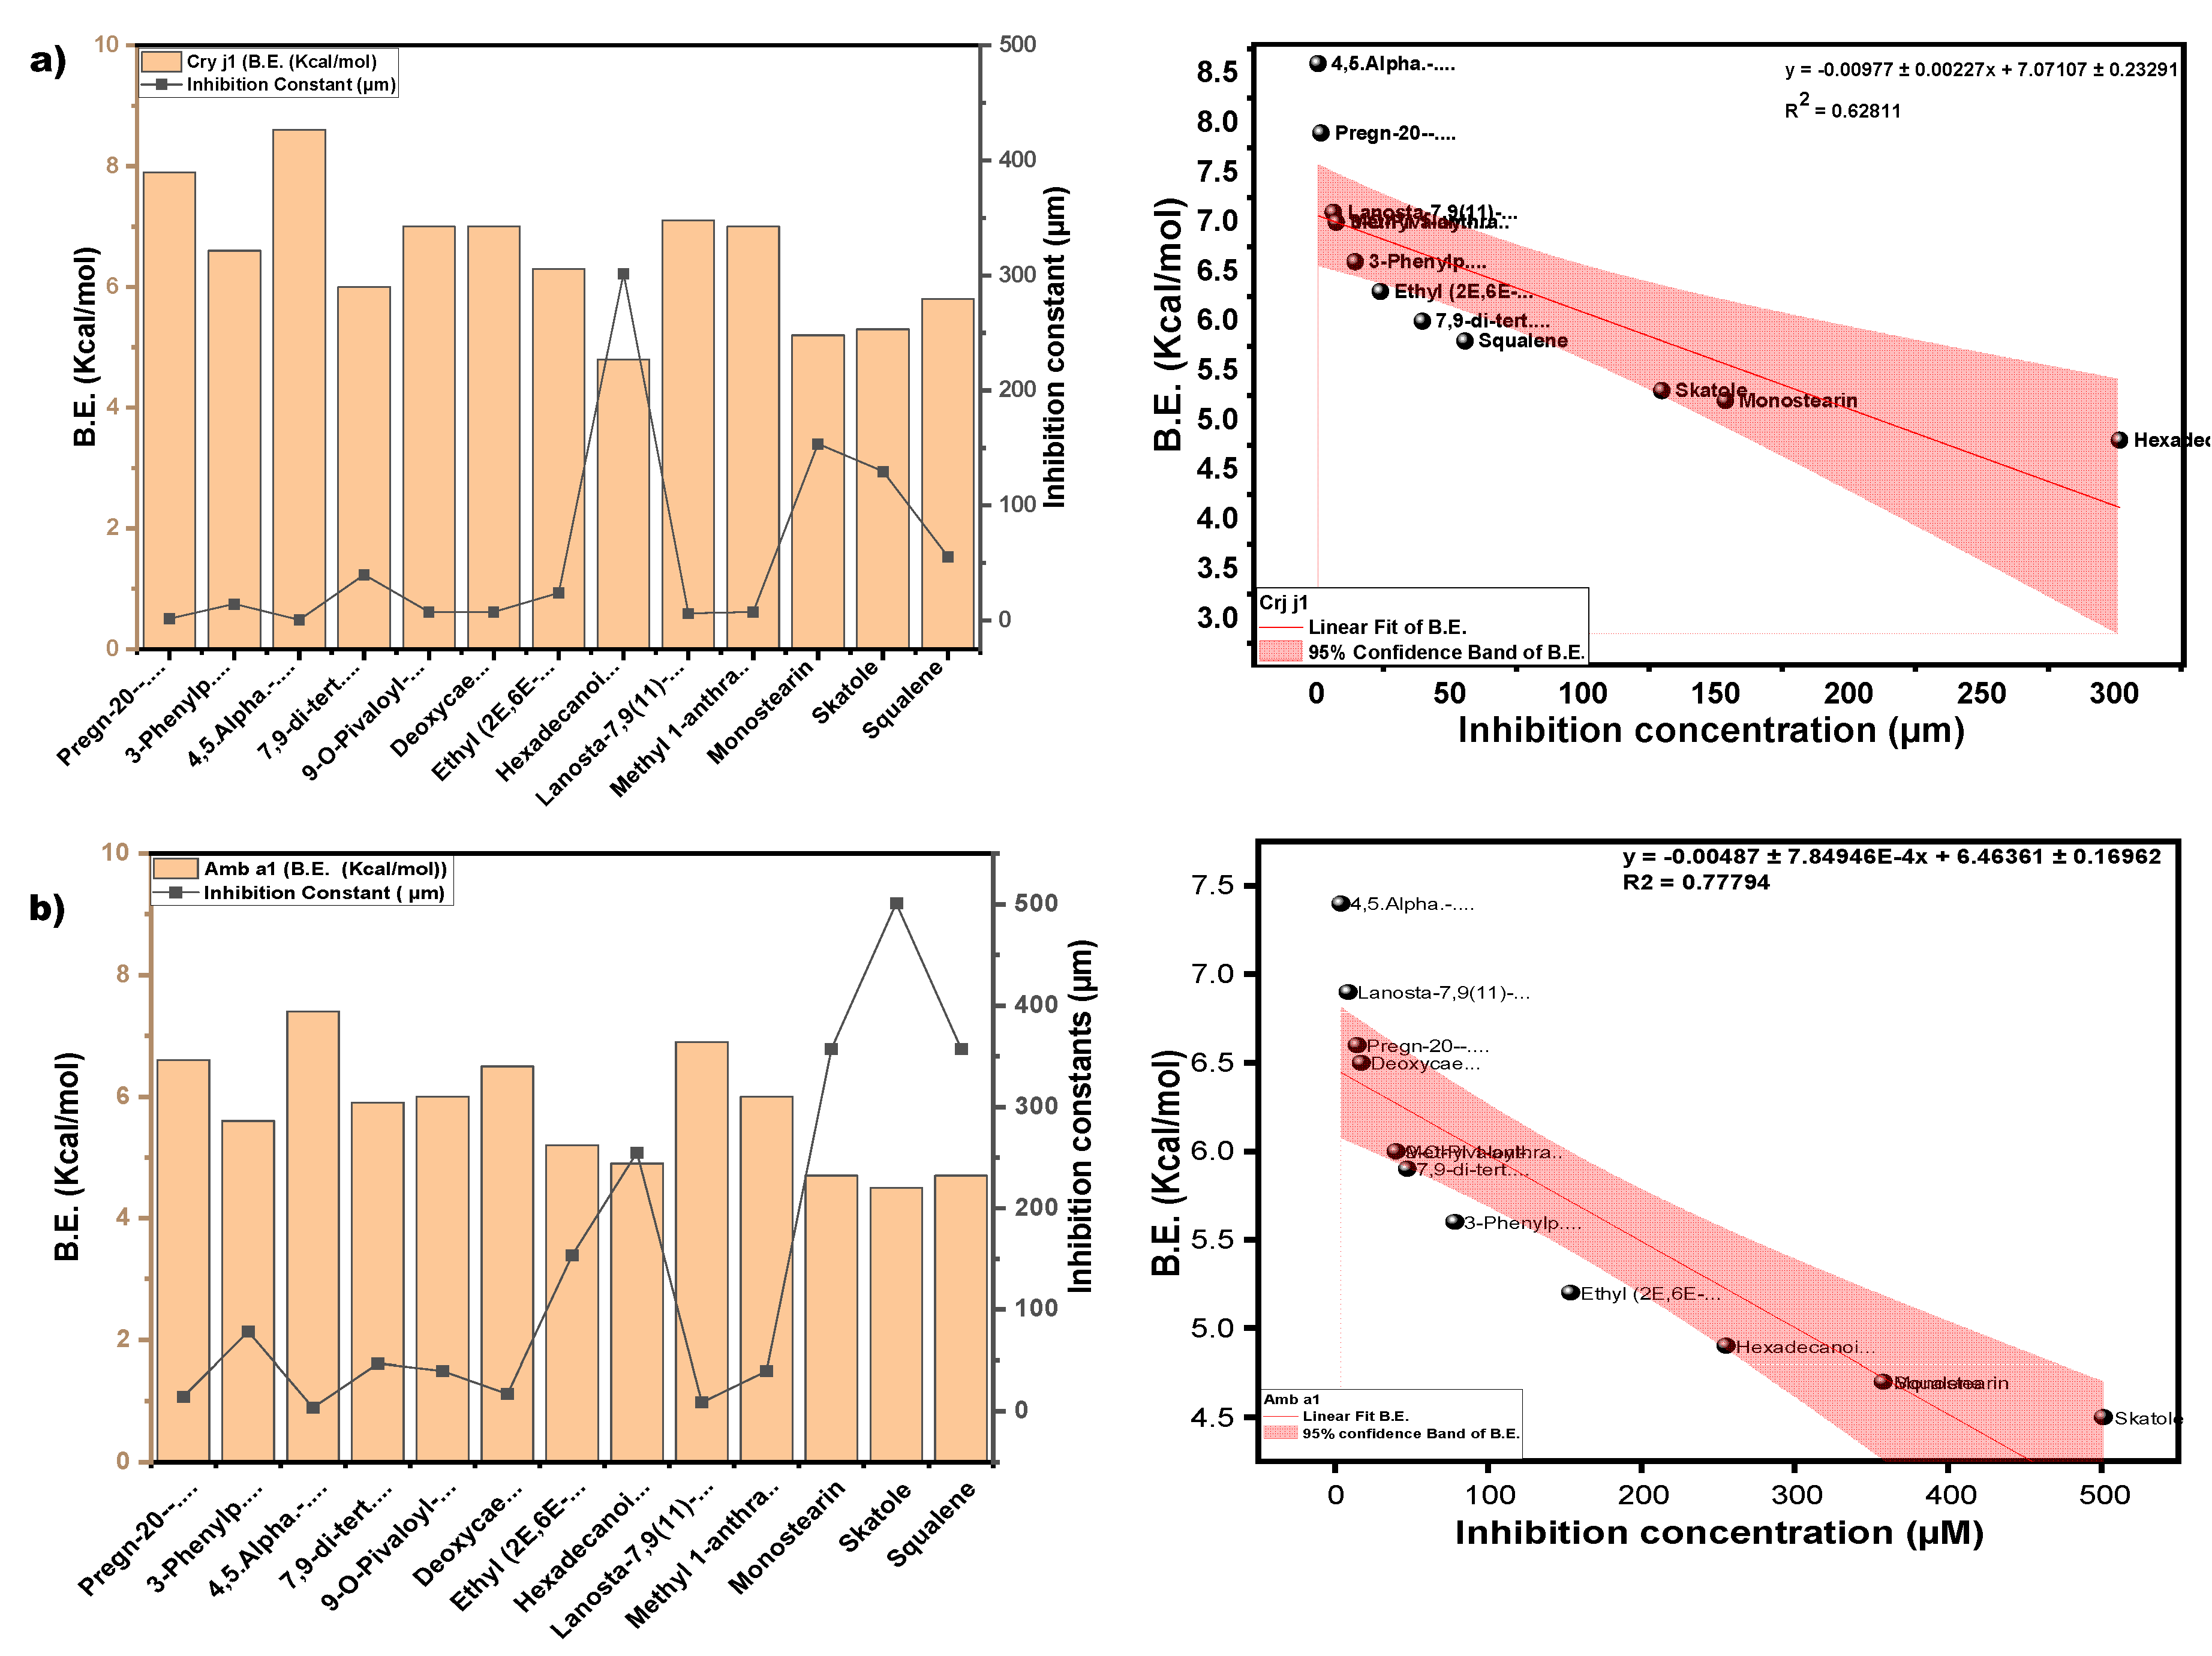
Figure 10.
2d and 3d visualization of the interaction between Methyl-7-Alpha-(4-Phenyl-1,3-Butadienyl)-6-Beta,7-Beta-(Oxymethylene) Morphinan and allergen protein A) Amb a 1 B) Crj j 1.
Figure 10.
2d and 3d visualization of the interaction between Methyl-7-Alpha-(4-Phenyl-1,3-Butadienyl)-6-Beta,7-Beta-(Oxymethylene) Morphinan and allergen protein A) Amb a 1 B) Crj j 1.
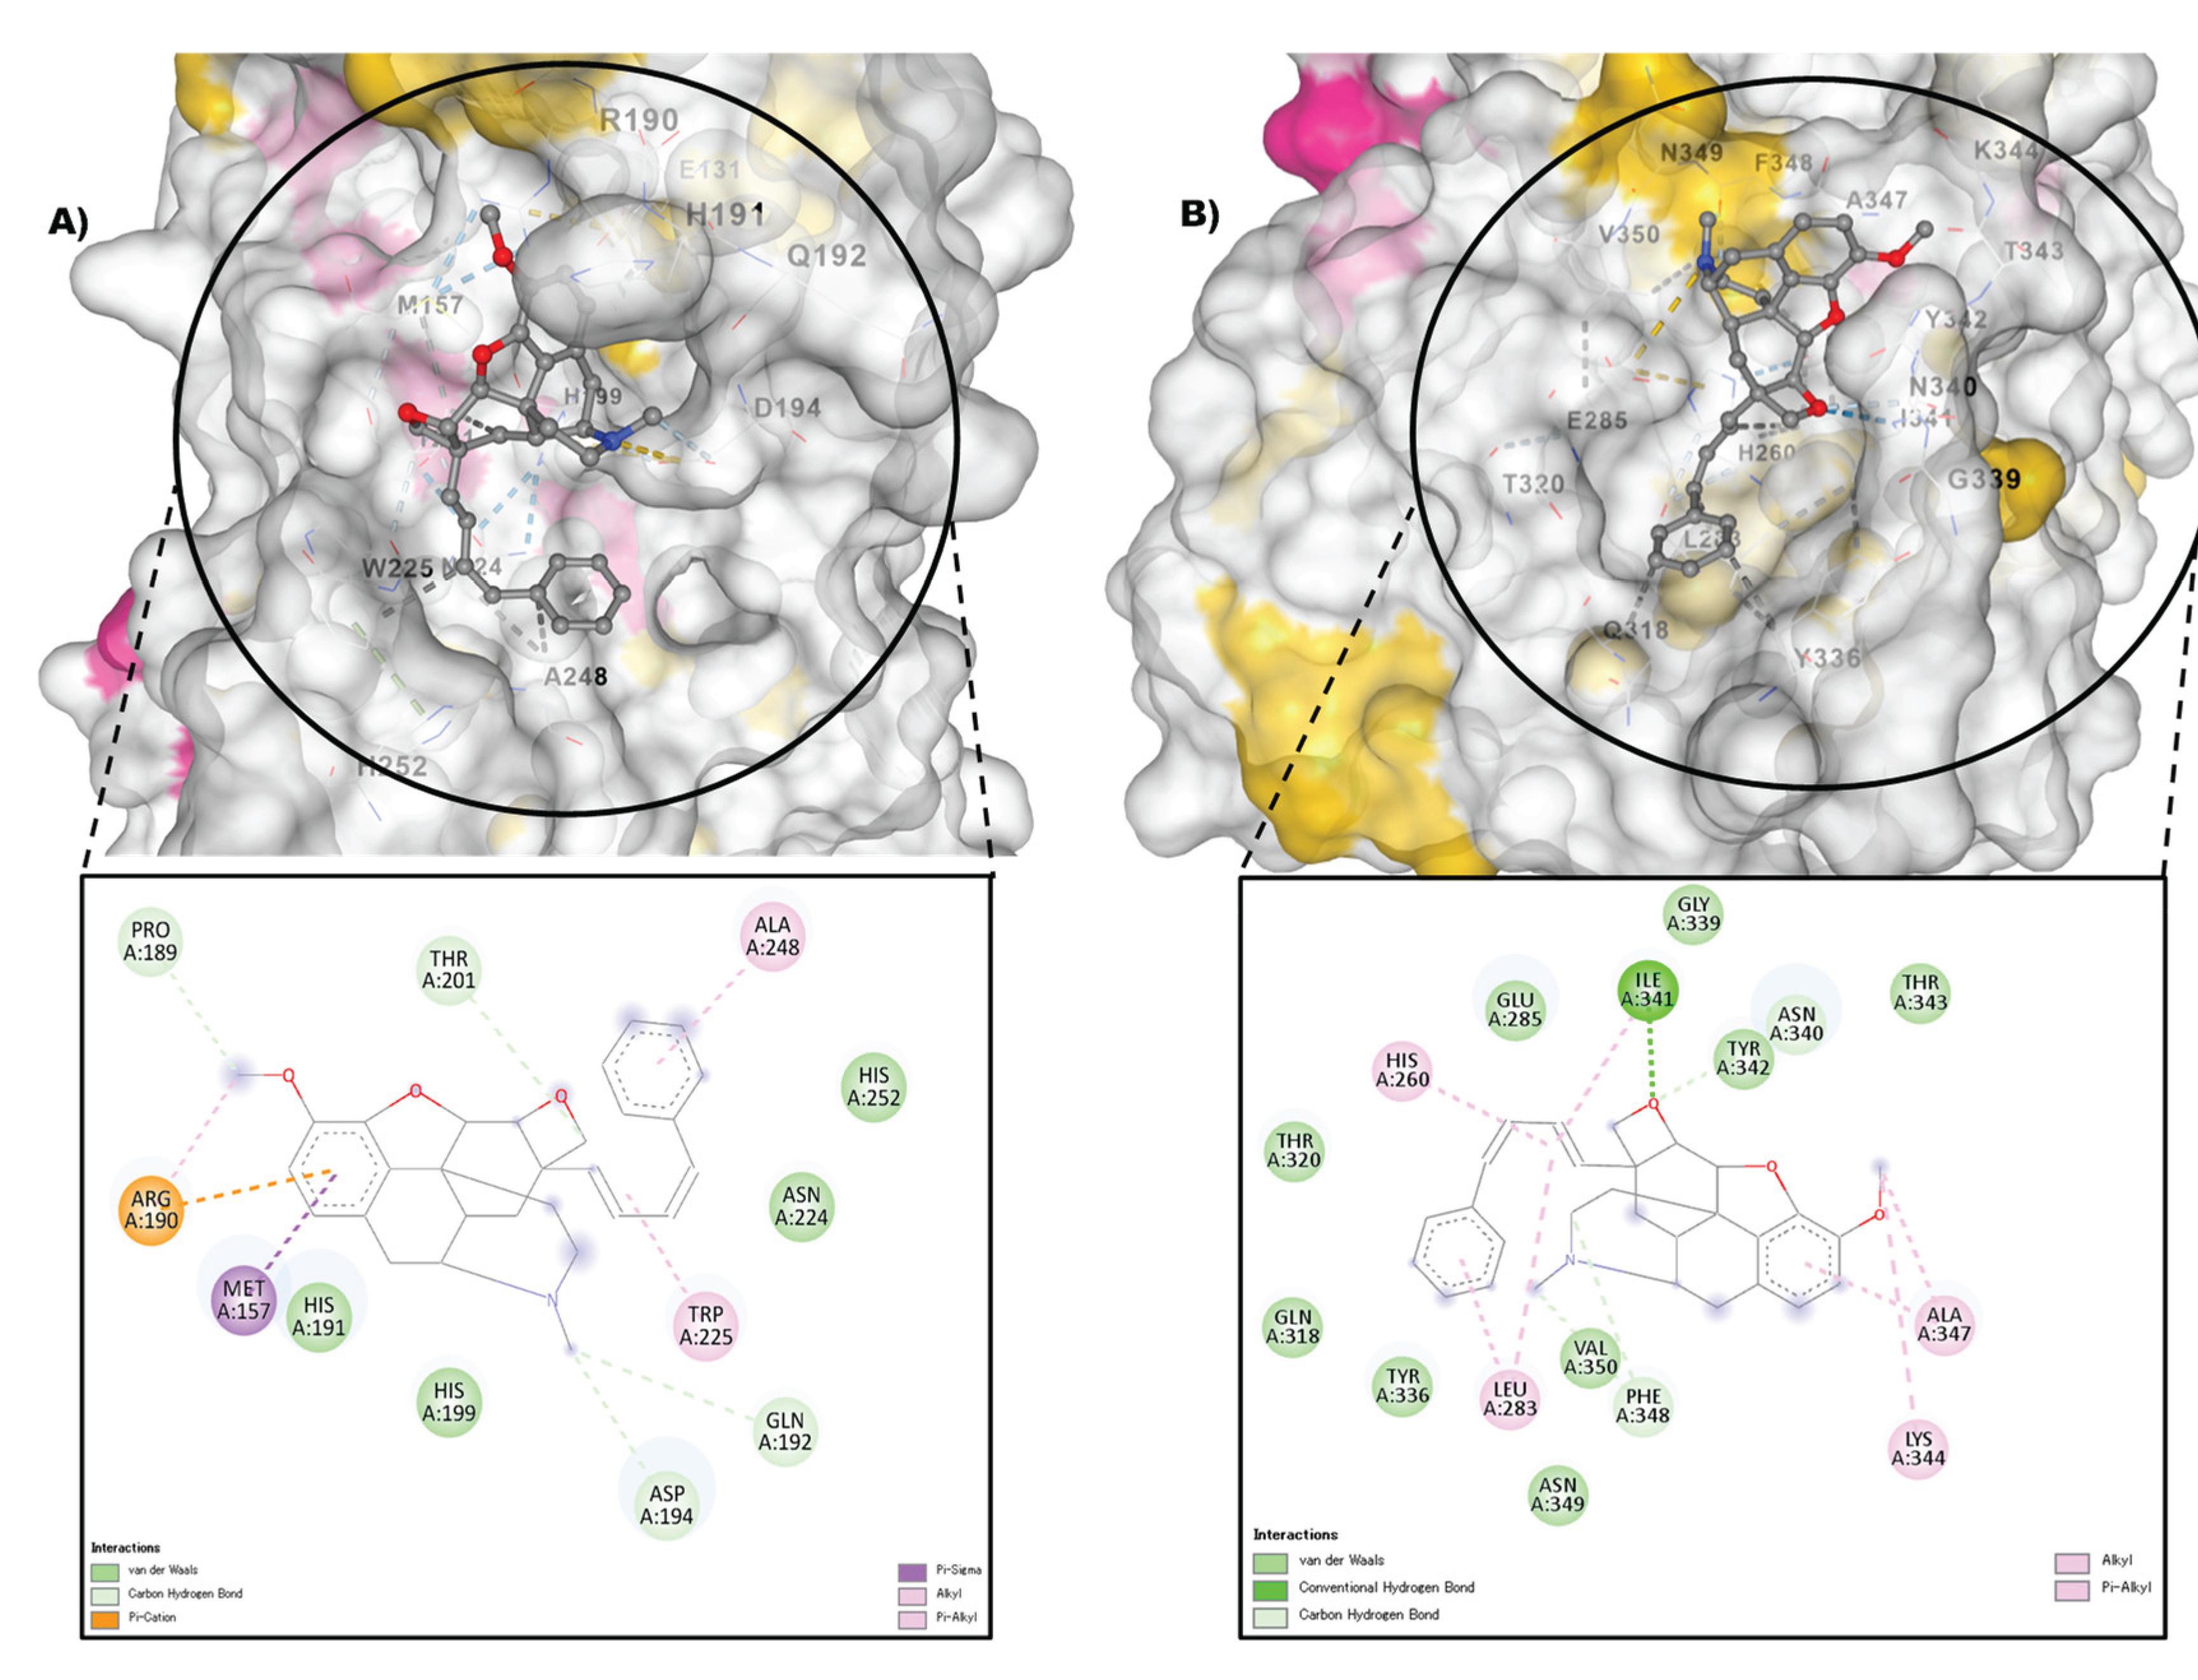
Table 1.
Chemicals used for the synthesis of the NADESs in this study.
| s/n | Chemical | MF | M/gmol-1 | Purity | Phase at RT | Structure |
| 1 | Camphor | C10H16O | 152.23 | >0.98 | Solid |  |
| 2 | Thymol | C10H14O | 150.22 | >0.98 | Solid | 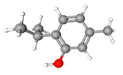 |
| 3 | Eugenol | C10H12O2 | 164.20 | >0.98 | Liquid | 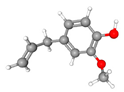 |
| 4 | Menthol | C10H20O | 156.27 | >0.98 | Solid | 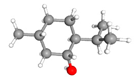 |
Table 2.
Thermal properties (Thermogravimetric analysis) of NADES in this study.
| NaDES | T onset (°C) | Tp (°C) | DTA Peak (°C) |
| Thymol-Camphor | 125.2 | 174.31 | 180 |
| Thymol-Eugenol | 123.4 | 185.12 | 190 |
| Menthol-Eugenol | 110.2 | 155.35 | 160 |
| Camphor-Eugenol | 114.0 | 178 | 180 |
| Thymol-Menthol | 125.5 | 176.88 | 180 |
| Thymol | 132.5 | 181.8 | 180 |
| Camphor | 102.0 | 165.4 | 160 |
| Eugenol | 145.0 | 206.8 | 200 |
| Menthol | 119.3 | 167 | 160 |
Table 3.
Components of the extracts obtained by the extraction of T. dolabrata wood biomass using hydrophobic NADES.
Table 3.
Components of the extracts obtained by the extraction of T. dolabrata wood biomass using hydrophobic NADES.
| Phytochemical Family | Compounds |
| Alkane related compounds | 1-Cyano-1,1-dideuterio hexadecane (II) 2-Methylhexadecane (III) 2-Methylpentadecane (IV) 3,8-Dimethyldecane (V) 3-Methylheneicosane (VI) 3-Methyloctadecane (VII) 5-Methylundecane, (VIII) Cetane (IX) Decane, 3,8-dimethyl- (X) Docosane (XI) Eicosane (XI) Heneicosane (XII) Heptadecane (XIII) Heptadecane, 8-methyl- (XIV) 8-methyl- Heptacosane (XV) Hentriacontane (XVI) Hexadecane (XVII) Hexadecane, 7,9-dimethyl- (XIII) Hexatriacontane (XIX) Nonadecane (XX) Nonacosane (XXI) Norpristane (XXII) Octadecane (XXIII) Octadecane, 2-methyl- (XXIV) Pentacosane (XXV) Pentadecane (XXVI) Phytane (XXVII) Tetracosane (XXVIII) Tetradecane (XXIX) Tricosane (XXX) Triacontane |
| Polycyclic Aromatic Compound derivative | 4-(biphenyl-2′-yl)-7-chloro-1,2-dihydronaphthalene |
| Alkaloids | 4,5α-Epoxy-3-methoxy-17-methyl-7α-(4-phenyl-1,3-butadienyl)-6β,7β-(oxymethylene) morphinan) (II) Skatole |
| Terpenes and Terpenoids | Ethyl (2E,6E,10E)-3,7,11,15-tetramethylhexadeca-2,6,10,14-tetraenoate (II) Deoxycaesaldekarin C (III) Lanosta-7,9(11)-diene-3,18,20-triol (IV) Squalene |
| Fatty Acids and Esters | Hexadecanoic acid, 1-(hydroxymethyl)-1,2-ethanediyl ester (II) Monostearin (III) 7,9-di-tert-butyl-1-oxaspiro[4.5]deca-6,9-diene-2,8-dione |
| Phenolic Compounds | Methyl 1-anthraquinonesulfenate (II) 3-Phenylpropionic acid, 5-methoxy-2-[3,4-dimethoxyphenyl]- |
| Steroids | Pregn-20-en-3-ol, 20-methyl-, (3β,5α)- |
Table 4.
Quantum chemical properties of deep eutectic solvents.
| Components | E gap | I (eV) | A (eV) | µ(eV) | η (eV) | S (eV) | Χ (eV) | Ѡ(eV) |
| Cam-Eug | 3.83 | 8.64 | 4.81 | -6.72 | 1.92 | 0.96 | 6.72 | 11.80 |
| Cam-Thy | 4.26 | 9.20 | 4.94 | -7.07 | 2.13 | 1.07 | 7.07 | 11.72 |
| Men-Eug | 4.14 | 8.99 | 4.84 | -6.91 | 2.07 | 1.04 | 6.91 | 11.53 |
| Thy-Eug | 3.98 | 9.00 | 5.02 | -7.01 | 1.99 | 0.99 | 7.01 | 12.35 |
| Men-Thy | 4.29 | 9.24 | 4.95 | -7.10 | 2.14 | 1.07 | 7.10 | 11.74 |
| Camphor | 5.02 | 9.76 | 4.74 | -7.25 | 2.51 | 1.26 | 7.25 | 10.46 |
| eugenol | 4.13 | 8.93 | 1.68 | -5.30 | 3.62 | 1.81 | 5.30 | 3.89 |
| menthol | 8.85 | 10.54 | 4.80 | -7.67 | 2.87 | 1.43 | 7.67 | 10.25 |
| thymol | 4.27 | 9.21 | 4.94 | -7.07 | 2.13 | 1.07 | 7.07 | 11.72 |
Abbreviations: Energy gap: E gap, Ionization potential: (I), Electron affinity: (A) Chemical potential: (µ), Chemical hardness: (ƞ), Chemical softness: (S), Electronegativity: (Х), Electrophilicity index: (ω).
Table 5.
The QTAIM analysis of (3, -1) (BCPs) in the hydrogen bonds (O–H···O) of the NADES system (HBA: HBD 1:1), topological properties, including (ρe) and (Δ²ρe) at each BCP. (CVB) index is provided for each hydrogen bond.
Table 5.
The QTAIM analysis of (3, -1) (BCPs) in the hydrogen bonds (O–H···O) of the NADES system (HBA: HBD 1:1), topological properties, including (ρe) and (Δ²ρe) at each BCP. (CVB) index is provided for each hydrogen bond.
| NADES | (ρe) (a.u.) | (Δ2ρe) (a.u.) | CVB |
| Camphor_Thymol | 0.023 | 0.078 | 0.031 |
| Eugenol_Camphor | 0.027 | 0.086 | 0.009 |
| Eugenol_Thymol | 0.026 | 0.082 | 0.015 |
| Thymol_Menthol | 0.023 | 0.074 | 0.010 |
| Menthol_Eugenol | 0.039 | 0.117 | -0.051 |
Disclaimer/Publisher’s Note: The statements, opinions and data contained in all publications are solely those of the individual author(s) and contributor(s) and not of MDPI and/or the editor(s). MDPI and/or the editor(s) disclaim responsibility for any injury to people or property resulting from any ideas, methods, instructions or products referred to in the content. |
© 2025 by the authors. Licensee MDPI, Basel, Switzerland. This article is an open access article distributed under the terms and conditions of the Creative Commons Attribution (CC BY) license (http://creativecommons.org/licenses/by/4.0/).
Copyright: This open access article is published under a Creative Commons CC BY 4.0 license, which permit the free download, distribution, and reuse, provided that the author and preprint are cited in any reuse.


