
Submitted:
13 May 2025
Posted:
15 May 2025
You are already at the latest version
Abstract
Background and Purpose: Spontaneous intracerebral hemorrhage (ICH) is a severe stroke subtype characterized by high morbidity and mortality. Early hematoma expansion (HE) predicts poor outcomes, yet non-contrast CT (NCCT) markers that can be readily assessed in clinical practice remain underutilized. We evaluated four NCCT signs - Blend Sign (BS), Black Hole Sign (BHS), Irregular Shape (IRS), and Satellite Sign (SS) - and introduced a composite score (SUM_BBIS) to determine their association with key clinical and radiological outcomes.
Methods: Between January 2017 and December 2023, we retrospectively examined 602 consecutive patients with spontaneous ICH at a single tertiary center; 404 met inclusion criteria, each un-dergoing baseline and follow-up NCCT. We identified BS, BHS, IRS, and SS on the initial scan and computed SUM_BBIS (range 0–4). Hematoma progression was defined as a volume increase >33% or >6 mL. Primary outcomes included the frequency of NCCT signs, hematoma expansion, and in-hospital mortality. Secondary analyses explored sign prevalence by hemorrhage volume, lo-cation, intraventricular extension, and comorbidities.
Results: Of the 404 patients analyzed (mean SUM_BBIS=1.25), IRS was most frequent (59.4%), fol-lowed by SS (34.4%), BHS (30.9%), and BS (15.1%). Higher SUM_BBIS correlated with larger he-matomas, deep or brainstem locations, and comorbidities such as warfarin use, chronic kidney disease, or thrombocytopenia. Hematoma expansion occurred more often in those with at least one sign; BHS had the strongest association (56.2% in expanding vs. 23.8% in non-expanding hemor-rhages, p< 0.001). In-hospital mortality was significantly higher among patients with a greater number of signs: decedents had a mean SUM_BBIS of 1.95 compared to 0.93 for survivors (p< 0.001). Each sign was markedly more prevalent in non-survivors, with BHS again showing the largest difference (66.4% vs. 15.4%). Surgical intervention was more closely related to clinical and vol-umetric factors rather than the presence of NCCT markers.
Conclusions: Four NCCT signs - Blend Sign, Black Hole Sign, Irregular Shape, and Satellite Sign—were significantly linked to increased hematoma expansion and in-hospital mortality. The Black Hole Sign proved to be the most potent single predictor of expansion, while multiple co-existing signs further elevated the risk of poor outcome. Incorporating these NCCT markers into routine acute ICH assessments may allow earlier identification of high-risk patients and more timely therapeutic intervention.
Keywords:
intracerebral hemorrhage
; non-contrast CT
; hematoma expansion
; radiological signs
; ICH
1. Introduction
Spontaneous intracerebral hemorrhage (ICH) remains a serious subtype of stroke, accounting for approximately 10–15% of all strokes worldwide and carrying significant morbidity and mortality [1]. Unlike ischemic stroke, ICH commonly leads to increased intracranial pressure, perihematomal edema, and the potential for hematoma expansion, which in turn contributes to neurological deterioration and high fatality rates. Indeed, early hematoma expansion (HE) - defined in many studies as an increase in hematoma volume by at least 6 mL or 33% - occurs in 20–35% of patients, primarily in the first 24 hours [2]. This phenomenon is one of the most important predictors of in-hospital mortality and poor functional outcome [3].
Several imaging-based risk factors for HE and poor prognosis have been identified. Among them, the “Spot Sign” on CT angiography (CTA) has been extensively studied as a predictor of hematoma expansion [4]. However, performing CTA in all ICH cases is not always feasible due to clinical, logistical, or resource-related constraints. Therefore, attention has increasingly turned to specific signs on non-contrast CT (NCCT) - which is universally performed in acute ICH - to predict progression. Four such NCCT-based signs described in the literature are the Blend Sign, the Black Hole Sign, Irregular Shape, and the Satellite Sign [5].
- Blend Sign (BS) is classically defined by a sharply demarcated region of different attenuation within the hematoma (at least an 18 Hounsfield unit difference), appearing as a “blending” of hypo- and hyperdense portions [6].
- Black Hole Sign (BHS) refers to a discrete, well-defined hypoattenuating region within a hyperdense clot, with at least a 28 Hounsfield unit difference, and no continuity with normal brain parenchyma [7].
- Irregular Shape (IRS)—sometimes referred to as “irregular hematoma margin” - is thought to reflect multiple active bleeding sites, producing a lobulated or spiculated contour to the hemorrhage [8].
- Satellite Sign (SS) indicates small, separate microhemorrhages around the main clot, not exceeding 10 mm in diameter and located within 20 mm of the main hematoma, still intraparenchymal (i.e., not in ventricles or subarachnoid space) [9].
Each of these signs, when present on initial NCCT, has been associated with higher risk of hematoma growth and worse neurological outcome. However, there remain questions about their relative frequency and about how they co-occur in a typical unselected ICH population.
We undertook this single-center cohort study to:
- Determine the frequency of the Blend Sign, Black Hole Sign, Irregular Shape, and Satellite Sign in a consecutive population of ICH patients.
- Evaluate how these signs relate to hematoma characteristics such as location, volume, and intraventricular extension.
- Examine their association with ICH progression (i.e., hematoma expansion) and in-hospital mortality.
- Assess a simple additive score - the sum of the four signs, “SUM_BBIS” (0–4)—to gauge the overall “radiological instability” of the hematoma, and its possible value in prognostication.
2. Materials and Methods
2.1. Study Design and Patient Selection
Between January 2017 and December 2023, we retrospectively screened all patients admitted with spontaneous intracerebral hemorrhage (ICH) to a single tertiary medical center. Initially, 602 consecutive patients were identified. We excluded cases involving hemorrhages secondary to vascular malformations, aneurysms, tumors, or hemorrhagic transformation of ischemic stroke; those lacking adequate baseline non-contrast CT scans; primary intraventricular hemorrhage without a parenchymal component; and patients without a follow-up CT scan within the first 24–48 hours, which precluded assessment of hematoma expansion. As a result, 404 patients fulfilled all criteria: each had a high-quality baseline NCCT in the Picture Archiving and Communication System (PACS) plus follow-up imaging. Relevant clinical data were extracted from electronic health records, covering demographics (age, sex), hypertension, diabetes, chronic kidney disease, chronic alcohol intake, and antithrombotic use (vitamin K antagonists, direct oral anticoagulants [DOACs], or antiplatelet agents).
2.2. Imaging Protocol and Definitions of Radiological Signs
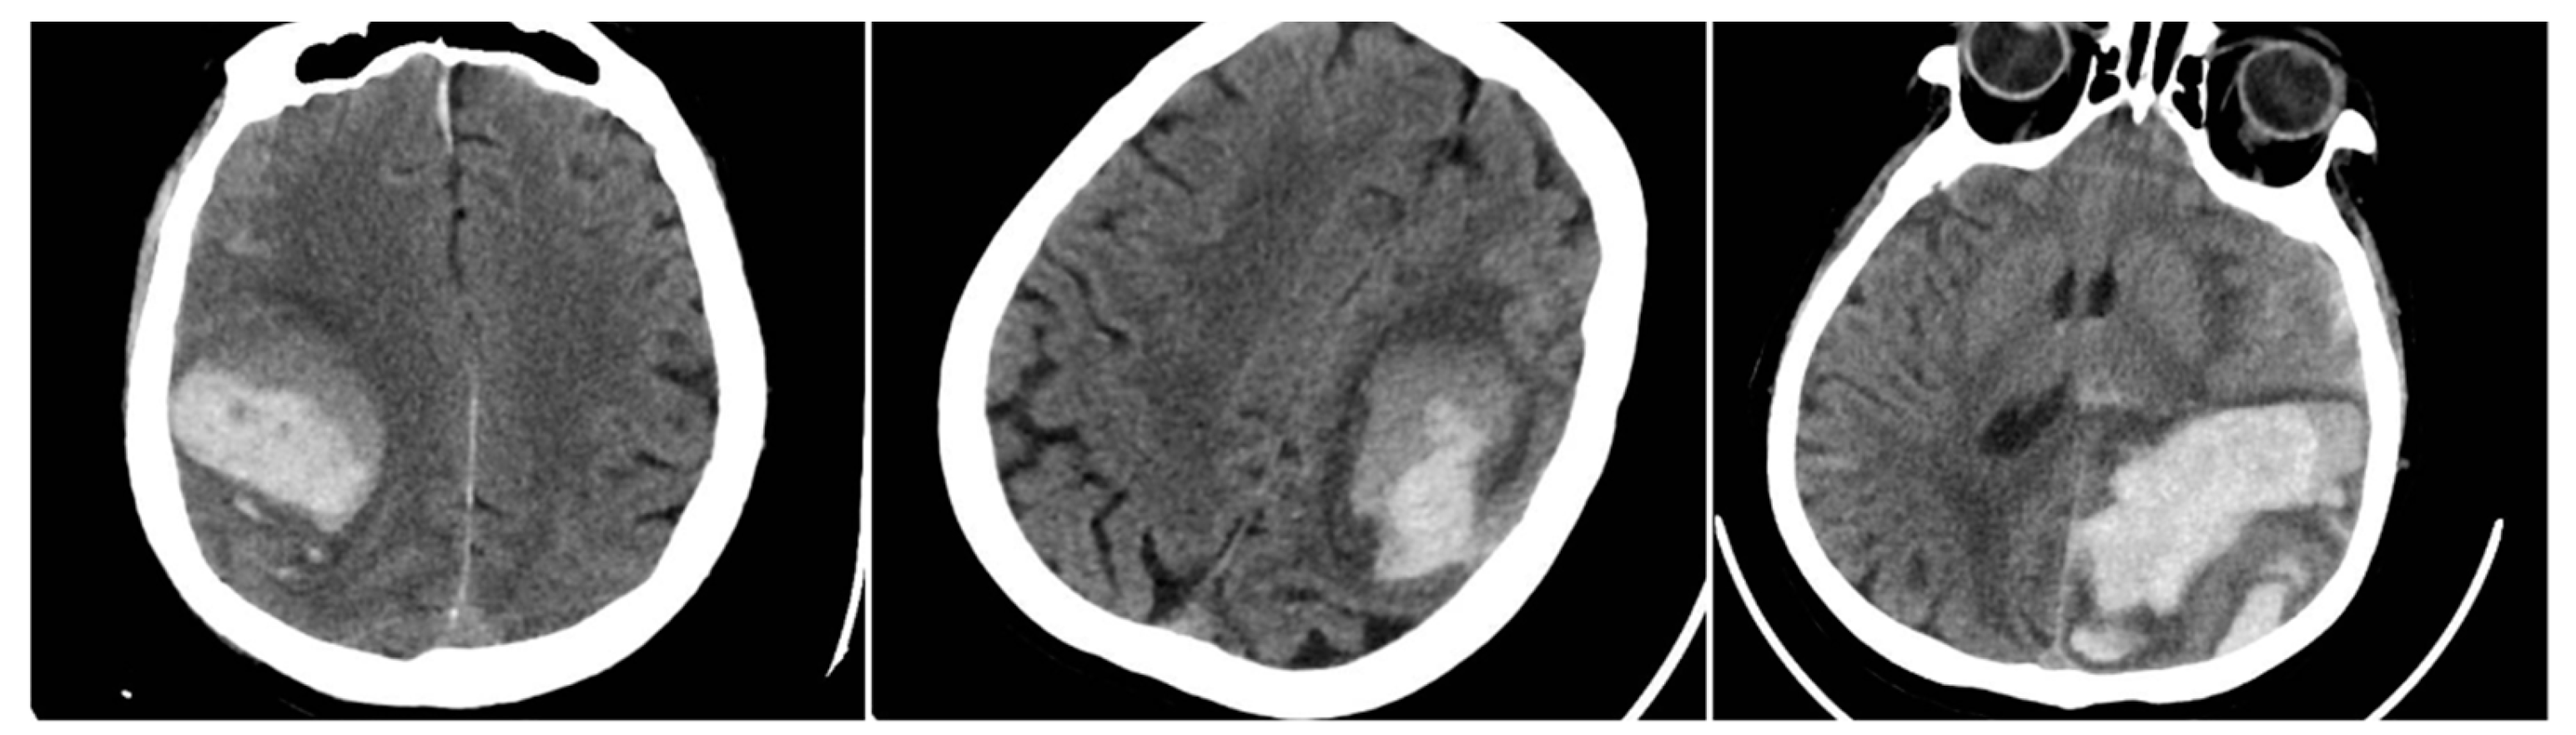
All eligible patients underwent a baseline NCCT scan upon presentation, followed by a second NCCT within 24 hours or sooner if clinical deterioration occurred, to detect hematoma expansion. Four key radiological signs were evaluated on the initial NCCT. The Blend Sign (BS) was recorded when a well-defined hypoattenuating region directly abutted a hyperattenuating area within the same hematoma, differing by ≥18 HU, without the hypodense portion being fully encapsulated by the hyperdense region (BS=1 if present, otherwise 0).
Figure 1.
Blend Sign (BS) – three examples from our cohort.
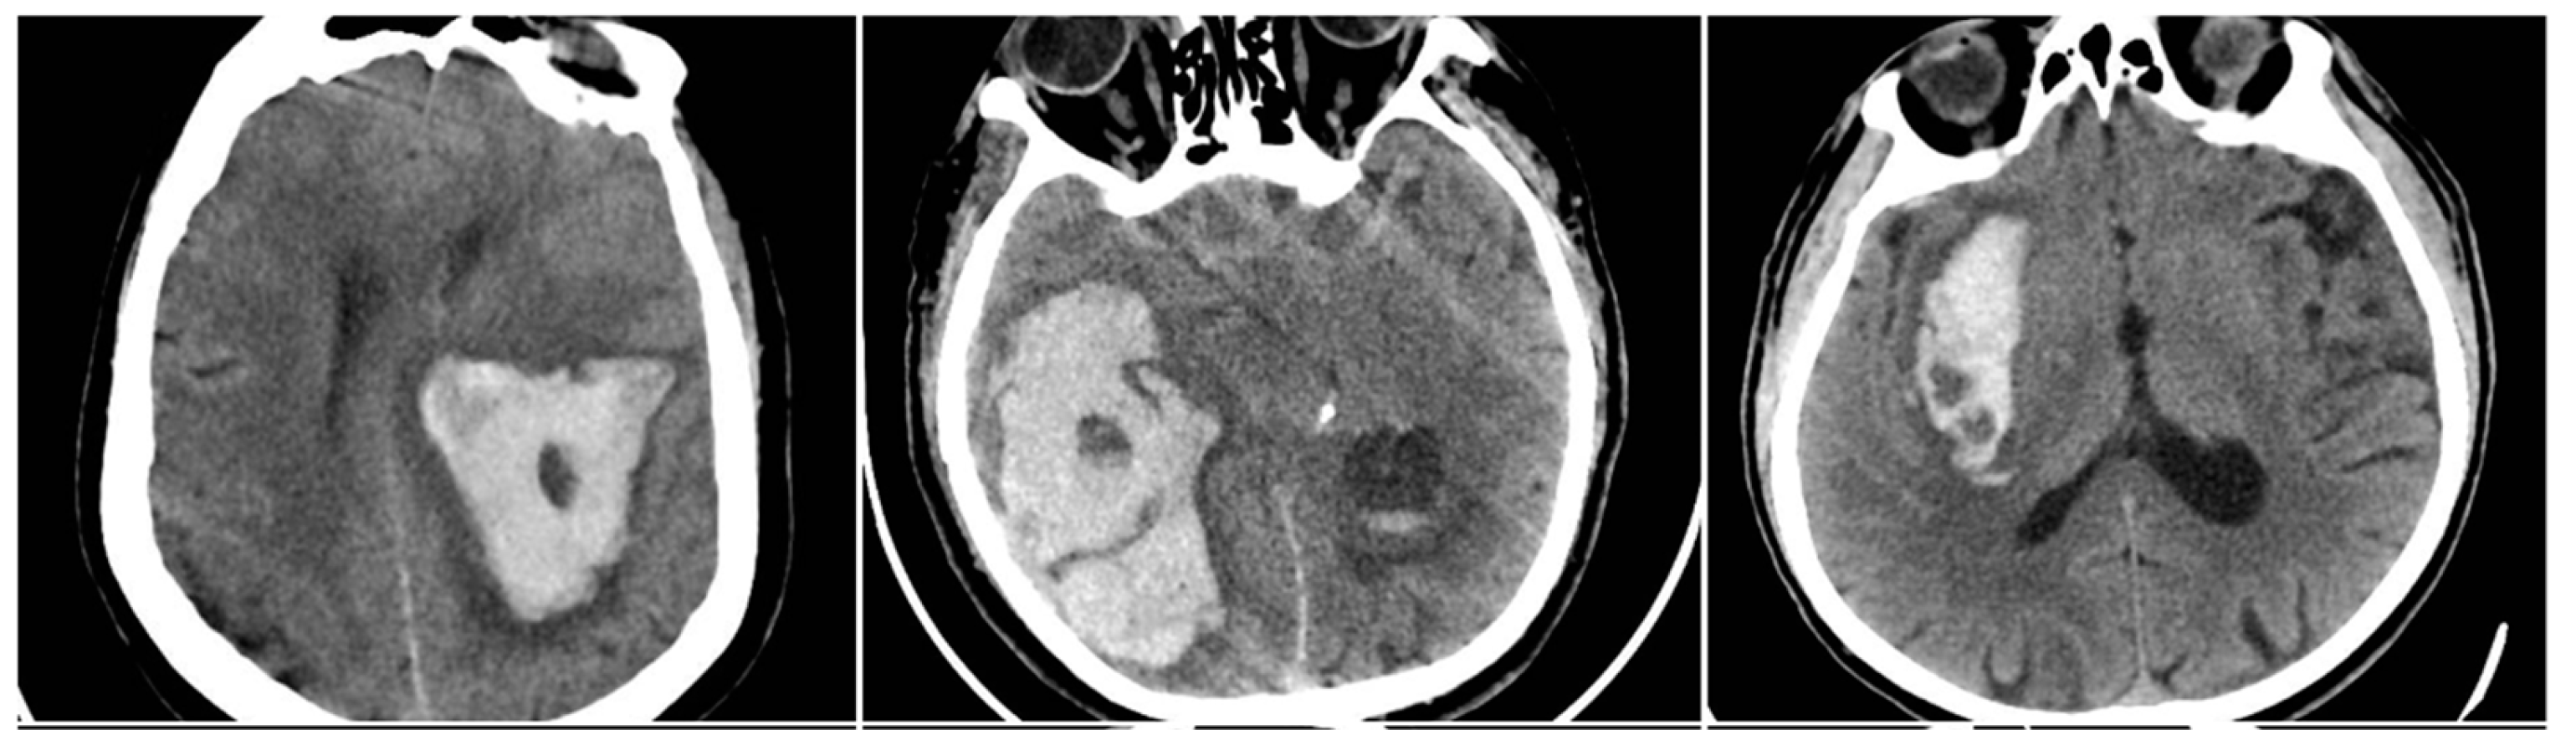
The Black Hole Sign (BHS) referred to a distinct hypodense area (≥28 HU difference) fully enclosed within a hyperdense clot (BHS=1 if present).
Figure 2.
Black Hole Sign (BHS) – three examples from our cohort.
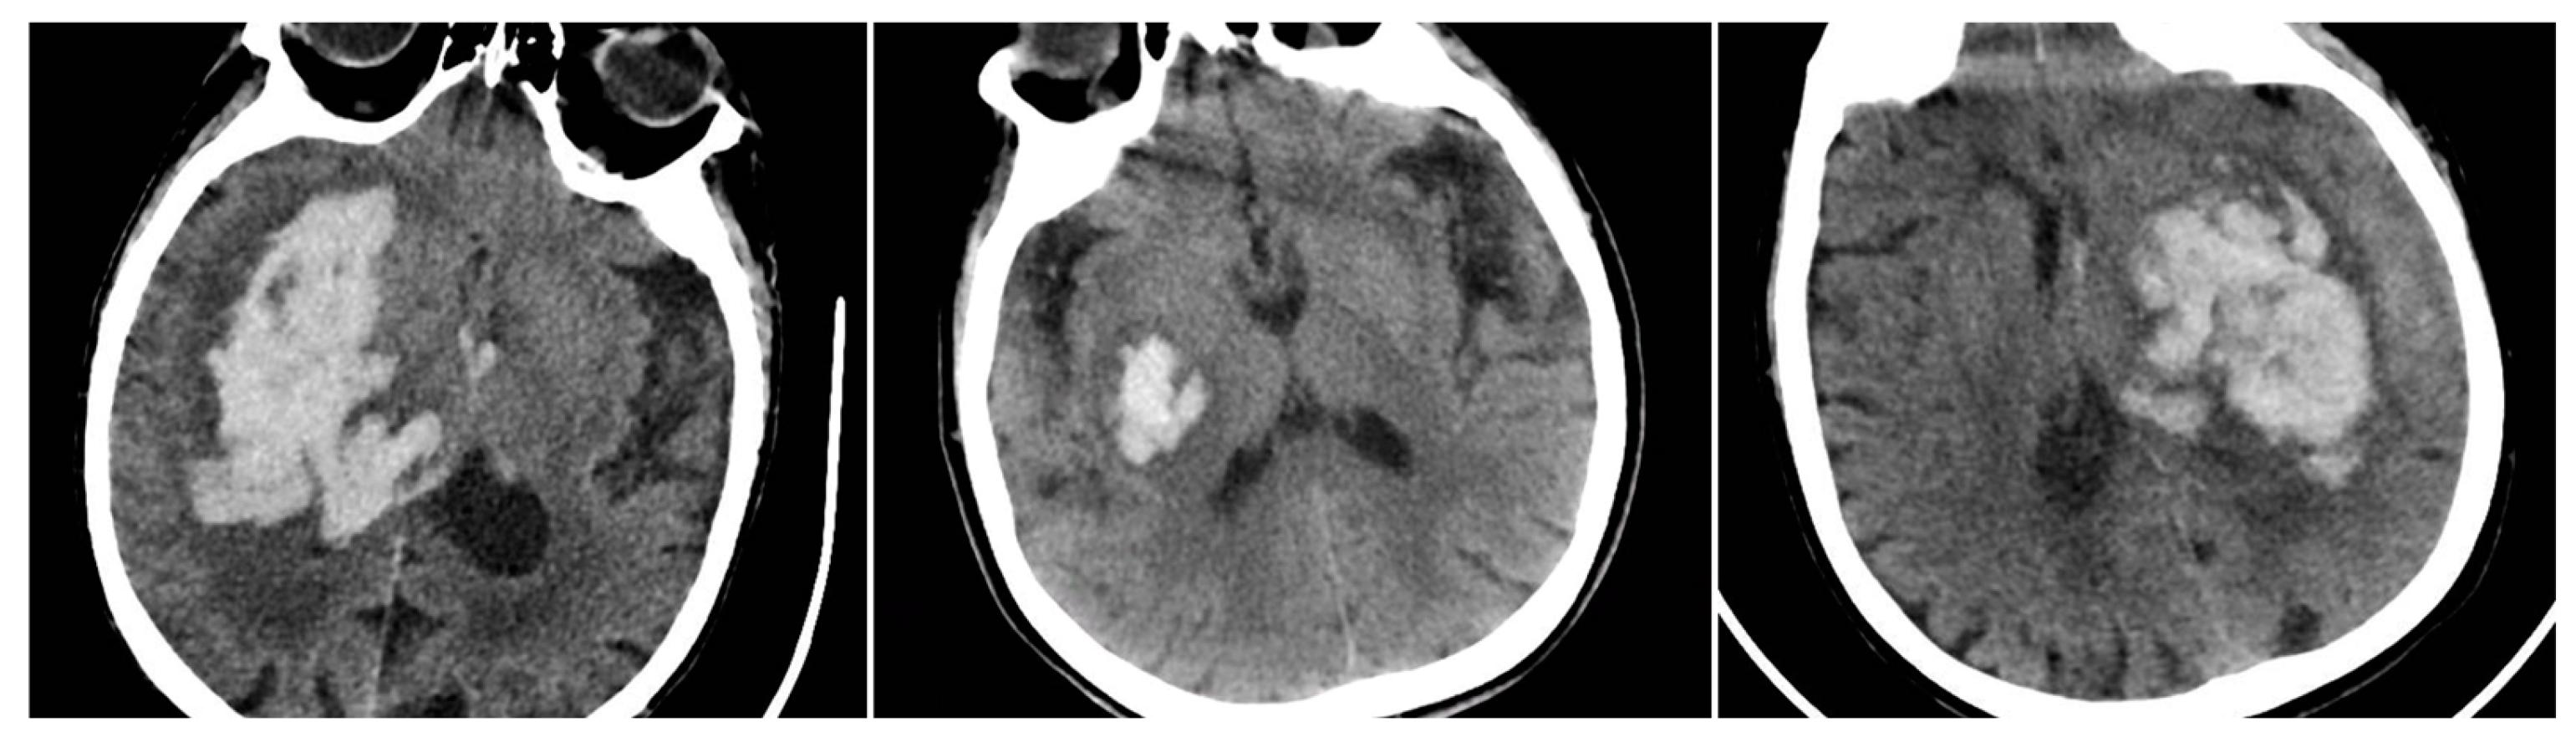
Irregular Shape (IRS) indicated a clearly lobulated or spiculated hematoma margin (IRS=1 if irregular, otherwise 0).
Figure 3.
Irregular Shape sign – three examples from our cohort.
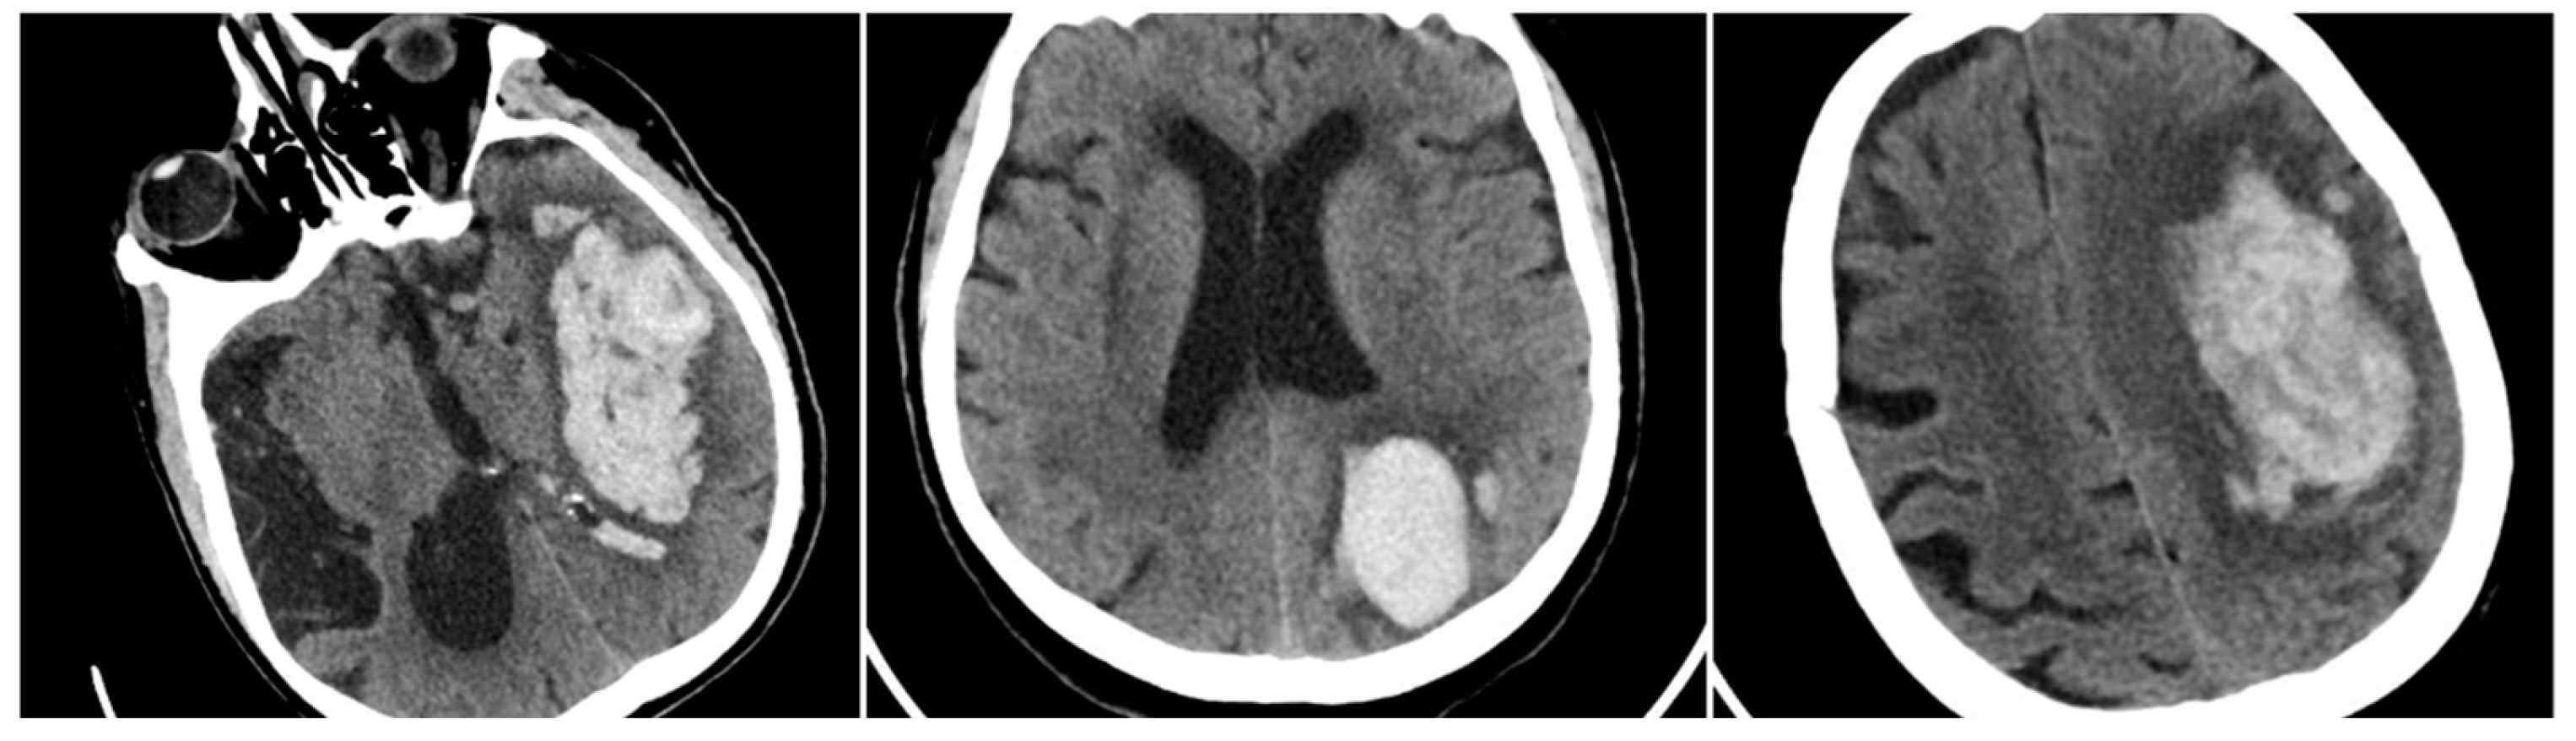
The Satellite Sign (SS) was identified when a small (≤10 mm) hyperdense hemorrhagic focus lay within 20 mm of, but separate from, the main clot on at least one CT slice (SS=1 if present). An aggregate score, SUM_BBIS (range 0–4), was computed by summing the presence of BS, BHS, IRS, and SS for each patient.
Figure 4.
Satellite Sign (SS) – three examples from out cohort.
2.3. Hematoma Volume, Location, and Progression
All 404 patients underwent a repeat NCCT to assess changes in hematoma size. Hematoma progression was defined as an increase in volume >33% or >6 mL from baseline (labeled “YES” if present, “NO” otherwise). Volumetric calculations used the ABC/2 method or slice-by-slice volumetry if needed [10,11]. Hemorrhage location was categorized by the deepest involved structure (capsulo-lenticular, thalamic, lobar, cerebellar, or brainstem), and intraventricular extension (IVH) was noted if blood was seen in the ventricles on initial or follow-up CT. We also documented whether patients underwent surgical management (hematoma evacuation or decompression) or conservative treatment [12].
2.4. Outcome Measures
Primary outcomes included the overall frequency of each sign, the distribution of SUM_BBIS scores, and the association of these signs with hematoma progression. We also examined in-hospital mortality and explored differences in sign prevalence between key clinical subgroups, such as surgical vs. conservative management and anticoagulant vs. non-anticoagulant therapy.
2.5. Statistical Analysis
All statistical tests were performed in SPSS (version 26.0; IBM Corp., Armonk, NY) [13]. Descriptive measures (mean ± standard deviation or median [interquartile range]) were calculated for continuous variables, and proportions for categorical variables. Between-group comparisons for categorical data (e.g., presence/absence of a sign) employed chi-square tests. For continuous variables (e.g., SUM_BBIS, hematoma volume), we applied t-tests or one-way ANOVA, using nonparametric alternatives if distributions were non-normal. A two-sided p<0.05 was deemed statistically significant. Where possible, relative risks (RR) or odds ratios (OR) were estimated to quantify associations between specific signs and outcomes (hematoma progression or mortality). As this was a retrospective study, all numeric findings directly reflect the dataset provided.
3. Results
A total of 404 patients with spontaneous intracerebral hemorrhage (ICH) formed the study cohort, each having undergone a baseline non-contrast CT (NCCT) at hospital presentation and a follow-up CT within 24-48 hours. Four radiological signs - Blend Sign (BS), Black Hole Sign (BHS), Irregular Shape (IRS), and Satellite Sign (SS) - were systematically reviewed on the initial NCCT, and an additive score (SUM_BBIS, range 0–4) reflected how many signs were present. Across the entire cohort, the mean SUM_BBIS was 1.25.
Examination of individual signs showed that IRS was the most common feature, present in 240 of 404 patients (59.4%). SS was observed in 139 (34.4%), BHS in 125 (30.9%), and BS in 61 (15.1%). Table 1 summarizes the average SUM_BBIS in key subgroups based on hemorrhage volume, anatomical location, and whether intraventricular extension (IVH) occurred. Hematoma volume was strongly associated with the number of radiological signs. Patients with large hematomas (>30 mL) showed a significantly higher mean SUM_BBIS of 2.13, compared with 1.35 for medium (15–30 mL) and 0.91 for small (<15 mL) bleeds. A one-way ANOVA demonstrated that these group differences by volume were highly significant (p<0.001). Similarly, the presence of IVH correlated with more complex bleeding patterns, as reflected by an elevated mean SUM_BBIS of 1.76. Location-specific analysis revealed that brainstem hemorrhages had the highest average SUM_BBIS (2.33), whereas cerebellar hemorrhages had the lowest (0.76). Black Hole Sign frequency varied significantly among locations (chi-square p<0.001), ranging from 66.7% in brainstem bleeds (28 of 42) to only 14.6% in cerebellar bleeds (6 of 41).
Below is an illustrative breakdown of hematoma expansion according to the presence of each NCCT sign on baseline imaging. In this dataset, 89 out of 404 patients (22.0%) demonstrated significant enlargement (“YES”) on follow-up CT, whereas 315 (78.0%) did not progress (“NO”). Table 2 shows that all four radiological signs were substantially more frequent among those with hematoma expansion. Notably, the Black Hole Sign (BHS) has the most pronounced association with expansion, affecting 56.2% of patients in the “YES” group versus 23.8% among “NO” cases (p<0.001 by chi-square). This observation reinforces the concept that a distinct hypodensity within the main clot may reflect ongoing or repeated hemorrhage, placing the patient at higher risk of volume growth.
Despite these robust associations, several limitations warrant consideration. Early surgical evacuation in some patients may have led to underestimation of expansion, while late presentation could mean that signs such as the Blend Sign reflected a post-expansion state rather than a purely predictive marker. Additionally, “slightly irregular” shapes can be subjective. Overall, however, the Black Hole Sign appears most strongly correlated with hematoma enlargement, underscoring its potential as an indicator of ongoing bleeding risk (Figure 5).
In-hospital mortality analysis demonstrated an even clearer relationship with radiological findings (Figure 6). Patients who died had a mean SUM_BBIS of 1.95, whereas survivors had 0.93 (independent samples t-test p<0.001). At the individual sign level, all four markers appeared markedly more often in non-survivors: BS in 24.8% vs. 11.1% of survivors (p<0.001), BHS in 66.4% vs. 15.4% (p<0.001), IRS in 87.2% vs. 50.8% (p<0.001), and SS in 52.0% vs. 27.2% (p<0.001). Table 3 illustrates these proportions. In pairwise comparisons, the Black Hole Sign had the largest absolute gap between fatal and nonfatal cases (50.9 percentage points), suggesting that a large fraction of fatal ICH cases exhibit pronounced intra-hematoma hypodensity indicative of ongoing or repeated bleeding episodes.
Despite these strong associations between radiological complexity and mortality, there was no statistically significant difference in the average SUM_BBIS when comparing patients treated surgically (mean 1.06) with those managed conservatively (mean 1.35, p>0.05). Frequencies of each sign similarly did not differ substantially between the two treatment groups (p>0.05 by chi-square). Blend Sign, for example, was noted in 17.0% of surgical vs. 14.8% of conservative patients, and BHS in 34.0% vs. 30.3%, respectively. These results suggest that actual surgical decisions at this center were driven primarily by clinical and volumetric factors rather than explicit consideration of NCCT signs.
Subgroup analysis based on comorbidities and medication use revealed additional insights (Table 4). Notably, patients with chronic kidney disease and those with thrombocytopenia had the highest mean SUM_BBIS (1.60 and 1.68, respectively), each significantly exceeding the overall mean of 1.25 (p<0.05). Chronic alcohol consumption was also associated with a higher average (1.50). Conversely, statin therapy correlated with a lower SUM_BBIS of 0.92. Within the anticoagulated subset, there was a trend toward more heterogeneous bleeding in warfarin (vitamin K antagonist) users (BS=9.0%, BHS=59.1%, IRS=59.0%, SS=28.5%, mean SUM_BBIS=1.48) compared to DOAC users (BS=13.8%, BHS=37.9%, IRS=55.2%, SS=35.7%, mean SUM_BBIS=1.32), though the difference in total score did not reach significance in this sample (p>0.05). Nevertheless, the Black Hole Sign was conspicuously frequent (59.1%) among warfarin-related hemorrhages, aligning with the possibility that deeper or more unstable bleeds occur under poorly controlled anticoagulation (Figure 7).
Taken together, these findings underscore that ICHs displaying multiple NCCT signs tend to be larger, more often affecting deeper structures, and prone to intraventricular extension. They are also associated with a heightened risk of hematoma expansion and in-hospital mortality. Patients with significant coagulopathy (e.g., warfarin use or thrombocytopenia) or systemic comorbidities (e.g., chronic kidney disease, chronic alcohol abuse) were similarly prone to exhibit these radiological markers of bleeding heterogeneity. The strong, statistically significant links between NCCT-based signs and clinical outcomes highlight the potential role of a systematic sign-based evaluation in stratifying risk and guiding early aggressive management.
4. Discussion
In this single-center analysis of 404 patients with spontaneous intracerebral hemorrhage (ICH) and adequate imaging data, we systematically evaluated four non-contrast CT (NCCT) signs—Blend Sign, Black Hole Sign, Irregular Shape, and Satellite Sign—and introduced a composite score (SUM_BBIS) to capture the total number of positive signs. Our results showed that Irregular Shape was the most frequent sign (observed in 59.4% of patients), followed by Black Hole Sign (30.9%), Satellite Sign (34.4%), and Blend Sign (15.1%). Although the latter three signs were relatively less common, each still appeared in a substantial portion of cases [14].
A key observation was that a higher SUM_BBIS correlated closely with larger hemorrhages, infratentorial (especially brainstem) location, intraventricular extension, and certain comorbidities, including warfarin-associated coagulopathy, chronic kidney disease, or thrombocytopenia. Notably, the presence of these signs—particularly when multiple signs coexisted—strongly predicted in-hospital mortality [15]. Patients who died in the hospital had an average SUM_BBIS of 1.95, while survivors had an average score of 0.93. Each of the four signs occurred more frequently among non-survivors, suggesting a clear link between radiological markers of hematoma instability and outcome.
Despite the relevance of these NCCT markers to prognosis, their prevalence did not differ substantially between surgically managed and conservatively treated patients. This likely reflects our center’s surgical decision-making process, which prioritizes clinical status, hematoma size, and location over routine use of NCCT signs in triage. Nevertheless, these findings align with multiple previous studies indicating that heterogeneous density (i.e., Blend Sign, Black Hole Sign) and morphological irregularity (i.e., Satellite Sign, Irregular Shape) often signify active or ongoing hemorrhage, carrying a higher risk of hematoma expansion. Although we did not calculate new numeric data on expansion rates, the study dataset indicates that “Hematoma progression” occurred more often when at least one sign was present [16]. Moreover, the strong association between higher SUM_BBIS and in-hospital death underscores the cumulative prognostic significance of having multiple concurrent indicators of hematoma instability.
From a clinical standpoint, early identification of these NCCT signs can facilitate prompt risk stratification for patients with acute ICH, especially in settings where CTA may not be immediately available. Recognizing these signs during the initial imaging can alert clinicians to a heightened danger of clinical deterioration. For high-risk patients—those with multiple positive signs—it is prudent to consider closer monitoring, aggressive blood pressure control, and early use of hemostatic therapies such as prothrombin complex concentrates in warfarin-related hemorrhages or antifibrinolytics in specific contexts.
The SUM_BBIS proposed in this study (ranging from 0 to 4) is a simple composite index designed to indicate “radiological complexity.” Although external validation is needed before widespread adoption, it fits with the broader understanding that concurrent signs likely reflect multifocal or ongoing bleeding sources [17]. Incorporating this score into future prognostic models or clinical trials might enhance our ability to identify those patients who would benefit most from targeted interventions.
Our findings are broadly consistent with earlier investigations into NCCT markers of hematoma expansion and poor outcomes. For instance, the Blend Sign has been independently associated with hematoma expansion, with reported odds ratios of about 3–5 in other studies. Its frequency in our cohort (15.1%) falls within the generally reported range of 10–20%. The Black Hole Sign, described as both specific for expansion and indicative of unfavorable prognosis, was present in roughly 31% of our patients, aligning with reports that link heterogeneous bleeding to coagulopathy and deep hemorrhages.
Irregular Shape emerged as the most common sign in our cohort (59.4%), potentially reflecting the high prevalence of hypertensive bleeds with multiple bleeding points. The Satellite Sign, defined as a smaller clot separate from the main hematoma, appeared in 34.4% of cases. This figure is somewhat higher than the 15–25% previously reported but may be attributable to differences in imaging protocols or patient populations across studies [18].
Several constraints should be noted. Although the data were collected prospectively in routine clinical practice, our final analysis is retrospective, which limits our ability to draw causal inferences. Additionally, this is a single-center experience, so patient characteristics and imaging protocols may differ elsewhere, potentially affecting the generalizability of our findings. We focused on in-hospital mortality rather than long-term functional outcomes such as the modified Rankin Scale at three months, primarily because complete follow-up data were not available. Nonetheless, in-hospital mortality remains a critical endpoint in acute ICH.
Furthermore, we did not present a multivariable logistic regression model, as we confined ourselves to reporting the data from our dataset without recalculating odds ratios. Finally, some overlap among the signs is inevitable—an Irregular Shape can coincide with the Satellite Sign, for example—raising the possibility of subjective interpretation. Nevertheless, careful and consistent definitions were employed to minimize this concern.
5. Conclusions
In this single-center study of 404 patients with spontaneous intracerebral hemorrhage, four non-contrast CT signs (Blend Sign, Black Hole Sign, Irregular Shape, and Satellite Sign) were consistently associated with hematoma expansion and in-hospital mortality. While all signs correlated with worse outcomes, the Black Hole Sign emerged as the most potent individual predictor of hematoma enlargement. Larger bleeds, deeper location, and intraventricular extension were particularly likely to show multiple radiological signs, reflecting greater hemorrhage complexity. Our findings support routine, systematic assessment of these NCCT markers in acute ICH to identify high-risk patients who may benefit from more aggressive monitoring and earlier intervention.
Author Contributions
Conceptualization, C.C., R.M., V.S., P.Ca.; methodology, C.C., R.M., V.S., P.Ca.; software, C.C., S.T.; validation, C.C., S.T., V.S.; formal analysis, C.C., S.T.; investigation, C.C., P.Co.; resources, C.C.; data curation, C.C., T.K.; writing—original draft preparation, C.C.; writing—review and editing, C.C., S.T., R.M., P.Ca.; visualization, C.C., V.T.; supervision, R.M., C.R.-F.; project administration, C.C.; funding acquisition, C.C. All authors have read and agreed to the published version of the manuscript.
Funding
This research received no external funding.
Institutional Review Board Statement
The study was conducted in accordance with the Declaration of Helsinki, and approved by the Sibiu Emergency Hospital Ethics Committee (Approval Code: 91/2025),
Informed Consent Statement
Informed consent was obtained from all subjects involved in the study.
Acknowledgments
The authors have reviewed and edited the output and take full responsibility for the content of this publication.
Database publicly available: DOI: 10.5281/zenodo.15368709
Conflicts of Interest
The authors declare no conflicts of interest.
Abbreviations
The following abbreviations are used in this manuscript:
| ICH | Intracerebral Hemorrhage |
| NCCT | Non-Contrast Computed Tomography |
| BS | Blend Sign |
| BHS | Black Hole Sign |
| IRS | Irregular Shape |
| SS | Satellite Sign |
| SUM_BBIS | Sum of Blend Sign, Black Hole Sign, Irregular Shape, and Satellite Sign (range 0–4) |
| IVH | Intraventricular Hemorrhage |
| DOAC | Direct Oral Anticoagulant |
| VKA | Vitamin K Antagonist |
| ANOVA | Analysis of Variance |
| CT | Computed Tomography |
| CTA | CT Angiography |
| ED | Emergency Department |
References
- Qureshi, A.I.; Mendelow, A.D.; Hanley, D.F. Intracerebral haemorrhage. Lancet. 2009 ;373(9675):1632-44. [CrossRef]
- Delcourt, C.; Sato, S.; Zhang, S.; et al. Hematoma growth and outcomes in intracerebral hemorrhage: the INTERACT1 study. Neurology. 2012 Mar 13;78(11):737-42. [CrossRef]
- Broderick, J.P.; Brott, T.; Duldner, J.E.; et al. Volume of intracerebral hemorrhage. A powerful and easy-to-use predictor of 30-day mortality. Stroke. 1993 Jul;24(7):987-93. [CrossRef]
- Wada, R.; Aviv, R.I.; Fox, A.J.; et al. CT angiography “spot sign” predicts hematoma expansion in acute intracerebral hemorrhage. Stroke. 2007 Apr;38(4):1257-62. [CrossRef]
- Boulouis, G.; Morotti, A.; Charidimou, A.; et al. Noncontrast computed tomography markers of intracerebral hemorrhage expansion. Stroke. 2017 Apr;48(4):1120-1125. [CrossRef]
- Li, Q.; Zhang, G.; Xiong, X.; et al. Blend sign on computed tomography: novel and reliable predictor for early hematoma growth in patients with intracerebral hemorrhage. Stroke. 2015 Oct;46(10):2119-23. [CrossRef]
- Li, Q.; Yang, W.S.; Chen, S.L.; et al. Black hole sign: novel imaging marker that predicts hematoma growth in patients with intracerebral hemorrhage. Stroke. 2016 Jul;47(7):1777-81. [CrossRef]
- Morotti, A.; Boulouis, G.; Dowlatshahi, D.; et al. Irregular shape of intracerebral hemorrhage is associated with hematoma expansion and poor outcome. Stroke. 2017 Jul;48(7):2040-2046. [CrossRef]
- Ye, H.; Chen, S.; Huang, X.; et al. Satellite sign and hematoma expansion in intracerebral hemorrhage: a meta-analysis. World Neurosurgery. 2018 Jun;114:e1-e6. [CrossRef]
- Kothari, R.U.; Brott, T.; Broderick, J.P.; et al. The ABCs of measuring intracerebral hemorrhage volumes. Stroke. 1996 Aug;27(8):1304-5. [CrossRef]
- Huttner, H.B.; et al. Comparison of ABC/2 estimation technique to computer-assisted planimetric analysis in measuring intracerebral hemorrhage volume. Stroke. 2006;37(12):3045-9.
- Mendelow, A.D.; Gregson, B.A.; Rowan, E.N.; et al. Early surgery versus initial conservative treatment in patients with spontaneous supratentorial intracerebral hematomas in the International Surgical Trial in Intracerebral Haemorrhage (STICH): a randomised trial. Lancet. 2005 Jan 29;365(9457):387-97. [CrossRef]
- Field, A. Discovering Statistics Using IBM SPSS Statistics. 5th ed. Sage Publications; 2017.
- Morotti, A.; Dowlatshahi, D.; Boulouis, G.; et al. Predicting intracerebral hemorrhage expansion with noncontrast computed tomography: the BAT score. Stroke. 2018 Jan;49(1):116-122. [CrossRef]
- Demchuk, A.M.; Dowlatshahi, D.; Rodriguez-Luna, D.; et al. Prediction of hematoma expansion and outcome with the CTA spot sign (PREDICT): a prospective observational study. Lancet Neurol. 2012 Apr;11(4):307-314. [CrossRef]
- Boulouis, G.; Morotti, A.; Brouwers, H.B.; et al. Association between hypodensities detected by computed tomography and hematoma expansion in patients with intracerebral hemorrhage. JAMA Neurol. 2016 Jul 1;73(7):961-968. [CrossRef]
- Goldstein, J.N.; Fazen, L.E.; Snider, R.; et al. Contrast extravasation on CT angiography predicts hematoma expansion in intracerebral hemorrhage. Neurology. 2007 Dec 11;69(24):2085-92. [CrossRef]
- Shimoda, Y.; Ohtomo, R.; Arai, N.; et al. Satellite sign: a poor outcome predictor in intracerebral hemorrhage. Cerebrovasc Dis. 2017;44(1-2):105-112. [CrossRef]
Figure 5.
Left: ICH with expansion with the presence of BHS and IRS; Right: ICH without hematoma expansion, no NCCT Signs observed
Figure 5.
Left: ICH with expansion with the presence of BHS and IRS; Right: ICH without hematoma expansion, no NCCT Signs observed
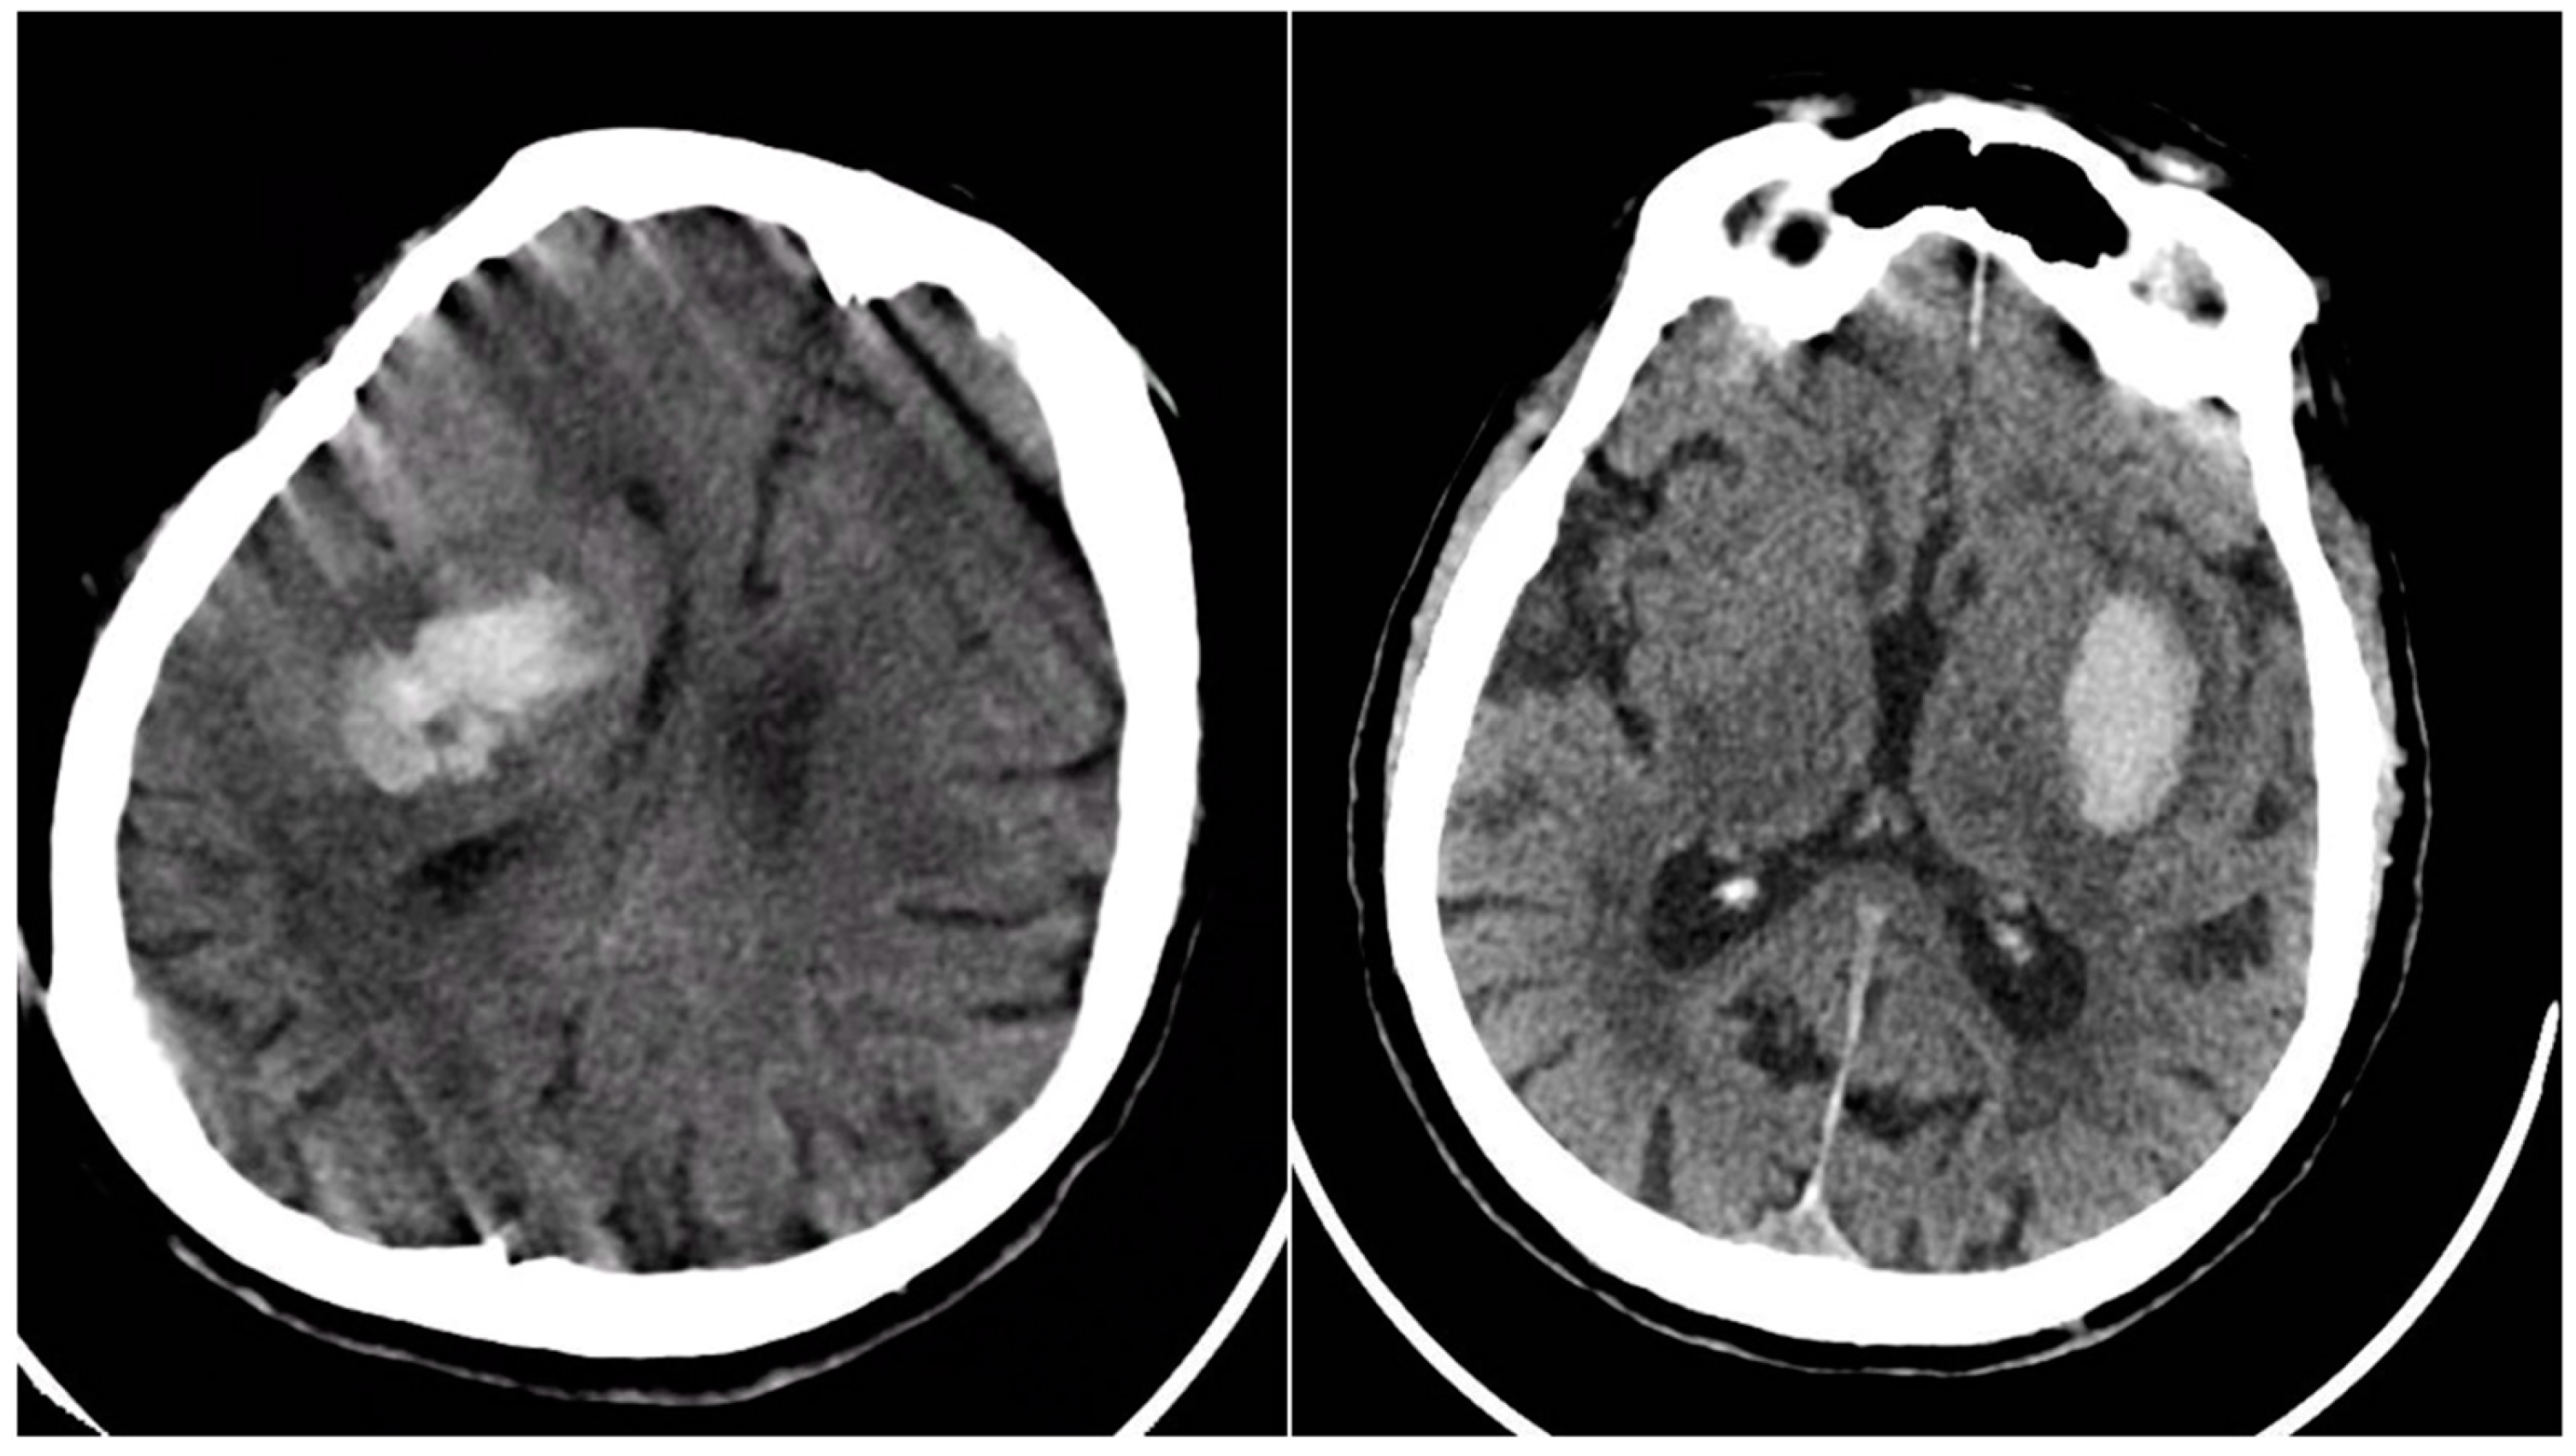
Figure 6.
Intracerebral hemorrhage (ICH) from the subgroup with in-hospital mortality, demonstrating a high incidence of NCCT signs.
Figure 6.
Intracerebral hemorrhage (ICH) from the subgroup with in-hospital mortality, demonstrating a high incidence of NCCT signs.
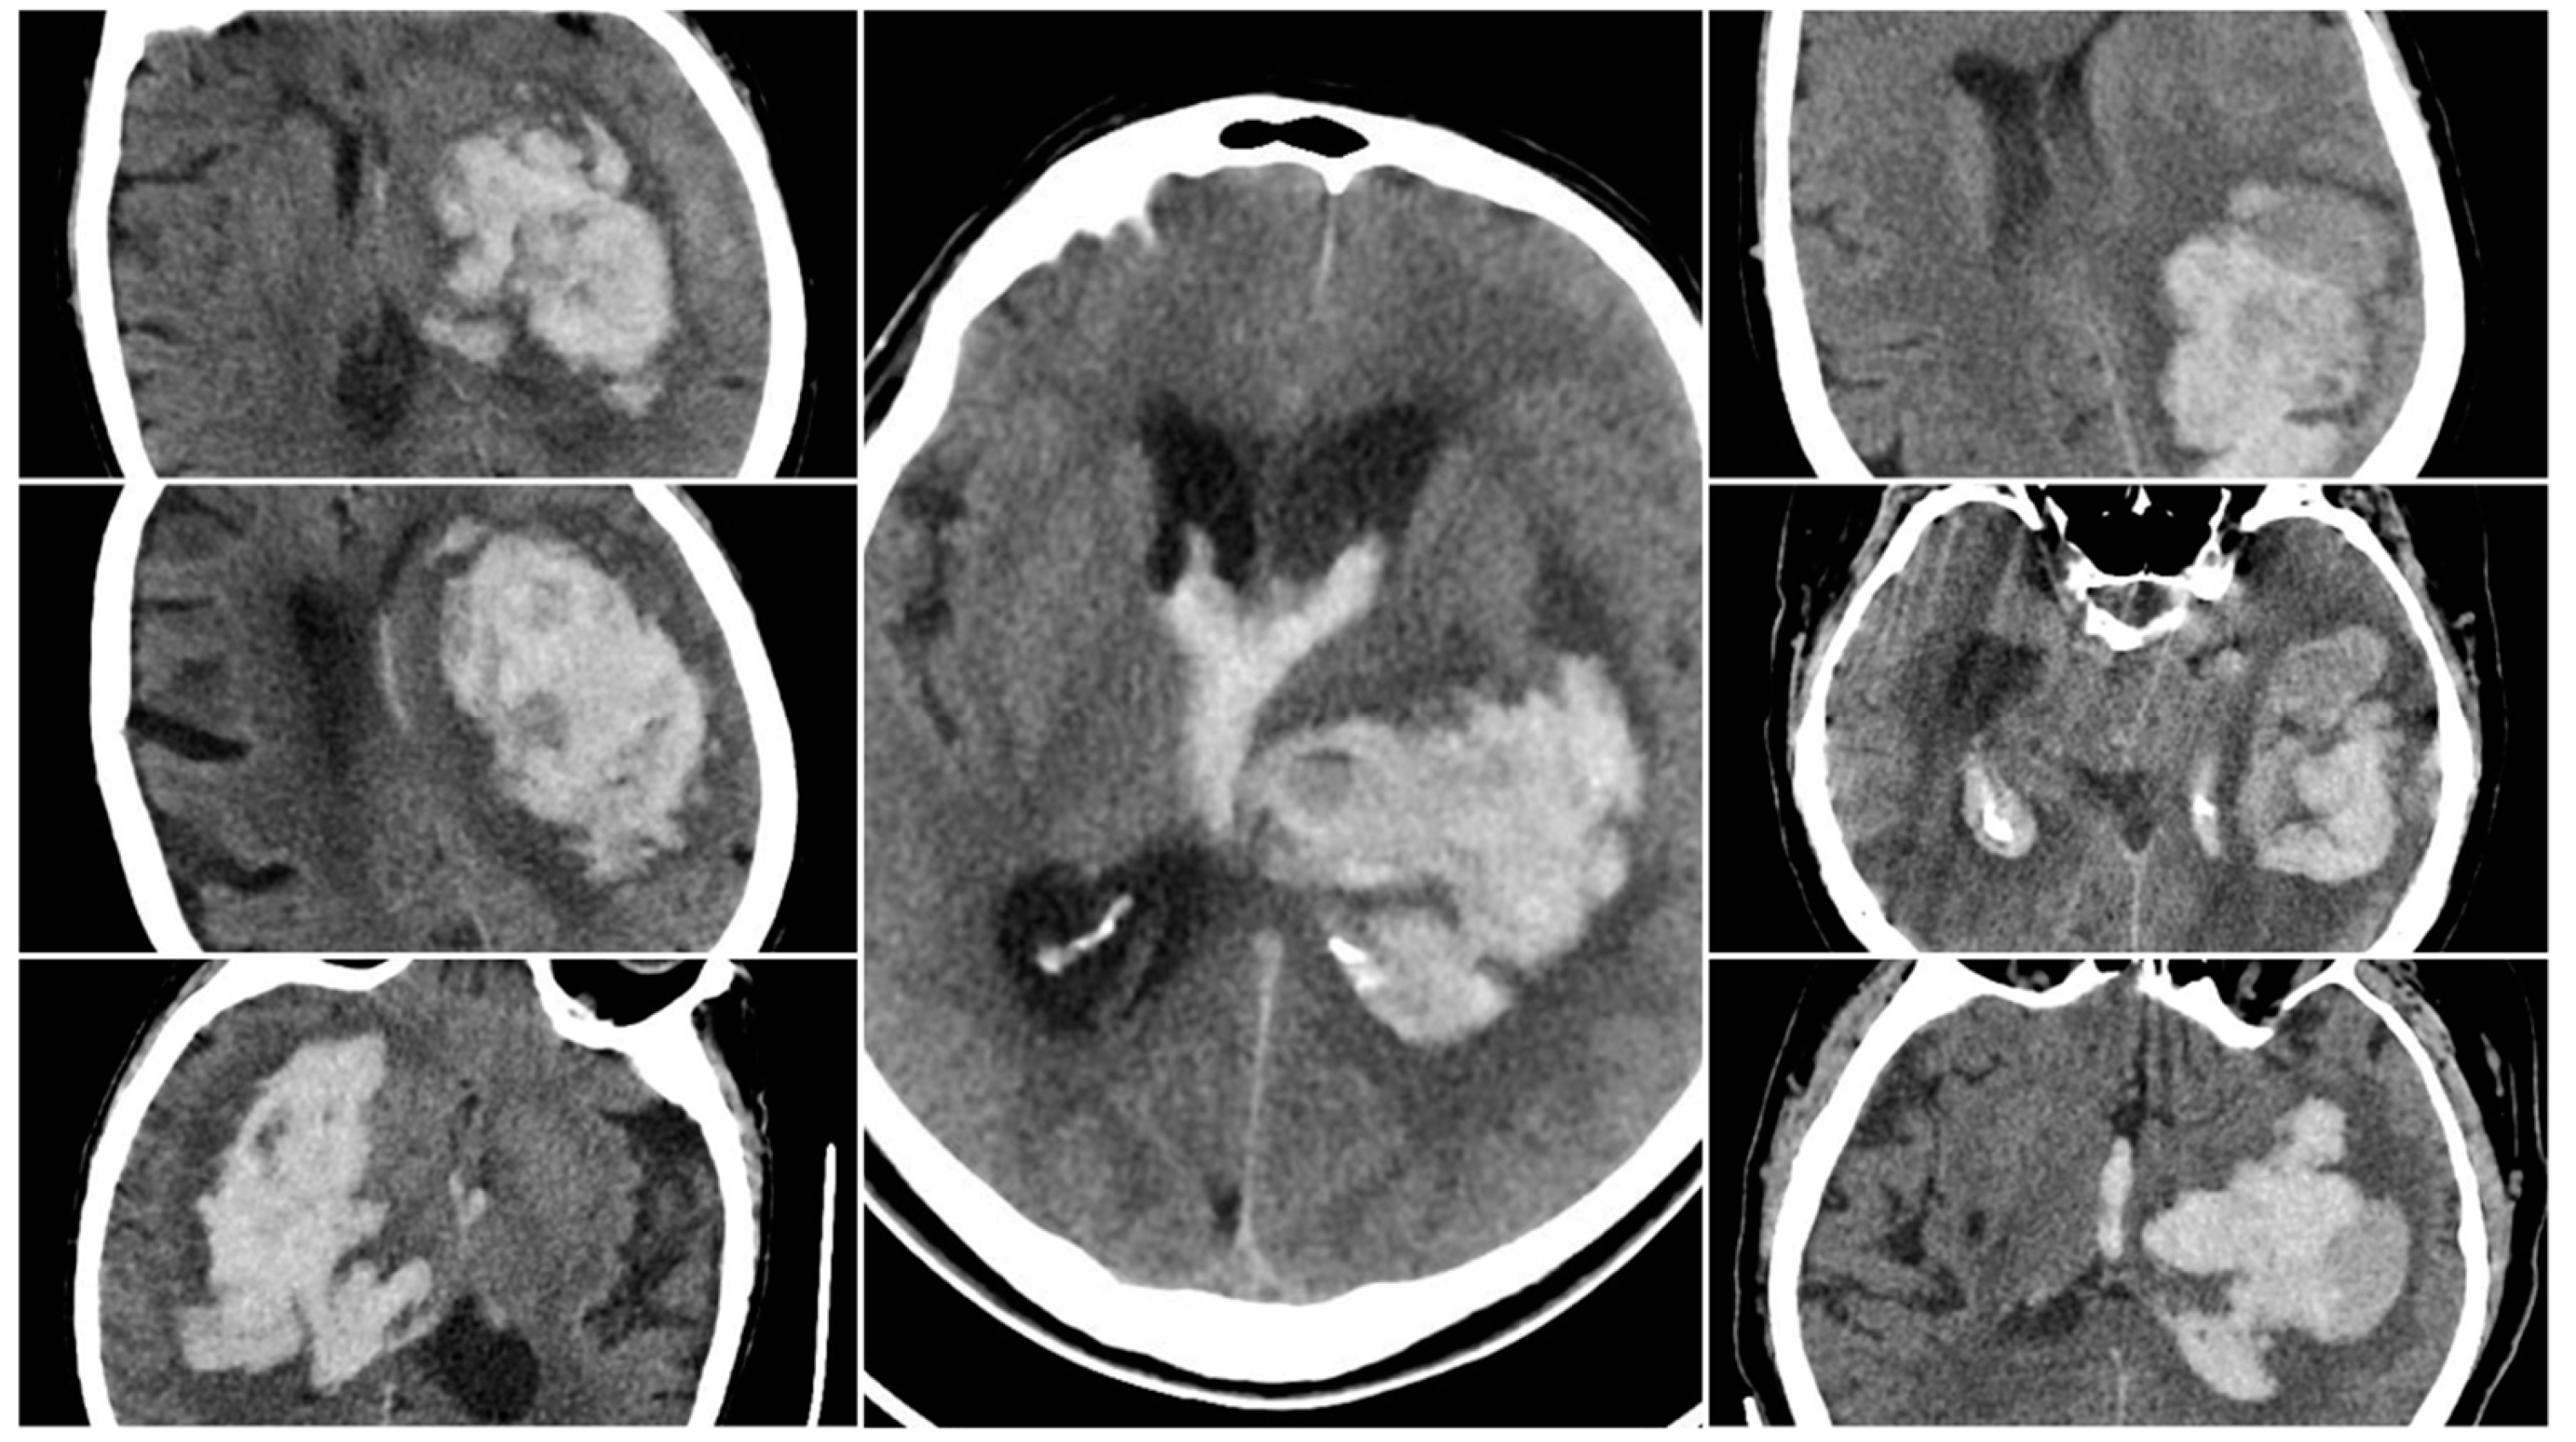
Figure 7.
Cranial CT scan performed in the ED for a patient with an ICH who had been on apixaban therapy. Left: The head CT scan shows a 70 ml large left capuso-lenticular hematoma; Right: The head CT scan shows a black hole sign (red circle) and margin irregularities (light-blue line).
Figure 7.
Cranial CT scan performed in the ED for a patient with an ICH who had been on apixaban therapy. Left: The head CT scan shows a 70 ml large left capuso-lenticular hematoma; Right: The head CT scan shows a black hole sign (red circle) and margin irregularities (light-blue line).
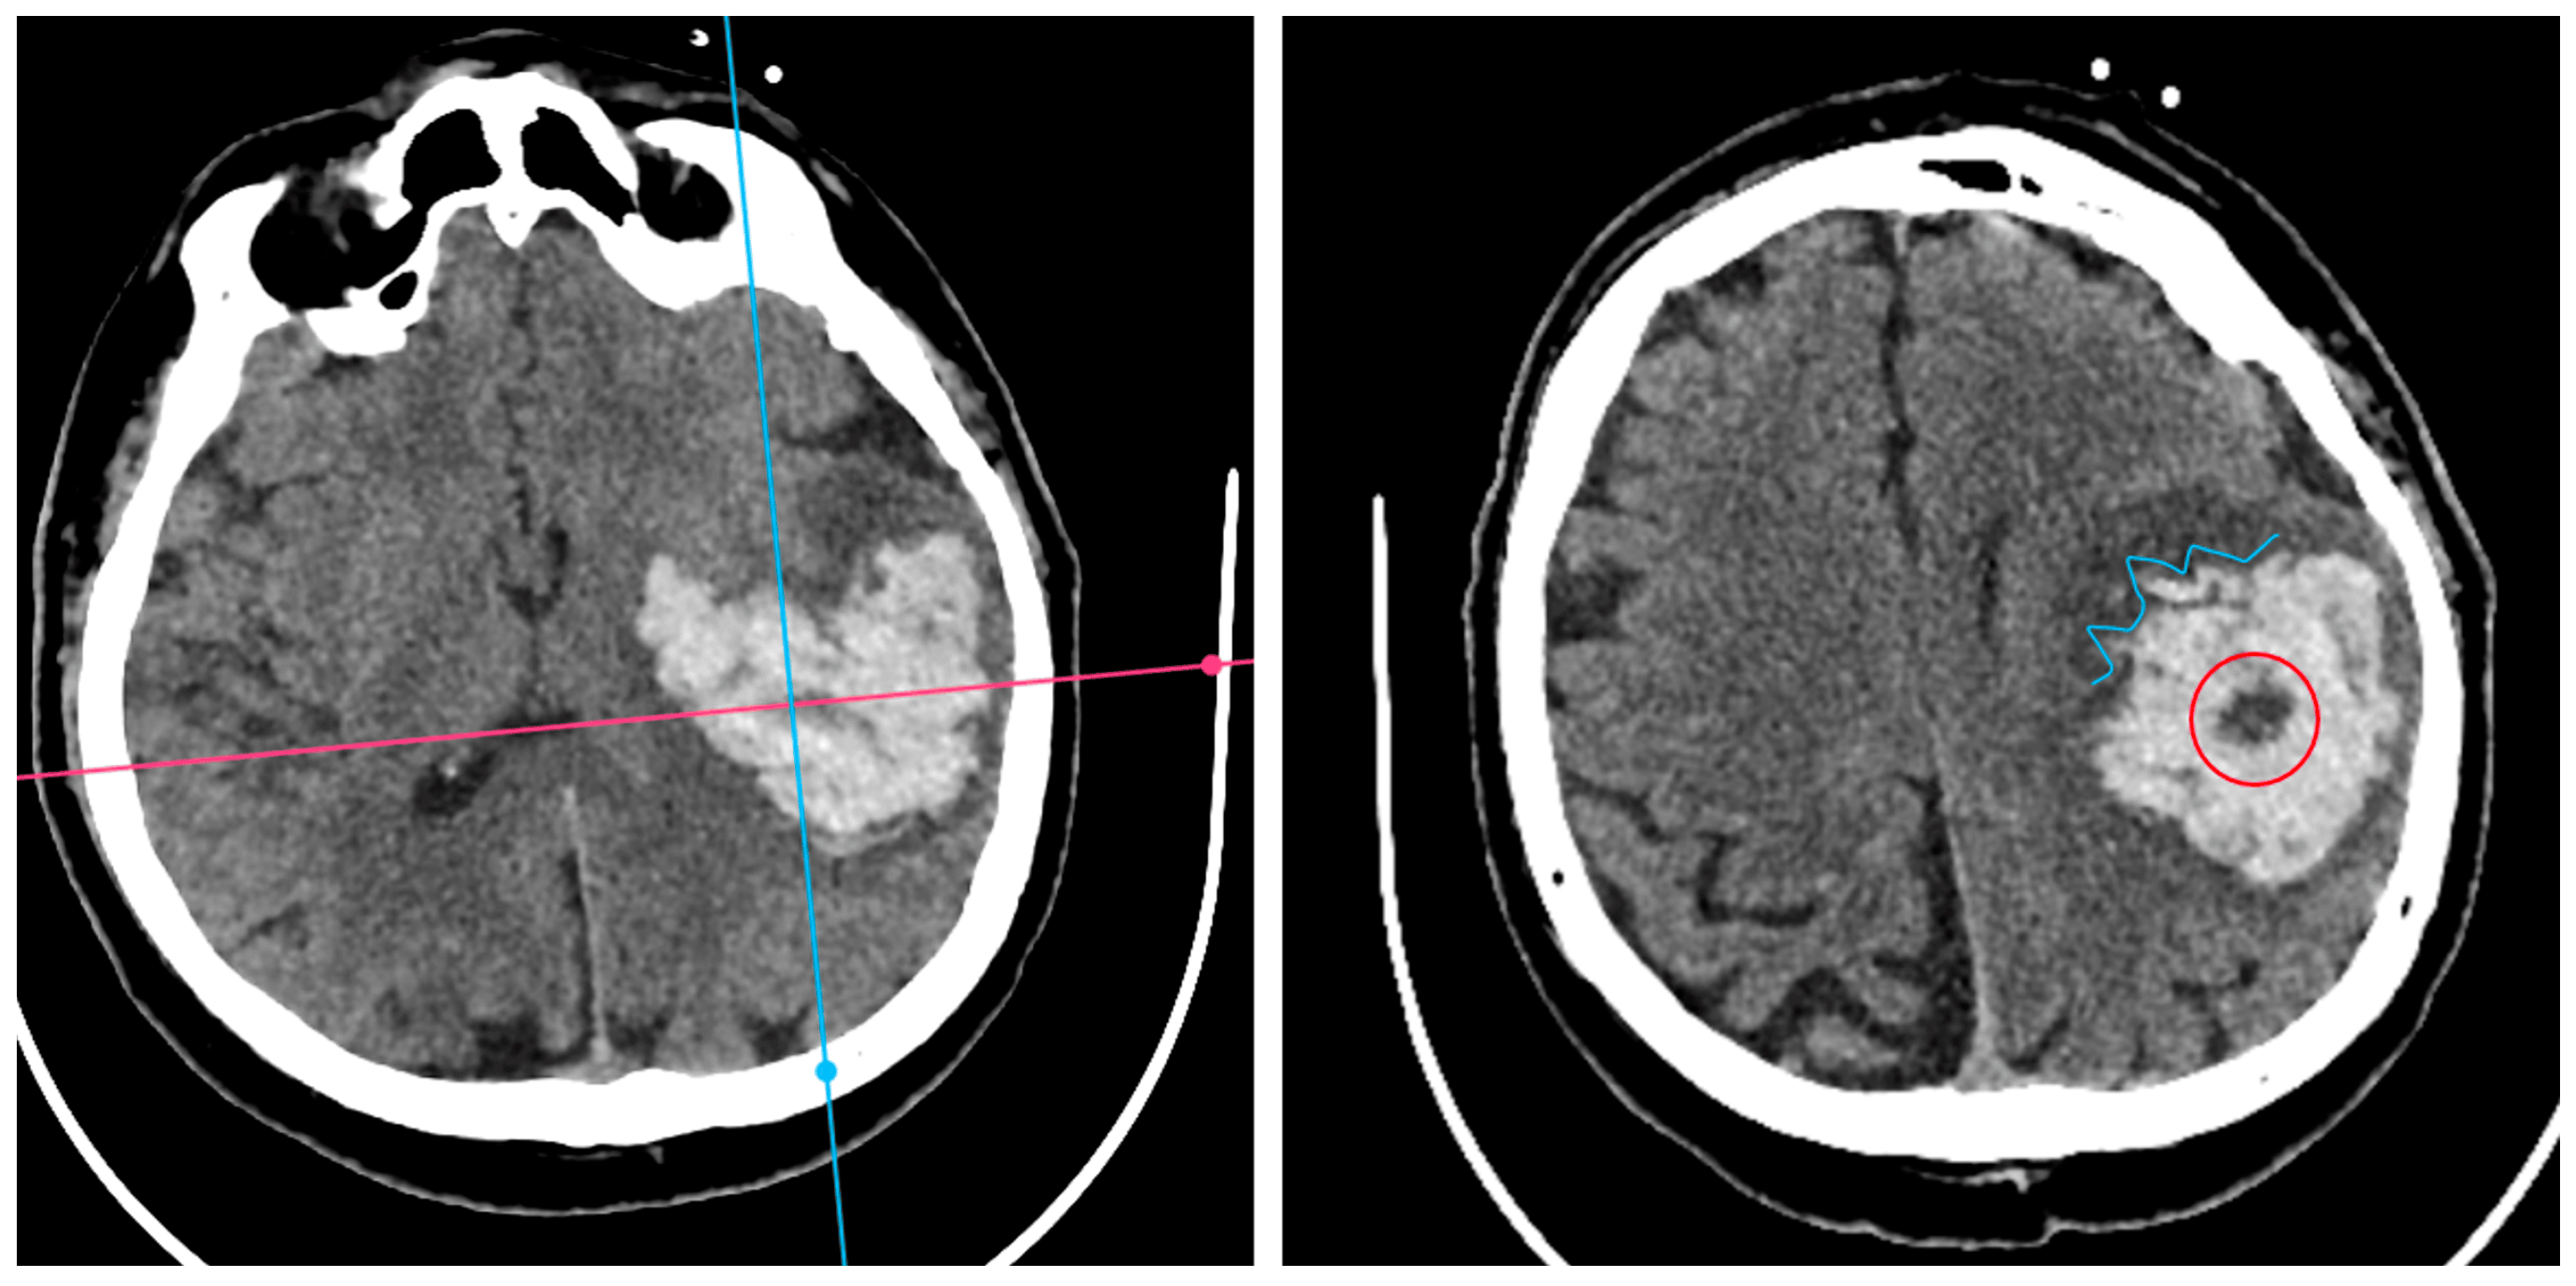

Table 1.
SUM_BBIS Scores by Hematoma Characteristics.
| Characteristic | SUM_BBIS (Mean) |
|---|---|
| Overall (N=404) | 1.25 |
| Large hematoma (>30 mL) | 2.13 |
| Medium hematoma (15–30 mL) | 1.35 |
| Small hematoma (<15 mL) | 0.91 |
| Infratentorial (overall) | 1.57 |
| Cerebellum | 0.76 |
| Brainstem | 2.33 |
| Thalamic | 1.34 |
| Lobar | 1.11 |
| Capsulo-lenticular | 1.23 |
| Intraventricular extension (IVH) | 1.76 |
| Male vs. Female | 1.25 vs. 1.25 |
Table 2.
Relationship Between NCCT Signs and Hematoma Expansion.
| Sign | Expansion YES (n=89) | Expansion NO (n=315) | Total (N=404) | p-value |
|---|---|---|---|---|
| Blend Sign (BS) | 25 (28.1%) | 36 (11.4%) | 61 | <0.001 |
| Black Hole Sign (BHS) | 50 (56.2%) | 75 (23.8%) | 125 | <0.001 |
| Irregular Shape (IRS) | 67 (75.3%) | 173 (54.9%) | 240 | <0.001 |
| Satellite Sign (SS) | 45 (50.6%) | 94 (29.8%) | 139 | <0.001 |
Table 3.
Radiological Signs in Survivors vs. In-Hospital Deaths
| Sign | In-Hospital Deaths (%) | Survivors (%) | p-value (Chi-square) |
|---|---|---|---|
| Blend Sign (BS) | 24.8 | 11.1 | <0.001 |
| Black Hole Sign (BHS) | 66.4 | 15.4 | <0.001 |
| Irregular Shape (IRS) | 87.2 | 50.8 | <0.001 |
| Satellite Sign (SS) | 52.0 | 27.2 | <0.001 |
Table 4.
NCCT Sign Frequencies and SUM_BBIS in Selected Comorbidities
| Subgroup | BS (%) | BHS (%) | IRS (%) | SS (%) | SUM_BBIS |
|---|---|---|---|---|---|
| Anticoagulant Therapy (overall) | 11.3 | 47.2 | 54.7 | 31.3 | 1.36 |
| – Vitamin K Antagonists (VKA) | 9.0 | 59.1 | 59.0 | 28.5 | 1.48 |
| – DOAC | 13.8 | 37.9 | 55.2 | 35.7 | 1.32 |
| Antiplatelet Therapy | 15.0 | 30.0 | 60.0 | 30.0 | 1.22 |
| Statin Therapy | 0 | 22.7 | 59.0 | 27.2 | 0.92 |
| Chronic Alcohol Consumption | 16.4 | 32.7 | 69.0 | 41.5 | 1.50 |
| Chronic Kidney Disease | 12.2 | 46.9 | 71.4 | 43.7 | 1.60 |
| Diabetes Mellitus (type 1 or 2) | 8.2 | 31.1 | 57.4 | 30.0 | 1.22 |
| Thrombocytopenia | 11.1 | 48.1 | 70.4 | 44.4 | 1.68 |
Disclaimer/Publisher’s Note: The statements, opinions and data contained in all publications are solely those of the individual author(s) and contributor(s) and not of MDPI and/or the editor(s). MDPI and/or the editor(s) disclaim responsibility for any injury to people or property resulting from any ideas, methods, instructions or products referred to in the content. |
© 2025 by the authors. Licensee MDPI, Basel, Switzerland. This article is an open access article distributed under the terms and conditions of the Creative Commons Attribution (CC BY) license (http://creativecommons.org/licenses/by/4.0/).
Copyright: This open access article is published under a Creative Commons CC BY 4.0 license, which permit the free download, distribution, and reuse, provided that the author and preprint are cited in any reuse.


