

Submitted:
13 May 2025
Posted:
14 May 2025
You are already at the latest version
Abstract
Costa Rica has experienced 37 tsunamis at both its Pacific and Caribbean coasts, with none to moderated impact. However, the coastal population has increased exponentially in the past decades, which might lead to higher impact from future tsunamis. In 2018 and 2019, IOC/UNESCO organized Experts Meetings of Tsunami Sources, Hazards, Risks and Uncertainties associated with the Tonga-Kermadec and Colombia-Ecuador subduction zones, where experts defined worst-case scenarios. Here we modeled the propagation of those tsunami scenarios to Costa Rica and their inundation for selected sites. We found that the Tonga-Kermadec scenarios provoked larger inundation than previous modeled sources from that region. However, the large travel time for those scenarios, about 14 hours, would allow for a timely evacuation. In the case of the Colombia-Ecuador scenarios, they provoked smaller inundation than previously modeled sources from that region, a good outcome as their arrival time is between 75 and 150 minutes. These new results required the update of tsunami evacuation maps and/or plans for many communities but provided more favorable conditions for tsunami preparedness. Yet, the short arrival times of the Colombia-Ecuador scenarios still require a prompt response from the population and authorities. For this, additional to updated tsunami evacuation maps and plans, it is recommended to have tsunami exercises in a regular basis.
Keywords:
tsunami
; tsunami numerical modeling
; tsunami evacuation maps
; tsunami evacuation plans
; Tonga‐Kermadec tsunamis
; Colombia‐Ecuador tsunamis
1. Introduction
A first estimation of tsunami hazard for the Pacific coast of Costa Rica was performed by [1] using local, regional and far-field seismic sources located all around the Pacific basin. They found that tsunamis coming from the Subduction Zones of Tonga-Kermadec and Colombia-Ecuador caused the highest tsunami heights for Costa Rica, not only amongst regional and distant sources but also higher than local sources. The results from this assessment were employed to elaborate tsunami evacuation maps for 54 communities in the Pacific coast of Costa Rica. The inundation areas used to build the maps for most of the communities were defined by fixed height based on the maximum tsunami amplitude obtained nearshore them. However, as high-resolution bathymetry existed at that moment for eight sites, tsunami inundation modeling was performed there using the sources employed in [1] to obtain the inundation area. These tsunami evacuation maps were part of a joint project between the National University Costa Rica (UNA) and the National Commission on Risk Prevention and Emergency Response (CNE). With the support of this project, Costa Rica has 10 communities recognized as Tsunami Ready by [2] along its Pacific coast.
Costa Rica has experienced 42 tsunamis since 1746 [3,4,5]. Of the 37 recorded at the Pacific coast, 24 were caused from distant earthquakes and one from a distant volcanic eruption. None of those tsunamis caused casualties, but in total they flooded 10 locations causing damages in six of them. In other six locations strong currents were observed, causing damages in two of them and morphological changes were reported twice. In 13 locations witnesses reported minor sea level fluctuations caused by the tsunamis. Nonetheless, future tsunamis might have a larger impact due to the fast increase on coastal population at both shores of Costa Rica, since the 1990s.
Costa Rica Pacific coast has registered four tsunamis originated at the Tonga-Kermadec Subduction Zone (TKSZ) and three originated at the Colombia-Ecuador Subduction Zone (CESZ) (Figure 1). Of the former, three tsunamis were originated by earthquakes and one by a volcanic eruption (black squares and triangle in Figure 2, respectively); of the latter, all were caused by earthquakes (black squares in Figure 3).
Regarding the Tonga-Kermadec Subduction Zone (TKSZ), the tsunami caused by a Mw=8.0 earthquake on 3 May 2006 was registered in Quepos tide gauge with a maximum height of 7.9 cm arriving 14:19 hours after the earthquake (Figure 4a). The Mw=8.1 Samoa tsunami of 29 September 2009 was observed as minor sea level changes at Wafer Bay, Cocos Island [6]. The Mw=8.1 Kermadec Islands tsunami of 4 March 2021 was registered at the tide gauges at Quepos and at Chattam Bay (Cocos Island) with maximum heights of 17.6 cm and 5.8 cm arriving 15:31 hours and 15:02 hours after the earthquake, respectively (Figure 4b and c) [4]. The eruption of the Hunga Tonga – Hunga Ha’apai (HTHH) volcano in January 2022 caused a meteotsunami that due to Proudmann resonance got amplified at the Tonga Trench causing a tsunami observed in 24 locations in Costa Rica almost 13 hours after the eruption [5], including the tide gauges of Quepos (Figure 4d) and Cocos Island (Figure 4e). These observation points are shown with purple circles in Figure 1.
The first tsunami originated at the Colombia-Ecuador Subduction Zone (CESZ) registered in Costa Rica was caused by a Mw=8.8 earthquake on the 31st of January of 1906 [3]. This tsunami caused sea level changes and small flooding at Tárcoles, Boca Barranca, Barranca and Potrero Bay (green circles in Figure 1). The second one was caused by a Mw=7.9 earthquake on the 12th of December of 1979 and was recorded partially at Puntarenas tide gauge (Figure 5a). The first two hours of the tsunami were not recorded and the rest of the marigram shows a maximum height of 13.5 cm [7]. Based on model results, the tsunami could have arrived 2:20 hours after the earthquake, and might have had a maximum height of 43 cm. The third tsunami was caused by a Mw=7.8 earthquake on the 16th of April of 2016 and was recorded at Quepos tide gauge with a maximum height of 7.4 cm arriving 2:10 hours after the earthquake (Figure 5b).
In their tsunami hazard study, [1] used combinations of unitary sources in ComMIT with a standard Mw= 9.3 around the Pacific basin for regional and far-field tsunamis. When that paper was under its final phases of writing, the UNESCO-IOC published the results from two Experts’ Meetings on tsunami sources from Tonga-Kermadec and Colombia-Ecuador subduction zones [8,9]. One of the goals of those meetings was “to provide guidance in the selection of seismic sources for the development of (tsunami) evacuation maps” [8,9]. However, these scenarios were not included in [1] due to time constraints.
The Experts Meeting on Tsunami Sources, Hazards, Risks and Uncertainties Associated with the Tonga-Kermadec Subduction Zone [8] was held in Wellington, New Zealand, from 29 October to 3 November 2018. At this meeting, 17 experts declared that “The rapid convergence rates at the Tonga-Kermadec trench, and the implications that such high rates of activity have for potential megathrust earthquakes, highlight this region as one of major concern for tsunami hazard in the circum-Pacific region” [8]. The experts proposed 21 scenarios along the 3600-km-length trench. Twenty scenarios were defined rupturing sections of the trench, and one rupturing almost the entire trench length, 3100 km. Eight scenarios were considered of high probability with magnitudes ranging from Mw=8.3 to Mw=9.3, and 13 were considered of intermediate probability with magnitudes ranging from Mw=8.6 to Mw=9.7.
The Experts Meeting on Tsunami Sources, Hazards, Risk and Uncertainties Associated with the Colombia-Ecuador Subduction Zone [9] was held in Guayaquil, Ecuador, from 27 to 29 January 2019. At this meeting, 17 experts proposed seven scenarios along the 1220-km-length trench. Six scenarios ruptured sections of the trench with magnitudes ranging from Mw=7.9 to Mw=8.7, with high probability of occurrence. One multi-segment scenario was considered possible but less likely to occur, rupturing along 560 km with a Mw=8.9. The experts stated that the scenarios defined “are a first estimation of the inter-plate coupling along the Pacific coast of Colombia. However, for a more accurate and detail assessment it is necessary to densify the geodetic network along the center and north of the Colombian Pacific (Sagiya Mora-Paez, 2020) with more instruments” [9].
Here, we model the sources from the mentioned Experts Meetings and compare the results with [1]. This modeling is important considering the higher impact for Costa Rica of tsunamis originated at those trenches. Additionally, the scenarios proposed by the experts have either lower or higher magnitude than the scenarios employed in [1]. Finally, in the case of the Colombia-Ecuador Subduction Zone scenarios, they have more precise faulting parameters than ComMIT unit sources, which play an important role for regional and local sources.
2. Materials and Methods
The numerical simulations were performed with ComMIT, a graphical user interface of MOST [10], using both pre-calculated unit sources and customized sources. ComMIT uses the results of tsunami propagation modeling over a pre-established grid covering the Pacific Ocean, nesting them offline to three telescopic inundation grids defined by the user, which are nested online between them.
Here we employ the same grid setup as [1] to assess the nearshore tsunami heights (NTH) along the entire Costa Rica Pacific coast at 20 m depth.
Due to the lack of high-resolution coastal bathymetry at most of the coast, tsunami inundation was not simulated countrywide. Though, we modeled tsunami inundation at 13 locations where high-resolution coastal bathymetry was available. These places include the eight sites for which tsunami evacuation maps were done through inundation modeling of the scenarios from the previous study: Culebra Bay, Potrero, Tamarindo, Samara, Tambor, Puntarenas, Jaco and Quepos (Figure 6). We also modeled Manuel Antonio, Drake, Golfito, Puerto Jiménez and Cocos Island, which bathymetries were surveyed afterwards.
The inundation models of Puntarenas, Quepos and Cocos Island were validated in previous work [4,7,11]. For the other locations, there were no quantitative records of tsunamis to validate the inundation models. The grids of the inundation models have resolutions of 30, 5 and 1 arcsec; except for: Potrero, Manuel Antonio, Golfito and Cocos Island having 24, 3 and ½ arcsec resolutions, Drake having 24, 4 and ½ arcsec, and Quepos and Puerto Jiménez having 24, 3 and 1/3 arcsec resolutions. The results from the inundation modeling at the first eight sites were compared with the results obtained from modeling the inundation caused by the scenarios in [1] at those sites.
As mentioned before, the scenarios were obtained from the Experts Meeting Reports [8,9]. The 21 scenarios at Tonga-Kermadec Trench were defined as linear combination of ComMIT unit sources. The seven scenarios at Colombia-Ecuador Trench were modeled as customized sources using ComMIT module for custom propagation. The scenarios from Tonga-Kermadec had magnitudes ranging from Mw=8.3 to Mw=9.7 over rupture lengths between 200 and 2800 km (Table 1). The Colombia-Ecuador scenarios had magnitudes ranging from Mw=7.9 to Mw=8.9 rupturing distances between 110 to 560 km (Table 1).
We run all the 28 scenarios (Figure 2a and Figure 3a) for the low-resolution grid setup and then selected those scenarios having higher tsunami heights (with an * in Table 1) to perform the inundation modeling.
3. Results
In [1], all the scenarios were based on unit sources combined for a Mw= 9.3. Six scenarios were modeled along the TKSZ and two scenarios along the CESZ (Figure 2b and Figure 3b, respectively). Of the TKSZ scenarios, one provoked much higher tsunami heights (TK4, here named oTK4, in red in Figure 2b) than the others, also for CESZ one scenario was more significant (SA2, in red in Figure 3b) than the other. Those are the scenarios used here for comparison.
3.1. Nearshore Tsunami Heights and Arrival Times
From the Tonga-Kermadec intermediate probability scenarios modeled here, two had nearshore maximum tsunami heights (NTH) larger than 20 m: scenario 21 and 12 with 26.1 and 24.4 m respectively (Table 1, Figure 7a and b). Two scenarios had maximum NTH over 10 m: scenarios 11 and 14, with 18.3 and 14.6 m respectively (Table 1, Figure 7c and d). The maximum NTH for high probability scenarios was 5.3 m for scenario 4, and the minimum value of maximum NTH among all the TKSZ scenarios was for scenario 7 with 0.1 m (Table 1). Scenarios from Tonga-Kermadec subduction zone affected particularly the south Pacific coast of Costa Rica (Figure 7). The travel times obtained for the worst-case scenario, TK21, were 13:31 hours to Cocos Island and 14:07 hours to mainland.
Of the Colombia-Ecuador scenarios, the “less likely” Mw=8.9 Galera I & II had maximum NTH of 4.38 m (Figure 8a, Table 1). Only one of the “more likely” scenarios caused maximum NTH over 1 m: Galera II (Esmeralda) with 4.01 m (Figure 8b, Table 1). The travel time for these two scenarios were 1:21 and 1:07 hours respectively to Punta Burica, the closest location to the source in Costa Rica.
The highest NTH for TK scenarios were located close to Punta Llorona (PL in Figure 7) and for CE scenarios between Punta Muñeco and Playa Hermosa (PM and PH in Figure 8).
3.2. Tsunami Inundation
Among the sites where tsunami inundation was modeled, Puerto Jiménez resulted in the smallest inundation distance for both TK21 and CE28 scenarios: 0.25 and 0.1 km, respectively (Table 2). Tambor had the largest inundation distance also for both scenarios: 2.4 km for TK21 and 1.4 km for CE28. Puntarenas was excluded of the comparison due to its complex geomorphology.
Regarding inundated areas, Tamarindo had the largest for both scenarios: 7.4 and 3.6 km2 for TK21 and CE28 respectively. The smallest inundated area was for Cocos Island: 0.15 and 0.07 km2 respectively for TK21 and CE28.
The maximum flowdepth obtained was in Potrero with 13.3 m for TK21 scenario and Jaco with 7.3 m for CE28 scenario. The minimum flowdepth occurred in Puerto Jiménez: 1.84 m for the TK21 scenario, and in Quepos: 0.1 m for the CE28 scenario.
4. Discussion
4.1. Wave Evolution
In lower panels of Figure 9 and Figure 10 is shown the time evolution of the tsunami waves for scenarios TK21 and CE28 respectively, for the coast sections between Cabo Velas (CV) and Punta Chancha (Ch). The coast sections and their maximum NTH for each scenario are shown in the upper panels of Figure 9 and Figure 10, respectively, along with the incidence direction of each tsunami scenario.
For the TK21 scenario, tsunami amplitudes higher than 1 m persisted during longer timespans than for CE28 scenario. The much higher magnitude of the earthquake caused the TK21 tsunami to be reflected around the Pacific basin thus its effects persisted for longer times, as happened for the 2010 Chile and 2011 Japan tsunami for example [12].
For both scenarios, tsunami waves continued for longer times in the subsections marked with a purple thick line, between Punta Muñeco (PM) and Playa Hermosa (PH), and with a green thick line, between Cabo Blanco (CB) and Punta Chancha (Ch), compared to the neighboring subsections (Figure 9b and Figure 10b).
In the case of the TK21 scenario, waves over 3 m continued up to 10 hours after the first arrival between Punta Muñeco and Playa Hermosa, while they lasted only about 5 hours in the neighboring subsections. For the CE28 scenario, waves over 2 m lasted about 5 hours in this subsection versus 2 hours in the neighboring subsections. For the CE scenarios, the highest NTH were obtained also in this subsection (Figure 8a and Figure 10a). The incidence angle of CE tsunamis with respect to the continental slope made the waves refract and arrive perpendicular to the continental platform in this section (see arrival times as thick black line in Figure 10b), and the concave shape of the continental slope contributed to dissipate less energy for this subsection.
For the TK21 scenario, tsunami waves over 3 m lasted 10 hours along the entire subsection between Cabo Blanco (CB) and Punta Chancha (Ch) (green tick line in Figure 9b). The reason is these waves became trapped in this section due to their incidence angle (black arrow in Figure 9a), their periods and the narrow continental platform at those two locations, as explained in Chacón-Barrantes and Arozarena Llopis (2021). Also, the highest NTH for TK scenarios was obtained nearby Punta Llorona (PL) and the Terraba River mouth (TR) (Figure 9a) due to the influence of Caño Island offshore this coast subsection.
For the CE28 scenario, trapped tsunami waves lasted only about 4 hours here (Figure 10b), due mainly to the presence of the Osa Peninsula relative to their incidence angle (black arrow in Figure 10a) and the much smaller earthquake magnitude. However, for this scenario, waves lasted longer at the entrance of Nicoya Gulf, between Negritos Island (IN) and Bajamar (Ba), marked with an orange thick line in Figure 10. This Gulf was not considered in the model due to its shallow depths, particularly at its mouth. Further studies are recommended to explore possible implications of this result within the Gulf.
The first study (Chacón-Barrantes and Arozarena Llopis 2021) also discussed trapped waves in the coast section between Cabo Blanco (CB) and Punta Chancha (Ch) using the SA2 scenario as example, the largest scenario from the CESZ employed in that work. The higher magnitude of the TK scenarios considered here made more evident the trapped waves and island effect discussed in Chacón-Barrantes & Arozarena-Llopis [1] along subsection 3.1 (between Terraba River, TR, and Punta Chancha). On the other hand, the refined seismic sources of the CE scenarios provoked much larger tsunami heights along subsection 2.1 (between Punta Muñeco and Cabo Blanco) than in the rest of the segments, opposite to SA2 scenario generated from ComMIT unit sources.
4.2. Arrival Times
TK21 scenario arrived almost perpendicular to northwest Nicoya Peninsula (black arrow in Figure 9a), thus the difference in arrival times between Cabo Velas and Cabo Blanco was only 2 minutes (Table 3 and Figure 9). This tsunami arrived first to the north of Costa Rica, despite the source being located southwest, due to the orientation of Costa Rica Pacific coast and wave refraction.
[1] mistakenly stated that tsunami waves reached Cabo Blanco (CB) and Punta Llorona almost at the same time for the SA2 scenario, but the difference was 13 minutes. Here, we obtained that same time difference for the CE28 scenario (Table 3). In the case of the TK21 scenario, that time difference was larger due to the incidence angle: 21 minutes (black arrow in Figure 9a and Table 3).
The short arrival times of CE scenarios should be considered when ellaborating tsunami evacuation plans. These arrival times are slightly larger than arrival times for local tsunamis, however, these earthquakes will not be likely felt by the population, thus require other warning mechanisms.
4.3. Maximum Heights and Inundation
In [1], one scenario from Tonga-Kermadec subduction zone (referred as oTK4 here) and one scenario from Colombia-Ecuador subduction zone (SA2) resulted in the highest nearshore tsunami heights (NTH) for Costa Rica of 12.5 and 12.3 m, respectively. The later was particularly worrisome due to its short arrival time of about 1:15 hours. Fortunately, the new scenarios from Colombia-Ecuador subduction zone modeled here produced about three times smaller maximum NTHs than SA2 scenario (Table 1).
On the opposite, several of the intermediate probability scenarios from Tonga-Kermadec resulted on maximum NTH higher than those from oTK4. The maximum NTH obtained from the worst-case scenario (intermediate probability) was more than double the previous study, 26.1 m versus 12.5 m (Table 1). However, the high probability scenarios simulated here have maximum NTH much lower than those of the previous study: 5.3 m versus 12.5 m. Also, tsunamis arriving from this subduction zone have a travel time of approximately 14 hours, which could support timely evacuation of exposed areas.
The difference on maximum inundation distance, inundation area and flowdepth between the modeling of experts’ scenarios and the scenarios from [1] is shown in Table 4. Manuel Antonio, Drake, Puerto Jiménez, Golfito and Cocos Island were not included as they were not modeled using the previous scenarios.
In all cases but one, the inundation areas caused by the TK21 scenario were larger than the inundation areas caused by the oTK4 (Table 4), which is consistent with the larger magnitude of the new scenario: Mw=9.7 versus Mw=9.3. Tambor had the largest change on tsunami inundation area between old and new scenarios: the area increased by 4.5 km2. Considering that the coastline length for Tambor grid is 20.3 km, the inundation area increased 0.22 km2 per kilometer of coastline. Potrero and Tamarindo also had a significant increase on inundation areas: 2.0 and 2.4 km2, respectively. The only exception of this was Quepos, where the bathymetric and topographic grids were also updated as new bathymetric information became available. In Quepos, the total inundation area caused by the TK21 scenario was 0.39 m2 smaller than the inundation area caused by the oTK4 scenario. However, this reduction was only in the Boca Vieja mangrove. In the city, the inundation area increased for the TK21 scenario by 0.2 km2
Regarding the CESZ scenarios, in all cases the inundation areas caused by the CE28 scenario were smaller than those caused by the SA2 scenario from [1]. In this case the magnitude of the new scenario was smaller: Mw=8.9 versus Mw=9.3. Tamarindo, Sámara and Tambor had a significant decrease in inundation areas: 4.9, 2.1 and 4.0 km2, respectively.
4.4. Implications for Coastal Communities
The results obtained here implied a revision of the tsunami evacuation maps and plans developed from the results of [1]. The difference between inundation areas caused by new versus old scenarios was diverse for each location where tsunami inundation was modeled, and for those where inundation areas were defined by fixed height. Here we analyze only the eight locations where tsunami inundation modeling was performed before and now.
Tsunami evacuation maps and plans are basic tools for tsunami preparedness and response at community level. Both require tsunami inundation area as their main input, in addition of community infrastructure, tsunami inundation distance, and tsunami flowdepths, in order of importance.
The inundation area, obtained either from tsunami inundation modeling or fixed height, was extended to nearby roads or other landmarks for easiness of interpretation. This extended area is known as evacuation area in tsunami evacuation maps and plans. In the case of Bahía Culebra, Tamarindo, Samara, Tambor and Jaco, the new inundation areas did not require to change the old evacuation areas and did not affect assembly points nor evacuation routes.
For those communities, even when their maps did not require an update, they amended their tsunami exposure with the new scenarios. Their worst-case scenario now is a distant tsunami instead of a regional tsunami as was before. This means that the arrival times for their worst-case-scenario increased from 1-2 to 14 hours, streamlining the evacuation processes. The tsunami evacuation plans of Tamarindo and Samara were updated accordingly. In the case of Bahía Culebra, it has three communities: El Coco, Playa Hermosa and Playa Panamá. The later has no tsunami evacuation plan; and Playa Hermosa and El Coco were in the process of building their plans when these results became available and then used them for their plans. For Tambor and Jaco no tsunami evacuation plan has been created yet.
The other three locations required to update their tsunami evacuation maps: Potrero, Puntarenas and Quepos. In Potrero, the inundation area was smaller for the new CE scenarios. On the other hand, the new TK scenarios inundated about 500 m further inland than the previous ones (
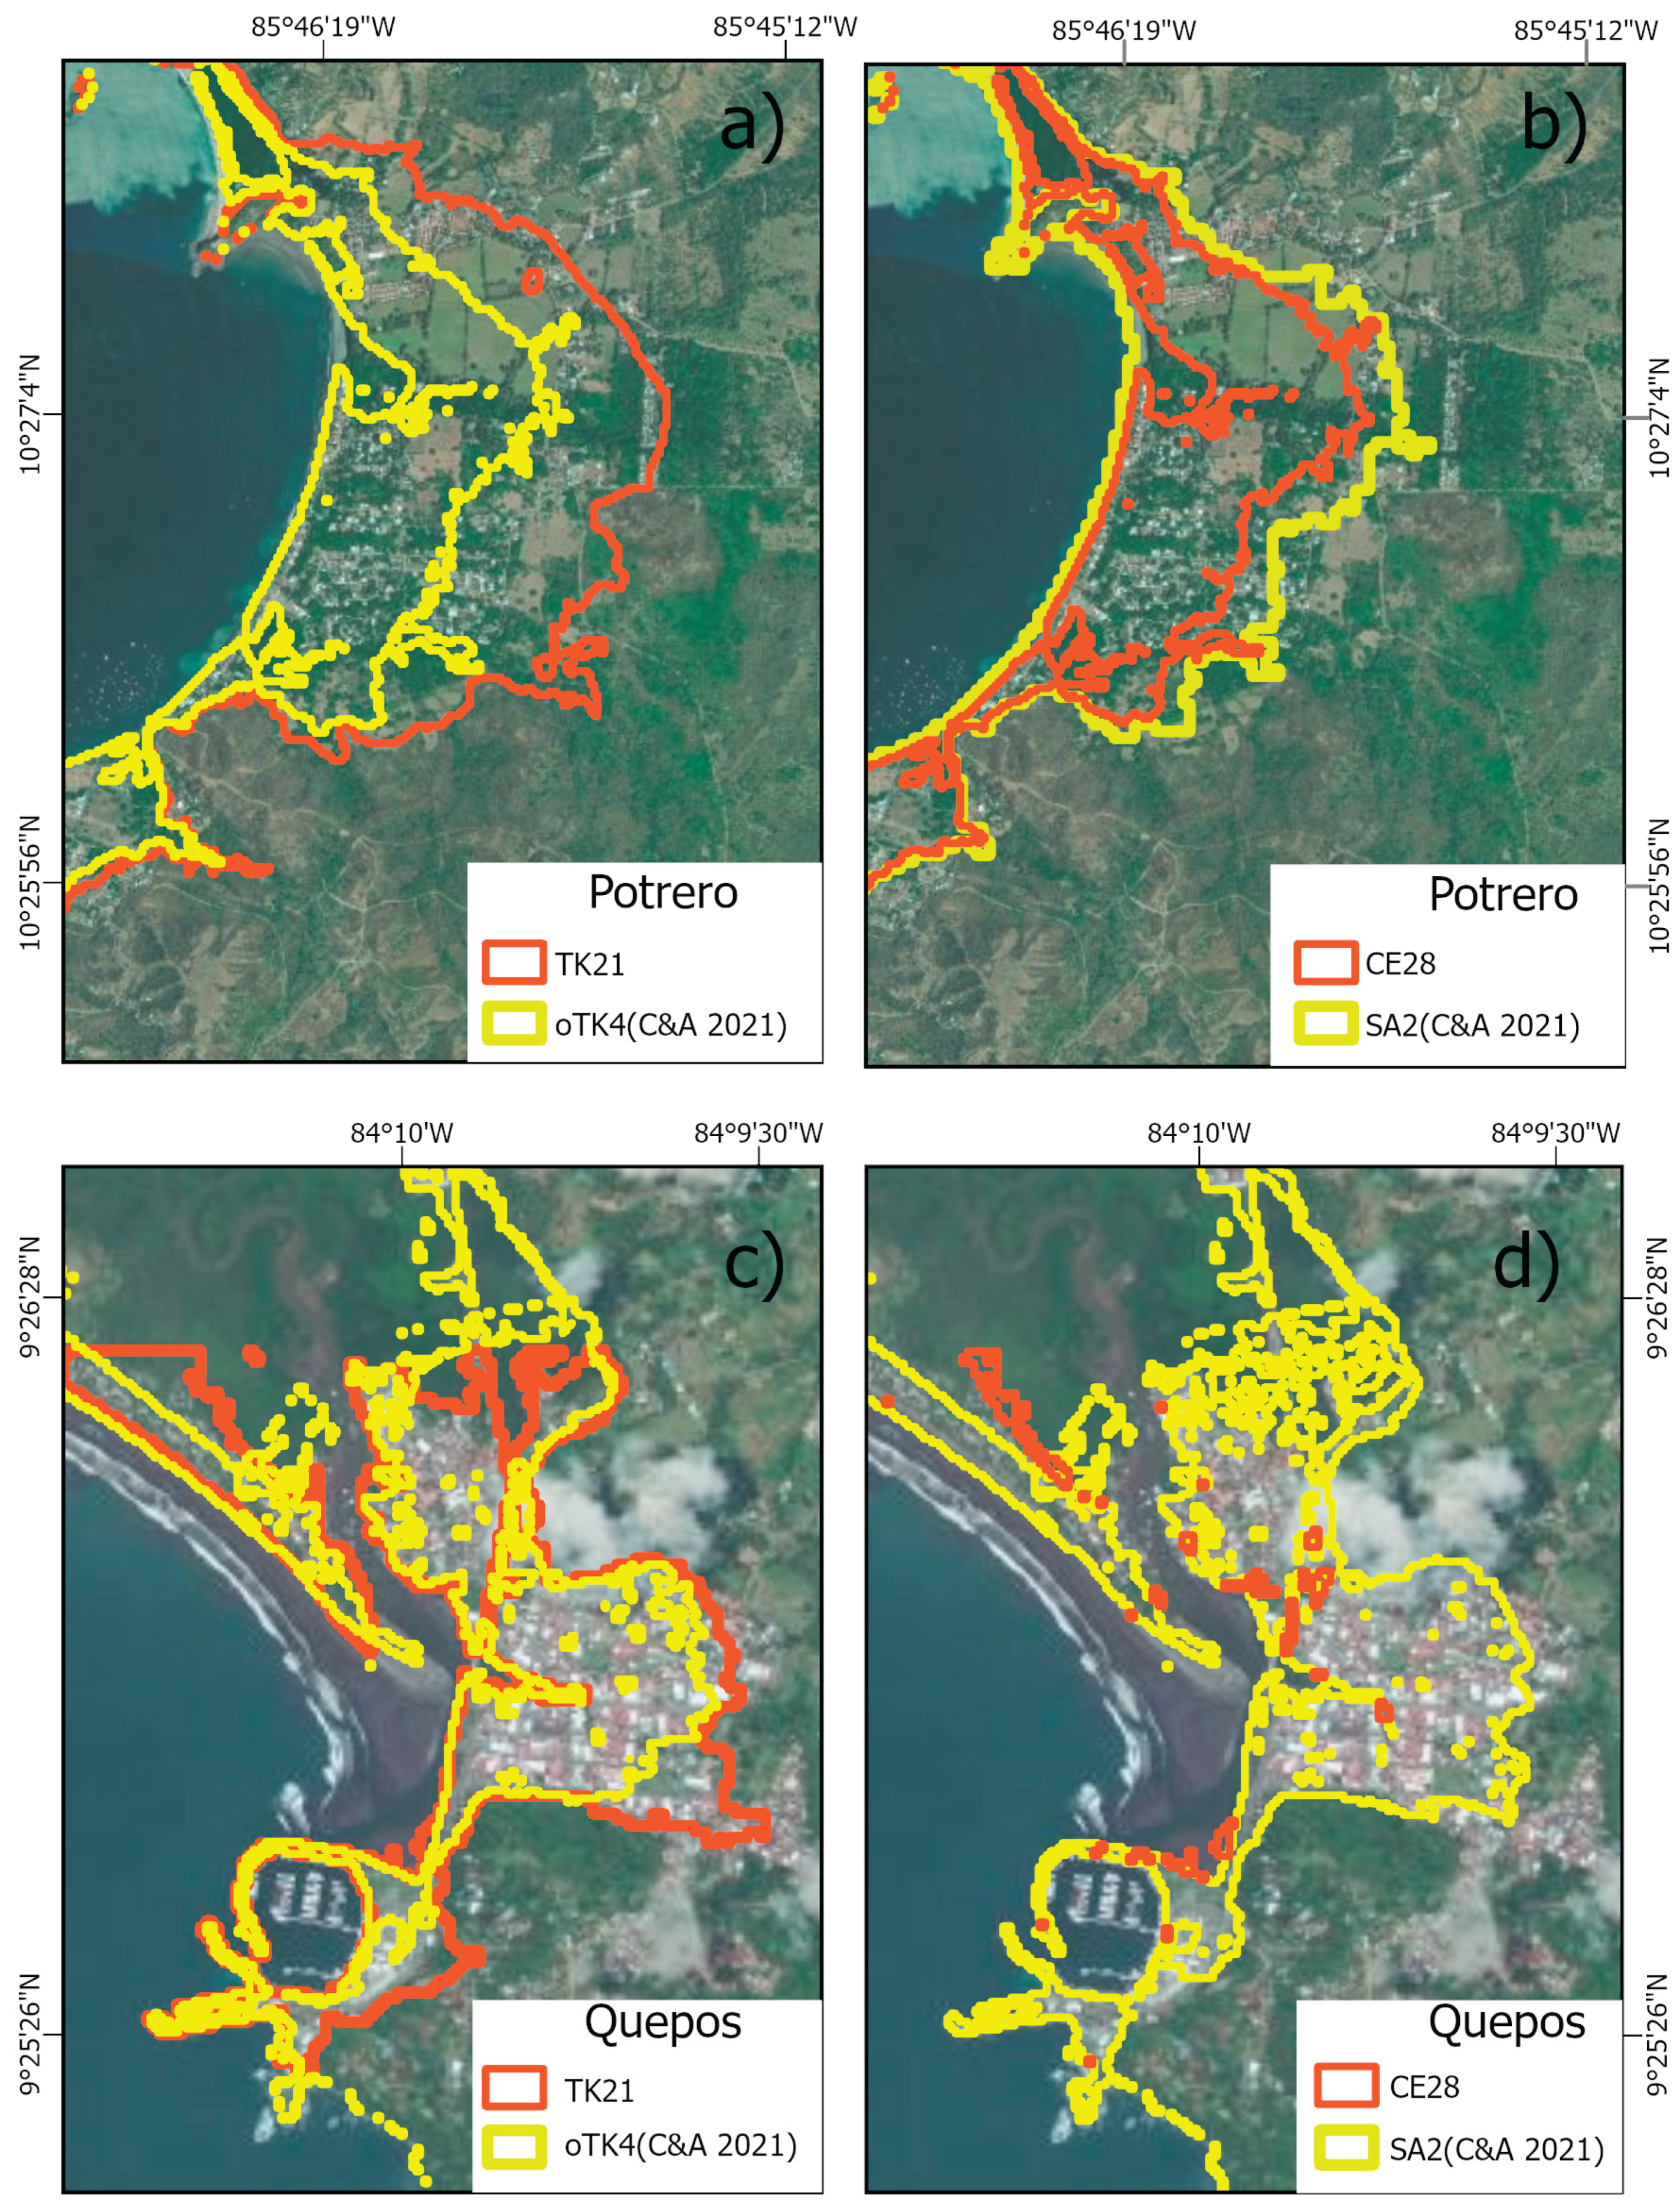
Figure 11b and a, respectively): the maximum inundation distance went from 1.065km to 1.568km. This difference was constant along the entire location requiring updating the tsunami evacuation map. Yet, it didn’t require to update the sectorization of the community for the evacuation procedures.
Regarding Quepos, the overall inundation area was smaller for both Tonga and Colombia new scenarios than for previous scenarios
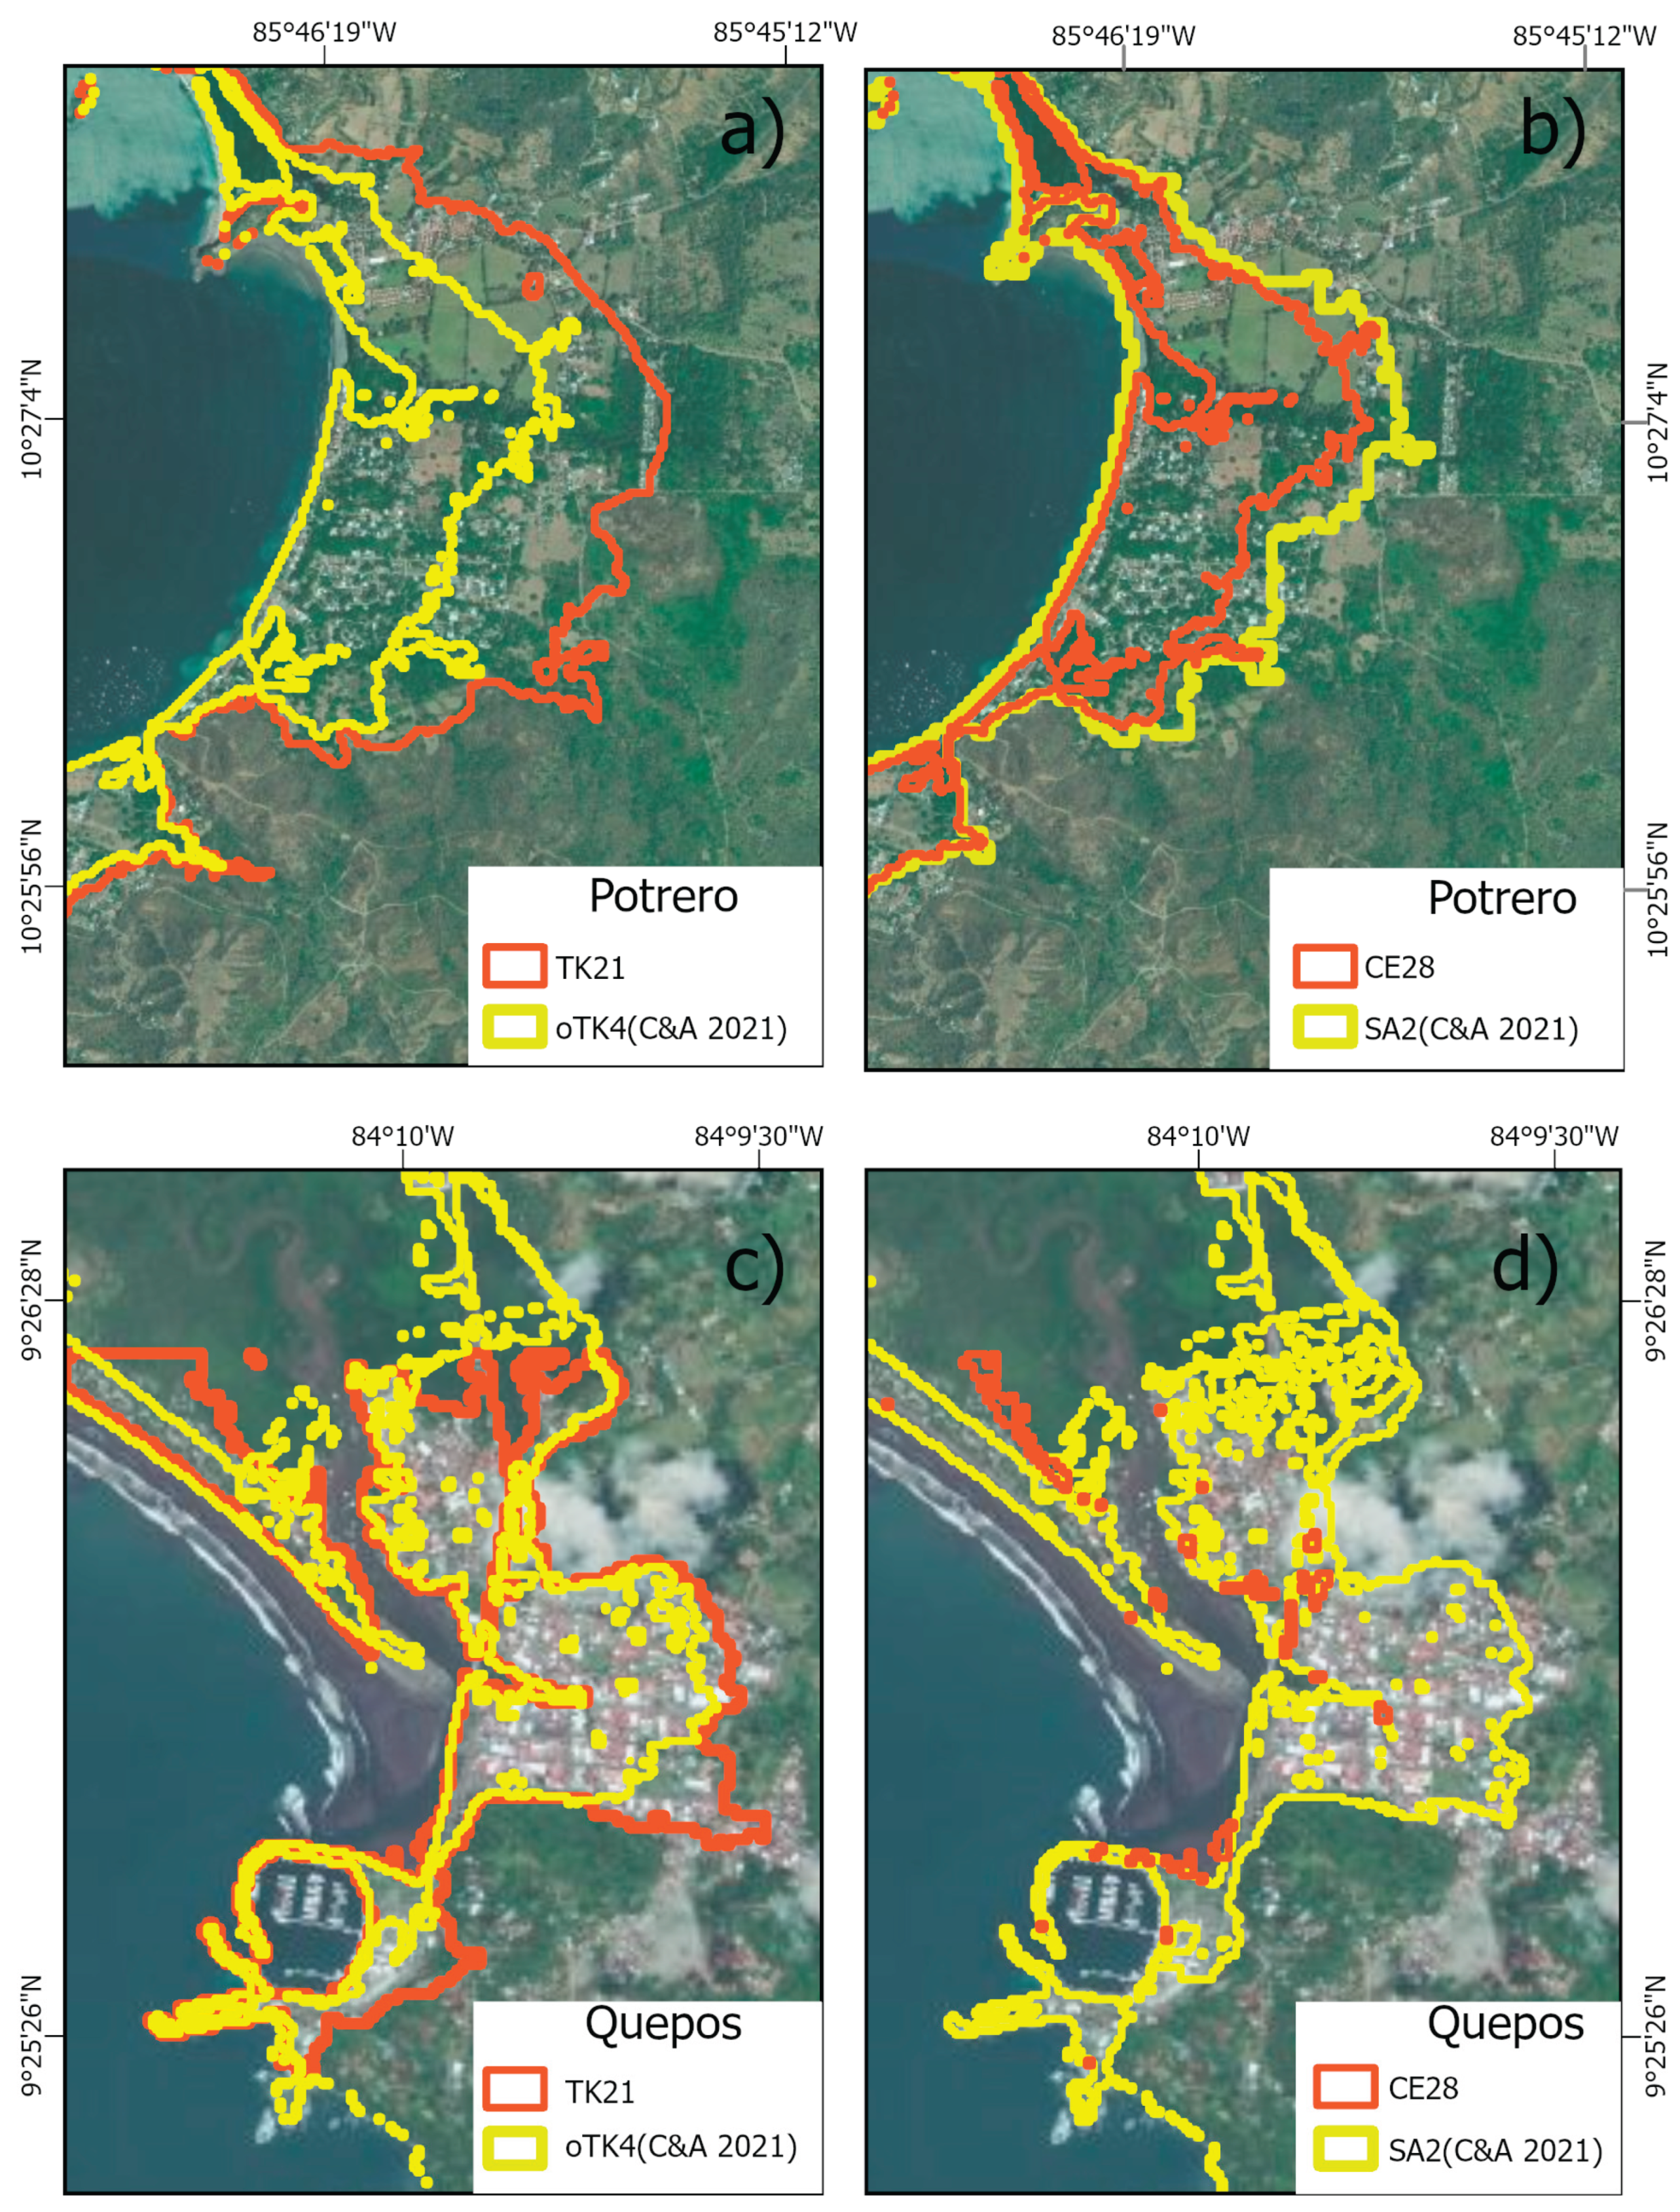
Figure 11b and d, respectively). In the mangrove, the maximum inundation distance decreased by about 400 m. However, this distance increased about 200 m in the city center, leading to the update of the tsunami evacuation map and plan.
Puntarenas is the most populated city in the Costa Rica Pacific coast, located in a sand bar 7.5 km long, with maximum width of 600 m and minimum of 70 m. The SA2 scenario of [1] was the worst for Puntarenas, having maximum flow depths of 4.29 m. However, only 1.7% of the grid had flowdepths over 3 m for that scenario (
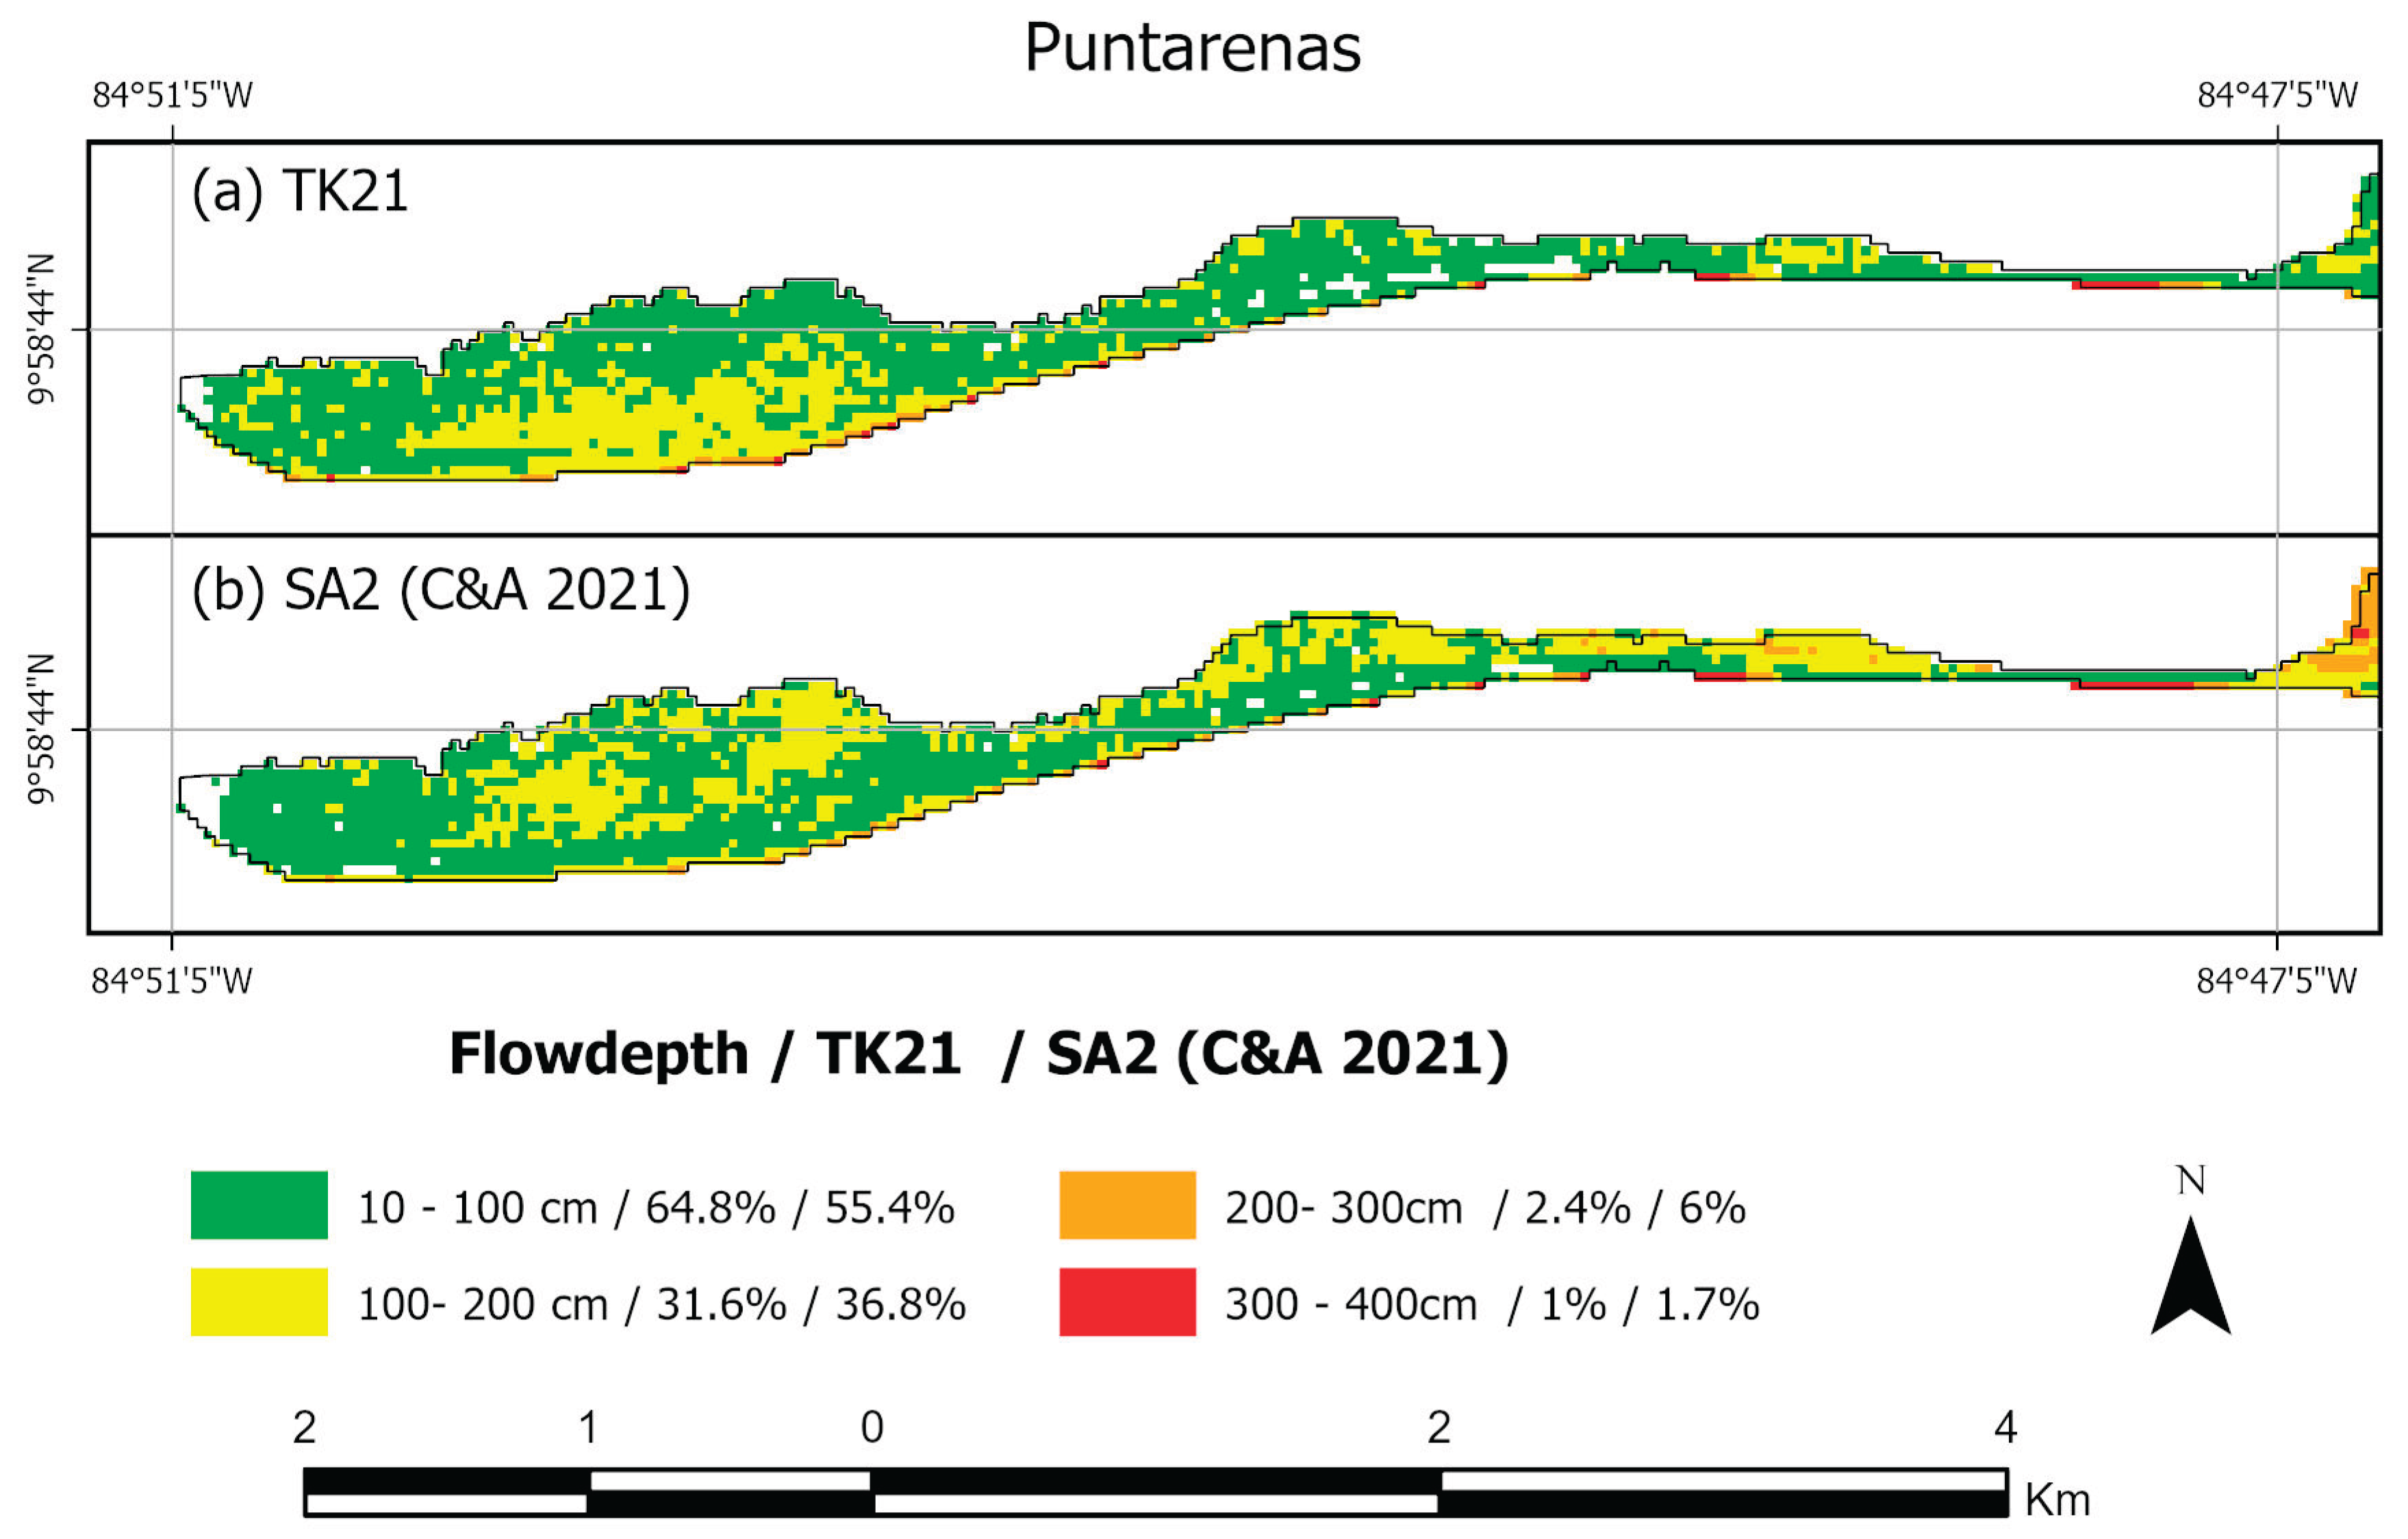
Figure 12b). The maximum flowdepths and minimum arrival times were obtained along the only terrestrial access to the city. Consequently, vertical evacuation was decided for the city of Puntarenas. In the first evacuation map elaborated, three buildings were designated as vertical assembly points, together with four horizontal assembly points: locations in the ground level inside the city but outside the inundation area. Those assembly points were not enough to host the entire population and visitors within the inundation area, but as there are many two stories’ houses, the inhabitants can evacuate to the second floor of their houses and the visitors can evacuate to the upper floors of their hotels.
In this work, the TK21 scenario had similar maximum flowdepths than the SA2 scenario. Now only 1% of the grid has flowdepths over 3 m (
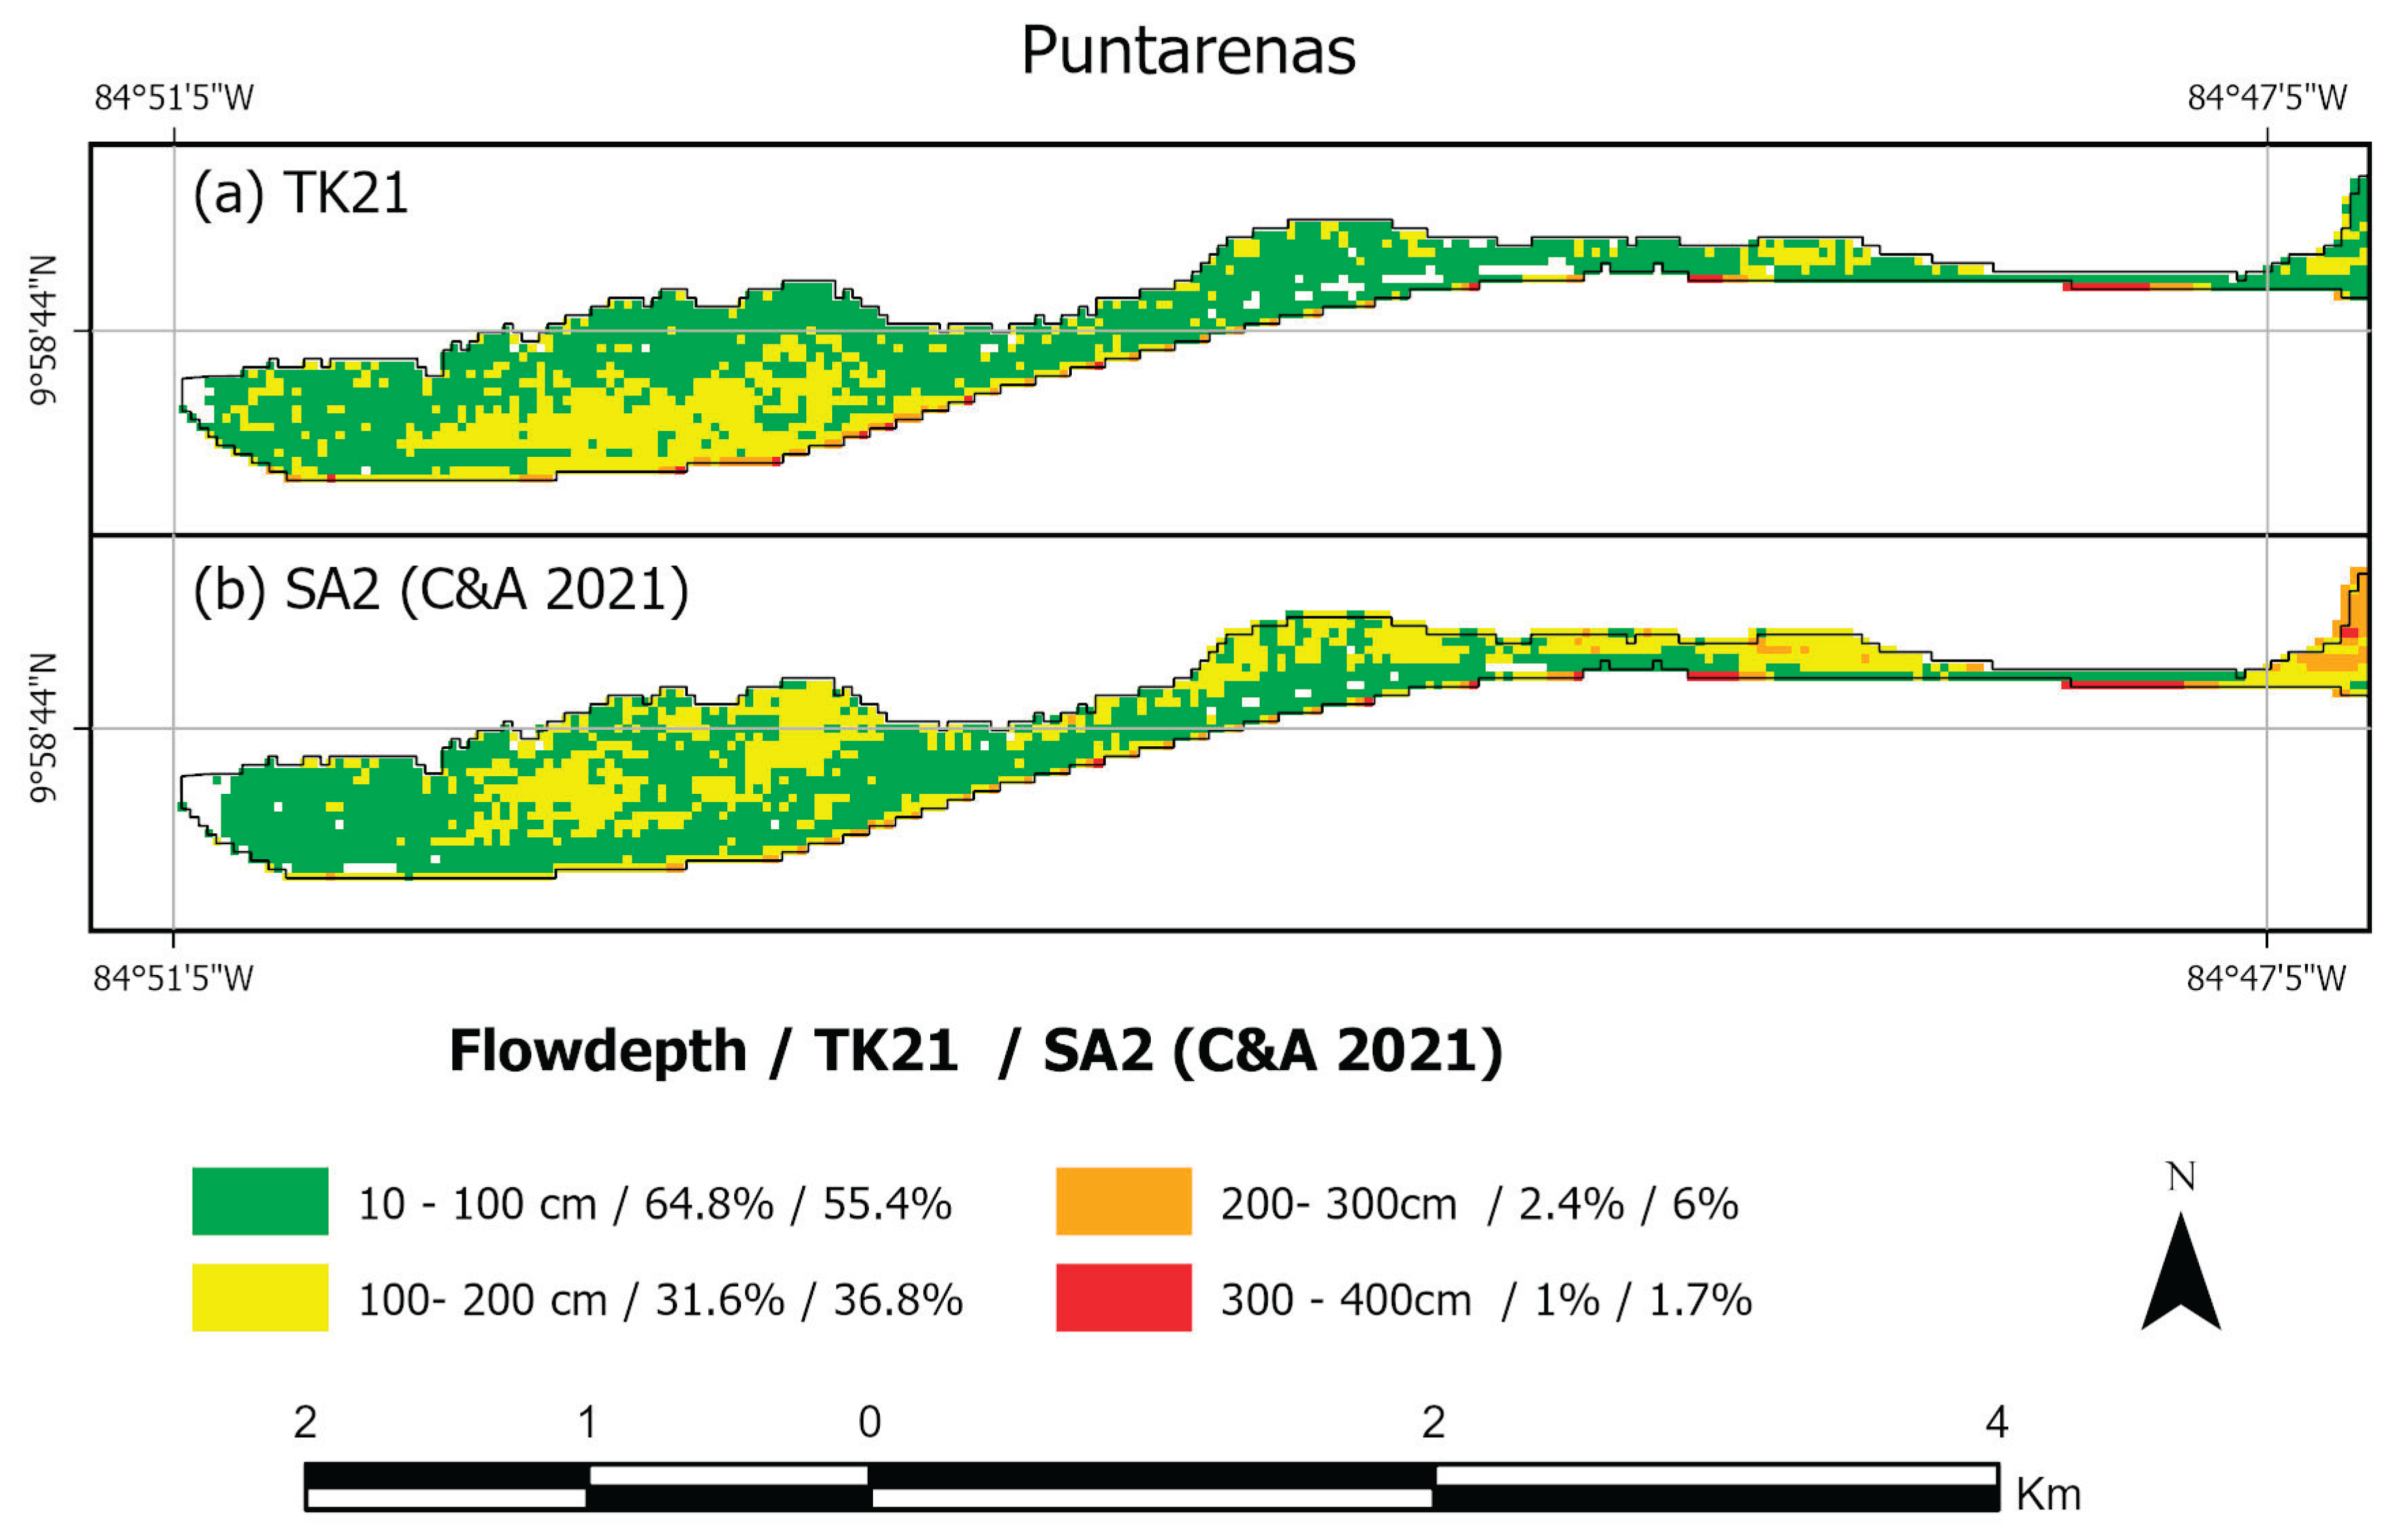
Figure 12a), but two of the former horizontal assembly points became inundated with flowdepths of 2 m, making necessary to create new assembly points and thus a new evacuation map. Yet, evacuation at the second floor of houses is still possible in most of the city.
Tsunami evacuation maps are not static tools on tsunami preparedness. They should be constantly updated, as new bathymetry is surveyed, new information on tsunami sources is published and population changes are expected. The new scenarios considered here confirmed the importance of constant review and updating if needed.
5. Conclusions
Here we modeled tsunami propagation and inundation from 28 seismic scenarios defined by experts on the Subduction Zones of Tonga-Kermadec and Colombia-Ecuador. Results from a previous tsunami hazard assessment for Costa Rica Pacific coast showed that those subduction zones represented the larger tsunami threat for the country, larger than the threat from local sources.
In general, the maximum nearshore tsunami heights and inundation areas from the regional scenarios considered here were smaller than those obtained from regional scenarios of the previous study. On the opposite, the maximum nearshore tsunami heights and the inundation areas from the distant scenarios considered here were larger than those obtained from all the scenarios considered in the previous study. To estimate the inundation areas, tsunami inundation was modeled for 13 sites where high resolution coastal bathymetry allowed it.
The results obtained from the modeling of those scenarios implied updating tsunami evacuation maps, plans and procedures for many coastal communities in Costa Rica, using refined and more trustable information.
The larger inundation areas obtained from the distant scenarios modeled here did not required major changes on tsunami evacuation procedures, due to the large arrival time of more than 14 hours. For regional scenarios, the reduction on the inundation area simplified evacuation procedures for most communities.
The modeling performed here was done with the best available bathymetric and topographic data for each model site. The scenarios modeled, defined at Experts Meeting for both Subduction Zones, are the most trustable characterization of tsunami scenarios from those subduction zones up to date because they were developed recently by experts on those zones. Also, as the aim of both meetings was for those scenarios to be used to develop tsunami evacuation maps, they were developed as worst-case scenarios, accounting for uncertainties. Therefore, the results presented here are the best available information on tsunami threat from regional and distant seismic sources for Costa Rica Pacific coast nowadays.
Nevertheless, an updated assessment for local tsunami sources is desirable, including heterogeneous slip distribution and landslides, as they might have larger tsunami heights than tsunamis from seismic sources.
Supplementary Materials
The following supporting information can be downloaded at: https://www.mdpi.com/article/doi/s1, Figure S1: Maximum tsunami heights caused by scenarios (a) TK10 and (b) TK15 of the TKSZ; Figure S2: Maximum tsunami heights caused by scenarios (a) TK04, (b) TK13, (c) TK03, (d) TK08 and (e) TK02 of the TKSZ; Figure S3: Maximum tsunami heights caused by scenarios (a) TK17, (b) TK18, (c) TK09 and (d) TK16 of the TKSZ; Figure S4: Maximum tsunami heights caused by scenarios (a) TK01, (b) TK20 and (c) TK19 of the TKSZ; Figure S5: Maximum tsunami heights caused by scenarios (a) CE25 and (b) CE26 of the CESZ.
Author Contributions
Conceptualization, S.C.-B. and F.R.-C.; methodology, S.C.-B..; software, S.C.-B., F.R.-C. and A.M.-G.; validation S.C.-B., F.R.-C., K.E.-H. and A.M.-G.; formal analysis, S.C.-B.; data curation, S.C.-B. and F.R.-C.; writing—original draft preparation, S.C.-B.; writing—review and editing, S.C.-B., F.R.-C., K.E.-H. and A.M.-G.; visualization, K.E.-H. and A.M.-G.; supervision, S.C.-B.; project administration, S.C.-B.; funding acquisition, S.C.-B.. All authors have read and agreed to the published version of the manuscript
Funding
This research was funded by a Cooperation Agreement between the UNA and the CNE.
Data Availability Statement
The datasets presented in this article are not readily available because the data has several owners and restricted use. Requests to access the datasets should be directed to corresponding author.
Conflicts of Interest
The authors declare no conflicts of interest. The funders had no role in the design of the study; in the collection, analyses, or interpretation of data; in the writing of the manuscript; or in the decision to publish the results.
Abbreviations
The following abbreviations are used in this manuscript:
| UNA | Universidad Nacional Costa Rica – National University Costa Rica |
| CNE | National Commission on Risk Prevention and Emergency Response |
| TKSZ | Tonga-Kermadec Subduction Zone |
| CESZ | Colombia-Ecuador Subduction Zone |
| ComMIT | Community Model Interface for Tsunami |
| MOST | Method of Splitting Tsunami model |
| NTH | Nearshore Tsunami Height |
References
- Chacón-Barrantes, S.; Arozarena-Llopis, I. A First Estimation of Tsunami Hazard of the Pacific Coast of Costa Rica from Local and Distant Seismogenic Sources. Ocean Dyn 2021, 71, 793–810. [Google Scholar] [CrossRef]
- UNESCO/IOC Standard Guidelines for the Tsunami Ready Recognition 2022, 62. UNESCO/IOC Standard Guidelines for the Tsunami Ready Recognition 2022, 62.
- Chacón-Barrantes, S.E.; Murillo-Gutiérrez, A.; Rivera-Cerdas, F. Catálogo de Tsunamis Históricos de Costa Rica Hasta El 2021; First ed.; EDUNA: HEREDIA, 2021. [Google Scholar]
- Porras, H.; Chacón-Barrantes, S.E.; Murillo-Gutiérrez, A.; Rivera-Cerdas, F. Tsunami de Las Islas Kermadec Del 4 de Marzo Del 2021: Registros, Modelado Numérico y Atención Del Evento Para Costa Rica. Revista de Ciencias Marinas y Costeras 2022, 14, 31–49. [Google Scholar] [CrossRef]
- Chacón-Barrantes, S.E.; Rivera-Cerdas, F.; Murillo-Gutiérrez, A. Impact of the Tsunami Caused by the Hunga Tonga–Hunga Ha’apai Eruption in Costa Rica on 15 January 2022. Bull Volcanol 2023, 85, 36. [Google Scholar] [CrossRef] [PubMed]
- Rojas, W.; Alvarado, G.E. Marco Geológico y Tectónico de La Isla Del Coco y La Región Marítima Circunvecina, Costa Rica. Rev Biol Trop 2012, 60, 15–32. [Google Scholar] [CrossRef]
- Chacón-Barrantes, S.; Gutiérrez-Echeverría, A. Tsunamis Recorded in Tide Gauges at Costa Rica Pacific Coast and Their Numerical Modeling. Natural Hazards 2017, 89, 295–311. [Google Scholar] [CrossRef]
- UNESCO-IOC Experts Meeting on Tsunami Sources, Hazards, Risk and Uncertainties Associated with the Tonga-Kermadec Subduction Zone 2020, 49.
- UNESCO-IOC Tsunami Sources, Hazards, Risk and Uncertainties Associated with the Colombia-Ecuador Subduction Zone 2021, 37.
- Titov, V. v.; Moore, C.; Greenslade, D.J.M.; Pattiaratchi, C.; Badal, R.; Synolakis, C.E.; Kanoglu, U. A New Tool for Inundation Modeling: Community Modeling Interface for Tsunamis (ComMIT). Pure Appl Geophys 2011, 168, 2121–2131. [Google Scholar] [CrossRef]
- Chacón-Barrantes, S. The 2017 México Tsunami Record, Numerical Modeling and Threat Assessment in Costa Rica. Pure Appl Geophys 2018, 175, 1939–1950. [Google Scholar] [CrossRef]
- Borrero, J.C.; Greer, S.D. Comparison of the 2010 Chile and 2011 Japan Tsunamis in the Far Field. Pure Appl Geophys 2013, 170, 1249–1274. [Google Scholar] [CrossRef]
Figure 1.
Locations where tsunamis from Tonga-Kermadec (pink circles) and Colombia-Ecuador (green circles) subduction zones were recorded in Costa Rica. The number represents the maximum impact of the tsunami: 0 instrumental record, 1 sea level changes, 2 strong currents, 3 flooding, 4 damages by currents and 5 damages by flooding, according with the impact scale defined in [3].
Figure 1.
Locations where tsunamis from Tonga-Kermadec (pink circles) and Colombia-Ecuador (green circles) subduction zones were recorded in Costa Rica. The number represents the maximum impact of the tsunami: 0 instrumental record, 1 sea level changes, 2 strong currents, 3 flooding, 4 damages by currents and 5 damages by flooding, according with the impact scale defined in [3].
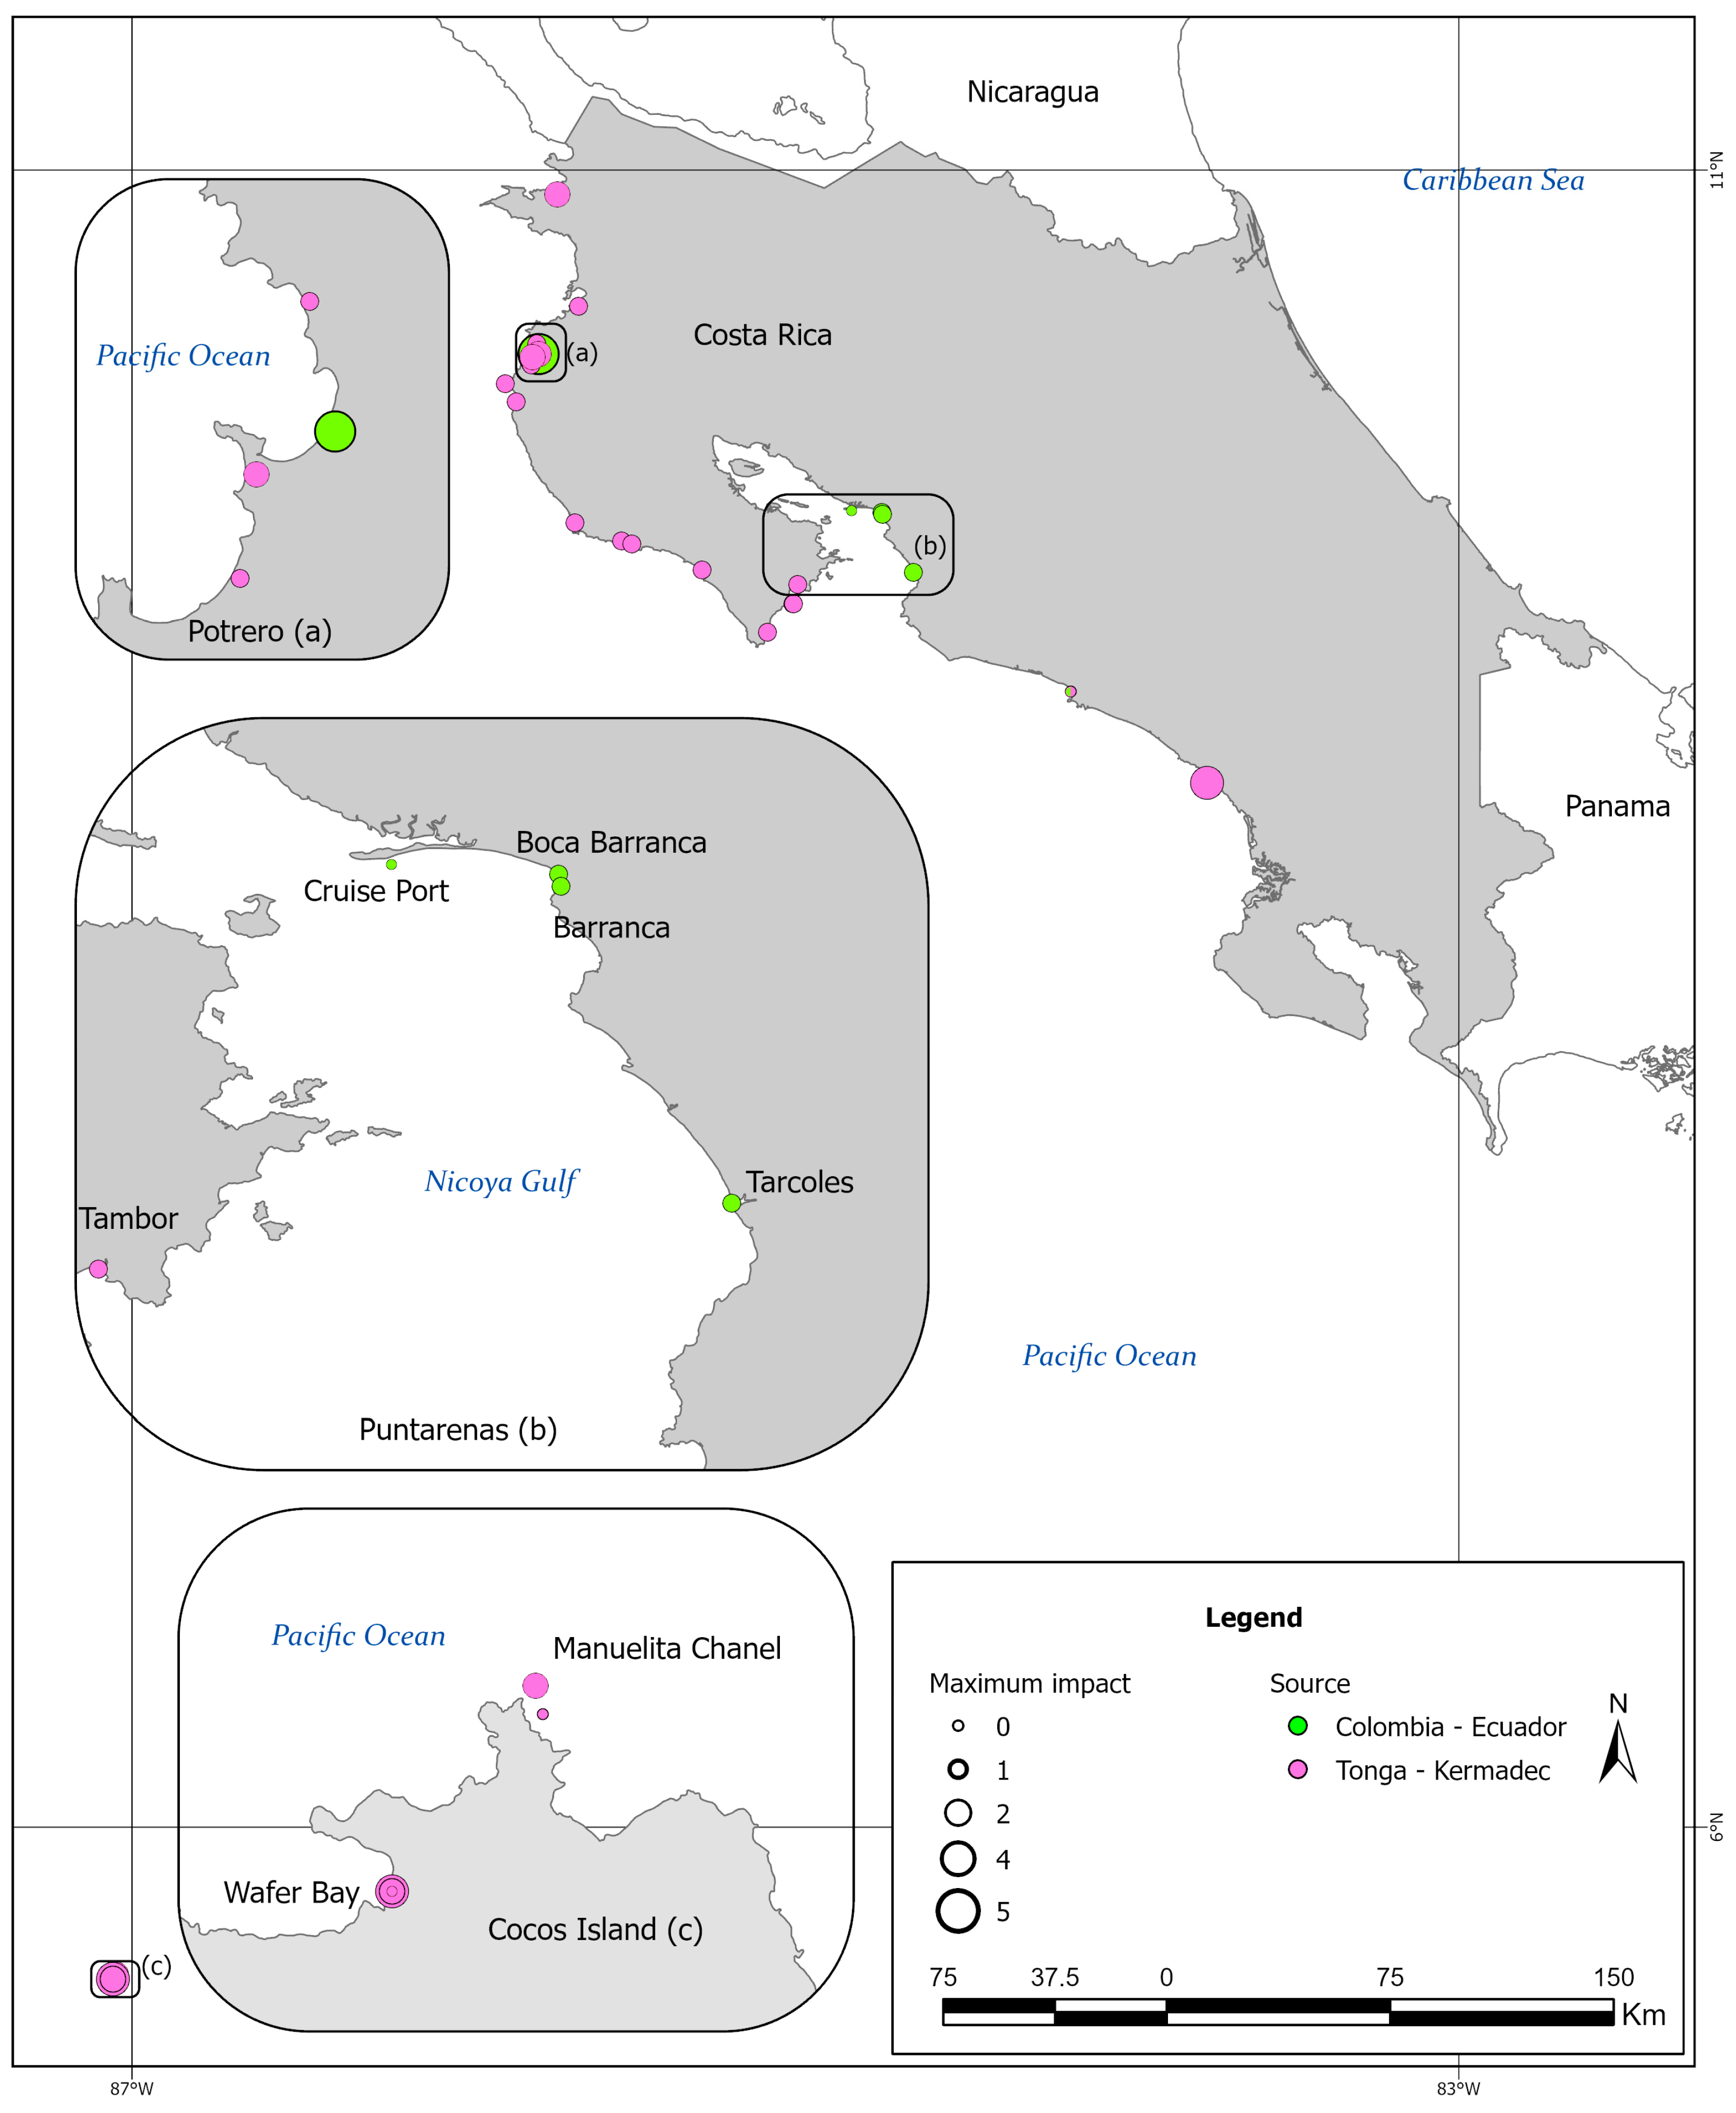
Figure 2.
Comparison of fault planes along the Tonga-Kermadec Subduction Zone employed for (a) the scenarios modeled in this work and (b) the scenarios modeled in [1]. Some scenarios modeled here are a combination of single scenarios in (a). The scenario having the maximum tsunami heights is shown in red and blue in (a): EM21 (H+A+B+C+D) and in red in (b): oTK4. Epicenters of earthquakes causing tsunamis recorded in Costa Rica are shown with black squares and Hunga Tonga – Hunga Ha’apai volcano is shown with a black triangle.
Figure 2.
Comparison of fault planes along the Tonga-Kermadec Subduction Zone employed for (a) the scenarios modeled in this work and (b) the scenarios modeled in [1]. Some scenarios modeled here are a combination of single scenarios in (a). The scenario having the maximum tsunami heights is shown in red and blue in (a): EM21 (H+A+B+C+D) and in red in (b): oTK4. Epicenters of earthquakes causing tsunamis recorded in Costa Rica are shown with black squares and Hunga Tonga – Hunga Ha’apai volcano is shown with a black triangle.
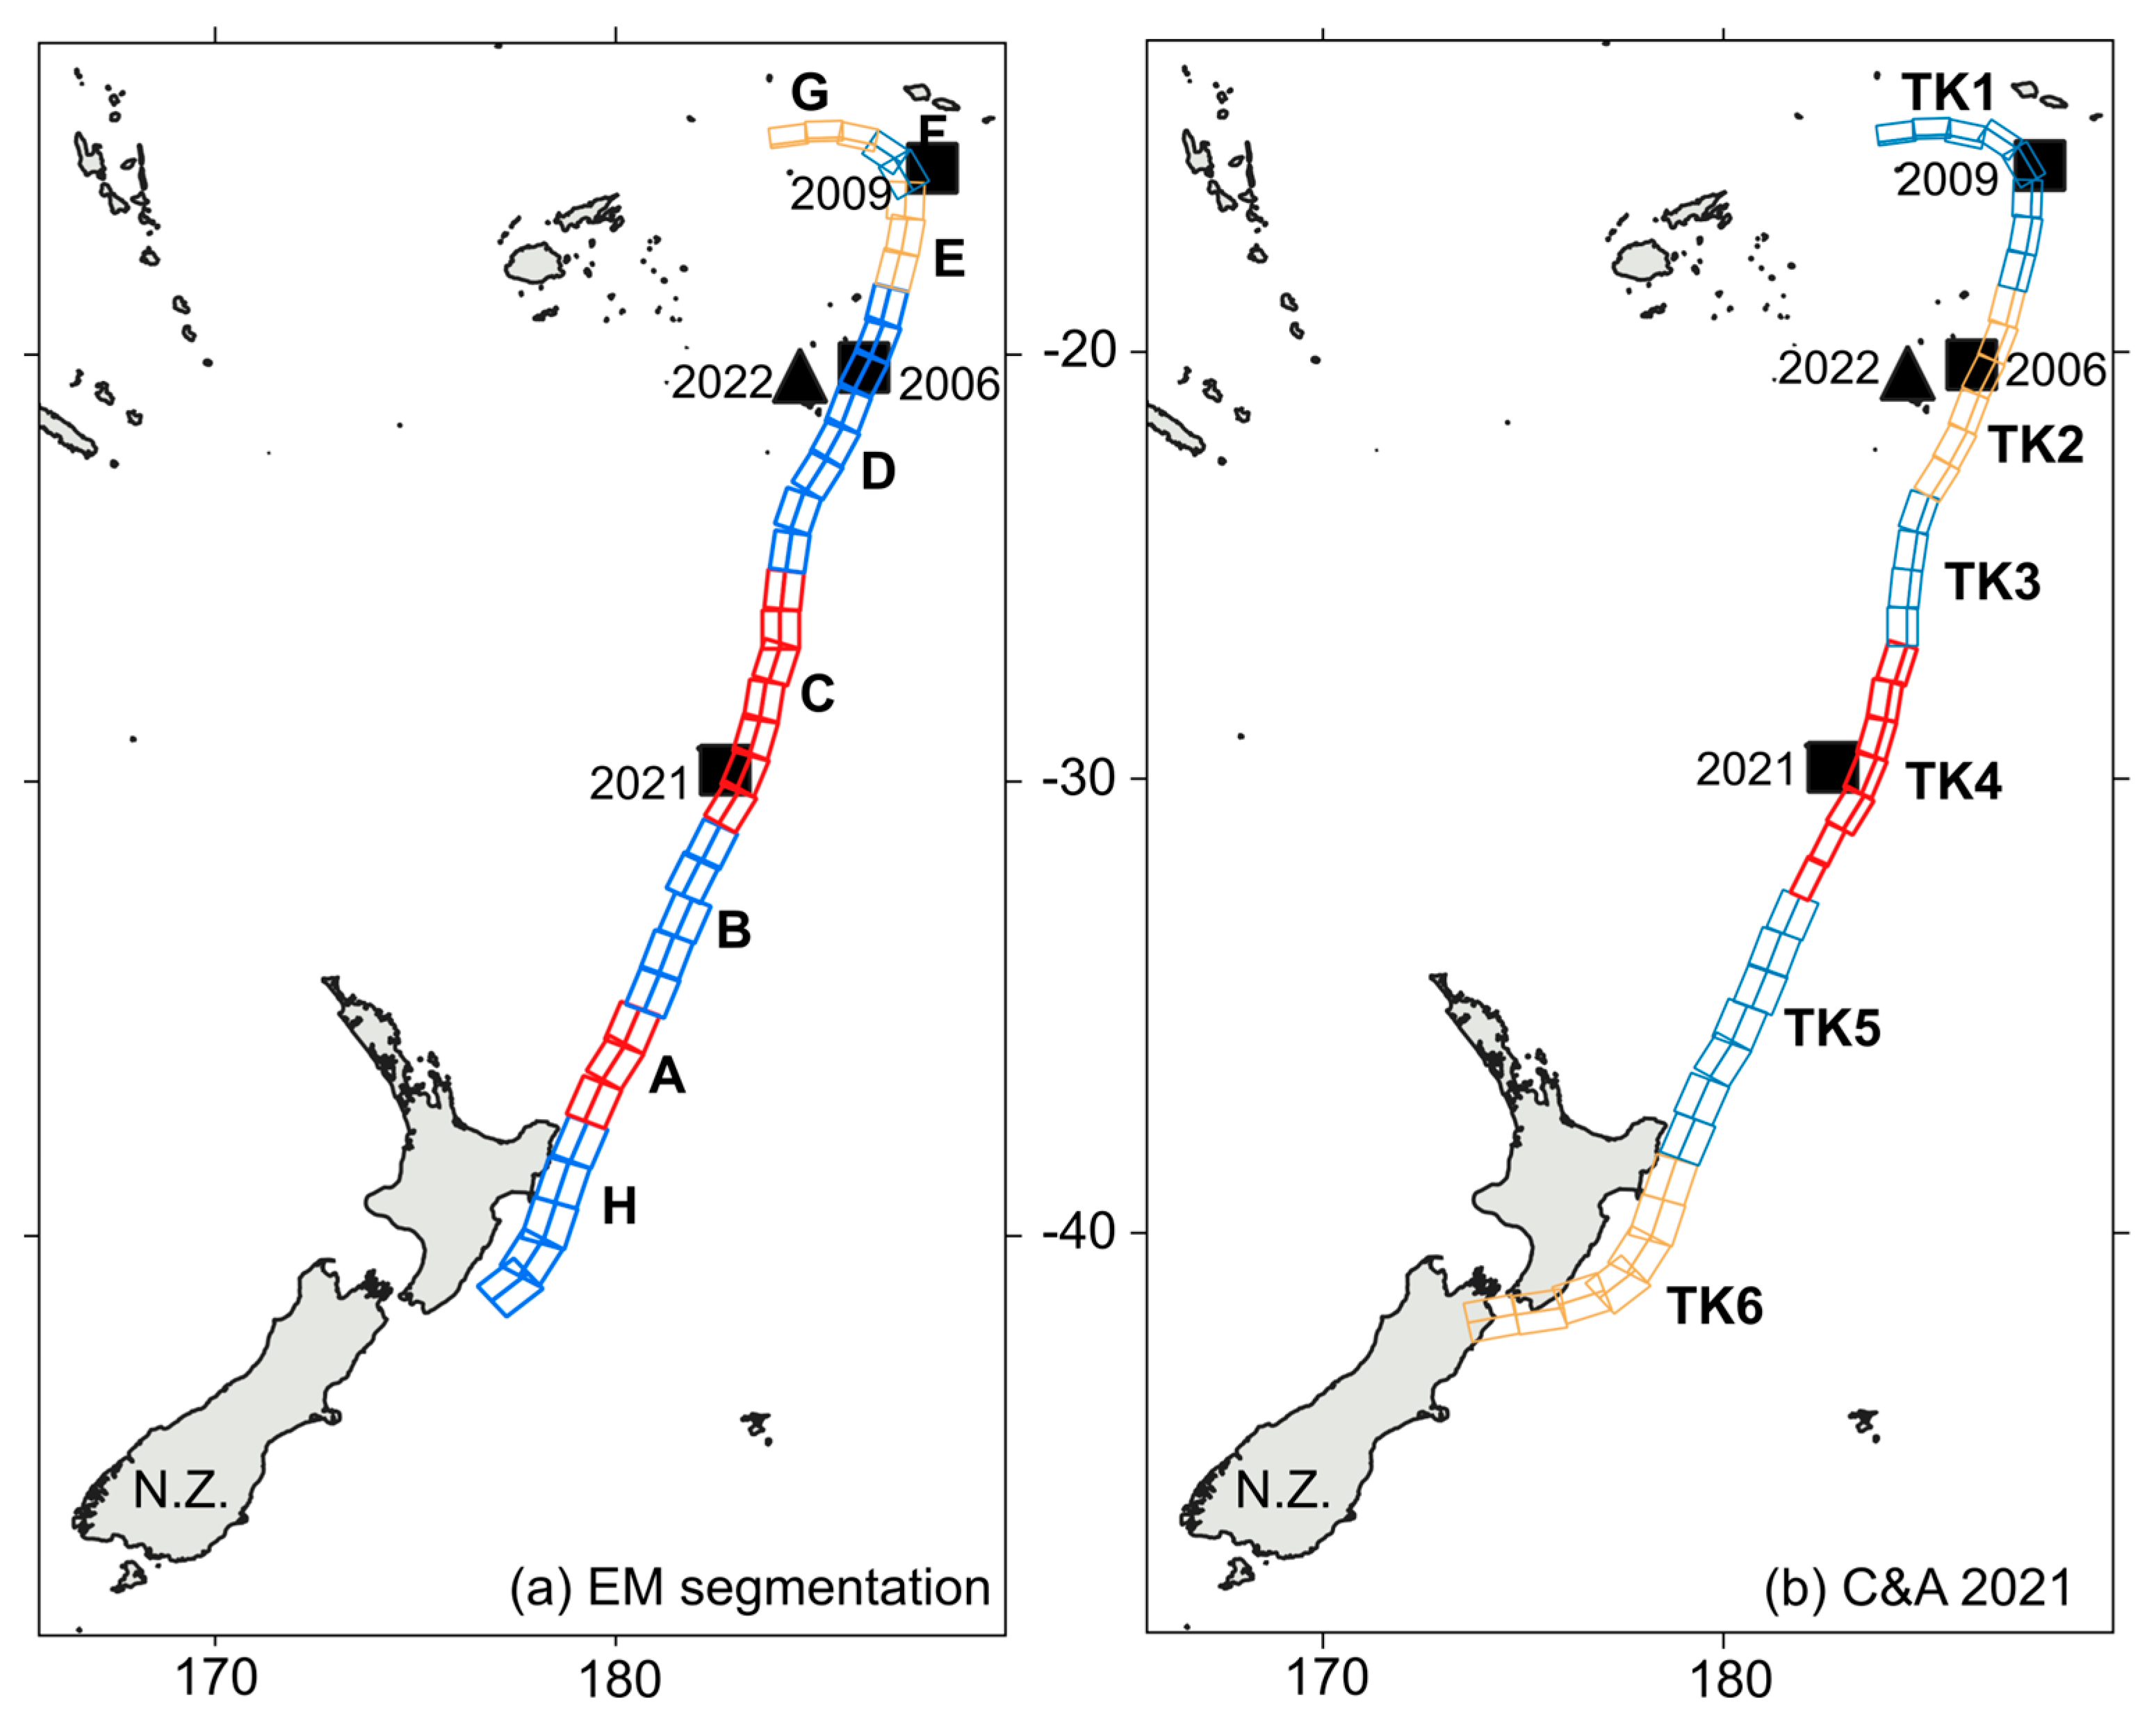
Figure 3.
Comparison of fault planes along the Colombia-Ecuador Subduction Zone employed for (a) the scenarios modeled in this work and (b) the scenarios modeled in [1]. The scenario having the maximum tsunami heights is shown in red and blue in (a): EM28 (Galera 1 + Galera 2) and in red in (b) SA2. Epicenters of earthquakes causing tsunamis recorded in Costa Rica are shown with black squares.
Figure 3.
Comparison of fault planes along the Colombia-Ecuador Subduction Zone employed for (a) the scenarios modeled in this work and (b) the scenarios modeled in [1]. The scenario having the maximum tsunami heights is shown in red and blue in (a): EM28 (Galera 1 + Galera 2) and in red in (b) SA2. Epicenters of earthquakes causing tsunamis recorded in Costa Rica are shown with black squares.
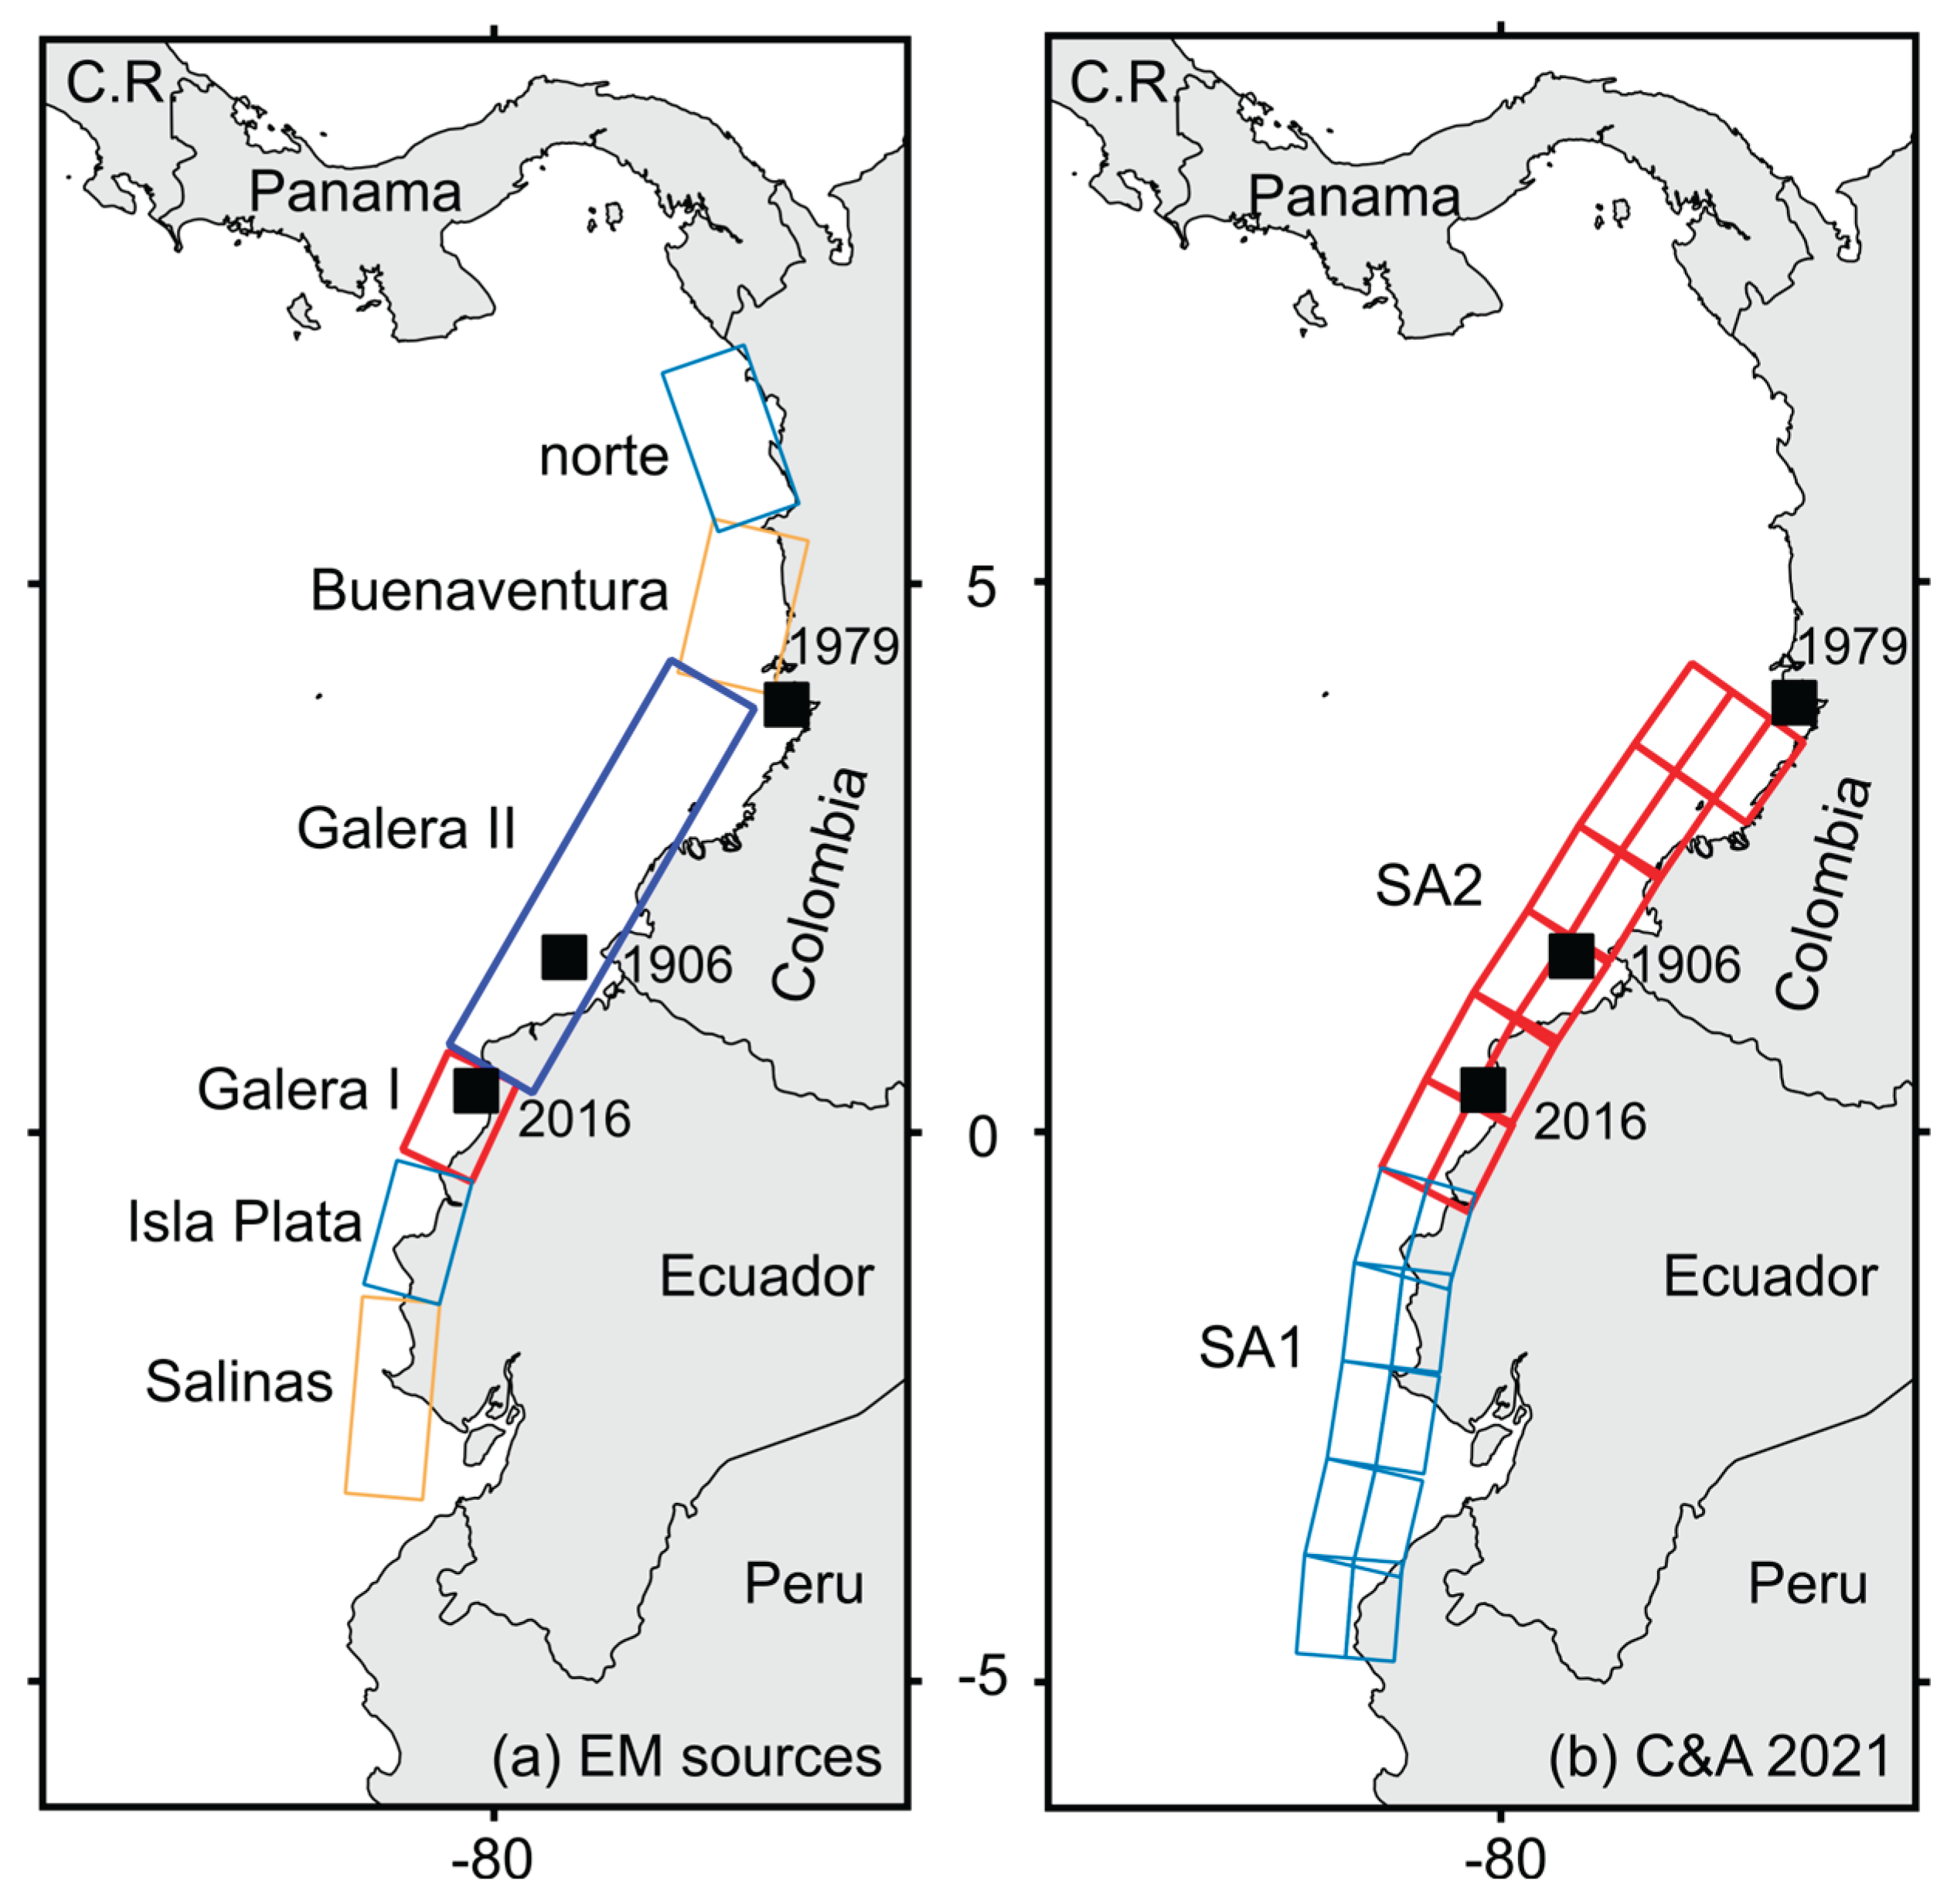
Figure 4.
Tsunami records (black line) and model results (red line) of the (a) 2006 Tonga tsunami at Quepos tide gauge, and of the 2021 Kermadec Islands tsunami at (b) Coco’s Island tide gauge and (c) Quepos tide gauge. Also, tsunami records of the 2022 Hunga Tonga – Hunga Ha’apai (HTHH) tsunami at (d) Quepos tide gauge and (e) Cocos Island tide gauge. Panel (a) was modified from [7], panels (b) and (c) were modified from [4], panels (d) and (e) were modified from [5].
Figure 4.
Tsunami records (black line) and model results (red line) of the (a) 2006 Tonga tsunami at Quepos tide gauge, and of the 2021 Kermadec Islands tsunami at (b) Coco’s Island tide gauge and (c) Quepos tide gauge. Also, tsunami records of the 2022 Hunga Tonga – Hunga Ha’apai (HTHH) tsunami at (d) Quepos tide gauge and (e) Cocos Island tide gauge. Panel (a) was modified from [7], panels (b) and (c) were modified from [4], panels (d) and (e) were modified from [5].
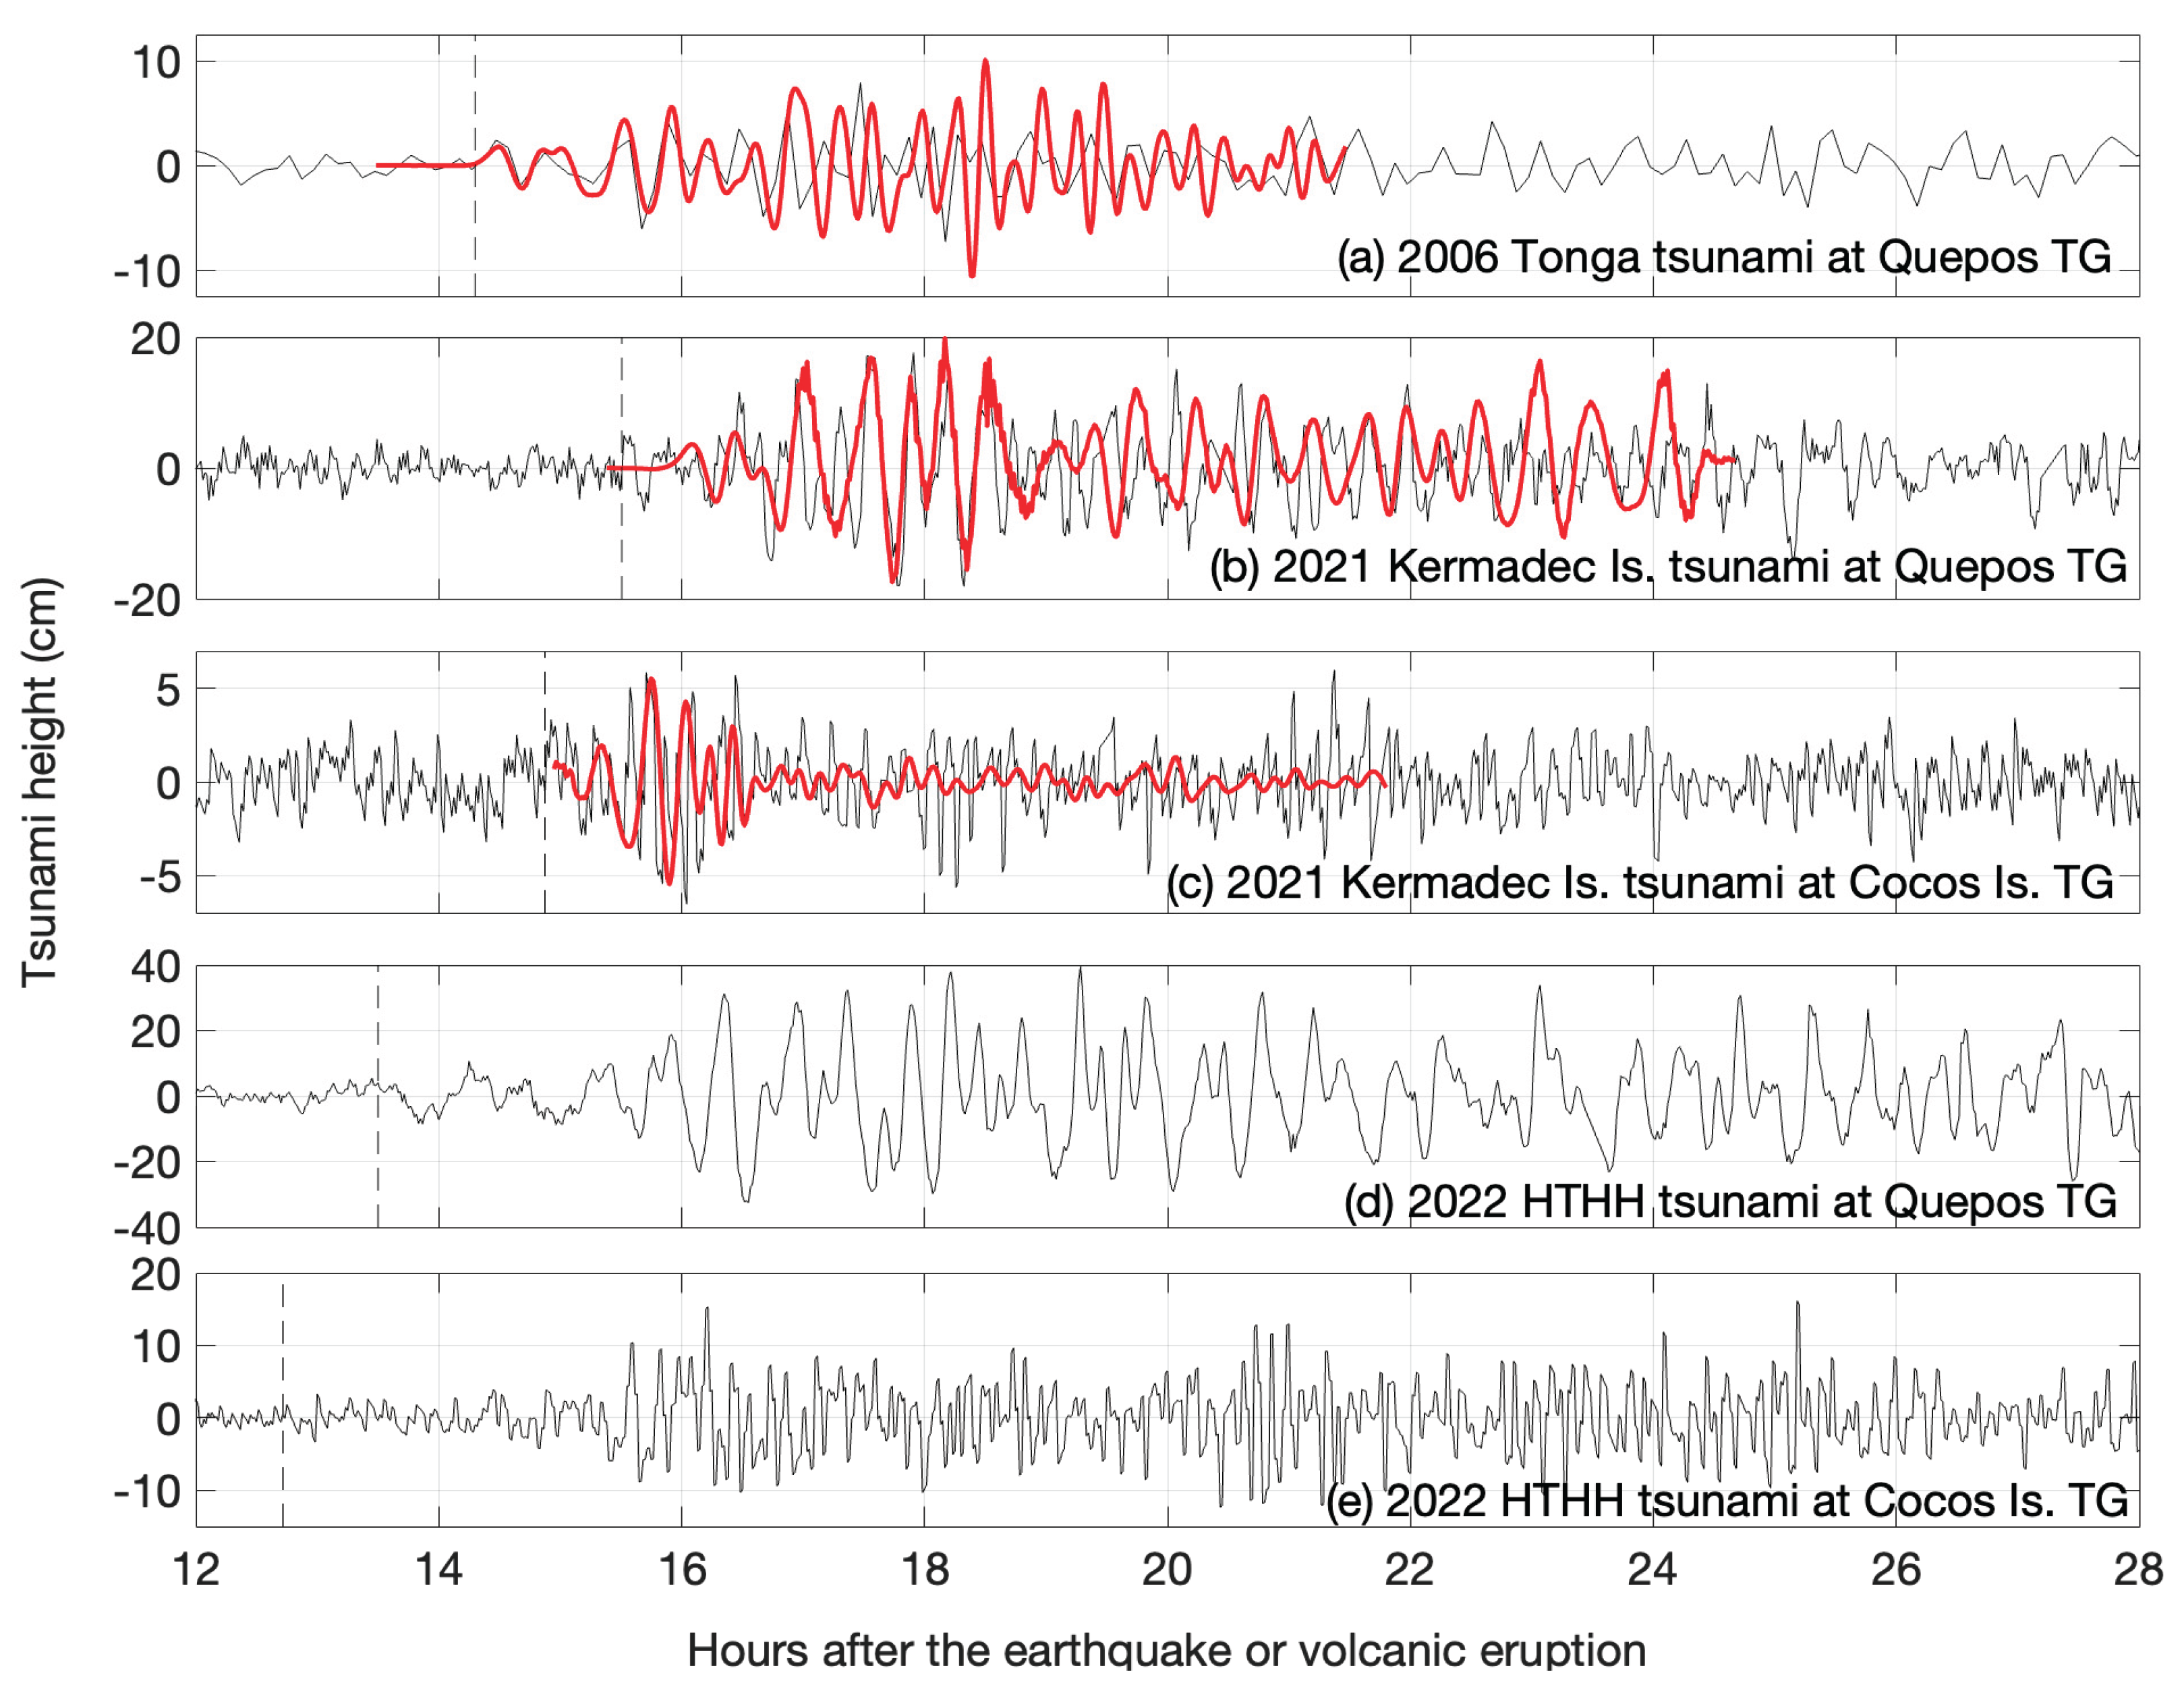
Figure 5.
Tsunami records (black line) and model results (red line) of the (a) 1979 Colombia tsunami at Puntarenas tide gauge, (b) 2016 Ecuador tsunami at Quepos tide gauge. Panel (a) was modified from [7]. Data in panel (b) has not been published before.
Figure 5.
Tsunami records (black line) and model results (red line) of the (a) 1979 Colombia tsunami at Puntarenas tide gauge, (b) 2016 Ecuador tsunami at Quepos tide gauge. Panel (a) was modified from [7]. Data in panel (b) has not been published before.
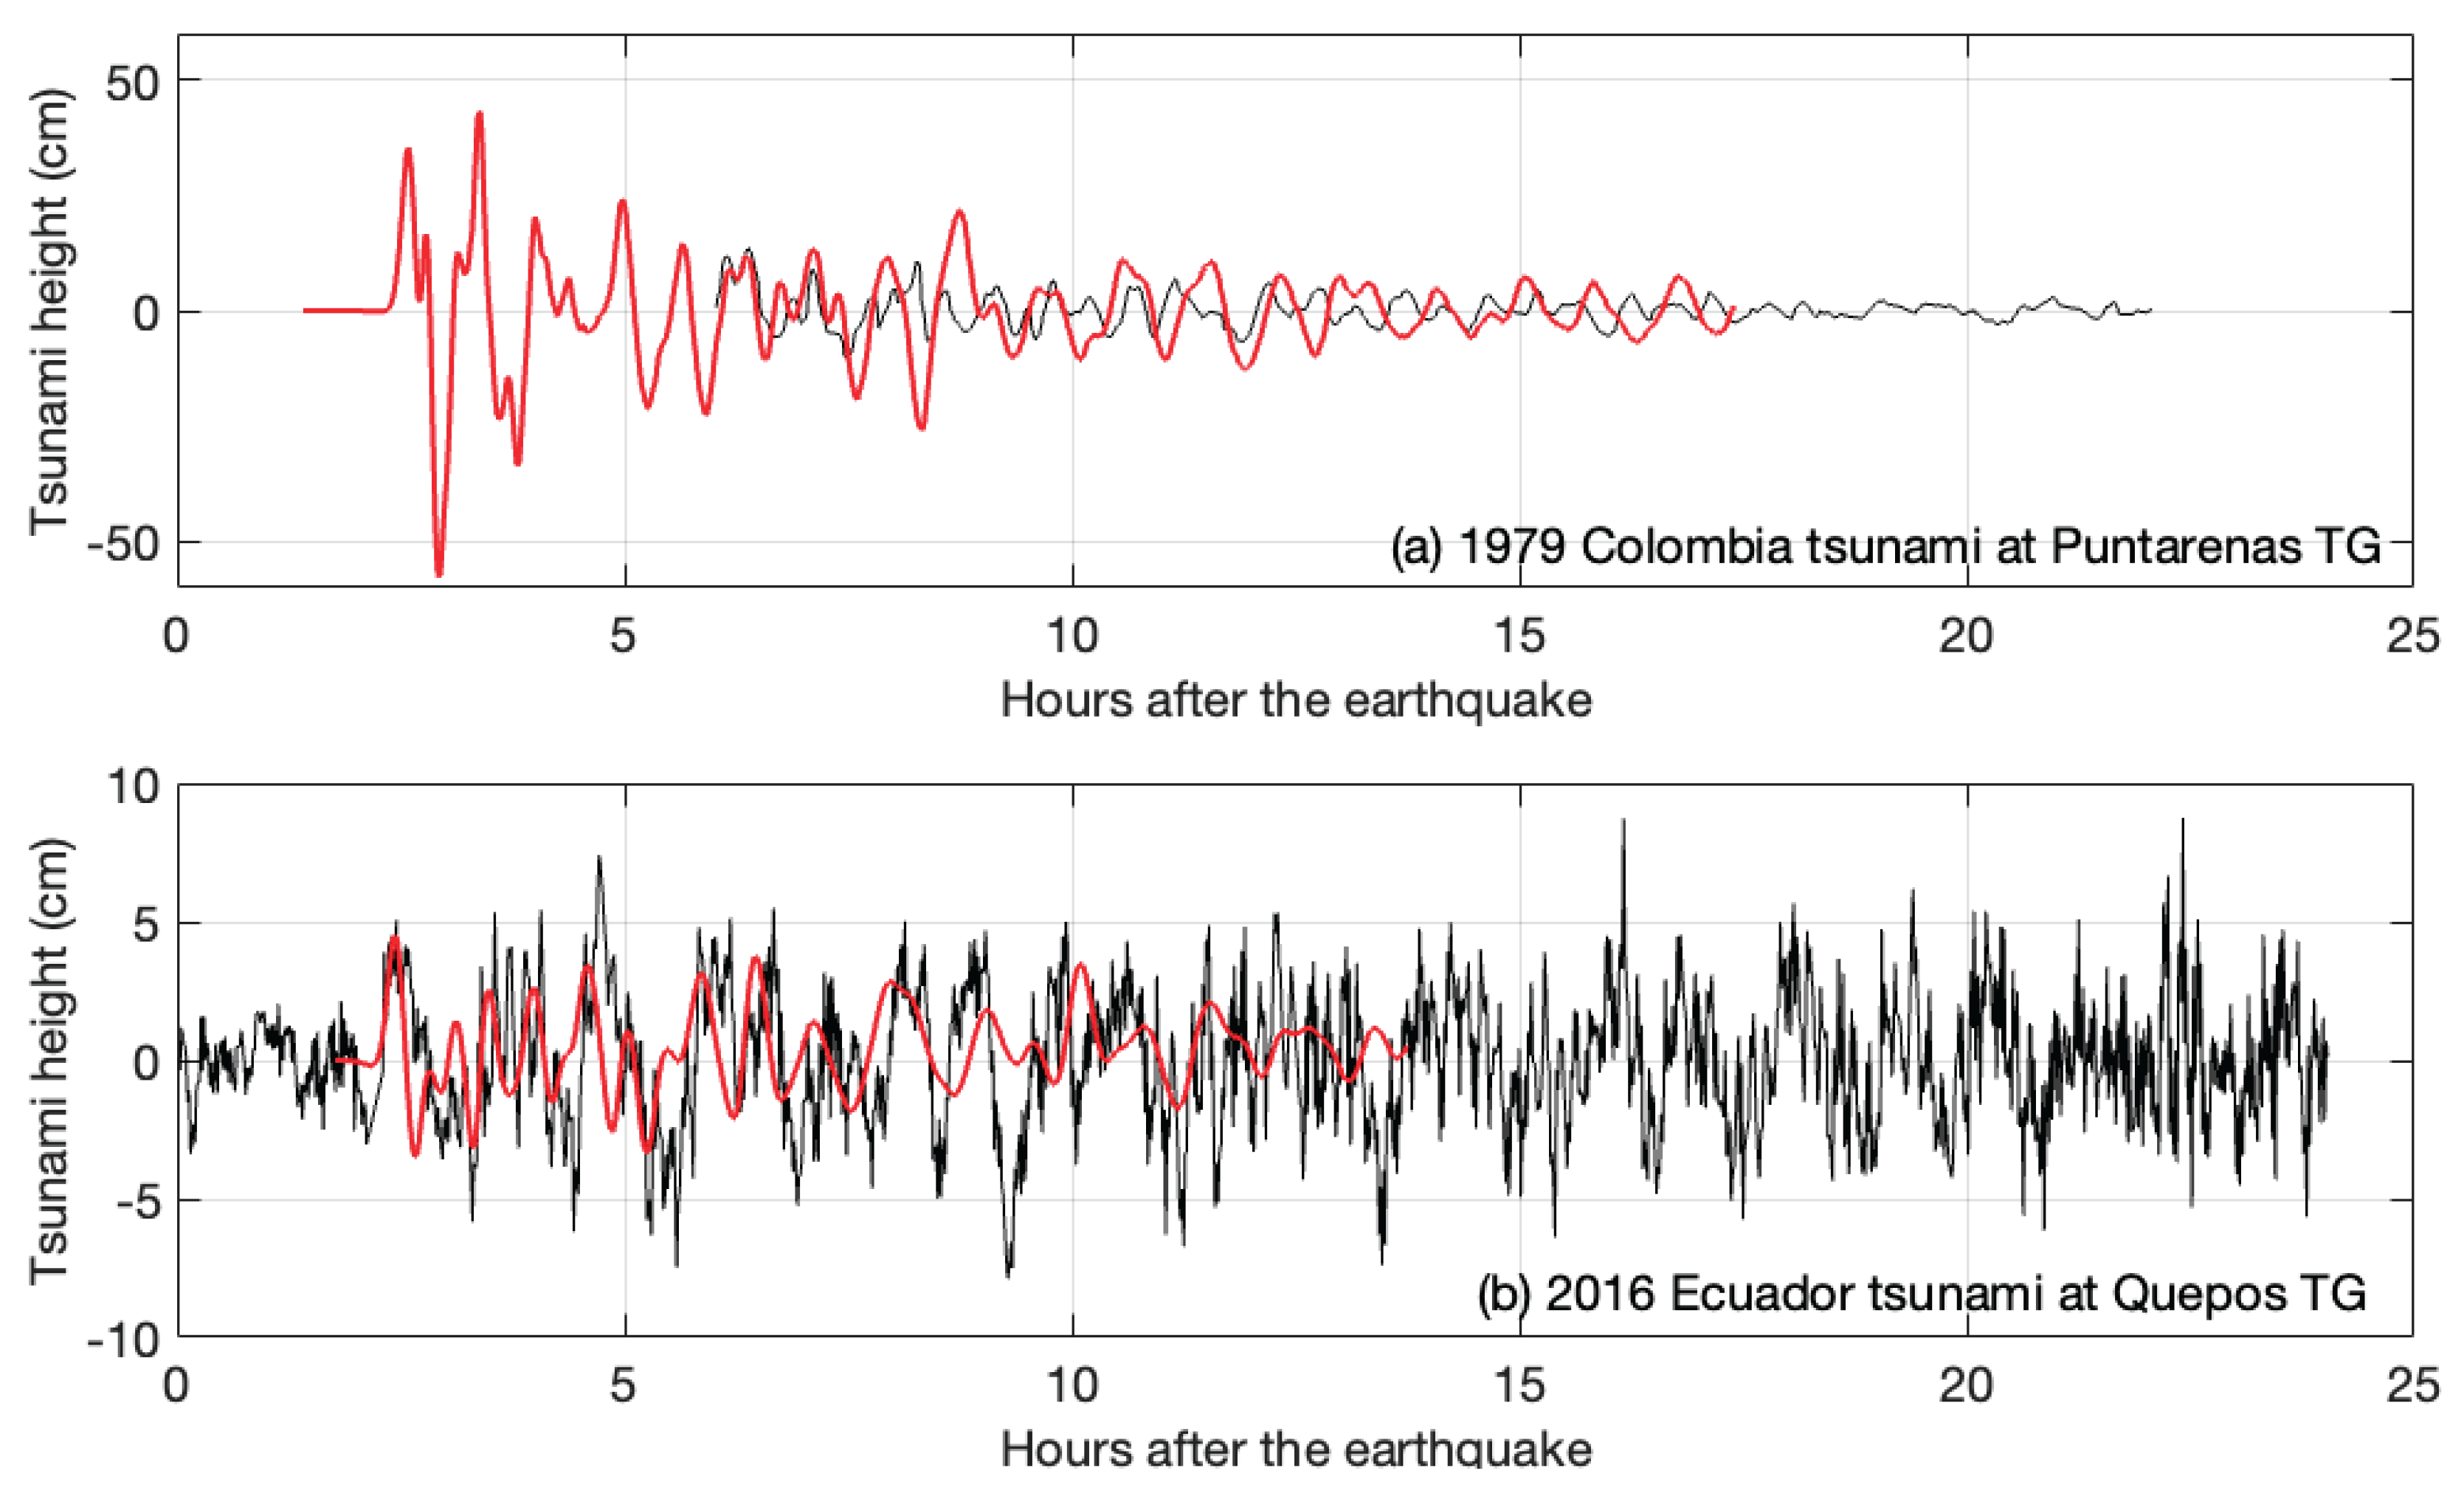
Figure 6.
Extent of the inundation grids employed here for tsunami modeling.
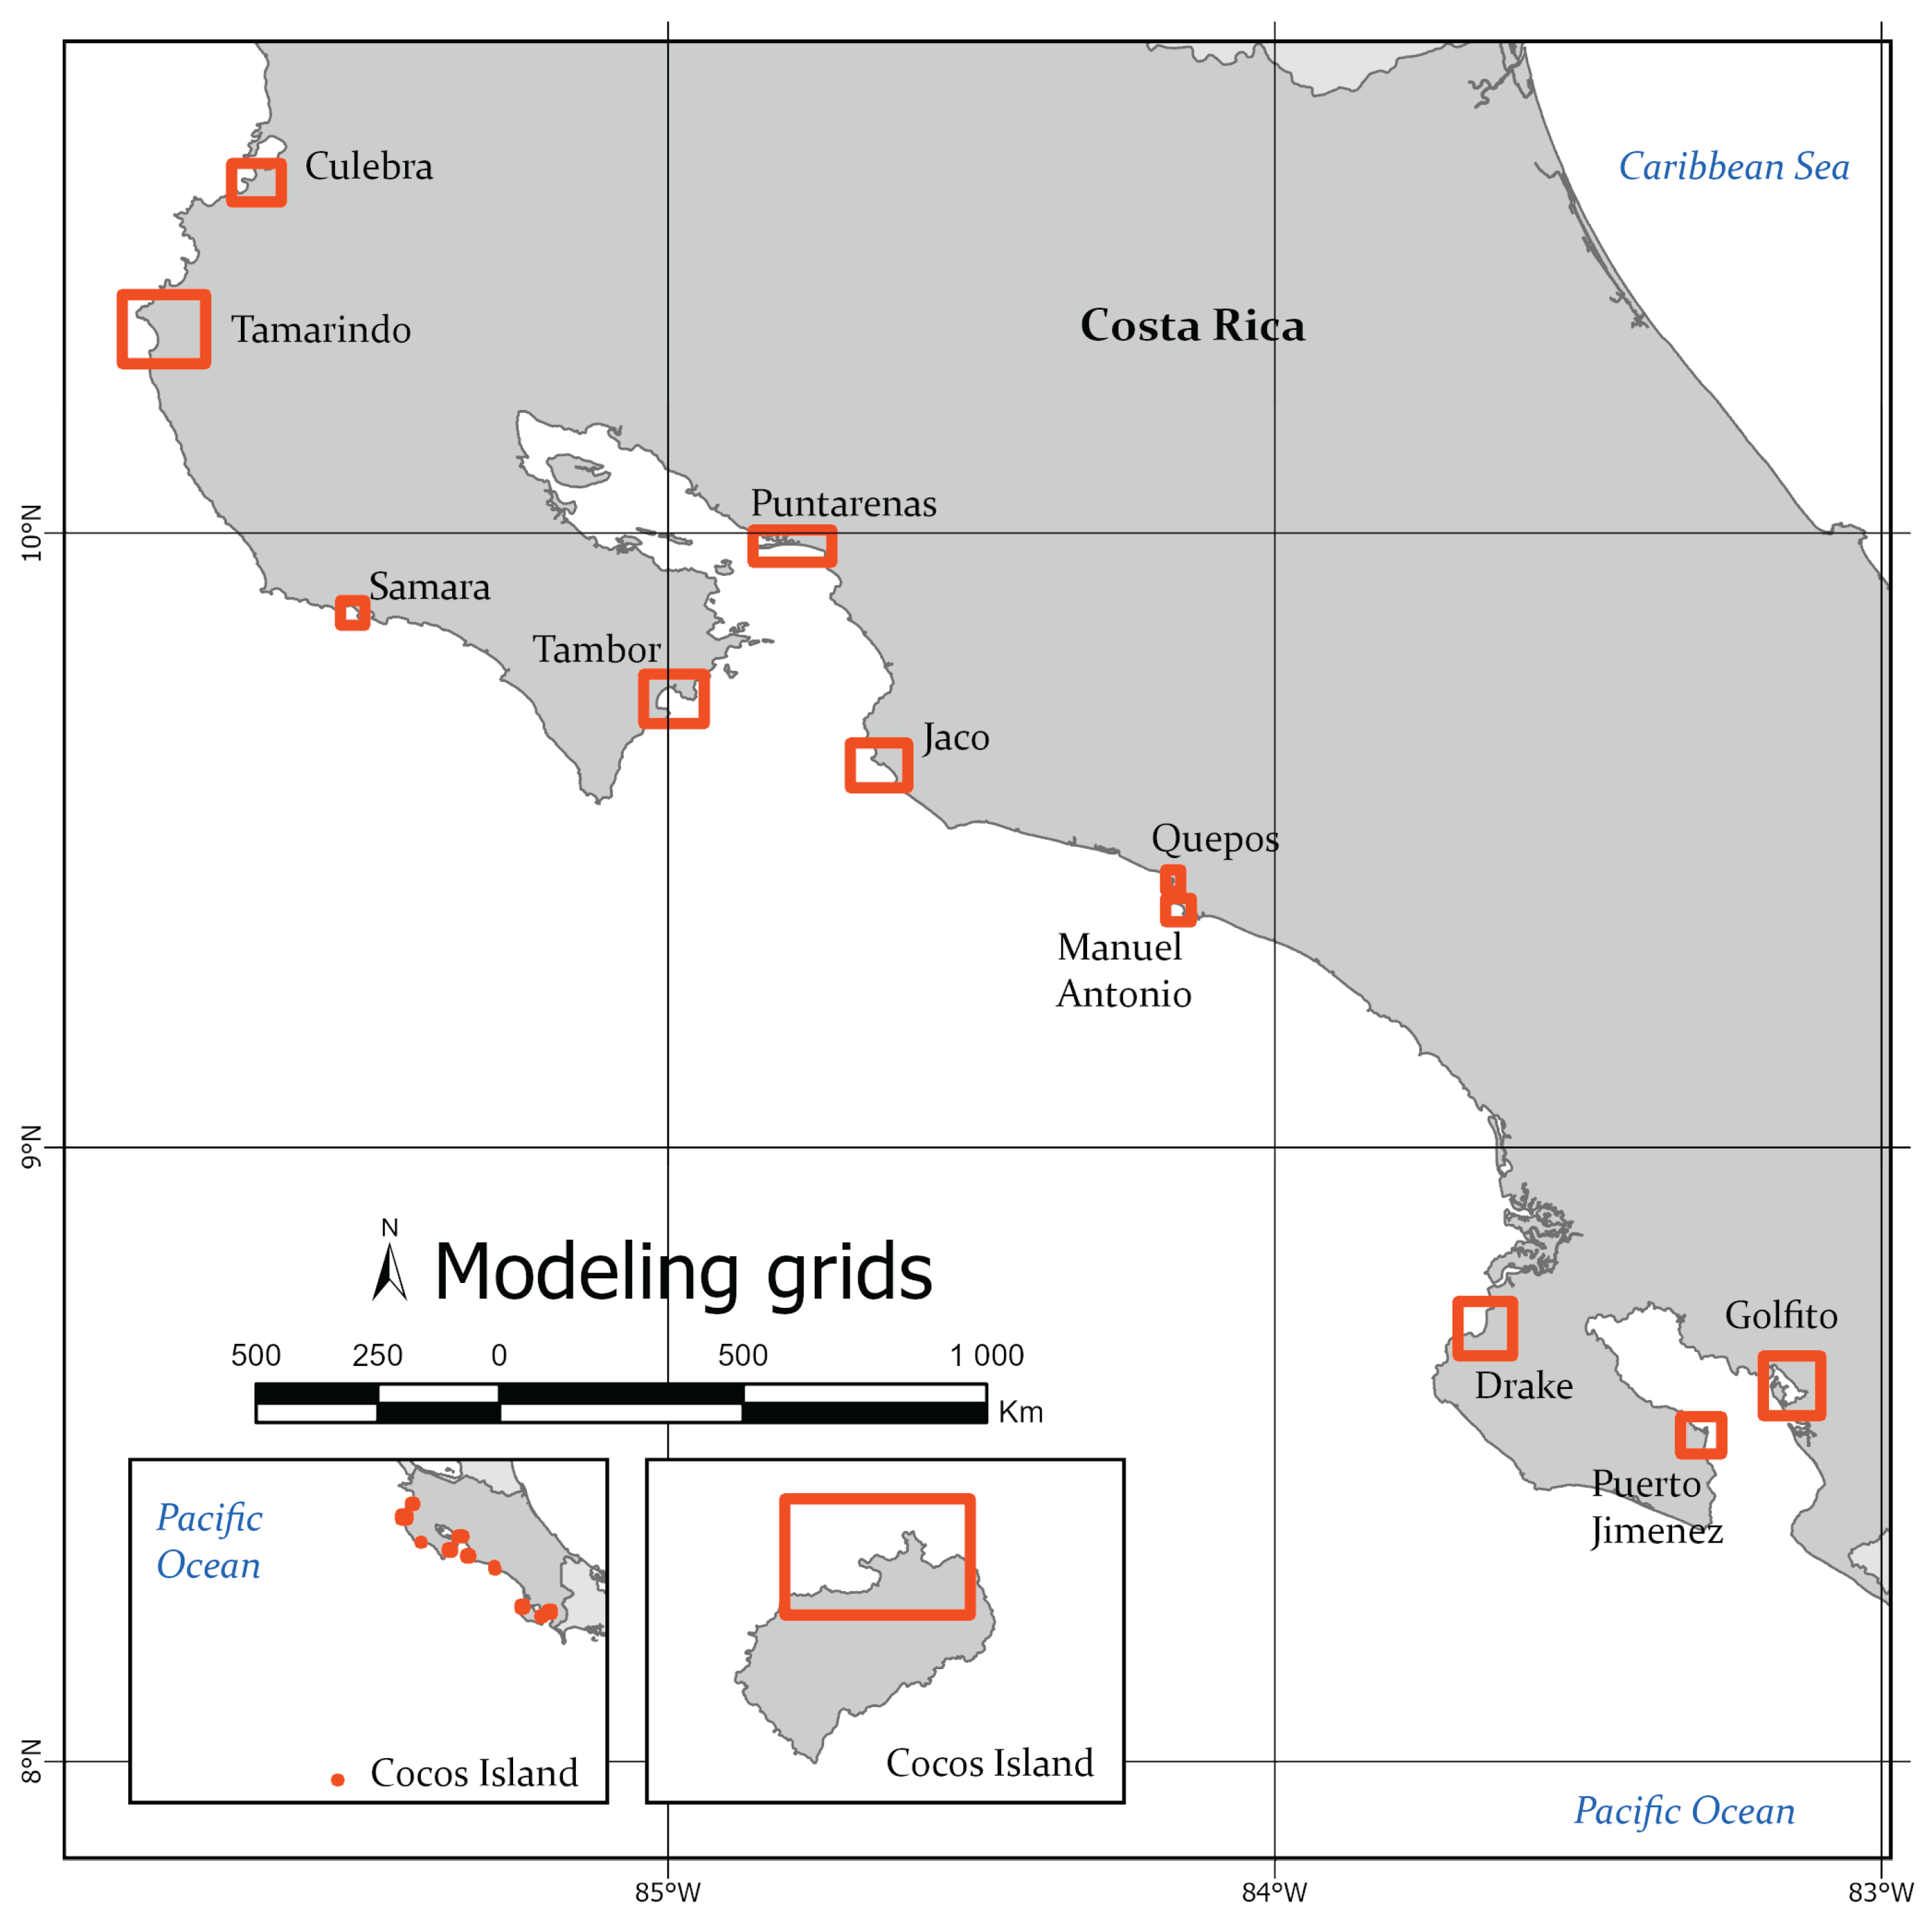
Figure 7.
Maximum nearshore tsunami heights caused by Tonga-Kermadec scenarios (a) 21, (b) 12, (c) 11 and (d) 14. The maximum nearshore tsunami heights caused by the other Tonga-Kermadec scenarios are shown in the Supplementary Material. Places shown in the figure are Qp: Quepos, PL: Punta Llorona and Ch: Punta Chancha.
Figure 7.
Maximum nearshore tsunami heights caused by Tonga-Kermadec scenarios (a) 21, (b) 12, (c) 11 and (d) 14. The maximum nearshore tsunami heights caused by the other Tonga-Kermadec scenarios are shown in the Supplementary Material. Places shown in the figure are Qp: Quepos, PL: Punta Llorona and Ch: Punta Chancha.
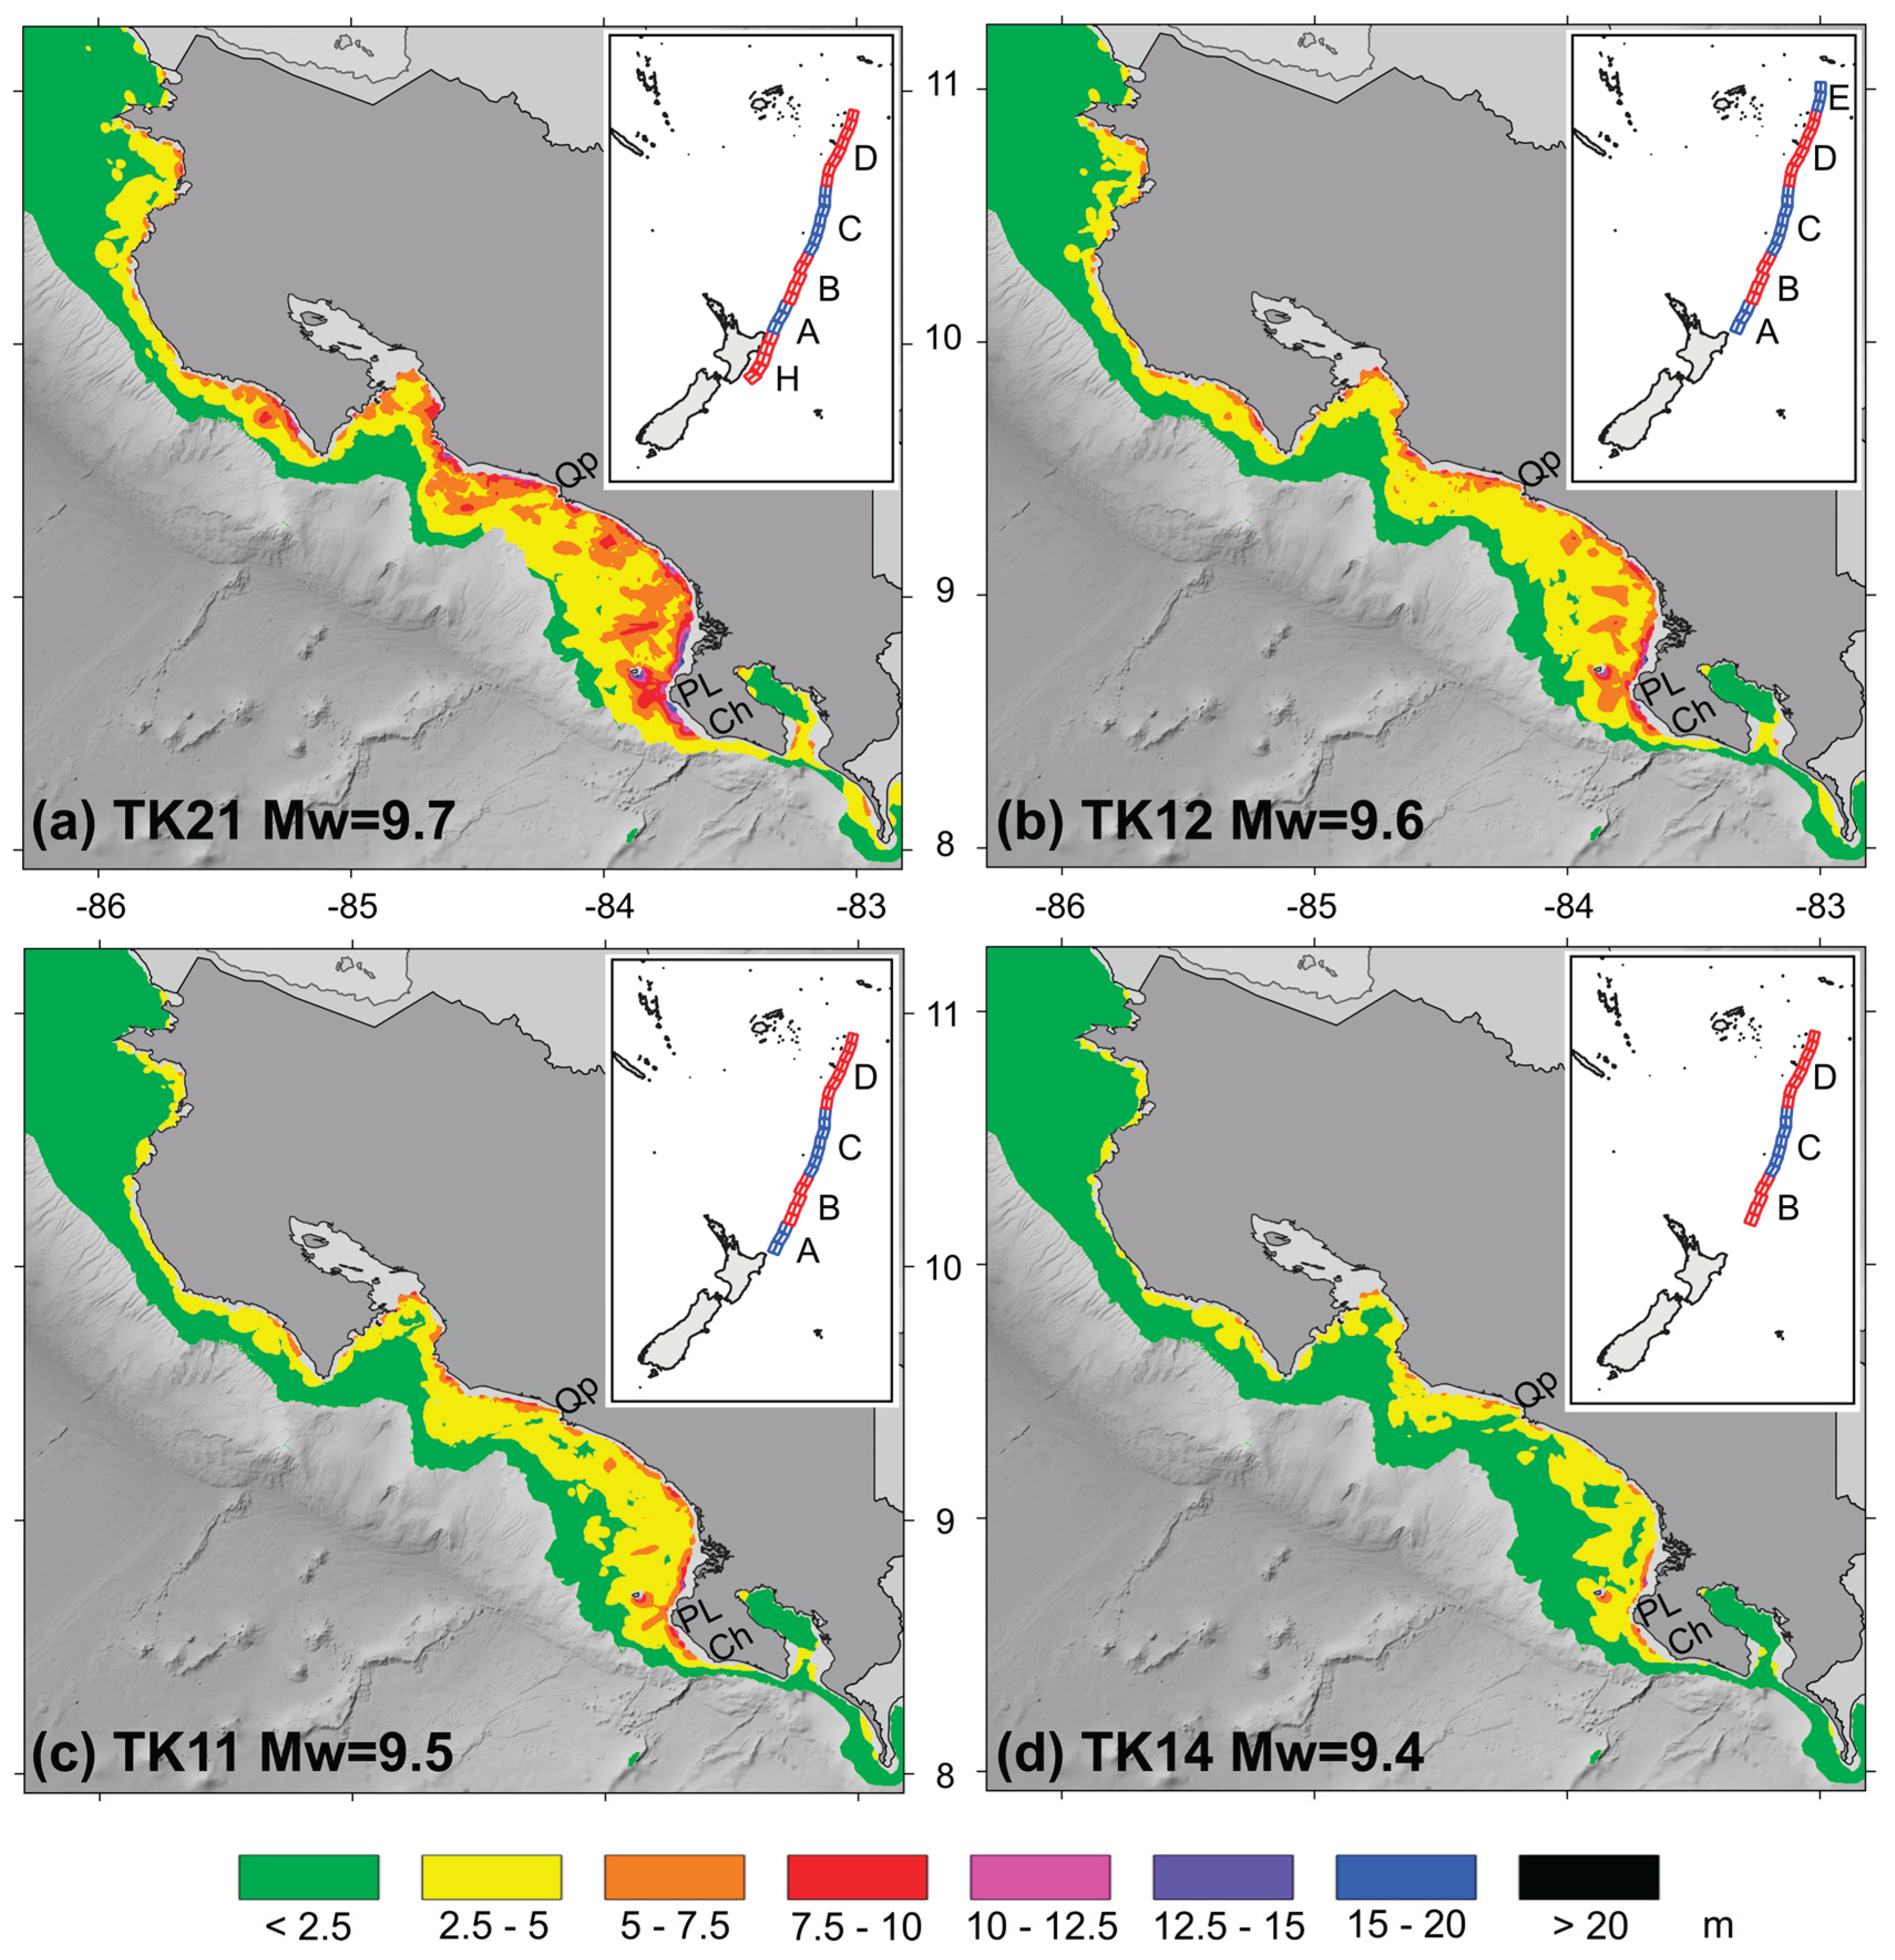
Figure 8.
Maximum nearshore tsunami heights caused by Colombia-Ecuador scenarios (a) Galera I and II, and (b) Galera II. The maximum nearshore tsunami heights caused by the other Colombia-Ecuador scenarios are shown in the Supplementary Material. Places shown in the figure are PM: Punta Muñeco and PH: Playa Hermosa.
Figure 8.
Maximum nearshore tsunami heights caused by Colombia-Ecuador scenarios (a) Galera I and II, and (b) Galera II. The maximum nearshore tsunami heights caused by the other Colombia-Ecuador scenarios are shown in the Supplementary Material. Places shown in the figure are PM: Punta Muñeco and PH: Playa Hermosa.
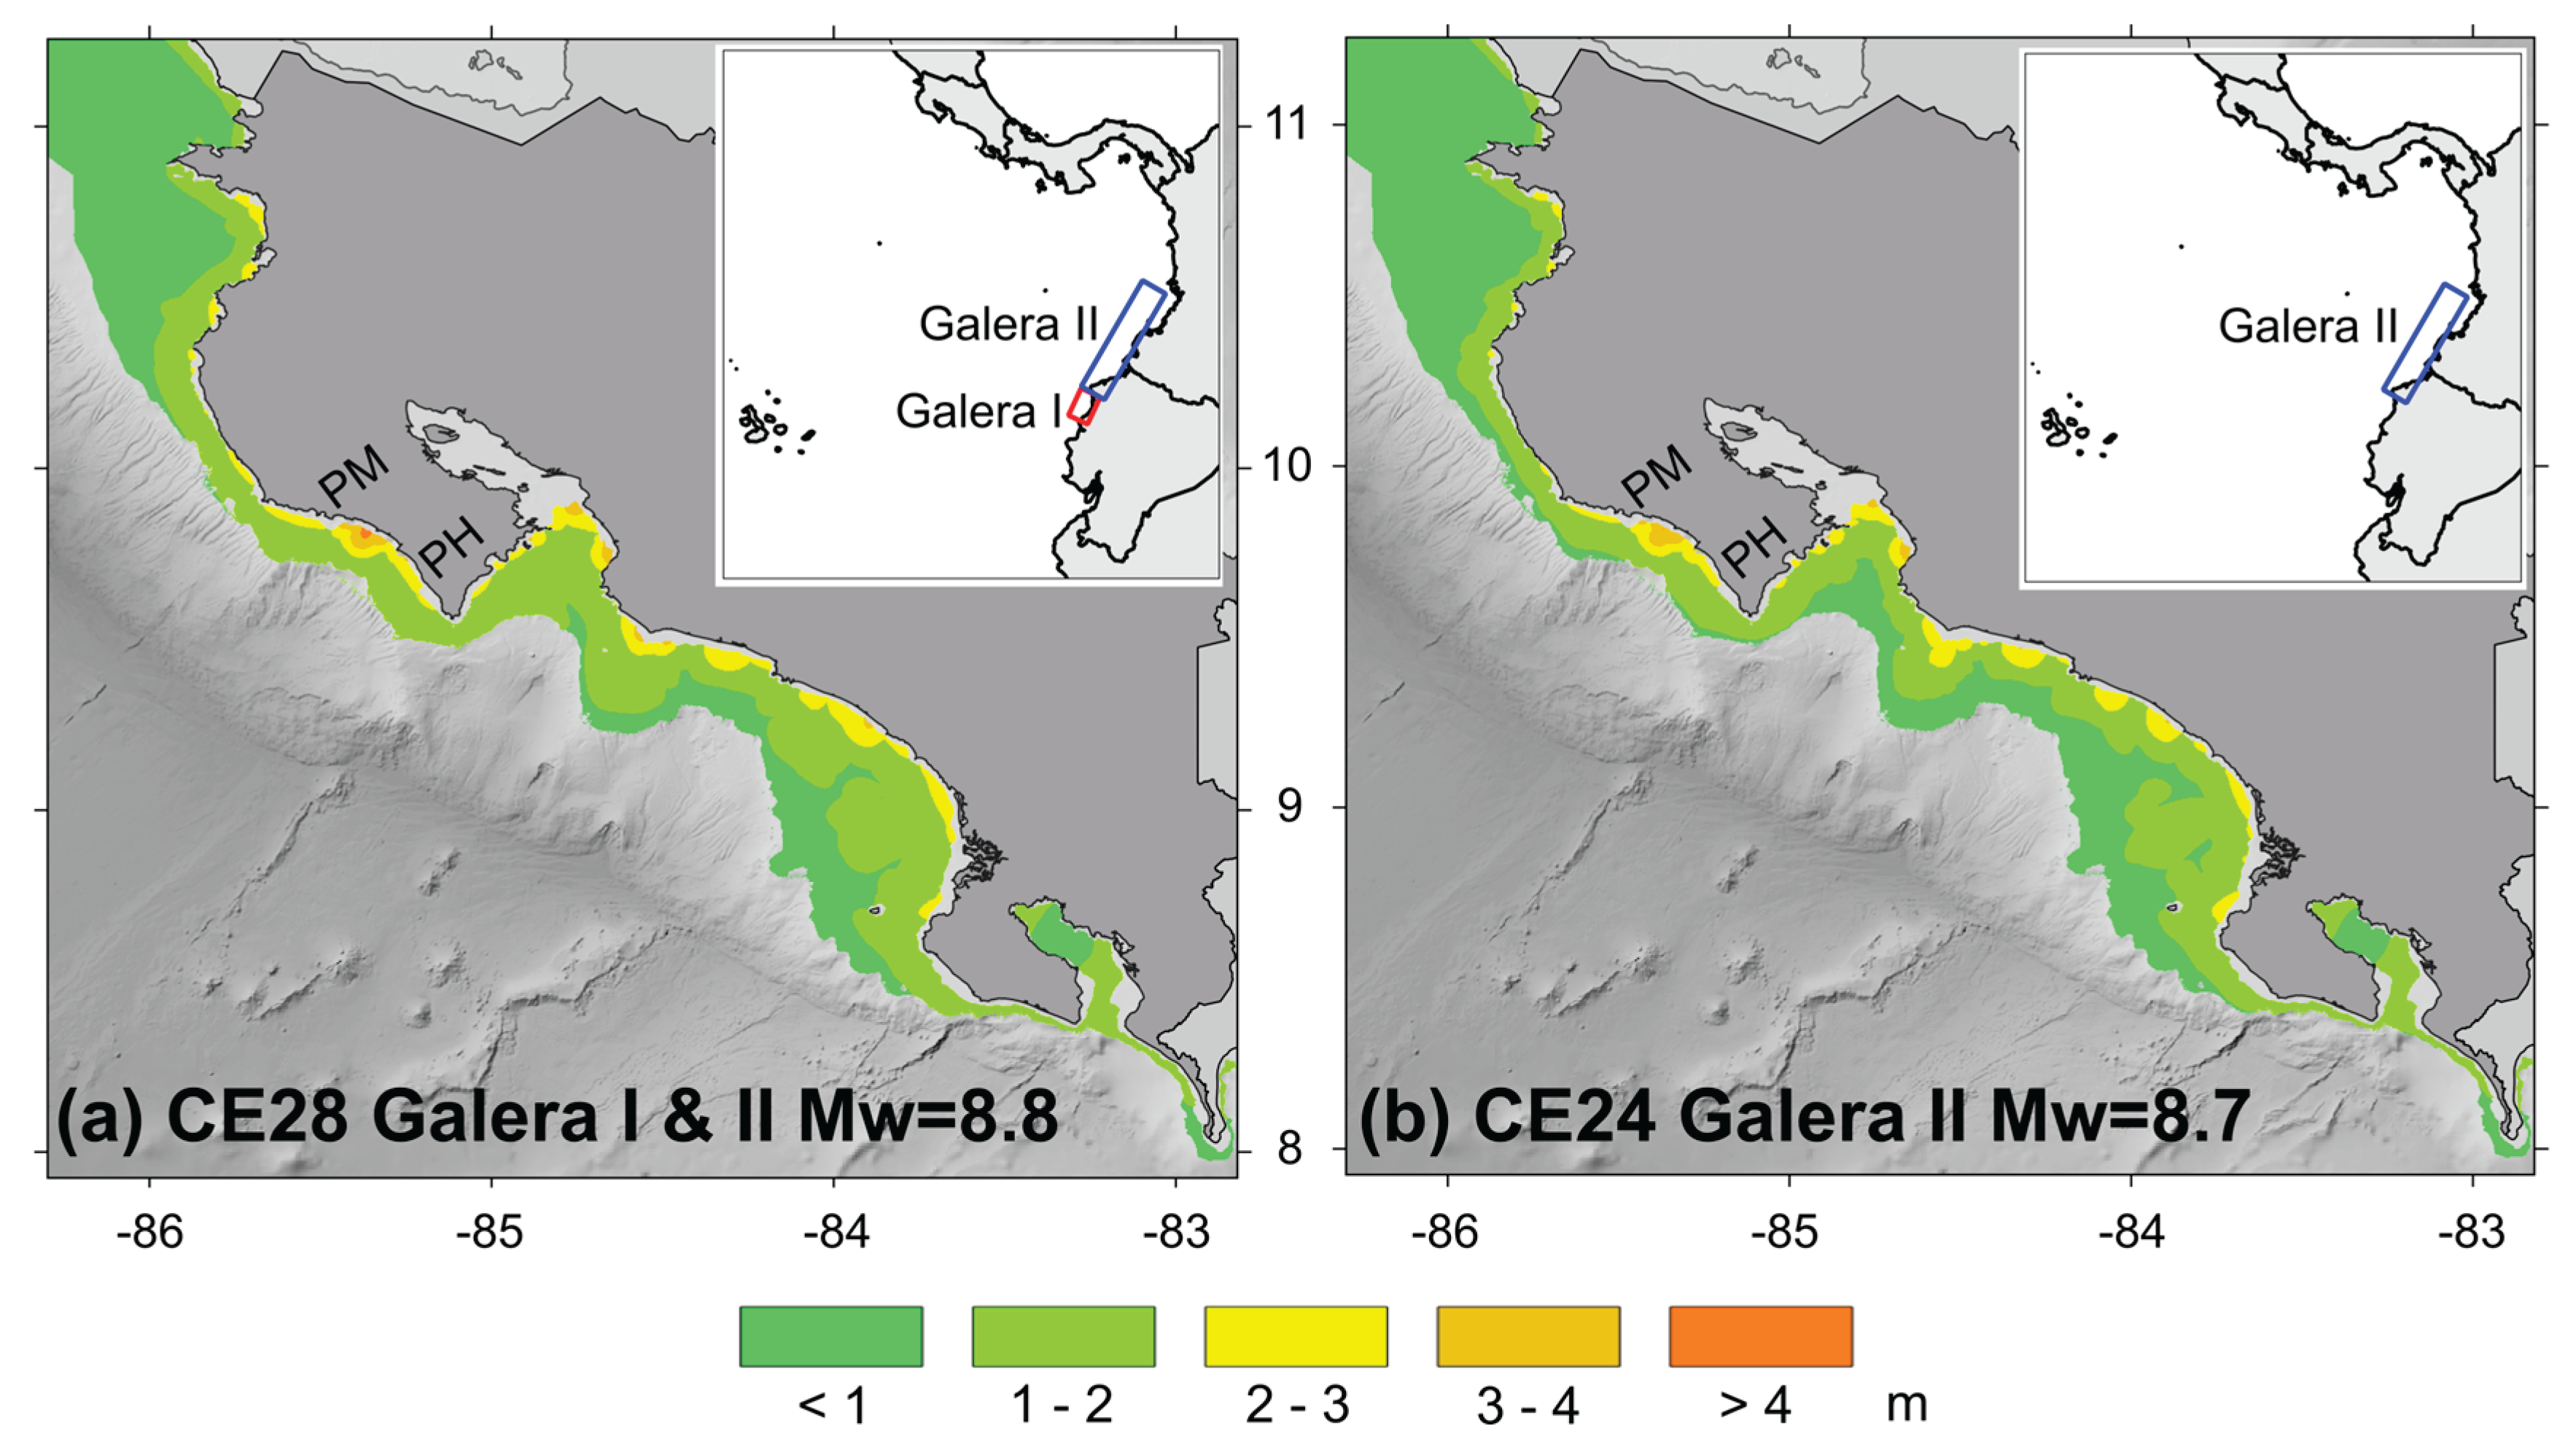
Figure 9.
Maximum heights in meters caused by the TK21 scenario. (b) Time evolution of the waves in meters for the coast section between Cabo Velas (CV) and Punta Chancha (Ch). Times are given in hours after the earthquake. Black arrow in (a) shows approximated wave incidence direction. Places shown in the maps are CV: Cabo Velas, T: Tamarindo, A: Avellanas, G: Garza, PM: Punta Muñeco, Be: Bejuco, PH: Playa Hermosa, CB: Cabo Blanco, IT: Tortuga Island, IN: Negritos Island, Ba: Bajamar, Le: Punta Leona, Qp: Quepos, BNP: Ballena National Park, PL: Punta Llorona, and Ch: Punta Chancha.
Figure 9.
Maximum heights in meters caused by the TK21 scenario. (b) Time evolution of the waves in meters for the coast section between Cabo Velas (CV) and Punta Chancha (Ch). Times are given in hours after the earthquake. Black arrow in (a) shows approximated wave incidence direction. Places shown in the maps are CV: Cabo Velas, T: Tamarindo, A: Avellanas, G: Garza, PM: Punta Muñeco, Be: Bejuco, PH: Playa Hermosa, CB: Cabo Blanco, IT: Tortuga Island, IN: Negritos Island, Ba: Bajamar, Le: Punta Leona, Qp: Quepos, BNP: Ballena National Park, PL: Punta Llorona, and Ch: Punta Chancha.
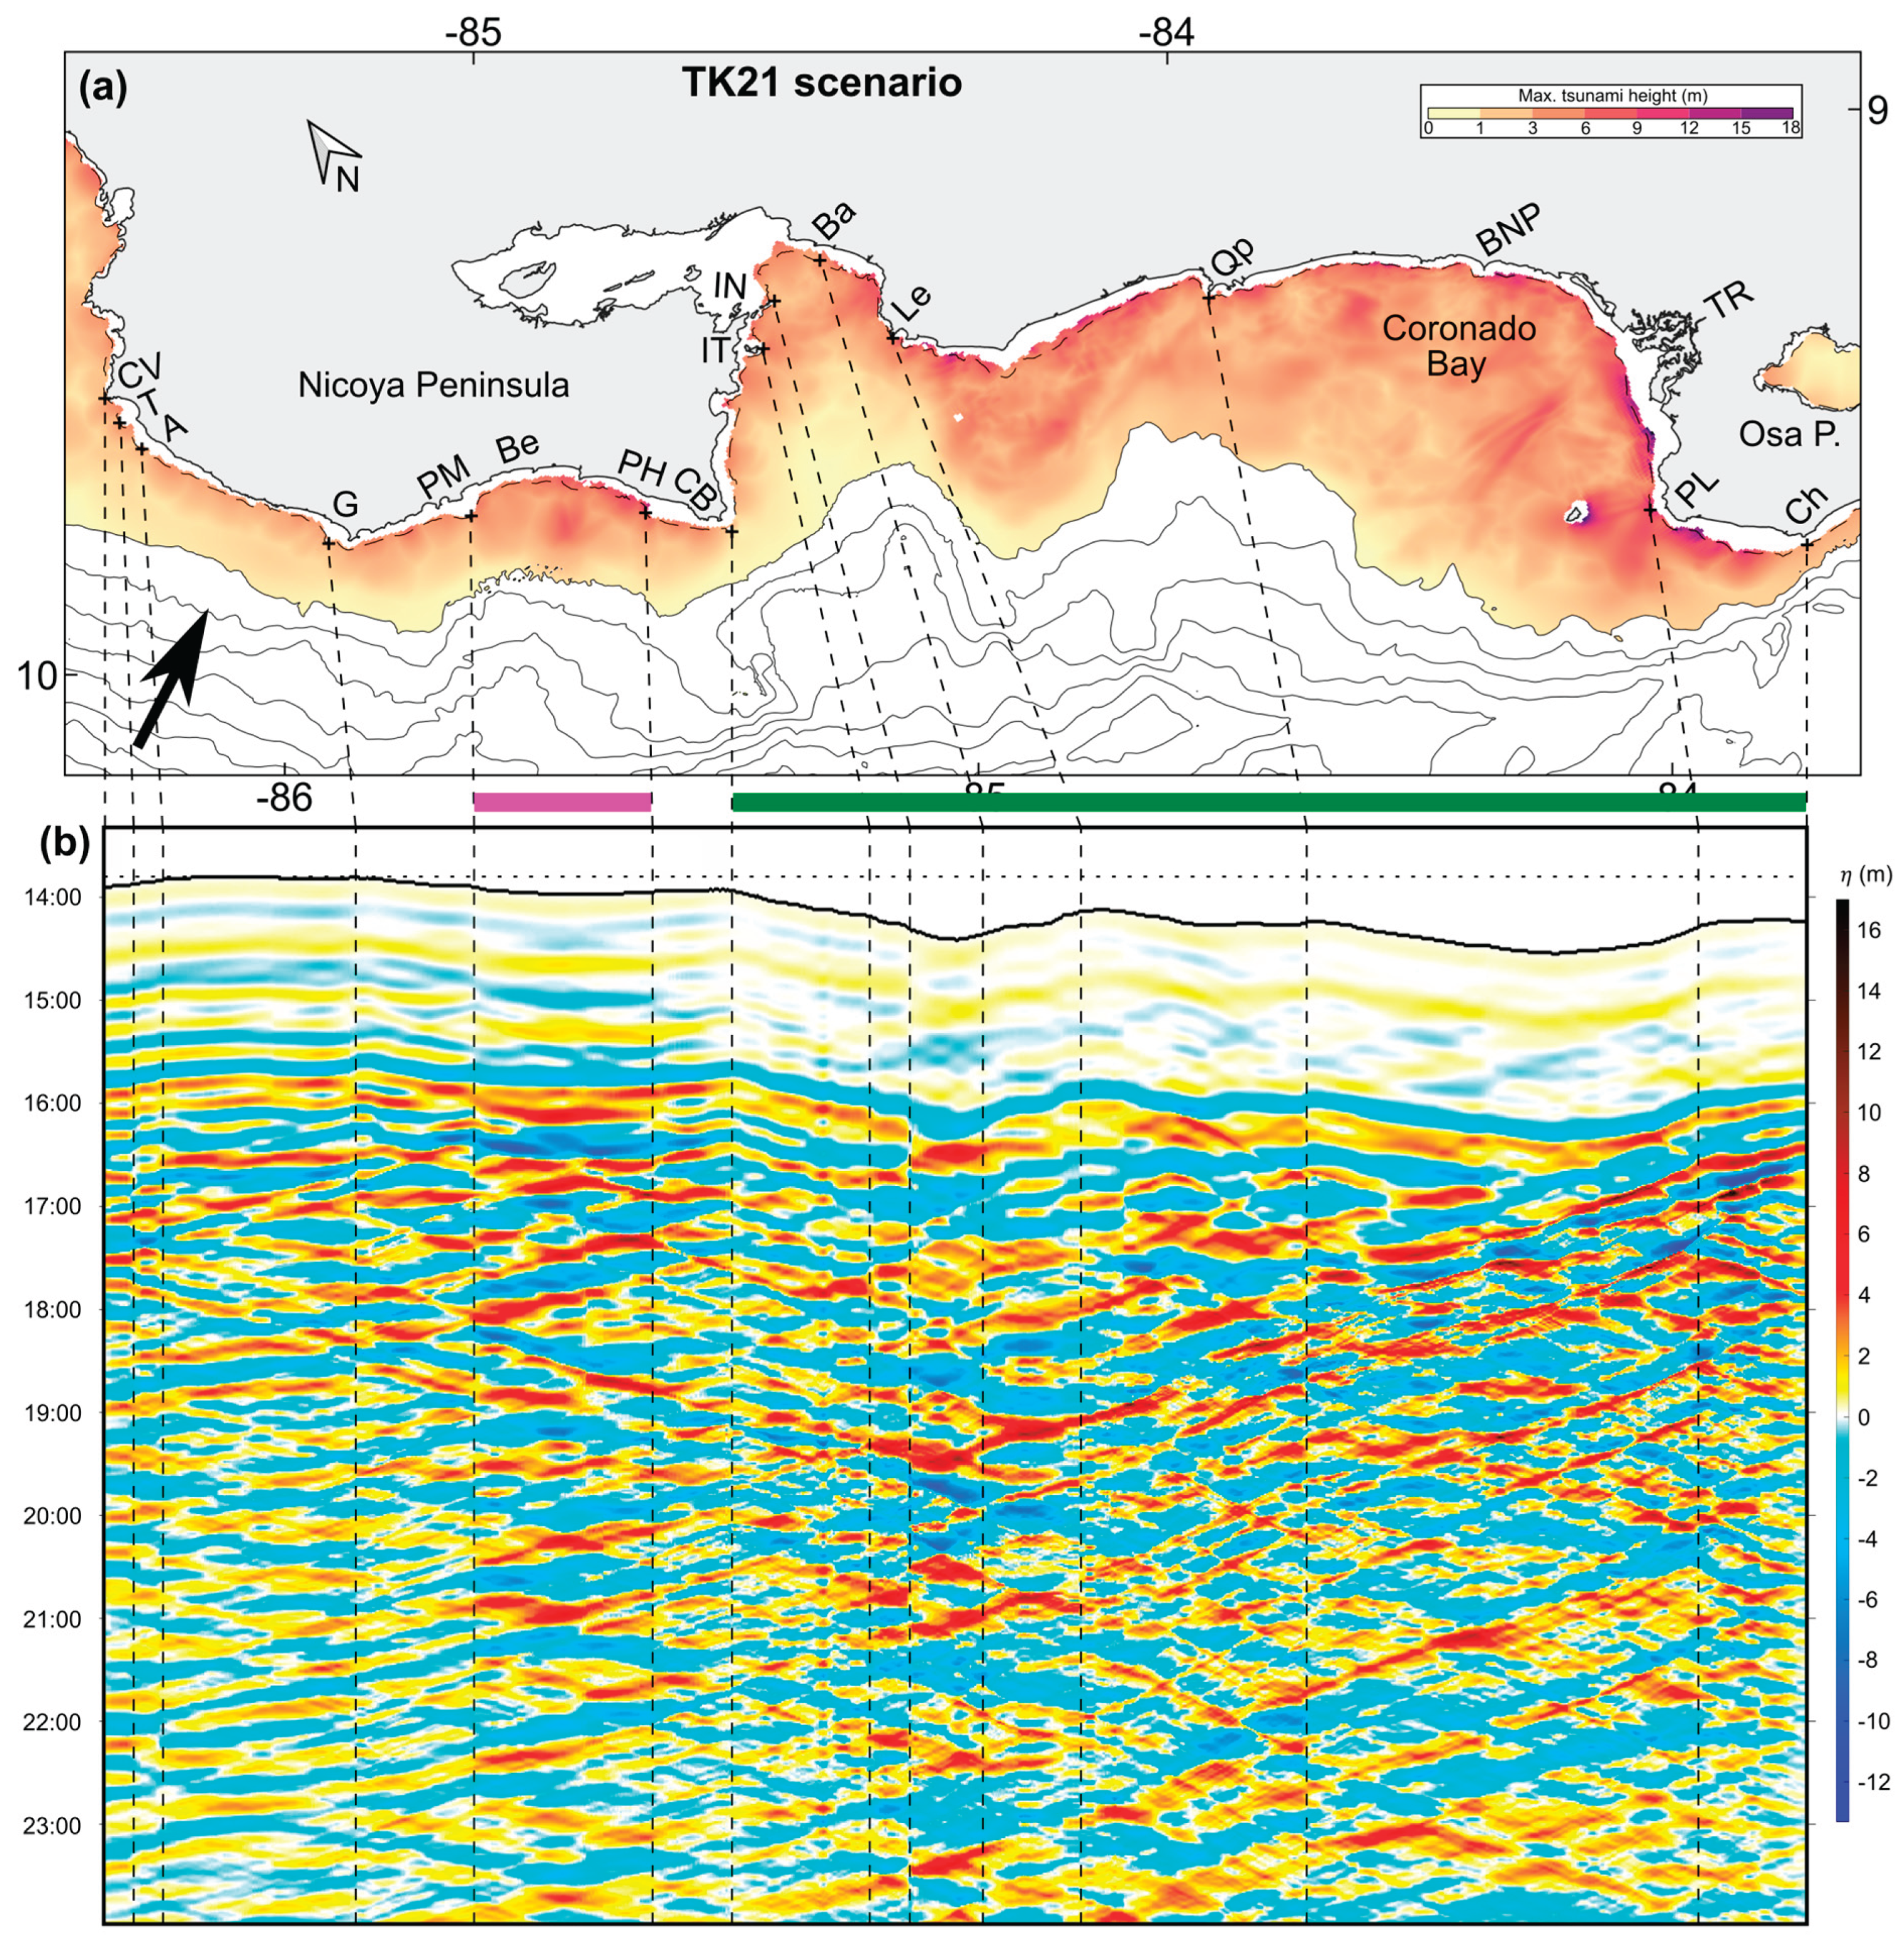
Figure 10.
Maximum heights in meters caused by the CE28 scenario (Galera I and II). (b) Time evolution of the waves in meters for the coast section between Cabo Velas (CV) and Punta Chancha (Ch). Times are given in hours after the earthquake. Black arrow in (a) shows approximated wave incidence direction. Places shown in the maps are CV: Cabo Velas, T: Tamarindo, A: Avellanas, G: Garza, PM: Punta Muñeco, Be: Bejuco, PH: Playa Hermosa, CB: Cabo Blanco, IT: Tortuga Island, IN: Negritos Island, Ba: Bajamar, Le: Punta Leona, Qp: Quepos, BNP: Ballena National Park, PL: Punta Llorona, and Ch: Punta Chancha.
Figure 10.
Maximum heights in meters caused by the CE28 scenario (Galera I and II). (b) Time evolution of the waves in meters for the coast section between Cabo Velas (CV) and Punta Chancha (Ch). Times are given in hours after the earthquake. Black arrow in (a) shows approximated wave incidence direction. Places shown in the maps are CV: Cabo Velas, T: Tamarindo, A: Avellanas, G: Garza, PM: Punta Muñeco, Be: Bejuco, PH: Playa Hermosa, CB: Cabo Blanco, IT: Tortuga Island, IN: Negritos Island, Ba: Bajamar, Le: Punta Leona, Qp: Quepos, BNP: Ballena National Park, PL: Punta Llorona, and Ch: Punta Chancha.
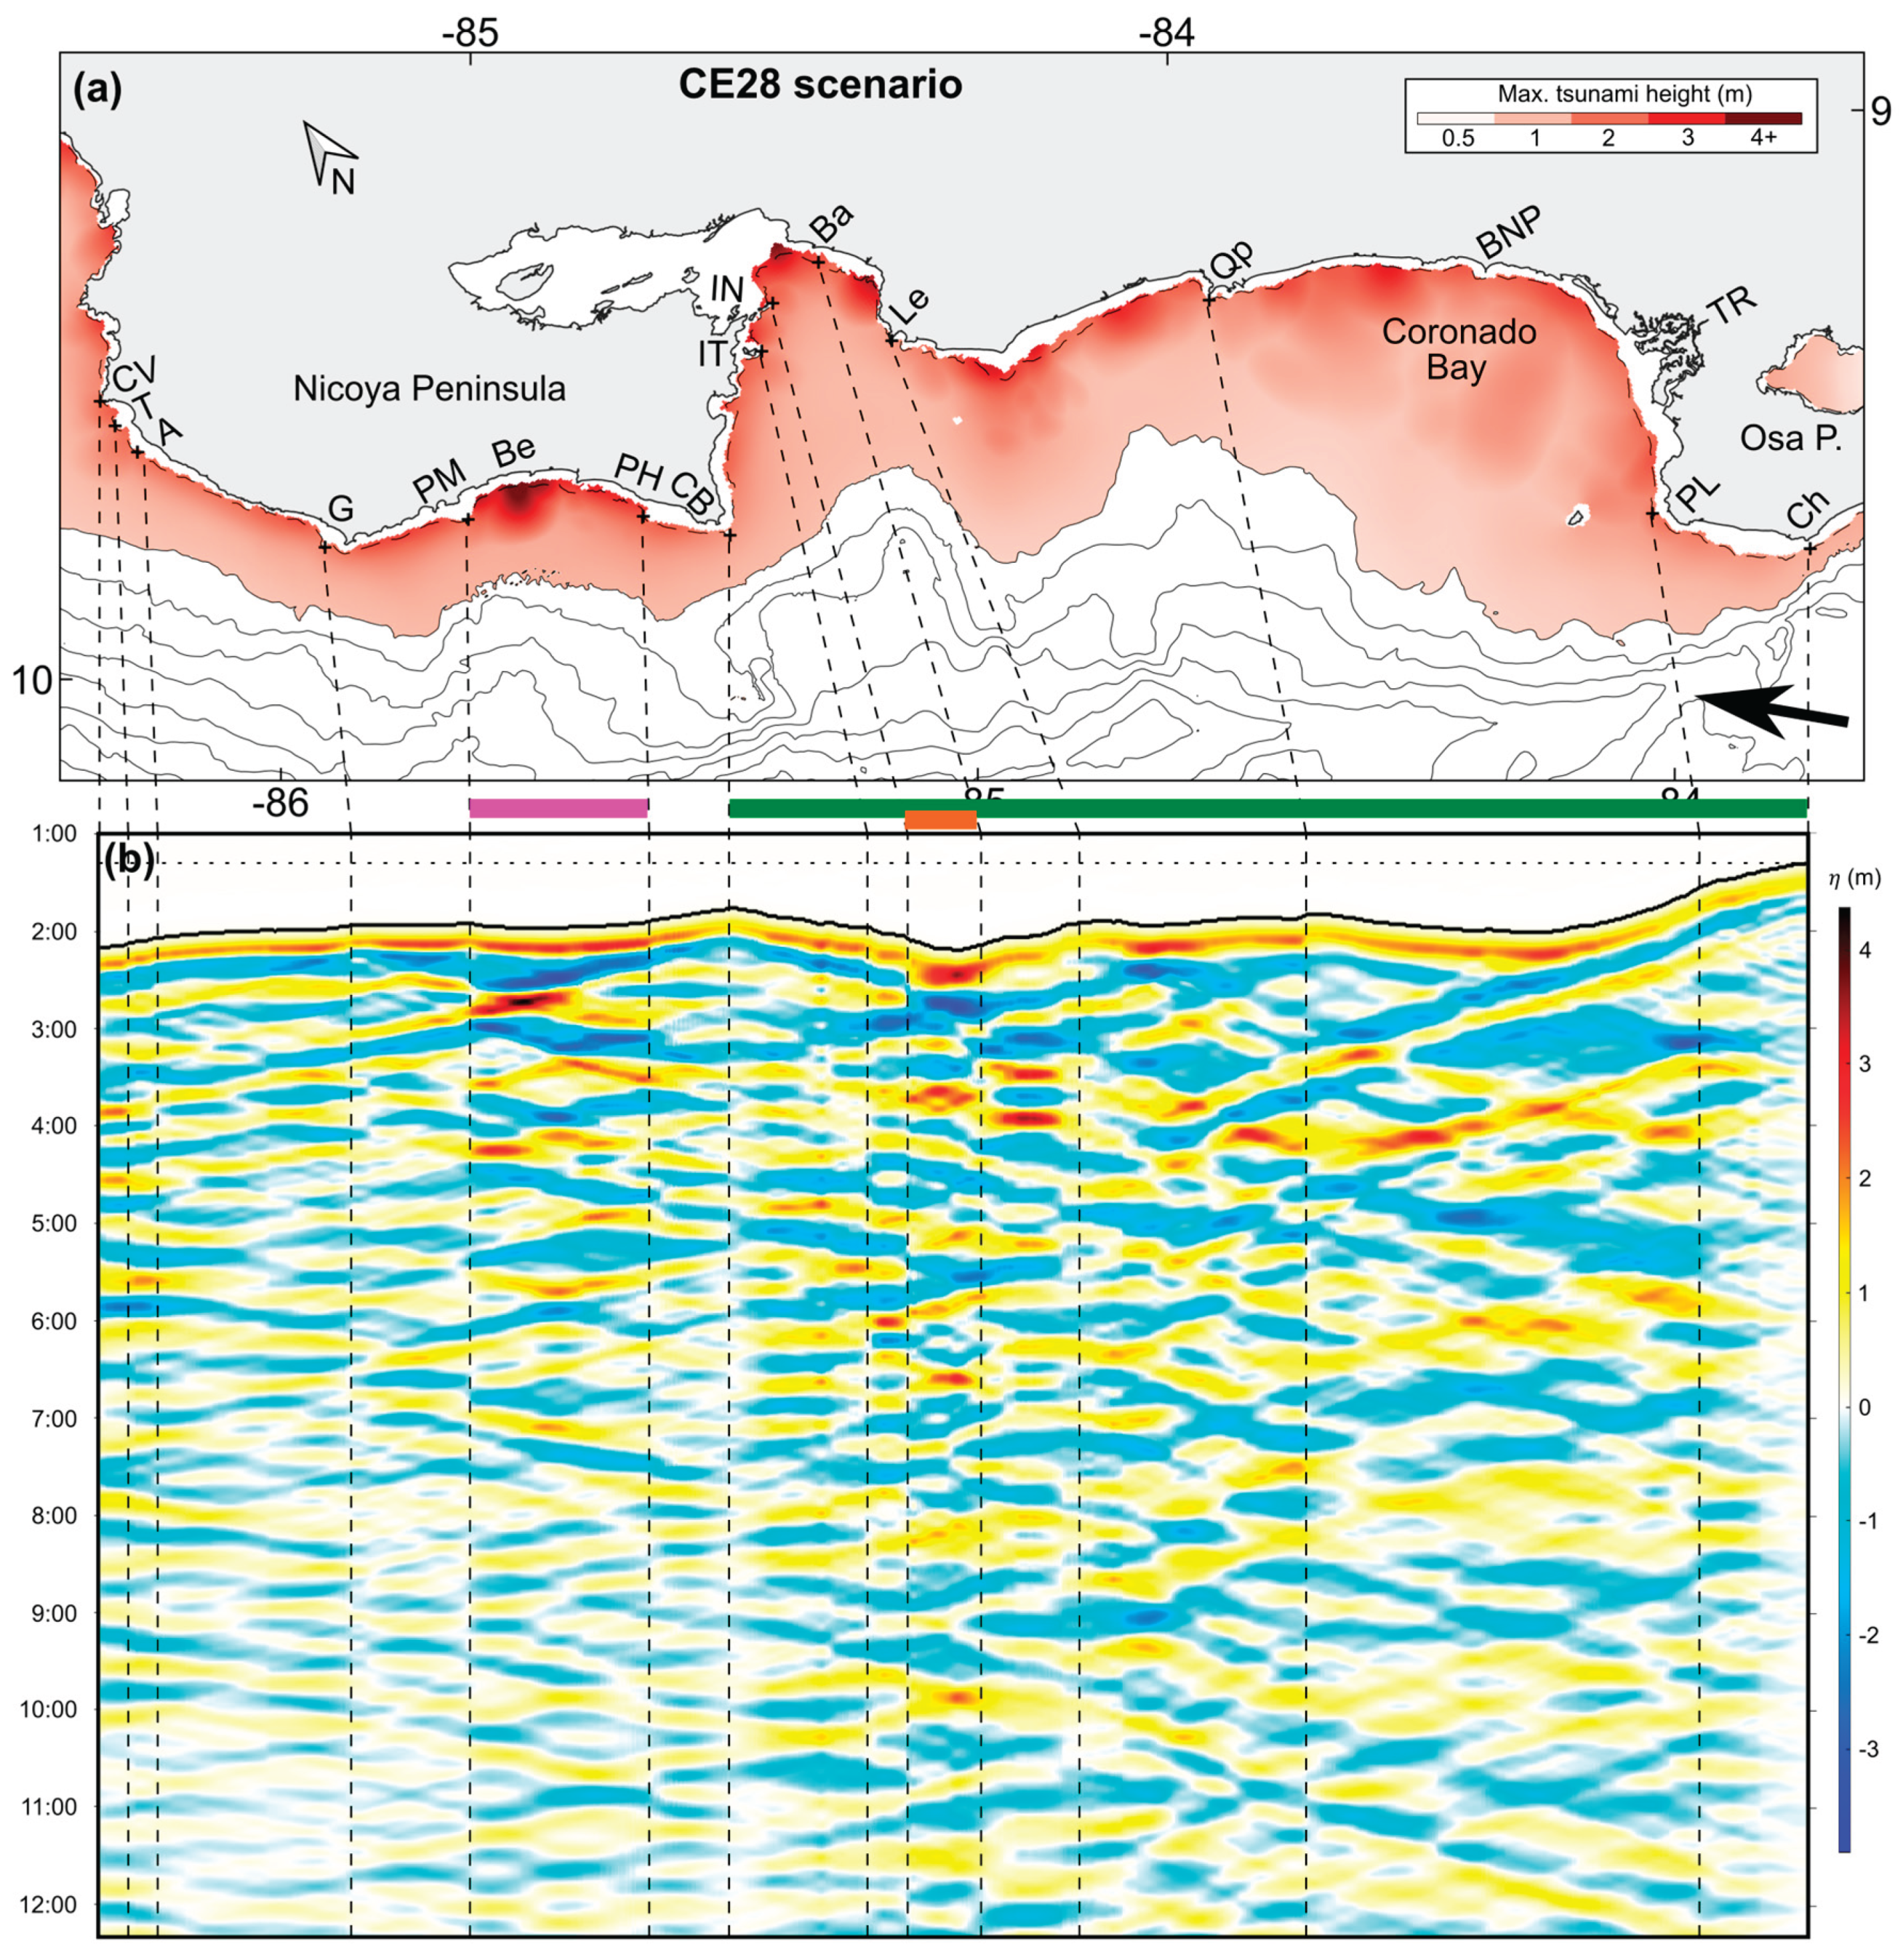
Figure 11.
Upper panels: comparison of the inundation areas at Potrero (a) caused by scenario TK21 (orange) and scenario oTK4 of [1] (yellow) and (b) caused by scenario CE28 (orange) and scenario SA2 of [1] (yellow). Lower panels: comparison of the inundation areas at Quepos (c) caused by scenario TK21 (orange) and scenario oTK4 of [1] (yellow) and (d) caused by scenario CE28 (orange) and scenario SA2 of [1] (yellow).
Figure 11.
Upper panels: comparison of the inundation areas at Potrero (a) caused by scenario TK21 (orange) and scenario oTK4 of [1] (yellow) and (b) caused by scenario CE28 (orange) and scenario SA2 of [1] (yellow). Lower panels: comparison of the inundation areas at Quepos (c) caused by scenario TK21 (orange) and scenario oTK4 of [1] (yellow) and (d) caused by scenario CE28 (orange) and scenario SA2 of [1] (yellow).

Figure 12.
Maximum joint flowdepths in Puntarenas in meters and percentage of total area flooded for (a) scenarios in [1] and (b) the scenarios modeled here.
Figure 12.
Maximum joint flowdepths in Puntarenas in meters and percentage of total area flooded for (a) scenarios in [1] and (b) the scenarios modeled here.
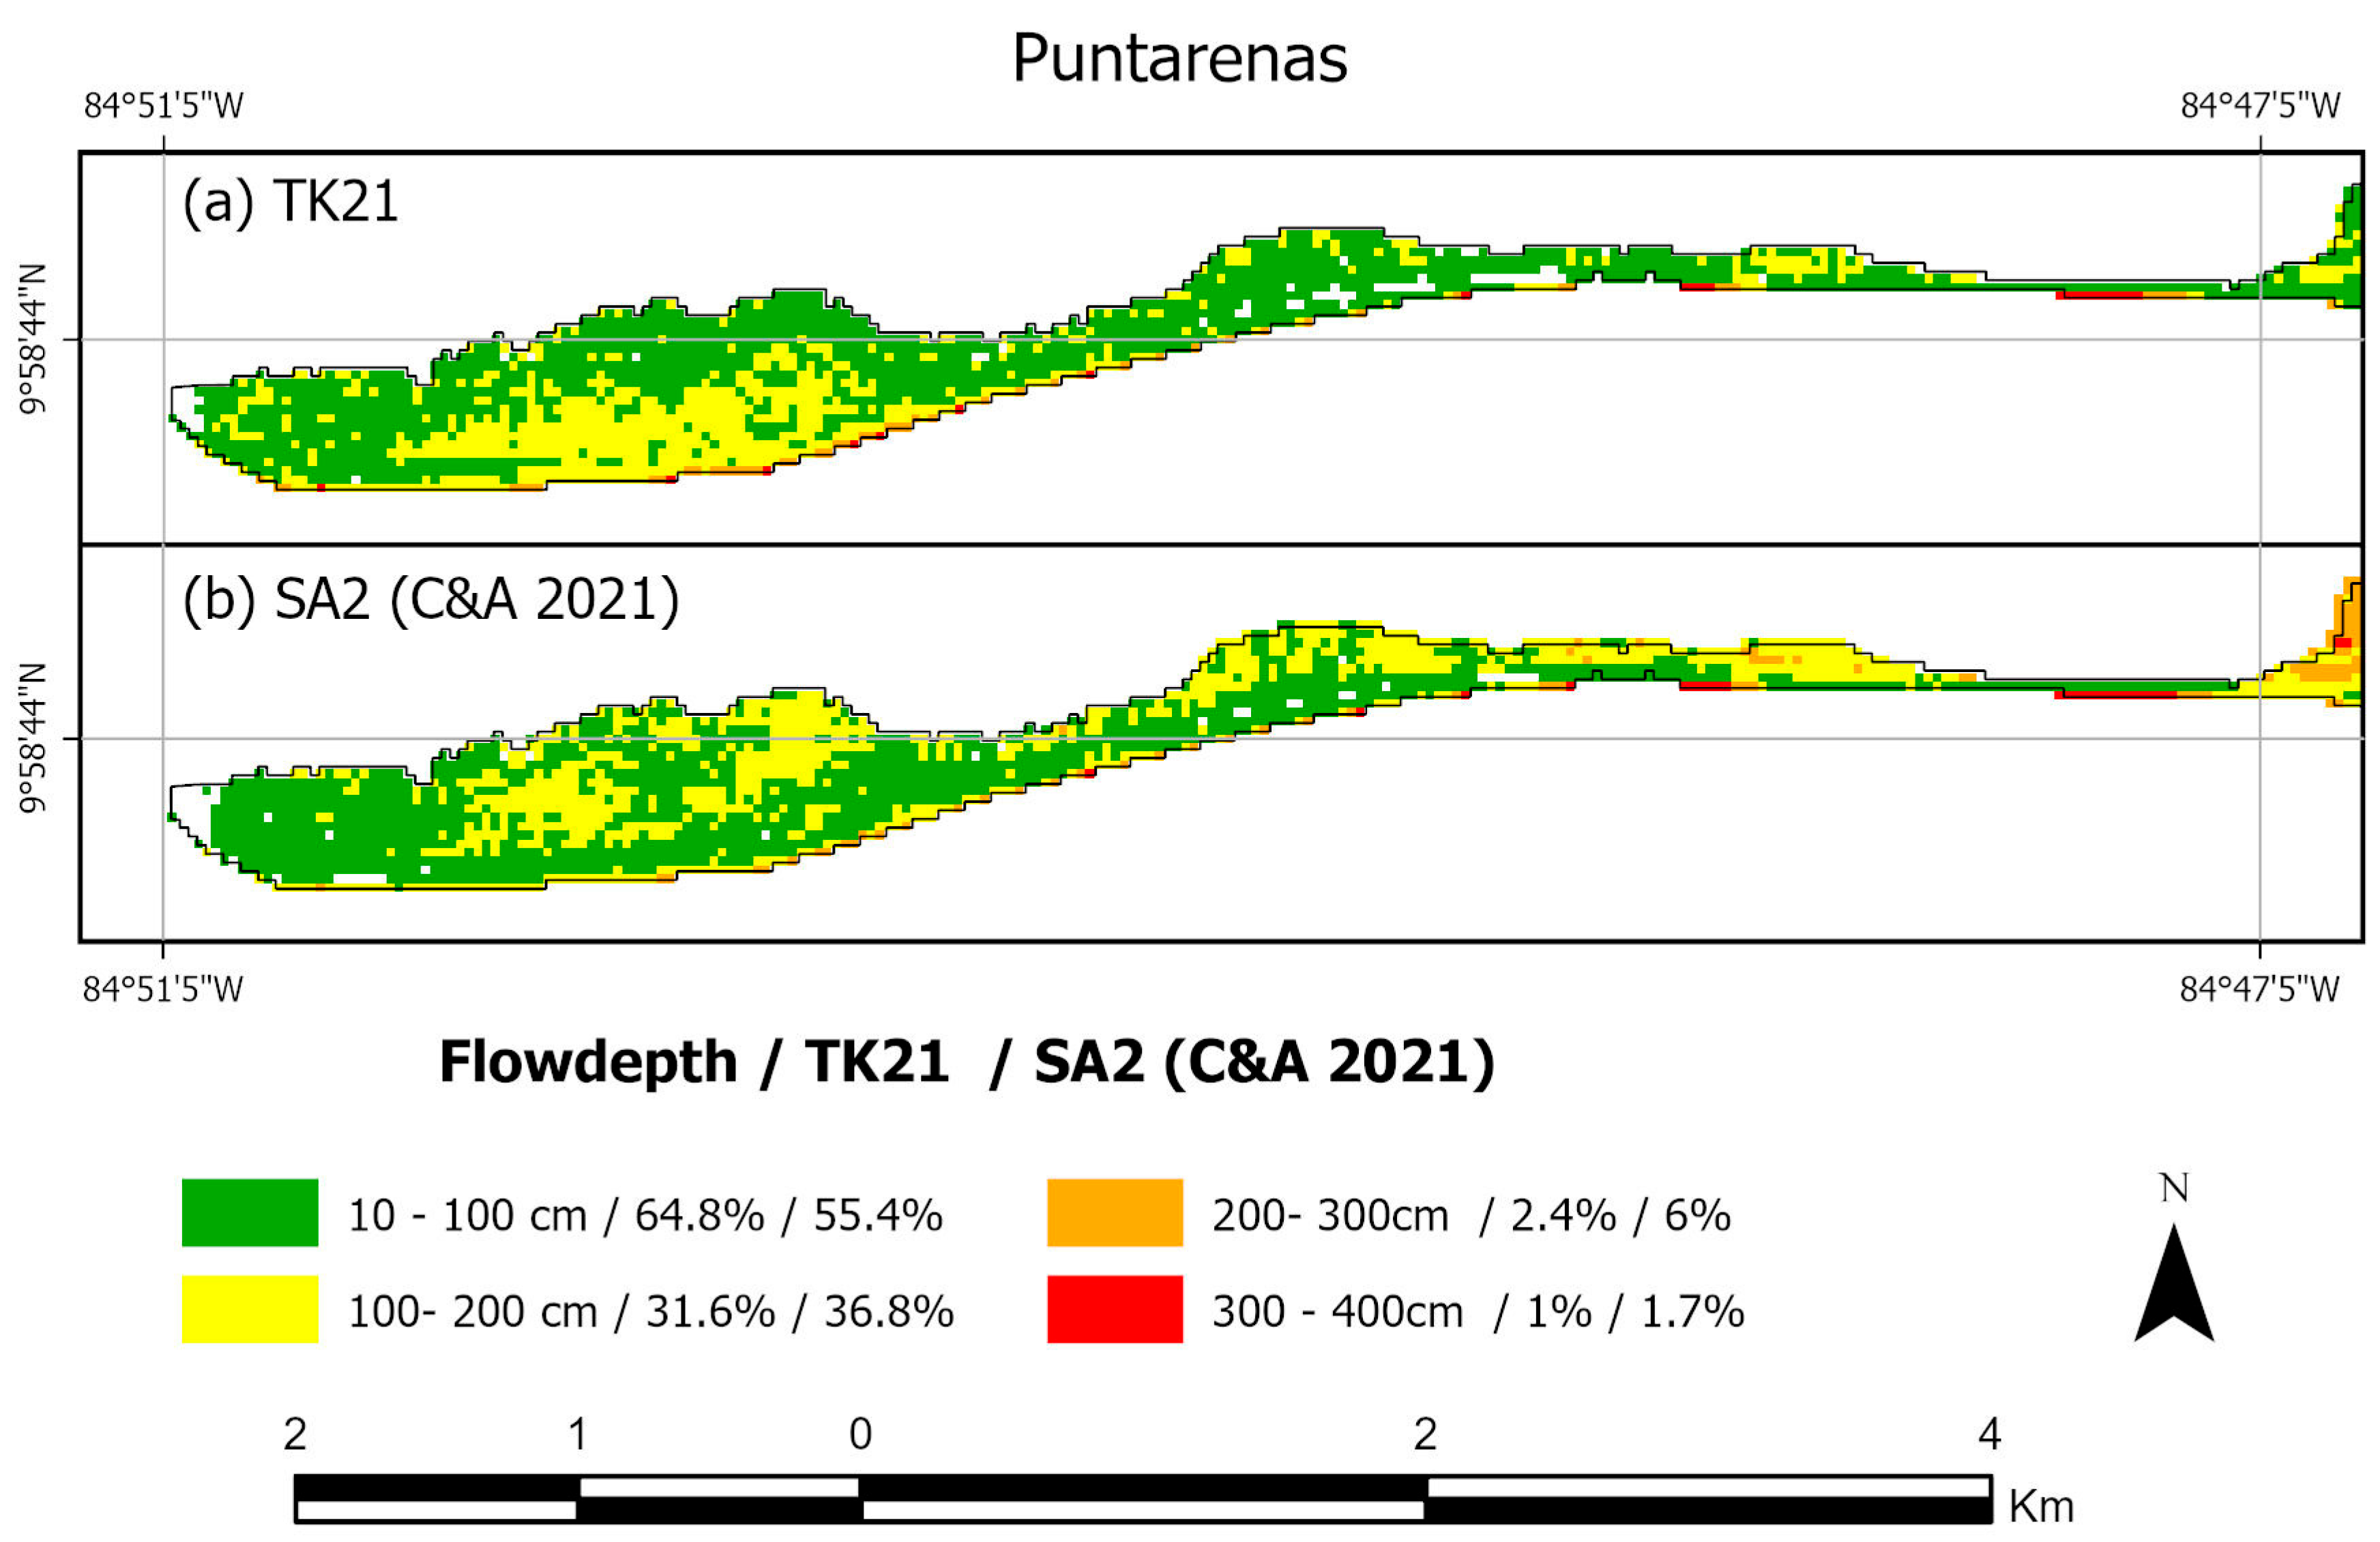

Table 1.
List of tsunami scenarios modeled here from both subduction zones, with magnitude, length, and probability. Scenarios with an * produced the highest tsunami heights and thus were run also for inundation models.
Table 1.
List of tsunami scenarios modeled here from both subduction zones, with magnitude, length, and probability. Scenarios with an * produced the highest tsunami heights and thus were run also for inundation models.
| SZ | # | Scenario name | Mw | Length (km) | Max. nearshore tsunami height (NTH) (m) | Probability |
| Tonga-Kermadec Subduction Zone | 1 | G | 8.4 | 300 | 0.93 | High |
| 2 | F | 8.3 | 200 | 2.66 | ||
| 3 | E | 8.4 | 300 | 4.97 | ||
| 4 | D | 9.3 | 800 | 5.27 | ||
| 5 | C | 8.9 | 700 | 0.34 | ||
| 6 | B | 8.9 | 500 | 0.18 | ||
| 7 | A | 8.7 | 300 | 0.11 | ||
| 8 | H | 9.1 | 500 | 2.71 | ||
| 9 | A+B | 9.0 | 800 | 1.96 | Intermediate | |
| 10 | A+B+C | 9.3 | 1500 | 9.18 | ||
| 11 | A+B+C+D | 9.5 | 2300 | 18.34* | ||
| 12 | A+B+C+D+E | 9.6 | 2600 | 24.39* | ||
| 13 | B+C | 9.1 | 1200 | 5.24 | ||
| 14 | B+C+D | 9.4 | 2000 | 14.55* | ||
| 15 | C+D | 9.2 | 1500 | 8.36 | ||
| 16 | C+D+E | 9.3 | 1800 | 1.94 | ||
| 17 | D+E | 9.1 | 1100 | 2.42 | ||
| 18 | D+E+F | 9.2 | 1300 | 2.42 | ||
| 19 | E+F | 8.6 | 500 | 0.57 | ||
| 20 | E+F+G | 8.8 | 800 | 0.69 | ||
| 21 | H+A+B+C+D | 9.7 | 2800 | 26.11* | ||
| Colombia-Ecuador Subduction Zone | 22 | Norte | 7.9 | 170 | 0.20 | More likely |
| 23 | Buenaventura | 8.1 | 160 | 0.20 | ||
| 24 | Galera II / Esmeraldas | 8.7 | 450 | 4.01 | ||
| 25 | Galera I / Pedernales | 8.0 | 110 | 0.97 | ||
| 26 | Isla Plata | 8.0 | 130 | 0.65 | ||
| 27 | Salinas | 8.2 | 200 | 0.10 | ||
| 28 | Galera I and II | 8.9 | 560 | 4.38* | Less likely |
Table 2.
Maximum inundation distances, areas and flow depths for the sites where tsunami inundation was modeled. Maximum and minimum values for each scenario are highlighted with * and †, respectively.
Table 2.
Maximum inundation distances, areas and flow depths for the sites where tsunami inundation was modeled. Maximum and minimum values for each scenario are highlighted with * and †, respectively.
| Site name | Total coastline length in the model (km) | Max. Inundation Distance (km) | InundatedArea (km2) | Max. Flowdepth (m) | |||
| TK21 | CE28 | TK21 | CE28 | TK21 | CE28 | ||
| Culebra Bay | 14.5 | 1.0 | 1.0 | 3.2 | 1.0 | 7.0 | 1.6 |
| Potrero | 4.7 | 1.6 | 1.0 | 5.2 | 3.1 | 13.3* | 4.9 |
| Tamarindo | 12.5 | 1.8 | 1.3 | 7.4* | 3.6* | 7.9 | 4.5 |
| Samara | 6.8 | 1.2 | 0.5 | 2.9 | 0.9 | 11.1 | 3.5 |
| Tambor | 20.3 | 2.4* | 1.4* | 5.7 | 1.9 | 8.0 | 4.2 |
| Jaco | 8.7 | 2.2 | 0.6 | 4.8 | 0.4 | 7.4 | 7.3* |
| Quepos | 4.5 | 1.1 | 0.4 | 0.9 | 0.0 | 8.0 | 0.1† |
| Manuel Antonio | 5.5 | 0.8 | 0.53 | 0.78 | 0.28 | 8.39 | 2.97 |
| Drake | 8.05 | 2.3 | 2.1 | 2.06 | 0.93 | 9.6 | 3.75 |
| Puerto Jimenez | 2.5 | 0.25† | 0.1† | 0.27 | 0.5 | 1.84† | 0.33 |
| Golfito | 6.9 | 0.97 | 0.85 | 2.85 | 1.8 | 6.77 | 4.87 |
| Cocos Island | 0.4 | 0.32 | 0.25 | 0.15† | 0.07† | 3.08 | 1.46 |
Table 3.
Modeled arrival times to several locations for the scenarios TK21 and CE28, shown in the upper panels of Figure 9 and Figure 10. Also, arrival times from SA2 for Cabo Blanco to Punta Chancha from Fig. 11 of Chacón-Barrantes & Arozarena-Llopis [1] for comparison; Cabo Velas is not shown for SA2 as it was not included in that figure.
Table 3.
Modeled arrival times to several locations for the scenarios TK21 and CE28, shown in the upper panels of Figure 9 and Figure 10. Also, arrival times from SA2 for Cabo Blanco to Punta Chancha from Fig. 11 of Chacón-Barrantes & Arozarena-Llopis [1] for comparison; Cabo Velas is not shown for SA2 as it was not included in that figure.
| Location / Scenario | Cabo Velas (CV) | Cabo Blanco (CB) | Punta Llorona (PL) | Punta Chancha (Ch) | Diff. CV-CB | Diff. CB-PL | Diff. CB-Ch |
| TK21 | 13:54 | 13:56 | 14:17 | 14:14 | 00:02 | 00:21 | 00:18 |
| CE28 | 02:10 | 01:46 | 01:33 | 01:18 | 00:24 | 00:13 | 00:28 |
| SA2 | - | 01:49 | 01:36 | 01:21 | - | 00:13 | 00:28 |
Table 4.
Differences between results from modeling experts’ scenarios and scenarios from [1]. Manuel Antonio, Drake, Puerto Jimenez, Golfito and Cocos Island were not modeled with sources from [1]. Maximum and minimum values for each scenario are highlighted with * and †, respectively.
| Site name | Diff. Max. Inundation Distance (km) | Diff. Inundation Area (km2) | Diff. Max. Flowdepth (m) | |||
| Tonga | Colombia | Tonga | Colombia | Tonga | Colombia | |
| Culebra Bay | 0.2 | 0.1† | 1.2 | -1.4 | 1.6 | -2.6 |
| Potrero | 0.5 | -0.1† | 2.0 | -0.9† | 8.1* | -7.2 |
| Tamarindo | 0.1† | -0.3 | 2.4* | -4.9* | -0.7 | -6.7 |
| Samara | 0.3 | -0.9 | 0.9 | -2.1 | 3.4 | -10.3* |
| Tambor | 1.6* | -0.7 | 4.5 | -4.0 | 2.6 | -4.1 |
| Jaco | 0.3 | -0.3 | 1.4 | -1.1 | 0.0† | 0.0† |
| Quepos | -0.4 | -1.2* | -0.4† | -1.4 | -0.1 | -4.1 |
Disclaimer/Publisher’s Note: The statements, opinions and data contained in all publications are solely those of the individual author(s) and contributor(s) and not of MDPI and/or the editor(s). MDPI and/or the editor(s) disclaim responsibility for any injury to people or property resulting from any ideas, methods, instructions or products referred to in the content. |
© 2025 by the authors. Licensee MDPI, Basel, Switzerland. This article is an open access article distributed under the terms and conditions of the Creative Commons Attribution (CC BY) license (https://creativecommons.org/licenses/by/4.0/).
Copyright: This open access article is published under a Creative Commons CC BY 4.0 license, which permit the free download, distribution, and reuse, provided that the author and preprint are cited in any reuse.


