Submitted:
14 May 2025
Posted:
14 May 2025
You are already at the latest version
Abstract
The shear strength properties of ionic rare earth ore bodies are directly related to the stability of mine slopes, which provides important theoretical and engineering support for preventing geological disasters and ensuring the safe extraction of resources. This study investigates the effects of different confining pressures, leaching agent types, and MgSO₄ concentrations on the shear strength of ionic rare earth ores through triaxial shear tests. Scanning electron microscopy (SEM) analysis of post-shear mineral samples was conducted to examine the microscopic pore structure, revealing the evolution patterns of the ionic rare earth ore's microscopic pore structure under various leaching conditions. The results show that the shear strength of the ore body varies significantly under different leaching conditions. After leaching, the shear strength values of the ore body, ranked from highest to lowest, are: (NH₄)₂SO₄ > MgSO₄ > Al₂(SO₄)₃ > pure water. The (NH₄)₂SO₄ leaching group exhibited an average shear strength approximately 9.8% higher than the pure water group. When comparing the cohesion and internal friction angle of the pure water leaching group, the (NH₄)₂SO₄ leached ore body showed significantly higher cohesion and a smaller internal friction angle. In contrast, the MgSO₄ and Al₂(SO₄)₃ leaching groups demonstrated lower cohesion and higher internal friction angles. As the MgSO₄ concentration increases, the cohesion of the ore body gradually decreases, the internal friction angle increases, and the shear strength correspondingly increases. Under low-concentration MgSO₄ leaching, the number and area of pores in the ore samples initially increase and then decrease, leading to a more complex pore structure. At higher concentrations of MgSO₄, the variety of pore shapes increases and becomes more complex, pore randomness decreases, the probability entropy value decreases, and the pore distribution becomes more ordered.
Keywords:
Ionic rare earth
; Strength characteristics
; Leaching agents
; Pore structure
; Microcosmic mechanism
1. Introduction
Rare earths are often referred to as the “mother of new materials” and “industrial gold,” and are widely used in cutting-edge technological fields such as optics, electronic information, aerospace, and nuclear industries [1,2]. Ionic rare earths, also known as weathered crust elution rare earths, are rich in medium and heavy rare earth elements and are predominantly found in southern regions such as Jiangxi, Fujian, and Guangxi [3]. As an important strategic resource in China, ionic rare earths hold substantial economic value. In ionic rare earth deposits, rare earths are adsorbed onto clay minerals in the form of hydrated cations or hydroxylated cations, with characteristics such as a complete distribution, high content of heavy rare earth elements, low radioactivity contrast, high comprehensive utilization value, and simple extraction processes [4,5]. The mining of ionic rare earths has gone through three generations of mining processes: pool leaching, heap leaching, and in-situ leaching. In-situ leaching, known for its high efficiency, environmental friendliness, and low cost, has been widely adopted in areas with favorable geological conditions [6,7,8,9]. The in-situ leaching process involves injecting leaching agents into the ore body through a well network from the mountain top, without disturbing surface soil or vegetation. After sufficient ion exchange reactions between the leaching agent and the rare earths, the rare earth ions on the clay surface are desorbed by the cations in the leaching agent, forming rare earth leachate, which then flows into a collection pool at the mountain’s base through the collection tunnel [10,11,12,13]. In-situ leaching requires the injection of large volumes of leaching agent, placing the ore body in a complex environment of prolonged liquid injection, high saturation, enhanced chemical reactions, and combined self-weight and additional stress. This process gradually weakens the inter-particle structure and cohesion, resulting in a continuous decrease in the shear strength of the ore body [14,15]. During this process, the bond between mineral particles in the leached area is weakened, particle rearrangement and framework displacement occur, leading to changes in the effective stress of the ore body. These alterations significantly affect the pore structure of the ore body, decreasing the stability of the rock-soil mass and increasing the risk of geological disasters such as landslides [16,17]. This study examines the impact of different leaching actions on the shear strength properties of ionic rare earth ores and, through microscopic structural characterization, provides a theoretical basis for slope stability analysis and the development of safe mining plans in the in-situ leaching process of ionic rare earth deposits.
In the context of the safe and efficient mining of ionic rare earths, many scholars have made valuable scientific contributions and research advancements. Chen [18] conducted shear tests on ionic rare earth ores after leaching with 3% (NH4)2SO4. The results showed that after leaching, the cohesion of the mineral samples decreased, and the cohesion of each layer of the ore samples was lower than that of the pre-leaching samples. The internal friction angle was greater than that of the pre-leaching samples, and the internal friction angle increased progressively from the top to the bottom of the ore layers. Chen et al. [19] conducted direct shear tests on rare earth ore samples subjected to varying leaching durations using a simulated leaching apparatus, and analyzed the influence of leaching agents on the shear strength of the ore body. The study elucidated the underlying mechanisms by which leaching time affects cohesion and internal friction angle. Huang et al. [20], using triaxial compression tests, analyzed the effects of different concentrations of (NH4)2SO4 leaching agents on the shear strength of the samples during the leaching process. The infiltration of the leaching agent increased soil porosity, and intense chemical reactions occurred between (NH4)2SO4 and the rare earth ores during the leaching process, altering the internal structure of the ores and weakening the strength of the ionic rare earth ore body. Peng et al. [21] conducted zeta potential tests, particle size distribution tests, and direct shear tests to reveal the effects of different concentrations of (NH4)2SO4 leaching agents on the thickness of the double electric layer, particle size distribution, and shear strength parameters of the ion-adsorbed rare earth ore samples.
Wang et al. [22] conducted leaching tests and nuclear magnetic resonance (NMR) tests to investigate the chemical and physical effects of (NH4)2SO4 leaching during ion exchange and infiltration. These effects alter the stability of fine particles, causing them to migrate and leading to changes in the pore structure. At low confining pressures (50 kPa and 100 kPa), the shear behavior of the samples transitioned from strain hardening to strain softening, and the peak strength of the rare earth samples increased. Zhou et al. [23] carried out triaxial tests on rare earth ore bodies at different leaching times, developed a constitutive model for the stress-strain behavior of the rare earth samples, and analyzed the pore structure changes in the ore body using NMR technology. Yin et al. [24,25] performed direct shear tests on ionic rare earth ore samples with varying porosity ratios and developed a model linking porosity ratio to shear strength indicators, revealing the influence mechanism of porosity ratio on the cohesion and internal friction angle of the samples. Guo et al. [26] utilized digital image analysis to study the microstructural evolution of pore size, distribution, and shape at different depths before and after leaching in rare earth ore samples. Liu et al. [27] conducted direct shear tests and X-ray diffraction (XRD) analysis under varying normal stresses to examine the effect of particle size on the shear strength of rare earth ore samples, revealing the influence mechanism of particle size on cohesion and internal friction angle. Zhang et al. [28] performed laboratory leaching simulation experiments to compare and analyze the changes in Zeta potential during leaching with different concentrations of leaching agents. They explored the transformation of the pore structure during the leaching process and found that the pure water leaching process had minimal impact on the ore body’s pore structure, whereas the MgSO4 solution leaching process induced significant changes in the ore body’s pore structure. Currently, research on the strength change laws of ionic rare earth ore bodies under various leaching conditions remains incomplete, and there is limited research on how different leaching agents and their concentrations affect the strength characteristics of ionic rare earths. Therefore, studying the variations in ore body strength characteristics under different leaching conditions is crucial for understanding the intrinsic mechanisms behind shear strength changes in ionic rare earths.
This study focuses on ionic rare earth ores from southern China and utilizes the GDS stress-path triaxial apparatus to conduct triaxial shear tests. It aims to investigate the variations in shear strength of ionic rare earths after leaching with different types of leaching agents and varying concentrations of MgSO4. Scanning electron microscope (SEM) analysis was performed on the ore samples before and after treatment with different concentrations of leaching agents, investigating the effects of different leaching actions on the microstructure of ionic rare earths. The findings provide a theoretical foundation for understanding the macroscopic strength characteristics of ionic rare earths, offer theoretical support for enhancing rare earth extraction efficiency, and provide theoretical guidance for landslide prevention and safe mining practices.
2. Experimental Materials and Methods
2.1. Test Samples
The soil samples used in the experiment were collected from a rare earth mining area in Longyan City, Fujian Province. Sampling was performed manually around the injection wells, with samples taken from depths of 1 to 3 meters below the surface. In accordance with relevant standards, basic physical properties, including density, moisture content, liquid limit, and plastic limit, of the undisturbed soil were measured, as shown in Table 1. The particle size distribution curve is presented in Figure 1. Based on the soil engineering classification standard, the plasticity index (IP) is 12.6 (≥7) and the liquid limit (WL) is 41.83 (<50%). Judging by the liquid limit and plasticity index, this soil is classified as low liquid limit silty clay.
The mineral composition of the soil samples was determined using an X-ray diffractometer (XRD). X-ray fluorescence (XRF) uses X-rays to excite characteristic radiation emitted by elements in the mineral samples, enabling the analysis of their elemental composition and concentration. The primary elemental composition of the soil samples, as determined in the experiment, is presented in Table 2.
2.2. Experimental Equipment
In this experiment, triaxial shear tests were conducted using the GDS Stress-Path Triaxial Testing System. A photograph of the device is shown in Figure 2, and a schematic of the pressure chamber is shown in Figure 3. Developed by Geomaterials Instruments Technology Ltd. (Europe and America), this geotechnical testing device is primarily used for conducting triaxial shear tests and is designed to investigate the mechanical properties and behavior of mineral samples under complex stress paths.
In this study, scanning electron microscopy (SEM) was conducted using the MLA650F field emission scanning electron microscope to analyze the microstructural pore characteristics of the samples. The instrument and its operating principle are illustrated in Figure 4.
Prior to SEM testing, the sample was mounted on a copper stub using conductive adhesive, and loose particles were removed to enhance image clarity. As the sample consisted of dried powdered rare earth material, gold sputter coating was performed using a specimen coater to improve electrical conductivity. After coating, the sample was placed in the observation chamber of the electron microscope, where the chamber was evacuated and high voltage was applied. During observation, well-preserved and representative microstructural regions were selected and examined progressively from low to high magnification. SEM images of the selected areas were captured and saved.
2.3. Experimental Design
This study focuses on examining the influence of different types and concentrations of leaching agents on the shear strength of ionic rare earths. Triaxial shear tests were conducted under confining pressures of 50 kPa, 100 kPa, and 150 kPa. The leaching test conditions were designed as follows:
- (1) Leaching agent types: Pure water, 6% (NH4)2SO4, 6% MgSO4, and 6% Al2(SO4)3 solutions were selected as leaching agents, with a leaching duration of 48 hours.
- (2) Leaching agent concentrations: MgSO4 solutions with concentrations of 3%, 6%, and 9% were used, also with a leaching duration of 48 hours.
The detailed experimental conditions are listed in Table 3.
After completing the triaxial shear tests, the samples were removed from the apparatus, immediately wrapped in plastic film, and stored in a test cabinet. The pure water condition was used as the control group, while the 6% (NH4)2SO4, 6% MgSO4, and 6% Al2(SO4)3 conditions served as test groups for different leaching agent types. The 3%, 6%, and 9% MgSO4 conditions were designated as test groups for varying leaching agent concentrations. Each condition was tested under confining pressures of 50 kPa, 100 kPa, and 150 kPa, resulting in a total of 18 samples. Prior to SEM analysis, all samples were retrieved, and soil was taken from the central part of each specimen, placed in a container, and oven-dried at 105°C for 12 hours to remove internal moisture. After drying, the mineral samples from each condition were placed into labeled sealed bags and submitted for testing.
3. Shear Strength Test Analysis
3.1. Effect of Leaching Agent Type on the Shear Strength of Ionic Rare Earths
(1) Shear Strength Variation Under Different Leaching Conditions
To examine how different leaching agents affect the shear strength of ionic rare earth ores, simulated leaching was conducted using three agents at a concentration of 6%: (NH4)2SO4, MgSO4, and Al2(SO4)3. Pure water was used as the control group. Based on the results of triaxial shear tests, stress–strain curves were plotted for ore samples subjected to each leaching condition. The stress–strain responses of the control group and the various leaching agent test groups are shown in Figure 5.
As shown in the figure, under pure water conditions, the ionic rare earth sample reaches its peak stress at relatively low strain, and the stress–strain curve displays strain hardening behavior, indicating the onset of structural failure within the soil. In contrast, the samples treated with leaching agents exhibit more pronounced strain hardening characteristics, suggesting that the leaching agents help delay the onset of plastic deformation or structural failure in the soil.
According to relevant standards, shear strength was defined as the stress corresponding to 15% axial strain. The shear strength of ionic rare earth ore bodies under different leaching agent conditions is presented in Figure 6.
As shown in the figure, under identical effective confining pressures, the shear strength of samples leached with 6% (NH4)2SO4 was consistently higher than that of the other groups, with the strength enhancement becoming more pronounced as confining pressure increased. At lower confining pressures, the shear strength of samples treated with 6% MgSO4 and 6% Al2(SO4)3 exhibited minimal variation. However, at 150 kPa, the chemical reactions between the leaching agents and the ionic rare earth minerals became more extensive, resulting in a more noticeable improvement in shear strength. In summary, the post-leaching shear strength of the ore samples decreased in the following order: (NH4)2SO4 > MgSO4 > Al2(SO4)3 > pure water. On average, the shear strength of the (NH4)2SO4 leaching group was approximately 9.8% higher than that of the pure water group.
This can be attributed to the strong ion exchange capacity of NH4⁺, which may substitute for cations such as La³⁺ and Ce³⁺ in the rare earth minerals, leading to the formation of a stable cemented structure. In addition, (NH4)2SO4 may facilitate the formation of sulfate minerals (e.g., ammonium alum), which can fill pore spaces and enhance interparticle bonding. In contrast, Mg²⁺ has a lower charge density and weaker ion exchange ability than NH4⁺, resulting in limited enhancement of interparticle cohesion and weak cementation, which is insufficient to maintain structural integrity. Although Al³⁺ has a high charge density, it may hydrolyze to form colloidal Al(OH)3, which tends to clog pores and reduce permeability, thereby limiting its cementation effect.
(2) Analysis of Shear Strength Parameters Under Different Leaching Agent Conditions
To obtain the shear strength parameters of ionic rare earth ores—namely, cohesion (σ) and internal friction angle (φ)—Mohr’s circles were constructed based on the principal stresses derived from stress–strain data under various leaching agent conditions. The values of cohesion and internal friction angle for ionic rare earths treated with pure water,6% (NH4)2SO4, 6% MgSO4, and 6% Al2(SO4)3 are presented in Figure 7.
As shown in the figure, at a leaching agent concentration of 6%, the cohesion of the ionic rare earth samples was highest under (NH4)2SO4 leaching, followed by MgSO4, and lowest under Al2(SO4)3. Compared to the pure water condition, the cohesion increased by 31.6% under (NH4)2SO4, while it decreased by 21.0% and 33.2% under MgSO4 and Al2(SO4)3, respectively. The internal friction angle was lowest under (NH4)2SO4 leaching, whereas significantly higher values were observed under MgSO4 and Al2(SO4)3. Relative to the pure water condition, the internal friction angle decreased by 21.1% under (NH4)2SO4, while it increased by 2.8% and 1.9% under MgSO4 and Al2(SO4)3, respectively.
It is believed that during the leaching process, (NH4)2SO4 undergoes ion exchange reactions with soil minerals, particularly replacing cations in clay minerals. The NH4⁺ ions in (NH4)2SO4 are highly hydrophilic, promoting hydration between soil particles and enhancing cementation, which strengthens the interparticle bonding and cohesive forces. Additionally, the introduction of (NH4)2SO4 increases the concentration of exchangeable cations in the soil, further promoting particle aggregation and cementation, thereby enhancing cohesion. Meanwhile, the hydrophilic NH4⁺ ions increase surface lubrication between particles, reducing interparticle friction. Moreover, the presence of (NH4)2SO4 increases the thickness and zeta potential of the electrical double layer on particle surfaces, intensifying electrostatic repulsion. This enhanced repulsive force hinders close contact and interlocking among particles, making them more prone to sliding under external stress, which manifests macroscopically as a reduced internal friction angle.
Mg²⁺ ions in MgSO4 solution participate in ion exchange with cementing agents in the soil. As divalent cations, Mg²⁺ can replace existing monovalent or divalent cations (such as Na⁺ and Ca²⁺) that contribute to interparticle bonding, thereby weakening the cementation effect. The introduction of Mg²⁺ also reduces particle hydration and undermines the structural stability of the soil, leading to diminished interparticle interactions and a decrease in cohesion. Moreover, Mg²⁺ alters the electrochemical properties of particle surfaces, reducing adhesion and further weakening cohesive strength.
However, due to its small ionic radius and high charge density, Mg²⁺ is capable of forming strong ionic bridges between particle surfaces through ion exchange with ionic rare earth particles. These bridges function like “glue,” tightly linking particles and making relative sliding or displacement under stress more difficult, thus increasing the internal friction angle. Additionally, Mg²⁺ compresses the electrical double layer surrounding soil particles, reducing electrostatic repulsion and promoting aggregation. The resulting particle clusters are larger and more resistant to shear deformation, with enhanced interparticle friction—further contributing to the increase in internal friction angle [29].
Although the effect of Al2(SO4)3 is similar to that of MgSO4, the influence of Al³⁺ ions is more pronounced. As trivalent cations, Al³⁺ exhibit strong electrostatic attraction, enabling closer interactions with anions in the soil matrix. Compared with other leaching agents, Al³⁺ ions produce a stronger charge shielding effect, which suppresses hydration and adhesion between soil particles, leading to a significant reduction in cohesion. The high charge density of Al³⁺ enhances the electrostatic field around particles, increasing interparticle repulsion. Under hydrated conditions, Al³⁺ interacts intensely with water molecules, modifying the surface properties of soil particles and further weakening cementation.
Furthermore, the hydrolysis of Al2(SO4)3 generates various ions and compounds, complicating the surface charge environment. On one hand, polynuclear hydroxy-aluminum species increase the positive surface charge, thereby enhancing electrostatic attraction between particles. On the other hand, these hydrolysis products alter the distribution of surface potential, complicating interparticle interactions and diminishing effective interlocking and friction. As a result, the increase in internal friction angle is relatively limited.
3.2. Effect of Different MgSO4 Concentrations on the Shear Strength of Ionic Rare Earth Ores
(1) Shear Strength Variation Under Different MgSO4 Concentrations
To investigate how the shear strength of ionic rare earth ores changes under different MgSO4 concentrations, stress–strain curves were obtained for a pure water control group and test groups leached with 3%, 6%, and 9% MgSO4 solutions, as shown in Figure 8.
As shown in the figure, the stress–strain curve of the ionic rare earth ore under pure water conditions exhibits typical strain-hardening behavior. In the initial phase of the triaxial test, deviatoric stress increases linearly with strain, and gradually approaches a plateau as strain continues to increase. When leached with MgSO4 solutions of varying concentrations, the stress–strain curves under different confining pressures also display strain-hardening characteristics, with a noticeably accelerated hardening rate compared to the pure water group. MgSO4 enhances the chemical reactivity of rare earth elements, effectively facilitating the release of rare earth ions and promoting structural reorganization within the ore matrix. At a concentration of 3%, MgSO4 promotes the early-stage mobilization of smaller particles or ions, leading to a rapid initial hardening effect. Higher concentrations of 6% and 9% further intensify this process, resulting in more complete dissociation of rare earth ions in the aqueous environment, greater structural restructuring of the ore, and increased interparticle friction, all of which contribute to a rapid enhancement of shear strength.
Figure 9 illustrates the variation in shear strength of ionic rare earth ores under different MgSO4 concentrations. At low confining pressure, the shear strength shows no significant difference from the pure water group across varying MgSO4 concentrations. At a confining pressure of 150 kPa, the shear strength increases by 4.14% under 3% MgSO4, 1.55% under 6%, and reaches the highest increase of 4.28% under 9%, compared to the pure water group. As a leaching agent, MgSO4 effectively promotes the dissociation and release of rare earth ions under low confining pressure (e.g., 50 kPa). The interfacial hydration layers formed by the dissociated ions enhance interparticle interactions, thereby improving shear strength. At higher confining pressures, the chemical reactions between MgSO4 and the ionic rare earth minerals become more pronounced, influencing the restructuring and rearrangement of the soil particle fabric and resulting in increased shear strength.
(2) Analysis of Shear Strength Parameters Under Different MgSO4 Concentrations
Mohr’s circles were constructed based on the stress–strain curves to derive the shear strength parameters of the ionic rare earth ore, namely cohesion σ and internal friction angle φ. Using experimental data from samples leached with various MgSO4 concentrations, the effects of MgSO4 on shear strength parameters were analyzed, with the pure water group serving as the control. The variations in cohesion and internal friction angle under different MgSO4 concentrations are presented in Figure 10.
As shown in the figure, the cohesion of the ionic rare earth ore decreased across all MgSO4 test groups compared to the pure water control. With increasing MgSO4 concentration, cohesion exhibited a consistent downward trend, decreasing by 7.88%, 21.07%, and 35.88% under 3%, 6%, and 9% MgSO4, respectively. On average, each 3% increase in MgSO4 concentration resulted in a 11.96% reduction in cohesion. In contrast, the internal friction angle demonstrated a clear upward trend, increasing by 0.42%, 2.81%, and 4.00% under the same concentrations. This corresponds to an average increase of 1.33% in the internal friction angle for every 3% rise in MgSO4 concentration.
This analysis suggests that the observed reduction in cohesion is primarily attributed to the competitive interactions of Mg²⁺ and SO4²⁻ ions within the electrical double layer at soil particle interfaces, which weaken interparticle contact and attractive forces. As MgSO4 concentration increases, pore water is progressively replaced, altering the soil’s internal pore structure and reducing the adhesive capacity between particles. This process also elevates pore water pressure, further diminishing the effectiveness of interparticle contact. Under the influence of MgSO4, soil particles undergo significant rearrangement, leading to changes in contact angles and interaction patterns. The resulting increase in relative particle movement enhances frictional contact between particles, thereby contributing to the observed increase in internal friction angle.
4. Microscopic Mechanism Analysis
4.1. SEM Morphological Analysis Under Different MgSO4 Concentrations
The original scanning electron microscopy (SEM) images were grayscale and required post-processing for pseudo-coloring. Image coloration was based on a grayscale threshold, with higher values corresponding to lighter shades. The optical threshold was determined using PCAS image processing software to generate binarized images, where black regions indicate ore particles and white regions correspond to pores. Particle–pore boundaries in the SEM images were delineated using a pore segmentation method [30,31]. To ensure clear visualization of particle morphology within the observation plane, SEM imaging was performed from low to high magnification, and images at 8000× magnification were ultimately selected for comparative analysis.
To investigate the structural evolution of ore sample microstructures under different leaching agent concentrations, four experimental conditions—pure water (0%), 3% MgSO4, 6% MgSO4, and 9% MgSO4—were established at confining pressures of 50 kPa, 100 kPa, and 150 kPa. SEM analyses were conducted under these leaching conditions to assess the influence of MgSO4 concentration on microstructural changes in the samples. At a confining pressure of 50 kPa, the original and processed SEM images for samples treated with different MgSO4 concentrations are shown in Figure 11.
As shown in the figure, under a confining pressure of 50 kPa, the ore samples exhibit relatively concentrated distributions of large pores, predominantly angular in shape. Under the 3% MgSO4 condition, the pore distribution remains concentrated, with primarily angular pores indicative of an initially fragmented particle structure. At 6% MgSO4, the number of pores is reduced compared to other samples, with a more dispersed distribution pattern and a combination of angular and elongated morphologies. In the 9% MgSO4 condition, pores are more widely dispersed and predominantly elongated, with increased pore interconnectivity. Comparative analysis indicates that with increasing MgSO4 concentration, the pore distribution shifts from concentrated to dispersed, and pore morphology evolves from a predominantly angular form to a composite structure characterized by both angular and elongated features.
Under a confining pressure of 100 kPa, the SEM images and processed images of ionic rare earth samples subjected to different MgSO4 concentrations are shown in Figure 12.
As shown in the figure, under a confining pressure of 100 kPa, the ore sample treated with 3% MgSO4 exhibits predominantly angular pores with uniform spatial distribution. At 6% MgSO4, both the number and average area of pores increase; small pores coalesce into larger ones, and pore shapes become more complex, primarily block-shaped. Under 9% MgSO4, the pore quantity increases markedly, average pore area further enlarges, and the morphology becomes more irregular, with most pores exhibiting block-shaped and elongated forms. This suggests that at 3% concentration, secondary fragmentation of particles dominates, resulting in finer pore structures. In contrast, at higher concentrations (6% and 9%), the synergistic effect of crystallization-induced compaction and confining pressure promotes the development of a stable particle skeleton, leading to increased pore area.
Under a confining pressure of 150 kPa, the SEM images and processed images of ionic rare earth samples subjected to different MgSO4 concentrations are shown in Figure 13.
As shown in the figure, at a confining pressure of 150 kPa, the sample treated with 3% MgSO4 exhibits predominantly angular pores, with multiple pores coalescing into large macropores. The soil particles appear relatively disaggregated. Under the 6% MgSO4 condition, the number of pores increases, the average pore area decreases, and the pore distribution becomes more uniform; the soil particles appear more fragmented. In the 9% MgSO4 condition, the number of pores decreases, the average pore area further diminishes, and the distribution becomes more concentrated.
4.2. Quantitative Analysis of Microscopic Pore Structure
A quantitative analysis was conducted to investigate the evolution of the microscopic pore structure of the ore samples before and after leaching, focusing on three key aspects: pore proportion, pore distribution, and pore morphology.
(1) Pore Proportion
In this study, pore sizes were classified as follows: micropores (<4 μm), small pores (4–16 μm), medium pores (16–64 μm), large pores (64–256 μm), and macropores (>256 μm). SEM images were processed at a consistent magnification of 8000× using images of identical dimensions (1536 × 1103 pixels). According to the scale bar, each image corresponds to a real area of 51.2 μm × 36.8 μm, yielding a resolution of 30 pixels/μm. Based on this resolution, the corresponding pixel-based classification is as follows: micropores (<120 pixels), small pores (120–480 pixels), medium pores (480–1920 pixels), large pores (1920–7680 pixels), and macropores (>7680 pixels). The proportions of each pore size category and the total number of pores for the ore samples under different test conditions are summarized in Table 5. The variation in pore structure with MgSO4 concentration is shown in Figure 14.
Under a confining pressure of 50 kPa, the proportions of large and macropores gradually increase with rising MgSO4 concentration, although the overall variation remains modest. Medium pores exhibit a non-linear trend, initially decreasing, then increasing, and subsequently decreasing again. Small pores show a complementary pattern, with an initial increase followed by a decrease and a subsequent rise.
Under a confining pressure of 100 kPa, the proportion of large pores remains relatively stable across the concentration gradient. Macropores show minor fluctuations with a slight upward trend, while medium pores vary within a narrow range. In contrast, the proportion of small pores changes more significantly, displaying a decrease followed by an increase.
Under a confining pressure of 150 kPa, the macropore proportion first increases and then decreases, with more pronounced changes than those observed under lower confining pressures. Large pores consistently increase with concentration. Medium pores follow a similar trend as in the other conditions—first decreasing, then increasing, and decreasing again. The proportion of small pores shows a clear downward trend.
Under different conditions, the proportion of pores at each scale evolves through a synergistic regulation mechanism driven by the combined effects of MgSO4 concentration and confining pressure. At low confining pressure, the variation in pore size distribution is mainly governed by the ion exchange reaction involving Mg²⁺, which leads to the breaking of hydrogen bonds between clay mineral layers and promotes the initiation of microcracks. Meanwhile, the dynamic balance between cementation and dispersion causes fluctuations in the proportions of medium and small pores. At high confining pressure, the influence of MgSO4 on pore size distribution becomes more pronounced. The increase in confining pressure allows the leaching agent to react more fully with the sample, promoting the merging of small pores into medium pores, while macropores are decomposed into multiple large or medium pores during the exchange process.
(2) Pore Distribution Rose Diagram
The pore distribution rose diagram, also known as a “polar plot,” is a graphical representation in polar coordinates that illustrates the relationship between pore distribution and characteristics such as pore size, shape, and orientation. Each sector corresponds to a specific range of pore characteristics, and the size and height of each sector indicate the number and proportion of pores within that range. The rose diagram enables a more intuitive observation and analysis of pore distribution patterns and effectively reflects the consistency and diversity of different pore types within the sample. The rose diagrams of pore distribution, drawn based on SEM images of the samples after testing, are shown in Figure 15.
As shown in the figure, under a confining pressure of 50 kPa, the rose diagram for the pure water condition reveals a well-developed and relatively concentrated pore space, indicating that the material remains loosely structured and has not undergone significant compaction at this stress level. With 3% MgSO4, the pore distribution becomes more uniform, and the number of pores decreases. At 6% concentration, the distribution trend continues toward homogenization, reflected in the diagram by fewer sectors and a denser overall structure. At 9%, the pore morphology becomes more intricate and tightly packed, suggesting a pronounced compaction effect. This trend is attributed to the presence of MgSO4, which facilitates partial compaction of the pore structure. The MgSO4 solution interacts with soil particles, enhancing interparticle bonding. At higher concentrations, the intensified ion exchange promotes particle aggregation, thereby reinforcing the structural integrity of the granular skeleton.
Under a confining pressure of 100 kPa, the pore distribution under the 3% MgSO4 condition becomes further homogenized, accompanied by a noticeable reduction in pore size, indicating that this concentration effectively facilitates pore compaction. At 6% MgSO4, the pore structure exhibits increased stability, characterized by finer and more uniformly distributed pores—likely resulting from the enhanced chemical interactions of MgSO4 at this concentration. At 9%, the pores demonstrate a higher degree of compaction, with the emergence of more diverse and complex pore configurations, suggesting that increased MgSO4 concentration leads to further refinement and densification of the pore structure.
Under a confining pressure of 150 kPa, the pore structure in the pure water condition appears dense, indicating a high level of compaction and structural stability. In the 3% MgSO4 condition, the pore structure remains relatively compact, with further enhancement suggesting improved compressive resistance, likely due to hydration effects and increased interparticle affinity. At a concentration of 6%, the pore structure becomes more uniform and exhibits a more complex morphology compared to previous cases, suggesting that higher MgSO4 concentration effectively promotes structural cohesion and reinforcement. Under the 9% MgSO4 condition, the changes in pore structure are most evident, resulting in a denser and more tightly packed configuration. With increasing MgSO4 concentration, the rose diagrams under high confining pressure show significant changes, reflecting the compaction and reorganization of the pore network. These transformations are driven not only by chemical interactions but also by physical effects such as particle rearrangement and stress-induced densification.
(1) Probability Entropy
Probability entropy is a metric used to measure the uncertainty or degree of disorder in a system. In information theory, entropy can be understood as the average uncertainty or information content. In the context of data analysis, it can be used to quantify the diversity, distribution patterns, or structural complexity of a sample. For the analysis of pore distribution in ionic rare earth samples, entropy can be applied to quantitatively evaluate the uniformity and distribution characteristics of the pores. From a microscopic perspective, this study employs probability entropy to reveal the variation patterns in pore distribution. The calculation formula is shown in Equation (1).
 |
(1) |
In the equation, the value of Hi ranges from 0 to 1, where a higher value indicates a more disordered arrangement of particles and pore units. When Hi =0, all pores are oriented in the same direction; when Hi =1, the pore orientations are entirely divergent. Pi represents the proportion of pores falling within a specific angular interval, and n is the number of equal intervals dividing the 0°–180° range—for example, if the interval is 10°, then n=18. The calculated probability entropy variations for different regions are illustrated in Figure 16.
As illustrated in the figure, under a confining pressure of 50 kPa, the sample treated with 3% MgSO4 exhibits the highest probability entropy, indicating the greatest degree of disorder in its pore structure. As the MgSO4 concentration increases to 6% and 9%, the entropy values exhibit a slight decline, reflecting a more uniform and orderly distribution of microscopic pores within the ore samples.
Under a confining pressure of 100 kPa, the entropy value under the 3% MgSO4 condition is lower than that of the pure water condition, indicating a more ordered pore structure. As the MgSO4 concentration increases, the probability entropy initially rises and then falls, with the highest entropy observed at 6%, suggesting that this concentration results in the most heterogeneous and disordered pore distribution, exerting the greatest influence on the sample’s microstructural evolution. The entropy values for 3% and 9% MgSO4 are relatively close, indicating that both insufficient and excessive MgSO4 concentrations can induce particle aggregation and pore compaction, thereby increasing structural heterogeneity.
Under a confining pressure of 150 kPa, the probability entropy for the pure water condition remains comparable to that observed at 100 kPa, while the entropy value for the 3% MgSO4 condition exhibits a more pronounced decrease. With increasing MgSO4 concentration, the probability entropy initially rises and then drops sharply, indicating that under high confining pressure, the uniformity of the pore structure is more sensitive to changes in leaching agent concentration. The entropy reaches its lowest value at 9% MgSO4, suggesting that at this concentration, pore structure diversity and uniformity are significantly reduced, reflecting intensified particle aggregation and an overall trend of structural compaction.
(2) Fractal Dimension
Fractal dimension is a powerful tool for understanding and analyzing complex structures, offering a more refined geometric characterization than traditional Euclidean dimensions. It reflects the space-filling capacity of irregular shapes. SEM observations of rare earth ore samples reveal that the microscopic pore structures exhibit pronounced fractal characteristics. Accordingly, fractal theory is applied to quantitatively investigate variations in pore morphology. The fractal dimension of pore shape is derived from the relationship between pore area and shape factor, expressed by the following equation:
 |
(2) |
In the equation, Df denotes the fractal dimension of the pore shape, which takes values in the range of 1~2, higher values correspond to simpler pore structures. a is a constant, and S represents the pore area. Based on this relationship, the calculated fractal dimensions of pore shapes in the rare earth ore samples are presented in Figure 17.
It can be observed that under a confining pressure of 50 kPa, the fractal dimension of the pore structure exhibits a slight initial increase followed by a marked decrease as MgSO4 concentration increases. Under 100 kPa, the fractal dimension rises sharply at first and then declines. At 150 kPa, the fractal dimension shows a more complex trend—first decreasing, then increasing, and finally decreasing again with increasing MgSO4 concentration.
In the early stages of leaching, the pore structures in the upper sections of the ore body are more fragmented. As particle migration progresses during the leaching process, the middle and lower sections of the ore body become structurally compensated. With increasing MgSO4 concentration, pore geometries tend to simplify, and the post-leaching pore structures are overall simpler than those prior to leaching. This trend aligns with the observed variation in the average pore shape factor following leaching.
5. Conclusions
- Under the influence of different leaching agents, the particle arrangement and compositional structure of ionic rare earth ores undergo redistribution, leading to distinct trends in shear strength behavior. Following leaching, the shear strength of the ore body ranks in descending order as follows: (NH4)2SO4 > MgSO4 > Al2(SO4)3 > pure water. Compared with the pure water group, leaching with (NH4)2SO4 significantly enhances the cohesion of the rare earth ore samples while markedly reducing the internal friction angle. In contrast, treatment with MgSO4 and Al2(SO4)3 results in decreased cohesion and increased internal friction angle.
- Under varying MgSO4 concentrations, increasing concentration leads to a reduction in cohesion and an increase in internal friction angle. At 3% MgSO4, the leaching agent exerts a relatively mild effect, resulting in minimal changes in shear strength. At 6%, the agent begins to significantly interact with the chemical structure of the ore or soil, contributing to a gradual increase in shear strength. However, at 9% concentration, the intensified chemical reaction induces substantial mineral structural degradation, ultimately reducing the shear strength. Under high confining pressure, the chemical interaction between MgSO4 and the ionic rare earth ore becomes more pronounced, influencing the reorganization and rearrangement of soil particles. Compared with the pure water condition, the enhancement in shear strength is markedly more evident.
- The microscopic pore characteristics of the ore samples vary significantly under different confining pressures. As confining pressure increases, pore morphology evolves from angular to more uniform forms, and the pore structure exhibits a trend of increasing complexity followed by simplification. Pore areas gradually decrease, while the number of pores increases. The proportion of large pores rises, whereas that of super-large pores decreases. The total pore count shows an increasing trend, accompanied by a rise in structural disorder and a corresponding decline in overall pore organization.
- As MgSO4 concentration increases, the pore distribution in the ore samples transitions from a concentrated to a more dispersed pattern, while pore morphology evolves from angular to elongated forms. At lower concentrations, the pores are more numerous and structurally complex; however, with increasing concentration, pore size decreases progressively. The pore distribution becomes increasingly uniform and ordered, and the fractal dimension exhibits greater sensitivity to variation at lower concentrations, indicating a trend toward simpler pore structures.
References
- Huang, X.W.; Long, Z.Q.; Wang, L.S.; Feng, Z.Y. Technology development for rare earth cleaner hydrometallurgy in China. Rare Metals. 2015, 34, 215–222. [Google Scholar] [CrossRef]
- Wang, G.F.; Xu, J.; Ran, L.Y.; Zhu, R.L.; Ling, B.W.; Liang, X.L.; Kang, S.C.; Wang, Y.Y.; Wei, J.M.; Ma, L.Y.; et al. A green and efficient technology to recover rare earth elements from weathering crusts. Nature Sustainability. 2023, 6, 81–92. [Google Scholar] [CrossRef]
- Xie, D.Y.; Li, J.; Huang, Z.H.; Zhu, Y.Y.; Shi, W.H.; Xie, Y.Y.; Zhang, X.X.; Zhang, H.; Qi, T. One-step enrichment of rare earth elements from ionic rare earth leachate by electrochemical precipitation. Separation and Purification Technology. 2025, 357, 129912. [Google Scholar] [CrossRef]
- Zhang, Z.Y.; Sun, N.J.; He, Z.Y.; Chi, R.A. Local concentration of middle and heavy rare earth elements in the col on the weathered crust elution-deposited rare earth ores. Journal of Rare Earths. 2018, 36, 552–558. [Google Scholar] [CrossRef]
- Lan, Q.F.; Zhang, X.L.; Niu, F.; Liu, D.H.; Shen, L.T.; Yang, Y.M. Recovery of rare earth elements and thorium from acid leaching residue of ionic rare earth concentrates. Journal of Rare Earths. 2025, 43, 794–804. [Google Scholar] [CrossRef]
- Guo, Z.Q.; Liu, L.F.; Tang, T.; Zhou, K.F.; Wang, X.J. Influence of Leaching Solution on the Soil-Water Characteristics of Ion-Absorbed Rare Earth Minerals and Its Hysteresis Effect. Minerals. 2023, 13, 637. [Google Scholar] [CrossRef]
- Chen, Z.; Zhang, Z.Y.; He, Z.Y.; Chi, R.A. Mass transfer process of leaching weathered crust elution-deposited rare earth ore with magnesium salts. Physicochemical Problems of Mineral Processing. 2018, 54, 1004–1013. [Google Scholar]
- Chi, R.A.; Liu, X.M. Prospect and Development of Weathered Crust Elution-Deposited Rare Earth Ore. Journal of the Chinese Rare Earth Society. 2019, 37, 129–140. [Google Scholar]
- Zhong, Z.G.; Zhou, H.P.; Hu, J.; Zhang, Y.B.; Luo, X.P.; Feng, B. Research Progress of Green Extraction Technology for Ion-adsorption Type Rare Earths Ore in Southern China. Metal Mine. 2017, 12, 76–81. [Google Scholar]
- Guo, Z.Q.; Liu, L.F.; Zhou, J.R.; Tang, T.; Zhou, K.F.; Wang, X.J. The Effect of Different Leaching on the Water Retention Characteristics of Ion-absorption Type Rare Earth. Chinese Rare Earths. 2024, 45, 107–119. [Google Scholar]
- Wang, J.; Wang, G.S.; Luo, S.H.; Liang, Y.H.; Sun, Z.; Hu, S.L.; Yang, Y.L. The influence of low-permeability geological inclusions on the seepage behavior of ionic rare earth leaching mining: A study using visual microfluidic technology. Minerals Engineering. 2023, 204, 108440. [Google Scholar] [CrossRef]
- Li, Y.X.; Zhou, X.M.; Liu, Y.Z.; Li, D.P.; Li, J.; Tang, Q. Development of High Efficiency Extraction and Separation Technologies of Rare Earths from Ion-Adsorbed Type Deposit. Journal of the Chinese Rare Earth Society. 2012, 30, 257–264. [Google Scholar]
- Zhao, L.S.; Huang, X.W.; Feng, Z.Y.; Liu, D.P.; Zheng, X.D.; Yin, W.Q. Research Progresses and Development Tendency of Pollution Prevention and Control Technologies for Mining of Weathered Crust Elution-deposited Rare Earth Ore. Journal of the Chinese Rare Earth Society. 2022, 40, 988–997. [Google Scholar]
- Balaram, V. Rare earth elements: A review of applications, occurrence, exploration, analysis, recycling, and environmental impact[J]. Geoscience Frontiers. 2019, Vol.10(4): 1285-1303.
- Rao, R.; Li, M.C.; Zhang, S.B.; Rao, Y.Z.; Zhong, J.M. Experimental Study on Landslide Features and Countermeasures of In-situ Leaching Stope of Ion-type Rare Earth Mines. Chinese Rare Earths. 2016, 37, 26–31. [Google Scholar]
- Guo, Z.Q.; Lai, Y.M.; Jin, J.F.; Zhou, J.R.; Sun, Z.; Zhao, K. Effect of Particle Size and Solution Leaching on Water Retention Behavior of Ion-Absorbed Rare Earth[J]. Geofluids. 2020, Vol.2020: 1-14.
- Feng, X.J.; Wang, X.Q.; Zhang, S.R. Dong, C.L. Research status and prospect of particle migration, pore structure evolution and model construction of ionic rare earth in-situ leaching. Chinese Rare Earths 2025, 46, 114–127. [Google Scholar]
- Chen, Z.J. Study on the Change Rule of Shear Strength Parameters of Ionic Rare Earth Ore after Ore Leaching. Mining Research and Development. 2020, 40, 71–74. [Google Scholar]
- Chen, X.; Qi, Y.; Yin, S.H.; Li, X.W.; Xie, F.F.; Liu, J.W.; Chen, W.; Yan, R.F. Law of weakening mechanical properties of rare earth ore with leaching. Journal of Central South University Science and Technology. 2019, 50, 939–945. [Google Scholar]
- Huang, G.L.; Zhuo, Y.L.; Wang, X.J.; Li, Y.X.; Deng, S.Q.; Nie, Y.L. Effects of Different Concentration in Leaching Liquid on Rare Earth Ore’s Strength. Chinese Rare Earths, 2018, 39, 47–54. [Google Scholar]
- Peng, H.; Hu, S.L.; Wang, G.S.; Hong, B.G.; Wang, Y.L. The Influence of Leaching Agent Concentration on the Shear Strength Parameters of Ion-adsorption Rare Earth Ore. Chinese Rare Earths. 2022, 43, 58–64. [Google Scholar]
- Wang, H.; Wang, X.J.; Wang, Y.; Wang, D.H.; Hu, K.J.; Zhong, W.; Guo, Z.Q. Influence of ammonium sulfate leaching agent on engineering properties of weathered crust elution-deposited rare earth ore. Acta Geotechnica. 2024, 19, 1–22. [Google Scholar] [CrossRef]
- Zhou, L.B.; Wang, X.J.; Zhuo, Y.L.; Hu, K.J.; Zhong, W.; Huang, G.L. Dynamic pore structure evolution of the ion adsorbed rare earth ore during the ion exchange process. Royal Society open science. 2019, Vol.6, 191107. [Google Scholar] [CrossRef]
- Yin, S.H.; Qi, Y.; Xie, F.F.; Chen, X.; Wang, L.M. Strength characteristics of weathered crust elution-deposited rare earthores with different porosity ratios. Journal of University of Science and Technology Beijing. 2018, 40, 159–166. [Google Scholar]
- Yin, S.H.; Qi, Y.; Xie, F.F.; Chen, X.; Wang, L.M.; Shao, Y.J. Porosity characteristic of leaching weathered crust elution-deposited rare earth before and after leaching. The Chinese Journal of Nonferrous Metals. 2018, 28, 2112–2119. [Google Scholar]
- Guo, Z.Q.; Wang, H.X.; Liu, Q.Q.; Luo, F.Y.; Liu, Y.S. Microstructure Evolution Law of Ionic Rare Earth at Different Depths in In Situ Leaching Mine Site. Minerals. 2024, 14, 570. [Google Scholar] [CrossRef]
- Liu, D.F.; Zhang, Z.Y.; Chi, R.A.; Xi, Y.L.; Yan, S. Experimental Study on the Influence of Particle Size on the Strength Characteristics of Weathered Crust Elution-deposited Rare Earth Ores. Nonferrous Metals Engineering. 2020, 10, 97–103. [Google Scholar]
- Zhang, X.M.; Gao, Z.Q.; Rao, Y.Z.; Shi, L.; Xu, W. Evolutionary Law of Pore Structure of Ion-Adsorbed Rare Earth Ore Leaching Process. Minerals. 2023, 13, 322. [Google Scholar] [CrossRef]
- Cai, W.Q.; Zhou, D.; Qin, L.; Zhao, Y.H. Study on the adsorption law and morphology distribution of magnesium sulfate in ionic rare earths. Nonferrous Metals Science and Engineering. 2024, 15, 941–951. [Google Scholar]
- Bielicka, M.; Lubecka, M.; Wasilewska, A.; Klekotka, U.; Kalska-Szostko, B. Optimization of measurement conditions in SEM microscopy - a case study. Measurement. 2025, 253, 117513. [Google Scholar] [CrossRef]
- Wang, Y.L.; Han, D.L.; Lin, W.; Jia, Y.Q.; Zhang, J.Z.; Wang, C.C.; Ma, B.Y. Factors Controlling Differences in Morphology and Fractal Characteristics of Organic Pores of Longmaxi Shale in Southern Sichuan Basin, China. Fractal and Fractional. 2024, 8, 555. [Google Scholar] [CrossRef]
Figure 1.
Curve of particle size distribution of the soil samples.

Figure 2.
GDS stress path triaxial apparatus.
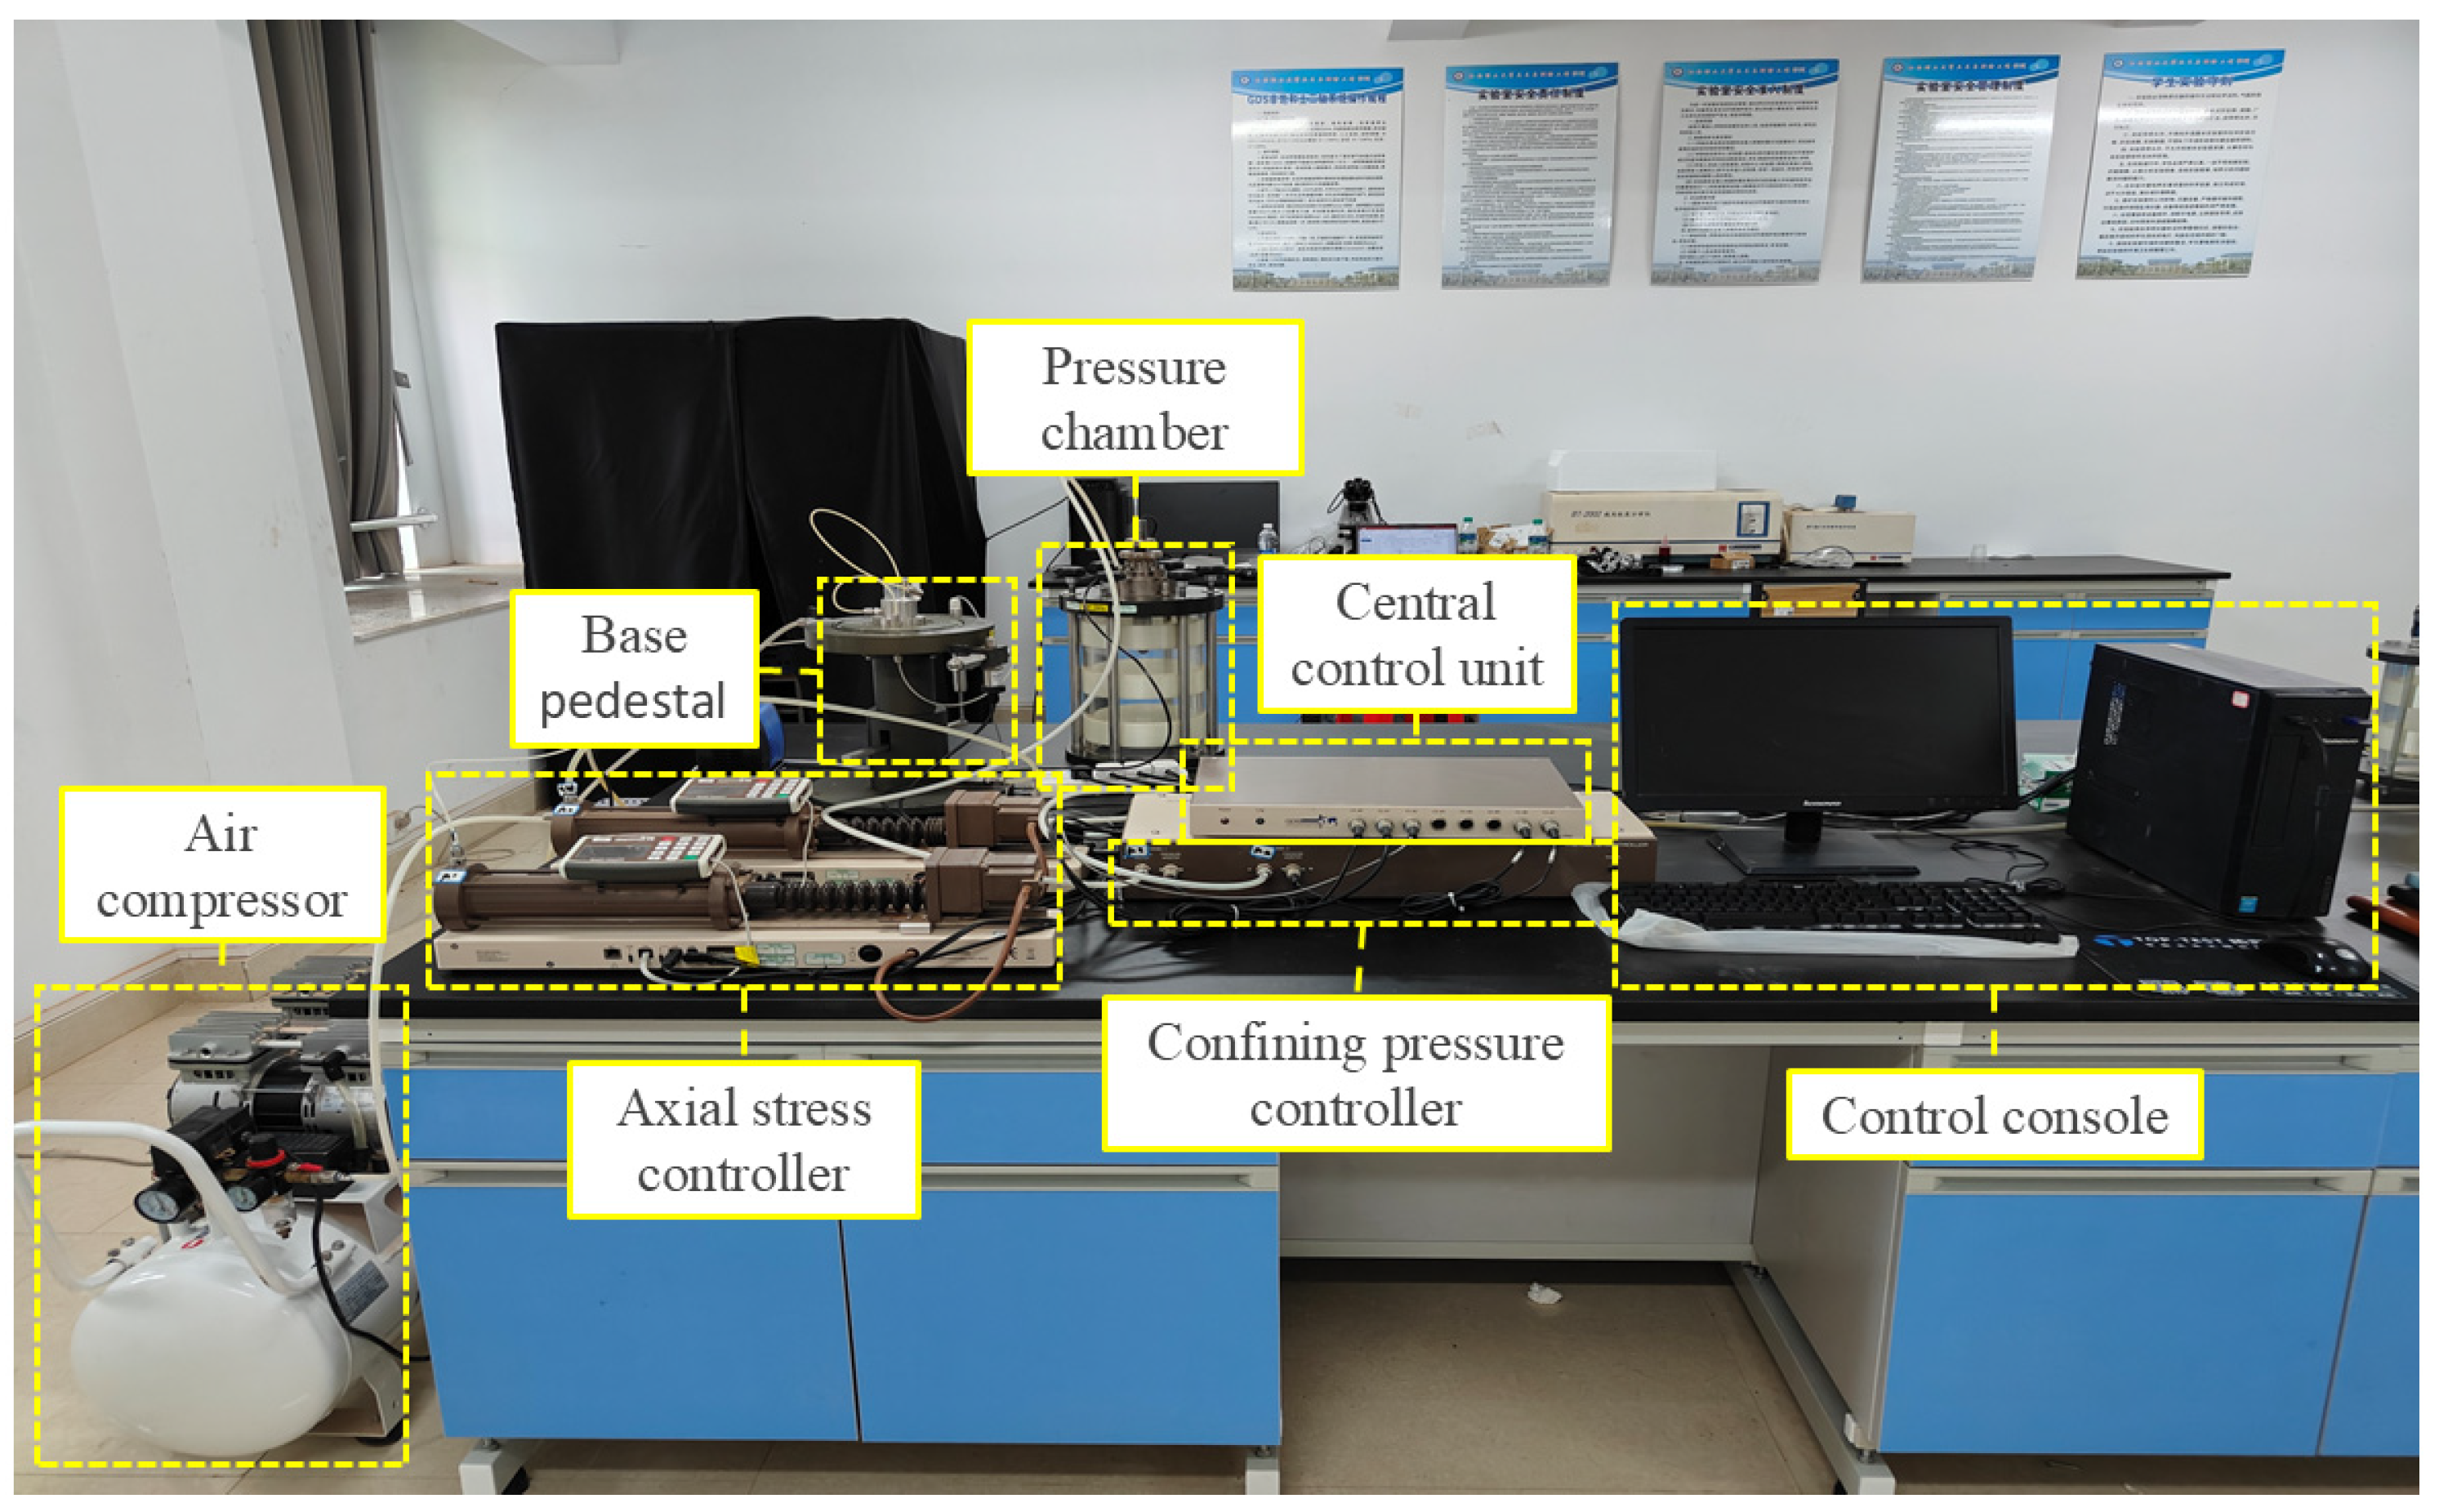
Figure 3.
GDS stress path triaxial pressure chamber diagram.
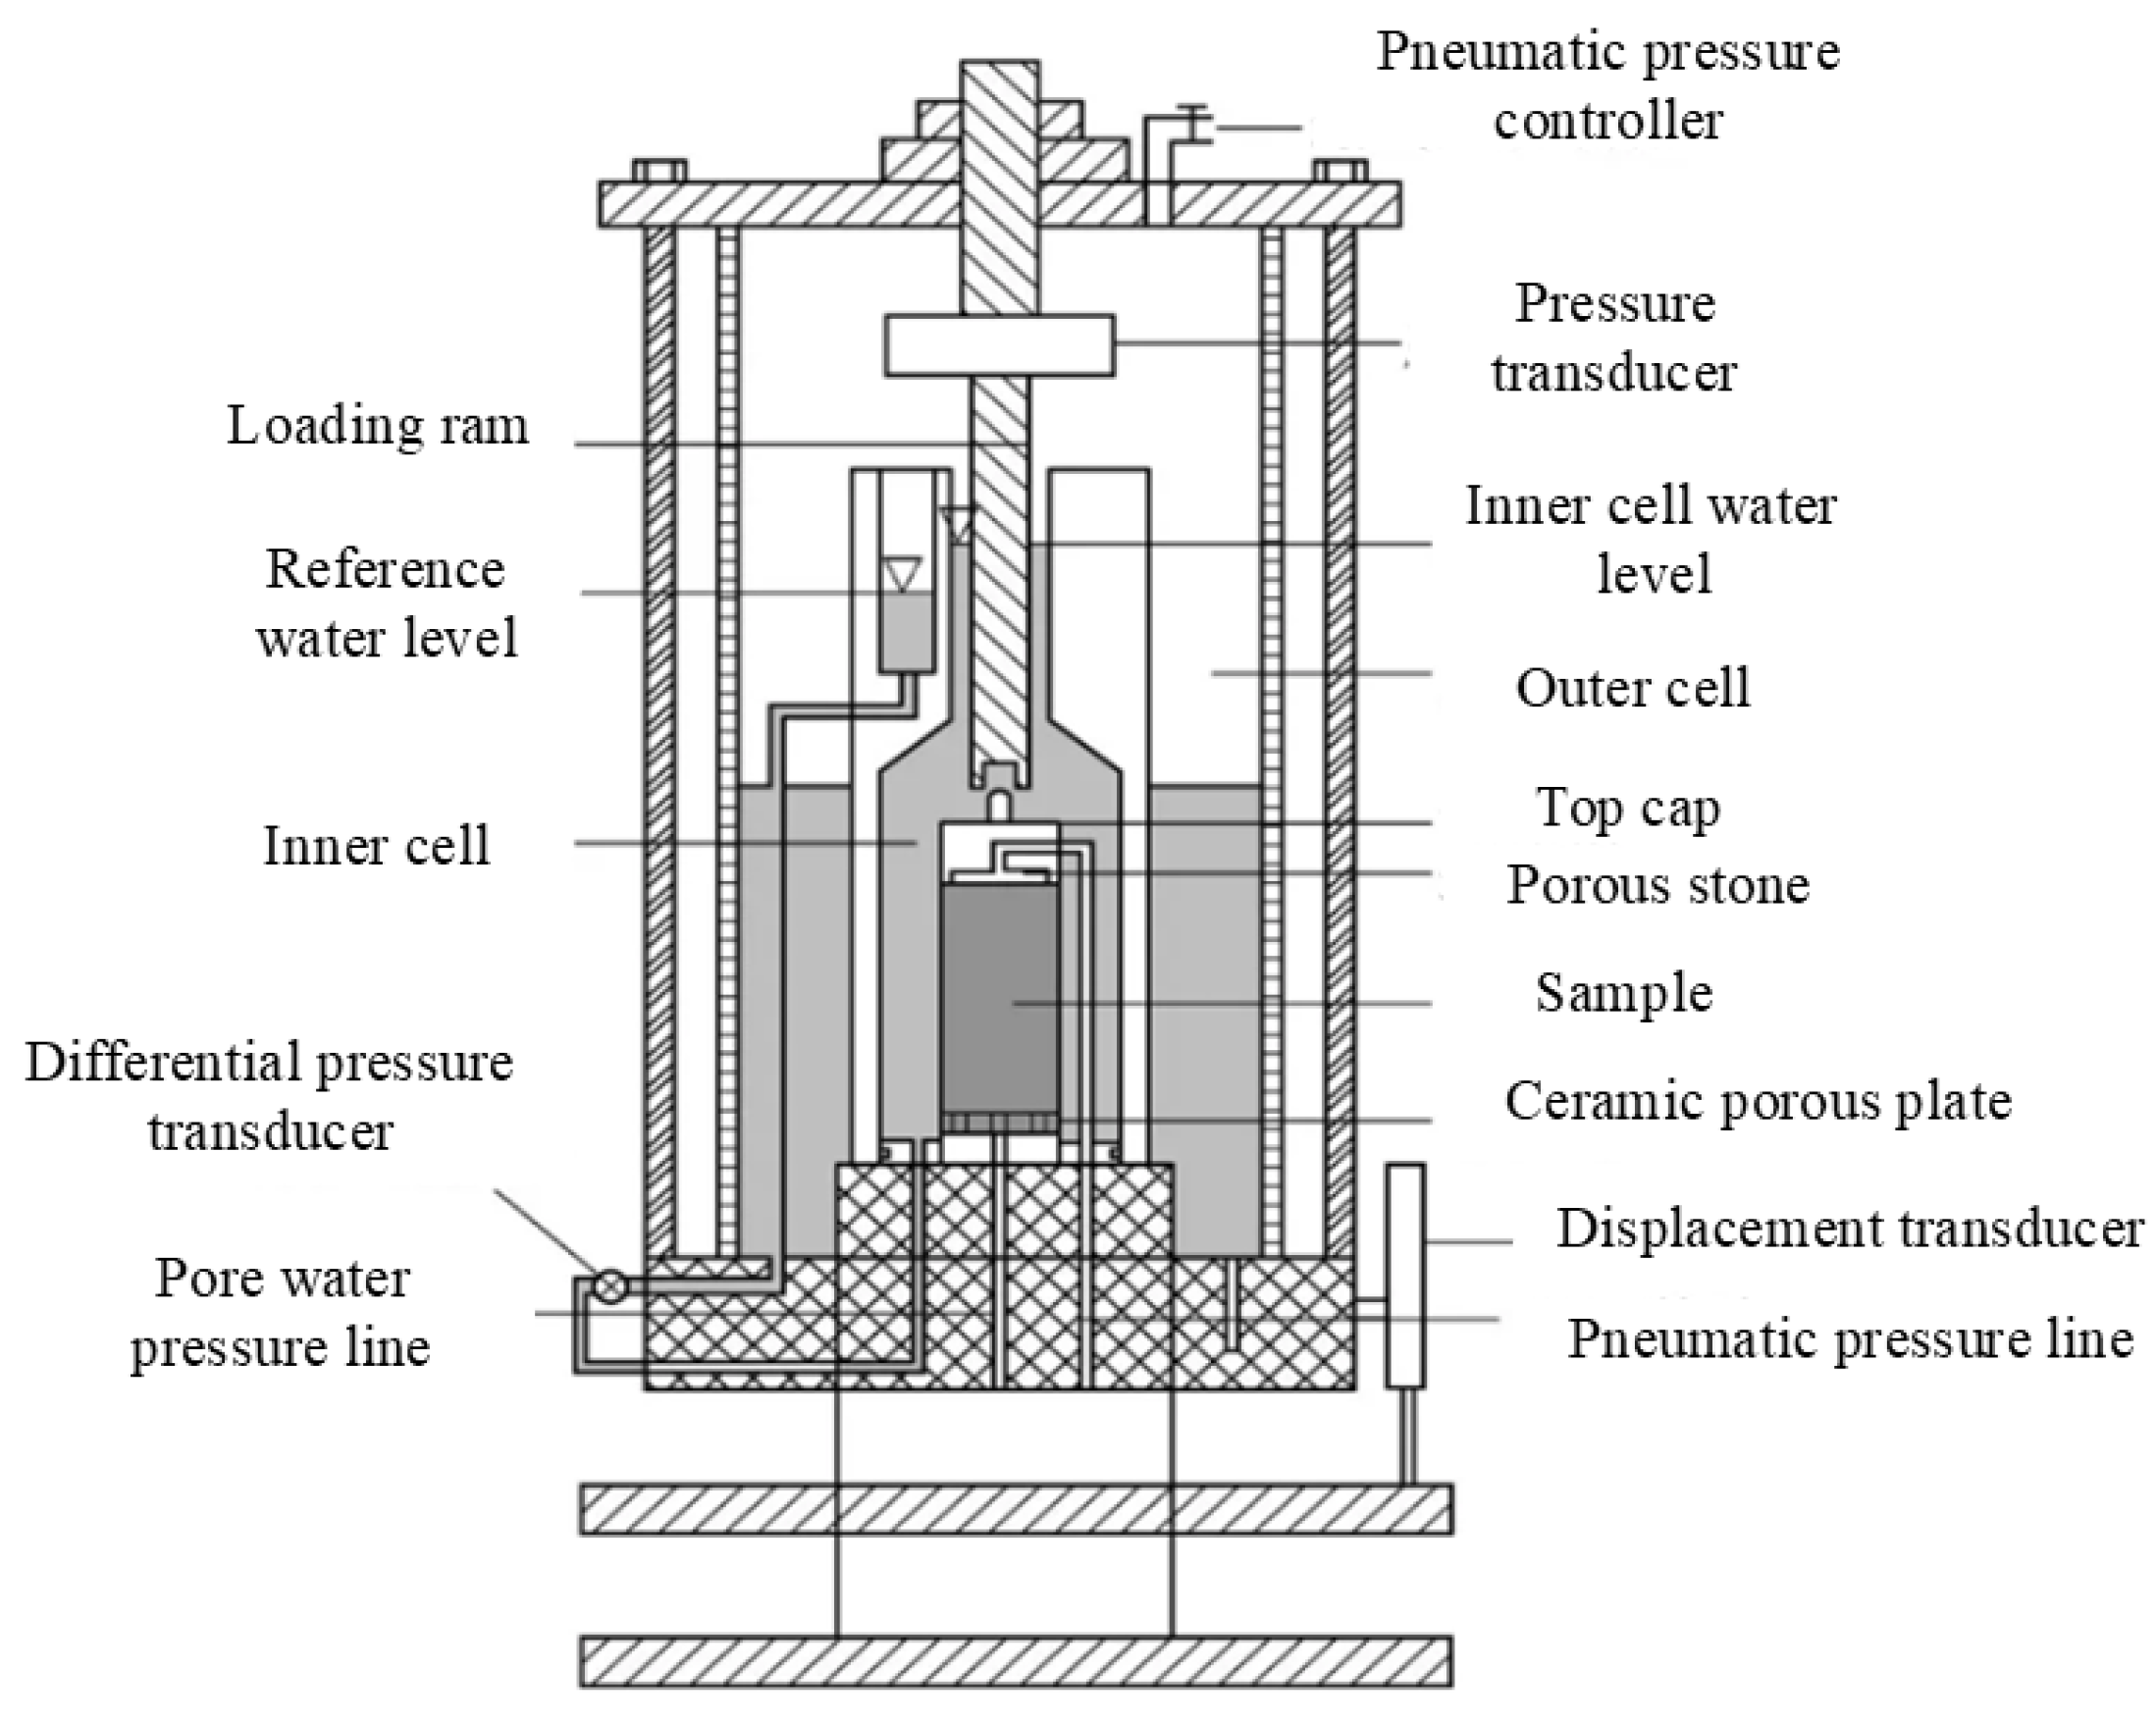
Figure 4.
MLA650F Field Emission Scanning Electron Microscope and Schematic of Its Working Principle.
Figure 4.
MLA650F Field Emission Scanning Electron Microscope and Schematic of Its Working Principle.
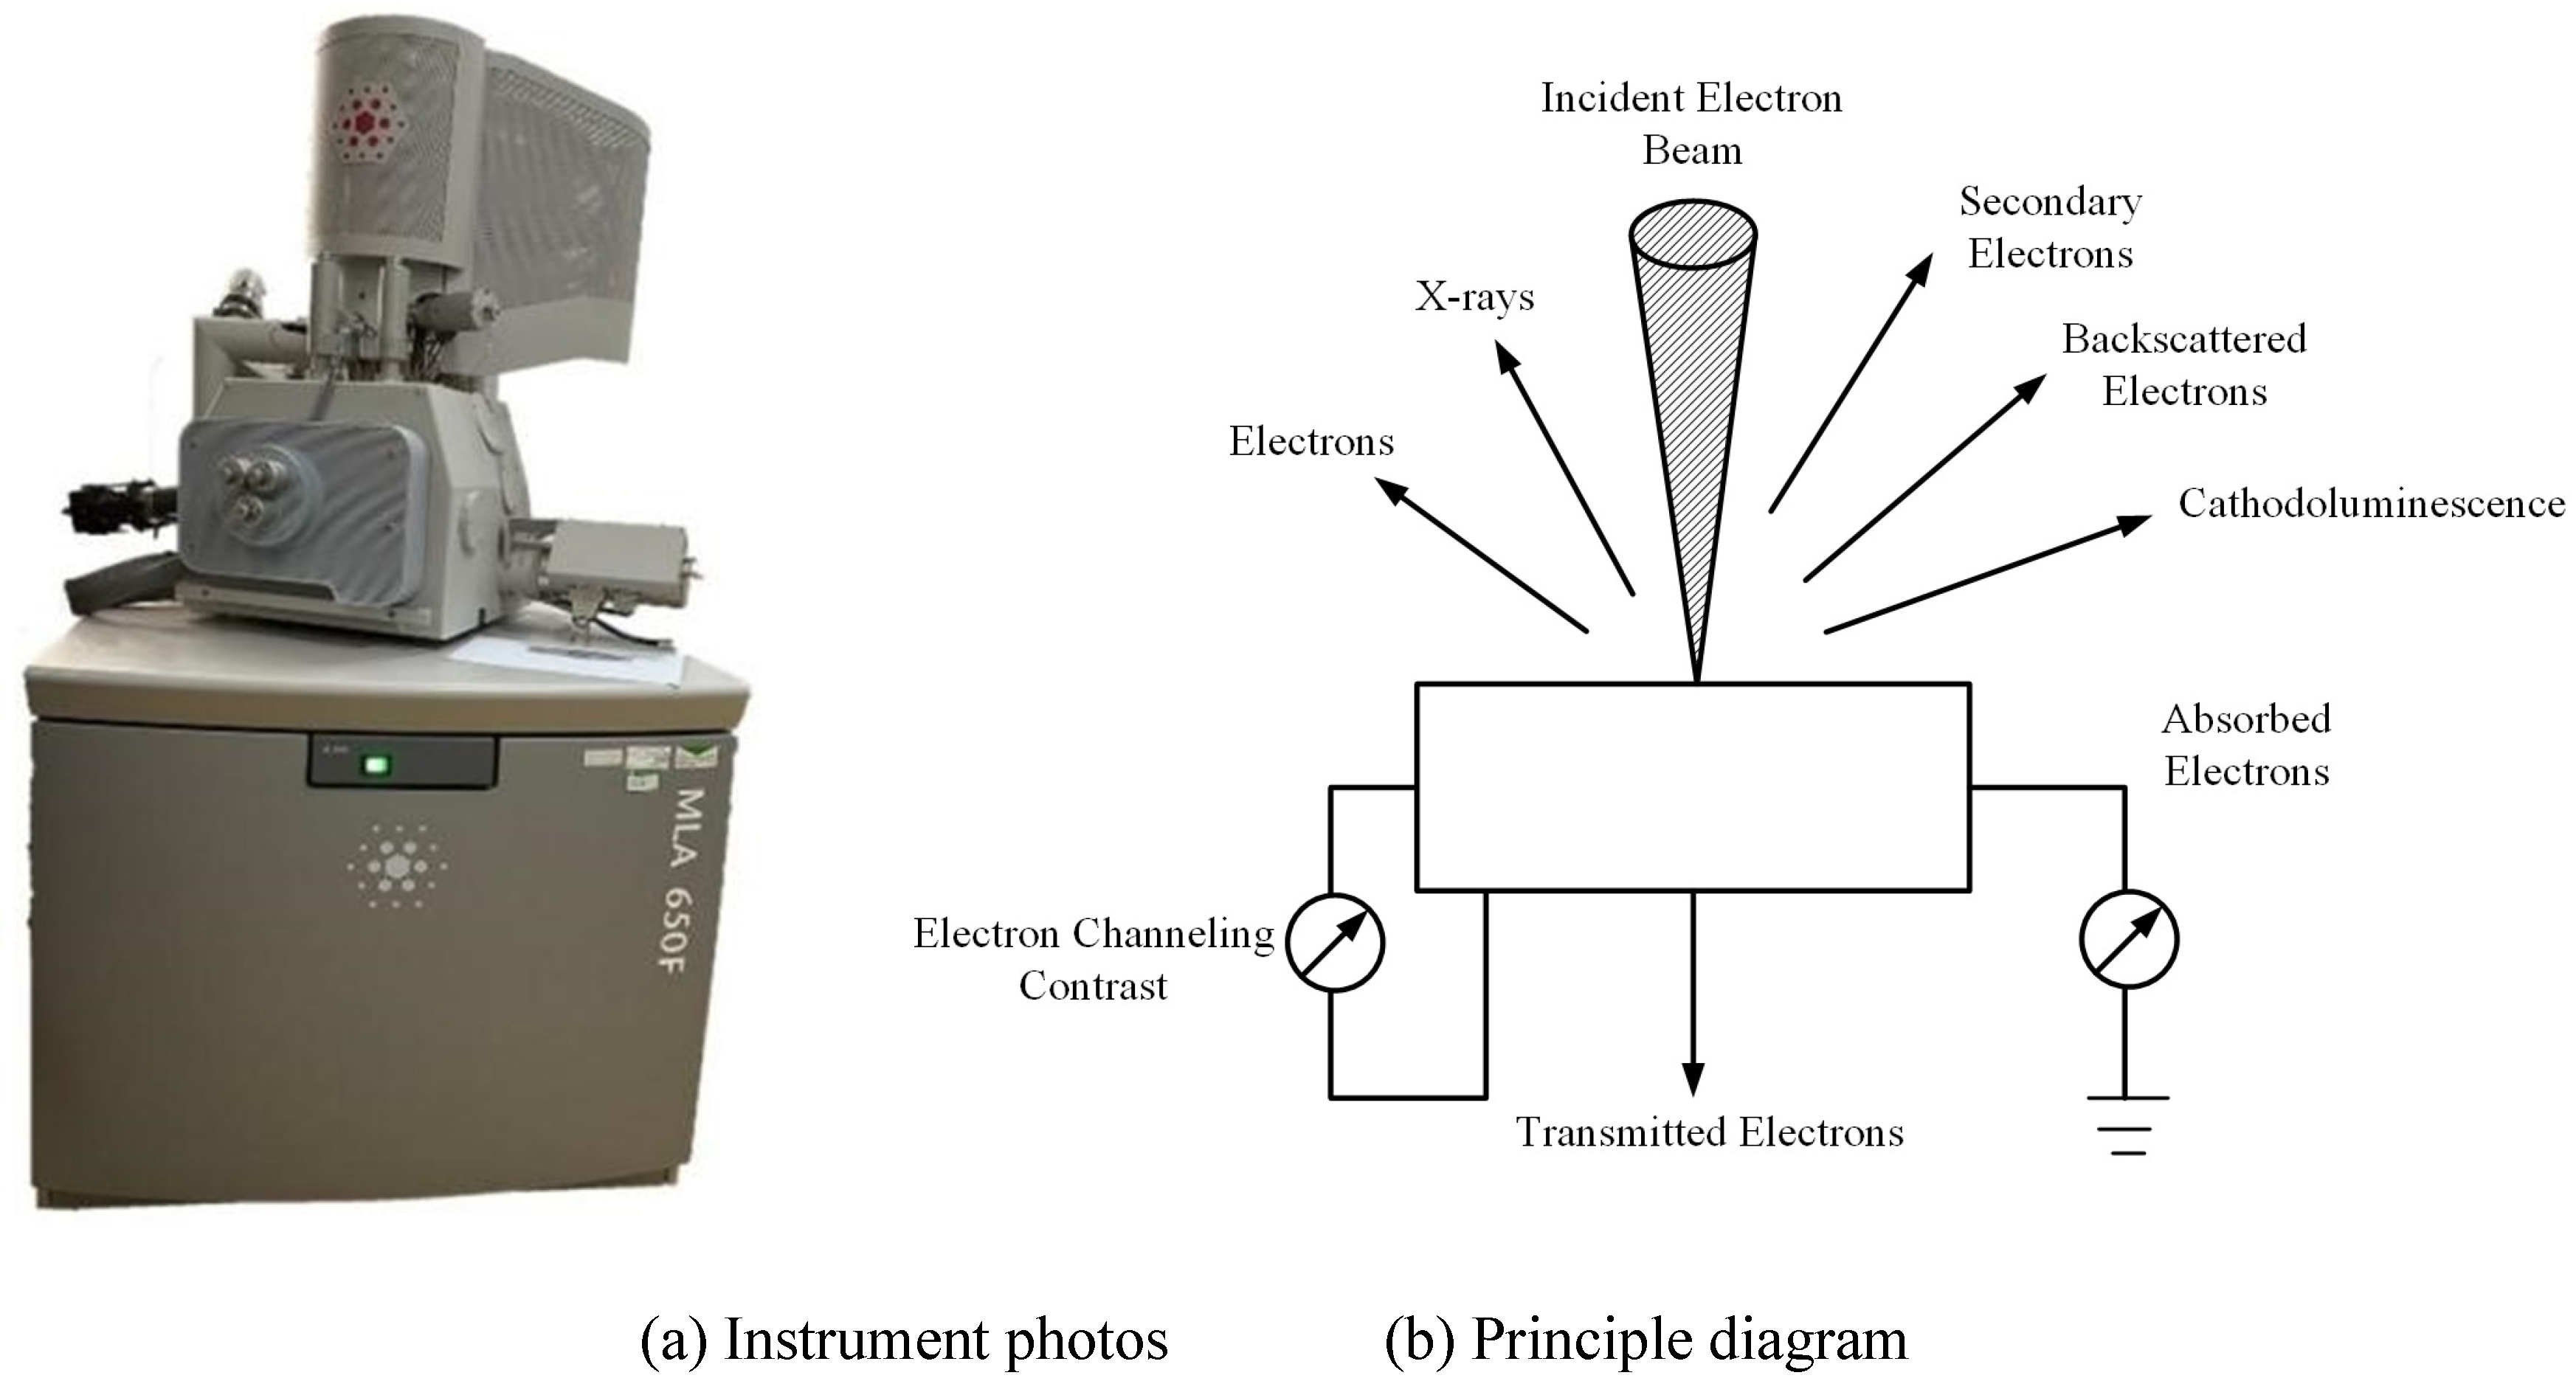
Figure 5.
Stress-strain curves under different leaching agents.
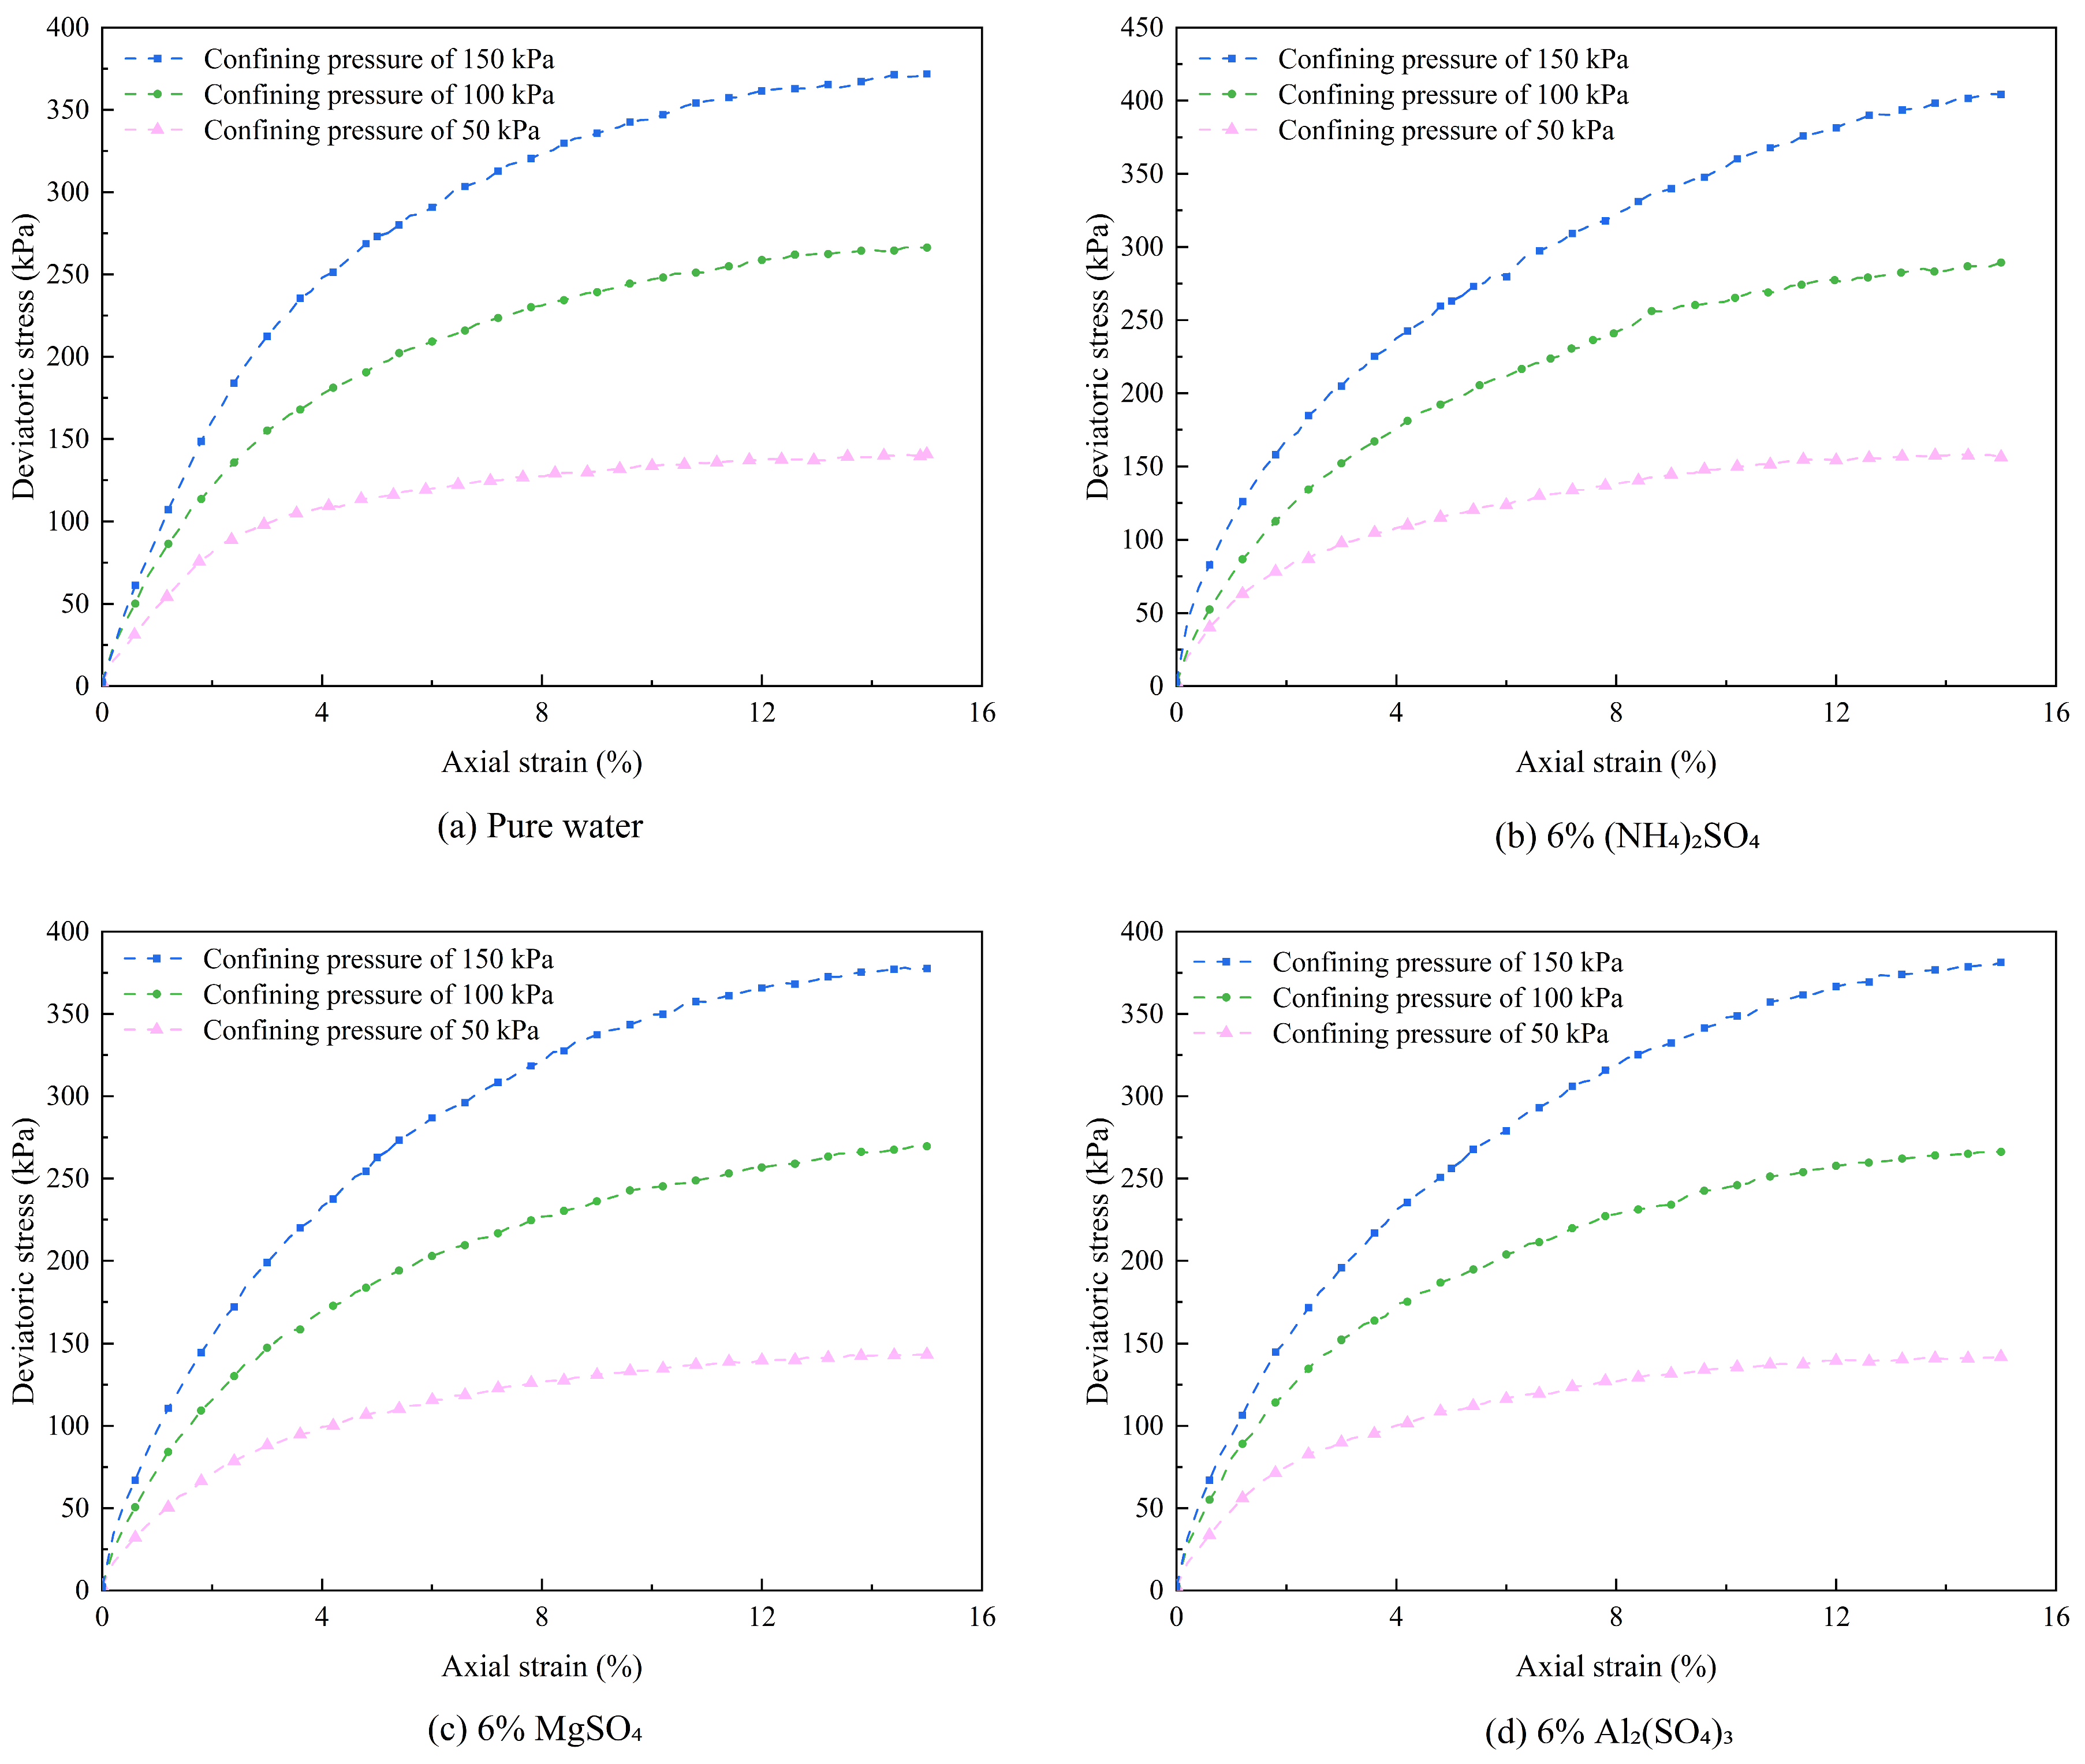
Figure 6.
Shear strength of ionic rare earth soils under different leaching agents.
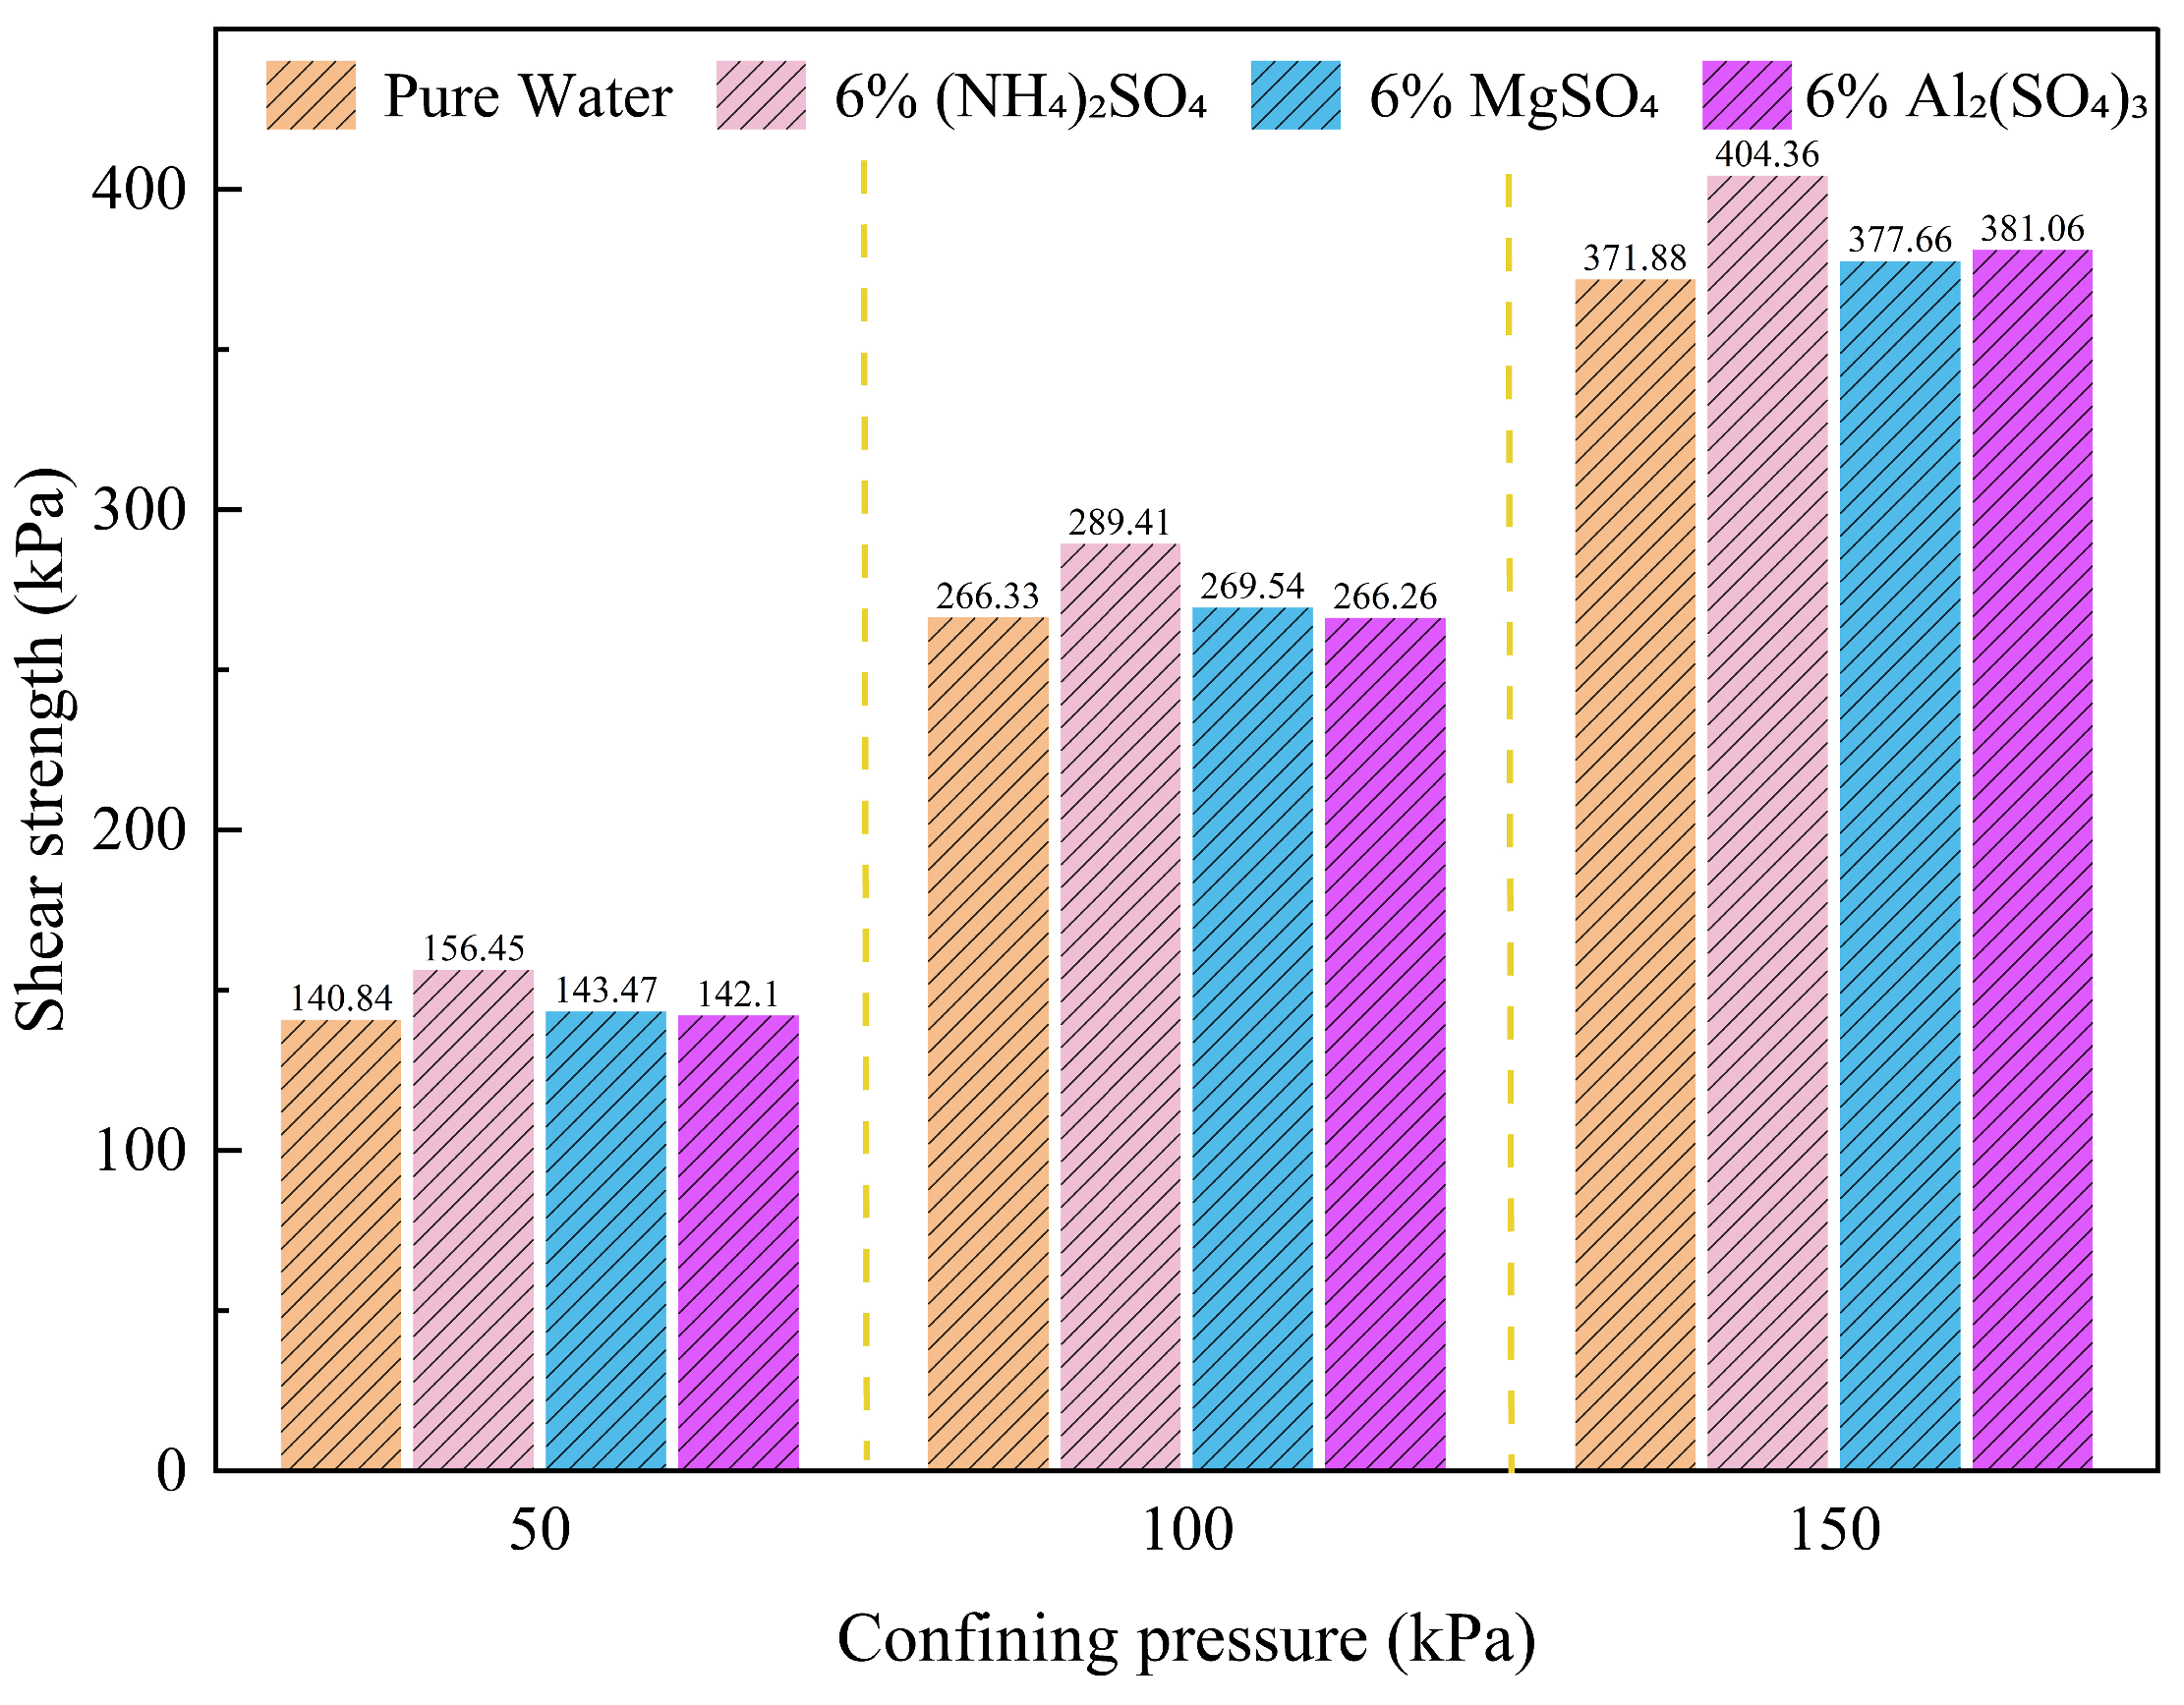
Figure 7.
Cohesion and internal friction angle under different leaching agents.
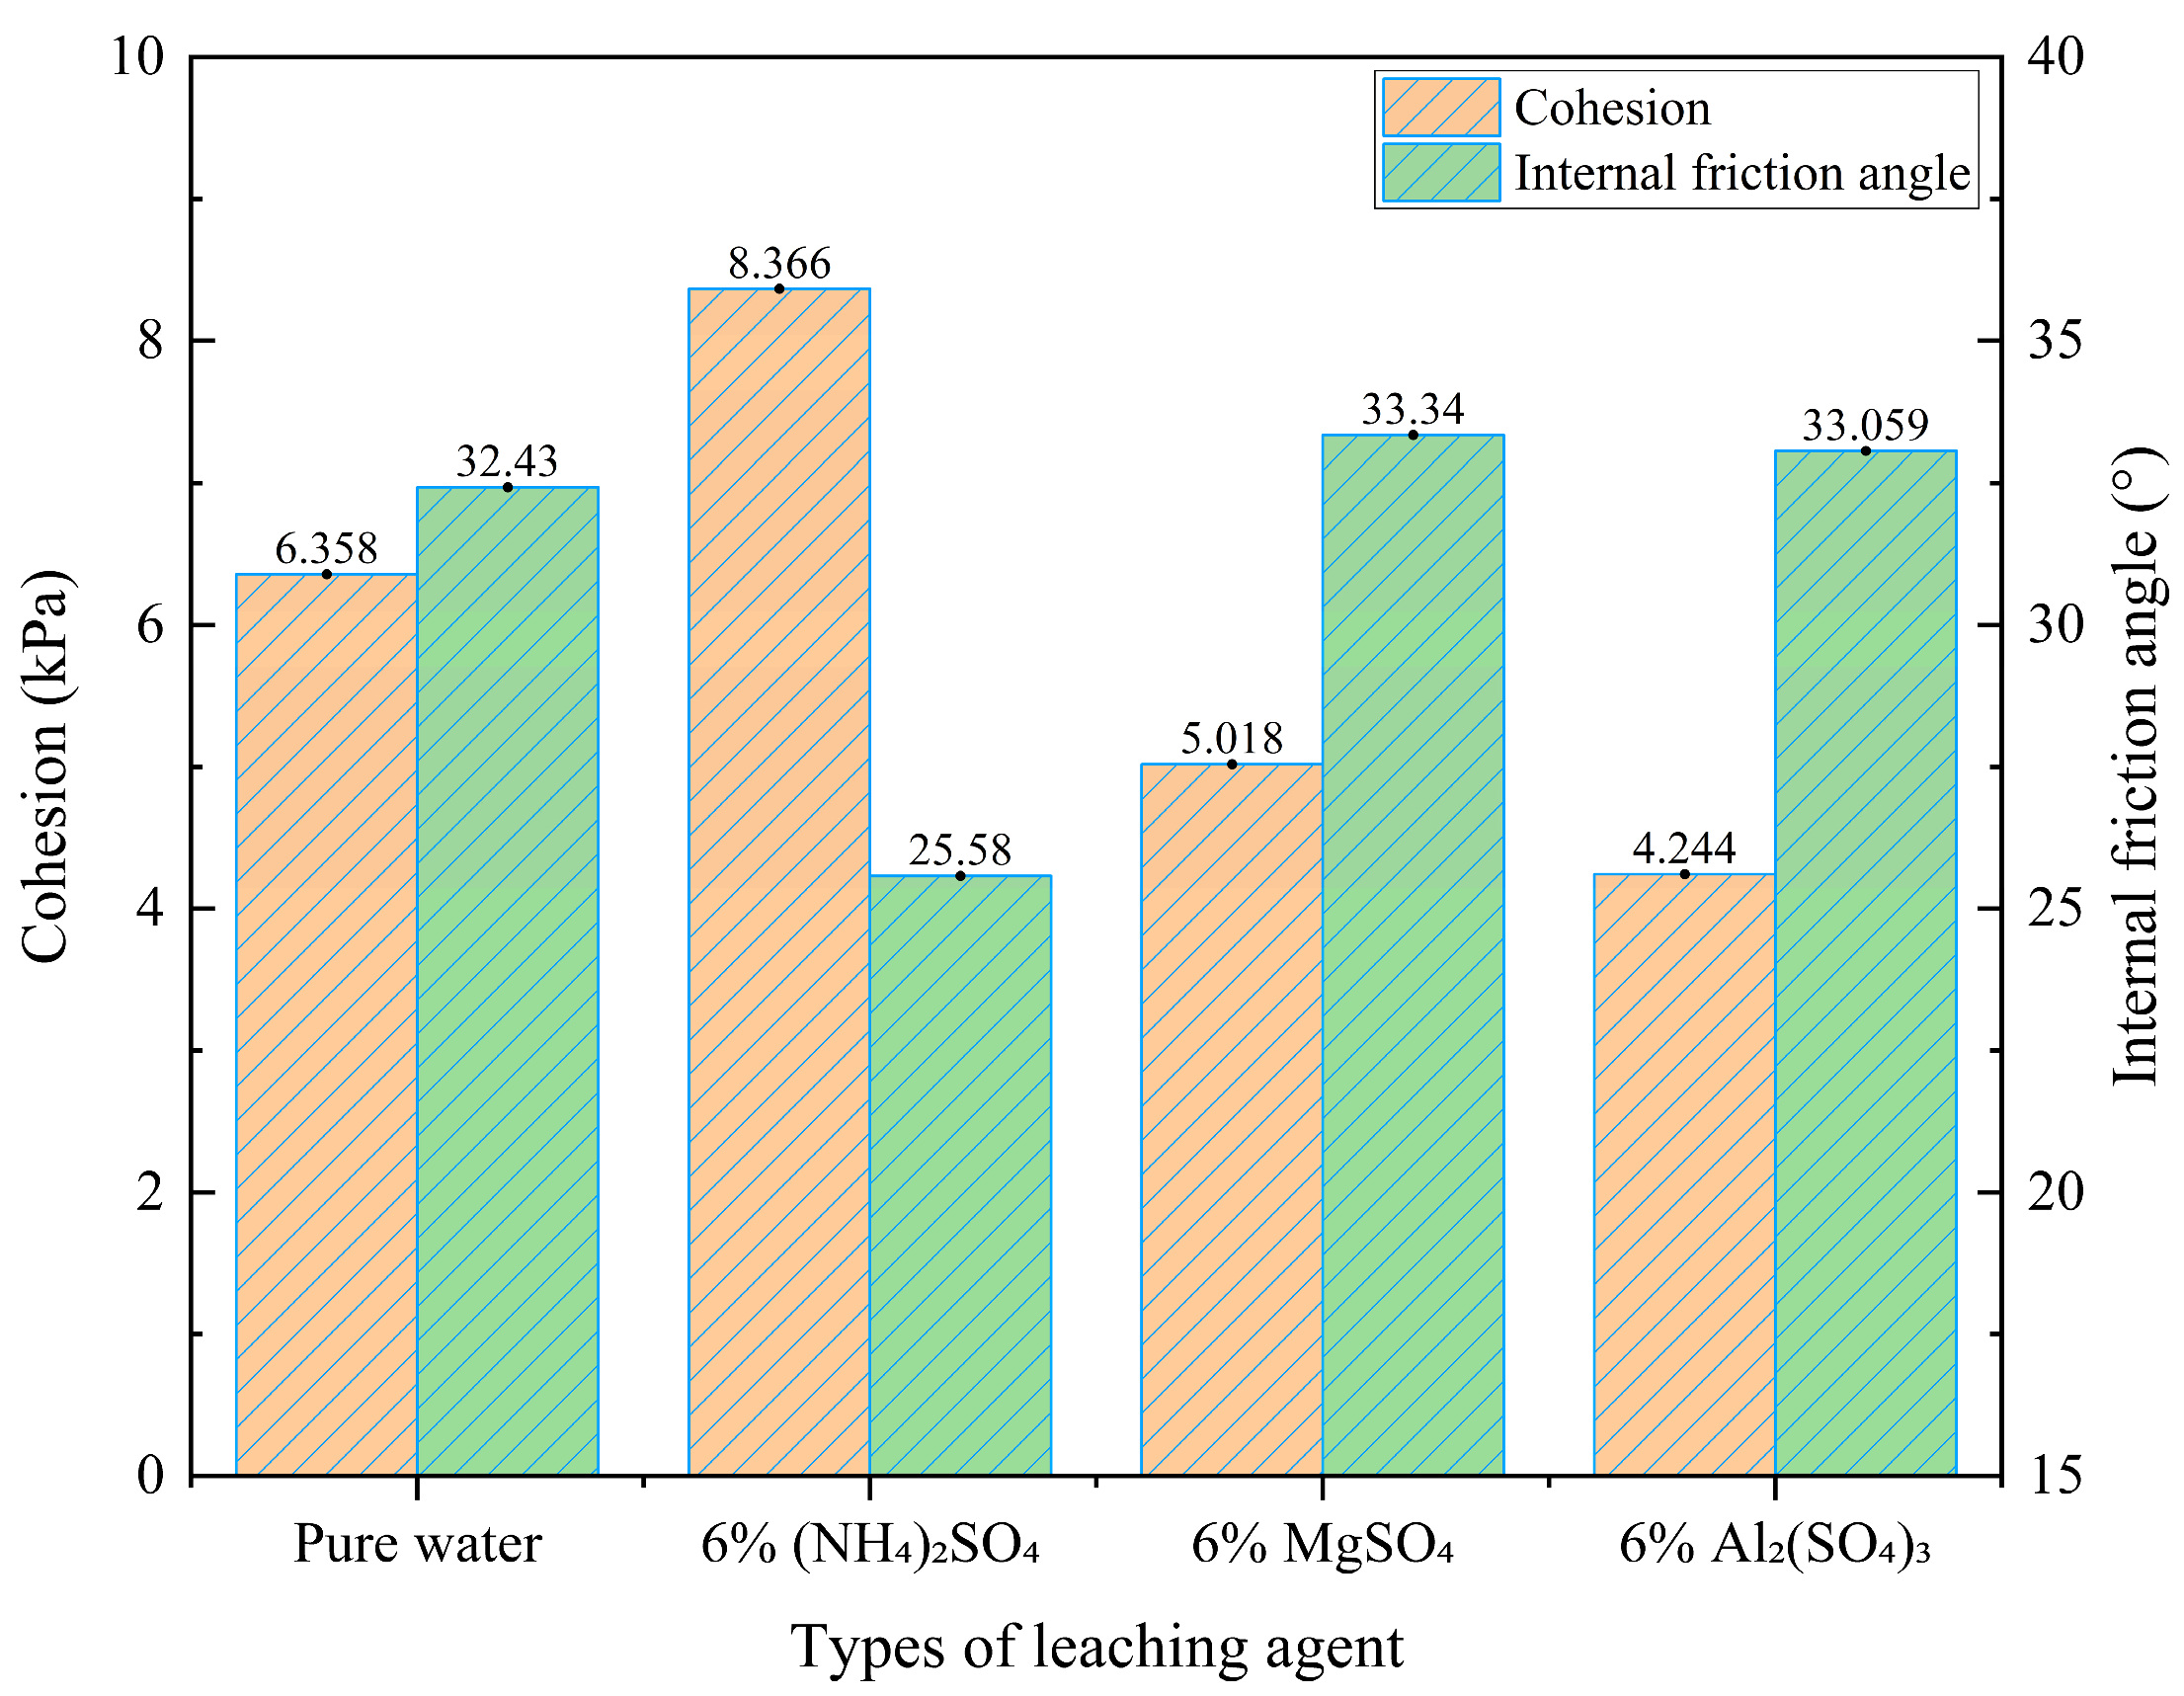
Figure 8.
Stress-strain curves under different magnesium sulfate concentrations.
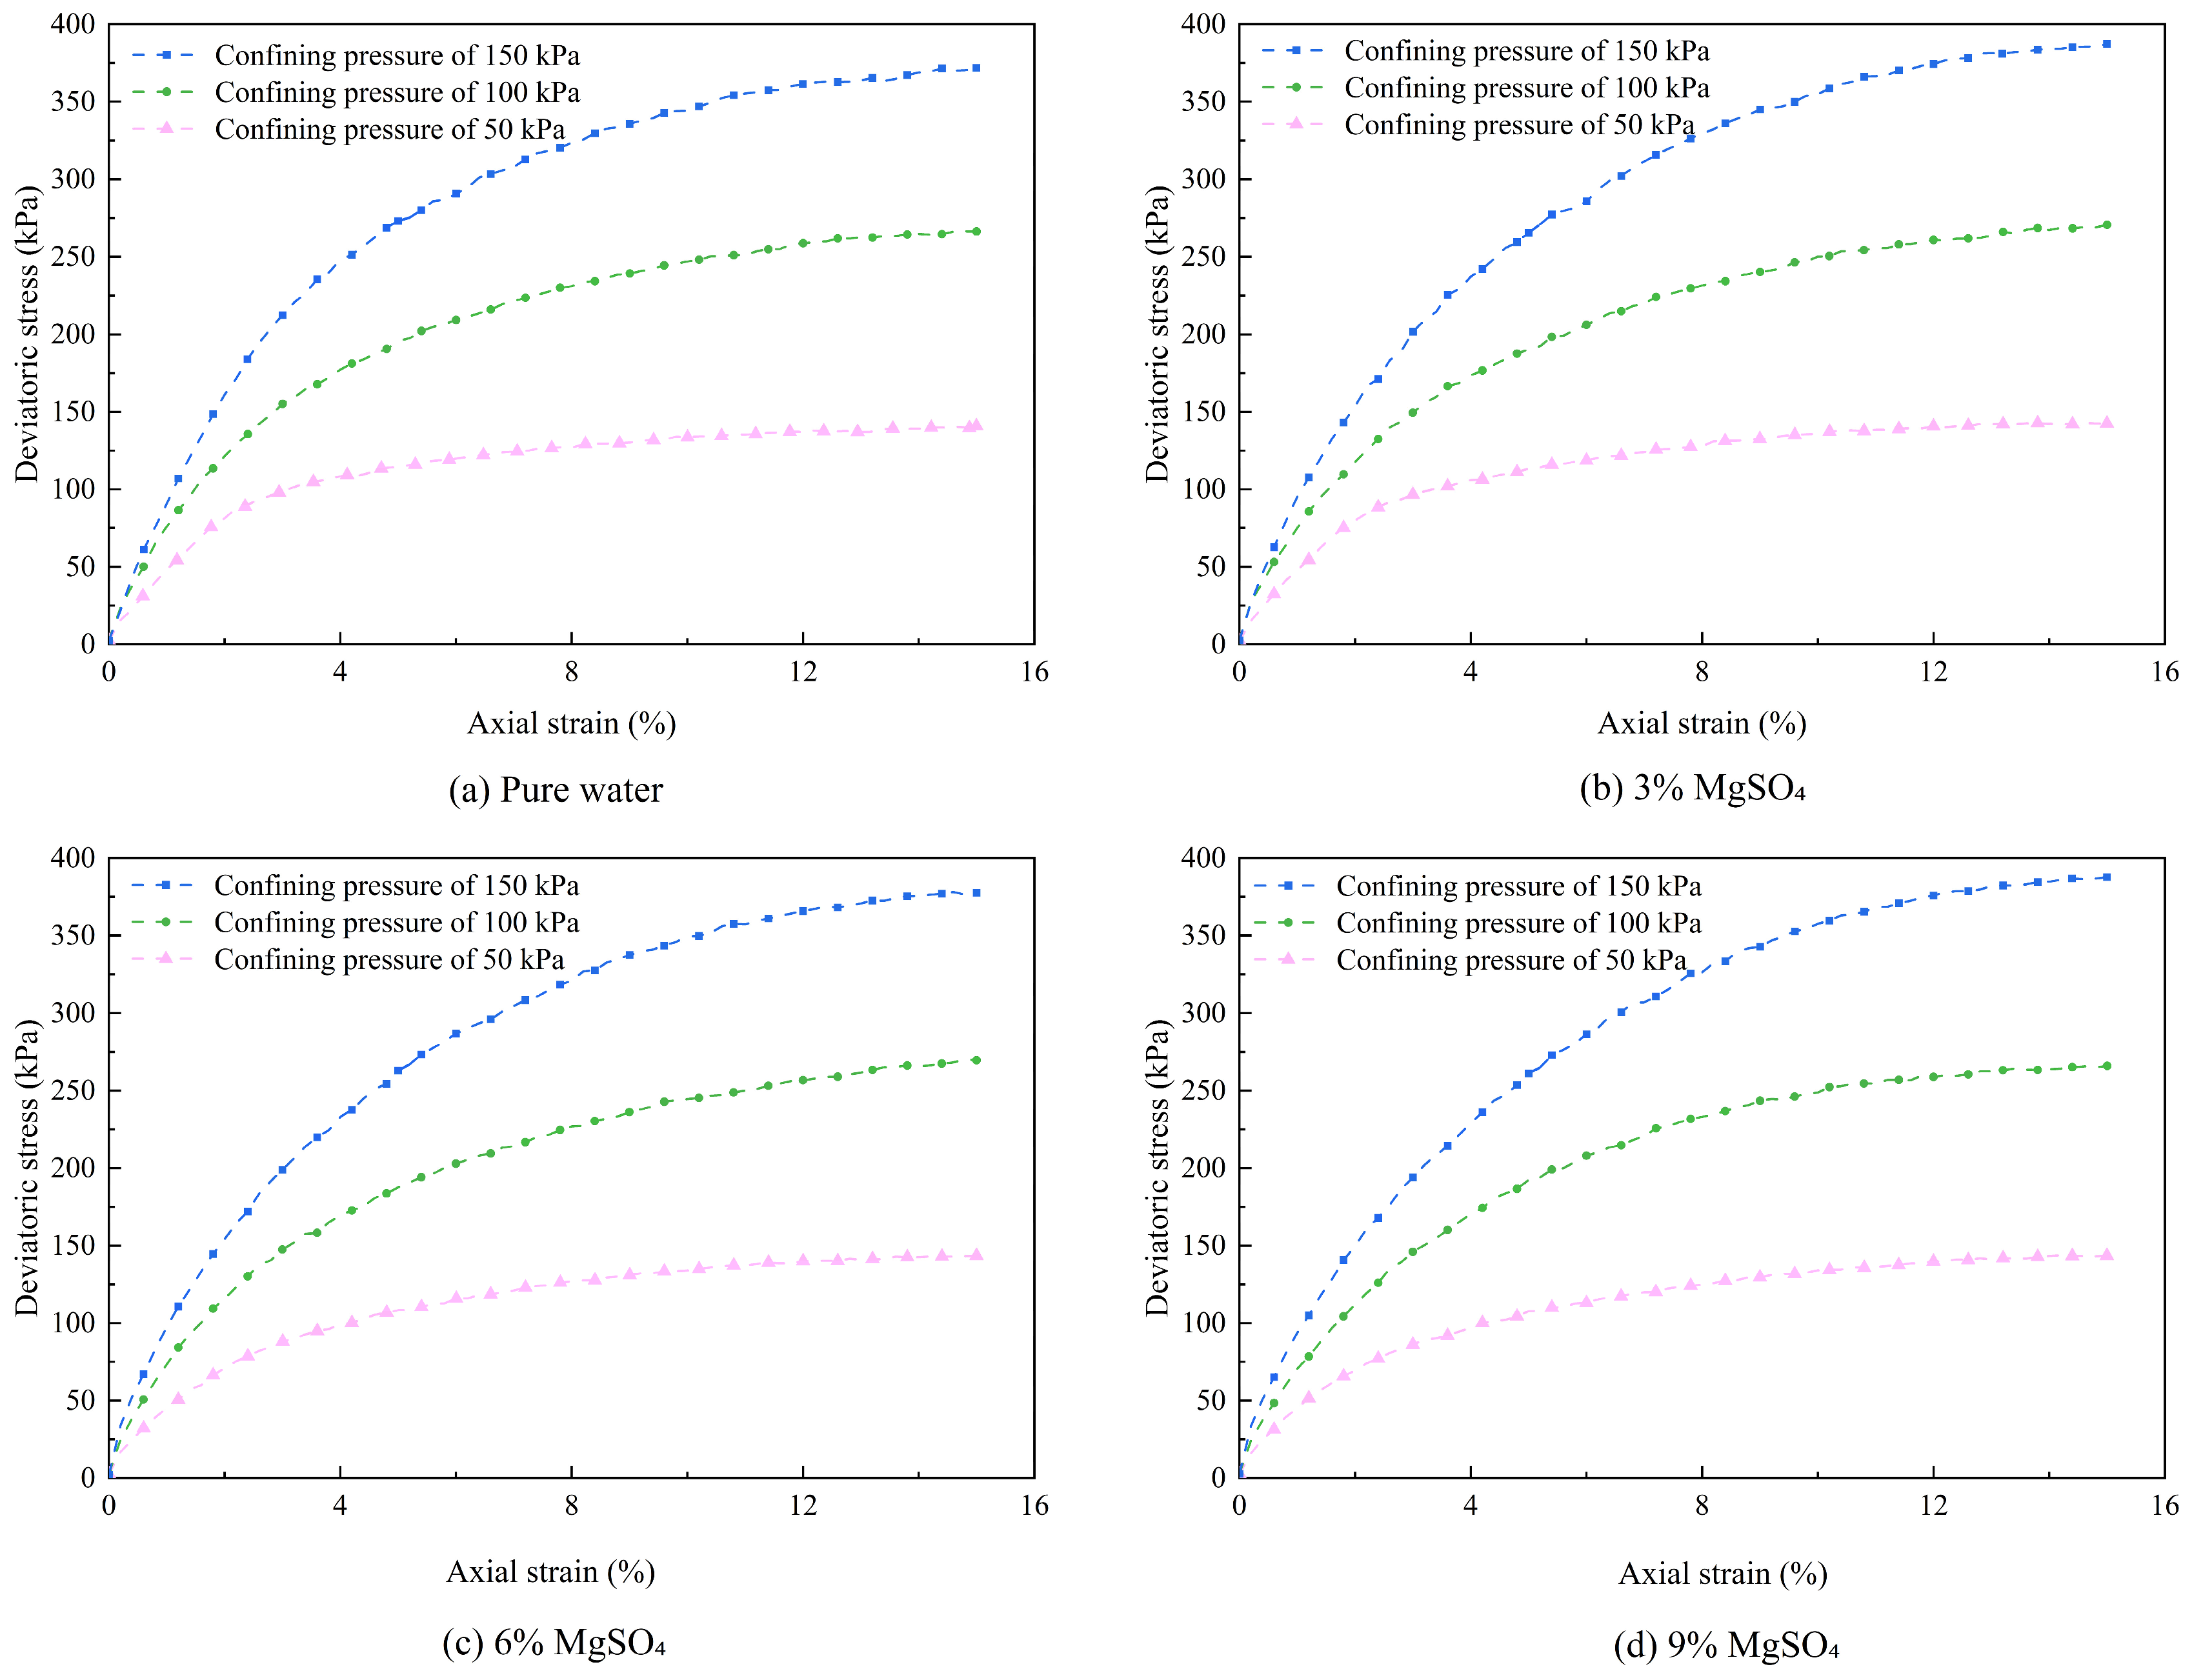
Figure 9.
Shear strength under different magnesium sulfate concentrations.
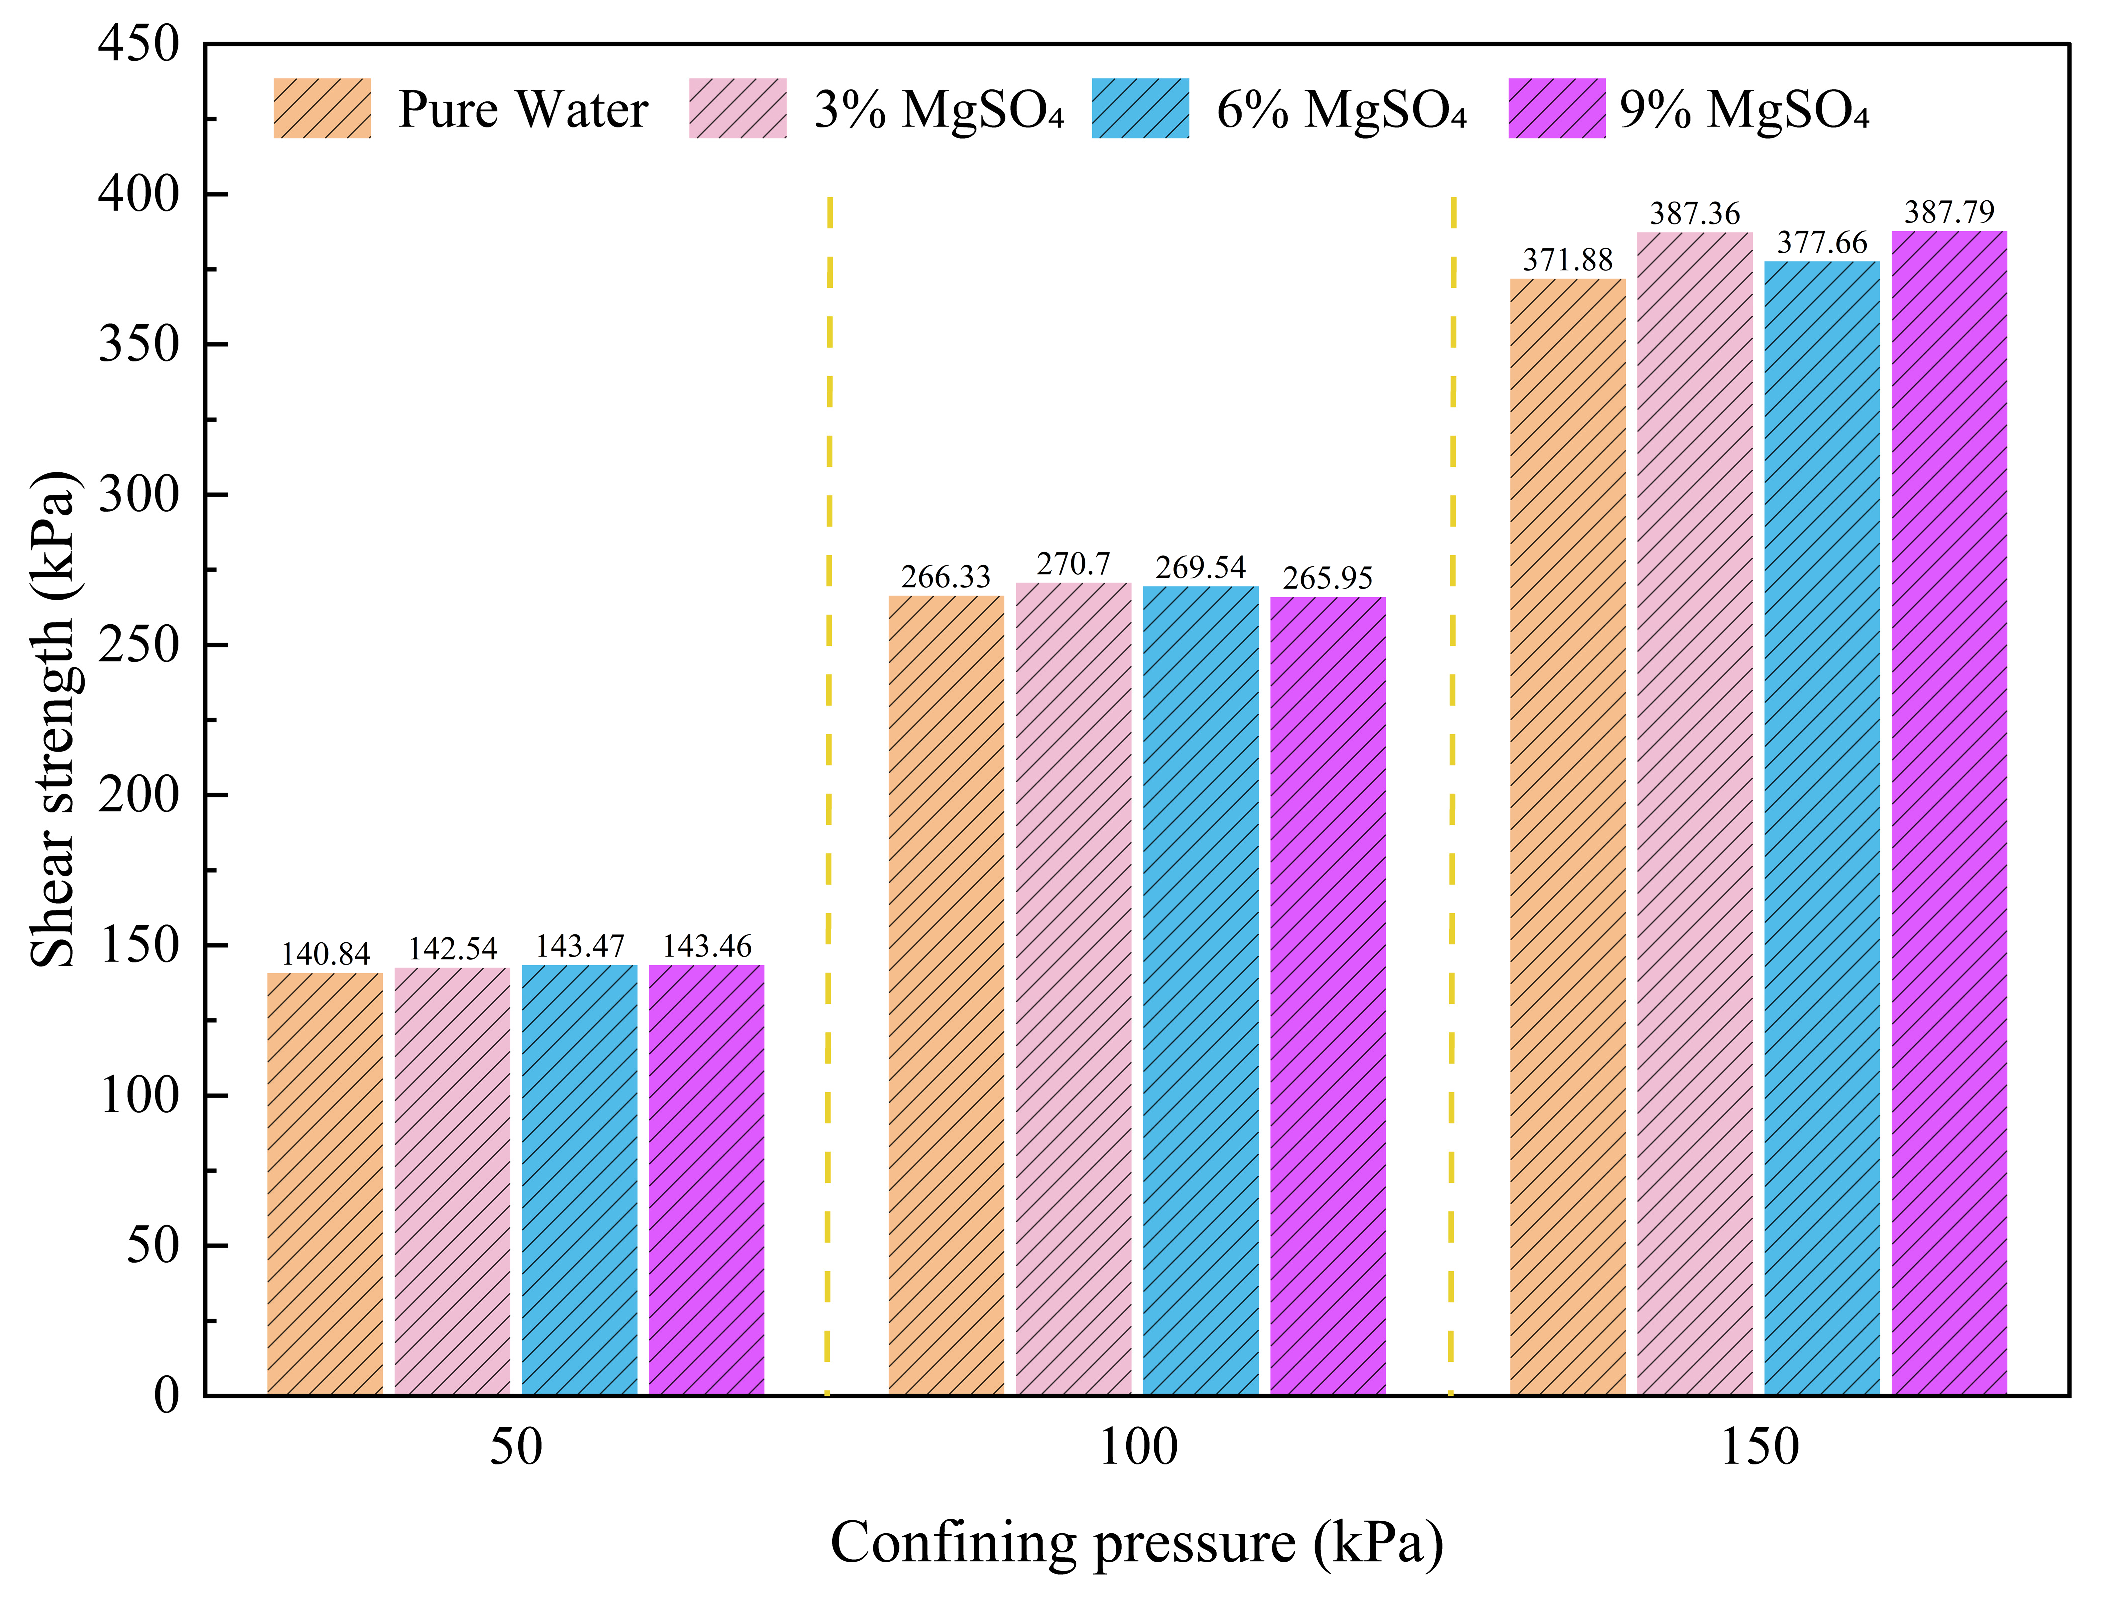
Figure 10.
Cohesion and internal friction angle under different magnesium sulfate concentrations.
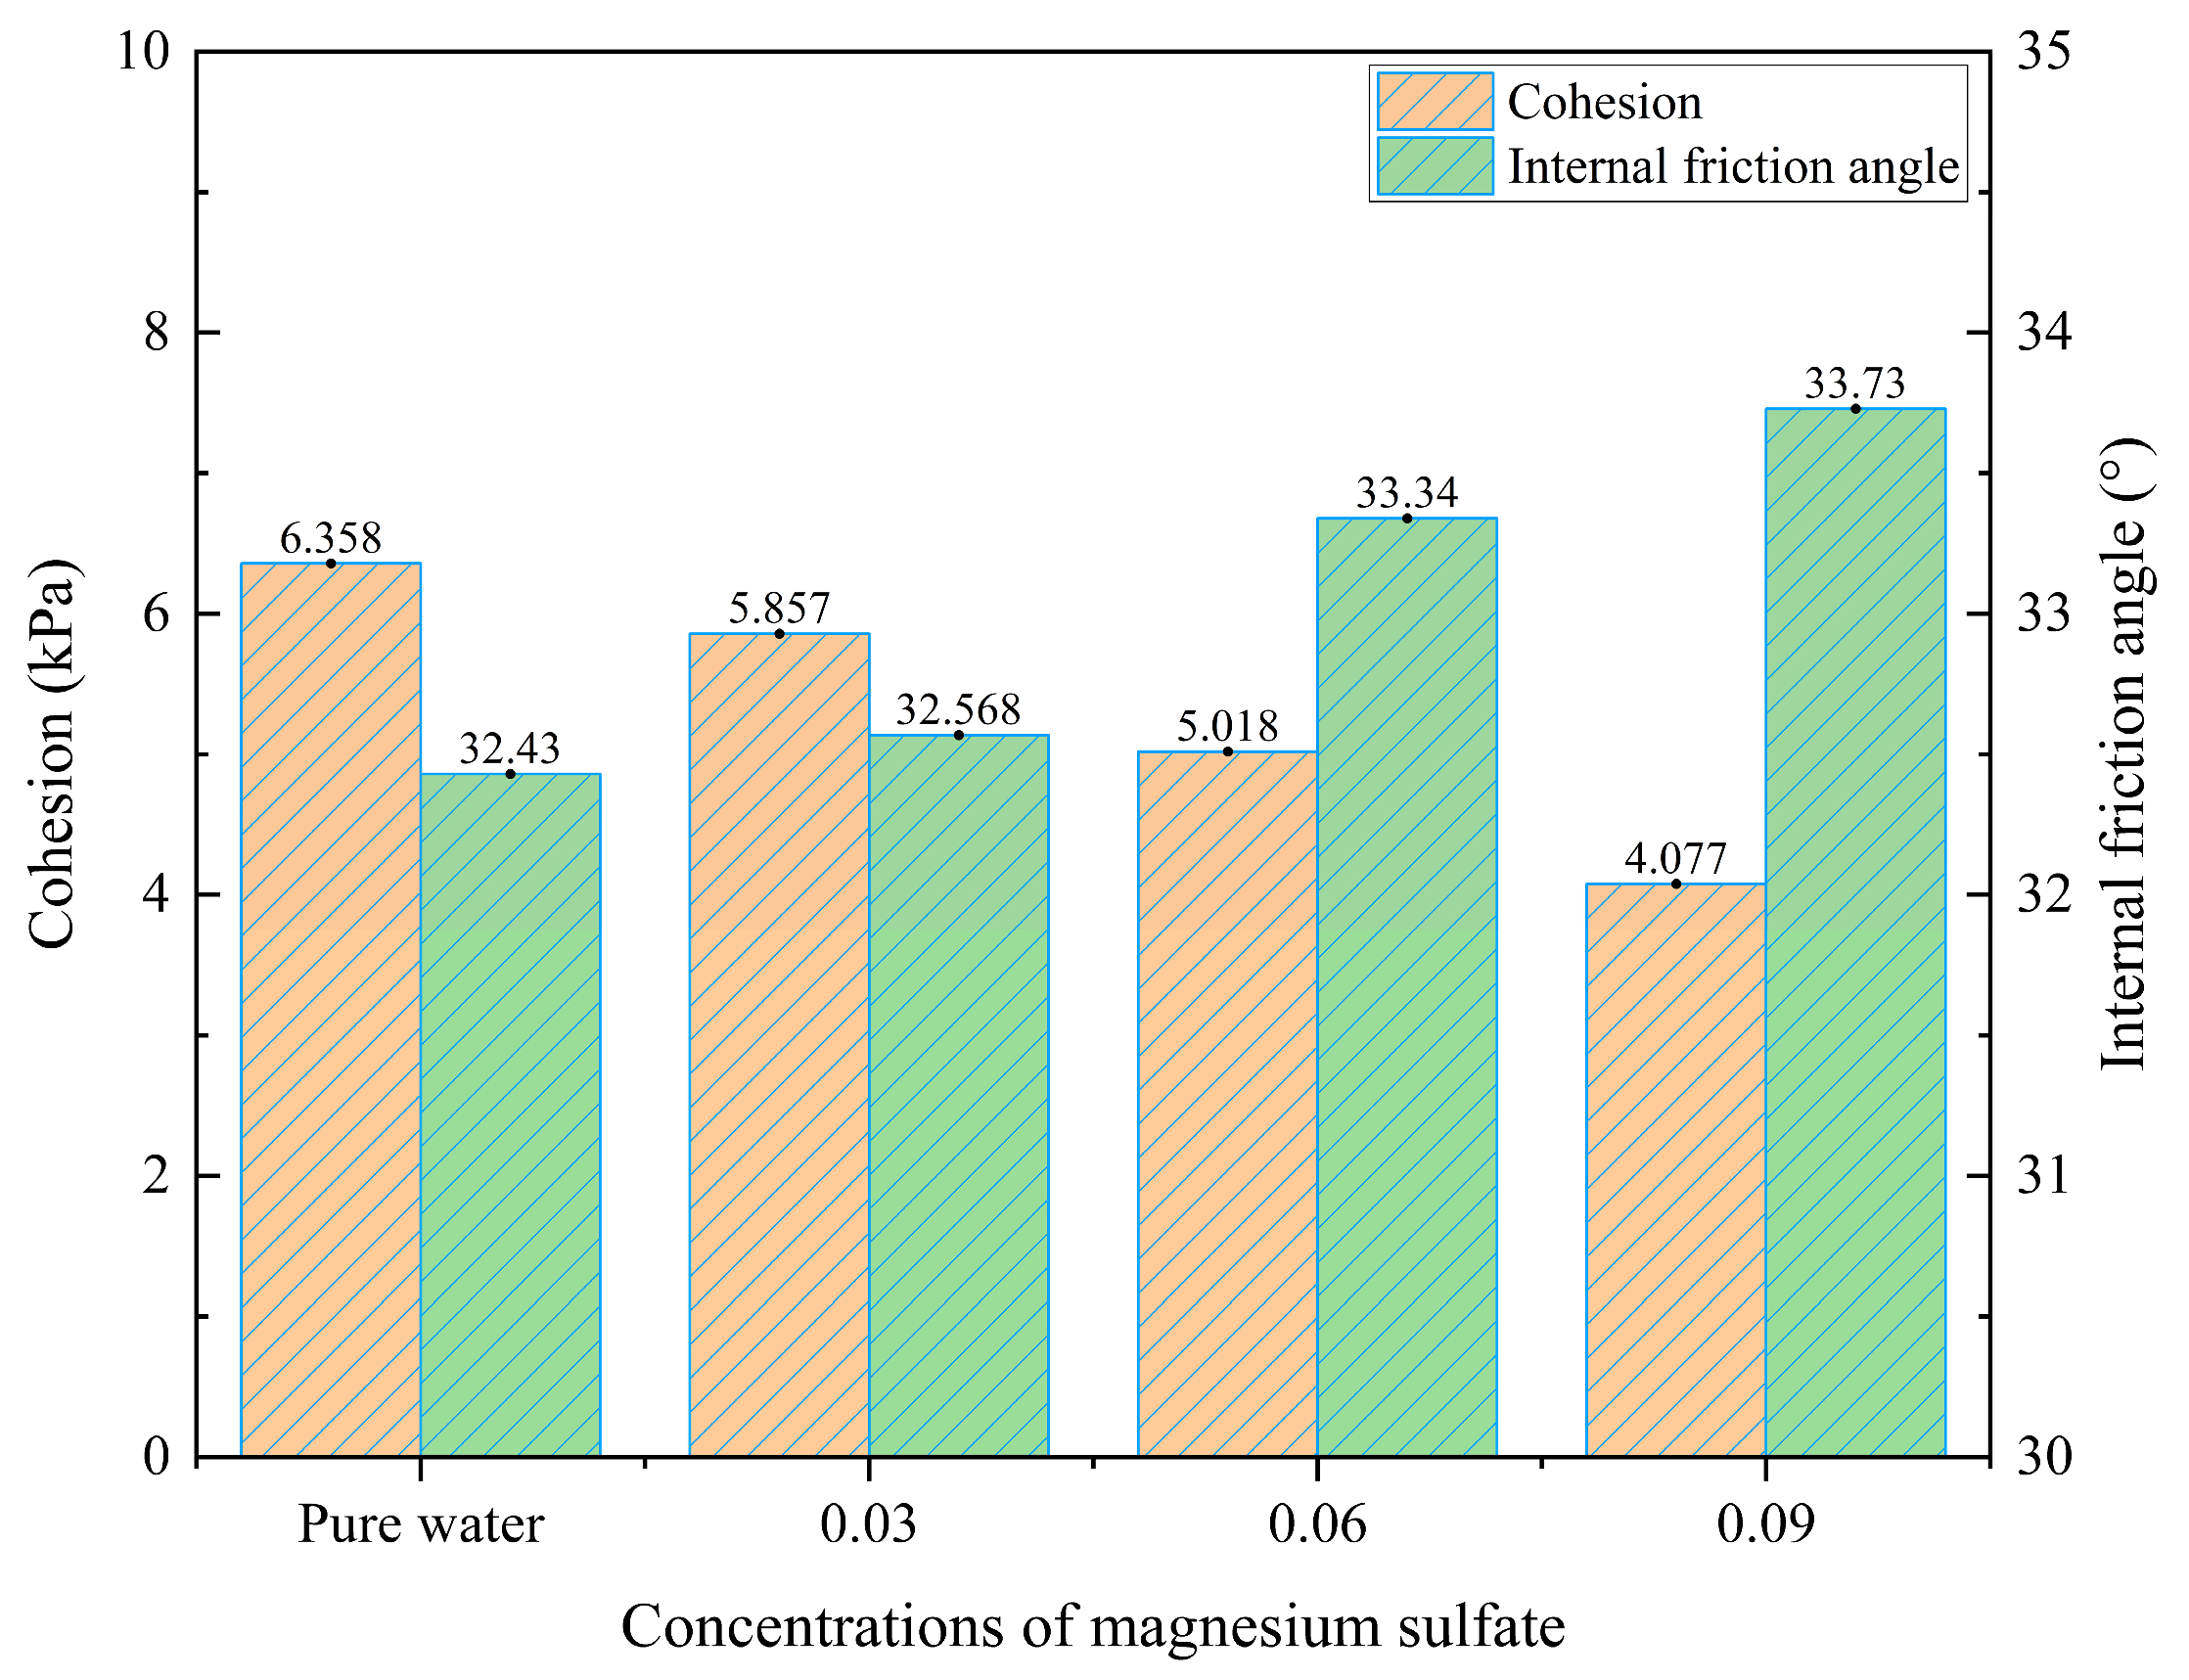
Figure 11.
Original and processed SEM images of specimens under 50 kPa confining pressure.(a) Pure water;(b) 3% MgSO4;(c) 6% MgSO4;(d) 9% MgSO4.
Figure 11.
Original and processed SEM images of specimens under 50 kPa confining pressure.(a) Pure water;(b) 3% MgSO4;(c) 6% MgSO4;(d) 9% MgSO4.
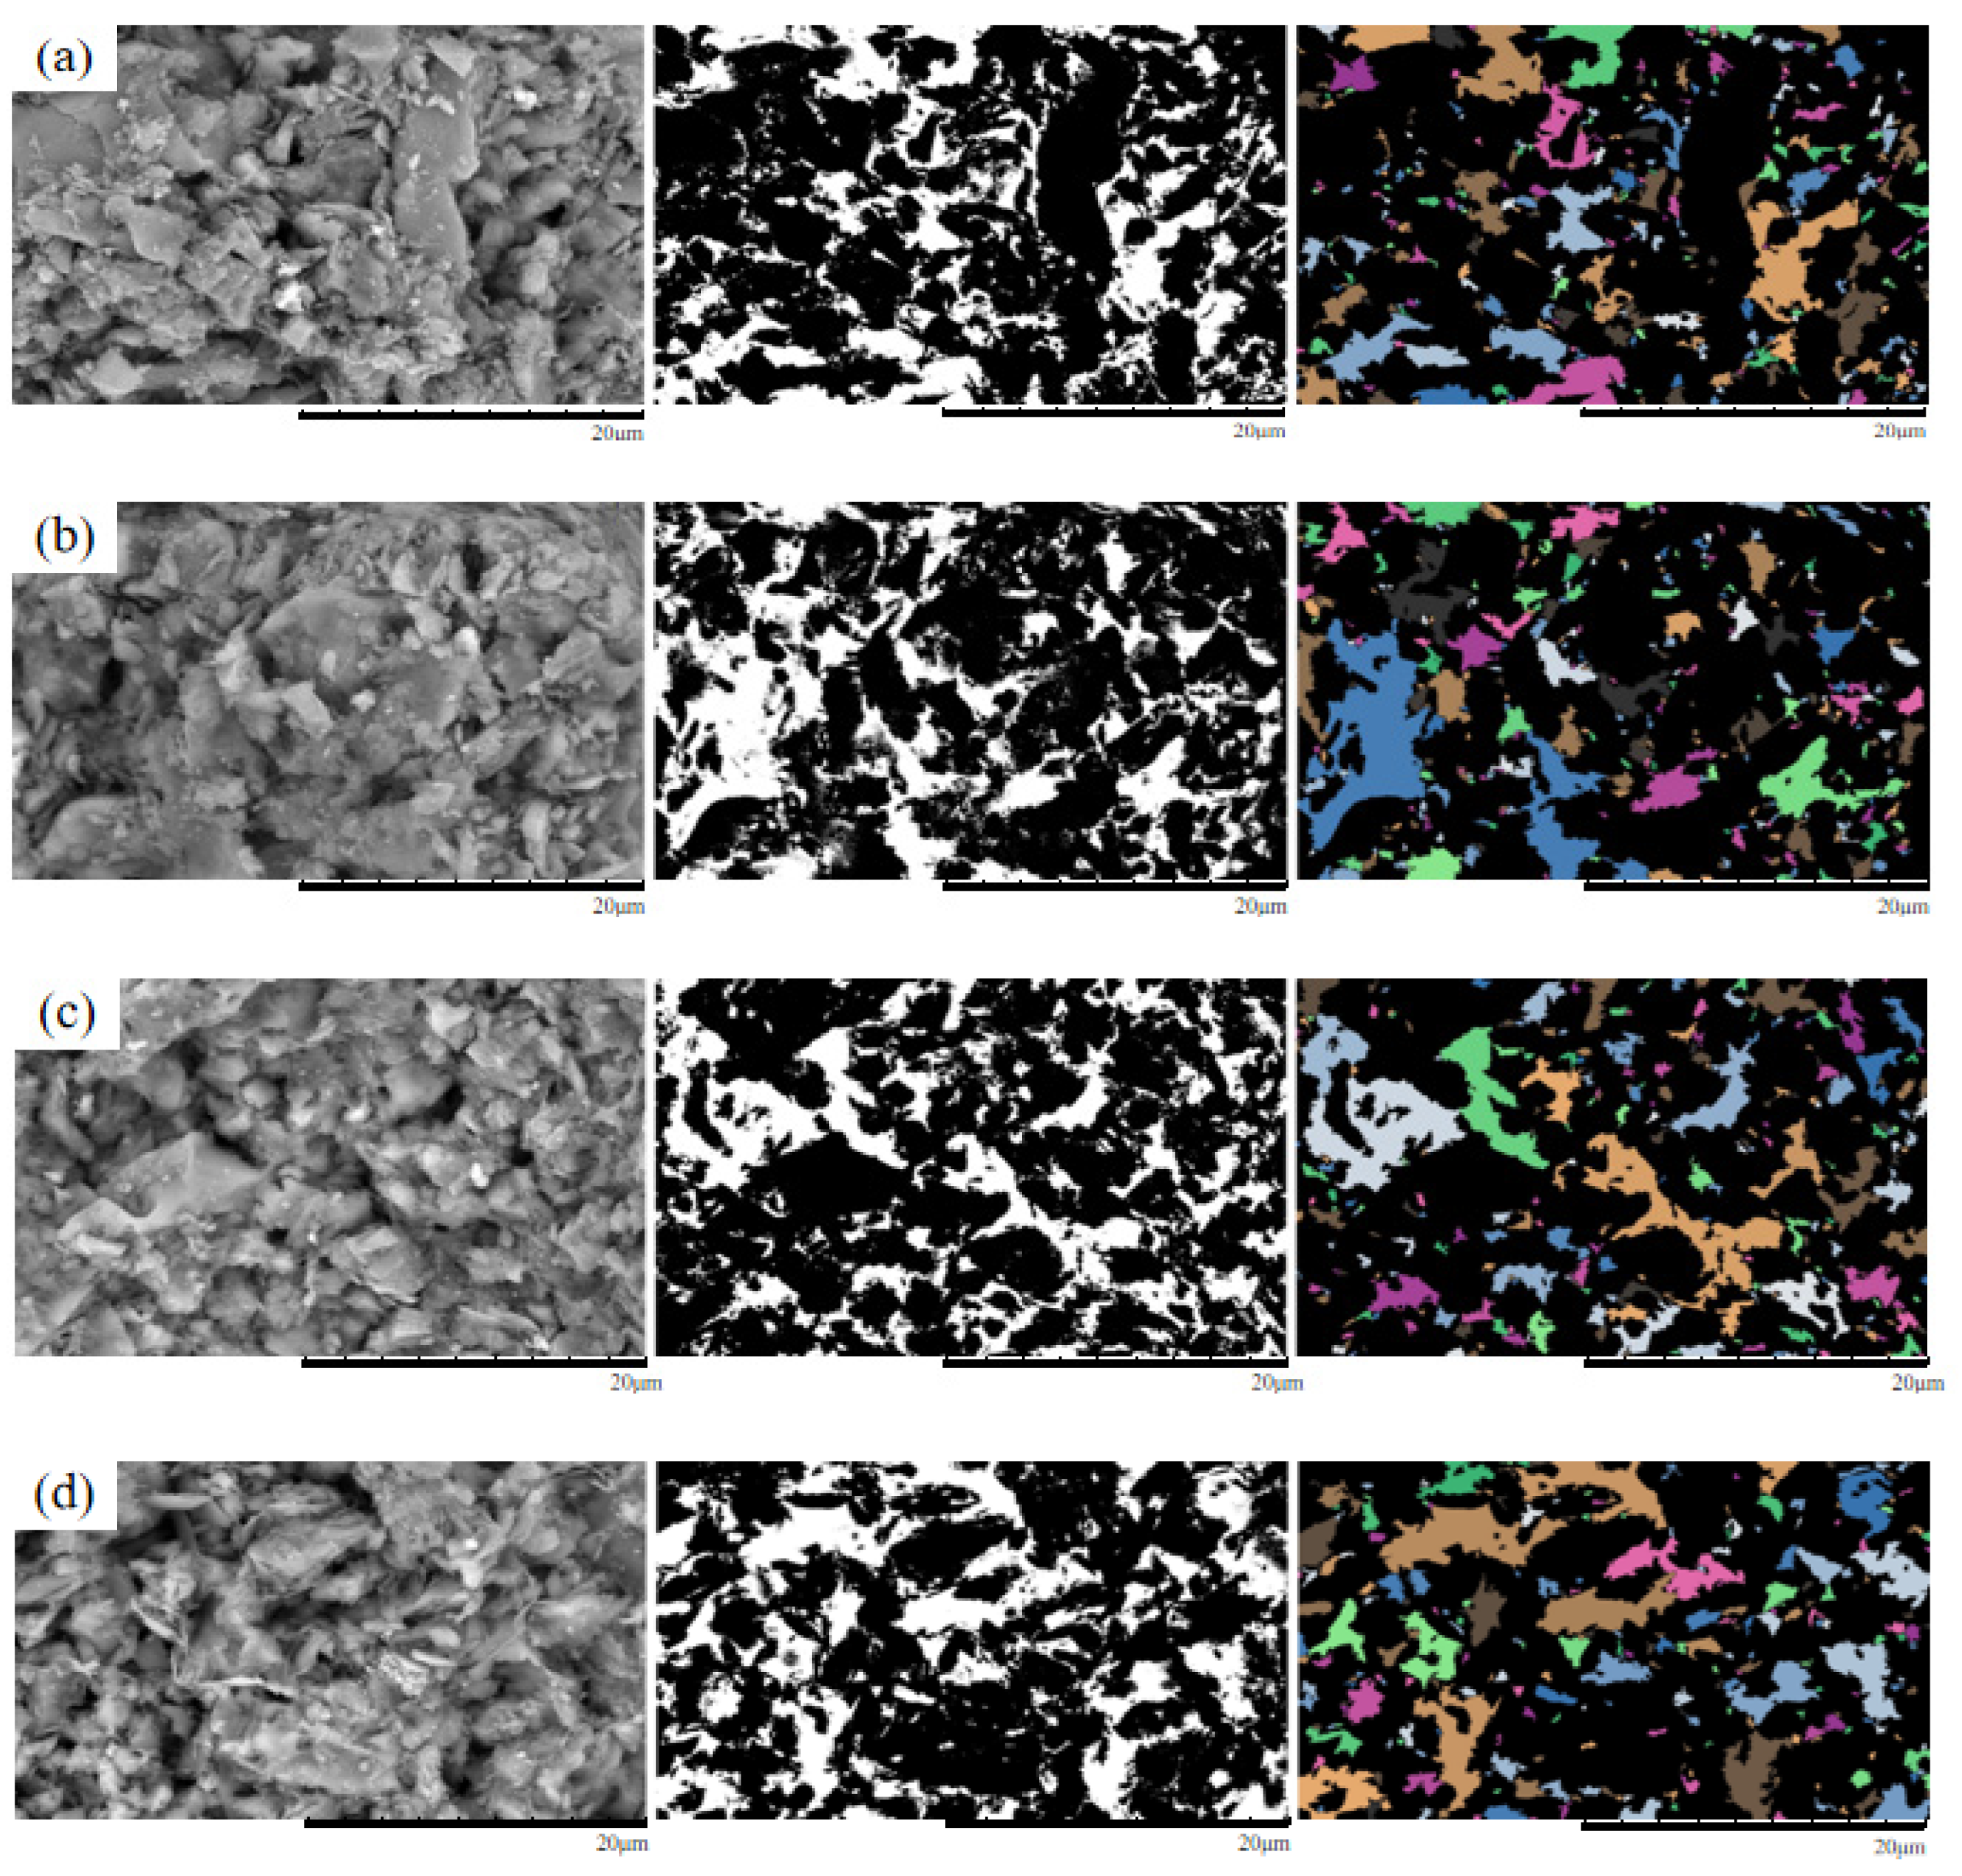
Figure 12.
Original and processed SEM images of specimens under 100 kPa confining pressure (a) Pure water;(b) 3% MgSO4;(c) 6% MgSO4;(d) 9% MgSO4.
Figure 12.
Original and processed SEM images of specimens under 100 kPa confining pressure (a) Pure water;(b) 3% MgSO4;(c) 6% MgSO4;(d) 9% MgSO4.
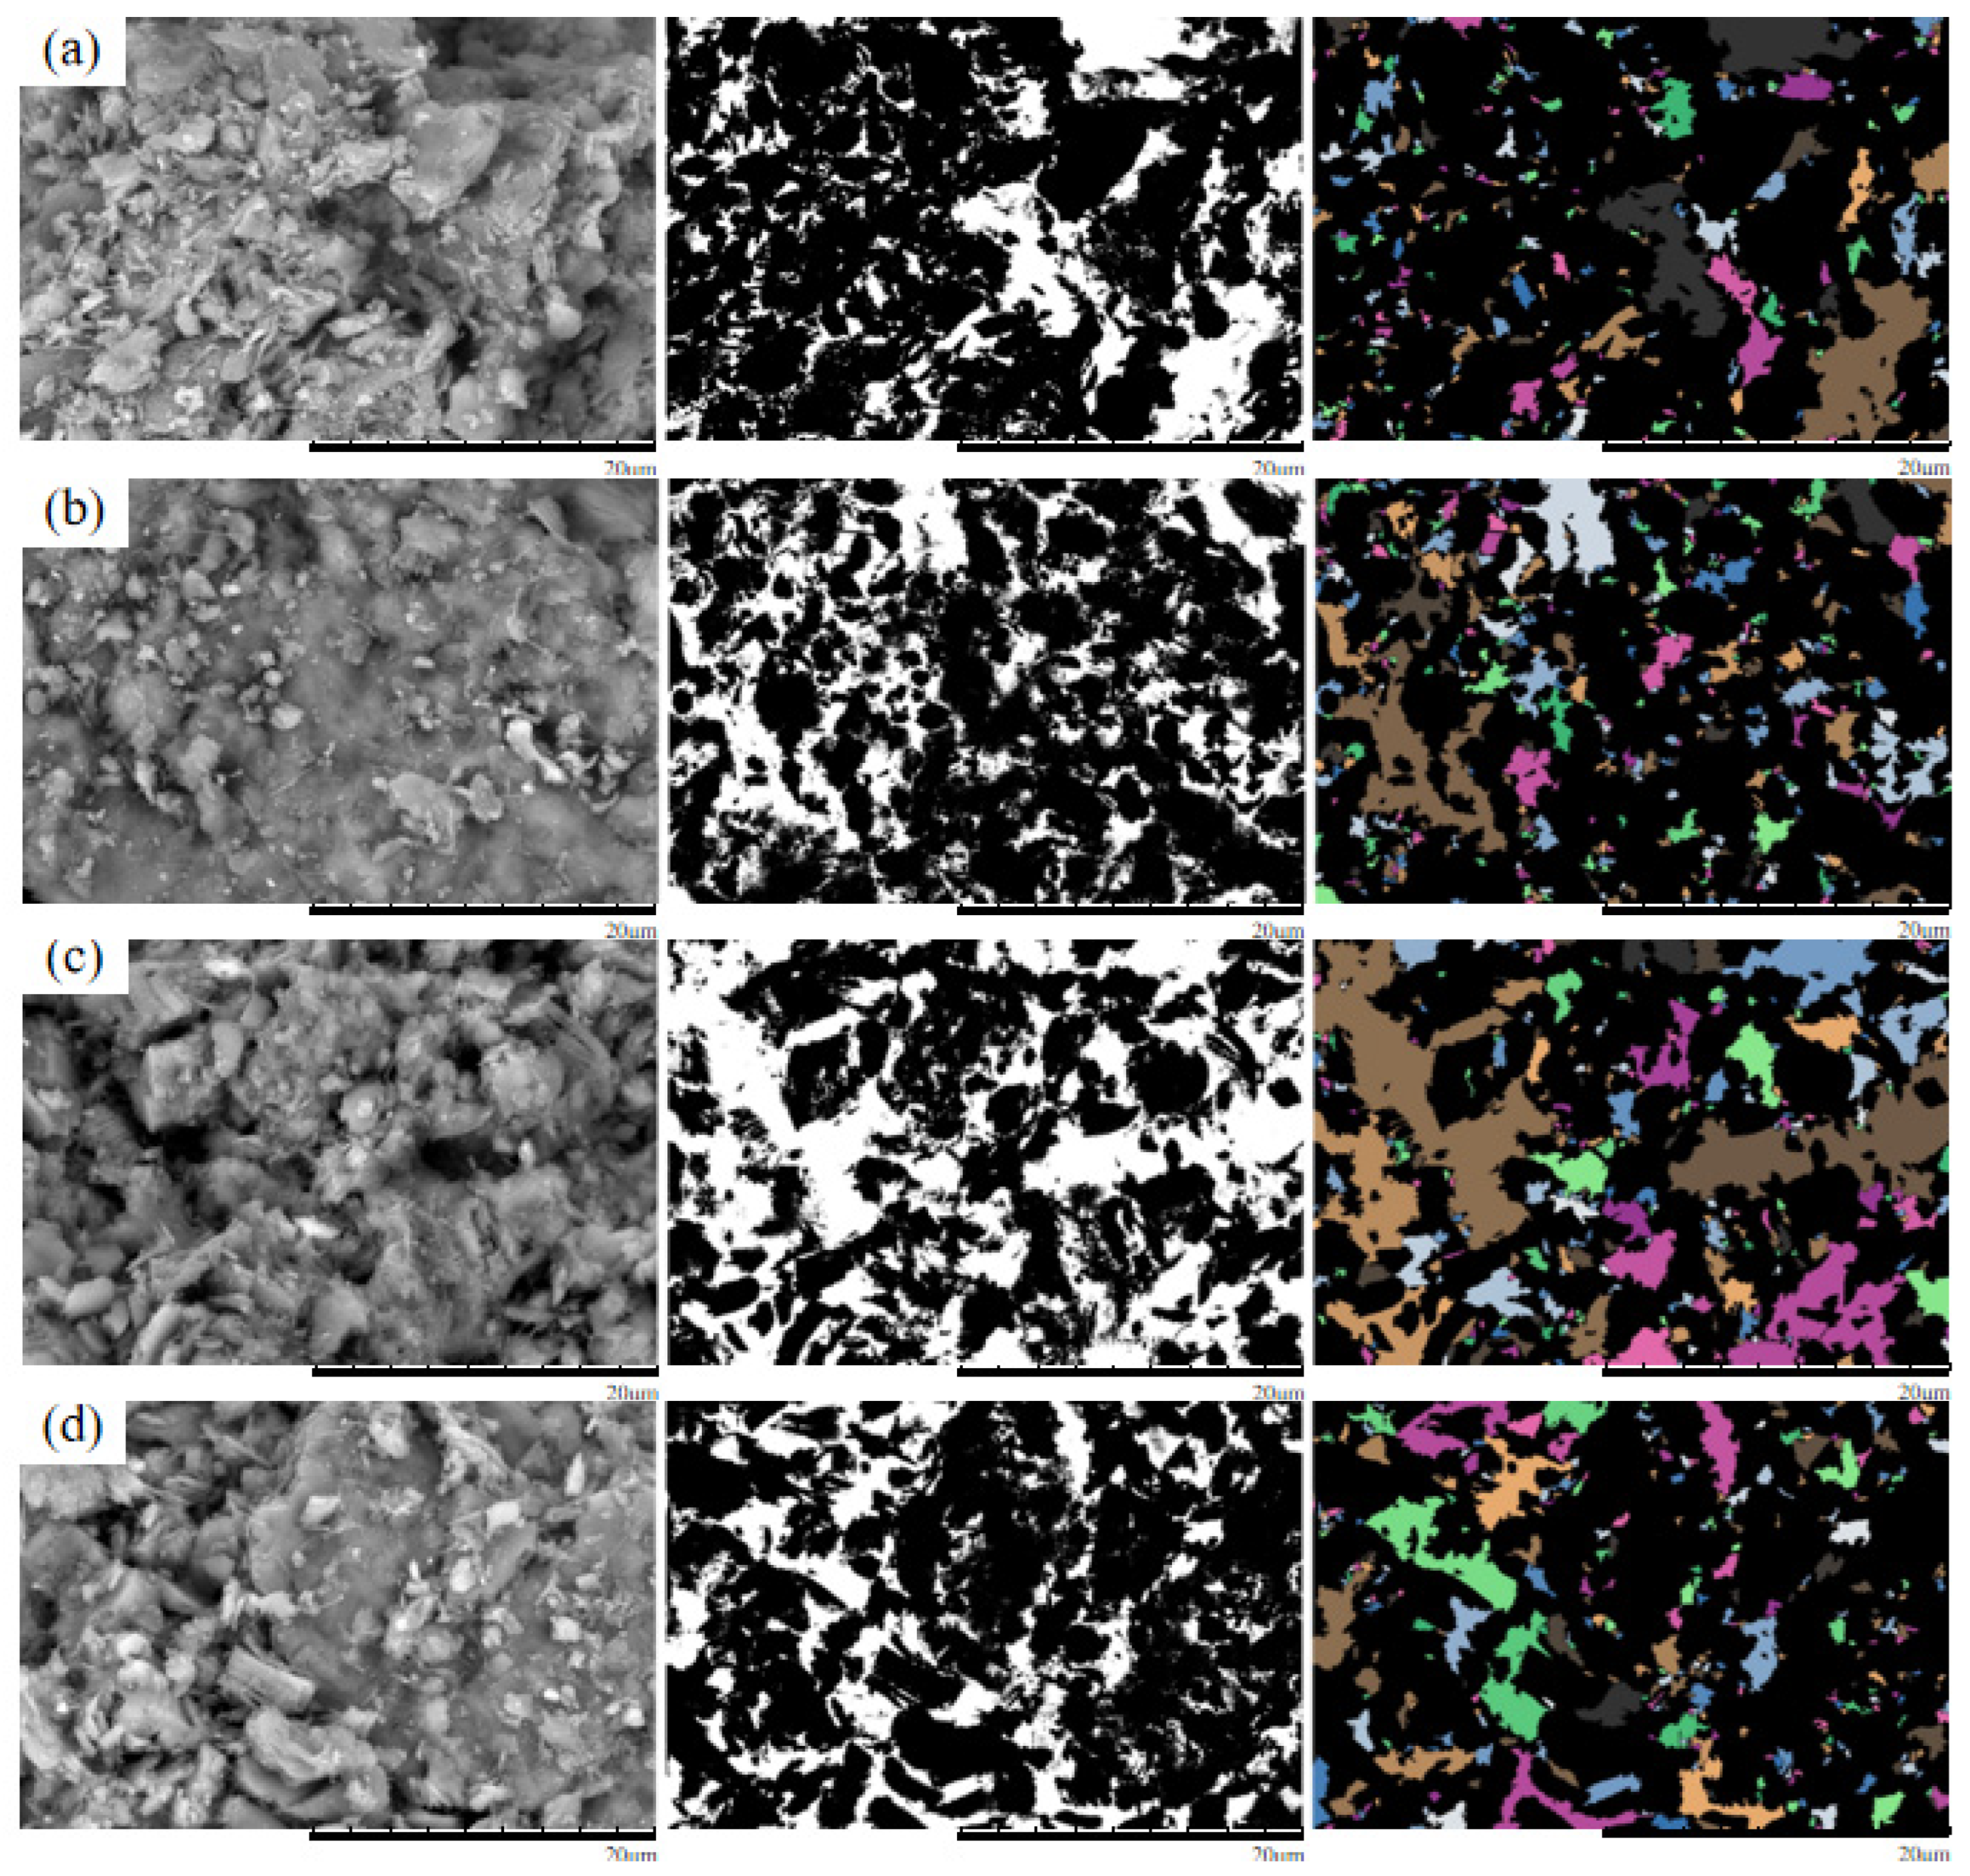
Figure 13.
Original and processed SEM images of specimens under 150 kPa confining pressure (a) Pure water;(b) 3% MgSO4;(c) 6% MgSO4;(d) 9% MgSO4.
Figure 13.
Original and processed SEM images of specimens under 150 kPa confining pressure (a) Pure water;(b) 3% MgSO4;(c) 6% MgSO4;(d) 9% MgSO4.
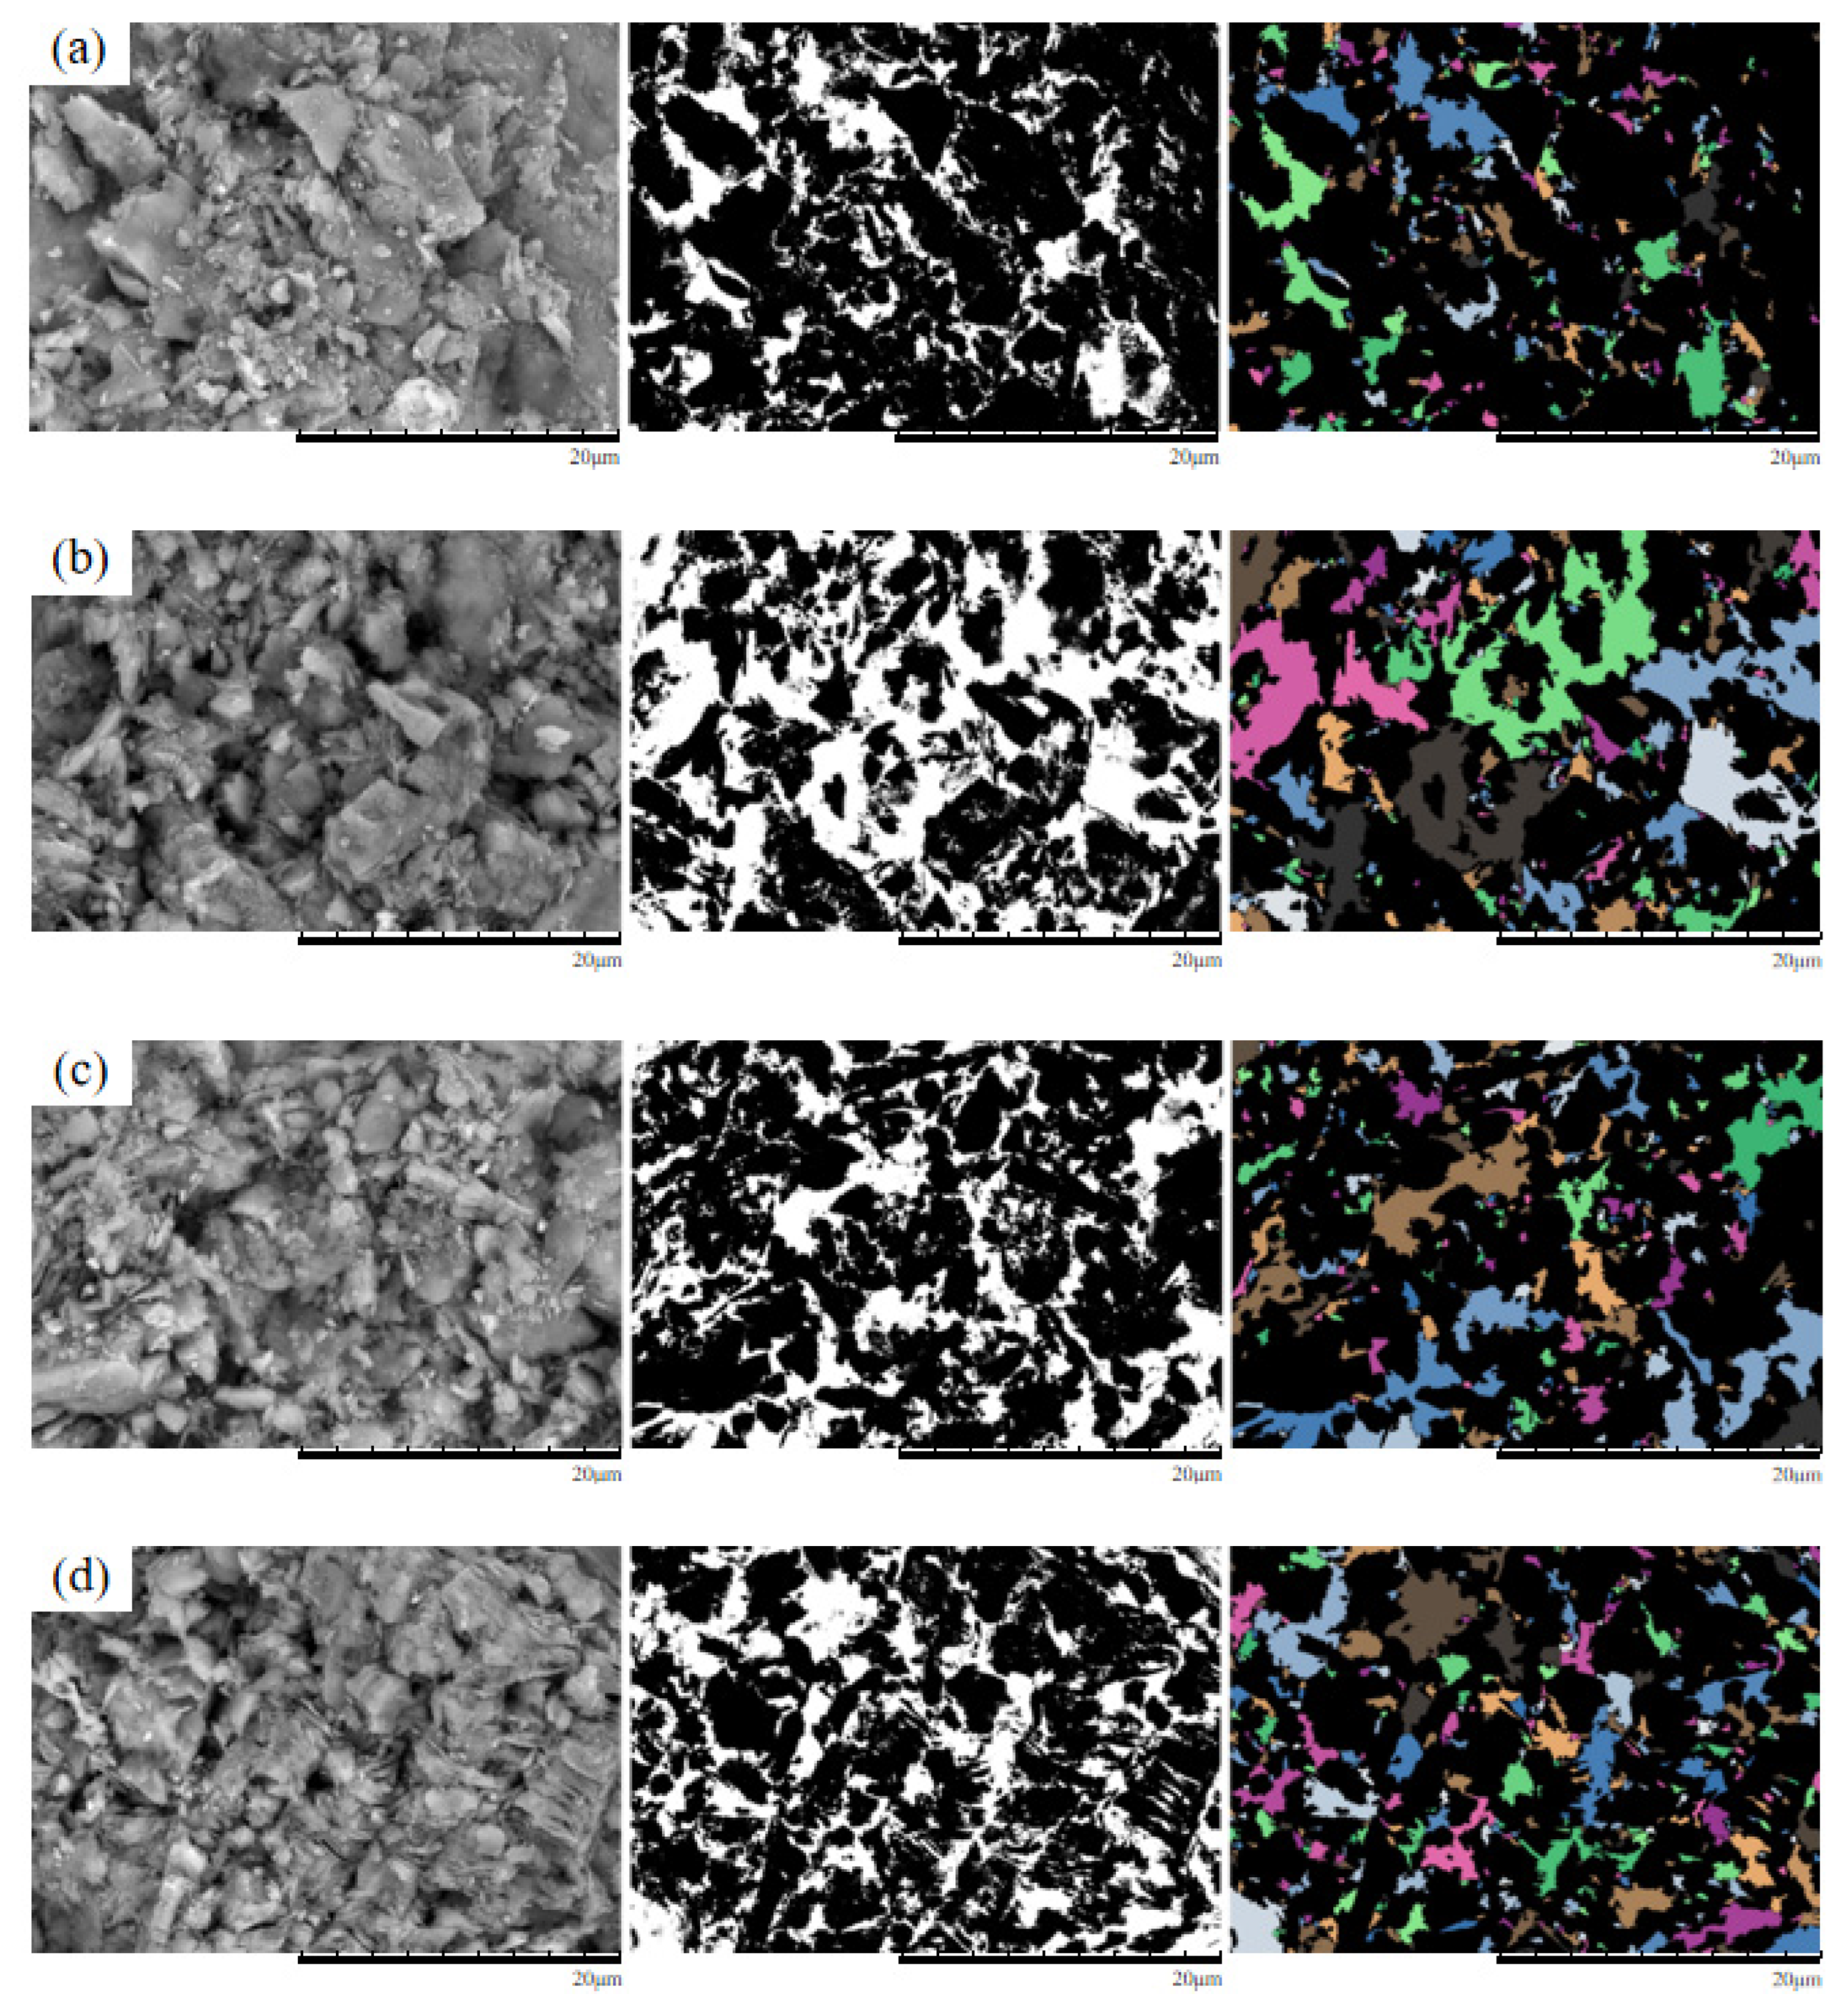
Figure 14.
Pore size distribution under different confining pressure.
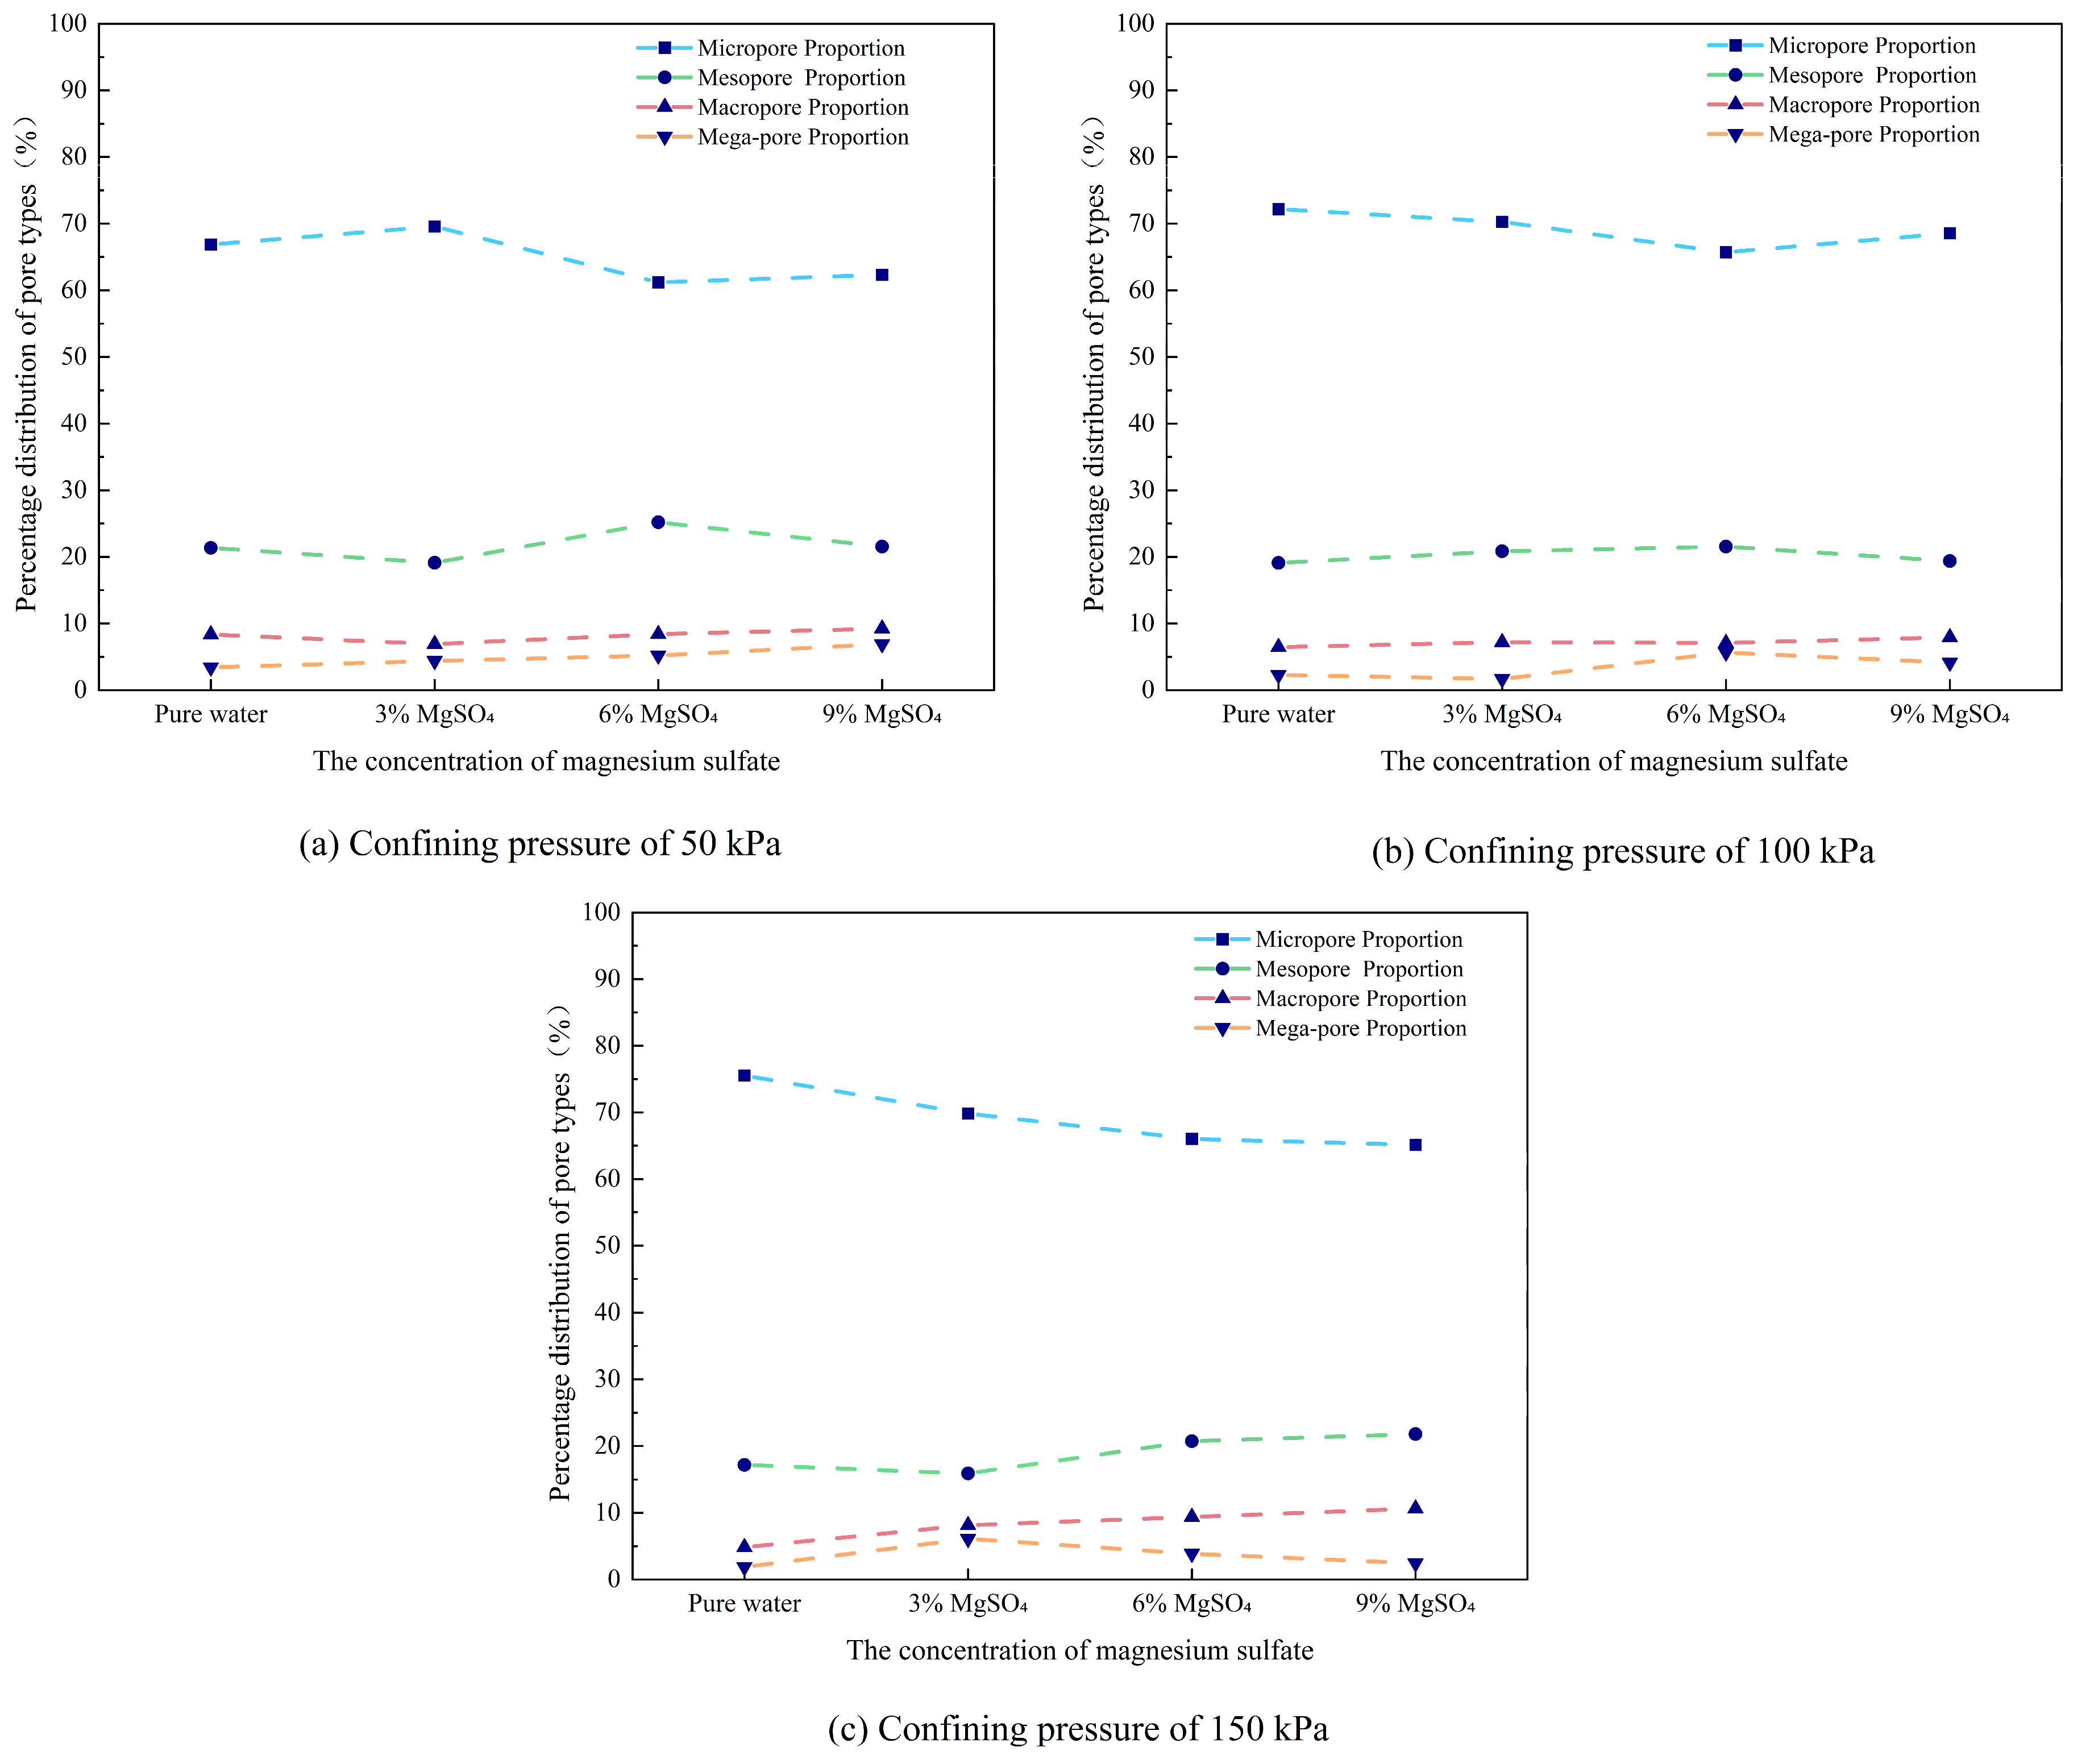
Figure 15.
Polar histogram under different magnesium sulfate concentrations (a) Pure water 50 kPa (b) Pure water 100 kPa (c) Pure water 150 kPa (d) 3%MgSO4 50 kPa (e) 3%MgSO4 100 kPa (f) 3%MgSO4 150 kPa (g) 6%MgSO4 50 kPa (h) 6%MgSO4 100 kPa (i) 6%MgSO4 150 kPa (j) 9%MgSO4 50 kPa (k) 9%MgSO4 100 kPa (l) 9%MgSO4 150 kPa.
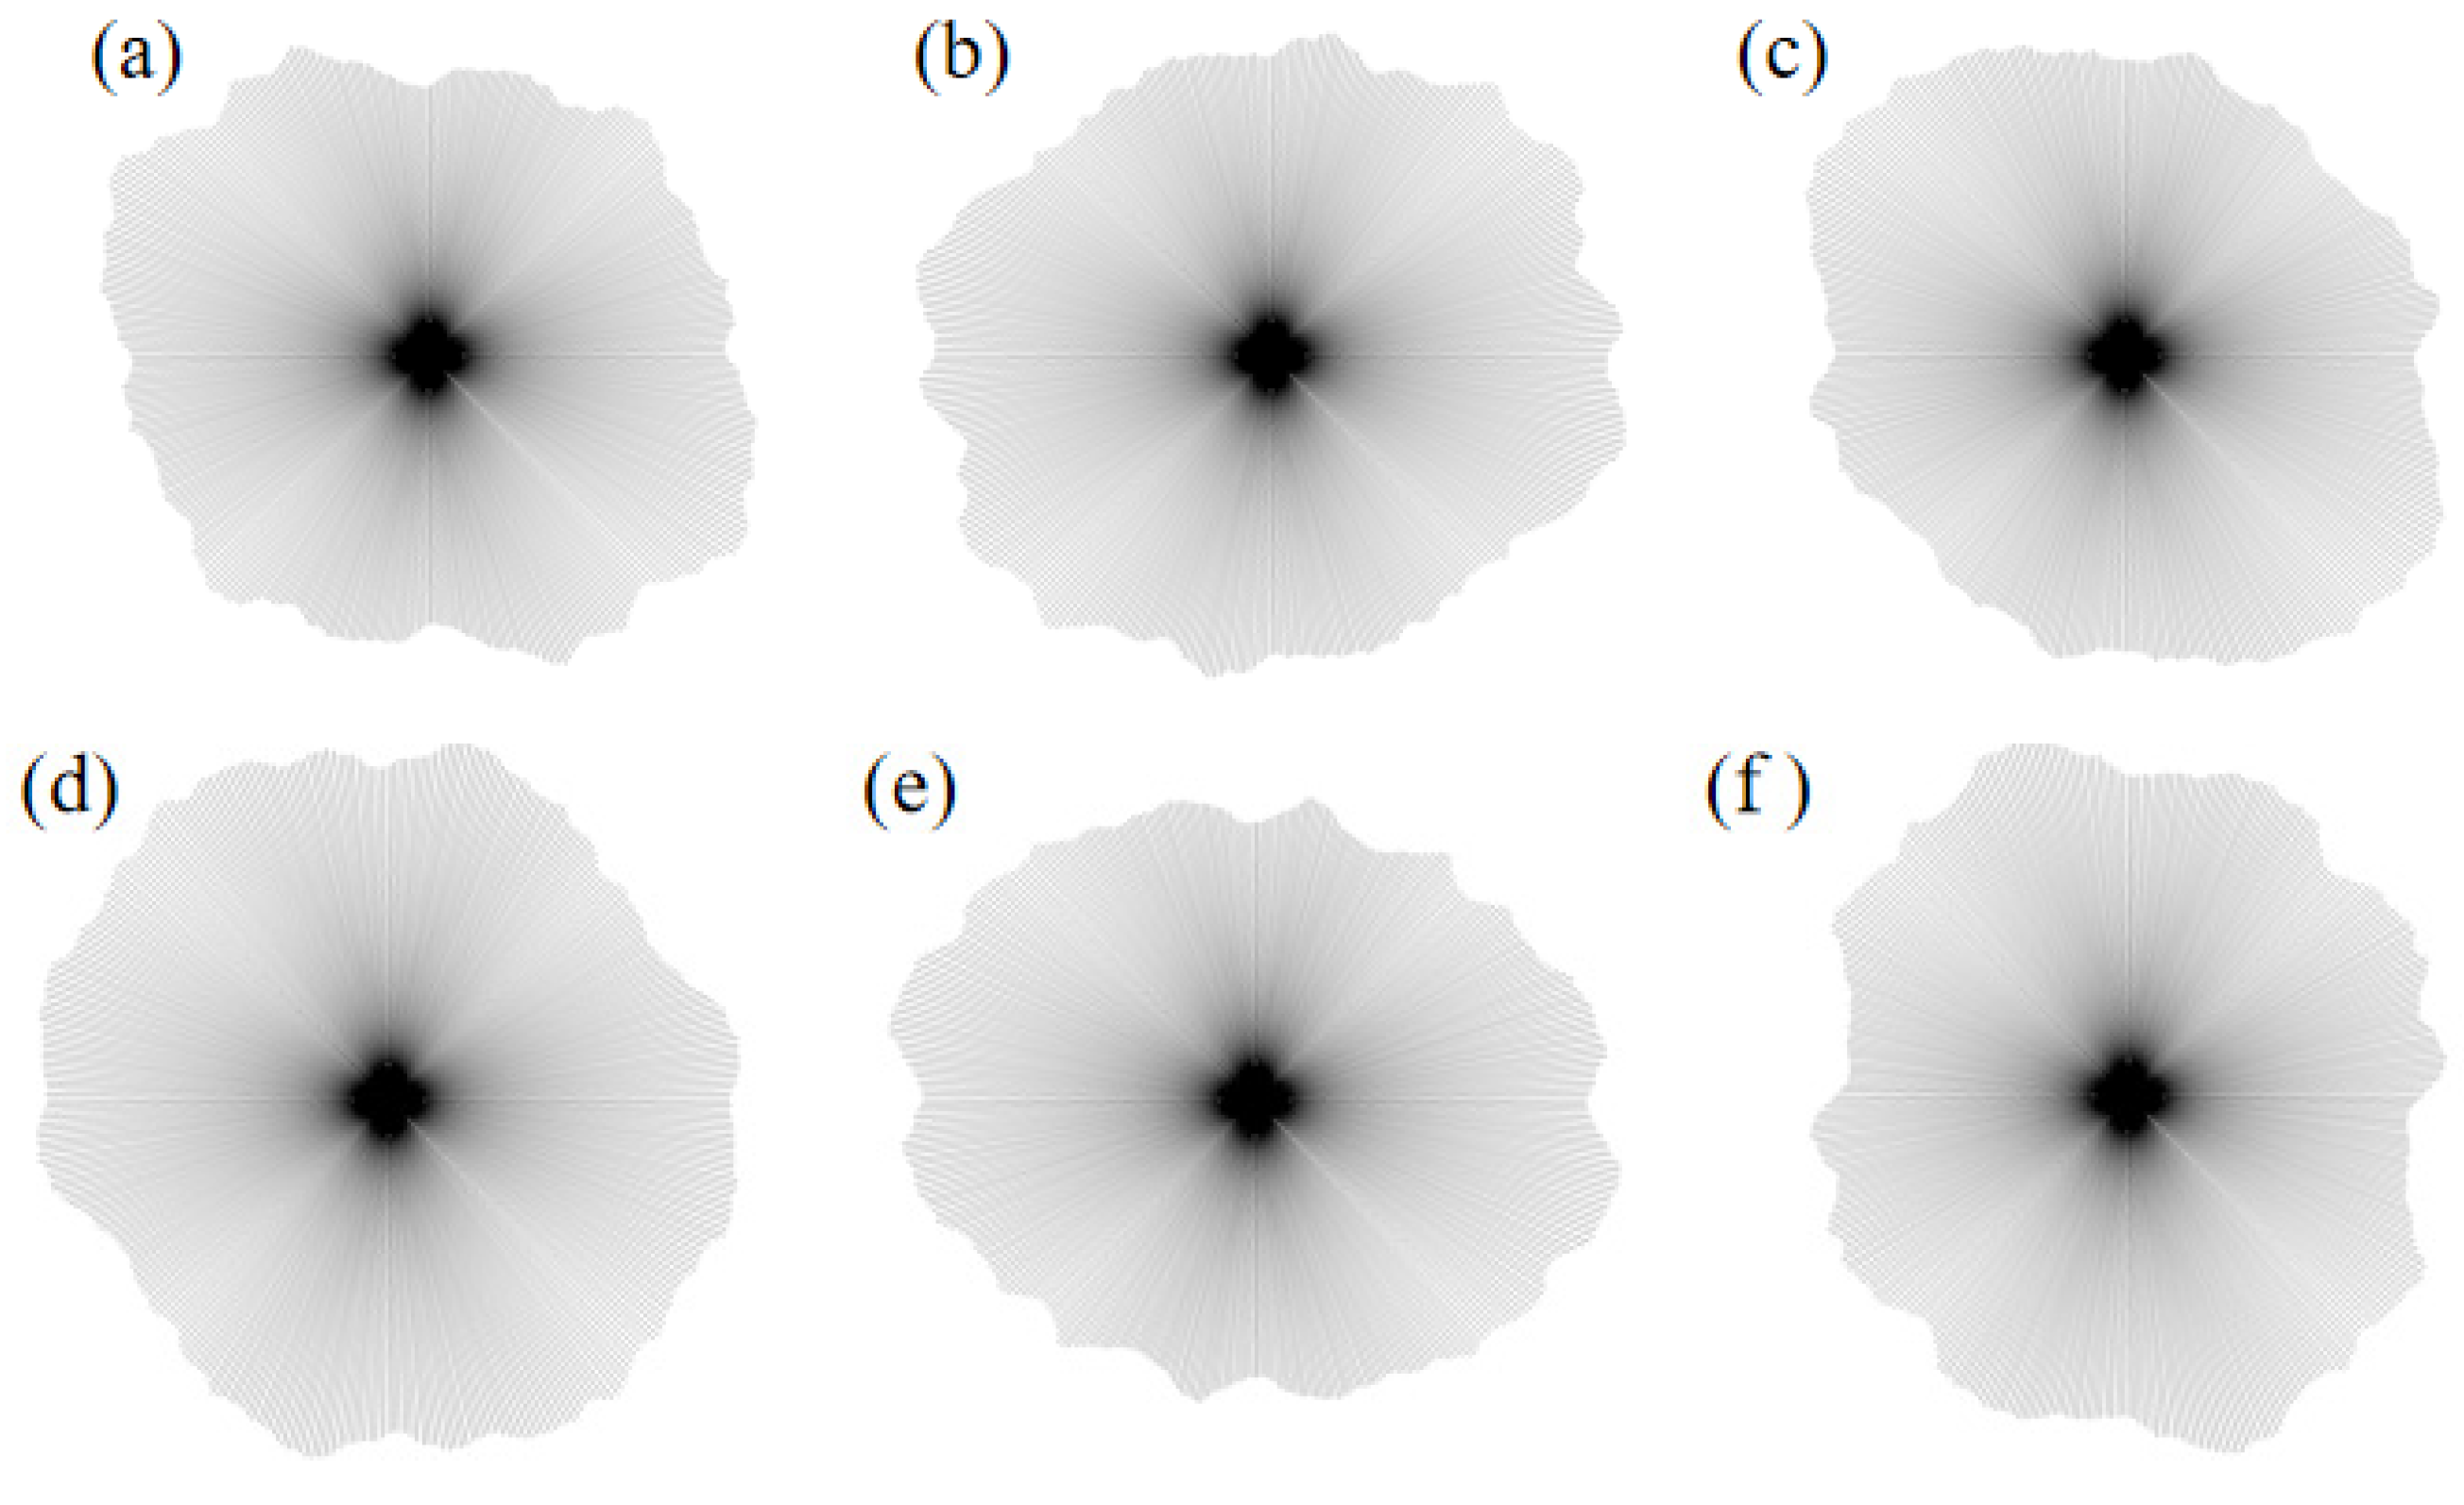
Figure 16.
Probability entropy under different magnesium sulfate concentrations.
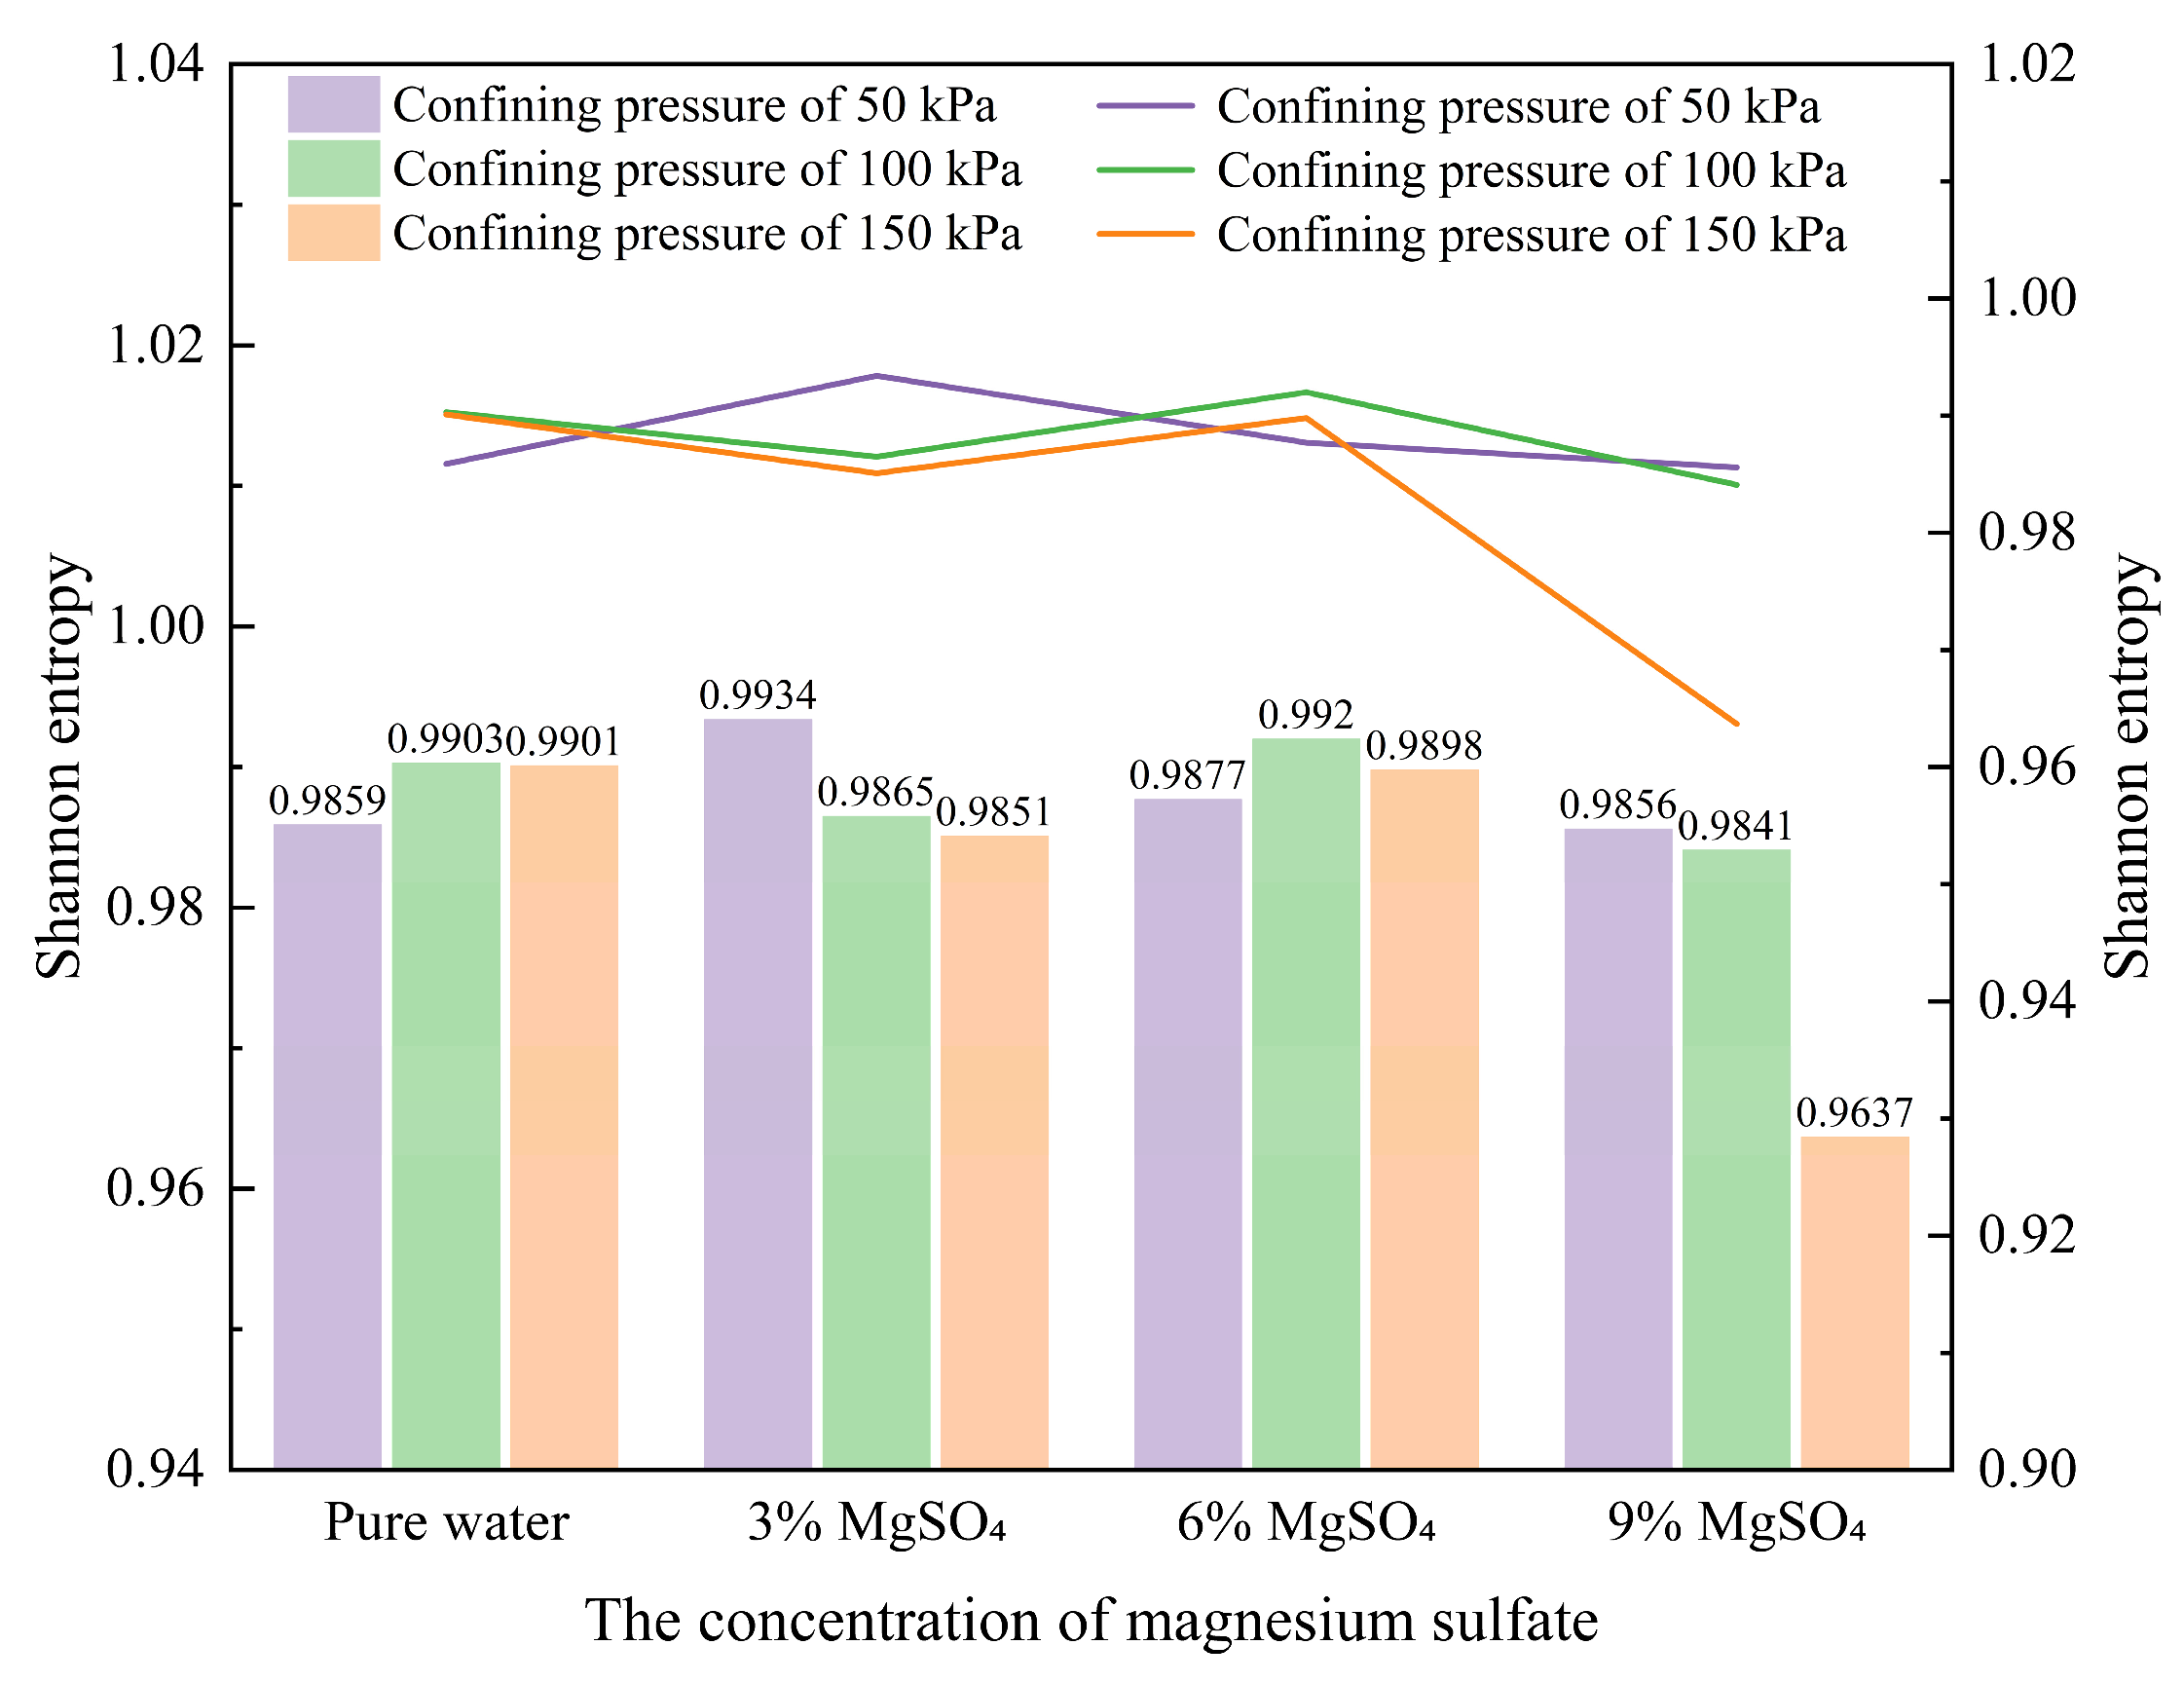
Figure 17.
Fractal dimension variation under different magnesium sulfate concentrations.
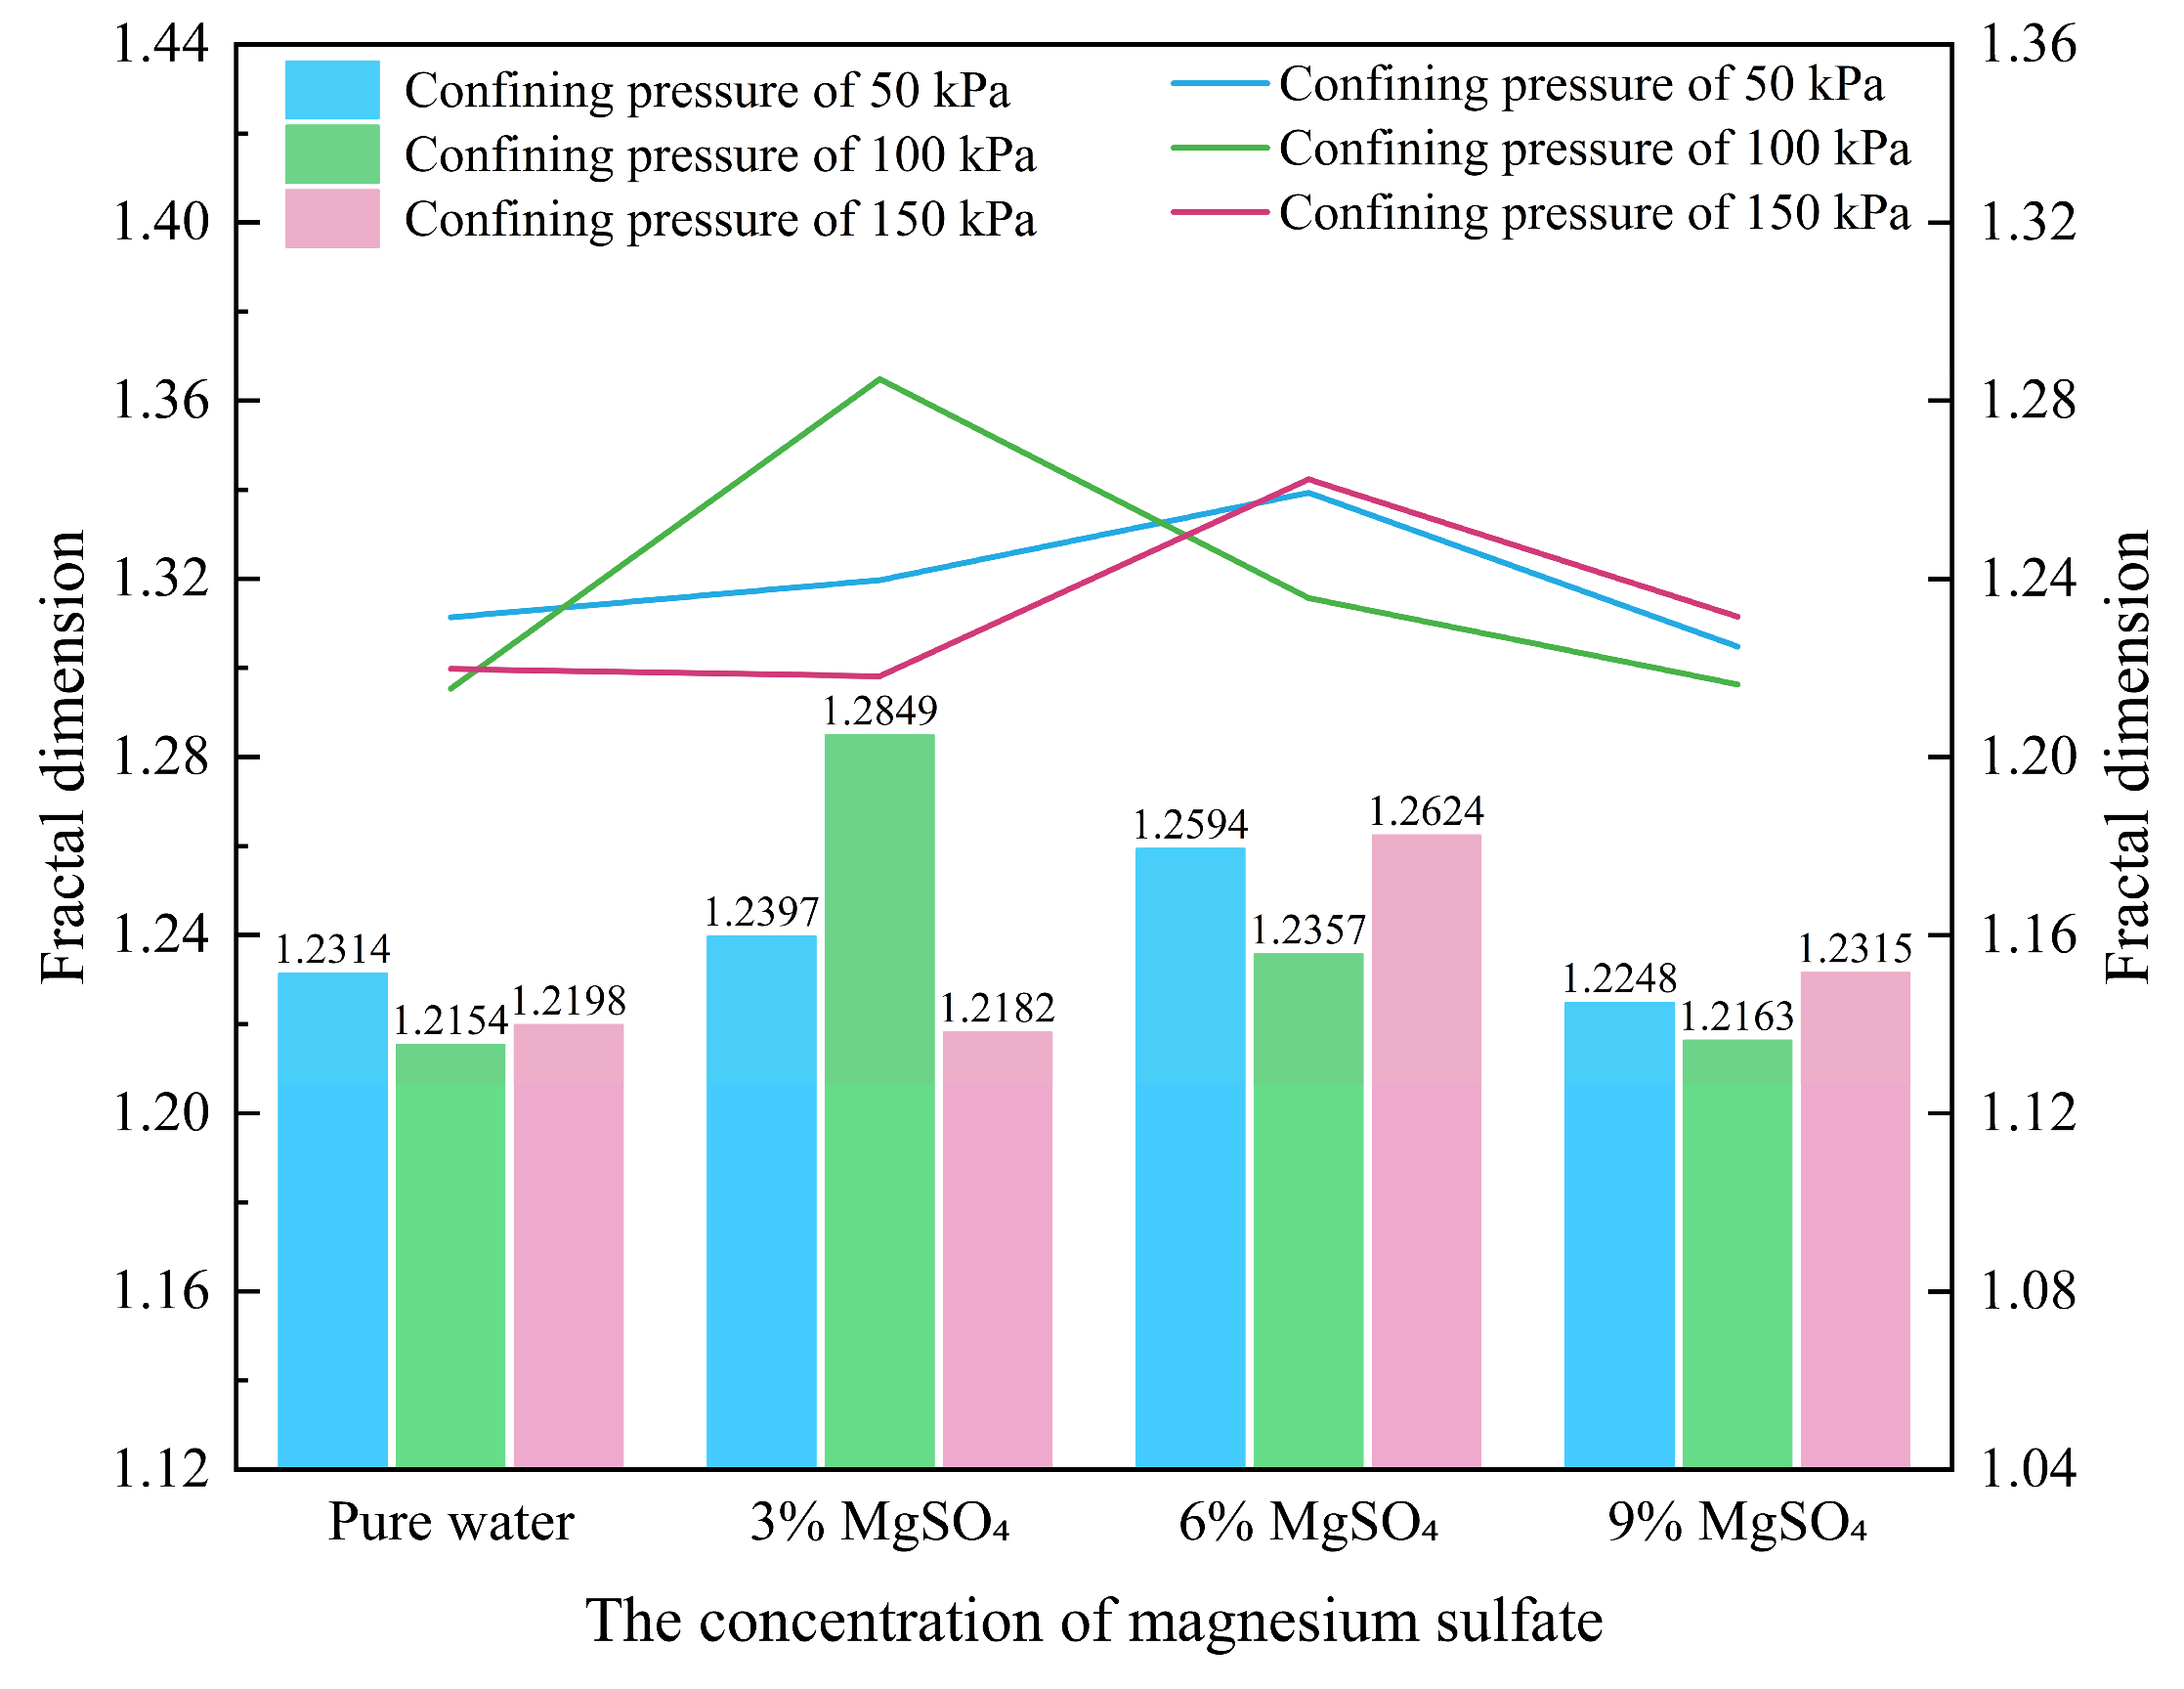

Table 1.
Physical indexes of the original rare earth ore sample.
| Physical indexes |
Water content/% |
Density (g/cm3) |
Dry density (g/cm3) |
Liquid limit (WP)/% |
Plastic limit (WL)/% |
Plastic index (IP) |
|---|---|---|---|---|---|---|
|
Original rare earth |
18.03 | 1.77 | 1.49 | 41.83 | 29.23 | 12.6 |
Table 2.
Composition analysis of soil samples.
| Element | SiO2 | Al2O3 | Fe2O3 | K2O | MnO | MgO |
|---|---|---|---|---|---|---|
| Content(%) | 20.201 | 18.069 | 3.916 | 1.453 | 0.046 | 0.161 |
| Element | PbO | Rb2O | CaO | ZnO | Y2O3 | |
| Content(%) | 0.015 | 0.014 | 0.009 | 0.007 | 0.001 |
Table 3.
Design of test conditions.
| Soil number | Leaching conditions | Confining pressure |
|---|---|---|
| A1 | Pure water | 50 kPa, 100 kPa, 150 kPa |
| B1 | 6%(NH4)2SO4 | |
| B2 | 6%MgSO4 | |
| B3 | 6%Al2(SO4)3 | |
| C1 | 3%MgSO4 | |
| C2 | 6%MgSO4 | |
| C3 | 9%MgSO4 |
Table 5.
Pore proportion and total number of pores in the SEM images.
| Testing condition | Confining pressure | Micropore proportion | Mesopore proportion | Macropore proportion | Mega-pore proportion | Total porosity |
|---|---|---|---|---|---|---|
| Pure water | 50kPa | 66.87% | 21.36% | 8.36% | 3.41% | 323 |
| 100kPa | 72.17% | 19.1% | 6.47% | 2.27% | 309 | |
| 150kPa | 75.54% | 17.2% | 4.84% | 1.88% | 372 | |
| 3%MgSO4 | 50kPa | 69.59% | 19.12% | 6.9% | 4.39% | 319 |
| 100kPa | 70.26% | 20.86% | 7.19% | 1.68% | 417 | |
| 150kPa | 69.83% | 15.93% | 8.14% | 6.1% | 295 | |
| 6%MgSO4 | 50kPa | 61.2% | 25.2% | 8.4% | 5.2% | 250 |
| 100kPa | 65.72% | 21.55% | 7.07% | 5.65% | 283 | |
| 150kPa | 66.02% | 20.71% | 9.39% | 3.88% | 309 | |
| 9%MgSO4 | 50kPa | 62.31% | 21.54% | 9.23% | 6.92% | 260 |
| 100kPa | 68.57% | 19.37% | 7.94% | 4.13% | 315 | |
| 150kPa | 65.13% | 21.79% | 10.65% | 2.42% | 413 |
Disclaimer/Publisher’s Note: The statements, opinions and data contained in all publications are solely those of the individual author(s) and contributor(s) and not of MDPI and/or the editor(s). MDPI and/or the editor(s) disclaim responsibility for any injury to people or property resulting from any ideas, methods, instructions or products referred to in the content. |
© 2025 by the authors. Licensee MDPI, Basel, Switzerland. This article is an open access article distributed under the terms and conditions of the Creative Commons Attribution (CC BY) license (https://creativecommons.org/licenses/by/4.0/).
Copyright: This open access article is published under a Creative Commons CC BY 4.0 license, which permit the free download, distribution, and reuse, provided that the author and preprint are cited in any reuse.


