Submitted:
13 May 2025
Posted:
14 May 2025
You are already at the latest version
Preprints on COVID-19 and SARS-CoV-2
Abstract
Understanding daily mobility in Egypt remains a challenge due to lim-ited data availability. Traditional urban studies rely on census data and satellite imagery, offering static snapshots rather than a dynamic rep-resentation of movement. This study utilizes Facebook’s “Data for Good” program to analyze daily mobility patterns of over four million users in Egypt from April to October 2020, coinciding with the first wave of COVID-19. The Egyptian government's response, including curfews and reductions in public transport, aimed to curb the virus’s spread, yet our findings indicate that daily commuting persisted at sig-nificant levels, particularly in Greater Cairo. We assess the extent to which mobility restrictions influenced move-ment flows, highlighting the interplay between commuting patterns and urban structure. Mobility reduction was most pronounced at night and during religious holidays, particularly Ramadan and Eid al-Fitr. However, daytime movement remained substantial, driven by eco-nomic necessity. By mapping COVID-19 incidence across Cairo’s dis-tricts, we reveal a correlation between urban centrality and infection rates, emphasizing the role of daily circulation in virus diffusion. This study underscores the potential of social media mobility data to fill gaps in urban research, offering comparative insights into how differ-ent countries experienced mobility shifts during the pandemic.
Keywords:
Egypt
; urban dynamics
; daily commuting
; big data mobility analysis
; Covid 19
1. Introduction
Egypt has just passed the milestone of 100 million inhabitants and the country is currently experiencing a rebound in its demographic growth linked to the reversal in its fertility rate (Assad 2020; Billion & Parant 2020). This countercyclical dynamic has been accompanied, particularly since 2011, by a sharp acceleration in the expansion of the built environment (Radwan et al. 2019).
However, knowledge of the daily mobility of the Egyptian urban population remains limited. To date, data available on commuting remains scarce. Consequently, urban studies mainly analyze city changes based on imagery and census data complemented by surveys, presenting a snapshot of a static socio-economic environment, but fail to provide a dynamic picture of the Egyptian cityscape on the move around the clock.
We propose here a first exploration of the data made available by the “Meta data for good” program that provides information on the mobility of Facebook users over 18 years. Our analysis is part of a larger and comparative program studying daily mobility patterns of individuals in several cities worldwide in relation with viruses’ diffusion such as SARS-CoV-2. As far as Egypt is concerned, we used a dataset comprising daily mobility between April and October 2020 for a cohort of more than 4 million regular Facebook users.
The period we cover in this article is anything but ordinary; it extends from the beginning of April to the end of November 2020. SARS-CoV-2 began to spread in Egypt towards the end of February 2020. The first significant measures to curb its national diffusion were taken by the Egyptian government at the end of March, with the first curfew being ordered on March 24th, the reduction of public transport, and the closure of schools and universities being at the center of epidemic control.
Therefore, our purpose is to reveal the major structural characteristics of the daily circulation of Egyptians and to qualify the extent of the reduction in commuting induced by the government’s efforts to contain the spread of the virus. First, we present the patchy knowledge of commuting dynamics within the network of cities and for Cairo. We assess the extent of the lacuna, as reflected in the academic literature. This section is completed by the presentation of the Facebook dataset we used to fill this knowledge gap on daily mobility.
In the second section, we present exploratory results regarding the limited effects on the intensity of daily circulation resulting from public policies to constrain the spread of Covid by controlling human mobility. We pursue with a focus on mapping in the Cairo Region more precisely with respect to the change in mobilities, which remained quite high during the first months of the sanitary crisis.
In the third section, we introduce data on Covid incidence by district for Cairo and explore their distribution in relation to daily commuting. We complete our study from a comparative perspective on variation in urban daily mobility patterns from country to country during the Covid crisis.
2. Methods: Studying Commuting in Egypt: State of Art, New Sources and Spatial Analyzes
2.1. Limited Data to Study Mobility in Egypt
To analyze this unprecedented pressure on Egyptian resources, in particular its urban system, geographers can rely on both sequential traces of the spatial distribution of the population by locality (provided by censuses) and land use captured by satellites. Based on these data, it is possible to qualify the process of urbanization. However, this analysis remains limited, being based solely on a series of static data taken at often very long-time intervals (e.g. 11 years between the two latest population censuses 2006-2017).
Information on mobility is even more limited. The census provides only aggregated data about residential migration and nothing about circular migration. However, these movements of individuals are crucial in the production of inhabited environments. In other words, until now, we were envisioning a snapshot of the sleeping city, capturing its inhabitants only at their place of residence, where they sleep, and only every ten years. Based on existing datasets, we are far from being able to push forward a grounded analysis of population circulation in Egypt. Nevertheless, relational geography is needed to better understand urban change and its extent, interconnections, and rhythms.
The few existing articles are based on ad hoc surveys of the movements of a sample of individuals over one day (see for Cairo, Badran et al. 2017). Other researchers use proxies to approach the more or less localized intensity of daily mobility; pollution sensors are thus used, providing only indirect information (Li et al. 2019; Mostafa et al. 2020).
This paucity of information prevents detection and understanding of the complexity of the urban fabric. In particular, we are pointing to the way, in a context of very unequal socio-economic constraints, in which daily mobility is articulated and transformed under the reciprocal influence of residential strategies, access to resources and employment opportunities within large cities or between villages and cities.
Recently, new mobility data have become accessible. Without being exhaustive, they bring us closer to the real-time and dynamic observation of settlement areas and allow us to understand how populations in motion use and produce their environment. This observation of social networks, using mobile phone users as proxy sensors, brings us closer to capturing socio-spatial fluxes currently irrigating the world. It offers us precise and dynamic data teaching us how each of us is shaping everyday oikumene through our circulation among interconnected places, redefining and challenging notions of frontiers such as urban and rural.
This massive dataset also invites us to question the transition currently in place, which tends to depend more than ever on the data produced by the inhabitants themselves: A real-time geography produced by users who have become the sensors of their own practices.
This massive amount of data made available by private multinationals places research on a new relationship of dependence, but no public data exists to compete with it. Moreover, these datasets allow us to build a structured and comparable vision of urban daily mobility in different countries, thus allowing international comparisons.
2.2. Data Source and Processing
On average, Facebook captured the daily locations of 4,124,000 Egyptians. These individual digital traces were grouped into tiles measuring 2 × 2 km. This cohort of Facebook users who activated the location function on their mobile phone application represents 7.7% of the Egyptian population over 18 years of age. The number of individuals per tile allows us to determine the geography of the studied population, per day, week, or month, in comparison with a baseline. This baseline is selected by the researcher, depending on the objective—e.g., a pre-pandemic period, or a typical weekend versus a weekday. These measurements of space occupancy can indicate unusual practices, such as people staying at home or zones with increased daytime movements.
The second dataset provides information on mobility between tiles of 8 × 8 km. For privacy reasons, only movements involving more than nine people are recorded. On average, 3,308,000 users were identified as mobile daily, with approximately 420,000 movements between tiles on working days. These movements were recorded in 8-hour intervals—between 02:00–10:00, 10:00–18:00, and 18:00–02:00—resulting in three mobility records per day. Altogether, we processed a matrix of 4,066,170 displacement flows between April and October 2020, using November as a reference period.
This dataset allowed the construction of daily dynamic mobility matrices between 8×8 km tiles across the country and in the Greater Cairo area.
All data processing and network analysis were conducted using the R programming language (version 4.3), leveraging the 'Igraph' package for network construction and metric computation. Spatial representations and cartographic outputs were created using QGIS (version 3.28), an open-source geographic information system licensed under the GNU General Public License. This combination of tools allowed for robust statistical handling and high-quality spatial visualization of Egypt’s mobility networks.
2.3. Network Analysis
To analyze the structure and evolution of Egypt's mobility system, we relied on Facebook's "Data for Good" dataset, which provides aggregated and anonymized movement flows between geographical tiles measuring 8×8 kilometers. These flows were recorded in three-time windows each day—early morning (02:00–10:00), daytime (10:00–18:00), and evening/night (18:00–02:00)—between April and November 2020.
Each tile was treated as a node, and directed, weighted edges were constructed based on the number of individuals moving between tiles during each time window. This enabled the formation of dynamic directed networks that captured population mobility in different temporal phases. From these networks, we calculated key structural indicators such as:
- Density: This measures how many connections exist in the network relative to the maximum possible. A high density indicates that most zones are interconnected, suggesting an extensive and robust mobility structure.
- Average path length and diameter: The average path length reflects the mean number of steps required to go from one node to another, while the diameter indicates the longest of the shortest paths in the network. These two metrics provide insights into the network's spatial reach and efficiency.
- Component count: This refers to the number of isolated subnetworks within the overall system. A single component means the entire network is connected; multiple components indicate fragmentation and disconnected areas.
- Community detection (Louvain algorithm): This algorithm identifies clusters of nodes that are more densely connected internally than with the rest of the network. These communities often reflect functional subregions or local commuting basins.
- Modularity: This metric quantifies the strength of the division into communities. Higher modularity values indicate well-separated clusters, suggesting more localized mobility patterns.
- Asymmetry indices: These assess the imbalance between incoming and outgoing flows for each zone, helping to distinguish areas that act mainly as emitters (sources) or attractors (destinations) of mobility.
- Mobility flow volumes: These reflect the total magnitude of movement across the network and allow us to track temporal trends in mobility intensity.
Analyzes were conducted at two spatial scales: the national level, covering all mobility across Egypt, and the metropolitan level, focusing on the Greater Cairo Region. This two-scale approach allowed us to detect both the broad resilience of Egypt's mobility system and the specific urban dynamics that contributed to concentrated commuting flows in the capital.
3. Results: A Cohort of Egyptian Users Sampled Day After Day
On average, Facebook captured the daily locations of 4,124,000 Egyptians. These individual digital traces were grouped into tiles measuring 2 × 2 km. This cohort of Facebook users who have activated the location function on their mobile phone application represents 7.7% of the Egyptian population over 18 years of age. The number of individuals per tile allows us to determine the geography of the studied population, per day, week, or month, in comparison with a baseline. This baseline is chosen by us, according to a specific event, but can also be chosen to compare mobility of individuals during the week vs. the weekend. This generation of space occupancy can indicate unusual practices, such as the areas where individuals are staying at home, or conversely, where people tend to move more during the day.
The second dataset provides information on the mobility between two tiles; however, these are larger tiles of 8 × 8 km. To protect the anonymity of users, only flows with more than nine people were reported. On average, our cohort of users included 3,308,000 users who travel daily, including 420,000 between tiles during the working days of the week.
Therefore, we processed a matrix of all the displacements between these tiles of 8 x 8 km, that is 9,545 links possible, from April to November 2020.
These flows were documented every 8 h, that is, at 02:00 a.m., 10:00 a.m., and 6:00 p.m. local time. In other words, we know how many people in the cohort moved from one tile to another between 2:00 a.m. and 10:00 a.m., 10:00 a.m. and 6:00 p.m., and 6:00 p.m. and 2:00 a.m., that is, three measurements per day. Therefore, we processed a displacement matrix containing 4,066,170 flows during April and October - using November as reference period. Because we are getting closer to the complexity of real-time mobility, the analytical method refers to the analysis of massive data.
As there are many links and more ad hoc data, the use of these datasets raises new methodological questions, both in terms of processing and representation (Bahoken et al., 2020; Barbosa et al. 2018).
There are some limitations to our dataset. We did not have qualitative information on the users of a platform whose daily movements were computed. We cannot precisely measure the representativeness of our cohort comprising 4 million Meta-users. From a spatial point of view, the average representativeness, which is around 7% of those over 18, turns out to be lower in the rural districts, around 4-5%, rising to 10 to 12% for larger cities. Based on our previous explorations of these data, particularly in India and France (Telle et al. 2020, Denis et al. 2020), we must admit gender, age, and social group biases. We can assume that urban populations, young people, and people belonging to the middle and upper classes are overrepresented. Therefore, the sequence of movements during the first two semesters of 2020 was not perfectly representative.
4. Results: A Modest Slowdown After the Lockdown
4.1. A Combination of Ramadan and Curfew That Slow Down Mobility
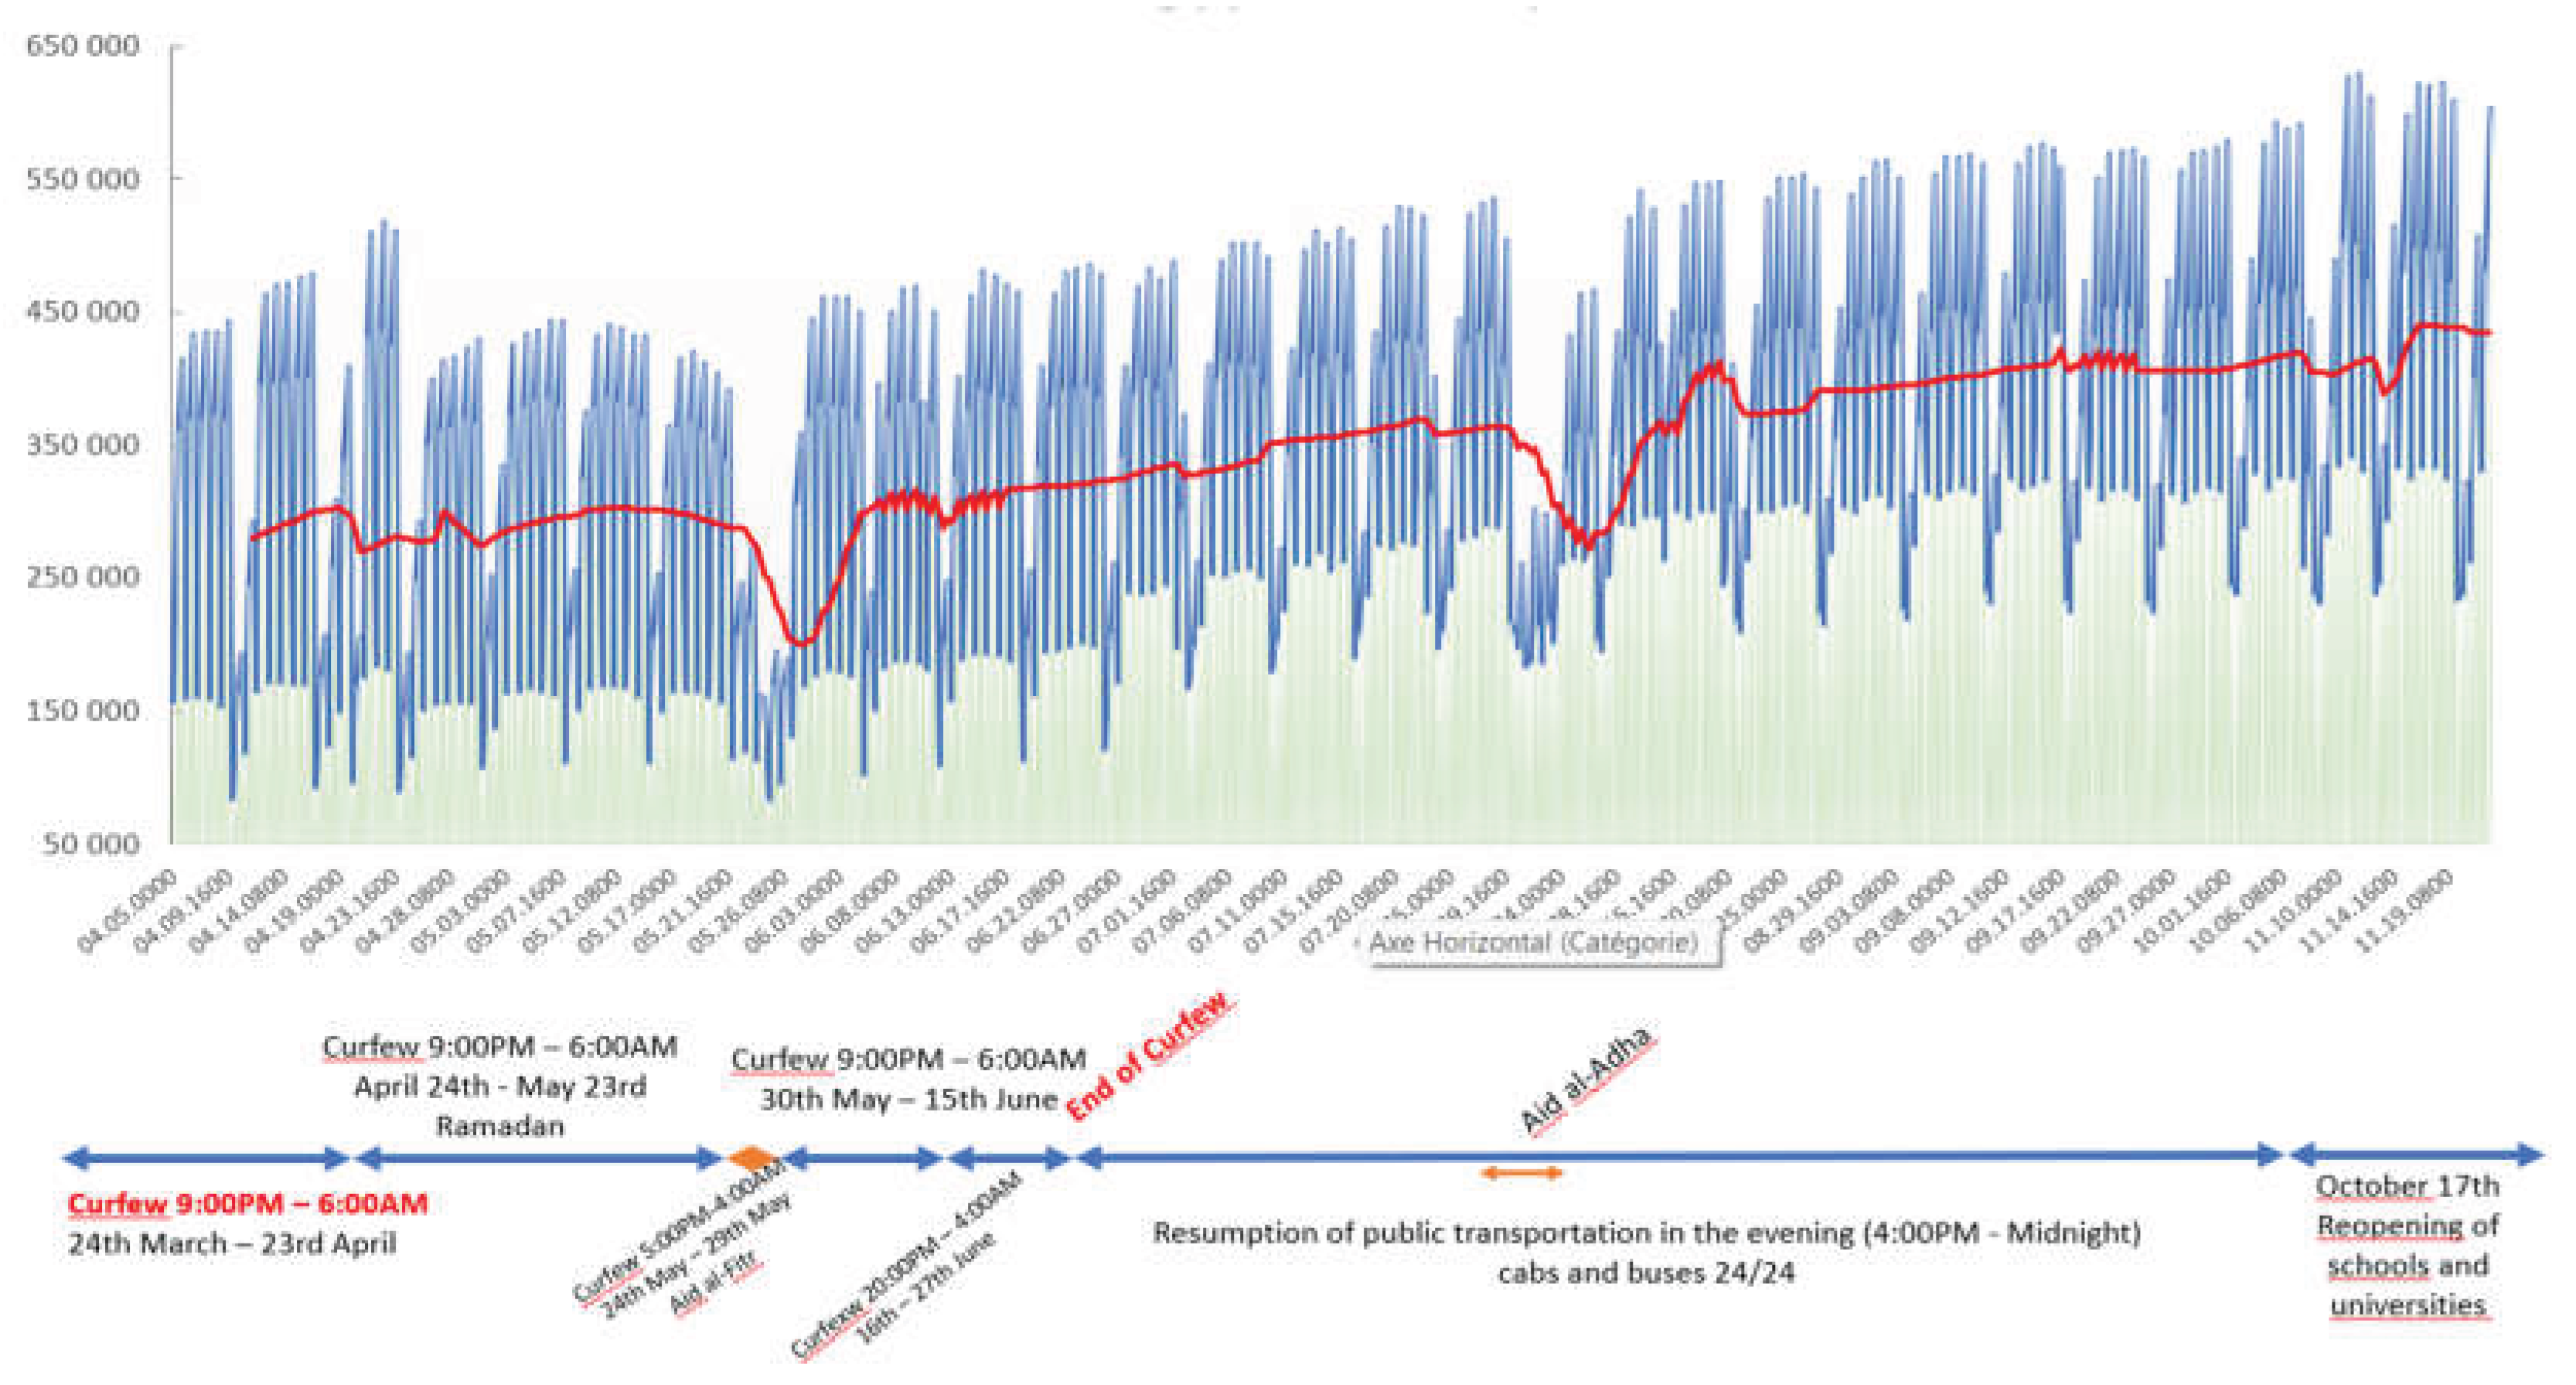
The daily mobility of our cohort was noticeably reduced at the start of the study period, from the beginning of April to the end of Aid, after Ramadan, and at the end of May 2020. Gradually, people resumed their usual travel pace. In October, with the reopening of schools and universities, Egyptian cities regained their daily and weekly “regular” patterns.
At the start of the period, the curfew severely limited nighttime travel, but daytime mobility was also very clearly affected by the reduction in public transport and the closure of schools and universities and of many workplaces, companies, and public services.

Table 1.
Mobility shrinkage compared to baseline during lockdown.
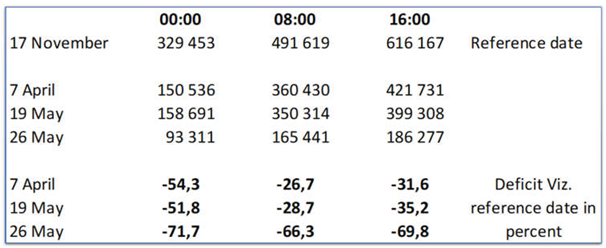 |
Compared with the reference period of November 2020 (our Baseline since we could not access this dataset before the lockdown was ordained), at the beginning of April, before the Ramadan, weekday trips between units fell drastically, with a reduction of more than 54% for the morning time slot (02: 00-10:00), 27% during the day (10:00-18:00) and 32% in the evening (18:00-02:00). During Ramadan (19th May), the mobility between units remained reduced by half in the morning, and by 29 and 35% for the two following sequences (day and evening). During Aid al-Fitr, the country is at a standstill: travel dropped by more than 70% in the morning and evening, and by 66% during the day, as compared to a standard day in November 2020. On the other hand, a few days before Ramadan started, between April 21st and 23rd, with the pre-Ramadan shopping frenzy, the peak in travel is barely reduced by the restrictions. Without the reference of a previous Ramadan period, it is difficult to assess the influence of Covid restriction on mobilities. It appears clearly that when people wanted to move, for instance for the preparation of the Ramadan’s festival, they did not restrict their displacement. All in all, the Egyptian population was not radically halted during the covid restriction. It was mostly blocked in its mobility at night and on weekends for a relatively short period. The necessity to move to access work and the limited control put in place by the authorities led to a quite ordinary Spring coinciding this year with Ramadan.
Graph 1.
Individual Mobilities > 8 km in Egypt from April 1st to November 22nd 2020.
At the beginning of the enforcement of the curfew, during daytime, a clear deficit of active population appears in the core of the larger cities (map 1) and their industrial peripheries. The new towns’ activity parks near Cairo, notably 10th of Ramadan and 6th October cities, are particularly affected. This shows that these new cities are more places of employment than residence.
In contrast, an excess of population is seen in the extended peripheries and countryside, as youth and workers stay confined at home. By freezing the functional area of major cities, in particular Cairo and Alexandria, the pandemic, at the beginning of the crisis, provides a snapshot of the extended metropolitan catchment basin in Egypt.
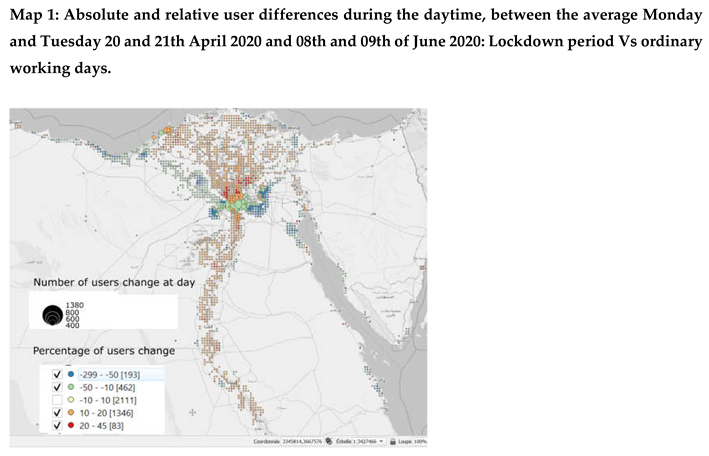
After Aid al-Fitr, which marks the end of the Ramadan, the mobility flows gradually returned to their normality. In the Graph (1), in the beginning of June during weekdays, people are going back to work and youth to schools and universities. Shops are fully reopened. We then have a Map (2) that contrasts the residential areas that empty during the day (mostly represented by blue dots) and employment areas (red dots) that fill up. Population decreases and increases of over 50% were not uncommon. This configuration also gives an idea of the high intensity of population flows from their home to employment locations every day. This intense daily commuting pattern concerns a huge space around Cairo toward its core but also the new cities industrial districts (East and West desert’s extensions of Cairo).
This is also a period when, again, the seaside resort’s towns are gradually filling up. Thus, at the end of July, as holiday movements are intensifying by the Aid al-Adha (or Aid al-Kabir), we observe a much higher density of users than the baseline in the seaside resorts, of the delta, of Sahîl al-Shamali on the Mediterranean shore and of the Gulf of Suez, from Ain al-Soukhna to Ras Sudr (located on the West coast of Alexandria). This phenomenon is visible because our cohort of Facebook users likely includes a wealthier urban population who head to the coast during summer vacations.
4.2. Network Analysis: Structural Shifts and Central Nodes in Egypt’s Mobility System
The analysis of Egypt’s national mobility network reveals that the COVID-19 pandemic and related containment measures induced a modest structural shift in population flows—without disrupting the network's overall configuration. As shown in Table 22, the number of active nodes and edges declined slightly during the confinement period (from 224 to 219 nodes, and from 2,077 to 2,051 edges). Interestingly, the network’s density increased marginally (from 0.0416 to 0.0430), indicating that, relative to its size, the system retained a strong degree of interconnection.
Structural cohesion remained largely stable. The average path length across the network shortened from 75.85 to 70.41, while the network diameter decreased from 660.5 to 452.5. These metrics suggest a mildly contracted system but one that remained navigable and functionally connected, with continued potential for long-range movements.
A notable change emerged in the network’s fragmentation and modular structure. The number of connected components fell from nine to five, suggesting a slight consolidation. Meanwhile, community detection using the Louvain algorithm indicated that the number of detected communities remained stable at twelve in both periods. However, modularity increased from 0.478 to 0.488, implying that while the number of clusters remained constant, their internal cohesion improved. This suggests a trend toward sharper spatial segmentation, where mobility flows became more self-contained within functionally bounded subregions during the confinement period.
Despite reductions in overall flow volumes—total mobility declined from 319,703 to 240,199 and average flow per edge dropped from 153.9 to 117.1—the network retained a configuration best described as sparse and random-like. This typology, derived from key indicators (low density, high diameter, moderate modularity), reflects a system with a broad spatial reach but relatively loose and uneven interconnections. Most zones remain only weakly connected to one another and rely heavily on intermediary hubs—making the system vulnerable to targeted disruptions but relatively resilient to broad-based restrictions like those imposed during the COVID-19 lockdown.
The asymmetry of mobility flows further illustrates this structural imbalance. Peripheral districts such as Markaz El Khankah and Qesm 1st Shubra El Khema (Qalyubiya), as well as Markaz El Giza, emerged as major emitters of daily mobility. These areas, typically dense residential zones with limited local employment, recorded strong positive asymmetry scores (e.g., +6,610 users for Markaz El Khankah at night versus day), reflecting their function as net labor exporters.
Conversely, core urban districts such as Qism El Sayda Zeinab, Al Nozha, and 2nd Nasr City served as commuter sinks, attracting large numbers of incoming workers. The district of El Sayda Zeinab showed the most pronounced asymmetry score (–20,854 users at night compared to day), highlighting its role as a central employment hub within the national system.
This persistent polarization—between labor-exporting peripheries and job-concentrated urban cores—mirrors Egypt’s entrenched socio-spatial inequalities. It underlines the urgent need for policies promoting decentralized employment opportunities and more equitable transport infrastructure, in order to mitigate long-distance commuting burdens and enhance urban resilience.
Finally, the Greater Cairo Region continues to dominate national mobility, concentrating nearly half of the country’s daily flows. This centrality justifies a closer analysis of its internal mobility dynamics, especially under pandemic constraints. Understanding how Cairo's dense network adapted to the pressures of COVID-19 offers insights into both structural inertia and adaptive capacity within the largest urban system in Egypt.
Table 2.
Metrics of Egypt national mobility system.
| Period | Nodes | Edges | Density | Diameter | Avg_Path_Length | Num_Components |
|---|---|---|---|---|---|---|
| Pre-confinement | 224 | 2077 | 0.0415 | 660.5 | 75.85175231 | 9 |
| Confinement | 219 | 2051 | 0.0429 | 452.5 | 70.41017408 | 5 |
| Period | Num_Communities | Modularity | Total_Mobility | Avg_Mobility_per_Edge | Type | |
| Pre-confinement | 53 | 0.4379 | 319703 | 153 | Sparse / Random-like | |
| Confinement | 45 | 0.454 | 240199 | 117 | Sparse / Random-like | |
4.3. Movements in the Capital Region
In ordinary time, the Greater Cairo Region registers an average of 1,035,000 daily users, of which more than 200,000 travel between two tiles (or units) within the region.
Table 3.
The 10 highest flows during an ordinary workday (Tuesday 10th November - baseline) within Greater Cairo region.
Table 3.
The 10 highest flows during an ordinary workday (Tuesday 10th November - baseline) within Greater Cairo region.
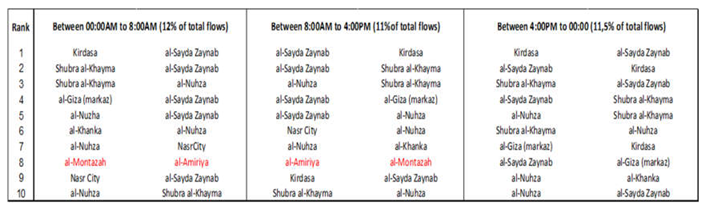 |
Tuesday 10th November 2020 can thus be observed as a normal working day of a typical week. During an ordinary day of the week, the ten most important flows gather between 11 and 12% of the total flows in Egypt (8945 links). They are all concentrated in the Greater Cairo region, except one located in Alexandria (in red), the second largest city of Egypt. It shows how, during the day, mainly for work, people move from peripheral residential neighborhoods of the west of Cairo Region (Kirdassa and Giza) as well from the North (Shubra al-Kayma) toward the center al-Sayda Zaynab and al-Nuzha. People of South Cairo, Khanka, are also commuting toward the city center, al-Sayda Zeinab in particular and there are also people moving toward Shubra al-Khayma, where there is a well-established hub of factories.
These data also reveal the strong integration of the new towns in the flow matrix polarized around Cairo, from the new town of Six October to the 10th of Ramadan city via New Cairo. As Map 2 shows (in red), these newly planned cities became major employment hubs that drive central movements from the core and popular residential part of the metropolis toward the desertic peripheral area in the West and East of Cairo. Adjacent regions appear to be closely linked to Cairo. In addition to the muhafaza of Giza, a large number of users of the Qalyubiya and Minufiya regions, linked to the productive machine of Greater Cairo and vice versa.
Within Cairo Muhafazat (Region) itself, we can map the evening and night flows: when the curfew is effective but Ramadan has not yet started (Map 3) Wednesday 1st of April 2020 and (Map 4) during Aid al-Fitr’s festival which marks the end of Ramadan, the Tuesday 26th May 2020.
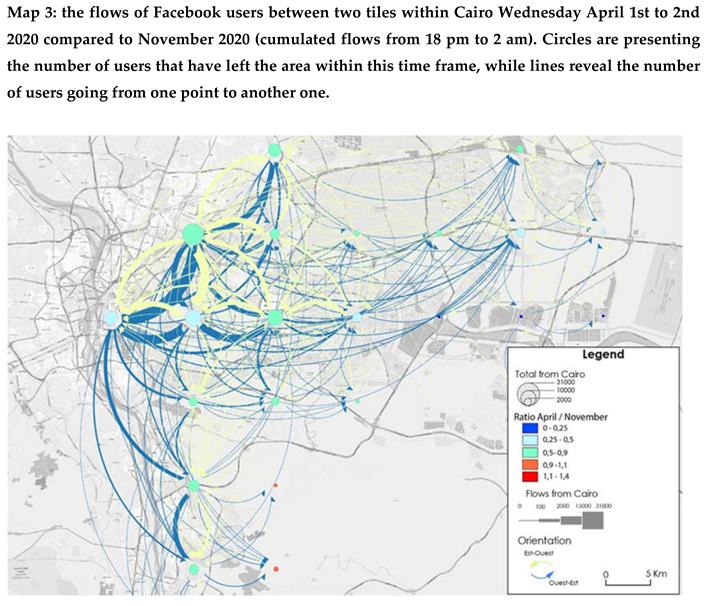
Beginning in April 2020, circulation within Cairo was significantly reduced in the evening and night. Between 5 and 25% less than usual (i.e. in November 2020 during a weekday), but the movement between the main employment and commercial center and residential areas remained quite significant. Popular and industrial areas in North Cairo, such as Shubra al-Khayma, continued to be active. This was the case for most pericentral neighborhoods. They were less affected than tertiary centers that concentrate on public employment and education institutions, including Medinat Nasr or the airport area.
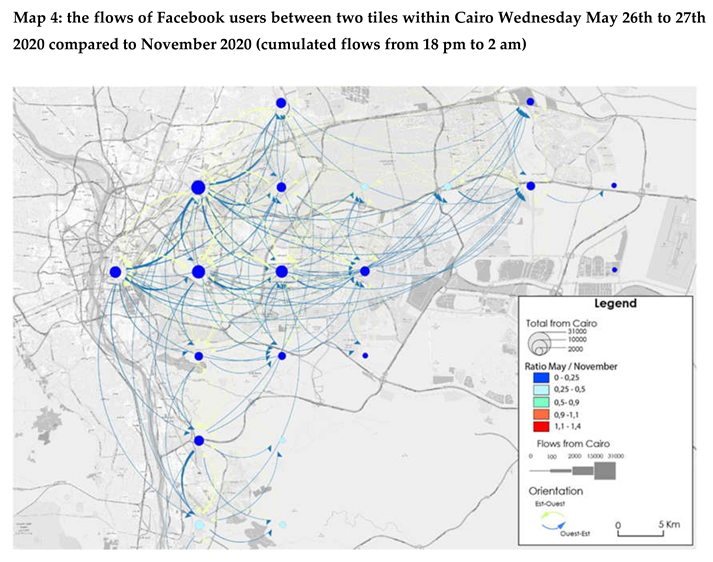
During the Aid–Fitr Festival, Cairo was at a standstill. People were no longer moving. All areas had a significant decrease in incoming individuals compared to a standard evening and night, meaning that by the end of Ramadan, either many Cairo residents had moved outside of the region to visit their families or/and that the remaining inhabitants were staying at home. This sacred festival significantly affected the mobility trend as compared with the Covid itself. It reveals the importance of the temporality of the city, profoundly marked by religious festivals (Madoeuf 1997) and other commemorative public holidays.
4.4. Structure of Cairo
The network analysis of the Cairo Muhafaza reveals a medium-density but well-structured urban mobility system, both before and during the confinement period. Prior to confinement, the network consisted of 91 nodes and 614 directed connections, yielding a moderate density (0.075), a large diameter (130.5), and a notably long average path length (42.7). These indicators highlight the dispersed and extensive nature of mobility across the governorate, with 4 communities detected using the Louvain algorithm, and an overall modularity of 0.06—pointing to limited but existing segmentation in mobility flows. The total mobility before confinement reached over 159,000 with an average of 259 people per link, indicating strong interdependencies between zones despite the network’s spatial scale.
During the confinement period, the structure remains robust, with 89 nodes and 609 edges—demonstrating limited disruption in the network’s core topology. However, mobility dropped by nearly 30% to around 113,000, and average flows per connection declined to 186. While the network density slightly increased, both the diameter and average path length decreased, suggesting a compression of mobility patterns—likely a result of movement restrictions and the reconfiguration of daily routines.
This configuration corresponds to an "Intermediate" network type, reflecting both the relative fragmentation of urban functions in Cairo and the enduring resilience of its mobility system. Even under confinement, the absence of isolated nodes and the persistence of a large-scale connected network underscores the essential nature of mobility in the city’s fabric, as well as its resistance to full disruption.
Table 4.
Metric of Cairo mobility system.
| Period | Nodes | Edges | Density | Diameter | Avg_Path_Length |
| Pre-confinement | 91 | 614 | 0.0749 | 130.5 | 42.653 |
| Confinement | 89 | 609 | 0.0777 | 145.5 | 33.400 |
| Period | Num_Communities | Modularity | Total_Mobility | Avg_Mobility_per_Edge | Type |
| Pre-confinement | 4 | 0.0618 | 159113 | 259.14 | Intermediate |
| Confinement | 3 | 0.0580 | 113356 | 186.13 | Intermediate |
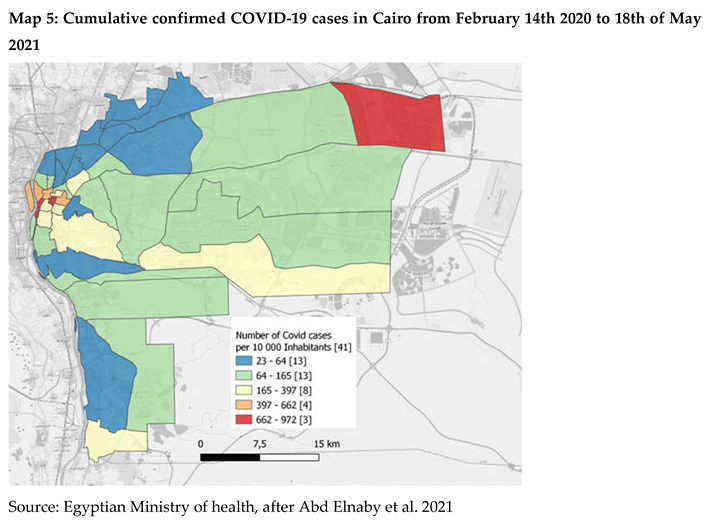
4.5. Covid Case and Mobility: Urban Centrality as a Significant Factor of Covid Diffusion in Cairo Region
We analyzed Covid cases registered in 41 district level units or qism of the Cairo administrative region/muhafaza between the 14th of February 2020 and the 18th of May 2021. Map 5 reveals a great inequality in the geographical distribution of covid cases, with an incidence rate ranging from 23 to 972 cases per 10,000 inhabitants. The lowest incidences were in the North-West and South of Cairo. On the contrary, the most affected qism are to be found in the busy Center-West and in the industrial North-East of the city. Those qism are also locations where we could detect an increasing population size during the day, suggesting that centrality could play a role in the exposure of a unit to covid risk.
Hence, we decided to confront the number of Covid 19 cases occurring in a district using the centrality profile. An excess of users during the day reveals that the district polarizes more individuals, most probably because the unit gathers many types of work-related, educational, religious, or shopping activities. Conversely, when a unit loses users during the day, this suggests that these sub-districts are residential with a limited concentration of jobs and education facilities. To understand the population dynamics during the day, we analyzed the Facebook dataset for Monday and Tuesday, June 8 and 9, 2020, at day and night.
We, then, segregated these units in three classes:
- Cat 1 (units that gain population during the day): units with at least 10% users excess during daytime;
- Cat 2 (units with an equal number of users at day and night): units with an equal number of users at day and night (from -10 to + 10% users at day);
- Cat 3 (units that lose population during the day): units with at least 10% decrease during daytime.
- Map 6 presents the result of this classification. As we could detect in map 2, the central and the southeast area of Cairo gathers more individuals during the daytime.
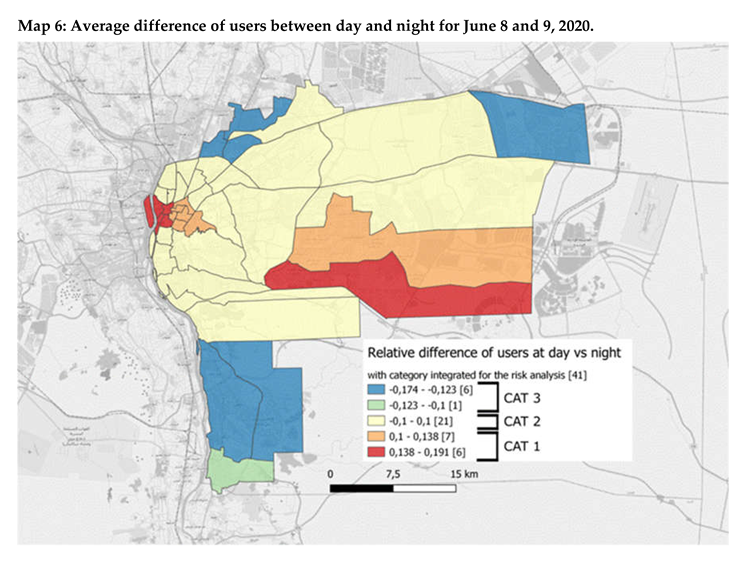
Table 5.
Mean population, users’ difference, covid cases and covid incidence, per category. .
| Category | Mean Population | Mean user difference at day | Mean Covid cases | Mean incidence (per 10,000) |
|---|---|---|---|---|
| Excess of users during daytime | 81 870 | 1 682 | 1 736 | 43.34 |
| Equilibrium | 270 839 | 132 | 2 217 | 12.40 |
| Decreased during daytime | 366 893 | -1 787 | 1 812 | 13.29 |
5. Discussion
This study aims to understand the spatial and network characteristics of the daily circulation of Egyptians during and after the lockdown. It also underlines the potential of social media such as Meta mobility data to fill gaps in urban research, offering comparative insights into how different countries experienced mobility shifts during the pandemic. In countries where traditional data on daily movements is lacking, such datasets provide critical information on population presence both at night—when people sleep—and during the day—when they work, shop, or study. This spatiotemporal variation helps capture functional urban centrality and informs both planning and public health policies.
In Egypt, reduction of mobilities is estimated to be around 55% of the overall mobilities. However; the analysis of the national mobility network reveals how the COVID-19 pandemic and related containment measures only slightly altered the structural configuration of daily movements. Network density remained stable, and key metrics such as average path length and diameter reflect the persistence of a robust structure even under constrained conditions. The overall structure retained an intermediate form—neither strongly centralized nor fully decentralized. A polarized flow structure emerged, where residential suburbs and peri-urban areas acted as sources of movement while employment-rich city centers functioned as dominant sinks.
Zooming into the Greater Cairo Region, the network analysis highlights a highly connected and dense mobility system. Even during lockdown, the region maintained its regular mobility patterns, with multiple redundant paths and flow regularity across areas. This suggests a resilience that limits the effectiveness of containment unless mobility control measures are extremely strict. Cairo’s configuration challenges its common representation as a centripetal city; the data show complex crossflows, especially between new towns with residential ambitions and traditional employment hubs. The mismatch between residential distribution and employment opportunities underscores the importance of integrating mobility into urban planning.
This configuration questions the usual vision of Cairo, being often described as centripetal, with the central and pericentral districts concentrating activities articulated around its residential suburbs, expanding informally on the rich irrigated land at the apex of the Nile Delta. With this mobility data, the picture appears to be much more complex. It also reveals how the residential ambitions of the new cities were not matched with a correspondent availability of activities, resulting in important flows of daily commuting. The mismatch between the residential population and workers within these new towns is revealed by the crossing flows toward the city core and from the residential area of Cairo toward new town industrial parks, but also from riche gated communities located in those new towns toward the core city center and new IT Parks
In Cairo, the mean COVID-19 incidence rate was 3.5 times higher in districts gaining population during the day. This supports previous research showing that mobility drives disease diffusion at the city level (Telle et al. 2021; Lefebvre et al. 2022). While the rapid response of Egyptian authorities may have helped reduce early spread, a recent World Bank report highlighted the possibility of underreporting, noting Egypt's comparatively high COVID-related death rate. These findings suggest the need for further scrutiny of both policy effectiveness and data completeness.
6. Conclusion
In sum, this study provides new insight into the spatial and structural dynamics of urban mobility in Egypt during the COVID-19 pandemic, with a particular focus on Cairo. Using anonymized social media mobility data, we were able to document how the intensity and geography of population movement remained remarkably consistent, even during periods of strict containment. While reductions in overall flow volumes were observed, especially during religious holidays and curfews, the underlying configuration of the mobility network changed only marginally. This continuity was reflected at both national and metropolitan scales, revealing a high concentration of mobility in a small number of hyper-connected zones.
From a public health and urban governance perspective, these findings are deeply significant. They show how urban systems can remain operational even under crisis, but also how such “resilience” may come at the cost of reinforcing existing inequalities. Commuting flows were not randomly distributed; they consistently followed the fault lines of urban structure, exposing peripheral populations to greater distances and potential viral exposure. Central business districts continued to attract large volumes of daily flows originating from the margins, becoming epidemiological hotspots in the process.
These observations raise a more fundamental question: should this stability in mobility patterns be interpreted as a sign of adaptive resilience, or as a manifestation of structural rigidity? The persistence of flows may reflect not a flexible urban system but one bound by path dependency—where the physical and socio-economic infrastructure offers few alternatives to established commuting routines. People continued to move because they had no choice: jobs remained in the same places, transit systems were not reoriented, and urban planning had long disconnected residential growth from employment hubs. What appears as systemic robustness may in fact be an indicator of limited spatial plasticity.
This distinction is not academic. Understanding whether urban mobility systems are resilient or merely locked into inflexible spatial arrangements has real consequences for how we plan, govern, and even protect cities. A path-dependent system is more vulnerable to disruption—not less—because it lacks the ability to redirect or reconfigure in response to emerging risks. If future epidemics, climate shocks, or socio-economic crises strike with similar intensity, the very features that sustained mobility during this pandemic may become liabilities.
Ultimately, this study highlights the dual value of high-resolution mobility data: not only does it allow us to observe human behavior in real time, but it also forces us to reflect on the deep structures that govern urban life. Cairo, like many megacities in the Global South, faces the paradox of being both dynamic and structurally constrained. To build truly resilient cities, we must move beyond monitoring flows and begin reshaping the systems that generate and constrain them.
References
- Abd Elnaby, S. E., & Al Qersh, A. B. A. (2021). Geospatial Analysis of COVID-19 Spread in Cairo Governorate Using Geographic Information System. Bulletin de la Société de Géographie d'Egypte, 94(1), 24-43.
- Assaad, R., & Arntz, M. (2005). Constrained geographical mobility and gendered labor market outcomes under structural adjustment: Evidence from Egypt. World Development, 33(3), 431-454. [CrossRef]
- Assaad, R. (2020, August). Prospects for Egypt's Population and Labor Force: 2000 to 2050. In Economic Research Forum Working Papers (No. 1398).
- Bahoken F., Le Campion G., Maisonobe M., Jégou L., Come E.. Typologie d'un geoweb des flux et réseaux. Geomatica, Association canadienne des sciences géomatiques, 2020, 48p.
- Barbosa, H., Barthelemy, M., Ghoshal, G., James, C. R., Lenormand, M., Louail, T., ... & Tomasini, M. (2018). Human mobility: Models and applications. Physics Reports, 734, 1-74.
- Batran, M. R., Kanasugi, H., Sekimoto, Y., & Shibasaki, R. (2017). Spatio- Temporal Analysis of Human Mobility in Cairo Using Person Trip Survey Data. Conference paper: 38th Asian Conference on Remote Sensing, New Delhi, India.
- Billion, D., & Parant, A. (2020). L'Égypte, un géant au bord de la rupture. Futuribles, (5), 69-90.
- Denis, E., Telle, O., Benkimoun S., Chalonge, L., & Paul, R. (2020). Évolution des mobilités et diffusion du Covid-19 en France: ce que les données Facebook dévoilent. The Conversation, May 22, 2020.
- Denis E. (2007) Villes et urbanisations des provinces égyptiennes. Vers l'écouménopolis ?, Paris : Khartahla – CEDEJ.
- Lefebvre B, Karki R, Misslin R, Nakhapakorn K, Daudé E, Paul RE. Importance of Public Transport Networks for Reconciling the Spatial Distribution of Dengue and the Association of Socio-Economic Factors with Dengue Risk in Bangkok, Thailand. Int J Environ Res Public Health. 2022 Aug 16;19(16):10123. [CrossRef]
- Li, W., Ali, E., El-Magd, A., Mourad, M. M., & El-Askary, H. (2019). Studying the impact on urban health over the greater delta region in Egypt due to aerosol variability using optical characteristics from satellite observations and ground-based AERONET measurements. Remote Sensing, 11(17), 1998. [CrossRef]
- Madoeuf, A. (1997). Quand le temps révèle l'espace: les fêtes de Husayn et de Zaynab au Caire. Géographie et cultures, 21, 71-92.
- Masoumi, H., Gouda, A. A., Layritz, L., Stendera, P., Matta, C., Tabbakh, H., & Fruth, E. (2018). Urban Travel Behavior in Large Cities of MENA Region: Survey Results of Cairo, Istanbul, and Tehran.
- Mostafa, M. K., Gamal, G., & Wafiq, A. (2020). The impact of COVID 19 on air pollution levels and other environmental indicators-A case study of Egypt. Journal of environmental management, 277, 111496. [CrossRef]
- OECD/SWAC (2020), Africa's Urbanisation Dynamics 2020: Africapolis, Mapping a New Urban Geography, West African Studies, OECD Publishing, Paris. [CrossRef]
- Paul R., Telle O., Benkimoun S. Integrating Social Sciences to Mitigate Against Covid. In Makoto Yano; Fumihiko Matsuda; Anavaj Sakuntabhai; Shigeru Hirota. Socio-Life Science and the COVID-19 Outbreak. Public Health and Public Policy, Springer Singapour, 2022, pp.47-71.
- Radwan, T. M., Blackburn, G. A., Whyatt, J. D., & Atkinson, P. M. (2019). Dramatic loss of agricultural land due to urban expansion threatens food security in the Nile Delta, Egypt. Remote Sensing, 11(3), 332. [CrossRef]
- Shi, Q., & Liu, T. (2020). "Should internal migrants be held accountable for spreading COVID-19?. Environment and Planning A: Economy and Space, 52(4), 695-697. [CrossRef]
- Telle, O., Denis, E., Benkimoun, S., Mukhopadhyay, P., & Nath, S. (2020). Mapping the lockdown effects in India: how geographers can contribute to tackle Covid-19 diffusion. April 2020, The Conversation.
- Telle O., Nicolay B., Kumar V., Benkimoun S., Nagpal S. and al. Social and environmental risk factors for dengue in Delhi city: A retrospective study, 2021, PLOS PNTD. [CrossRef]
- Telle O., Dengue geography in Vientiane Capital, 2012–2019: Combining multiple datasets to , understand virus spread in an endemic city, December 2020, International journal of infectious diseases: IJID: official publication of the International Society for Infectious Diseases. [CrossRef]
- World Bank, Overconfident: How Economic and Health Fault Lines Left the Middle East and North Africa Ill-Prepared to Face COVID-19, Mena Economic Update October 2021.
- Khalifa, N. E., Mawgoud, A. A., Abu-Talleb, A., Taha, M. H. N., & Zhang, Y. D. (2023). A covid-19 infection prediction model in egypt based on deep learning using population mobility reports. International Journal of Computational Intelligence Systems, 16(1), 96.
Disclaimer/Publisher’s Note: The statements, opinions and data contained in all publications are solely those of the individual author(s) and contributor(s) and not of MDPI and/or the editor(s). MDPI and/or the editor(s) disclaim responsibility for any injury to people or property resulting from any ideas, methods, instructions or products referred to in the content. |
© 2025 by the authors. Licensee MDPI, Basel, Switzerland. This article is an open access article distributed under the terms and conditions of the Creative Commons Attribution (CC BY) license (http://creativecommons.org/licenses/by/4.0/).
Copyright: This open access article is published under a Creative Commons CC BY 4.0 license, which permit the free download, distribution, and reuse, provided that the author and preprint are cited in any reuse.


