
Submitted:
12 May 2025
Posted:
13 May 2025
You are already at the latest version
Abstract
In silico trials can assess the effectiveness of new therapeutic methods before clinical evaluations. In this study, we propose a computational pipeline to develop personalized digital twins of cardiac ventricles, enabling a robust characterization of ventricular passive behavior with a focus on the right ventricle (RV). Our framework was employed to simulate the hearts of three right ventricular (RV) failure patients. The estimation of biomechanical properties, coupled with finding the unloaded shapes of the ventricles, was performed by minimizing the deviation between the simulated and target RV end-diastolic pressure-volume relationships (EDPVRs). Finite element analysis (FEA) was used to model the ventricles, enabling the virtual addition of an epicardial restraint to the RV. We examined two possible definitions of the target restrained RV EDPVRs: exponential and proportional volume reductions. Bayesian optimization was utilized for both material evaluation and constraint design on a wide range of available biomaterials across varying levels of desired RV volume reduction ratios. Sensitivity analysis indicated that increasing constraint thickness or stiffness shifts the RV EDPVR curve leftward. However, this shifting stops at a specific curve, beyond which further increase in restraint thickness or stiffness cannot reduce RV volumes. A perfect RV EDPVR fit was achieved with the optimal restraint, particularly for the exponentially shifted targets. The optimal thickness increases as the desired reduction ratio rises, which also corresponds to decreased fiber stress and strain in the right ventricular free wall (RVFW). Patient-specific design of epicardial restraints can offer the most effective treatment.
Keywords:
Biventricular computational model
; Finite element analysis (FEA)
; Bayesian optimization (BO)
; Epicardial restraint
; Right ventricle (RV)
; Right ventricular (RV) end-diastolic pressure-volume relationship (EDPVR)
; Unloaded geometry
; Passive material estimations
1. Introduction
End-stage heart failure (HF) can be effectively treated with cardiac transplantation, but this approach has limitations and is not available for every patient in need. Alternatively, ventricular restraint therapy provides a non-transplant option that uses prosthetic materials to mechanically stabilize the heart, curb further deterioration, and enhance patient outcomes [1]. The benefits of passive epicardial constraints on the failing left ventricle (LV) have also been exhibited using finite element analysis (FEA) [2]. However, each ventricle responds differently to epicardial constraints and the LV can withstand higher levels of such therapy [3]. It was already demonstrated that the application of adjustable ventricular restraints exclusively to the dilated and failing right ventricle (RV) in a sheep model of right ventricular (RV) failure resulted in an acute improvement of ventricular function with the potential to induce RV reverse remodeling, similar to what was observed in the LV during left ventricular (LV) failure [4].
RV computational modeling has the potential to demonstrate the complex mechanisms of RV adaptation in response to pressure overload triggered by pulmonary arterial hypertension (PAH) [5]. A structure-based modeling framework was used to analyze fiber, tissue, and organ-level adaptations of the RV in PAH, revealing that pressure overload-induced changes in geometry and wall stiffness significantly affect contractility [6,7]. A data assimilation method was used to quantify changes in regional myocardial properties and stresses in PAH, highlighting the relationship between right ventricular free wall (RVFW) contractility and the degree of remodeling [8]. Biventricular finite element models of rats with PAH showed that RV wall thickening, increased heart muscle contractility, and greater stiffness work together to mitigate the increased stress and strain of the wall caused by the pressure excess [9]. The application of more detailed FEA-based computational models to assess HF in individuals with pulmonary hypertension (PH) revealed significant improvements in RV function and reduced risk of failure after mitral valve surgery [10].
Computer-aided simulations revealed that some HF therapies for the LV can have adverse effects on the RV. A computational framework, incorporating both lumped-parameter and FEA, was used to evaluate the performance of the RV after the addition of the continuous-flow left ventricular assist device (CF-LVAD) in patients with end-stage heart failure [11]. Another biventricular FEA model of an end-stage failing heart assisted with a left ventricular assist device (LVAD) revealed that operating the LVAD at high speeds can lead to RV dysfunction due to LV unloading [12]. At speeds higher than 4k rpm, RV contractility decreases, especially when the septal wall is thin [13]. The performance of cardiac devices was analyzed using FEA to evaluate the balance between the hemodynamic and biomechanical impact of RV support in the context of LVAD-associated failure [14].
FEA has already been used to simulate repaired cardiac ventricles. Using an FEA model of the LV, it was demonstrated that increasing the size and stiffness of pericardial patches used in surgical repair of ventricular septal rupture following myocardial infarction (MI) significantly reduces stress in the suture line, thereby minimizing the risk of residual leakage [15]. Computational models of the infarcted LV in canines highlight the potential of mechanical modifications to improve heart function by reducing fiber stress and reshaping ventricular geometry, emphasizing the importance of tailoring therapeutic strategies [16,17]. FEA was also used to evaluate the restoration of LV function after implanting a contractile fibrous cardiac patch for chronic MI, focusing on different fiber orientations [18]. Numerical simulations could help investigate the effects of epicardial force patches on ventricular mechanics [19]. The design and evaluation of the RV external device (RVEX), a biomimetic elastic sleeve, has been documented to reinforce and control RV function in RV failure [20]. This was achieved by demonstrating hemodynamic improvements in both the left and right ventricles. In addition to epicardial restraints and patches [21], some computational studies focused on modeling injectable hydrogels [22] for infarcted ventricles [23,24]. However, since the RV has a relatively thin wall, injection is challenging, and patching is preferable for this ventricle.
Despite the development of various types of cardiac restraints and reinforcements to support failing hearts mechanically [25], there is still a need for assessing the clinical effectiveness of ventricular restraint devices and other mechanical supports in preventing adverse LV remodeling post-MI [26,27]. Further advancement of these therapies requires in-depth research into the changes in the heart following MI through collaboration across multiple disciplines [28]. Although previous computational studies have provided invaluable insights into the effect of patch fiber orientations on the acutely infarcted LV [16,18] or the impact of myofiber structure on the passive filling of the unloaded LV [29,30,31], such evaluations are unexplored for the RV. Moreover, different epicardial restraints have different mechanical properties and the optimal conditions for each should be determined.
Here, we propose a framework for designing optimal passive epicardial restraints for RV failure. Our method will be used to find the most effective restraints applied to unloaded biventricular FEA models using a variety of available materials. To examine the effectiveness of the therapy, the fiber stress and strain of the constrained ventricles will be analyzed. To the best of our knowledge, this is the first study to utilize computational modeling to identify the biomechanical properties and the optimal epicardial restraint for the RV, taking into account the unloaded state of the cardiac ventricles.
2. Materials and Methods
2.1. FEA Models from Imaging
We selected three patients diagnosed with RV failure for our study. Biventricular heart geometries were created based on the segmentation of cardiac magnetic resonance (CMR) images using the freely available software Segment Research (Medviso AB, Lund, Sweden) [32]. After smoothing and simplifying the 3D extracted ventricles, they were meshed with linear tetrahedral elements employing hybrid formulation (C3D4H). The total number of elements and nodes of all FEA models are shown in Table 1. Subsequently, material orientations were defined for each element. It was assumed that fiber angles changed smoothly from -60 to 60 degrees when moving from the endocardium to the epicardium, while sheets were perpendicular to each of these surfaces. A fixed reference point (RP) was created at the basal center of each ventricle. The RP of the LV was transitionally coupled with the basal nodes [33]. Ventricular blood pressure was exerted through the fluid cavity interaction [34] to the RPs. Valvular stiffness was added to the biventricular models using springs [35,36]. The LVEDV and RVEDV were calculated from the segmentation-based models at end-diastole (ED). Ventricular pressures were estimated noninvasively based on the reports provided by echocardiographic measures. For the LV, e/e’ helped us find the LVEDP [37,38,39], while the right ventricular end-diastolic pressure (RVEDP) was approximated through the right atrial pressure (RAP) according to the previous estimation guidelines [40]. RAP was determined from the pressure gradient across the tricuspid valve (ΔP) and the right ventricular systolic pressure (RVSP) [41,42,43,44,45]. End-diastolic (ED) pressures and volumes are shown in Table 1. To examine the effect of RVEDP on the optimization results, a second model of the third patient was developed with an RVEDP of 10 mmHg (referred to as patient 3-H), despite the initial estimate of 5 mmHg for this patient (patient 3). Due to the relatively low RVEDP of patient 3, we decided to examine the performance of his heart under both actual and elevated pressures.
2.2. Passive Mechanical Response
The myocardium was modeled as an anisotropic hyperelastic material using the invariant-based strain energy density function as defined in Equation (1) [46].
Where the , , , , , , , and are eight positive material constants. The parameters have stress dimensions, whereas the parameters are dimensionless. An orthonormal basis consisting of fibers () and sheets () directions was used in the formation of the first (), fourth (), and eighth () invariants of the right Cauchy-Green tensor. For representing , , , and , scale factors and were defined so that and . Basic material parameters and came from curve fitting to the experimental data from six shear modes of cubic specimens obtained from the myocardial wall, being [47,48]. The restraint was assumed to be isotropic and follow the neo-Hookean behavior, with the constant representing the material stiffness (Equation (2)).
can be determined from the Young’s modulus () and the Poisson ratio () using . The Cauchy stress tensor () was calculated for the myocardium as shown in Equation (3). Additionally, incompressibility was maintained by using as the Lagrange multiplier.
The deformation gradient and identity tensors are represented by and , respectively.
2.3. Coupled Shape-Material Estimations
Shape and material optimization were combined to determine biomechanical scale factors and the unloaded ventricles based on the RV end-diastolic pressure-volume relationships (EDPVR) and ED configuration. This method was similar to the technique we previously introduced for the LV EDPVR in ischemic cardiomyopathy [29]. Initially, the target RV EDPVR was established for each patient, assuming that the Klotz curve [51] could also serve as the target RV EDPVR [52,53]. Bayesian optimization was employed for the simulated RV EDPVRs to align them as closely as possible with the target curves. This alignment was achieved by using a pair of biomechanical scale factors (as inputs of the objective function) to adjust the base experimental material parameters. By minimizing the output of the target function (), which is an amplification of the Normalized Root Mean Squared Deviation of RV volumes (NRMSDV) by , both scale factors and unloaded shapes will be established. Amplifying the volume deviations helped us achieve accurate results from the optimizations.
In Equation (4), the total number of simulated () and predicted () RV volumes were used to calculate the output. The index represents RVEDV, where the simulated and predicted cavity volumes of the RV were calibrated during the estimation of the unloaded shapes. Therefore, RVEDV () was not included in Equation (4). The simulated RV EDPVR was generated when the unloaded FEA models of the ventricles were loaded according to the estimated ED pressures. The best pair of scale factors was selected that resulted in the lowest possible NRMSDV, indicating that the simulated and target RV EDPVRs were closely matched. This was achieved by minimizing the output of Equation (4).
The reference (unloaded) geometry was calculated using the augmented iterative method [54], where the difference between the loaded node configurations at the current iteration and the target node coordinates at ED () was defined as . The undeformed configuration at each iteration () was updated to according to Equation (5).
Where is the augmentation parameter used to facilitate the convergence rate. It was initially set to be one and then updated according to Equation (6).
2.4. Addition of the Epicardial Restraint
The effect of the epicardial restraint was incorporated into the unloaded FEA models by adding a layer of linear hybrid (C3D6H) elements. This was achieved by extending the epicardial element faces using the Bottom-Up mesh tool with the offset meshing method. The offset value was equal to the thickness of the epicardial constraint. As a result, all the added elements shared common nodes with the ventricular elements at the epicardial surface.
The restraint causes the RV EDPVR to shift to the left by reducing the RV volume. It also decreases the unconstrained (original) to through a reduction ratio () described in Equation (7).
It is noteworthy that “” is defined in a way that reduces the volume change of the RV EDPVR and not just . Therefore, when %, Equation (7) results in zero volume change in RV EDPVR ().
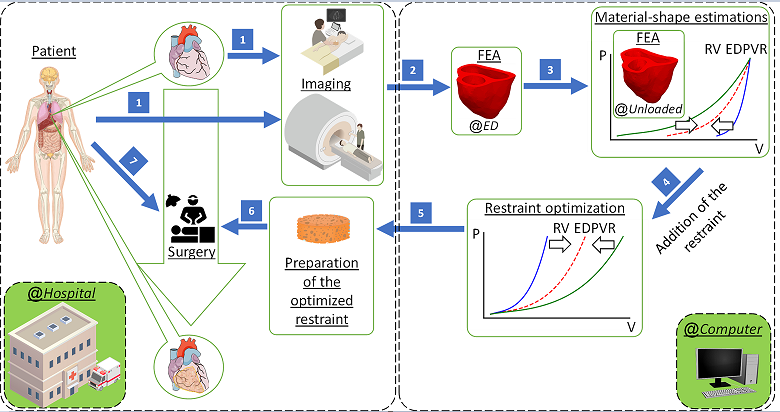
We defined the target restrained RV EDPVR assuming two different reduction methods, both of which maintain the nonlinearity of the shifted curve. Firstly, we considered an exponential volume reduction of the RV. The RV EDPVR curve of the restrained RV was determined using a scaling scheme that redistributes the volumes between the unloaded () and the previously moved () volumes as described in Equation (8).
changes from zero to , where is the total number of available PV data points that make up the RV EDPVR (). Figure 1a illustrates the effect of exponential reduction on the target RV EDPVR with varying values of . It is important to recognize that these reduced RV EDPVRs will serve as the target curves for optimizing the RV constraints.
Equation (9) describes the second reduction strategy for the target RV EDPVR, which involves proportionally reducing all volumes of the unconstrained RV EDPVR (). As shown in Figure 1b, this reduction results in a smoother and more systematic progression, with consistent spacing between the original and reduced curves.
Bayesian optimization was used not only to estimate material scale factors but also to determine the optimal thickness of the RV epicardial restraints. During the optimization of the restraints, the output of the target function was defined similarly to Equation (4) with being determined according to the target volumes of either Equation (8) (exponential reduction) or Equation (9) (smooth or proportional reduction).
20 initial points were generated through the Latin hypercube sampling (LHS) method. The acquisition function was probabilistically selected from the lower confidence bound (LCB), the expected improvement (EI), or the probability of improvement (PI) at each iteration. The optimization stopped successfully when the change in was either below 0.1 in 15 iterations or below 0.01 in 5 iterations, with a maximum allowable number of 200 function evaluations.
When the convergence criteria remain constant, increasing the amplification coefficient () provides more accurate results at the expense of more iterations during Bayesian optimization. To achieve a reliable fit and relatively fast convergence, was selected to be 10000. The choice of the amplification depends on the convergence criteria and it is possible to opt for a lower together with stricter convergence criteria.
The Scikit-Optimize Python package [55] was used to perform Bayesian optimizations in the present study. We determined the optimal restraint thickness for seven different reduction values ( 10%, 15%, 20%, 25%, 30%, 35%, and 40%) and for eight different restraint material stiffness values ( 0.005, 0.01, 0.02, 0.03, 0.05, 0.1, 0.3, and 0.5 MPa). The mentioned stiffness range came from the reported passive mechanical properties of the epicardial restraints in the literature [21,28,56]. This resulted in a total of 56 restraint optimizations per patient.
2.5. Sensitivity Analysis
The sensitivity of the optimized restraint thickness to the choice of initial evaluations was analyzed by comparing the results obtained from four random sets of initial points. Additionally, we examined the changes in the RV EDPVRs with a wide range of restraint thicknesses and materials. The selected thickness range for this purpose was 0.1 to 12 mm, while (representative of restraint stiffness) varied between 0.01 and 10 MPa.
2.6. Computational Framework in Brief
Our computational design method has the capability of being implemented in hospitals to provide optimal RV restraint therapy. The patient should initially undergo medical imaging (CMR and echocardiography). The extracted geometry and conditions will then be used to create an FEA model of the ventricles at ED. A combined material and shape optimization process will be used to estimate the mechanical properties and reference configurations simultaneously. Personalized virtual epicardial restraint will then be determined in order to achieve a target passive filling that guarantees shifting the RVEDV to a desired curve. The optimal restraint can be prepared and applied to the patient during cardiac surgery at hospitals (see Figure 2).
3. Results
3.1. Computational Performance
Simulations were performed on an HP Z440 Workstation equipped with an Intel® Xeon® E5-2680 v4 CPU, which has 14 cores with a maximum turbo frequency of 3.30 GHz, 32 GB DDR4 RAM, and an NVMe M.2 SSD running the Linux operating system. To improve resource usage, two simulations were run simultaneously, with half of the CPU cores dedicated to each one. Table 2 compares the average timing, number of iterations, estimated material scale factors, and the goodness of fit for each restraint optimization.
3.2. Sensitivity Results
To assess the robustness of Bayesian optimizations with respect to the selection of initial function evaluations, we compared the optimization results obtained from four separate random sets of initial points for both the first and second patients in all 56 cases (as detailed in section 0). In 98.8% of simulations for the first patient and 99.3% of simulations for the second patient, the coefficient of variation was below 1%.
Figure 3 demonstrates the sensitivity of the second patient’s RV EDPVR to the restraint thickness with a of 0.03 MPa (Figure 3a) and to the restraint stiffness with a thickness of 0.5 mm (Figure 3b). The black and yellow dashed lines show the target RV EDPVR and its exponentially reduced curve with , respectively. The target value for was 48.8 ml, which was calculated from the predictions of [51]. Using Equation (7) with a target , the goal RVEDV for the second patient experienced a decrease from 90.3 ml to 77.85 ml. By thickening the RV restraint from zero to 12 mm at a constant stiffness (, the simulated RVEDV decreased from 91.33 ml to 71.47 ml with an unchanged of 48.36 ml (Table 2 and Figure 3a). From Equation (7), the became 46.22% considering volume changes of FEA-based RV under these conditions. Similarly, when the constraint was stiffened by increasing to 10 MPa while its thickness remained constant at 0.5 mm, the simulated RVEDV declined to 68 ml resulting in (Figure 3b). As shown in Figure 3, a similar decrease was also evident for the whole RV EDPVR except for the unloaded volume. This volume reduction continues until the reduced figures converge to specific curves in both figures.
3.3. RV EDPVRs Before Restraint
Compared to the target RV EDPVRs, the simulated curves, produced from shape-material optimizations, showed good agreement before the addition of restraints, i.e., or (Figure 4).
3.4. Optimal Restraints
The 3D surface plots in Figure 5 illustrate the relationship between restraint stiffness, the expected reduction in RVEDV, and the estimated optimal thickness of the restraint. The plots also display the NRMSDV associated with each optimal value. It was observed that, at a constant reduction ratio, the optimized restraint thickness decreased as increased. Conversely, for a specific type of restraint, a higher optimized thickness was achieved for a higher desired . While the surface plots exhibited similar trends across all cases, the optimized thicknesses and NRMSDV values varied for each patient. Notably, the third patient (with an RVEDP of 5mmHg) had a higher NRMSDV. A low NRMSDV (approaching zero) indicates a perfect fit, whereas high values suggest a significant deviation between the goal and achieved RV EDPVRs. Interestingly, all patients in the study demonstrated lower NRMSDV in the second row, which is related to the exponential reduction in target curves.
Fiber Green strain () and fiber Cauchy stress () are compared in Figure 6 for different desired values in a representative biventricular model of the second patient assuming MPa. In general, a higher value requires a greater restraint thickness with a lower and in the RVFW.
4. Discussion
We have developed a computer-based design method for determining the optimal value of epicardial passive restraint in patients with RV failure. Our Bayesian optimization method demonstrates high robustness, regardless of the initial points selected. Low NRMSDV values were achieved for all material estimation simulations, indicating an excellent fit for the ventricular material scale factor estimations (see Table 2 and Figure 4). A more accurate fit has already been obtained for ischemic ventricles assuming LV EDPVR as the target [29]. In addition, the scale factors in healthy regions of the myocardium in that study were considerably lower than those found in the present study based on the RV EDPVR. However, due to the necessity of optimizing additional ischemic parameters in that study, the average total solution time for shape-material estimations here was approximately half of those reported previously for a biventricular model running on a relatively similar PC [29] (see Table 2). It is worth mentioning that the computational time depends on the complexity of the models and the available computational resources. Additionally, the shape-material estimation times were higher than the fitting run-times of the LV models reported for supercomputer resources with 96 CPU cores [31] and significantly lower than those reported for an LV being simulated on a regular workstation [57]. Among the three RV failure patients included in our study, the third patient had a longer running time. This patient’s FEA model contained the largest number of elements and nodes compared to the others.
The constraint sensitivity analysis revealed that while increased restraint thickness leads to reduced RV passive volumes, the rate of this decline is not consistent. Finally, the RV EDPVR converges to a final curve, after which increased thickness does not result in reduced RV volumes. Similar leftward shifts have already been reported in the literature using FEA to model the Acorn CorCap Cardiac Support Device (Acorn Cardiovascular Inc, St. Paul, MN) on a biventricular model [58], a constrained LV with pressure on the epicardium [2], and a longitudinal patch added to the epicardium of the acutely ischemic LV [16]. However, small changes in LV EDPVR have been reported after the addition of a longitudinal patch [16]. Another experimental study on dogs showed that longitudinal support of acute anteroapical infarcts does not affect LV EDPVR while improving cardiac output (CO) [59]. In addition, computational modeling showed that isotropic stiffening of the aforementioned infarcts moves LV EDPVR to the left and improves contractility, although it does not substantially influence stroke volume [17]. Additionally, it was reported that the RVEDV did not significantly alter when higher levels of quantitative ventricular restraint were applied solely to the RV epicardium [4]. The present study showed that constraint thickness and stiffness determine the degree of such ventricular volume reductions if passive constraints are applied to the epicardium of the unloaded RV (Figure 3).
Surface plots from Figure 5 indicate that the optimal restraint thickness is dependent on RVEDP, with patients having lower RVEDP requiring slimmer restraints. These surface plots also demonstrate that optimized restraint values provide a better fit for the exponentially reduced target RV EDPVRs compared to the proportional ones, particularly at higher RVEDP levels. Also, it is not advisable to use stiff restraints for low desired values due to the high NRMSDV, as indicated by the lower reddish corners of the surface plots in Figure 5. It is noteworthy that these conclusions are based on Klotz’s EDPVR as the goal curve for the RV passive filling, and there is potential for further exploration in future studies to assess the impact of measured target RV EDPVRs as opposed to the empirical Klotz curves utilized in this study.
Figure 6 illustrates a reduction in fiber stress and strain as restraint thickness increases for patient 2, with similar findings observed in the other two cases. Previous studies have shown decreased LV fiber stress at ED following the implementation of epicardial constraints [2,58]. In addition, restrained LV has been associated with reduced ED fiber strain [16], while isotropic reinforcement substantially decreased both circumferential and longitudinal ED strains [17].
According to the law of Laplace, reducing RV diameter and increasing its wall thickness after restraint both lead to decreased wall stress. This is similar to the changes in fiber stress presented in Figure 6. While this law can offer valuable insights into stress variations, it may not always provide precise estimations of LV stress changes following the treatment of dilated cardiomyopathy using passive devices [60]. The superiority of FEA over Laplace's law in stress calculations for the LV has been well-documented [61]. FEA not only predicts stress and strain alterations, but it can also determine their spatial distributions across the ventricles.
Limitations and Suggestions
Despite all the mentioned benefits, the methodology proposed in this research may have a few downsides. Our FEA and optimization were conducted to assess mechanical support provided by isotropic epicardial patches for the enlarged RV. The study focused on passive restraining, excluding the evaluation of therapeutic ingredients and healing effects [62]. While incorporating systolic behavior is crucial for understanding the impact of constraint thickness on CO, our modeling primarily centered on the diastolic filling of the RV. Also, the method utilized in this study is only able to predict the acute effects of restraints on passive filling (RV EDPVR), assuming consistent RVEDP before and after stiffening, and disregarding RVEDP changes [4,63]. Our assumption of a smooth variation of myofibers in the ventricular wall may have influenced the results negatively, given the structural changes and remodeling in HF. A sensitivity analysis has been conducted previously to demonstrate the effect of fiber orientations on estimated material parameters in ischemic ventricles [29]. For more accurate results, detailed whole-organ models should be considered; however, this may significantly increase solution times. The uniqueness of the estimated unloaded shapes is not yet guaranteed [31]. An additional limiting assumption could be the lack of consideration for prestretch when simulating epicardial restraints. While prestretch may be observed when passive biventricular restraints cover both ventricles, we do not anticipate high levels of prestretch in RV-specific applications. In addition to the aforementioned declarations, there are a few more limitations to our material estimations and unloading method that have already been discussed [29].
5. Conclusions
A novel and easy-to-implement computational framework has been proposed in the present study to predict the passive effect of constraining the RV epicardial surface noninvasively. Our robust method not only successfully estimated both the reference stress-free configuration and the passive biomechanical properties based on experiments and medical imaging, but it also found the optimal thickness for restraining the RV to desired volume reduction ratios using a wide range of available restraint materials. Low NRMSDV values were achieved for both material estimations and restraint optimizations, demonstrating the accuracy of the results. It was observed that the exponentially reduced target RV EDPVR can better mimic the behavior of the restrained ventricle. A sensitivity study revealed that increasing constraint thickness and stiffness results in a leftward shift of the RV EDPVR. As thickness and stiffness rise, the altered curves would eventually converge to a final state, beyond which further stiffening and thickening could not shift the curve to the left.
Patient-specific surface plots were generated for each patient to show the best thickness of a wide range of available constraint materials for different desired volume reduction values. With a rise in the target reduction, the optimal thickness increased, while fiber stress and strain decreased accordingly. One advantage of the current study is the consideration of the unloaded ventricular shape, personalized material estimations based on the RV EDPVR, and valvular effects. Although the primary focus of this research was modeling the passive constraints of the RV, similar techniques can also be applied to explore the effect of epicardial restraints on the passive behavior of the LV.
Author Contributions
S. Torbati: Data Curation, Formal Analysis, Investigation, Methodology, Software, Resources, Validation, Visualization, Writing – Original Draft, Writing – Review & Editing. A. Daneshmehr: Supervision, Validation, Writing – Review & Editing. M. Ramze Rezaee: Software, Validation, Writing – Review & Editing. H. Pouraliakbar: Data Curation, Validation, Formal Analysis, Writing – Review & Editing. S. H. Ahmadi Tafti: Conceptualization, Funding Acquisition, Methodology, Supervision, Writing – Review & Editing. M. Asgharian: Validation, Methodology, Writing – Review & Editing. H. Vali: Supervision, Writing – Review & Editing. A. Heidari: Conceptualization, Software, Resources, Methodology, Writing – Original Draft, Writing – Review & Editing, Project Administration. All authors have read and agreed to the published version of the manuscript.
Funding
This research was financially supported by the Tehran University of Medical Sciences (Grant number 1401-3-10-62084).
Institutional Review Board Statement
The methods used in this research, including data collection and modeling, have been evaluated and approved by the Research Ethics Committees of the School of Medicine - Tehran University of Medical Sciences (Approval ID: IR.TUMS.MEDICINE.REC.1401.667).
Data Availability Statement
Data are available from the corresponding author upon reasonable request.
Conflicts of Interest
The authors declare that they have no known competing financial interests or personal relationships that could have appeared to influence the work reported in this paper.
Nomenclature and Abbreviations
| Abbreviation | Full term |
| CMR | Cardiac magnetic resonance |
| CO | Cardiac output |
| ED | End-diastole or End-diastolic |
| EDPVR | End-diastolic pressure-volume relationship |
| EI | Expected improvement |
| FEA | Finite element analysis |
| HF | Heart failure |
| LCB | Lower confidence bound |
| LHS | Latin Hypercube sampling |
| LV | Left ventricle or Left ventricular |
| LVAD | Left ventricular assist device |
| MI | Myocardial infarction |
| NRMSDV | Normalized root mean squared deviation of volumes |
| PAH | Pulmonary arterial hypertension |
| PH | Pulmonary hypertension |
| PI | Probability of improvement |
| RAP | Right atrial pressure |
| RP | Reference point |
| RV | Right ventricle or Right ventricular |
| RVEDP | Right ventricular end-diastolic pressure |
| RVEDV | Right ventricular end-diastolic volume |
| RVFW | Right ventricular free wall |
| RVSP | Right ventricular systolic pressure |
References
- M. Naveed, I.S. Mohammad, L. Xue, S. Khan, W. Gang, Y. Cao, Y. Cheng, X. Cui, C. DingDing, Y. Feng, W. Zhijie, Z. Xiaohui, The promising future of ventricular restraint therapy for the management of end-stage heart failure, Biomed. Pharmacother. 99 (2018) 25–32. [CrossRef]
- C.S. Jhun, J.F. Wenk, Z. Zhang, S.T. Wall, K. Sun, H.N. Sabbah, M.B. Ratcliffe, J.M. Guccione, Effect of Adjustable Passive Constraint on the Failing Left Ventricle: A Finite-Element Model Study, Ann. Thorac. Surg. 89 (2010) 132–137. [CrossRef]
- L.S. Lee, R.K. Ghanta, S.A. Mokashi, O. Coelho-Filho, R.Y. Kwong, R.M. Bolman, F.Y. Chen, Ventricular restraint therapy for heart failure: The right ventricle is different from the left ventricle, J. Thorac. Cardiovasc. Surg. 139 (2010) 1012–1018. [CrossRef]
- M. Cevasco, M. Kwon, A. Fiedler, L.S. Lee, J. Shiao, R. V. Shah, A.H. Worthington, J.A. Fox, R.Y. Kwong, F.Y. Chen, Right heart failure: An ischemic model and restraint therapy for treatment, Ann. Thorac. Surg. 97 (2014) 1356–1363. [CrossRef]
- O.O. Odeigah, D. Valdez-Jasso, S.T. Wall, J. Sundnes, Computational models of ventricular mechanics and adaptation in response to right-ventricular pressure overload, Front. Physiol. 13 (2022). [CrossRef]
- R. Avazmohammadi, M. Hill, M. Simon, M. Sacks, Transmural remodeling of right ventricular myocardium in response to pulmonary arterial hypertension, 2017. [CrossRef]
- R. Avazmohammadi, E.A. Mendiola, J.S. Soares, D.S. Li, Z. Chen, S. Merchant, E.W. Hsu, P. Vanderslice, R.A.F. Dixon, M.S. Sacks, A Computational Cardiac Model for the Adaptation to Pulmonary Arterial Hypertension in the Rat, Ann Biomed Eng. 47 (2019) 138–153. [CrossRef]
- H. Finsberg, C. Xi, X. Zhao, J. Le Tan, M. Genet, J. Sundnes, L.C. Lee, L. Zhong, S.T. Wall, Computational quantification of patient-specific changes in ventricular dynamics associated with pulmonary hypertension, Am. J. Physiol. - Hear. Circ. Physiol. 317 (2019) H1363–H1375. [CrossRef]
- O.O. Odeigah, E.D. Kwan, K.M. Garcia, H. Finsberg, D. Valdez-Jasso, J. Sundnes, A computational study of right ventricular mechanics in a rat model of pulmonary arterial hypertension, Front. Physiol. 15 (2024) 1–17. [CrossRef]
- A. Heidari, K.I. Elkhodary, C. Pop, M. Badran, H. Vali, Y.M.A. Abdel-Raouf, S. Torbati, M. Asgharian, R.J. Steele, I. Mahmoudzadeh Kani, S. Sheibani, H. Pouraliakbar, H. Sadeghian, R. Cecere, M.G.W. Friedrich, H.A. Tafti, Patient-specific finite element analysis of heart failure and the impact of surgical intervention in pulmonary hypertension secondary to mitral valve disease, Med. Biol. Eng. Comput. 60 (2022) 1723–1744. [CrossRef]
- F. Scardulla, V. Agnese, G. Romano, G. Di Gesaro, S. Sciacca, D. Bellavia, F. Clemenza, M. Pilato, S. Pasta, Modeling Right Ventricle Failure After Continuous Flow Left Ventricular Assist Device: A Biventricular Finite-Element and Lumped-Parameter Analysis, Cardiovasc. Eng. Technol. 9 (2018) 427–437. [CrossRef]
- K.L. Sack, Y. Dabiri, T. Franz, S.D. Solomon, D. Burkhoff, J.M. Guccione, Investigating the role of interventricular interdependence in development of right heart dysfunction during LVAD support: A patient-specific methods-based approach, Front. Physiol. 9 (2018) 520. [CrossRef]
- L. Fan, J.S. Choy, S. Lee, K.S. Campbell, J.F. Wenk, G.S. Kassab, D. Burkhoff, L.C. Lee, An in silico study of the effects of left ventricular assist device on right ventricular function and inter-ventricular interaction, Artif. Organs. 47 (2023) 1831–1847. [CrossRef]
- I. Pirozzi, A. Kight, E. Aranda-Michael, R. Shad, Y. Zhu, L.K. Waldman, W. Hiesinger, M. Cutkosky, Cardiac Support for the Right Ventricle: Effects of Timing on Hemodynamics-Biomechanics Tradeoff, in: D.B. Ennis, L.E. Perotti, V.Y. Wang (Eds.), Lect. Notes Comput. Sci. (Including Subser. Lect. Notes Artif. Intell. Lect. Notes Bioinformatics), Springer International Publishing, Cham, 2021: pp. 385–395. [CrossRef]
- T. Ito, H. Hagiwara, A. Maekawa, T. Yamazaki, Finite element analysis regarding patch size, stiffness, and contact condition to the endocardium in surgery for post infarction ventricular septal rupture, Gen. Thorac. Cardiovasc. Surg. 61 (2013) 632–639. [CrossRef]
- A.C. Estrada, K. Yoshida, S.A. Clarke, J.W. Holmes, Longitudinal Reinforcement of Acute Myocardial Infarcts Improves Function by Transmurally Redistributing Stretch and Stress, J. Biomech. Eng. 142 (2020) 1–10. [CrossRef]
- G.M. Fomovsky, J.R. MacAdangdang, G. Ailawadi, J.W. Holmes, Model-based design of mechanical therapies for myocardial infarction, J. Cardiovasc. Transl. Res. 4 (2011) 82–91. [CrossRef]
- K.L.P.M. Janssens, P.H.M. Bovendeerd, Impact of cardiac patch alignment on restoring post-infarct ventricular function, Biomech. Model. Mechanobiol. (2024). [CrossRef]
- T. Kummer, S. Rossi, S. Vandenberghe, S. Demertzis, P. Jenny, Embedded Computational Heart Model for External Ventricular Assist Device Investigations, Cardiovasc. Eng. Technol. 13 (2022) 764–782. [CrossRef]
- I. Pirozzi, A. Kight, R. Shad, A.K. Han, S.A. Dual, R. Fong, A. Jia, W. Hiesinger, P. Yock, M. Cutkosky, RVEX: Right Ventricular External Device for Biomimetic Support and Monitoring of the Right Heart, Adv. Mater. Technol. 7 (2022) 1–13. [CrossRef]
- Y. Zhang, W. Mu, Y. Zhang, X. He, Y. Wang, H. Ma, T. Zhu, A. Li, Q. Hou, W. Yang, Y. Ding, S. Ramakrishna, H. Li, Recent Advances in Cardiac Patches: Materials, Preparations, and Properties, ACS Biomater. Sci. Eng. 8 (2022) 3659–3675. [CrossRef]
- V.C. Vetter, C.V.C. Bouten, A. van der Pol, Hydrogels for Cardiac Restorative Support: Relevance of Gelation Mechanisms for Prospective Clinical Use, Curr. Heart Fail. Rep. 20 (2023) 519–529. [CrossRef]
- K.L. Sack, E. Aliotta, J.S. Choy, D.B. Ennis, N.H. Davies, T. Franz, G.S. Kassab, J.M. Guccione, Intra-myocardial alginate hydrogel injection acts as a left ventricular mid-wall constraint in swine, Acta Biomater. 111 (2020) 170–180. [CrossRef]
- K.L. Sack, N.H. Davies, J.M. Guccione, T. Franz, Personalised computational cardiology: Patient-specific modelling in cardiac mechanics and biomaterial injection therapies for myocardial infarction, Heart Fail. Rev. 21 (2016) 815–826. [CrossRef]
- L. Rosalia, M. Saeed Y., E.T. Roche, Devices that Enhance the Biomechanics of the Failing Heart, INC, 2022. [CrossRef]
- C.E. Varela, Y. Fan, E.T. Roche, Optimizing epicardial restraint and reinforcement following myocardial infarction: Moving towards localized, biomimetic, and multitherapeutic options, Biomimetics. 4 (2019) 7. [CrossRef]
- S.A. Clarke, R.K. Ghanta, G. Ailawadi, J.W. Holmes, Cardiac Restraint and Support Following Myocardial Infarction, in: T. Franz (Ed.), Cardiovasc. Card. Ther. Devices, Springer Berlin Heidelberg, Berlin, Heidelberg, 2014: pp. 169–206. [CrossRef]
- K.D. Dwyer, K.L.K. Coulombe, Cardiac mechanostructure: Using mechanics and anisotropy as inspiration for developing epicardial therapies in treating myocardial infarction, Bioact. Mater. 6 (2021) 2198–2220. [CrossRef]
- S. Torbati, A. Daneshmehr, H. Pouraliakbar, M. Asgharian, S.H. Ahmadi Tafti, D. Shum-Tim, A. Heidari, Personalized evaluation of the passive myocardium in ischemic cardiomyopathy via computational modeling using Bayesian optimization, Biomech. Model. Mechanobiol. (2024). [CrossRef]
- S. Torbati, A. Heidari, A. Daneshmehr, H. Pouraliakbar, S.H.A. Tafti, D. Shum-Tim, Patient-Specific Study of Post-Ischemic Cardiac Ventricular Remodeling: A Passive Simulation of Structural Changes in Myofiber Orientation and Stiffness, in: 2022 29th Natl. 7th Int. Iran. Conf. Biomed. Eng., IEEE, Tehran, 2022: pp. 299–304. [CrossRef]
- L. Marx, J.A. Niestrawska, M.A.F. Gsell, F. Caforio, G. Plank, C.M. Augustin, Robust and efficient fixed-point algorithm for the inverse elastostatic problem to identify myocardial passive material parameters and the unloaded reference configuration, J. Comput. Phys. 463 (2022) 111266. [CrossRef]
- E. Heiberg, J. Sjögren, M. Ugander, M. Carlsson, H. Engblom, H. Arheden, Design and validation of Segment - freely available software for cardiovascular image analysis, BMC Med. Imaging. 10 (2010) 1–13. [CrossRef]
- M. Peirlinck, K.L. Sack, P. De Backer, P. Morais, P. Segers, T. Franz, M. De Beule, Kinematic boundary conditions substantially impact in silico ventricular function, Int. j. Numer. Method. Biomed. Eng. 35 (2019) 1–21. [CrossRef]
- Abaqus, Abaqus Analysis User’s Manual, Dassault Systèmes Simulia Corp, 2021.
- A. Van Gelder, Approximate Simulation of Elastic Membranes by Triangulated Spring Meshes, J. Graph. Tools. 3 (1998) 21–41. [CrossRef]
- P.E. Hammer, M.S. Sacks, P.J. Del Nido, R.D. Howe, Mass-spring model for simulation of heart valve tissue mechanical behavior, Ann. Biomed. Eng. 39 (2011) 1668–1679. [CrossRef]
- S.R. Ommen, R.A. Nishimura, C.P. Appleton, F.A. Miller, J.K. Oh, M.M. Redfield, A.J. Tajik, Clinical utility of Doppler echocardiography and tissue Doppler imaging in the estimation of left ventricular filling pressures: A comparative simultaneous Doppler-catheterization study, Circulation. 102 (2000) 1788–1794. [CrossRef]
- M. Schwarzl, F. Ojeda, T. Zeller, M. Seiffert, P.M. Becher, T. Munzel, P.S. Wild, M. Blettner, K.J. Lackner, N. Pfeiffer, M.E. Beutel, S. Blankenberg, Di. Westermann, Risk factors for heart failure are associated with alterations of the LV end-diastolic pressure-volume relationship in non-heart failure individuals: Data from a large-scale, population-based cohort, Eur. Heart J. 37 (2016) 1807–1814. [CrossRef]
- Y. Zhang, V.Y. Wang, A.E. Morgan, J. Kim, L. Ge, J.M. Guccione, J.W. Weinsaft, M.B. Ratcliffe, A Novel MRI-Based Finite Element Modeling Method for Calculation of Myocardial Ischemia Effect in Patients With Functional Mitral Regurgitation, Front. Physiol. 11 (2020) 158. [CrossRef]
- D. Kireyev, J. Hung, Estimation of Chamber Pressures, in: D. Kireyev, J. Hung (Eds.), Card. Imaging Clin. Pract., Springer International Publishing, Cham, 2016: pp. 121–124. [CrossRef]
- A.E. Lammers, C. Apitz, I. Michel-Behnke, M. Koestenberger, A guide to echocardiographic assessment in children and adolescents with pulmonary hypertension, Cardiovasc. Diagn. Ther. 11 (2021) 1160–1177. [CrossRef]
- E. Bossone, F. Ferrara, E. Grünig, Echocardiography in pulmonary hypertension, Curr. Opin. Cardiol. 30 (2015). http://journals.lww.com/co-cardiology/Fulltext/2015/11000/Echocardiography_in_pulmonary_hypertension.4.aspx.
- K. Meinel, M. Koestenberger, H. Sallmon, G. Hansmann, G.E. Pieles, Echocardiography for the assessment of pulmonary hypertension and congenital heart disease in the young, Diagnostics. 11 (2021). [CrossRef]
- D. Sidebotham, Chapter 7 - Echocardiography, in: D. Sidebotham, A. Mckee, M. Gillham, J.H.B.T.-C.C.C. Levy (Eds.), Cardiothorac. Crit. Care, Butterworth-Heinemann, Philadelphia, 2007: pp. 105–119. [CrossRef]
- A.Y. Jang, M.-S. Shin, Echocardiographic Screening Methods for Pulmonary Hypertension: A Practical Review, J Cardiovasc Imaging. 28 (2020) 1–9. [CrossRef]
- G.A. Holzapfel, R.W. Ogden, Constitutive modelling of passive myocardium: A structurally based framework for material characterization, Philos. Trans. R. Soc. A Math. Phys. Eng. Sci. 367 (2009) 3445–3475. [CrossRef]
- K.L. Sack, E. Aliotta, D.B. Ennis, J.S. Choy, G.S. Kassab, J.M. Guccione, T. Franz, Construction and validation of subject-specific biventricular finite-element models of healthy and failing swine hearts from high-resolution DT-MRI, Front. Physiol. 9 (2018). [CrossRef]
- G. Sommer, A.J. Schriefl, M. Andra, M. Sacherer, C. Viertler, H. Wolinski, G.A. Holzapfel, Biomechanical properties and microstructure of human ventricular myocardium, Acta Biomater. 24 (2015) 172–192. [CrossRef]
- H. Fehervary, L. Maes, J. Vastmans, G. Kloosterman, N. Famaey, How to implement user-defined fiber-reinforced hyperelastic materials in finite element software, J. Mech. Behav. Biomed. Mater. 110 (2020) 103737. [CrossRef]
- Abaqus, Abaqus User Subroutines Reference Manual, Dassault Systèmes Simulia Corp, 2021.
- S. Klotz, M.L. Dickstein, D. Burkhoff, A computational method of prediction of the end-diastolic pressure-volume relationship by single beat, Nat. Protoc. 2 (2007) 2152–2158. [CrossRef]
- S.M. Kim, E.B. Randall, F. Jezek, D.A. Beard, N.C. Chesler, Computational modeling of ventricular-ventricular interactions suggest a role in clinical conditions involving heart failure, Front. Physiol. 14 (2023). [CrossRef]
- S. Rain, M.L. Handoko, P. Trip, C.T.J. Gan, N. Westerhof, G.J. Stienen, W.J. Paulus, C.A.C. Ottenheijm, J.T. Marcus, P. Dorfmüller, C. Guignabert, M. Humbert, P. Macdonald, C. Dos Remedios, P.E. Postmus, C. Saripalli, C.G. Hidalgo, H.L. Granzier, A. Vonk-Noordegraaf, J. Van Der Velden, F.S. De Man, Right ventricular diastolic impairment in patients with pulmonary arterial hypertension, Circulation. 128 (2013) 2016–2025. [CrossRef]
- M.K. Rausch, M. Genet, J.D. Humphrey, An augmented iterative method for identifying a stress-free reference configuration in image-based biomechanical modeling, J. Biomech. 58 (2017) 227–231. [CrossRef]
- T. Head, G.L. MechCoder, I. Shcherbatyi, scikit-optimize/scikit-optimize: v0. 5.2, Version V0. 5 (2018). [CrossRef]
- J. Loureiro, S.P. Miguel, V. Galván-Chacón, D. Patrocinio, J.B. Pagador, F.M. Sánchez-Margallo, M.P. Ribeiro, P. Coutinho, Three-Dimensionally Printed Hydrogel Cardiac Patch for Infarct Regeneration Based on Natural Polysaccharides, Polymers (Basel). 15 (2023). [CrossRef]
- A. Borowska, H. Gao, A. Lazarus, D. Husmeier, Bayesian optimisation for efficient parameter inference in a cardiac mechanics model of the left ventricle, Int. j. Numer. Method. Biomed. Eng. 38 (2022) e3593. [CrossRef]
- J.F. Wenk, L. Ge, Z. Zhang, D. Mojsejenko, D.D. Potter, E.E. Tseng, J.M. Guccione, M.B. Ratcliffe, Biventricular finite element modeling of the acorn CorCap cardiac support device on a failing heart, Ann. Thorac. Surg. 95 (2013) 2022–2027. [CrossRef]
- G.M. Fomovsky, S.A. Clark, K.M. Parker, G. Ailawadi, J.W. Holmes, Anisotropic reinforcement of acute anteroapical infarcts improves pump function, Circ. Hear. Fail. 5 (2012) 515–522. [CrossRef]
- P.M. McCarthy, M. Takagaki, Y. Ochiai, J.B. Young, T. Tabata, T. Shiota, J.X. Qin, J.D. Thomas, T.J. Mortier, R.F. Schroeder, C.J. Schweich, K. Fukamachi, Device-based change in left ventricular shape: A new concept for the treatment of dilated cardiomyopathy, J. Thorac. Cardiovasc. Surg. 122 (2001) 482–490. [CrossRef]
- Z. Zhang, A. Tendulkar, K. Sun, D.A. Saloner, A.W. Wallace, L. Ge, J.M. Guccione, M.B. Ratcliffe, Comparison of the young-laplace law and finite element based calculation of ventricular wall stress: Implications for postinfarct and surgical ventricular remodeling, Ann. Thorac. Surg. 91 (2011) 150–156. [CrossRef]
- X. Mei, K. Cheng, Recent Development in Therapeutic Cardiac Patches, Front. Cardiovasc. Med. 7 (2020) 1–11. [CrossRef]
- R. Kiran Ghanta, L. Lee, A.T. Rangaraj, R. Umakanthan, R.G. Laurence, M.R. Bolman, L.H. Cohn, F.Y. Chen, Ventricular restraint therapy: And what of the right ventricle?, J. Am. Coll. Surg. 207 (2008) S27. [CrossRef]
Figure 1.
a) Exponential and (b) proportional reduction of the right ventricular (RV) end-diastolic pressure-volume relationship (EDPVR). Both curves were generated based on data measured from the second patient.
Figure 1.
a) Exponential and (b) proportional reduction of the right ventricular (RV) end-diastolic pressure-volume relationship (EDPVR). Both curves were generated based on data measured from the second patient.
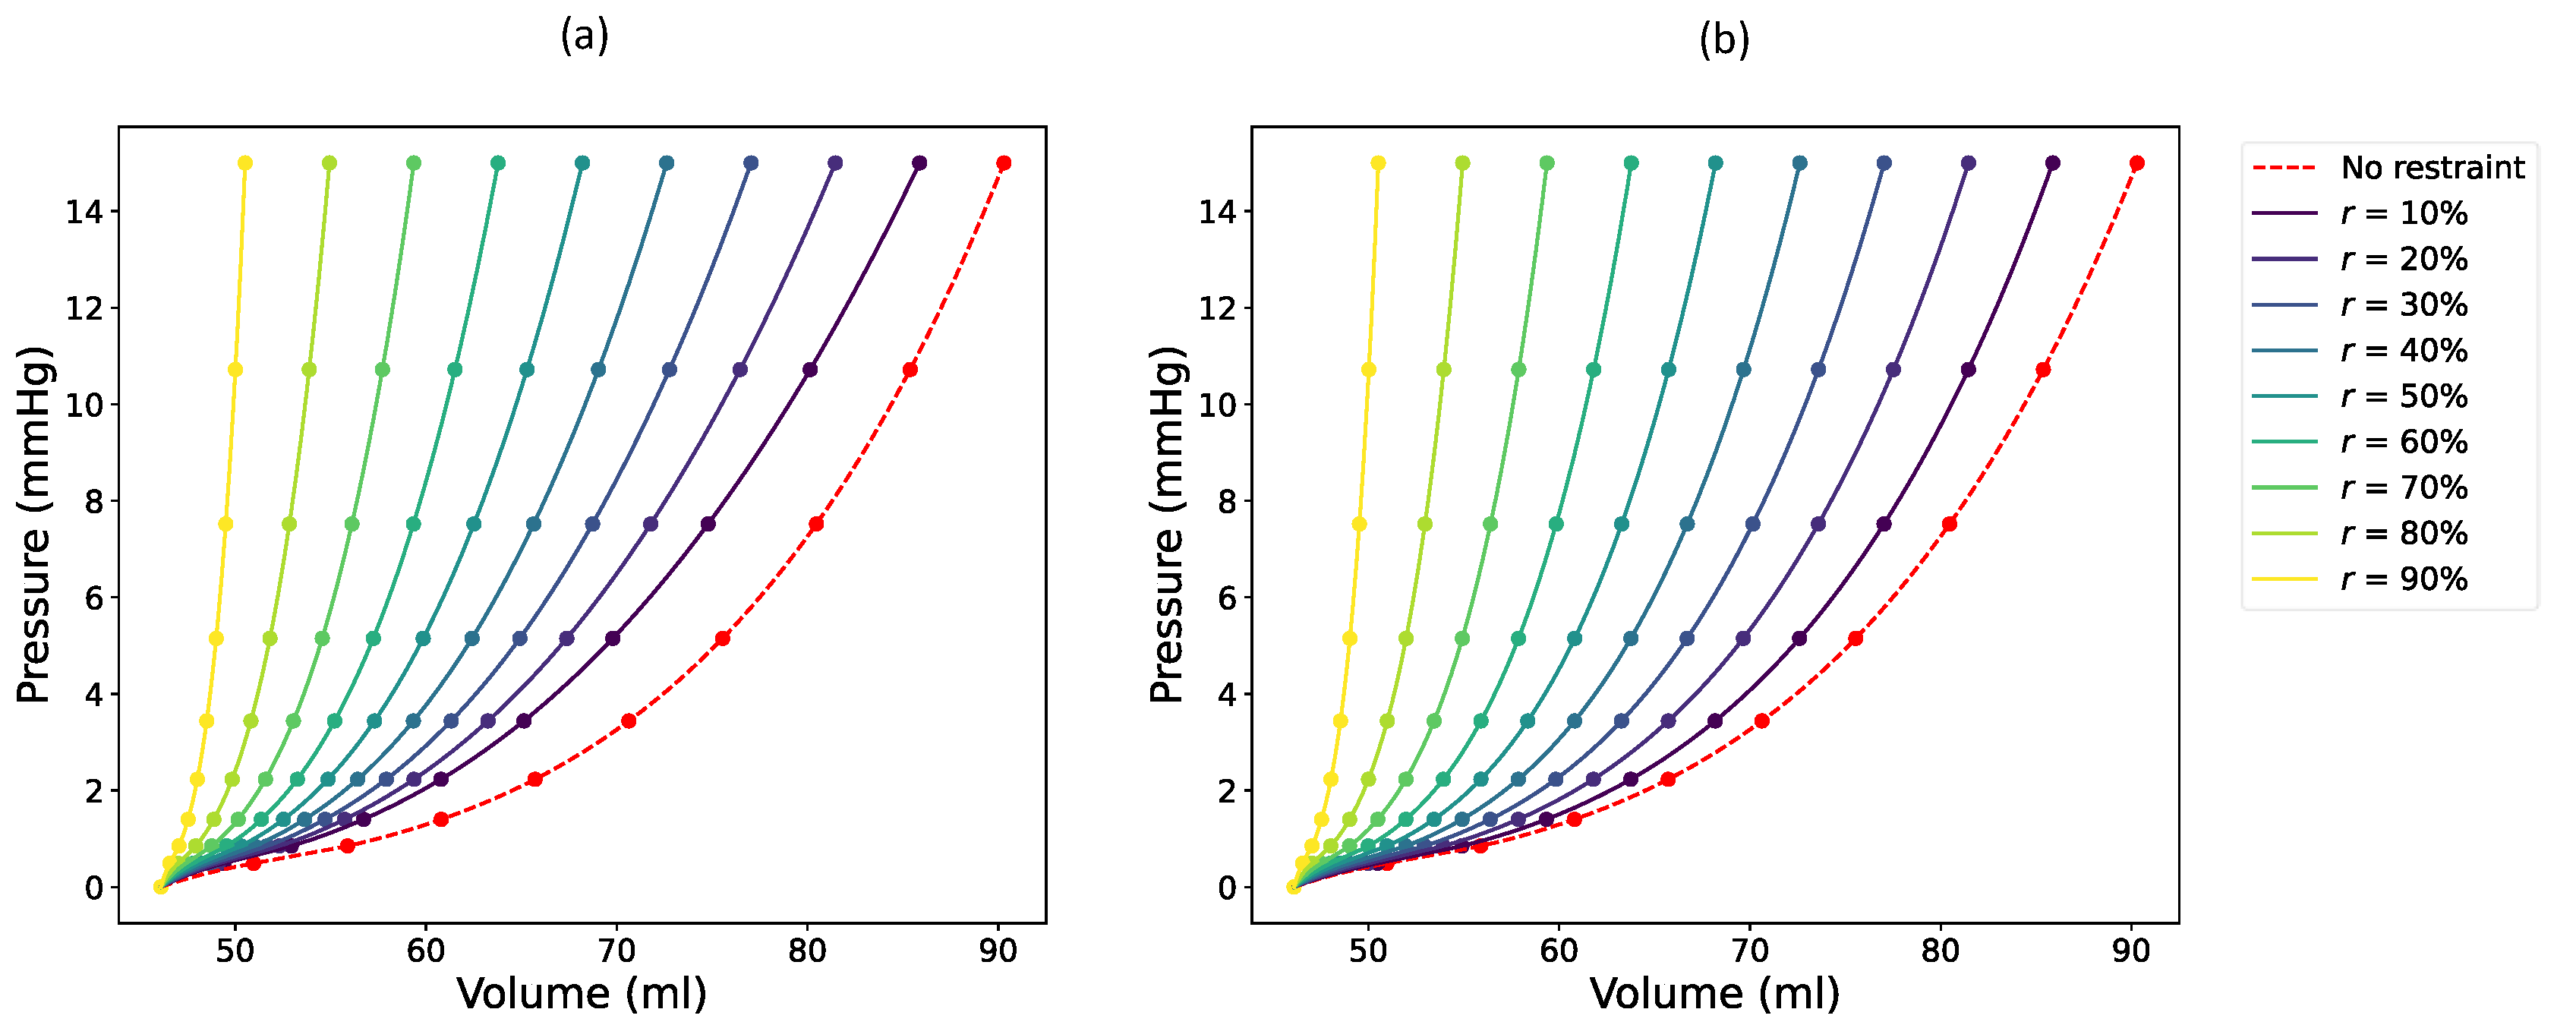
Figure 2.
Flowchart of the cardiac surgery using optimal epicardial restraint therapy through the computer-aided design. FEA stands for finite element analysis, ED for end-diastole, RV for right ventricular, and EDPVR for end-diastolic pressure-volume relationship.
Figure 2.
Flowchart of the cardiac surgery using optimal epicardial restraint therapy through the computer-aided design. FEA stands for finite element analysis, ED for end-diastole, RV for right ventricular, and EDPVR for end-diastolic pressure-volume relationship.
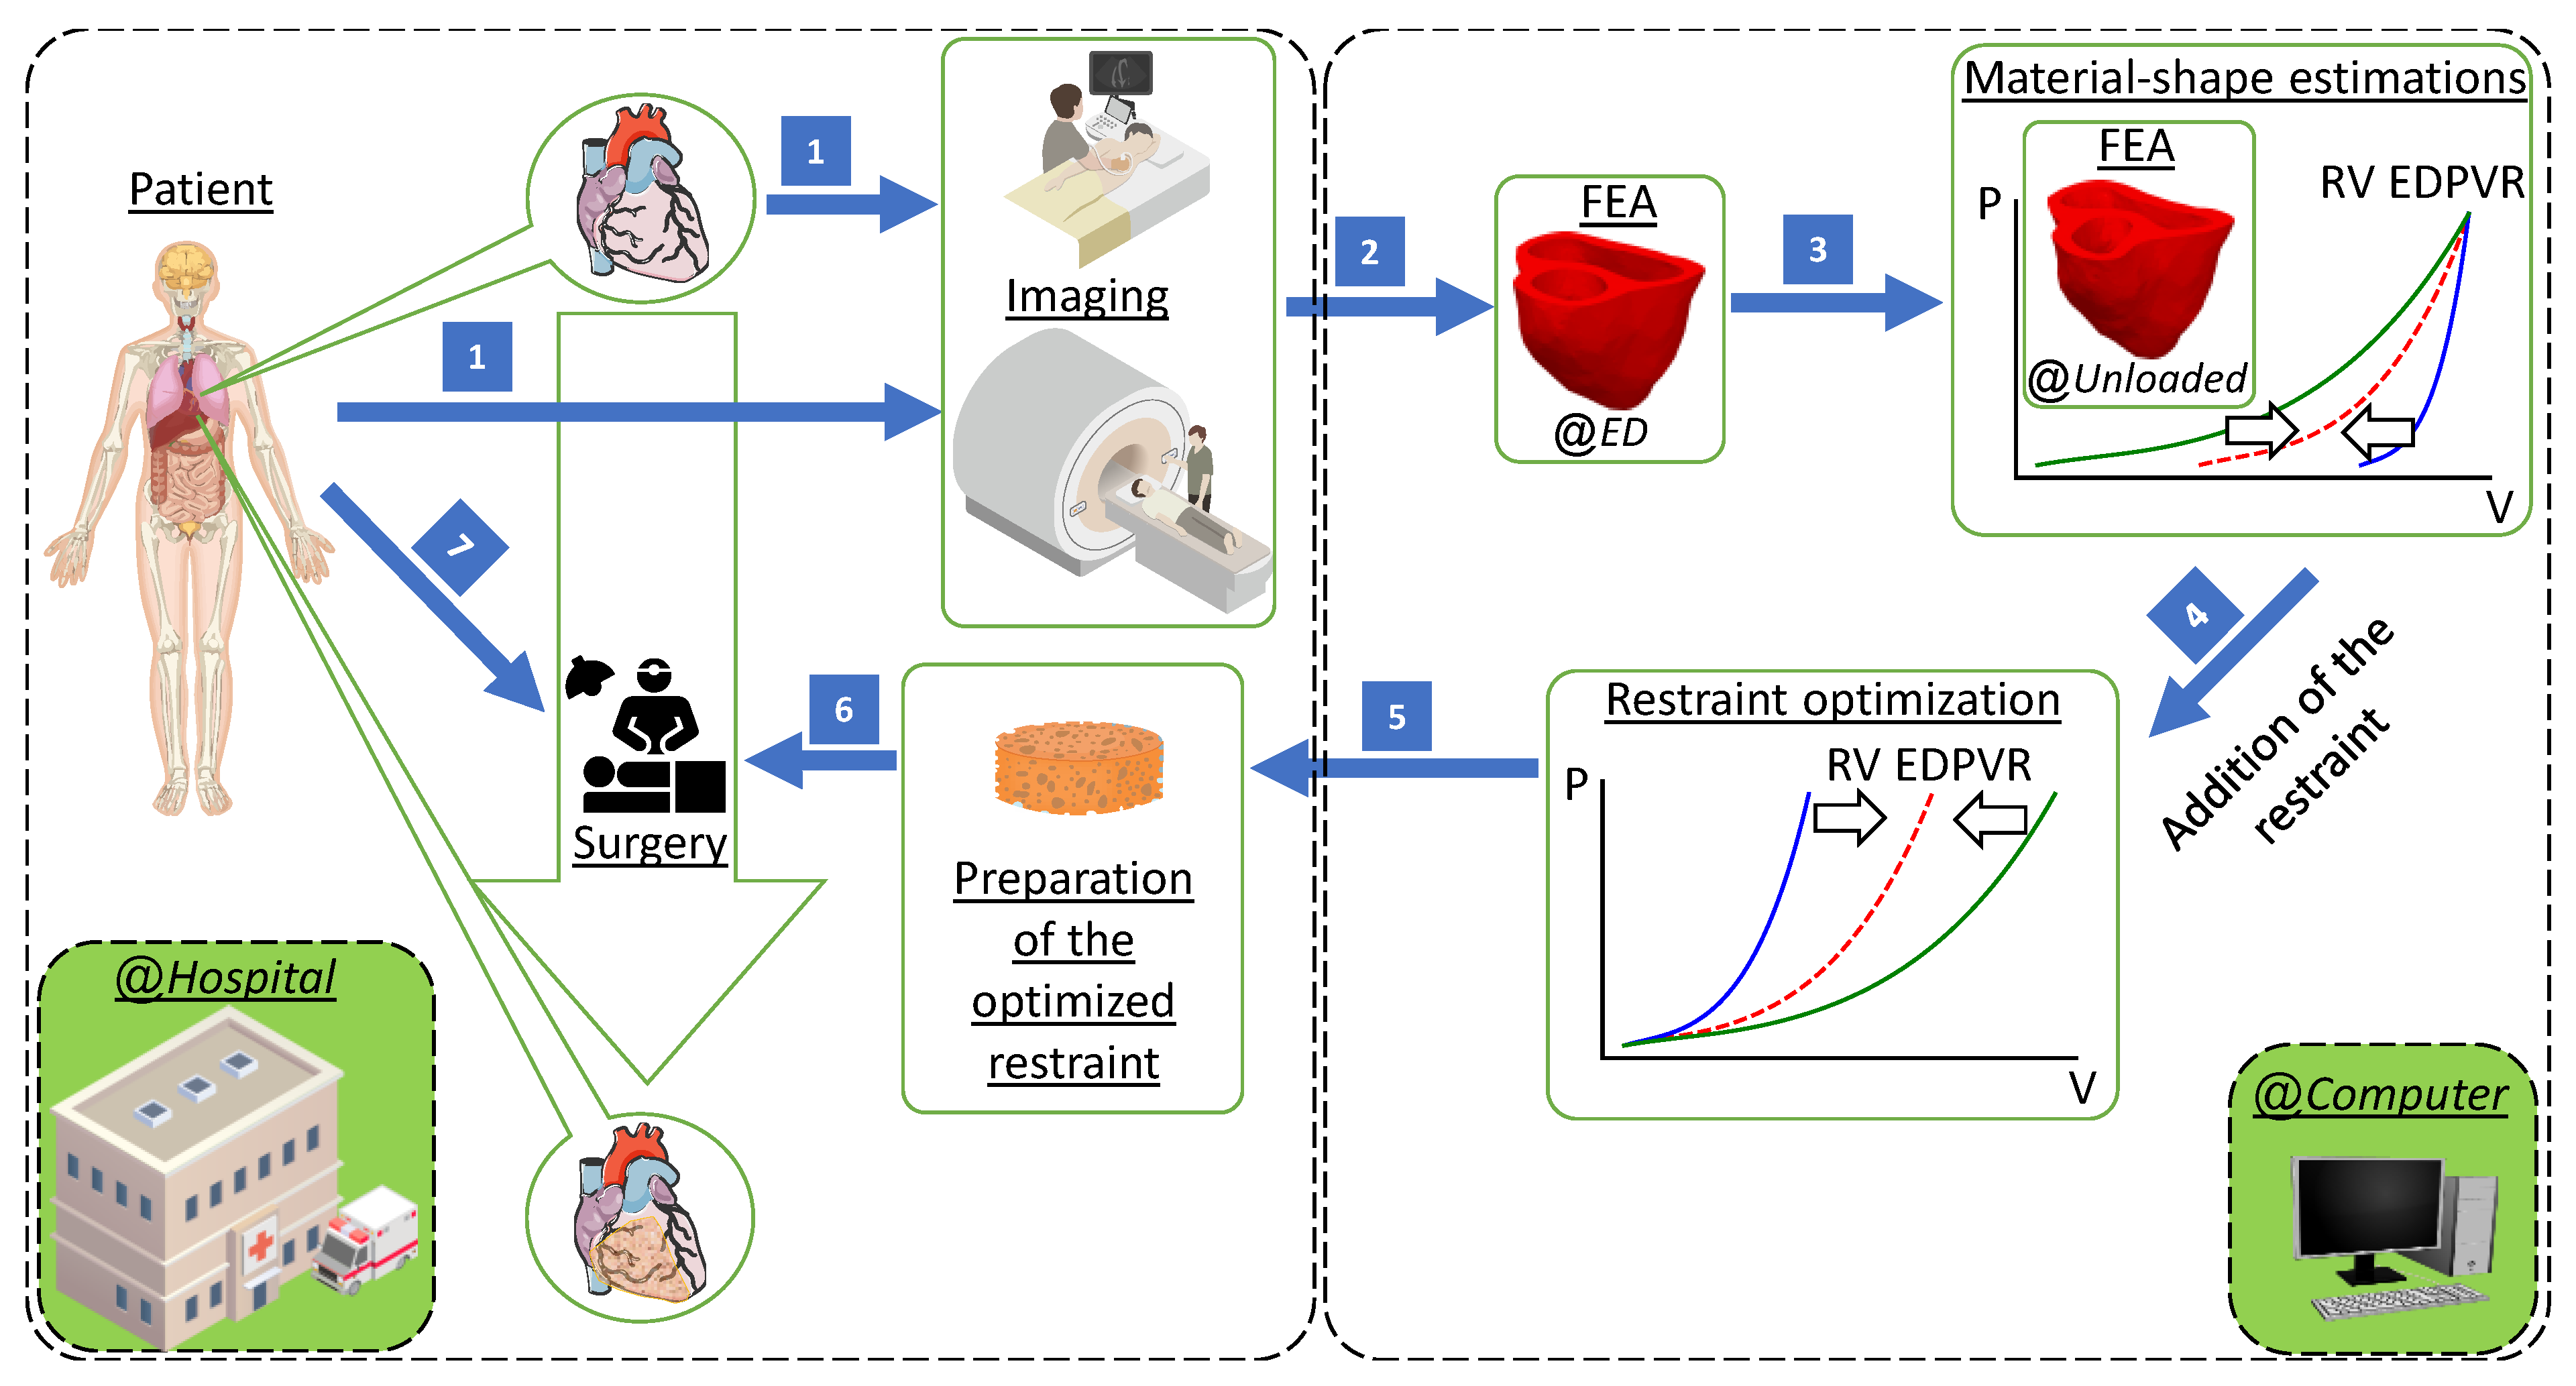
Figure 3.
The sensitivity of the right ventricular (RV) end-diastolic pressure-volume relationships (EDPVRs) to (a) constraint thickness with a constant MPa and to (b) constraint stiffness with a constant thickness of 0.5 mm applied to the right ventricle (RV) of the second patient. The yellow dashed lines represent the exponential target curve with , while the black dashed lines depict target curves for unconstrained passive filling of the RV. Solid lines show simulated RV EDPVRs, while dashed lines represent target RV EDPVRs.
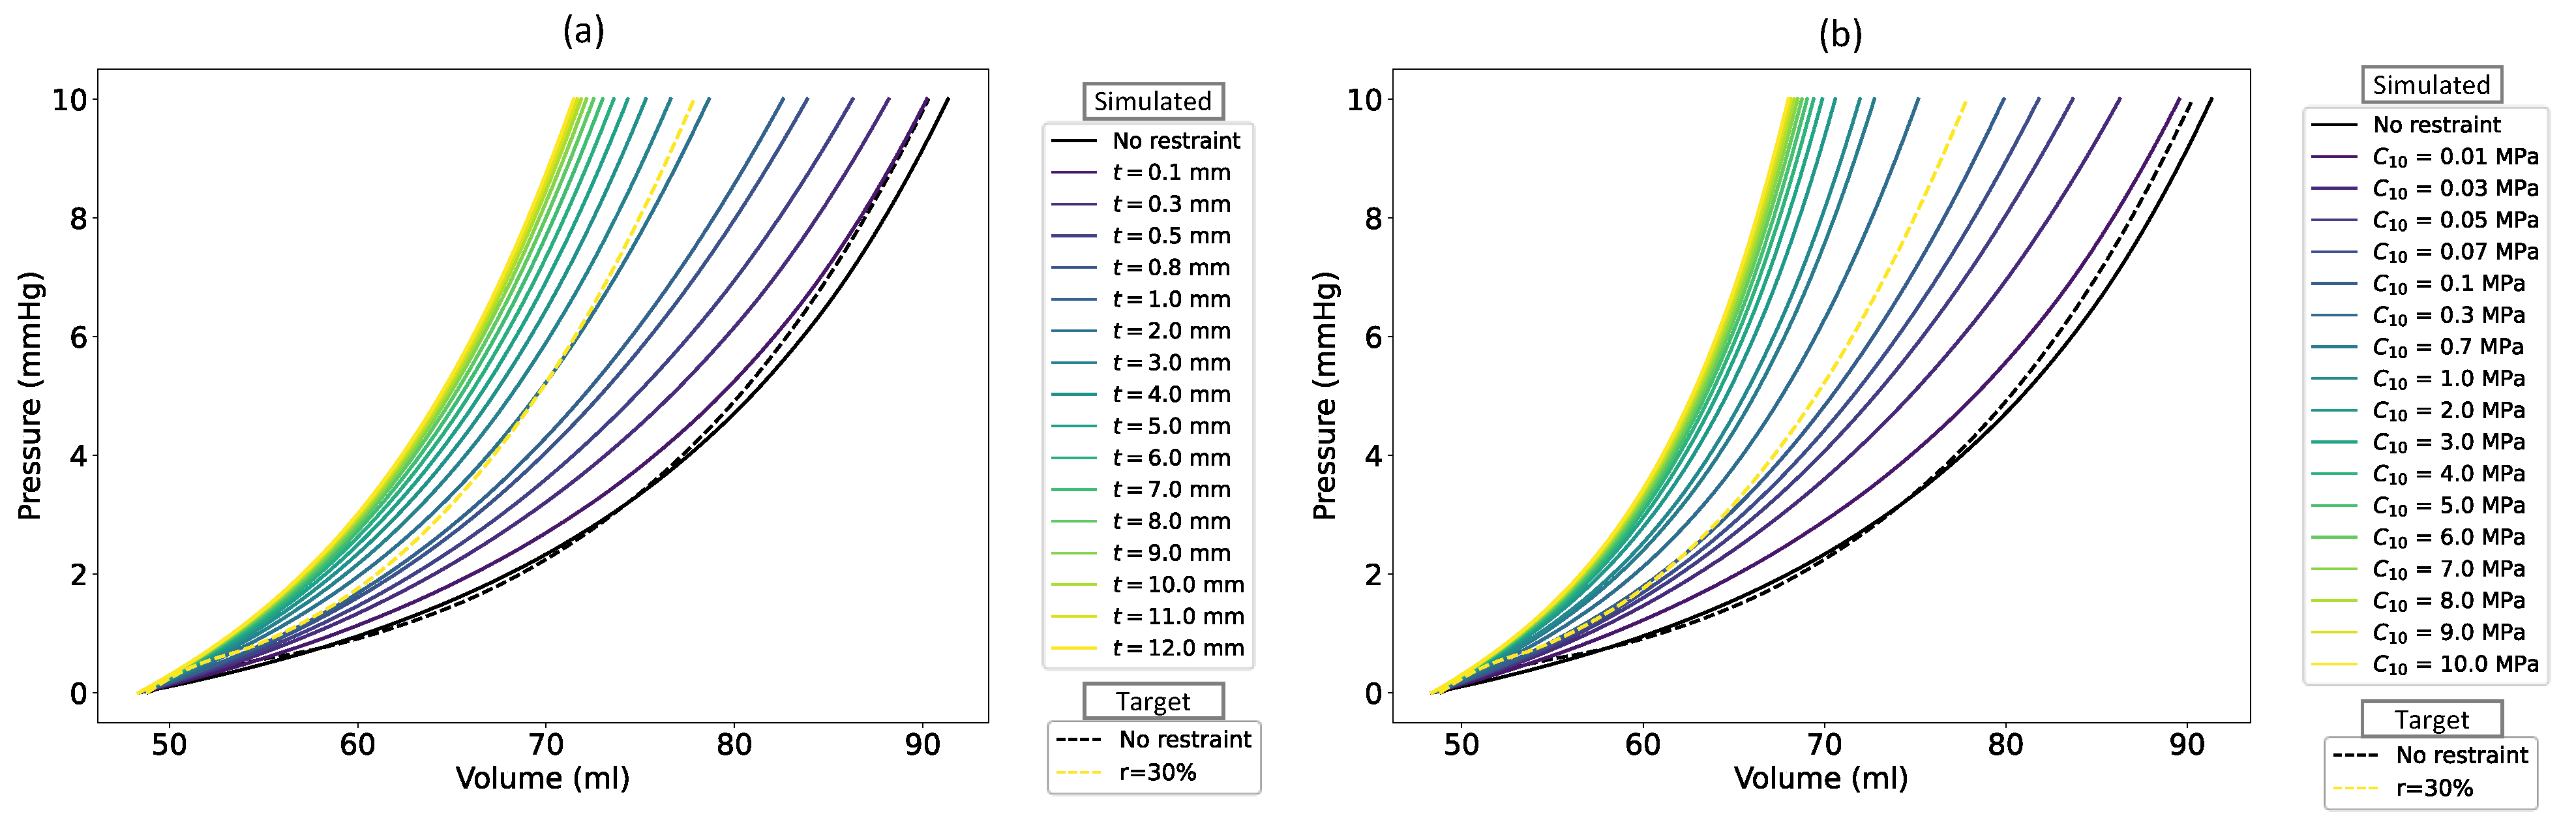
Figure 4.
Simulated (solid lines) and target (dashed lines representing empirical goals [51]) right ventricular (RV) end-diastolic pressure-volume relationships (EDPVRs).
Figure 4.
Simulated (solid lines) and target (dashed lines representing empirical goals [51]) right ventricular (RV) end-diastolic pressure-volume relationships (EDPVRs).
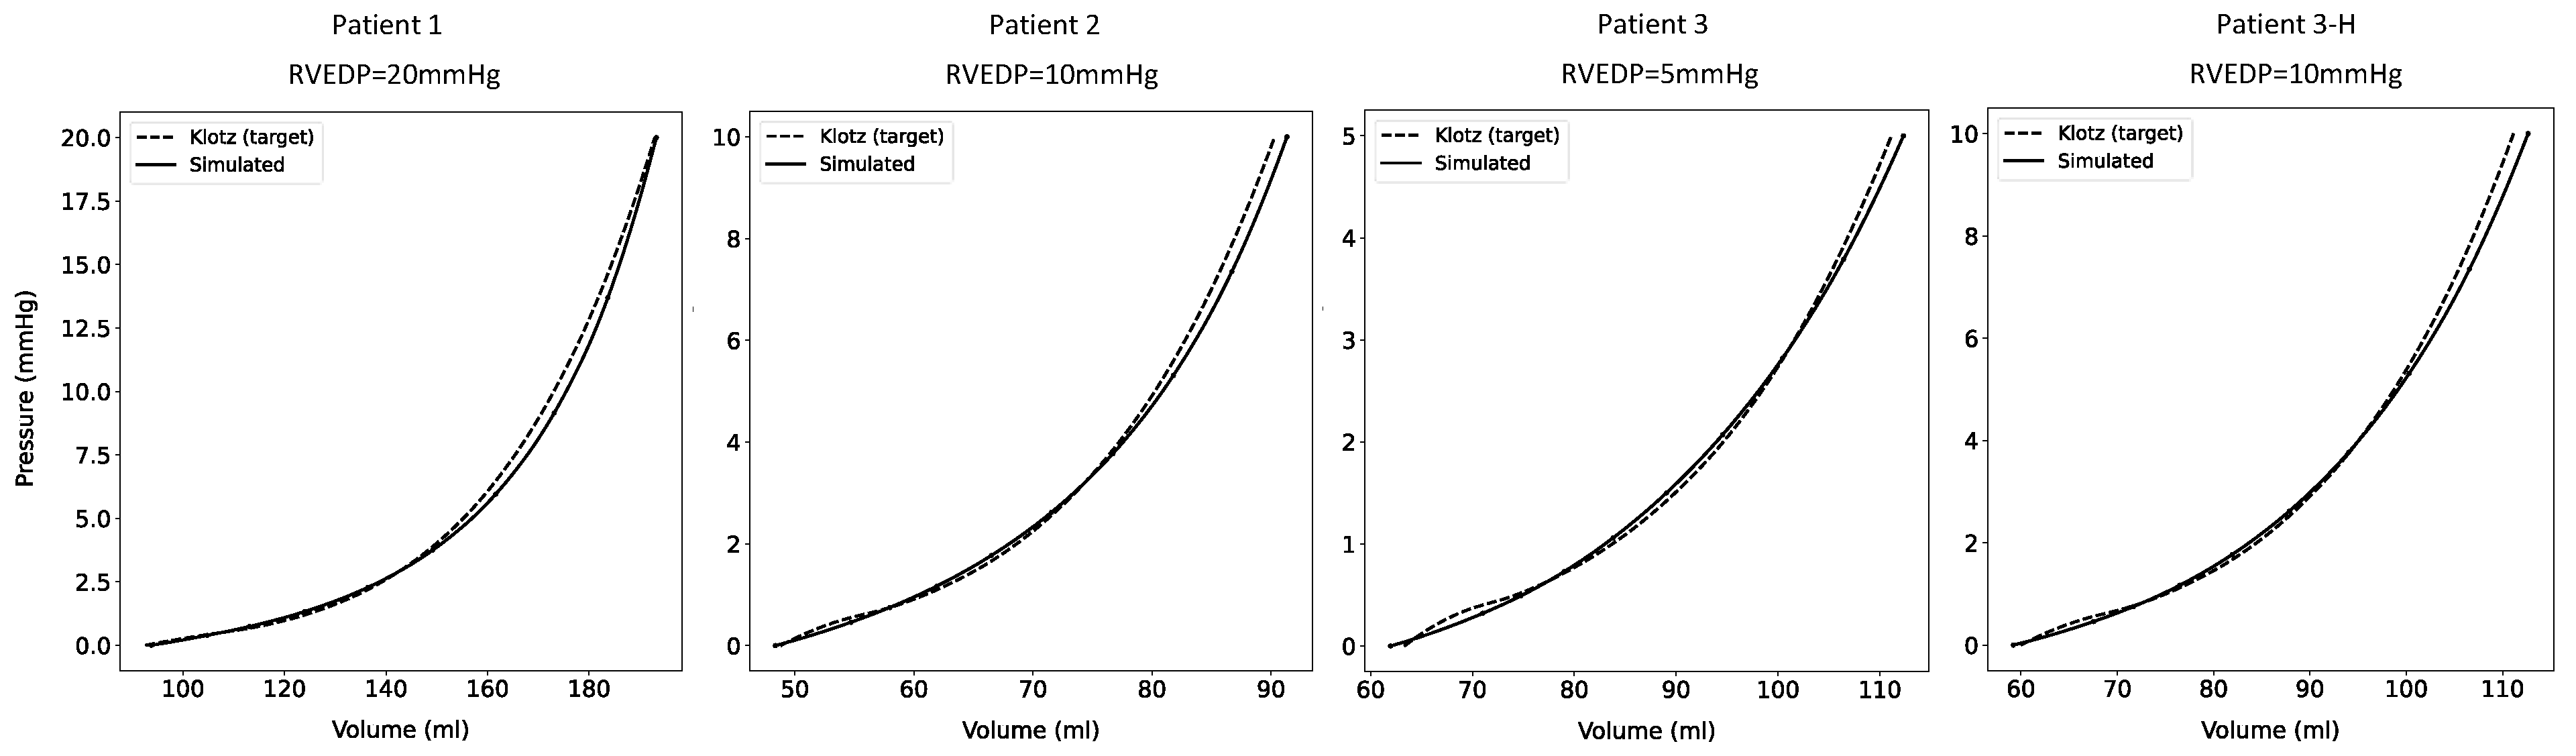
Figure 5.
dimensional surface plots display the relationship between restraint stiffness constant (), volume reduction ratio (), and optimized restraint thickness (). Color bars indicate the normalized root mean square deviations of RV volumes (NRMSDV), with blue indicating the most accurate results that closely match the target curves. The first row is produced from proportional reduction of the target RV EDPVR, while the second row illustrates optimized results using exponential reduction.
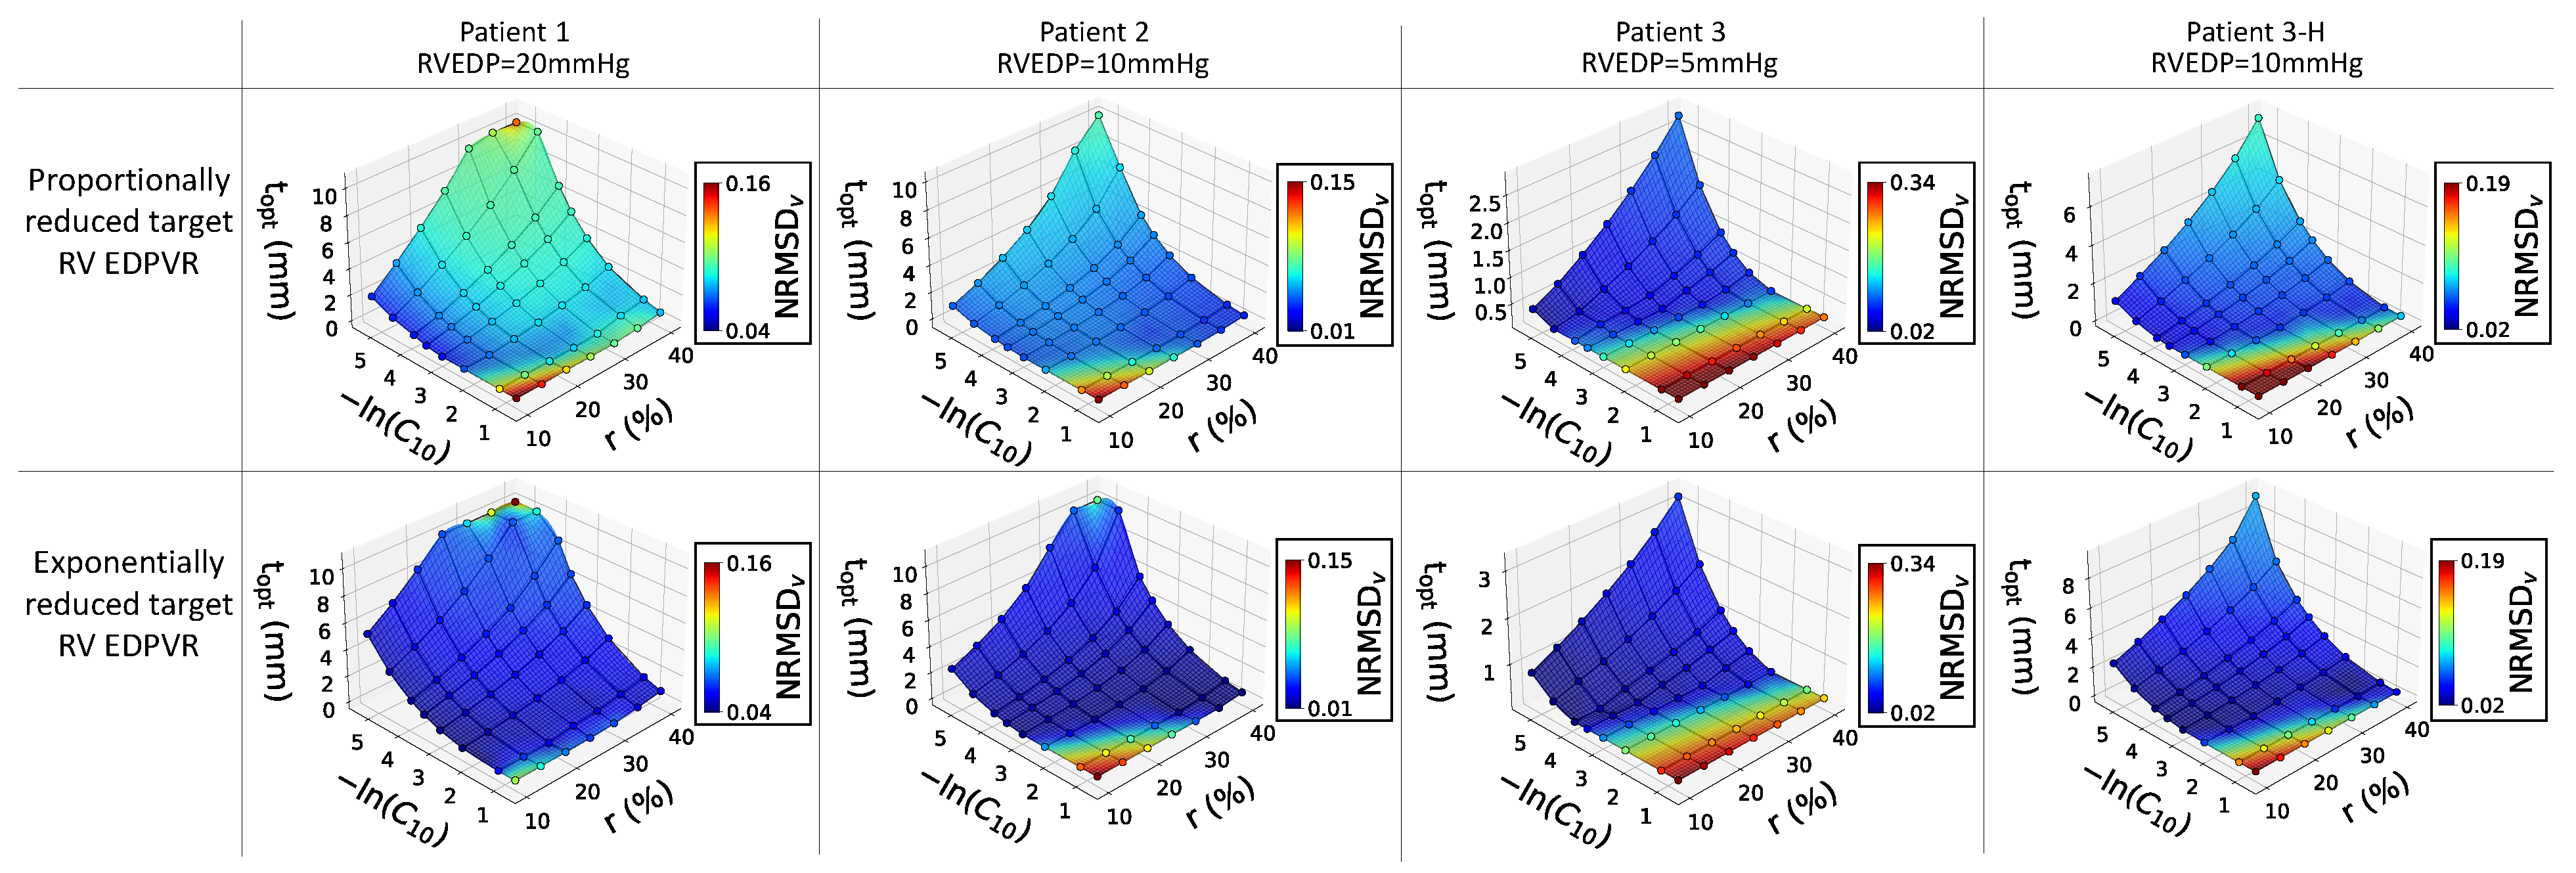
Figure 6.
The end-diastolic (ED) Cauchy stress and the Green strain in the fiber direction (represented as and , respectively) for patient 2 at different target volume reductions () with MPa.
Figure 6.
The end-diastolic (ED) Cauchy stress and the Green strain in the fiber direction (represented as and , respectively) for patient 2 at different target volume reductions () with MPa.
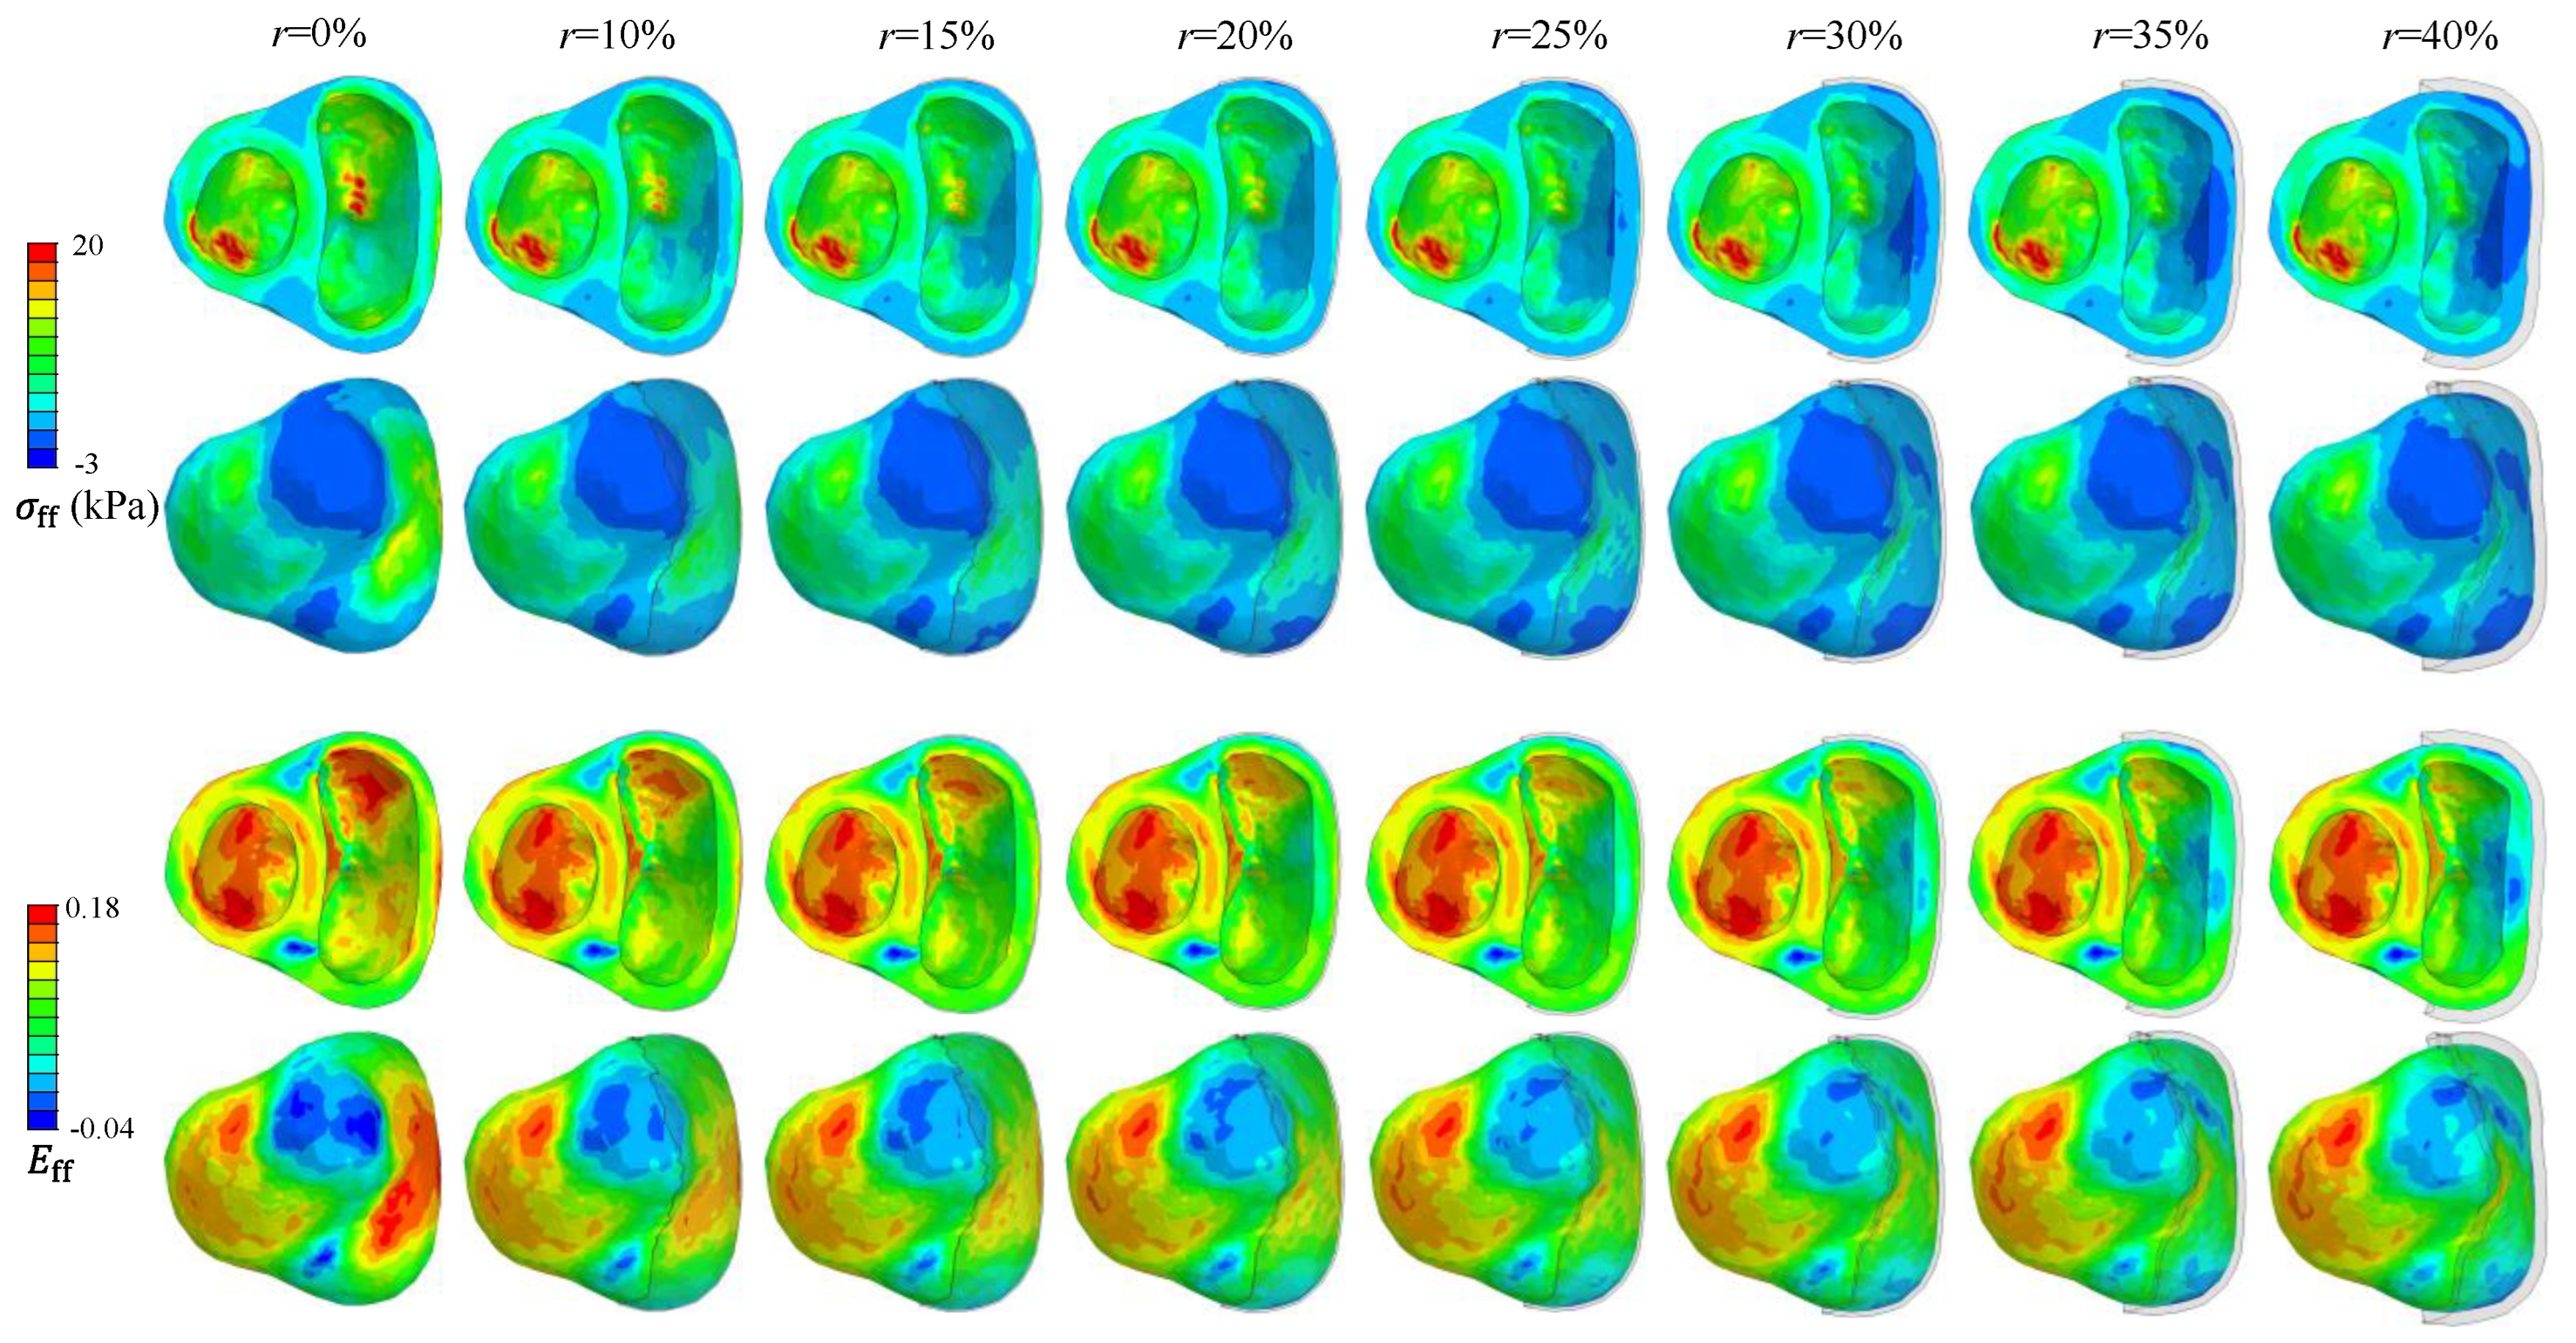

Table 1.
Specifications of the computational biventricular finite element models.
| Model | LVEDV (ml) | RVEDV (ml) | LVEDP (mmHg) | RVEDP (mmHg) | Nodes | Elements |
| Patient 1 | 57.16 | 192.96 | 20.9 | 20 | 12592 | 56512 |
| Patient 2 | 56.38 | 90.30 | 22 | 10 | 11499 | 53368 |
| Patient 3 | 205 | 111.13 | 23.88 | 5 | 15869 | 71849 |
| Patient 3-H | 205 | 111.13 | 23.88 | 10 | 15869 | 71849 |
Table 2.
The computational times and number of iterations, the estimated mechanical properties of the myocardium (, ), and the normalized root mean squared deviation of the passive RV volumes (NRMSDV).
Table 2.
The computational times and number of iterations, the estimated mechanical properties of the myocardium (, ), and the normalized root mean squared deviation of the passive RV volumes (NRMSDV).
| Unloading | Shape-material estimations | Restraint optimizations | |||||||||
| Case | Average unloading time (minutes) | Simulated (ml) | Material estimation iterations | NRMSDV | Shape-material estimation time (minutes) | Average restrained loading time (minutes) | Average restraint optimization time (minutes) | Average restraint optimization iterations | Average total time (minutes) | ||
| Patient 1 | 10.13 | 93.76 | 61 | 2.48 | 1.46 | 0.01892 | 652.86 | 2.84 | 90.03 | 31 | 742.89 |
| Patient 2 | 5.80 | 48.36 | 64 | 0.96 | 0.81 | 0.0196 | 392.19 | 2.78 | 86.43 | 32 | 478.62 |
| Patient 3 | 11.05 | 61.95 | 46 | 1.19 | 0.51 | 0.02492 | 687.84 | 4.22 | 144.05 | 34 | 831.89 |
| Patient 3-H | 8.82 | 59.20 | 67 | 2.79 | 0.67 | 0.01926 | 600.61 | 4.56 | 149.10 | 34 | 749.71 |
Disclaimer/Publisher’s Note: The statements, opinions and data contained in all publications are solely those of the individual author(s) and contributor(s) and not of MDPI and/or the editor(s). MDPI and/or the editor(s) disclaim responsibility for any injury to people or property resulting from any ideas, methods, instructions or products referred to in the content. |
© 2025 by the authors. Licensee MDPI, Basel, Switzerland. This article is an open access article distributed under the terms and conditions of the Creative Commons Attribution (CC BY) license (http://creativecommons.org/licenses/by/4.0/).
Copyright: This open access article is published under a Creative Commons CC BY 4.0 license, which permit the free download, distribution, and reuse, provided that the author and preprint are cited in any reuse.


