
Submitted:
12 May 2025
Posted:
15 May 2025
You are already at the latest version
Abstract
The initiation of ductile fracture in medium-strength AW5754 and high-strength AW6082 aluminum alloys at different quasi-static strain rates and under multiaxial stress states is investigated through a series of tensile tests using various specimen geometries. The sensitivity of the stress triaxiality locus to variations in loading rate is examined for these two aluminum alloy families. Numerical simulations based on the finite element method (FEM) are performed using ABAQUS/Standard to determine the actual stress triaxialities and equivalent plastic strains at fracture. The numerical approach is validated by comparing the simulation results with experimental findings. These simulations facilitate the generation of a stress triaxiality locus through a curve-fitting process. An exponential fitting function is employed to accurately relate the equivalent plastic strain at fracture to the corresponding stress state across different strain rates. The results reveal different strain-rate dependencies for the two alloys within a very low strain rate range. The resulting stress triaxiality loci provide a valuable tool for predicting fracture strains and for more accurately evaluating stress states. Overall, the findings of this study significantly advance the understanding of the fracture initiation behavior of aluminum alloys under multiaxial loading conditions and their sensitivity to various quasi-static loading rates.
Keywords:
Triaxiality locus
; strain rate sensitivity
; AW5754
; AW6082
; Multiaxial loading
; Tensile tests
; Fracture behavior
; Finite element model
1. Introduction
Medium- and high-strength aluminum alloys are widely used in various engineering applications, depending on specific requirements and desired material behaviors [1,2]. These materials are often subjected to complex multiaxial loading conditions, which can potentially lead to ductile fracture [3]. Accurately detecting initiation of the fracture within complex structures and estimating the corresponding failure loads are crucial for designers and engineers [4]. The mathematical models developed for these purposes should be simulated using accurate material properties. The determination of relevant material properties and the observation of ductile fracture behavior are typically conducted using standard tensile tests, which are the most commonly employed classical engineering experiments.
While determining uniaxial fracture strain through standard tensile tests using simple specimens is relatively straightforward, predicting multiaxial fracture behavior based on these tests presents considerable challenges. This complexity arises due to the intricate interactions between multiple stress components, material heterogeneity, and the varying deformation mechanisms under multiaxial loading conditions [5]. Additionally, the sensitivity and high cost of the experiments, the selection of appropriate specimen geome-tries, and especially the post-processing of results further increase the complexity of such problems [6]. However, solving this issue is of critical importance for accurately deter-mining the fracture behavior of structures operating under multiaxial loading conditions, particularly when considering the effect of strain rates.
The influence of strain rate on the fracture behavior of engineering structures is also a critical topic that researchers must consider [7]. Numerous studies have investigated the significant effects of varying strain rates on fracture behavior, particularly when comparing very high and very low strain rates (e.g., [8,9,10,11,12,13]). Notably, even slight variations at very low loading rates can lead to pronounced differences in certain materials. In this context, the need to understand how the multiaxial fracture behavior of medium- and high-strength aluminum alloys changes with slight variations in loading rate, particularly at very low strain rates, constitutes the primary motivation for this study.
The fracture strain obtained from standard tensile test specimens at a given loading rate may not accurately reflect the behavior under multiaxial loading conditions [14]. Therefore, establishing a stress triaxiality locus [15] is crucial to provide comprehensive insights into the fracture strain as a function of the material’s multiaxial stress state. To construct this locus, fracture points corresponding to different specimen geometries and loading conditions are identified, and fitting curves are derived through these points. De-pending on the specific case, the fracture points are typically determined from uniaxial or biaxial tensile or compressive test measurements [16,17].
To obtain a comprehensive triaxiality locus, experiments covering a range of stress states [15] at a constant strain rate are required. However, conducting tests for all data points within the locus can be an expensive process. Therefore, existing literature suggests performing a minimum of four tests—such as uniaxial tension, pure shear, combined shear-tension, and notched specimens—and fitting the results to derive the locus curve [18]. Similar analyses for different materials, including steels and aluminum alloys, are discussed in [15,16,19,20,21,22,23,24,25]. Additionally, Hong et al. [26] investigate the deformation and fracture behavior of 6061 aluminum alloy under varying stress triaxialities and examine the fracture mechanisms of tensile specimens. The influence of various stress states on the forming process and strength of Clinch Rivet joints made from AW5754 and AW6082 is studied in [27]. Ductile damage prediction for aluminum during cold forming is evaluated and compared with different damage models in [28]. Arslan and Haskul analyzed the stress triaxiality of the AW5754 aluminum alloy through quasi-static tensile tests without considering variations in the strain rate [25]. The stress-strain behaviors of 6xxx and 7xxx series aluminum alloys are examined over a broad strain rate range in [29], where no significant rate sensitivity is observed in 6xxx alloys, while moderate rate sensitivity is found in 7xxx alloys. The mechanical properties of 6082 and 7108 aluminum alloys at high strain rates are analyzed in [8], showing precipitation hardening and low strain rate sensitivity. Further studies on stress state effects on plastic behavior and ductile fracture of aluminum 5083 alloy are presented in [30], while the mechanical behavior of two variants of 5754 is examined using modified shear tests in [31]. The dynamic and fracture behavior of 6005 aluminum alloy under various stress rates and states is investigated in [19]. Finally, the sensitivity of Al6082-T6 aluminum alloy to factors like strain rate, heat treatment, and notch profiles is explored in [32], with findings showing increased yield stress and tensile strength at higher strain rates. While triaxiality analyses have been conducted for these two material families across various strain rates, their sensitivity to strain rate variations at quasi-steady-state strain rates still requires further investigation.
This study investigates the stress triaxiality of medium-strength AW5754 and high-strength AW6082 aluminum alloys to assess fracture strain under multi-axial loading conditions. The primary focus is on generating the triaxiality locus and examining the effect of strain rate on the onset of fracture. Specifically, this study targets low strain rates, particularly within the quasi-static loading range, and focuses exclusively on the tensile region of the triaxiality locus. The study aims to explore the sensitivity of the stress triaxiality locus to variations in loading rate for these two types of aluminum alloys.
To achieve the objectives of this study, uniaxial tensile tests at two distinct strain rates are performed using five different types of test specimens with varying geometries. The experimental data obtained are used to identify the initial fracture locations, establish correlations with the corresponding loads, and validate the finite element (FE) simulation results. Based on these test results, FE models are developed to determine data points for fracture strain and the stress triaxiality factor [33]. Subsequently, these data points are used in a curve-fitting process to generate stress triaxiality loci for the materials. An exponential curve-fitting function is applied to establish the relationship between equivalent plastic strain at fracture and the stress state for both AW5754 and AW6082 alloys.
2. Stress Triaxiality Locus
The triaxiality locus provides detailed insights into how the initation of material's fracture changes under different stress conditions. This locus, which graphically corre-lates the equivalent plastic strain to fracture with the stress triaxiality factor, is a valuable tool for understanding material fracture behavior across a wide range of stress states [34]. The stress triaxiality factor (η) is defined as [18]:
and denote the mean and Von Mises equivalent stresses, respectively, and are given by:
where are the principal stresses. On the other hand, the equivalent plastic strain to fracture for the corresponding stress triaxiality factor can be determined through experimental results and the use of the developed FE modeling.
A sample of the stress fracture locus is given in Figure 1. The figure illustrates different regions on the locus, each corresponding to a unique stress state. Within these regions, fracture points for various specimen geometries and loading conditions are identified, and curves are fitted through these points. The fracture points are determined based on uniaxial, biaxial tensile or compressive test measurements specific to each case.
3. Experiment and Simulations Methods
3.1. Experiment
Experiments using various specimen geometries were conducted to collect essential data for analysis and to support the development of the Finite Element (FE) model. The chemical compositions of the AW5754 and AW6082 aluminum alloys investigated in this study are presented in Table 1. Their elastic and hardening behaviors, particularly on fracture strain values, were evaluated through tensile tests performed at different strain rates. Two or three repeated tests were carried out under identical loading conditions to ensure the reliability of the results. The specimens with rectangular cross-sections were prepared with similar dimensions, featuring a total length of 122 mm, a width of 34 mm, and thicknesses of 3 mm (for AW5754) and 1.5 mm (for AW6082). Figure 2 presents a representative sample of the test specimens prepared for the experiments. These specimens were specifically designed to capture the tensile region of the stress triaxiality locus. Specimen I was used for uniaxial tension testing, Specimen II for identifying pure shear behavior, and Specimen III for representing combined tension-shear loading. Specimen IV, a V-notch specimen, was used to determine the fracture strain value in the high triaxiality region (see Figure 1), while Specimen V was designed as a central-hole specimen. The geometries and dimensions of all specimens are illustrated in Figure 3.
The tests were performed on two or three specimens for each specimen type, and the measurements were recorded. These tensile tests were conducted at two very low loading speeds. The gauge length was adjusted to ensure identical strain rates for all specimens, resulting in applied strain rates of 2×10⁻⁴ s⁻¹ and 4×10⁻⁴ s⁻¹ for each specimen. These load-ing speeds are considered representative of quasi-static loading conditions [35]. A Shi-madzu testing machine (see Figure 4) was used to apply an axial tensile load, and defor-mations at critical points on each specimen were measured using extensometers. During the tests, loading was applied until the complete fracture of each specimen, as the analysis specifically focuses on the fracture strain and the corresponding stress state. The fractured AW5754 specimens (tested at a strain rate of 2×10⁻⁴ s⁻¹) and AW6082 specimens (tested at a strain rate of 4×10⁻⁴ s⁻¹) are shown in Figure 5 and Figure 6, respectively, as a sample.
True stress and logarithmic strain values are calculated only for Specimen Type I, corresponding to the standard tensile test specimen, and are shown in Figure 7. Figure 7a presents the results for AW5754 at two different loading rates, with two repeated tests conducted for each rate. Figure 7b shows the results for AW6082 with three repeated tests for each of the two loading rates. For ease of comparison, the same axis scale is used in both figures. These plots also enable the determination of the modulus of elasticity and yield stress for each case. Additionally, the fracture point can be identified at the end of the loading phase in these figures. The test results further contribute to defining the stress–plastic strain relationship by capturing the hardening behavior of the alloys. The material data derived from the plastic regions of these tests are used in all FE simulations, including those for other specimen types. It is important to note that, while a true stress–strain curve can be obtained for Specimen I, calculating stresses and strains for the deformed geometries of other specimen types without FE modeling is challenging. Therefore, force–displacement curves (measured between extensometers) are plotted for Specimens II–V in Figure 10, Figure 11 and Figure 12. These data are employed to validate the FE models and to identify fracture points in the respective specimens. To avoid repetition, these data are presented in Section 3.2 as part of the comparison with the FE simulation results.
3.2. Finite Element Models
It is essential to determine the equivalent plastic strain at fracture and the evolution of the stress triaxiality factor in order to define the triaxiality locus of the material. Alt-hough initial values for these parameters can be theoretically estimated for simple speci-men types using certain assumptions [19], a more accurate and realistic representation re-quires finite element (FE) analysis due to the highly nonlinear deformation behavior of the material under multiaxial loading, particularly beyond the onset of necking. FE models for each specimen type and loading scenario were developed in ABAQUS [36]. The accuracy of these models was first validated by comparison with corresponding test results. Once validated, the models were used to compute the equivalent plastic strain at fracture and the associated stress triaxiality factor at the regions where fracture initiates.
Figure 8a–e presents the FE models for Specimen Types I–V, respectively. The refer-ence points shown in the figures represent the control nodes of the models, through which a monotonically increasing axial displacement is applied along the x-direction. These points are kinematically coupled to the loading surfaces, which simulate the contact in-terface between the specimen and the grips of the tensile testing machine used in the ex-periments. This coupling ensures a uniform distribution of the applied displacement across the surface. Additionally, identifying the fracture measurement point—which in-dicates the location where fracture initiates—is critical for each specimen type. The triaxi-ality factor and equivalent plastic strain at fracture are calculated at these measurement regions in the FE analysis.
For all specimens, the FE models were constructed using a three-dimensional, 8-node linear brick element with reduced integration and hourglass control (C3D8R) in ABAQUS. This element type provides a good balance between computational efficiency and numer-ical accuracy, particularly for problems involving large deformations. The reduced inte-gration scheme minimizes computational cost, while the hourglass control helps prevent numerical instabilities typically associated with under-integrated elements [37].
For Specimen types I, IV, and V (Figure 8a, 8d, and 8e, respectively), symmetric models were used to improve computational efficiency, as these specimens exhibit one or two planes of symmetry, which are indicated in the figures. For the remaining specimens (II and III), the surfaces on which displacement constraints were applied are also high-lighted.
The elastic modulus, yield stress, and nonlinear hardening behavior of the materials were defined for all specimen types based on the data shown in Figure 7a and 7b, which were originally obtained from tests on Specimen Type I. It should be noted that the devel-oped FE models do not incorporate a damage model and, as such, are unable to predict the onset of fracture. Consequently, fracture initiation points are determined through ex-periment data and are used as termination criteria for the simulations.
Various output parameters were extracted during the simulations, as will be discussed in the following section. As an illustrative example, Figure 9a–e shows the distributions of equivalent plastic strain at the time of fracture, determined based on the corresponding experimental results.
3.3. FE Simulation Validation and Fracture Initiation
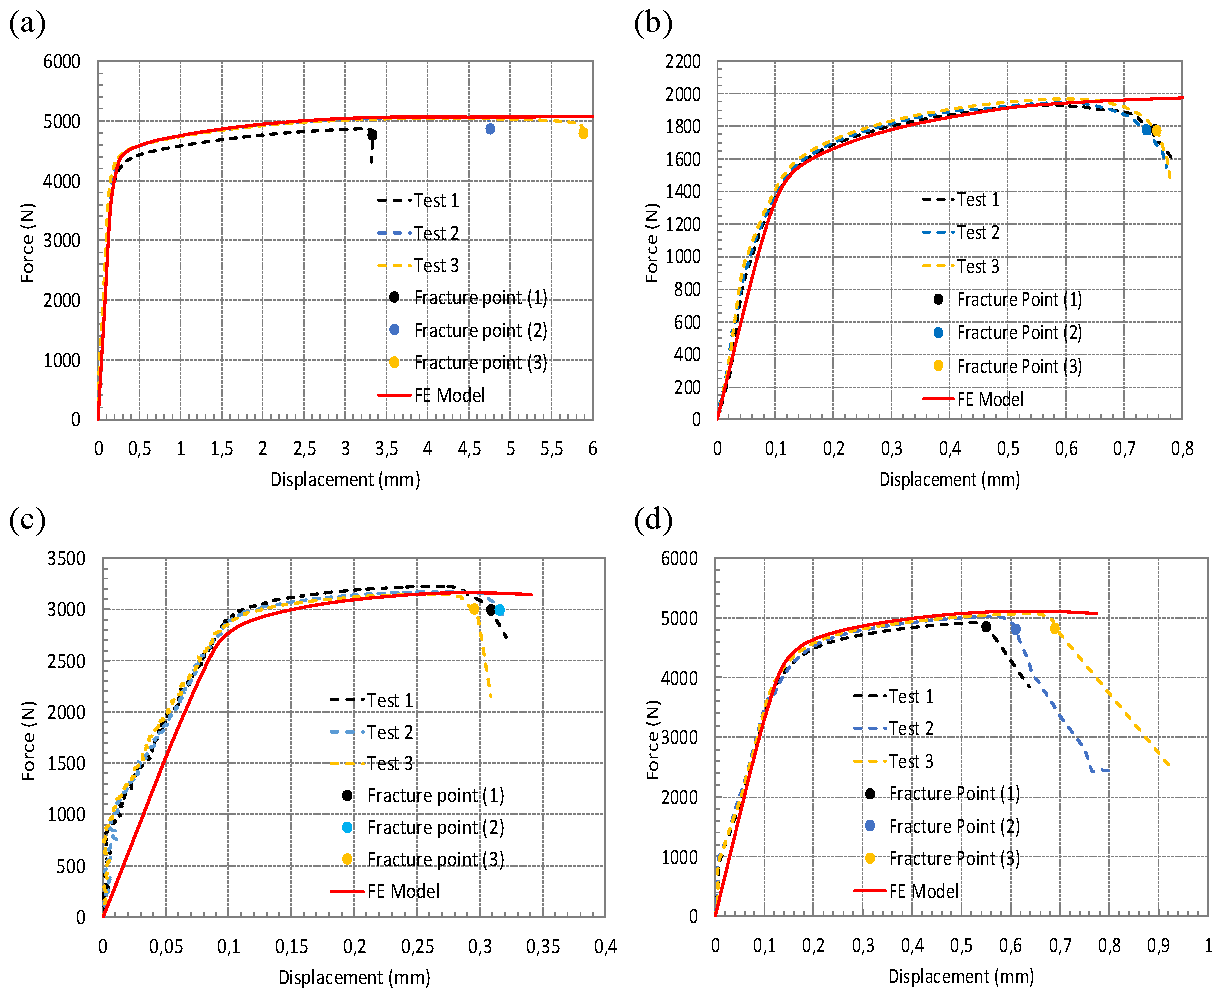
Finite element (FE) simulations were performed, and the resulting force–displacement curves were compared with the experimental data, as shown in Figure 10, Figure 11 and Figure 12. These figures correspond to the material AW5754 tested at 2×10⁻⁴ s⁻¹, AW6082 tested at 2×10⁻⁴ s⁻¹ and 4×10⁻⁴ s⁻¹, respectively. A similar comparison for AW5754 at 4×10⁻⁴ s⁻¹ has already been presented in [25]; therefore, it is not repeated here. In each figure, dashed lines represent the experimental data, while solid lines correspond to the FE simulation results. It should also be noted that for AW6082 tested at 4×10⁻⁴ s⁻¹, the test results for Specimen III were excluded from the analysis due to significant experimental errors.
The experimental force–displacement data reflect the force applied and the axial de-formation measured by the extensometer. In the FE models, displacements were extracted from the same locations as those used in the experiments to ensure a direct and meaning-ful comparison. These simulation results are plotted alongside the experimental data in the figures.
Overall, the FE simulations show good agreement with the experimental results, confirming the validity of the models. It is important to emphasize that the current FE models do not incorporate any damage formulation; therefore, they are incapable of predicting the onset of fracture. Instead, fracture initiation points were identified experimentally, and these locations were used as termination criteria in the simulations. Following this validation, the FE models were utilized to establish the relationship between the equivalent plastic strain at fracture and the corresponding stress triaxiality factor.
Figure 10.
Comparison of test data and FE Simulations at defined fracture points for (a) Specimen I, (b) Specimen II, (c) Specimen III, (d) Specimen IV, and (e) Specimen V for AW5754 at 2×10⁻⁴ s⁻¹.
Figure 10.
Comparison of test data and FE Simulations at defined fracture points for (a) Specimen I, (b) Specimen II, (c) Specimen III, (d) Specimen IV, and (e) Specimen V for AW5754 at 2×10⁻⁴ s⁻¹.
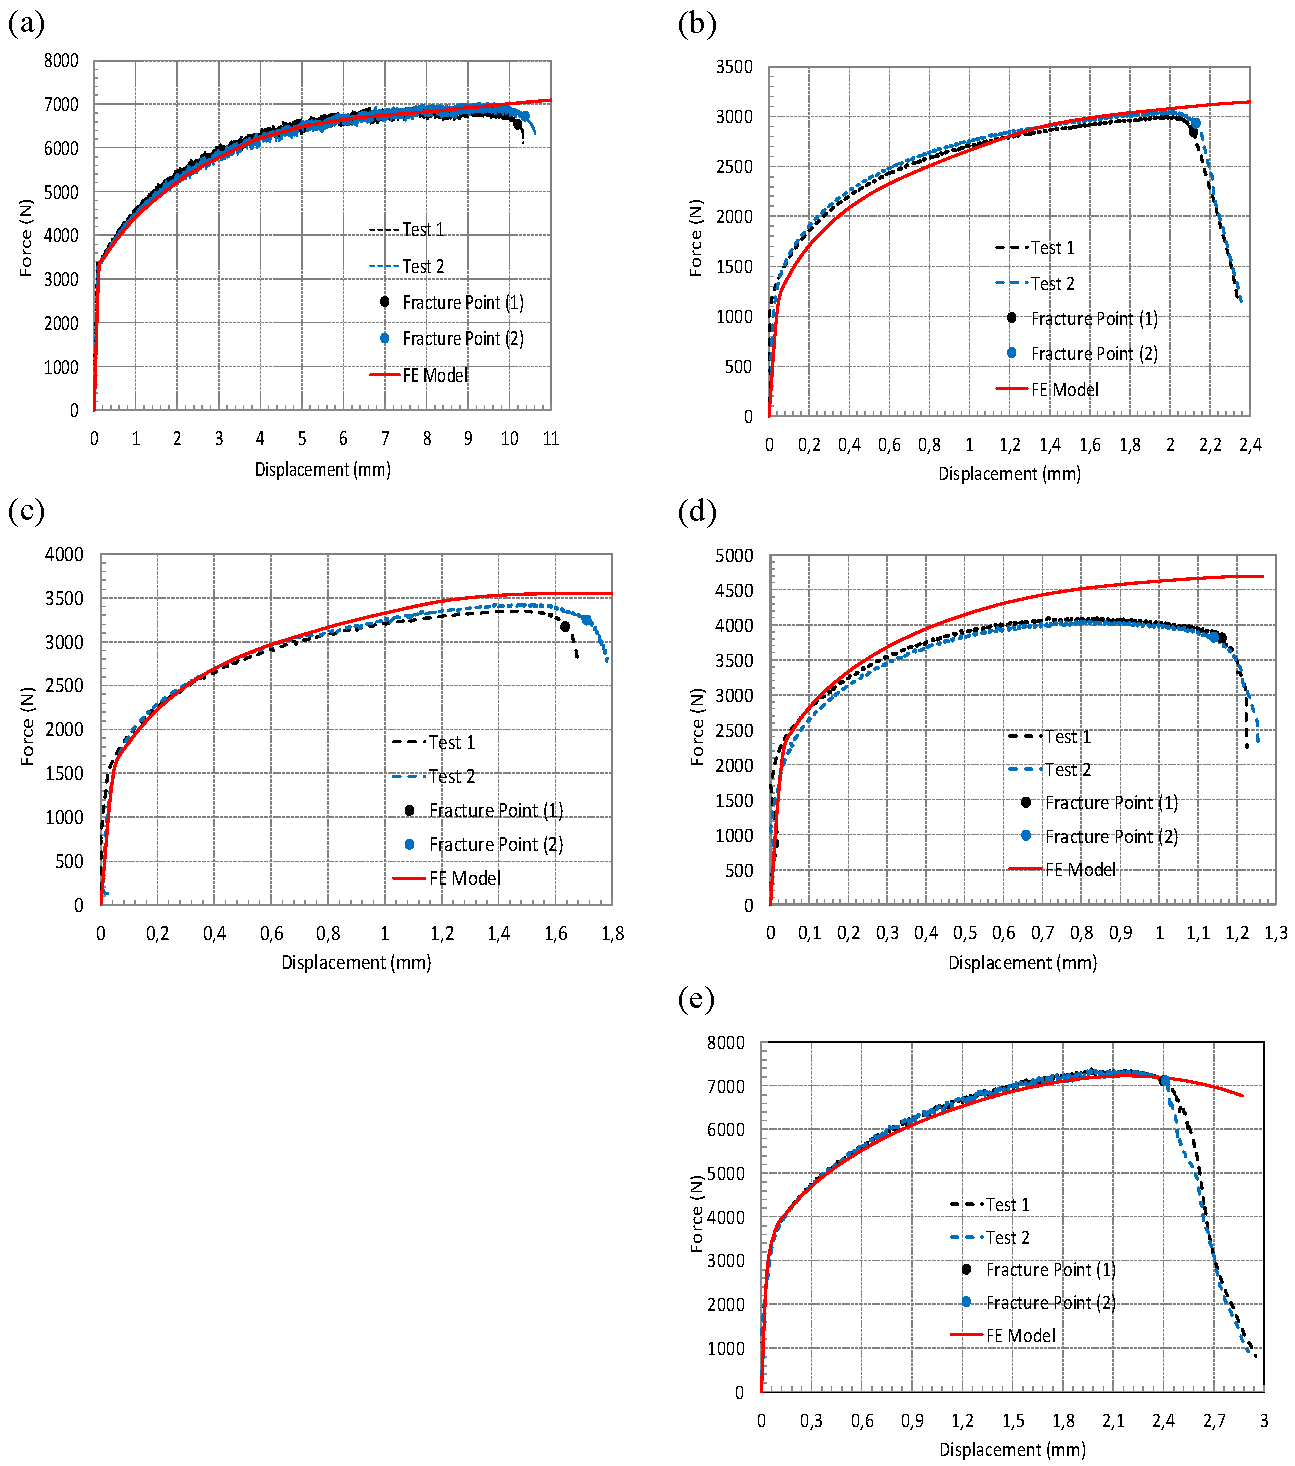
Figure 11.
Comparison of test data and FE Simulations at defined fracture points for (a) Specimen I, (b) Specimen II, (c) Specimen III, (d) Specimen IV, and (e) Specimen V for AW6082 at 2×10⁻⁴ s⁻¹.
Figure 11.
Comparison of test data and FE Simulations at defined fracture points for (a) Specimen I, (b) Specimen II, (c) Specimen III, (d) Specimen IV, and (e) Specimen V for AW6082 at 2×10⁻⁴ s⁻¹.
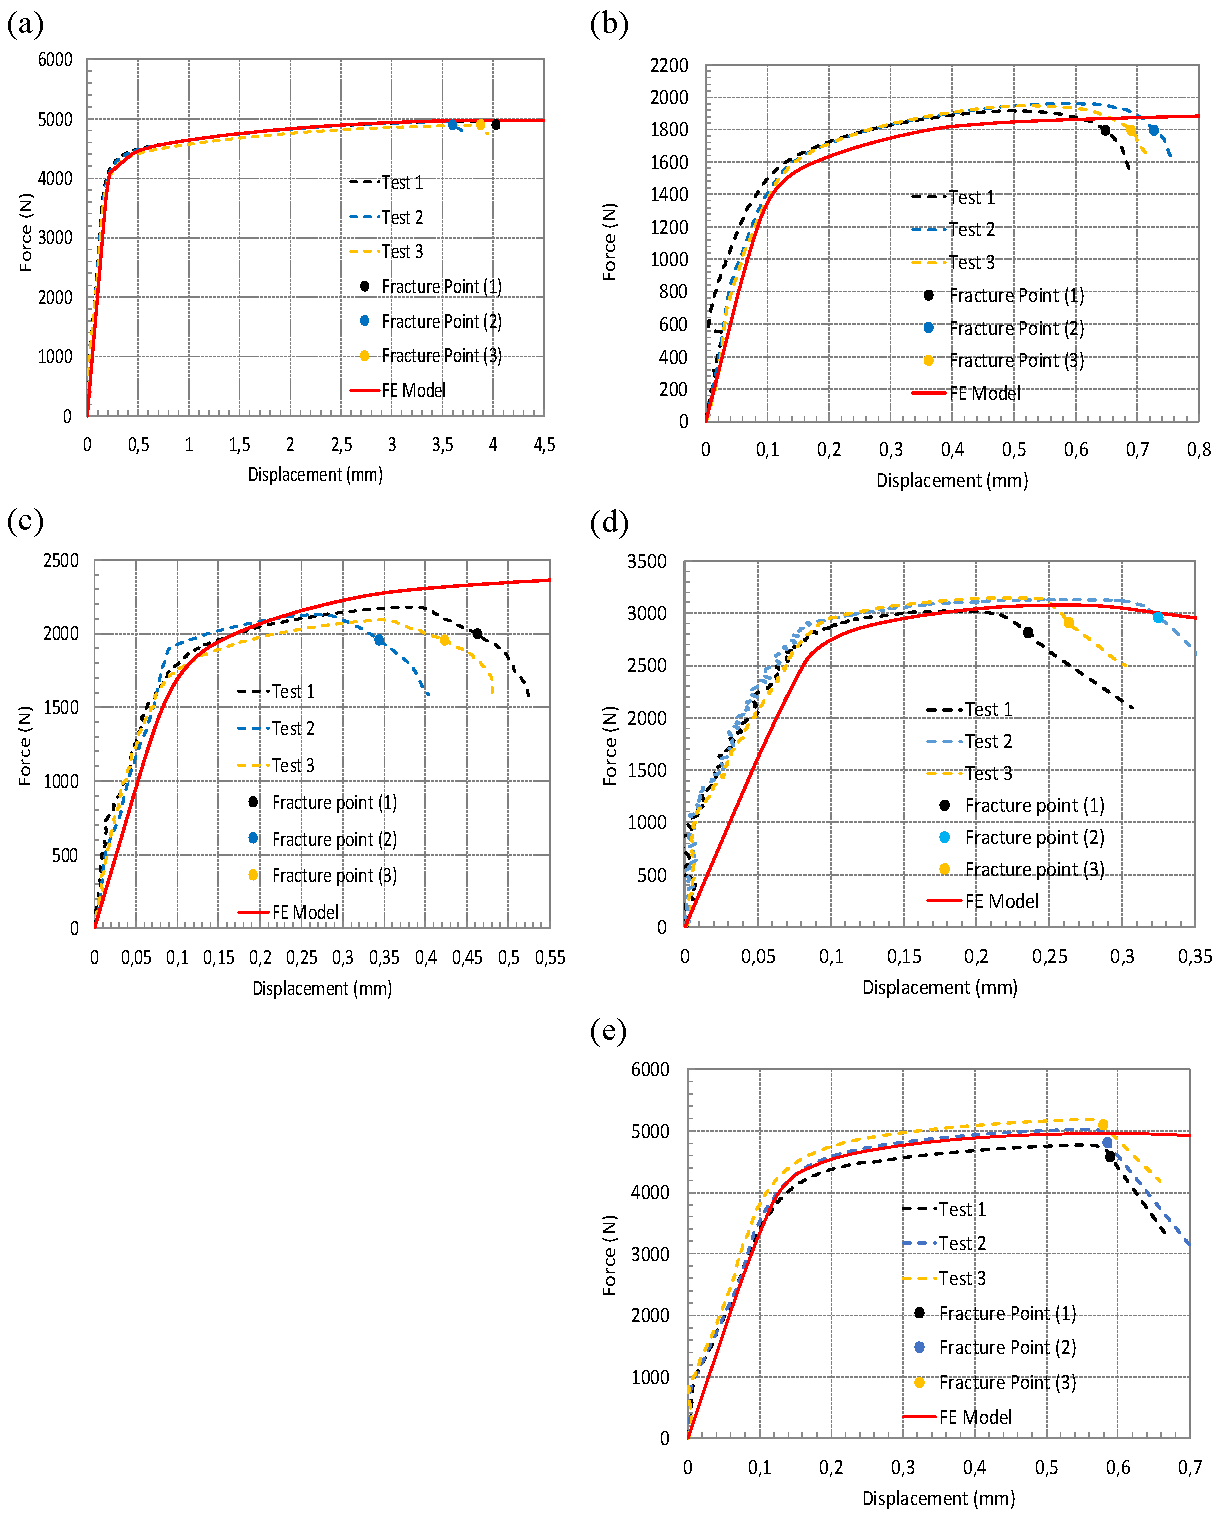
Figure 12.
Comparison of test data and FE Simulations at defined fracture points for (a) Specimen I, (b) Specimen II, (c) Specimen IV, and (d) Specimen V for AW6082 at 4×10⁻⁴ s⁻¹.
Figure 12.
Comparison of test data and FE Simulations at defined fracture points for (a) Specimen I, (b) Specimen II, (c) Specimen IV, and (d) Specimen V for AW6082 at 4×10⁻⁴ s⁻¹.
4. Determination of Triaxiality Loci
The evolutions of equivalent plastic strains and stress triaxiality factors for each specimen type are determined in the FE models up to the fracture points, which are determined by comparing the simulation results with the experimental data presented in Figure 10, Figure 11 and Figure 12. Based on this, the calculated simulation results, including the equivalent plastic strains and stress triaxiality factors, are presented in Figure 13(a-c) for AW5754 (at 2×10⁻⁴ s⁻¹), AW6082 (at 2×10⁻⁴ s⁻¹ and 4×10⁻⁴ s⁻¹), respectively. In Addition, this relationship for AW5754 at 4×10⁻⁴ s⁻¹ was provided in [25].
To develop a continuous curve representing the triaxiality locus, the fracture points for each specimen, shown in Figure 13a-c, are subjected to a curve-fitting procedure. Numerous mathematical functions for curve fitting to obtain the triaxiality locus have been proposed in the literature [18]. However, it is essential to emphasize that the selection of these functions is influenced by the material properties and its characteristic response under various loading conditions. In this study, an exponential curve-fitting function is adopted, as it effectively captures the relationship between the equivalent plastic strain at fracture and the stress state for the AW5754 and AW6082 alloys. The fracture points depicted in Figure 13a-c are used together with the following exponential function for the fitting procedure [18,24,38] to determine the equivalent plastic strain at fracture as a function of stress triaxiality factor η:
where are constants to be determined. The values of these constants are computed by minimizing the total error between the fitted curve and the fracture data points. The resulting curve, representing the triaxiality locus, is illustrated in Figure 13a-c as a red solid line.
Finally, the stress triaxiality loci obtained for different strain rates of AW5754 (dashed lines) and AW6082 (solid lines) are compared in Figure 14. This figure clearly illustrates the relationship between strain rate and fracture behavior of the two materials under mul-tiaxial loading conditions. Comparing the stress triaxiality loci of both aluminum alloys indicates that AW5754 generally exhibits higher equivalent plastic strain values at frac-ture compared to AW6082 across most of the stress triaxiality range. For both materials, an increase in strain rate leads to a higher equivalent plastic strain required for fracture initiation. However, this increase is more pronounced for AW5754, indicating a higher strain rate sensitivity compared to AW6082. It should be emphasized that all tests and simulations were conducted within the quasi-static strain rate regime.
5. Conclusions
This study aims to develop stress triaxiality loci to investigate fracture initiation behavior under multiaxial loading for medium-strength (AW5754) and high-strength (AW6082) aluminum alloys, using experimental data and finite element (FE) simulations. The resulting loci are used to examine the strain rate sensitivity of fracture behavior in these two types of aluminum alloys under very low loading rate conditions. To achieve this, uniaxial tensile tests were conducted on five distinct specimen geometries at two quasi-static loading rates. The experimental results were used to determine the critical load at fracture initiation, extract the necessary material parameters, and validate the corresponding FE simulations. Following validation, the equivalent plastic strain and stress triaxiality factor at fracture were extracted from the simulations. An exponential fitting function was applied to construct continuous triaxiality curves, which were subsequently compared across different strain rates to assess the influence of loading rate on fracture behavior.
The exponential fitting function provides a good representation of the relationship between equivalent plastic strain at fracture and stress triaxiality factor for both materials. In the region of low stress triaxiality factor (), which corresponds to shear-dominated loading conditions, both alloys show relatively high equivalent plastic strain values at fracture. As the triaxiality factor increases toward tension-dominated conditions (), the equivalent plastic strain decreases exponentially, which aligns with established theories of ductile fracture.
The comparison of the stress triaxiality loci for both aluminum alloys reveals that AW5754 generally exhibits higher equivalent plastic strain at fracture than AW6082 across most of the stress triaxiality range. Even under quasi-steady-state loading conditions, slight variations in strain rate can influence the fracture behavior of these materials to varying degrees. Both medium- and high-strength aluminum alloys can demonstrate increased resistance to fracture with rising loading rates. However, under loading conditions near the quasi-static regime, high-strength aluminum alloys exhibit very low strain rate sensitivity in the variation of equivalent plastic strain at fracture under multiaxial stress states. In contrast, medium-strength alloys show a more pronounced strain rate sensitivity in their fracture initiation behavior.
The stress triaxiality loci developed in this study serve as valuable tools for predicting fracture in structures made of AW5754 and AW6082 aluminum alloys subjected to complex loading conditions. These findings enhance the understanding of fracture behavior in aluminum alloys under multiaxial loading at quasi-steady-state strain rates and provide essential data for the development and calibration of damage models for these materials.
Author Contributions
M. Haskul contributed to the preparation of all test specimens, the execution of mechanical experiments, the processing of test results for model input, the implementation of the FE simulations, and the writing of the manuscript. E. Arslan contributed to the development of the FE model, the evaluation of simulation results, the formulation of the mathematical model for the stress triaxiality locus, and the writing of the manuscript.
Funding
This study is financially supported by Sirnak University (under the project number 2022.FNAP.06.05.02). Open access funding provided by TU Wien.
Acknowledgments
The authors acknowledge TU Wien Library for financial support through its Open Access Funding Program.
Conflicts of Interest
The authors declare that they have no known competing financial interests or personal relationships that could have appeared to influence the work reported in this paper.
References
- Jones, D. R.; Ashby, M. F. Engineering materials 2: An introduction to microstructures and processing, 4th ed.; Butterworth-Heinemann, Oxford, USA, 2012.
- Trzepieciński, T.; Najm, S. M.; Oleksik, V.; Vasilca, D.; Paniti, I.; Szpunar, M. Recent developments and future challenges in incremental sheet forming of aluminium and aluminium alloy sheets. Metals 2022, 12(1), 124.
- Foti, P.; Razavi, N.; Fatemi, A.; Berto, F. Multiaxial fatigue of additively manufactured metallic components: A review of the failure mechanisms and fatigue life prediction methodologies. Prog. Mater. Sci. 2023, 137, 101126.
- Rolfe, S. T.; Barsom, J. M. Fracture and fatigue control in structures: Applications of fracture mechanics, ASTM International, 1977.
- Baral, M.; Korkolis, Y. P. Ductile fracture under proportional and non-proportional multiaxial loading. Int. J. Solids Struct. 2021, 210, 88-108.
- Lian, Y.; Wu, F.; Zhao, Q.; Han, Y.; Wang, B. Multiaxial failure behavior and fatigue life prediction of unidirectional composit laminates. Compos. Sci. Technol. 2024, 247, 110430.
- Cui, J.; Wang, S.; Wang, S.; Li, G.; Wang, P.; Liang, C. The effects of strain rates on mechanical properties and failure behavior of long glass fiber reinforced thermoplastic composites. Polym. 2019, 11(12), 2019.
- Oosterkamp, L. D.; Ivankovic, A.; Venizelos, G. High strain rate properties of selected aluminium alloys. Mater. Sci. Eng. A 2000, 278(1-2), 225-235.
- Ma, H.; Huang, L.; Tian, Y.; Li, J. Effects of strain rate on dynamic mechanical behavior and microstructure evolution of 5A02-O aluminum alloy. Mater. Sci. Eng. A 2014, 606, 233-239.
- Chen, X.; Peng, Y.; Peng, S.; Yao, S.; Chen, C.; Xu, P. Flow and fracture behavior of aluminum alloy 6082-T6 at different tensile strain rates and triaxialities. PloS one 2017, 12(7), e0181983.
- Sharma, S. M.; Mishra, K.; Rodriguez, O.; Whittington, W. R.; Allison, P.; Bhat, S. P.; Gokhale, A.M.; Thadhani, N. N. Effects of Strain Rate on Mechanical Properties and Fracture Mechanisms in a Dual Phase Steel. In Dynamic Behavior of Materials, Volume 1: Proceedings of the 2017 Annual Conference on Experimental and Applied Mechanics (pp. 209-216). Springer International Publishing, 2018.
- Zhou, J.; Hayden, M.; Gao, X. An investigation of the strain rate and temperature effects on the plastic flow stress and ductile failure strain of aluminum alloys 5083-H116, 6082-T6 and a 5183 weld metal. Proc. Inst. Mech. Eng. C 2013, 227(5), 883-895.
- Li, P.; Siviour, C. R.; Petrinic, N. The effect of strain rate, specimen geometry and lubrication on responses of aluminium AA2024 in uniaxial compression experiments. Exp. Mech. 2009, 49, 587-593.
- Brünig, M.; Brenner, D.; Gerke, S. Stress state dependence of ductile damage and fracture behavior: experiments and numerical simulations. Eng. Fract. Mech. 2015, 141, 152-169.
- Bao, Y.; Wierzbicki, T. On fracture locus in the equivalent strain and stress triaxiality space. Int. J. Mech. Sci. 2004, 46(1), 81-98.
- Kõrgesaar, M. The effect of low stress triaxialities and deformation paths on ductile fracture simulations of large shell structures. Mar. Struct. 2019, 63, 45-64.
- Mehari, Z. A.; Han, J. Numerical prediction of ductile fracture during the partial heating roll forming process of DP980. Int. J. Fract. 2022, 234(1), 97-112.
- Asadi, M.; Haji Aboutalebi, F.; Poursina, M. A comparative study of six fracture loci for DIN1623 St12 steel to predict strip tearing in a tandem cold rolling mill. Arch. Appl. Mech. 2021, 91, 1859-1878.
- Peng, Y.; Chen, X.; Peng, S.; Chen, C.; Li, J.; Liu, G. Strain Rate-Dependent Constitutive and Low Stress Triaxiality Fracture Behavior Investigation of 6005 Al Alloy. Adv. Mater. Sci. Eng. 2018, 1, 2712937.
- Kõrgesaar, M.; Romanoff, J.; Remes, H.; Palokangas, P. Experimental and numerical penetration response of laser-welded stiffened panels. Int. J. Impact Eng. 2018, 114, 78-92.
- Zhou, L.; Wen, H. A new dynamic plasticity and failure model for metals. Metals 2019, 9(8), 905.
- Mae, H.; Teng, X.; Bai, Y.; Wierzbicki, T. Comparison of ductile fracture properties of aluminum castings: Sand mold vs. metal mold. Int. J. Solids Struct. 2008, 45(5), 1430-1444.
- Fraccaroli, L.; Mastrone, M. N.; Concli, F. Calibration of the fracture locus of an AlSi10 aluminum alloy. High Performance and Optimum Design of Structures and Materials IV, Hernandez, S. De Wilde, W.P. Sejnoha, M.; WIT Press: Southampton, UK, 2020, 3-10.
- Mae, H.; Teng, X.; Bai, Y.; Wierzbicki, T. Ductile fracture locus of AC4CH-T6 cast aluminium alloy. Arch. Comput. Mater. Sci. Surf. Eng. 2009, 1(2), 100-105.
- Arslan, E.; Haskul, M. Fracture behavior prediction of a high-strength aluminum alloy under multiaxial loading. In Proceedings of the 9th World Congress on Mechanical, Chemical, and Material Engineering, London, UK, (August 2023), 143-1.
- Hong, T.; Ding, F.; Chen, F.; Zhang, H.; Zeng, Q.; Wang, J. Study on the fracture behaviour of 6061 aluminum alloy extruded tube during different stress conditions. Crystals 2023, 13(3), 489.
- Mucha, J.; Kaščák, Ľ.; Witkowski, W. Research on the influence of the AW 5754 aluminum alloy state condition and sheet arrangements with AW 6082 aluminum alloy on the forming process and strength of the ClinchRivet joints. Materials 2021, 14(11), 2980.
- Amer, M.; Shazly, M.; Mohamed, M.; Hegazy, A. A. Ductile damage prediction of AA 5754 sheet during cold forming condition. J. Mech. Sci. Technol. 2020, 34, 4219-4228.
- Chen, Y.; Clausen, A. H.; Hopperstad, O. S.; Langseth, M. Stress–strain behaviour of aluminium alloys at a wide range of strain rates. Int. J. Solids Struct. 2009, 46(21), 3825-3835.
- Gao, X.; Zhang, T.; Hayden, M.; Roe, C. Effects of the stress state on plasticity and ductile failure of an aluminum 5083 alloy. Int. J. Plast. 2009, 25(12), 2366-2382.
- Kang, J.; Wilkinson, D. S.; Wu, P. D.; Bruhis, M.; Jain, M.; Embury, J. D.; Mishra, R. K. Constitutive behavior of AA5754 sheet materials at large strains. J. Eng. Mater. Technol. 2008, 130(3), 031004.
- Sagar, S.; Singh, N. K.; Maurya, N. S. Strain rate behaviour and notch sensitivity of Aluminium 6082-T6 alloy under tensile loads. UPB Sci. Bull. Series B 2023, 85(1).
- Andrade, F.; Conde, S.; Feucht, M.; Helbig, M.; Haufe, A. Estimation of stress triaxiality from optically measured strain fields. In Proceedings of the 12th European LS-DYNA Conference, Koblenz, Germany (May 2019).
- Bridgman, P. W. Studies in large plastic flow and fracture: with special emphasis on the effects of hydrostatic pressure. Harvard University Press, 1964.
- ASTM International Committee E-28 on Mechanical Testing. Standard test methods for tension testing of metallic materials. ASTM international, 2021.
- Dassault Systèmes, ABAQUS 2022 Documentation. Providence, RI, USA: Dassault Systèmes Simulia Corp., 2022.
- Lapidus, L.; Pinder, G.F. Numerical solution of partial differential equations in science and engineering. John Wiley & Sons: New York, USA, 1982.
- Abushawashi, Y.; Xiao, X.; Astakhov, V. A novel approach for determining material constitutive parameters for a wide range of triaxiality under plane strain loading conditions. Int. J. Mech. Sci. 2013, 74, 133-142.
Figure 1.
A sample of the stress triaxiality locus for a ductile material [25].
Figure 1.
A sample of the stress triaxiality locus for a ductile material [25].
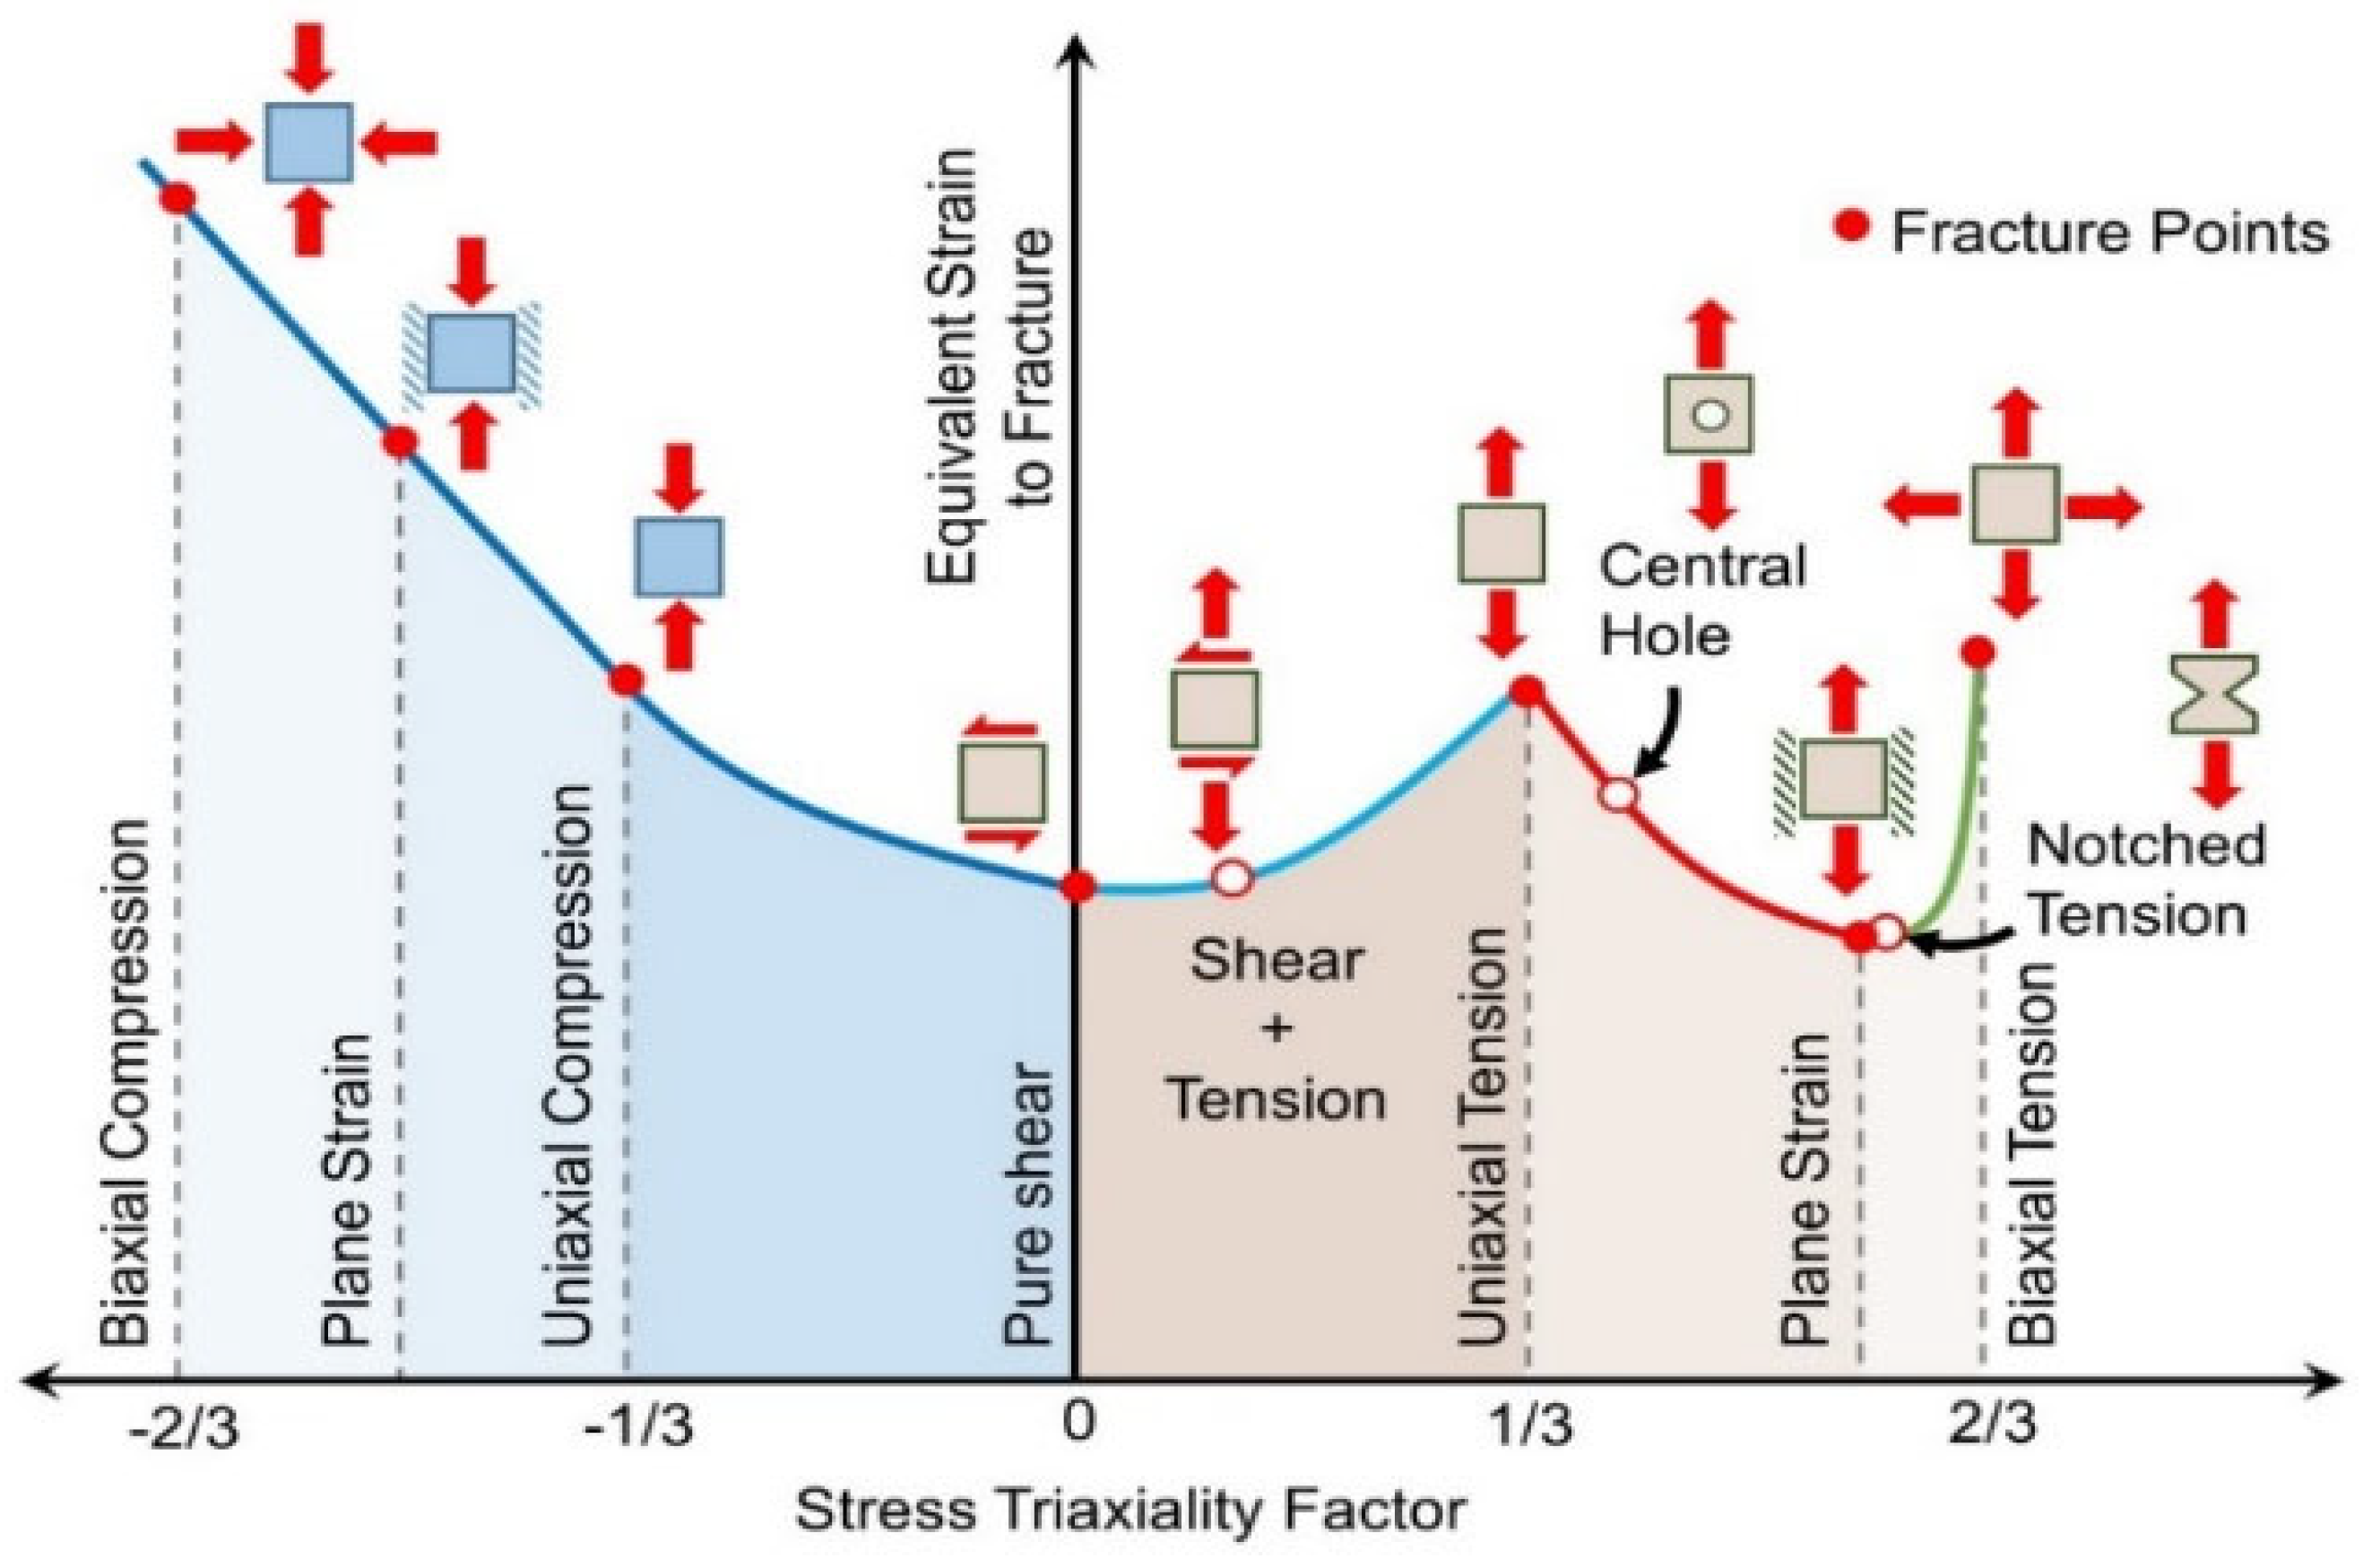
Figure 2.
Aluminum test specimen types prepared for the experiments.
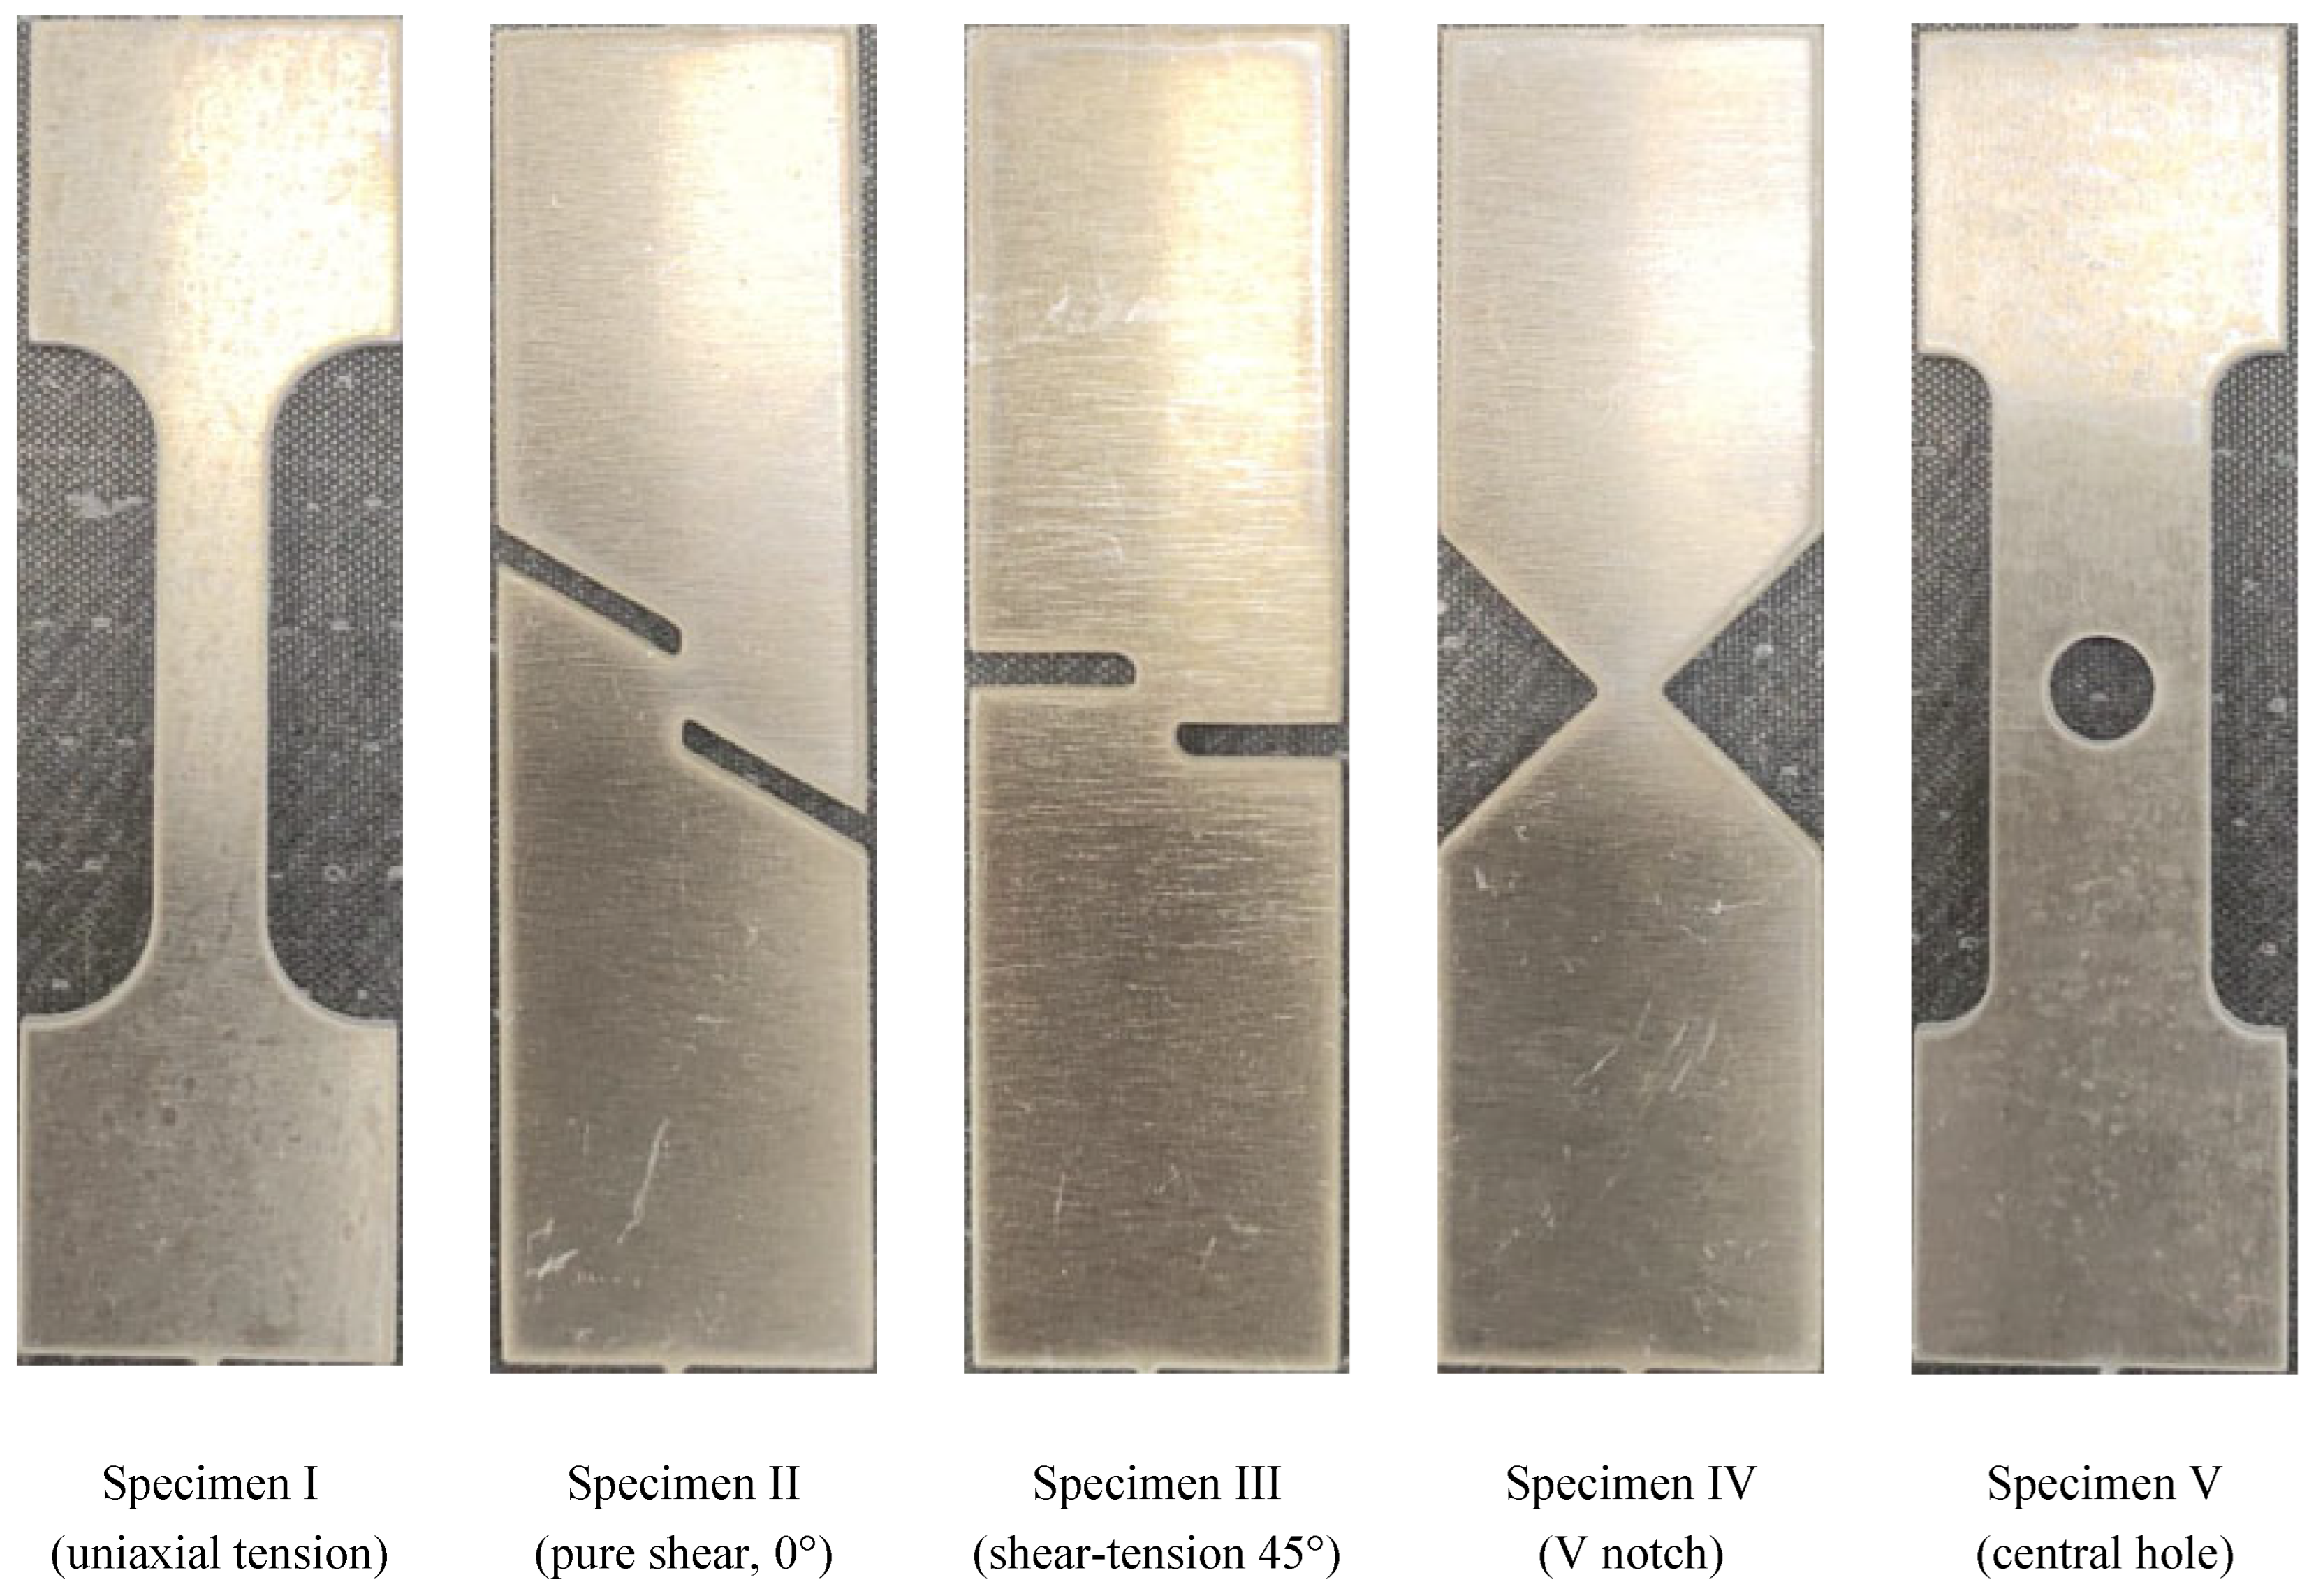
Figure 3.
Geometry and dimensions of the specimen types used in the experiments.
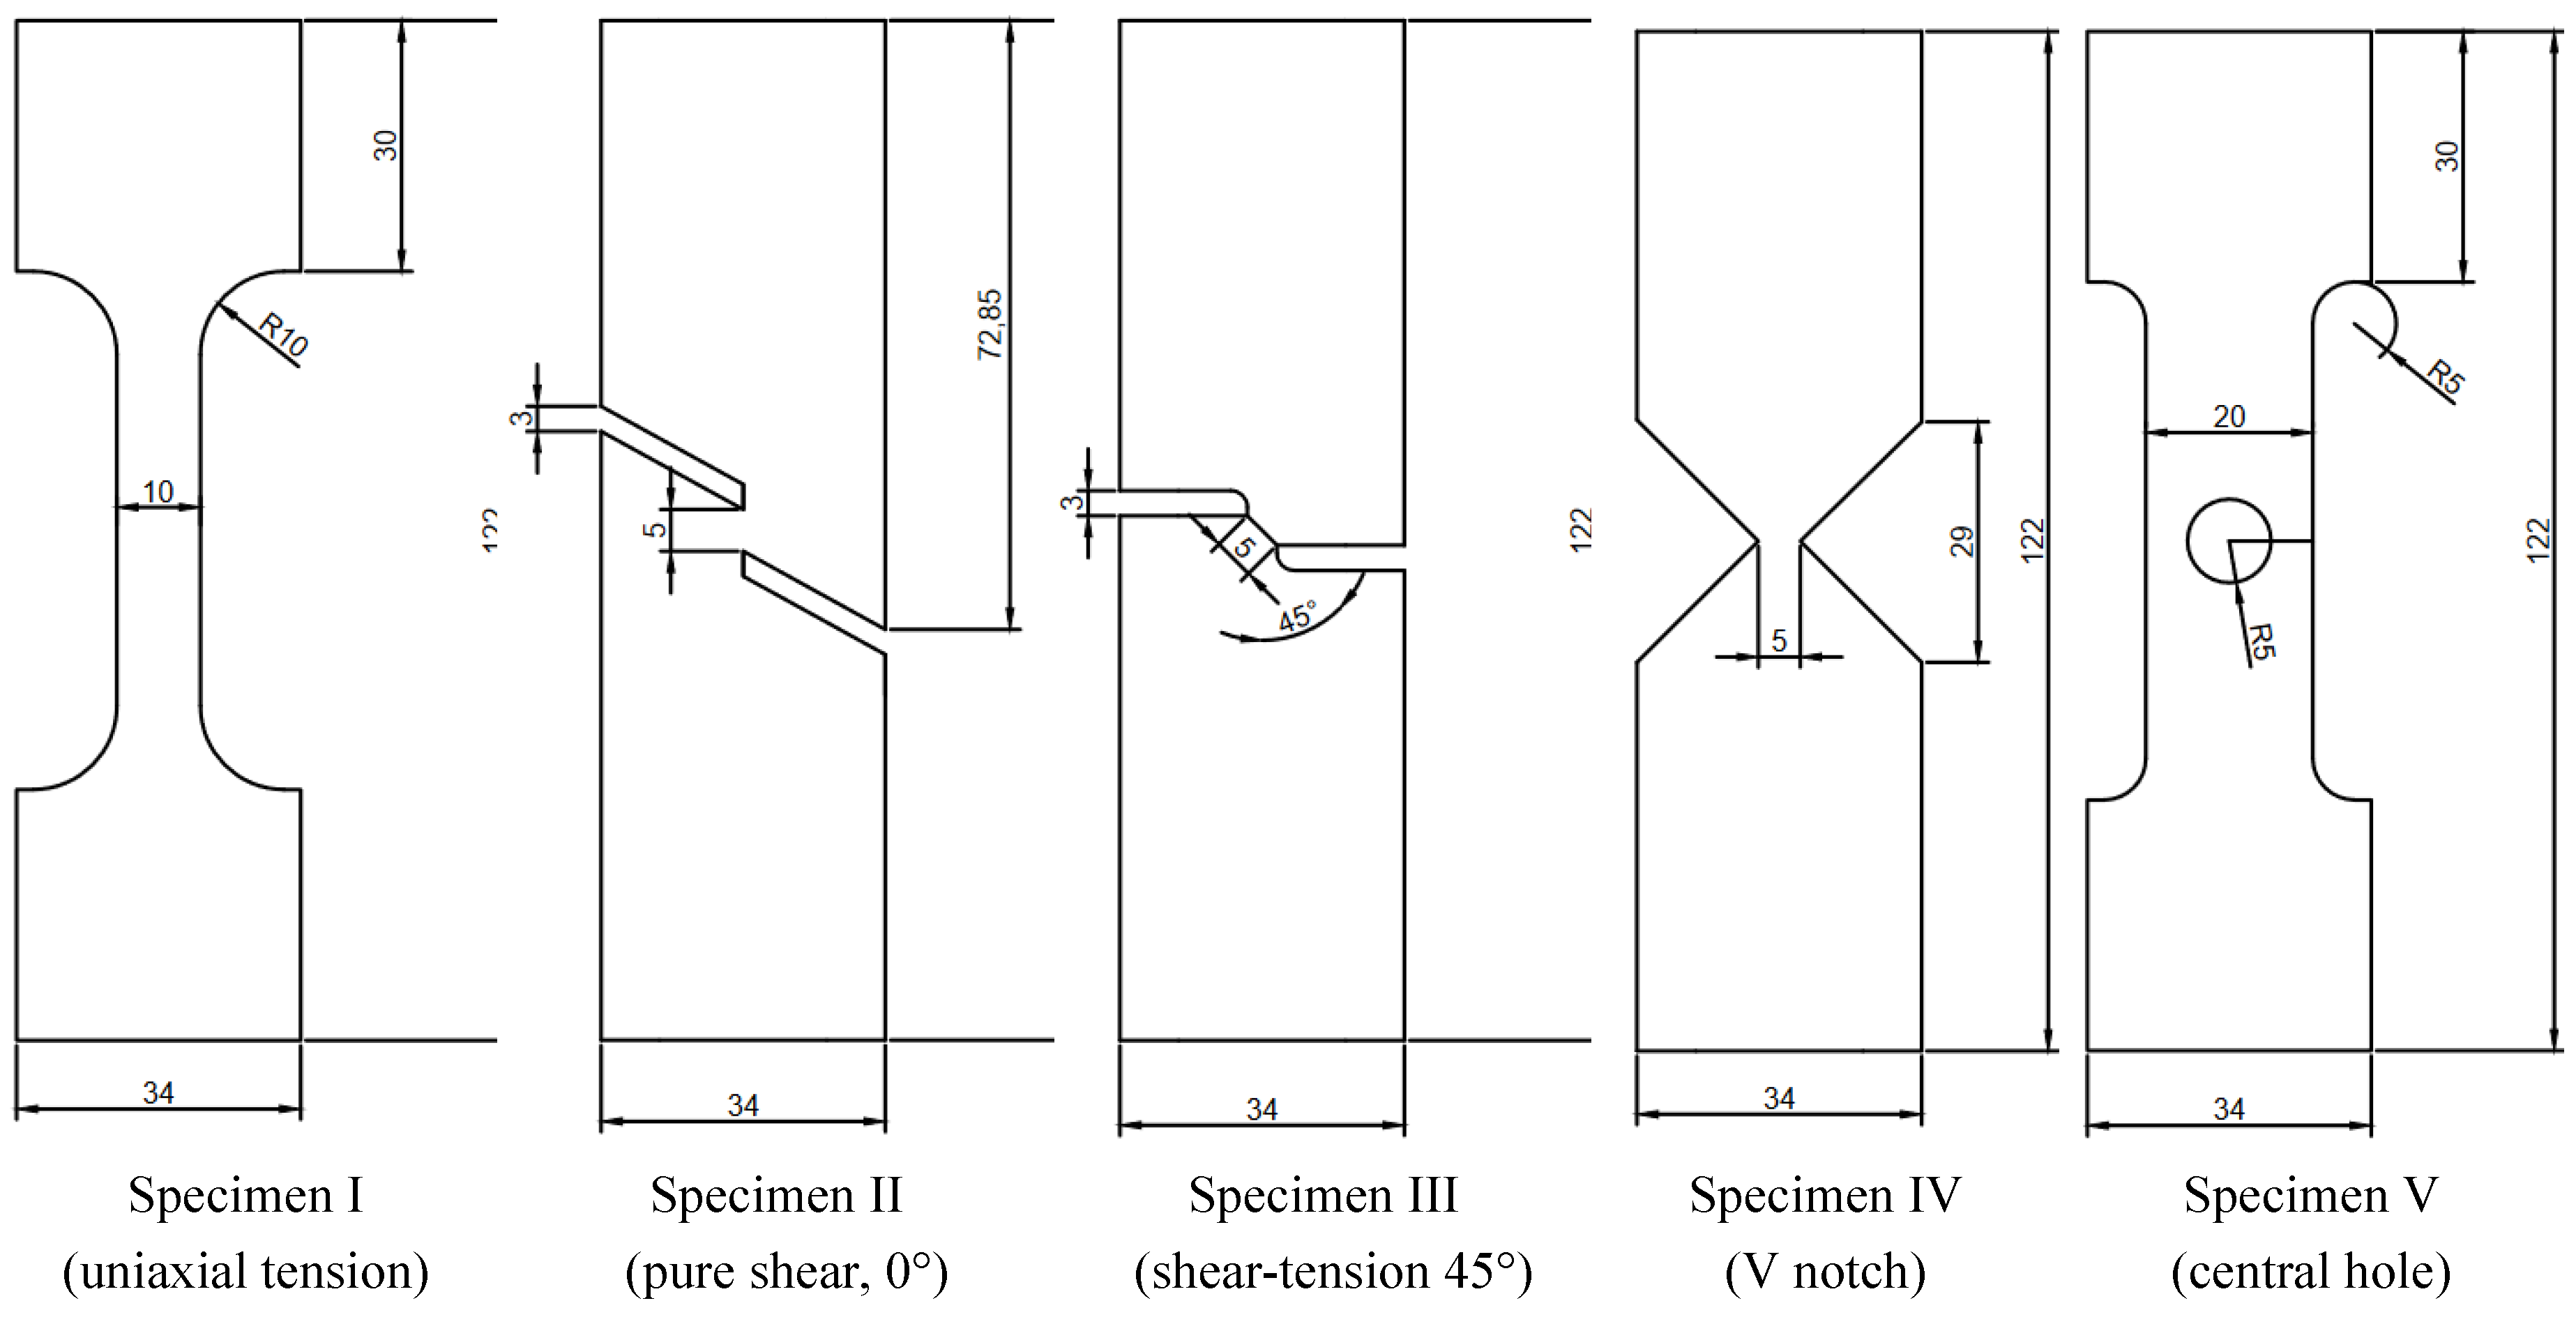
Figure 4.
Tensile testing machine.
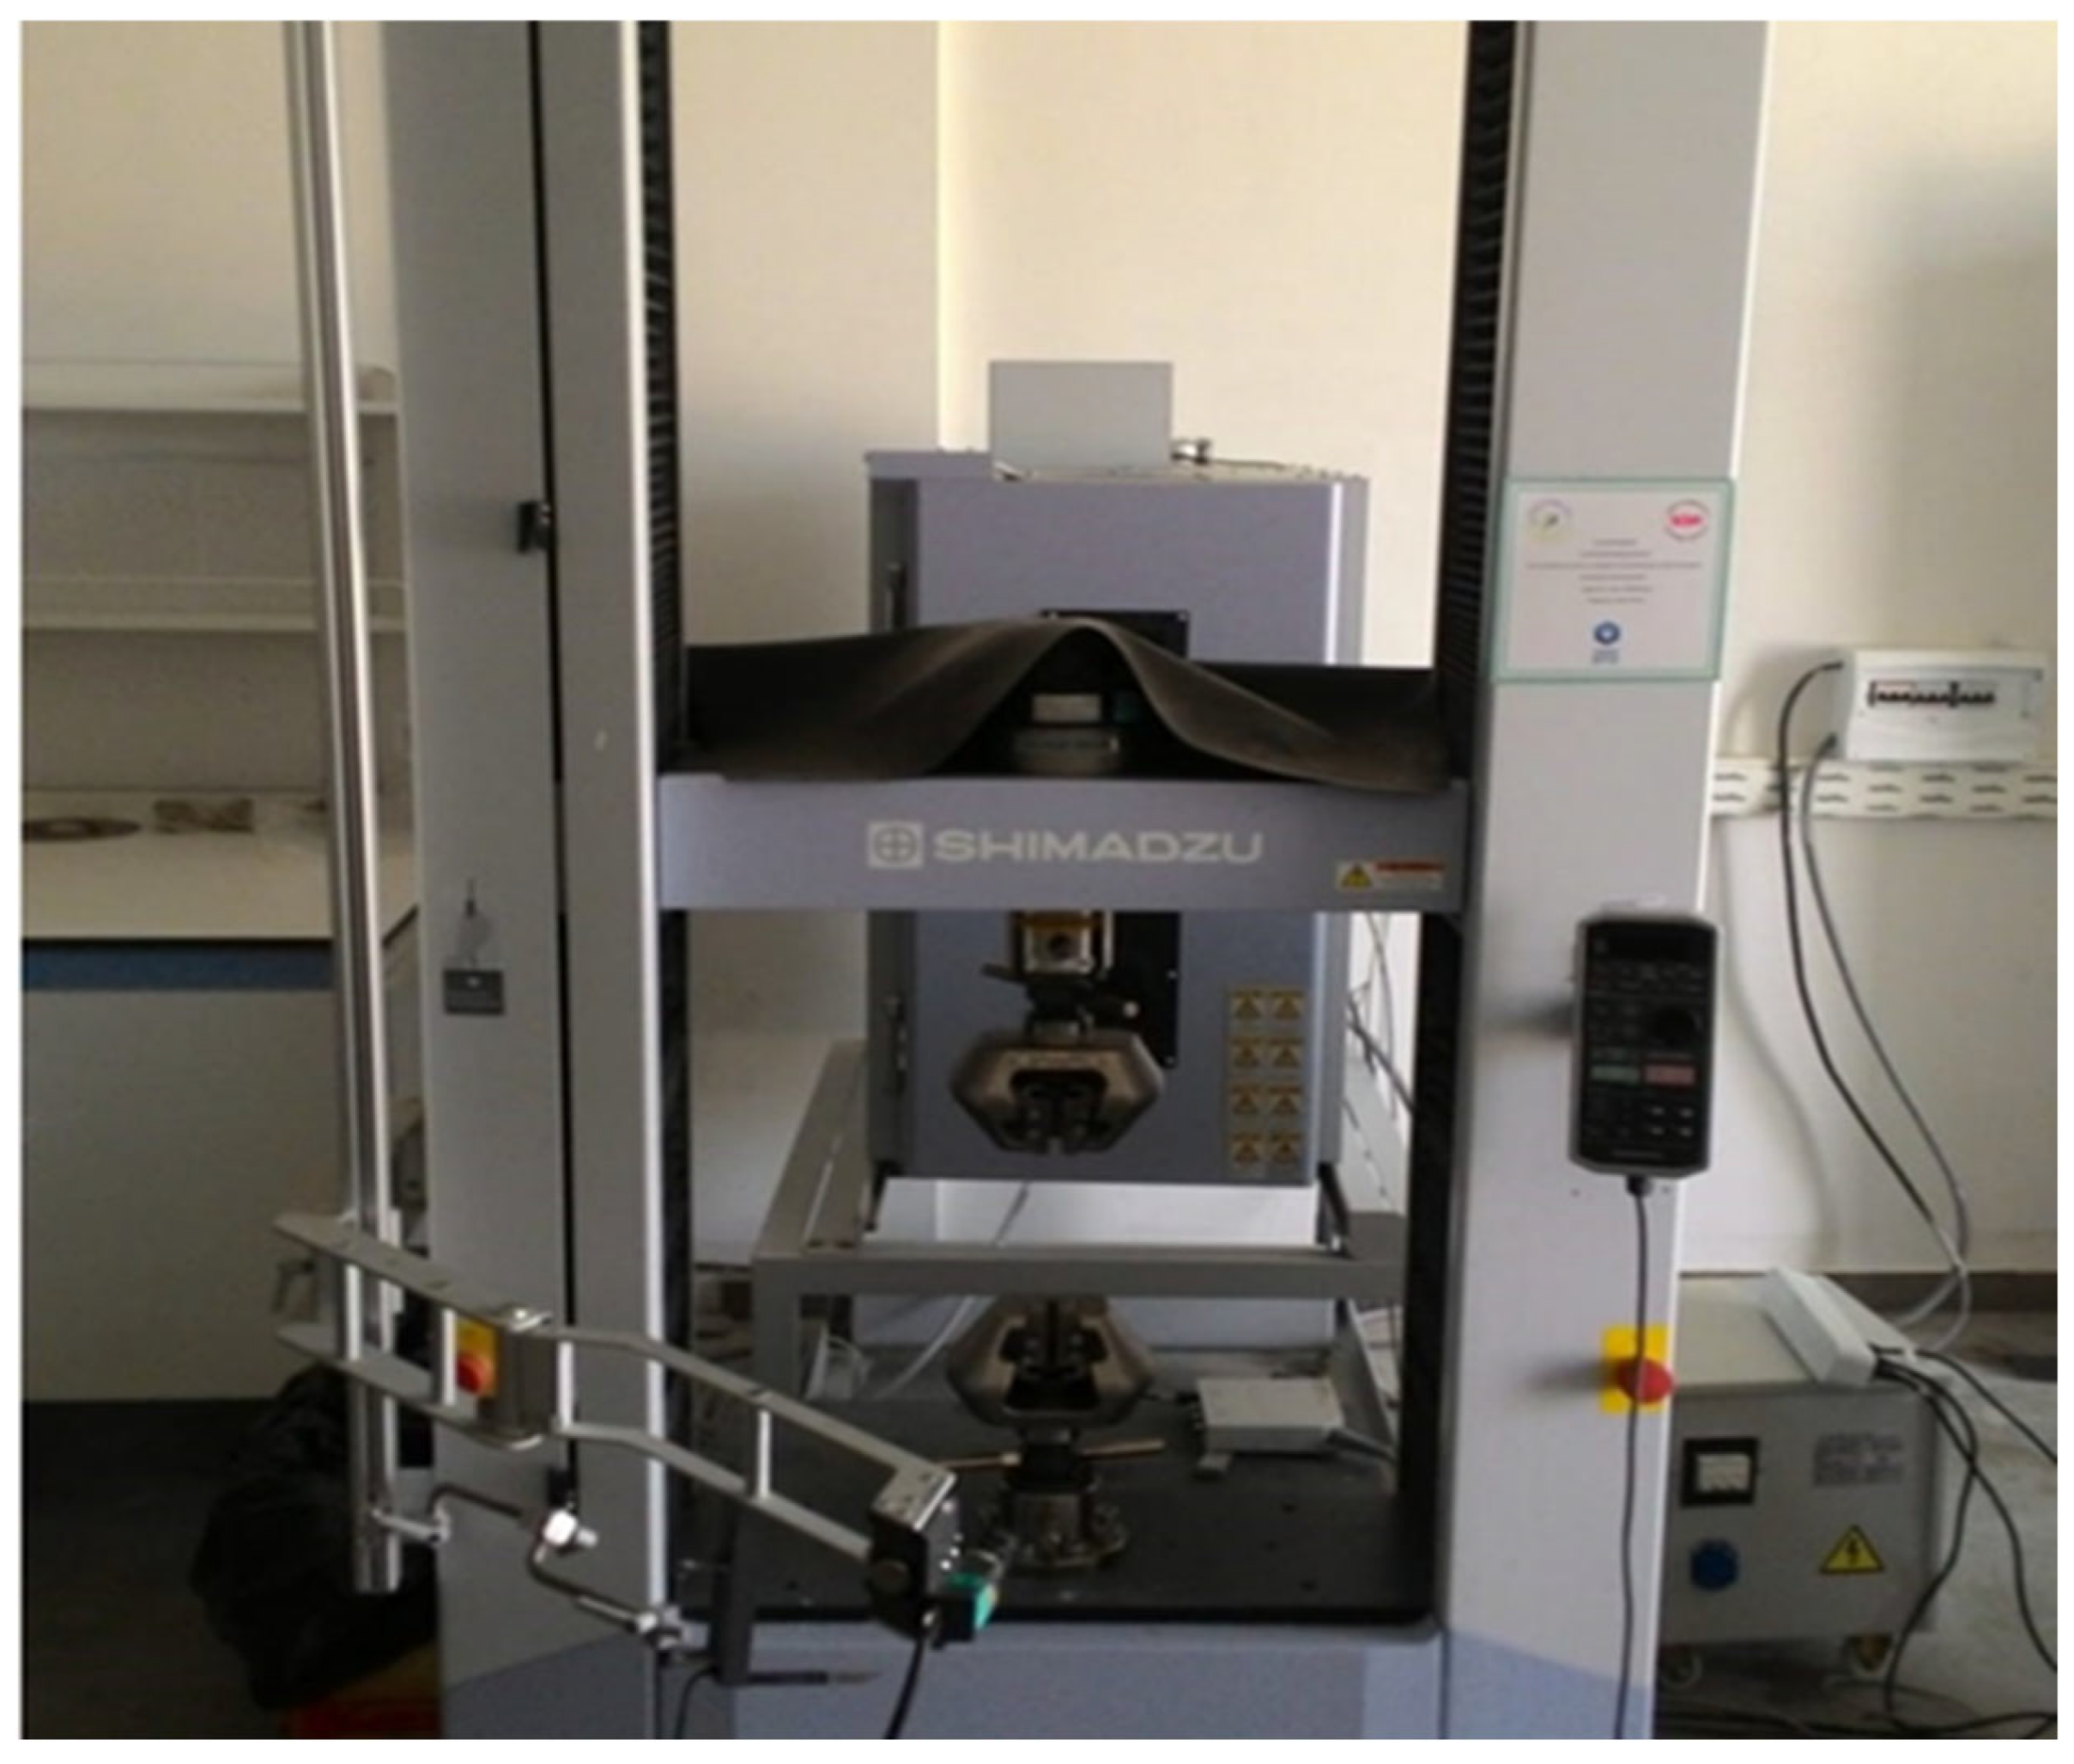
Figure 5.
AW5754 specimens after testing at a strain rate of 2×10⁻⁴ s⁻¹.
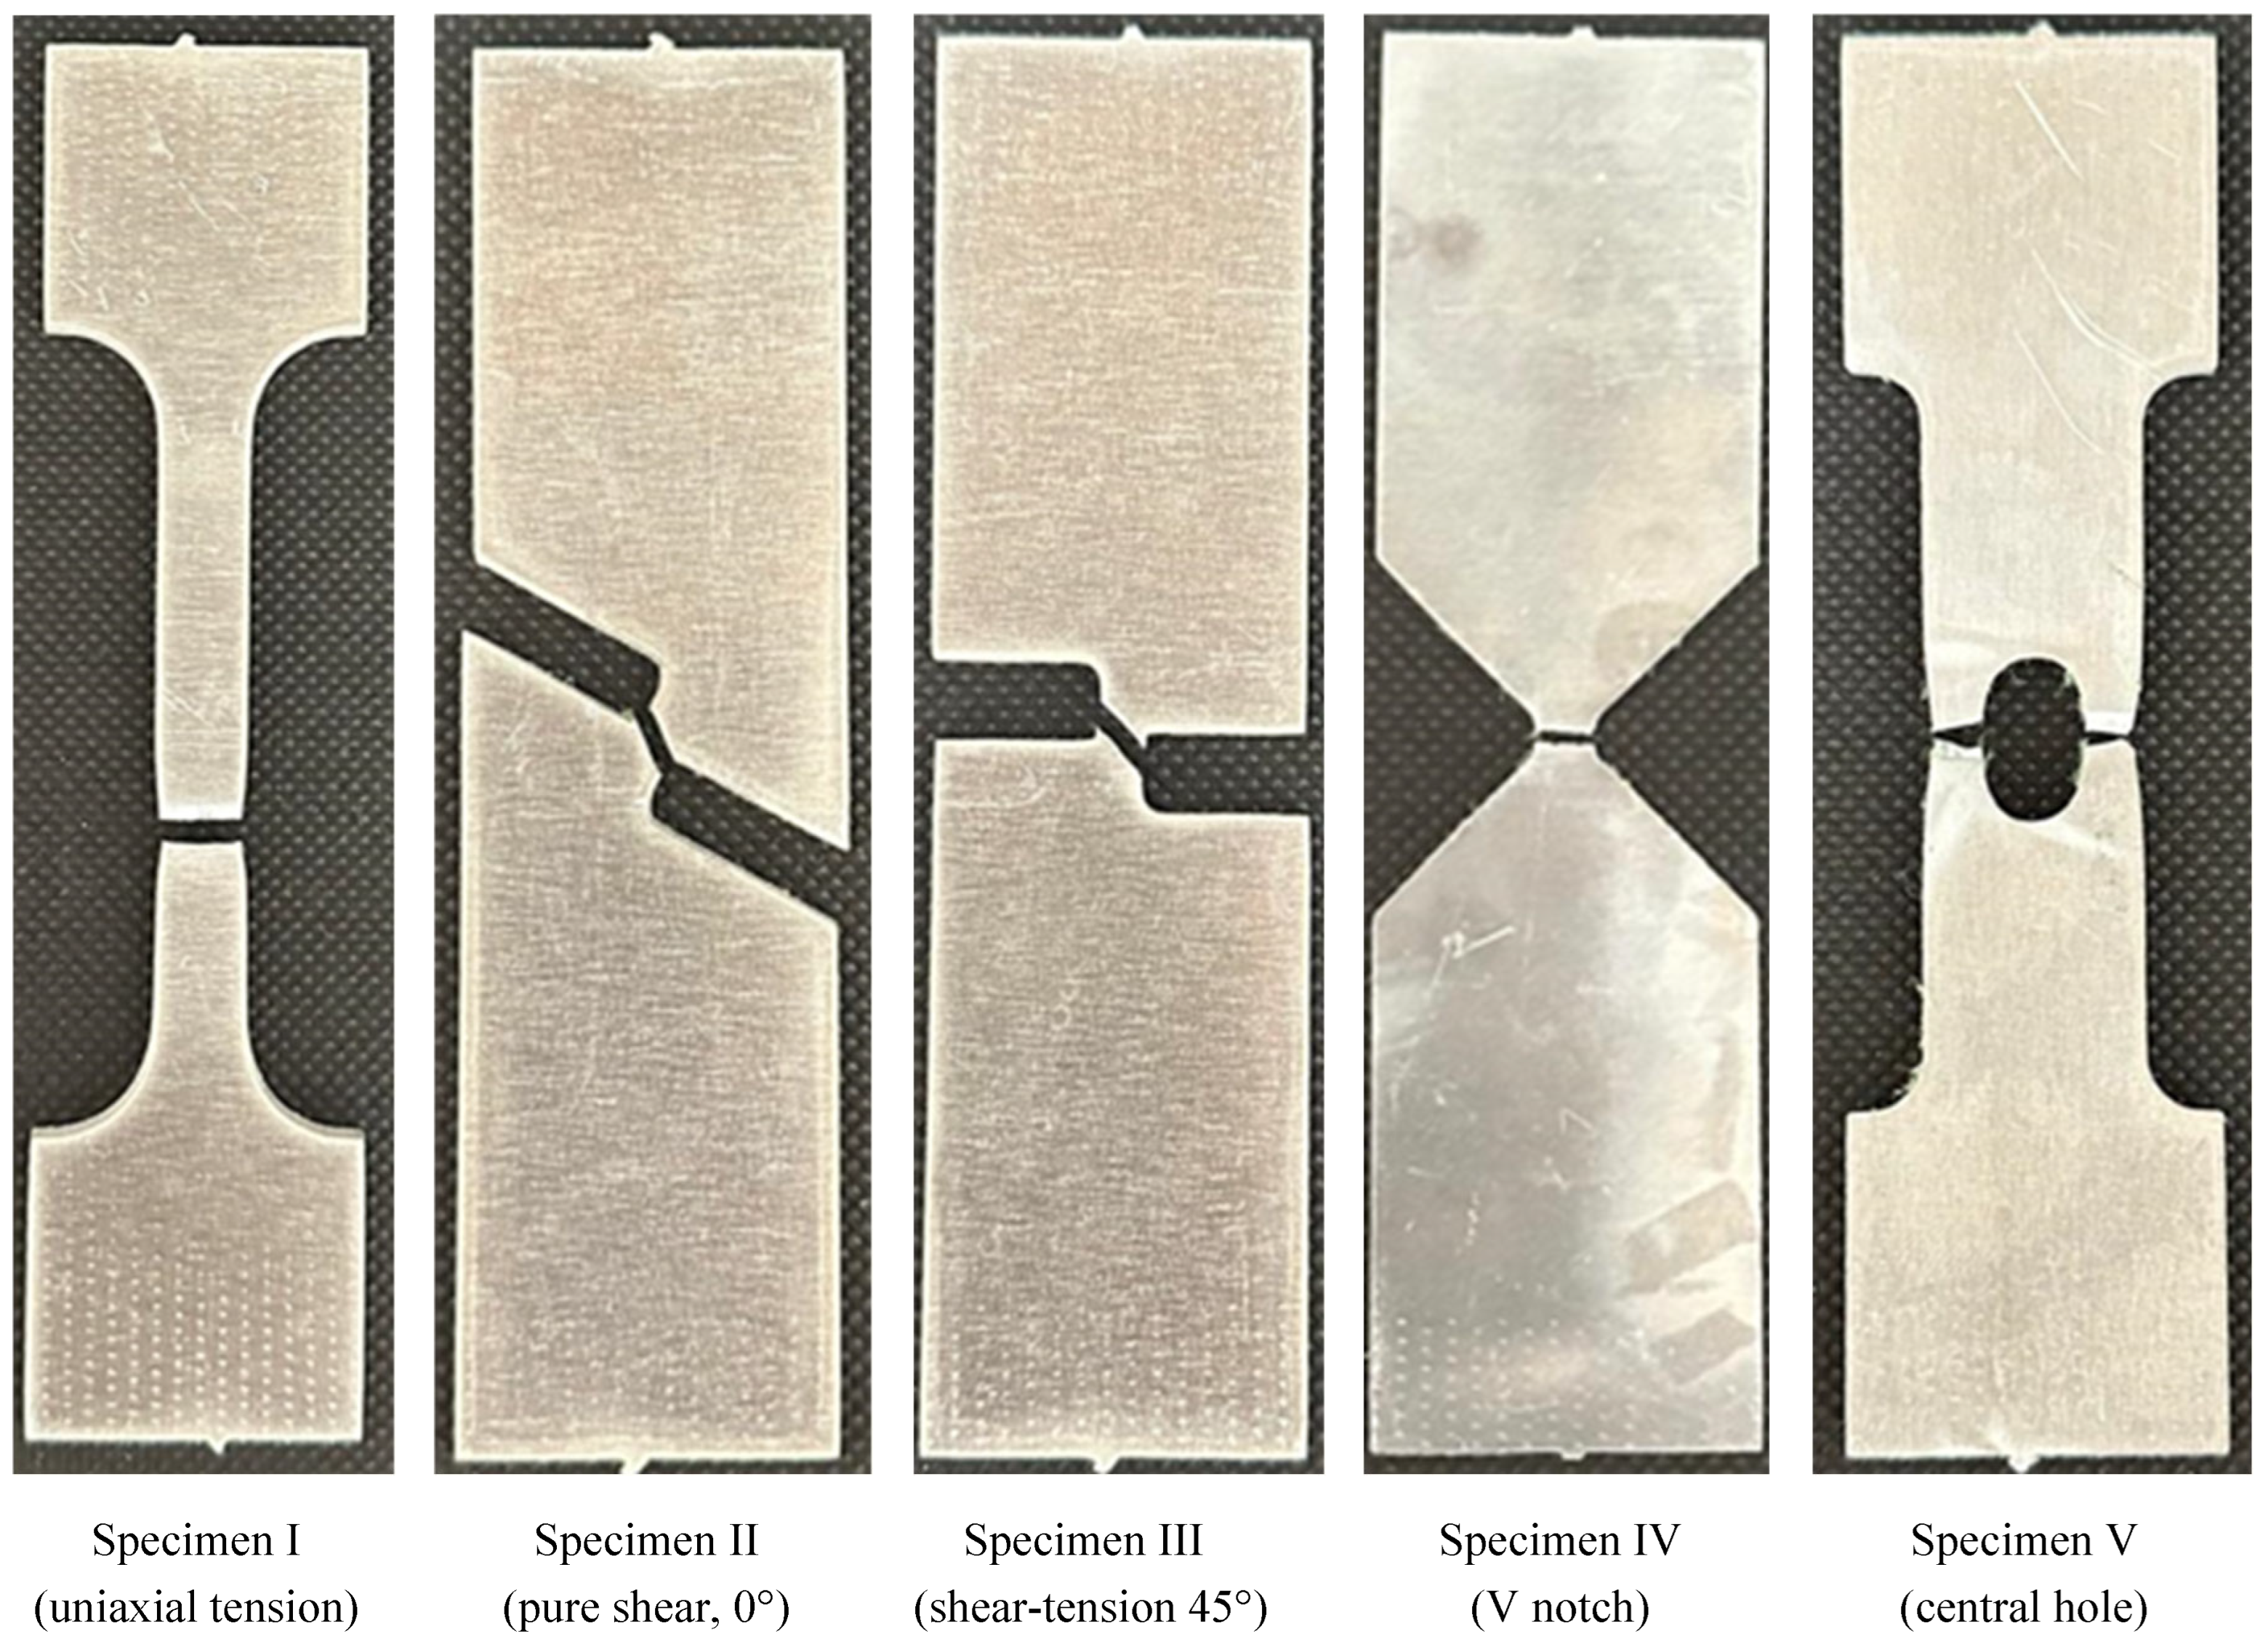
Figure 6.
AW6082 specimens after testing at a strain rate of 4×10⁻⁴ s⁻¹.
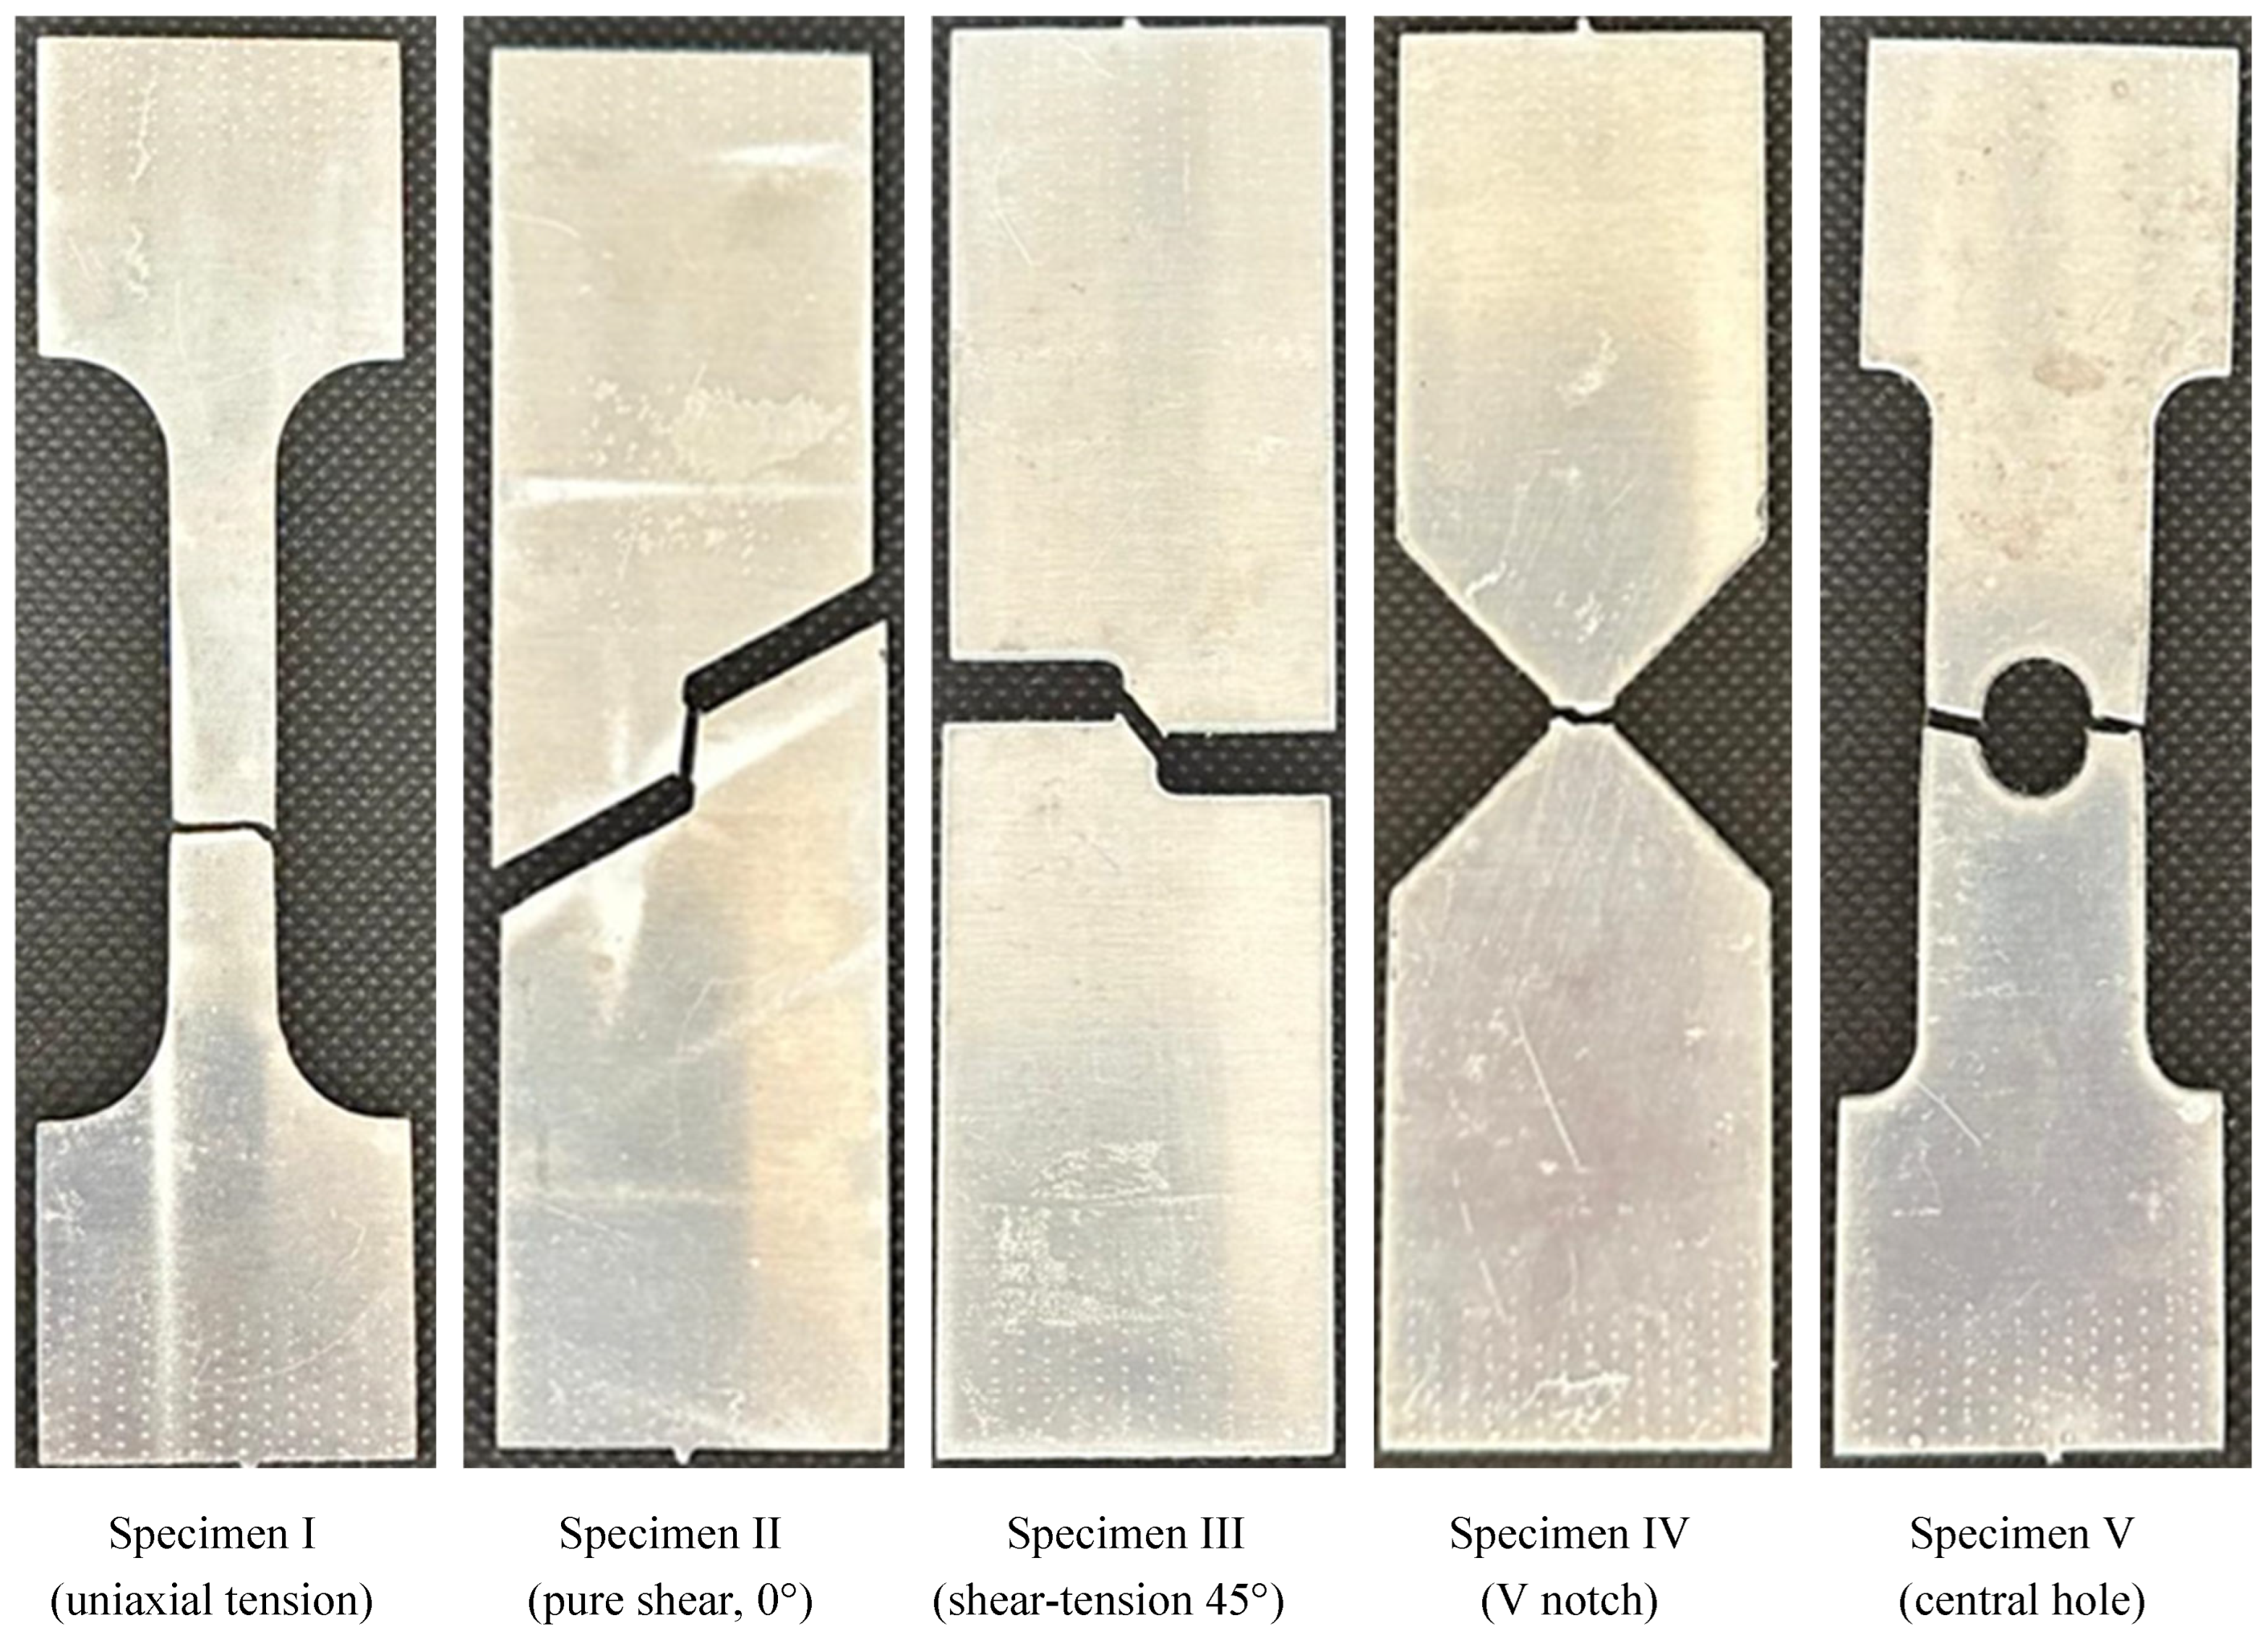
Figure 7.
True stress-strain curves for Specimen I of (a) AW5754 and (b) AW6082 at different loading speeds .
Figure 7.
True stress-strain curves for Specimen I of (a) AW5754 and (b) AW6082 at different loading speeds .
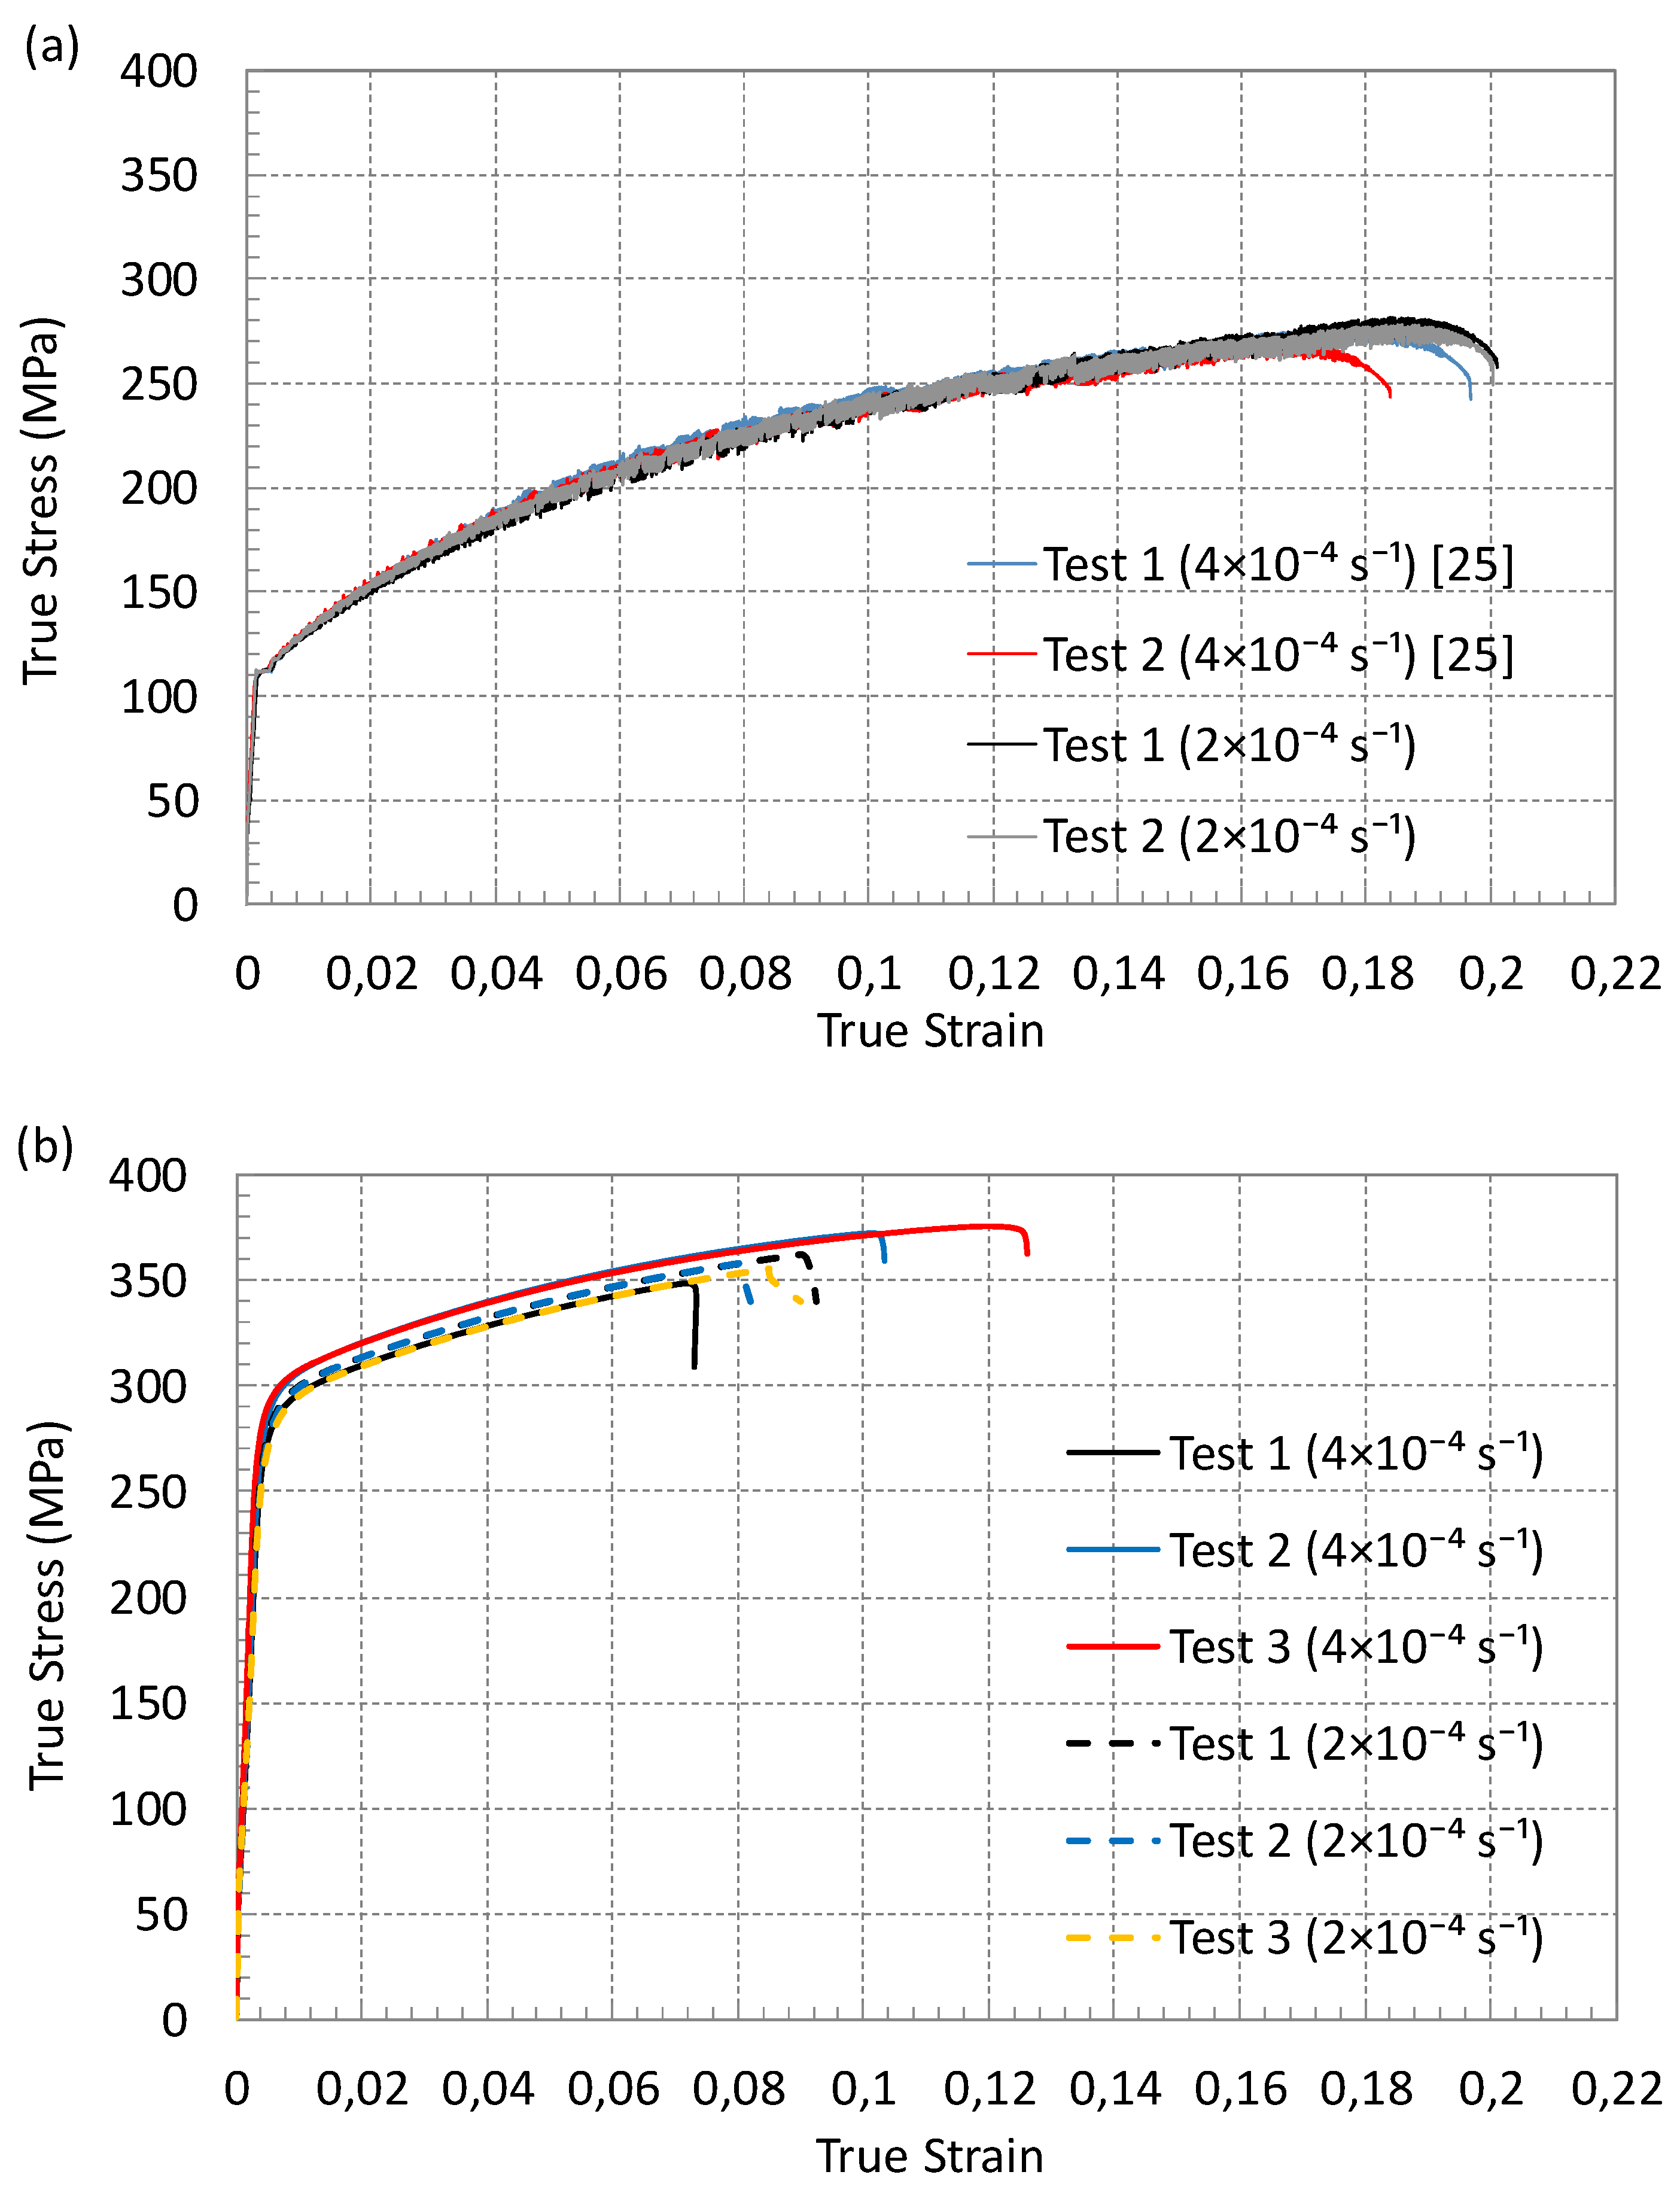
Figure 8.
FE Models for Specimens (a) I, (b) II, (c) III, (d) IV, and (e) V.
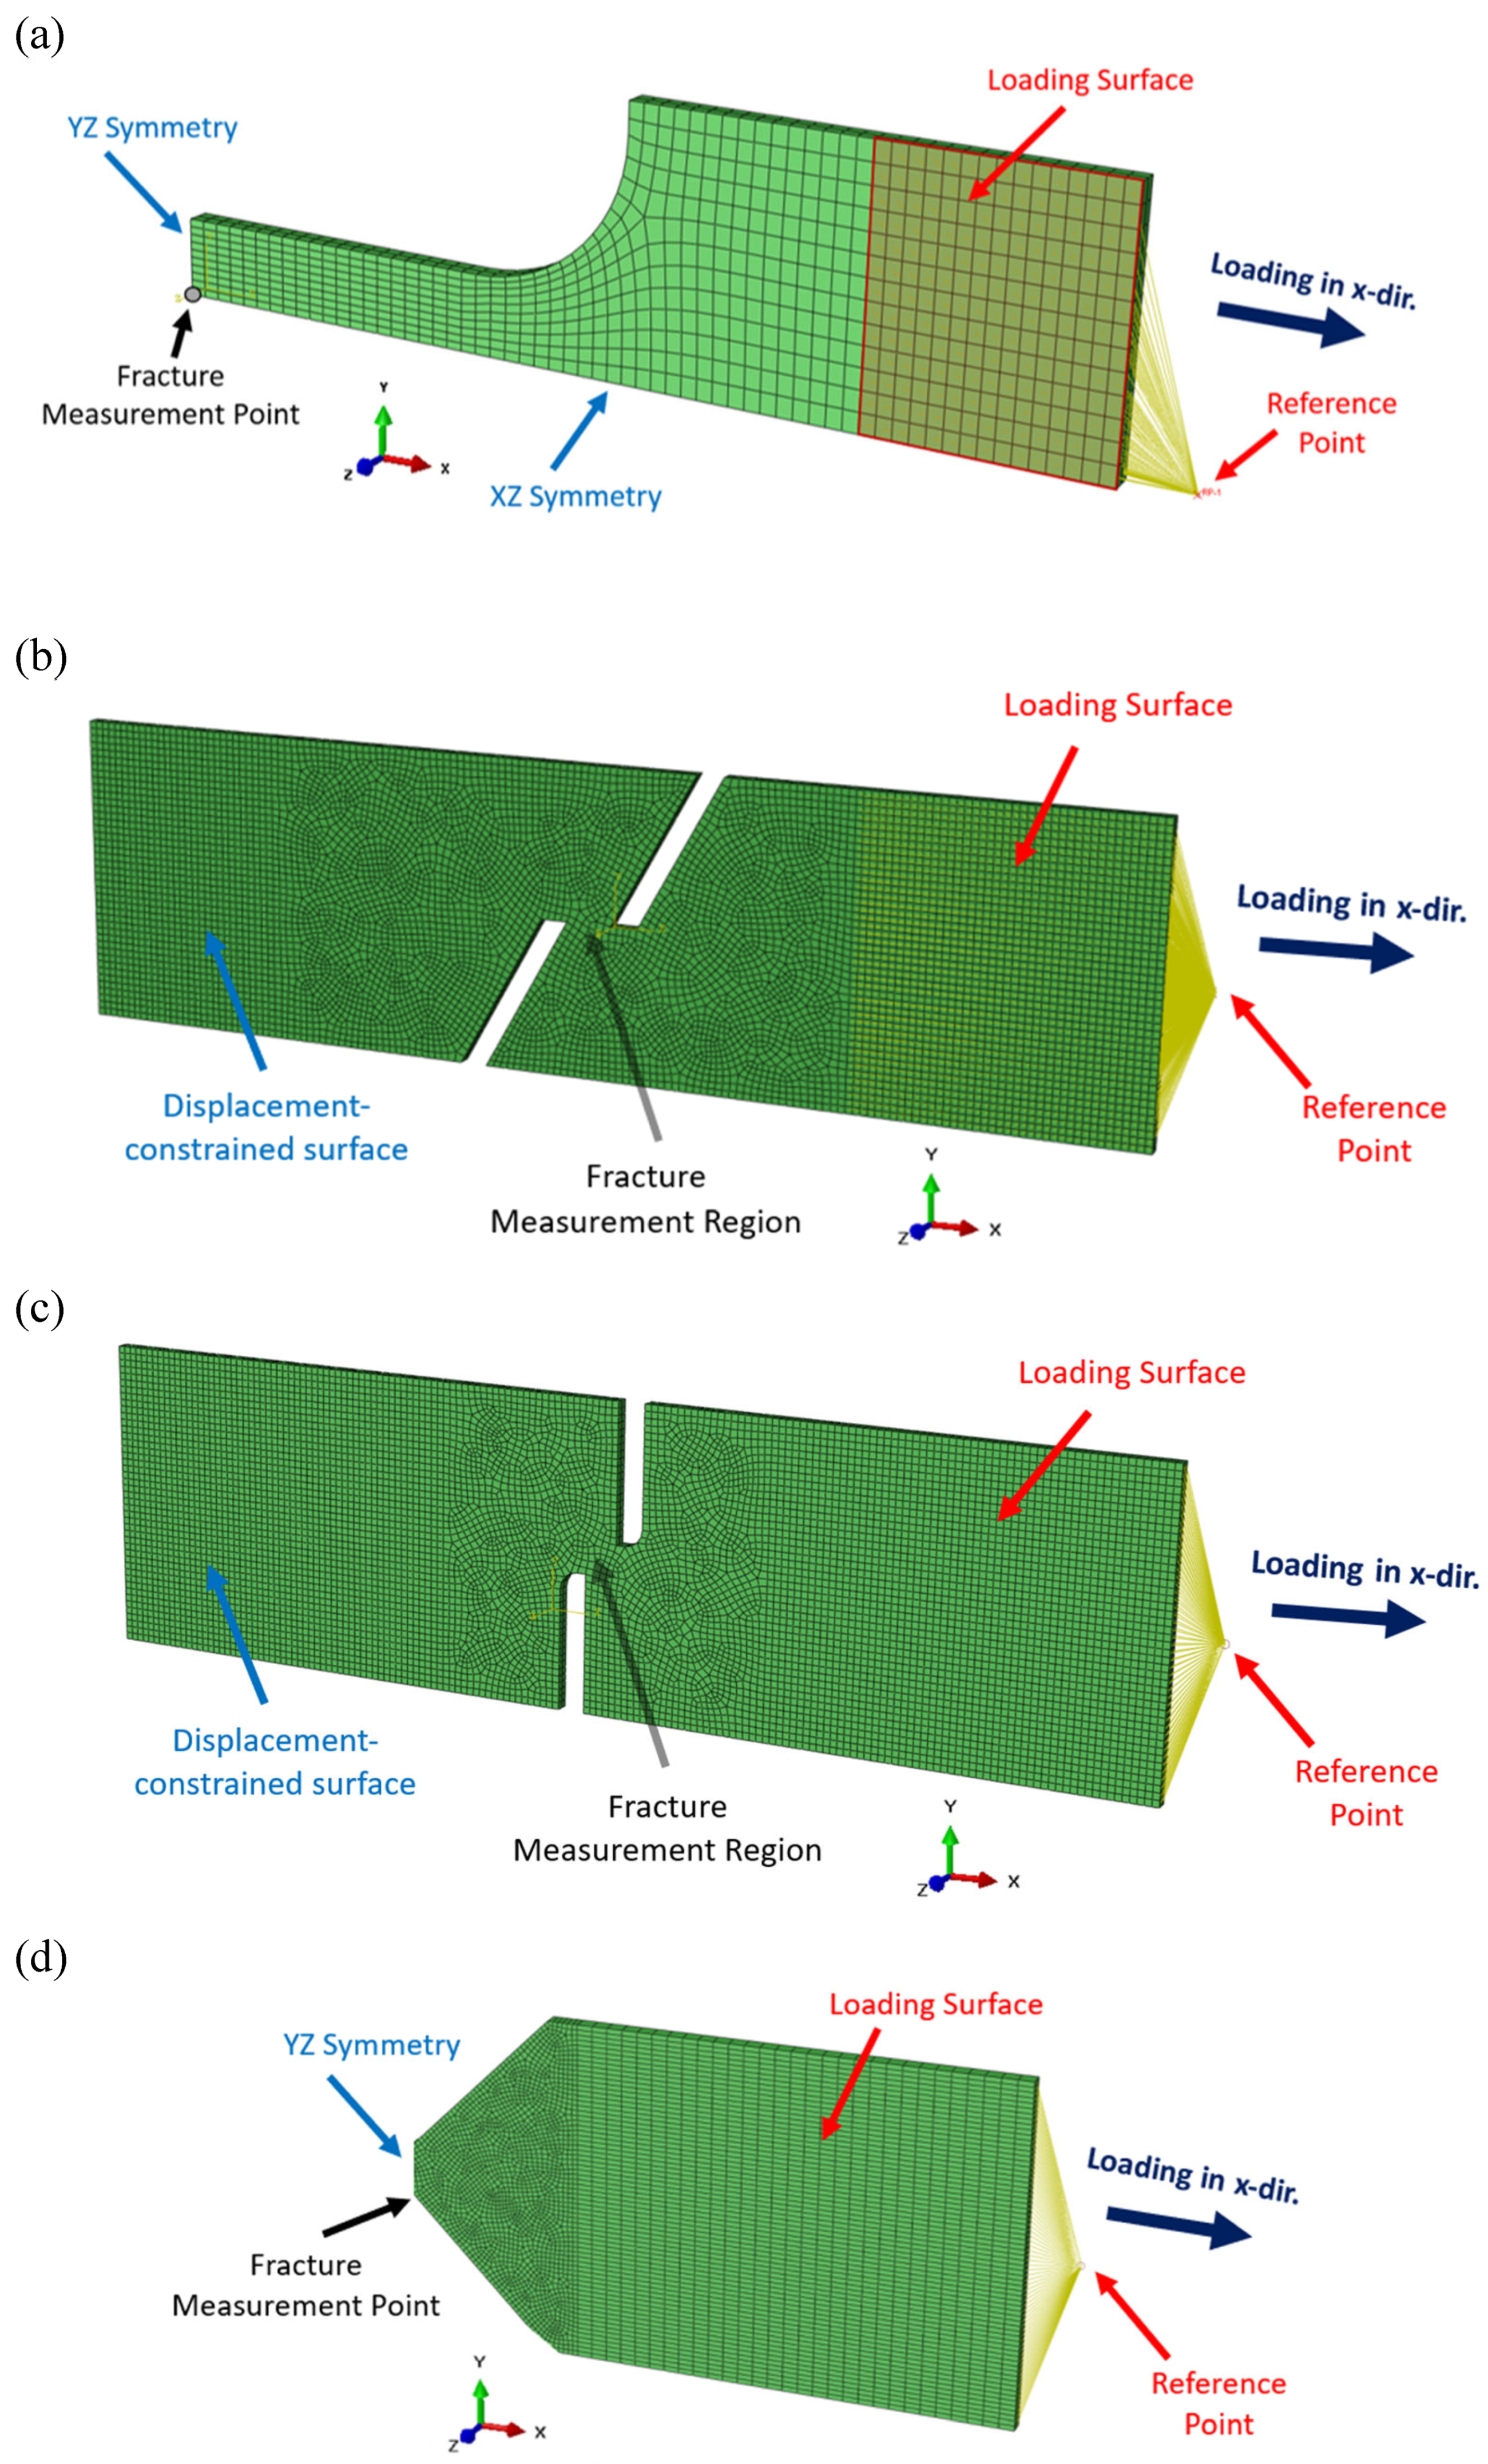
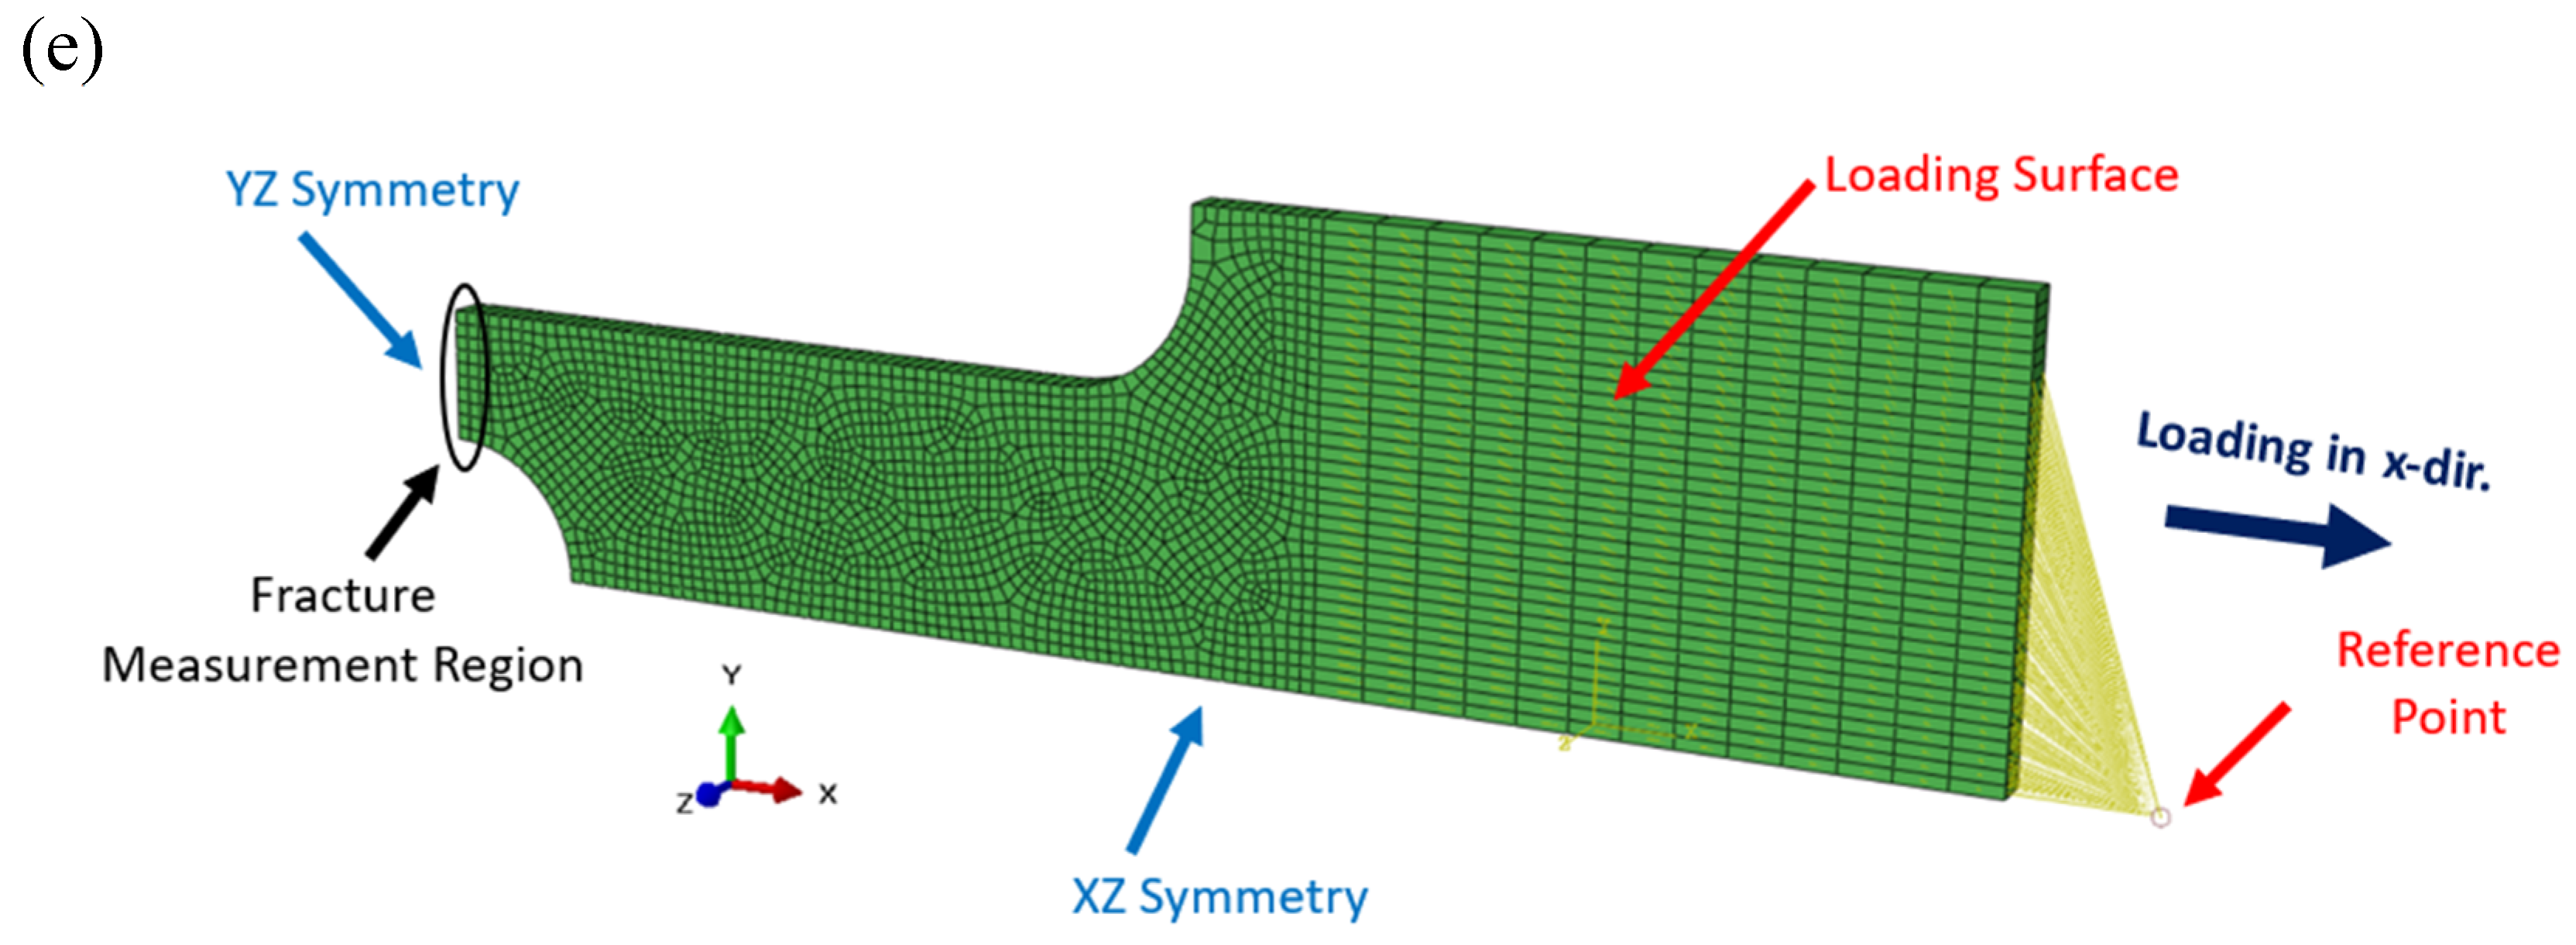
Figure 9.
Equivalent plastic strain distribution in FE models at the estimated damage (for AW6082 at 2×10⁻⁴ s⁻¹).
Figure 9.
Equivalent plastic strain distribution in FE models at the estimated damage (for AW6082 at 2×10⁻⁴ s⁻¹).
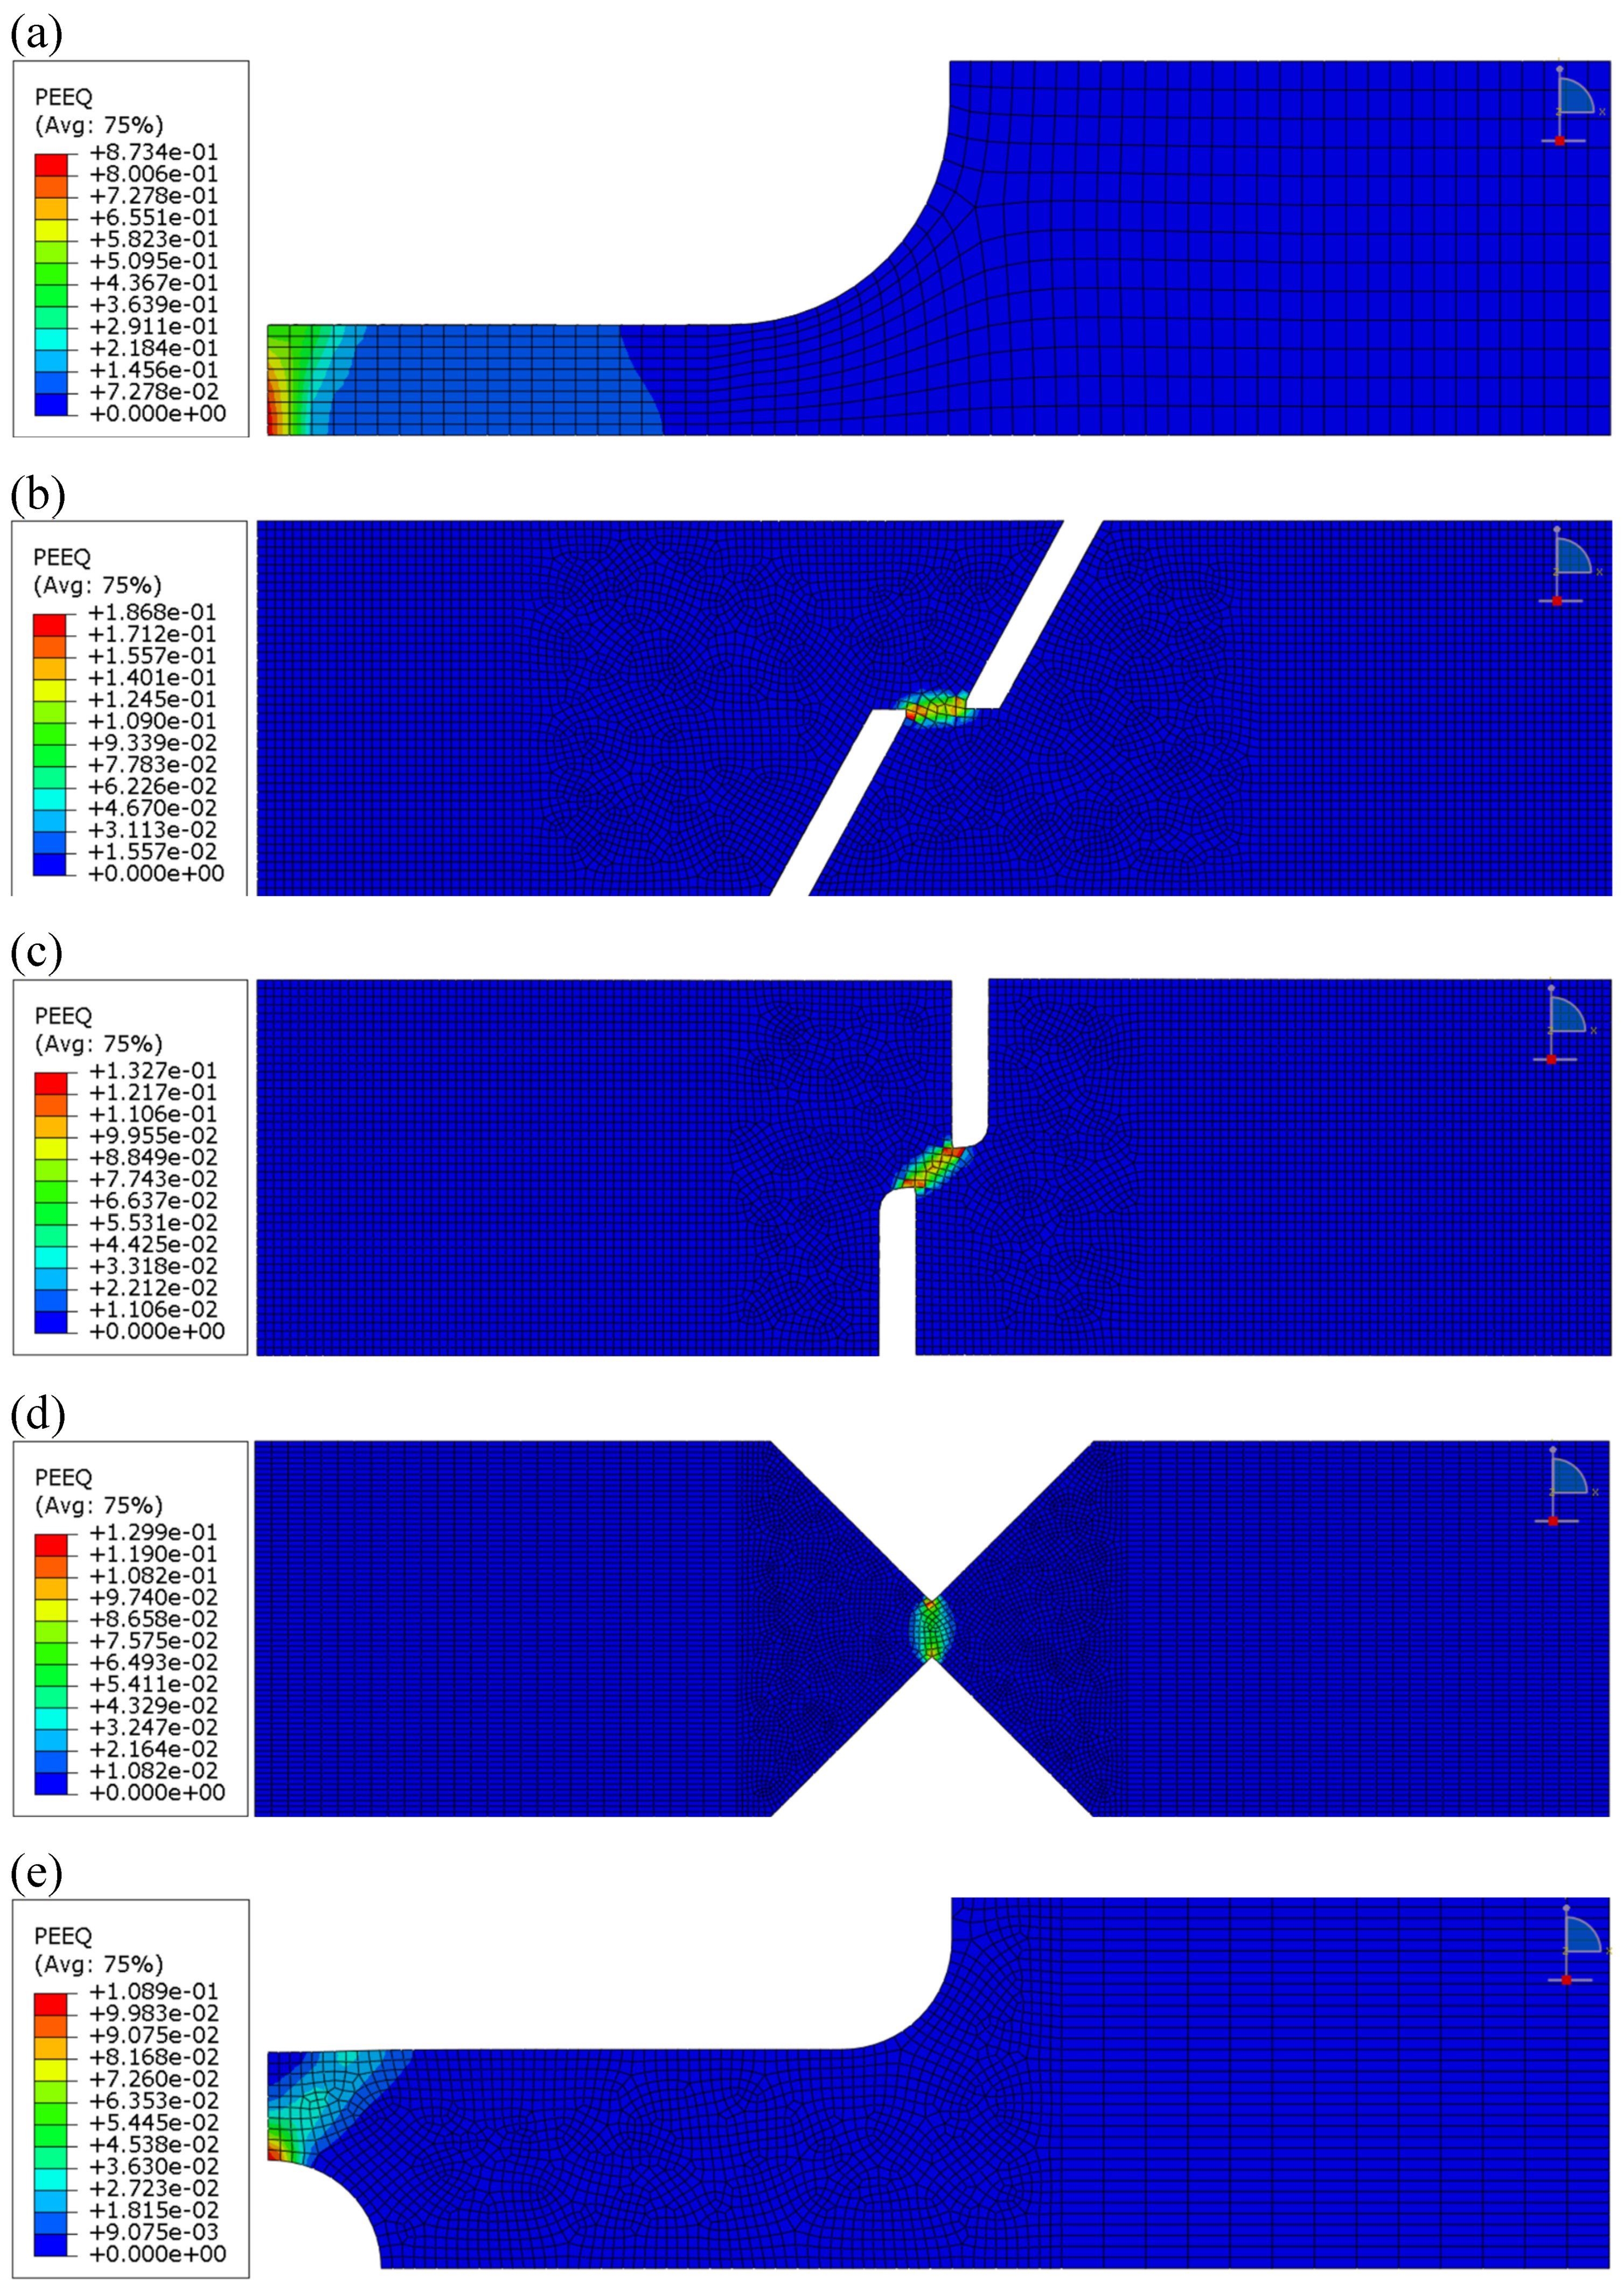
Figure 13.
Change of equivalent plastic strain with stress triaxiality factor and curve fitting for the triaxiality locus for (a) AW5754 at 2×10⁻⁴ s⁻¹ (b) AW6082 at 2×10⁻⁴ s⁻¹ and (c) AW6082 at 4×10⁻⁴ s⁻¹.
Figure 13.
Change of equivalent plastic strain with stress triaxiality factor and curve fitting for the triaxiality locus for (a) AW5754 at 2×10⁻⁴ s⁻¹ (b) AW6082 at 2×10⁻⁴ s⁻¹ and (c) AW6082 at 4×10⁻⁴ s⁻¹.
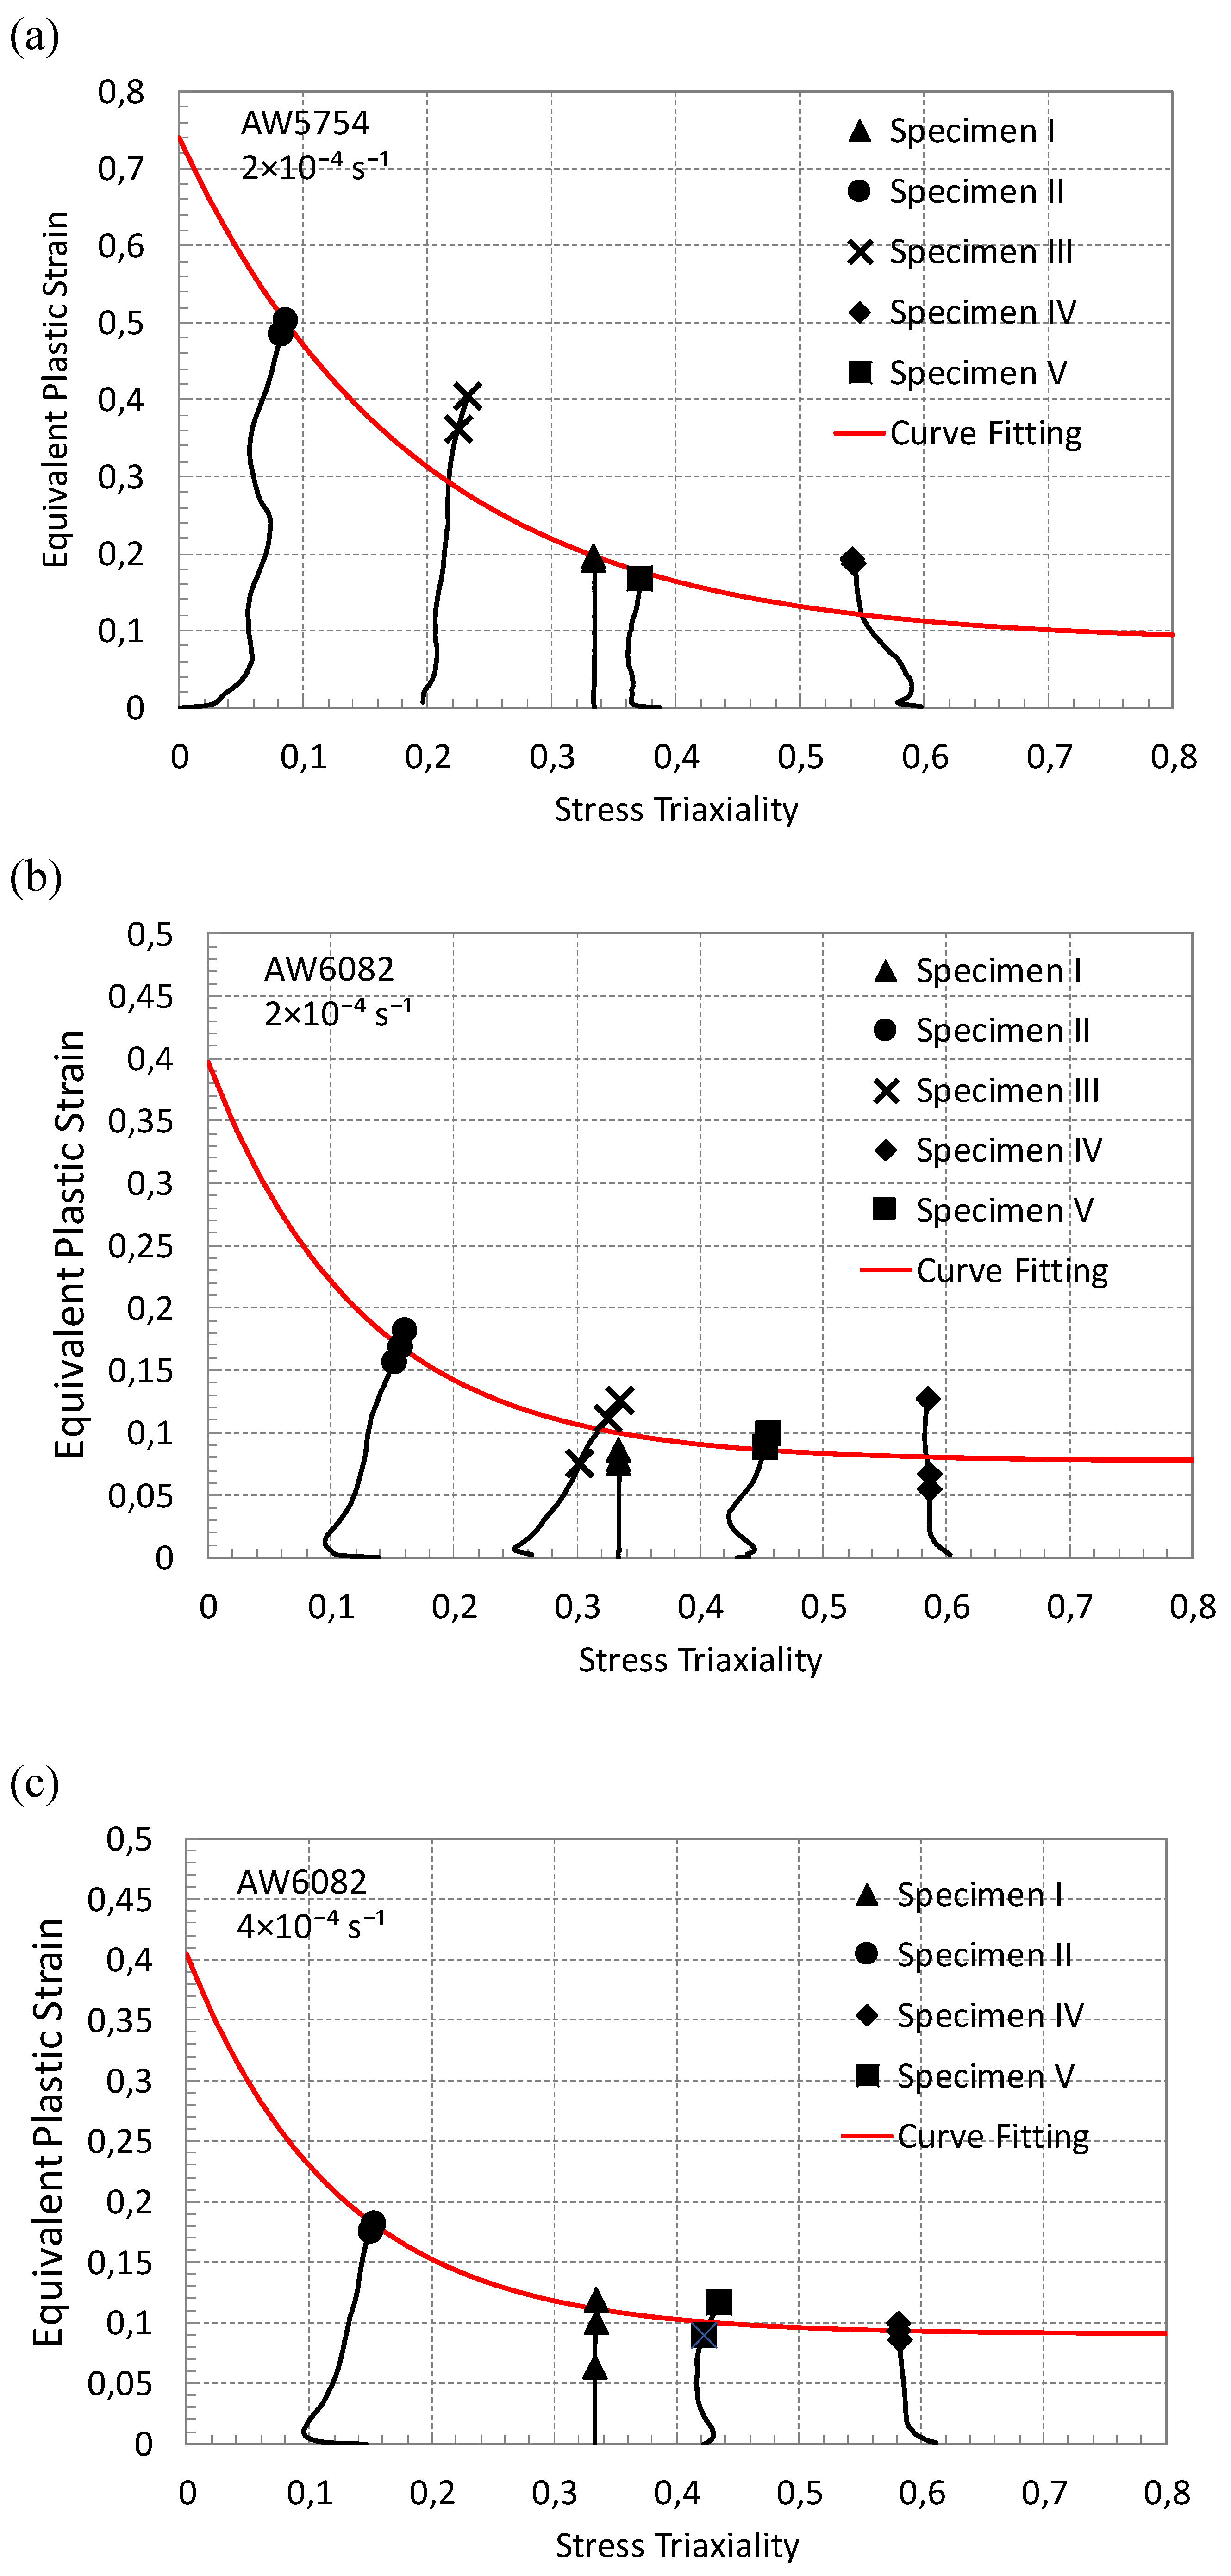
Figure 14.
Comparison of stress triaxiality locus for AW5754 and AW6082 at different strain rates.


Table 1.
The chemical composition of AW5754 and AW6082 Al alloy.
|
Chemical element |
Fe | Si | Mn | Cr | Ti | Cu | Mg | Zn | Al |
| AW5754 Wt. % | 0.35 | 0.22 | 0.3421 | 0.0772 | 0.0133 | 0.0129 | 3.0539 | 0.001 | Balanced |
| AW6082 Wt. % | 0.4 | 1.0 | 0.44 | 0.02 | 0.03 | 0.09 | 0.8 | 0.08 | Balanced |
Disclaimer/Publisher’s Note: The statements, opinions and data contained in all publications are solely those of the individual author(s) and contributor(s) and not of MDPI and/or the editor(s). MDPI and/or the editor(s) disclaim responsibility for any injury to people or property resulting from any ideas, methods, instructions or products referred to in the content. |
© 2025 by the authors. Licensee MDPI, Basel, Switzerland. This article is an open access article distributed under the terms and conditions of the Creative Commons Attribution (CC BY) license (http://creativecommons.org/licenses/by/4.0/).
Copyright: This open access article is published under a Creative Commons CC BY 4.0 license, which permit the free download, distribution, and reuse, provided that the author and preprint are cited in any reuse.


