
Submitted:
13 May 2025
Posted:
15 May 2025
You are already at the latest version
Abstract
Background/Objectives: University students are at a critical life stage for establishing lifelong dietary habits, yet little is known about the sustainability of their diets, especially in Croatia. This study aimed to assess the sustainability and environmental impact of university students' dietary patterns at the University of Rijeka using the Planetary Health Diet Index (PHDI), and to explore associations with demographic, lifestyle, nutritional, and environmental variables. Methods: A cross-sectional study was conducted from October 2023 to March 2024 among 224 students (54% male, mean age 22.7 ± 2.2 years). Data collection included sociodemographic information, physical activity, and dietary intake (semi-quantitative FFQ). Diet quality was assessed using the PHDI, Mediterranean Diet Score (MDS), and Dietary Inflammatory Index. Environmental impact indicators (carbon, water, and ecological footprints) were calculated using energy-adjusted intake data and standardized life cycle assessment data. Results: Students exhibited moderate adherence to the Planetary Health Diet (mean PHDI: 55.5). Higher PHDI scores were significantly associated with vigorous physical activity, higher MDS, and anti-inflammatory dietary patterns (all p<0.001). Despite male students showing slightly higher PHDI scores, their diets had significantly greater environmental impacts. A one-point increase in PHDI correlated with lower environmental footprints (carbon: β=–7.94; water: β=–13.88; ecological: β=–3.15; all p<0.001). Nutrient and food group analysis supported the health-promoting profile of diets aligned with the PHDI. Conclusions: This study highlights moderate sustainability of students’ diets, with significant associations between diet quality and environmental impact. University settings present key opportunities for promoting sustainable, health-oriented eating behaviors among young adults.
Keywords:
diet quality
; environmental impact
; planetary health diet
; students
; sustainable nutrition
1. Introduction
Modern dietary patterns are increasingly harmful to human and planetary health, significantly contributing to the global burden of disease and mortality. Non-communicable diseases (NCDs), including cardiovascular disease, obesity, and type 2 diabetes, are closely associated to diets low in fruits, vegetables, whole grains, and polyunsaturated fats, and high in sodium, red and processed meats, and sugar-sweetened beverages [1-4]. In 2021 alone, NCDs accounted for 43.8 million deaths globally, with dietary risks contributing to 7.22 million of those, while in Europe, poor diet remains the second leading cause of cardiovascular mortality [4-6]. At the same time, the current food system is a major driver of environmental degradation. Agri-food systems are major contributors to climate change and are exceeding planetary boundaries [1,2,7]. They contribute to approximately one-third of anthropogenic greenhouse gas emissions, occupy over one-third of global land area, and consume more than 70% of freshwater resources [7-9]. The environmental footprint of food production, combined with the high prevalence of diet-related diseases, results in substantial hidden costs not reflected in market prices, such as externalities that challenge the sustainability of global food systems [10]. Given the connection of human and environmental health, there is growing emphasis on promoting sustainable diets, as defined by the FAO [11] as those that have low environmental impacts while supporting nutritional adequacy and health for present and future generations. These diets must consider not only environmental sustainability but also cultural, social, and economic dimensions.
The EAT-Lancet Commission’s Planetary Health Diet (PHD) proposes a predominantly plant-based dietary pattern with limited animal-sourced and processed foods, aiming to align global eating habits with both health and environmental goals [2]. To quantify adherence to this model, the Planetary Health Diet Index (PHDI) was developed, offering a validated tool to evaluate the quality and sustainability of individual dietary patterns [12]. Aleksandrowicz et al. [13] provided evidence that adopting sustainable dietary patterns can lead to significant reductions in greenhouse gas emissions, land use, and water consumption, and at the same time, offer health benefits.
University students are at their life stage when long-term dietary habits are often established [14,15]. However, students frequently adopt unhealthy eating behaviors due to shared environments, limited food options, and lifestyle constraints [15,16]. The pattern of poor diet quality and low adherence to the Mediterranean diet among Croatian students is consistent with trends observed in other Mediterranean and non-Mediterranean European countries, where moderate or poor adherence is common and tends to decrease with age and during stressful periods such as the COVID-19 pandemic [17-19]. Currently, there is limited knowledge regarding the sustainability of university students' diet. Recent studies indicate that university students generally have moderate diet quality and environmental impact, showing that higher diet quality is often associated with more sustainable eating behaviors [20-27]. Moreover, the sustainability of university students' diets is challenged by poor diet quality, unhealthy food environments, and socioeconomic challenges. These indicate that the relationship between diet quality and environmental impact is complex, as not all nutritionally optimal diets are environmentally sustainable, which highlight the need for integrated educational nutritional strategies to promote both health and sustainability among university students [16,23]. At the same time, university settings may offer opportunities to influence dietary patterns through education, food service policies, and campus initiatives [16,27]. Examining how closely student diets align with the PHD can provide insights into potential health and environmental benefits, and inform strategies to promote sustainable eating among young adults. While there are initiatives about the sustainability and environmental impact of diets in Croatia, currently, there are no peer-reviewed studies that specifically quantify the environmental impact of dietary patterns.
Therefore, this study aimed to assess the sustainability and the environmental impact of dietary patterns of university students of the University of Rijeka, Croatia, using the Planetary Health Diet Index and evaluate the associations between demographic, lifestyle, nutritional, and environmental impact variables. By assessing the relationship between diet quality, sustainability, and environmental impact among young adults, this study increases the evidence base necessary to inform integrated strategies for health promotion and environmental management within higher education institutions in Croatia.
2. Materials and Methods
2.1. Procedure
This cross-sectional study was conducted between October 2023 and March 2024 and included university students from the University of Rijeka, Croatia. All participants were thoroughly informed about the study objectives and procedures, and provided written informed consent before enrolment. This study was conducted following the Declaration of Helsinki, and the study protocol was approved by the Ethics Committee of the Teaching Institute of Public Health of Primorsko-goranska County (Approval No: 04-400-139/2-22). The survey instrument comprised three distinct sections. The first section collected data on participants’ sociodemographic characteristics through a series of structured questions. The second section used the standardized International Physical Activity Questionnaire—Long Form (IPAQ-LF) [28] to assess physical activity levels across multiple domains, including occupational, transportation, household, and leisure-time activities. The third section was a semi-quantitative Food Frequency Questionnaire (FFQ) designed to evaluate participants' dietary intake over the preceding week [29]. The survey was conducted at the Department of School Medicine, Teaching Institute of Public Health of Primorsko-goranska County, Croatia.
2.2. Participants
The study involved 224 students (121 women and 103 men), aged 19 to 27 years, based on study criteria. To determine the required sample size, a priori power analysis was conducted using G*Power 3 software. The analysis was based on an expected medium effect size (f = 0.3), degrees of freedom (df = 5), a significance level (α) of 0.05, and a statistical power (1–β) of 0.95. The calculation determined a minimum sample size of 220 participants. Eligible participants were current university students aged 18 to 28 years, those who did not follow a specific dietary regimen or eating pattern, and those who had no history of chronic illnesses such as cardiovascular disease, diabetes, or medically diagnosed food allergies or intolerances requiring dietary restrictions. Participants were excluded if they did not meet the inclusion criteria, reported daily energy intakes below 600 kcal or above 3500 kcal (as determined from dietary records collected in the study), or were pregnant or lactating.
2.3. Measures
2.3.1. Participants’ Characteristics
Sociodemographic characteristics asked in the survey included age, gender, university status, data on faculty affiliation, current field of study, and smoking status. Physical activity level was assessed using the self-administered International Physical Activity Questionnaire—Long Form (IPAQ-LF) [28]. The total physical activity score was calculated by multiplying the duration (in minutes) and frequency (days per week) of each activity type by its corresponding metabolic equivalent of task (MET) value, and then summing the MET-minutes/week for all activity domains, including vigorous, moderate, and walking activities. Participants were then categorized into one of three physical activity levels—vigorous, moderate, or low—based on the following IPAQ scoring criteria [28]:
Vigorous: Engaging in vigorous-intensity activity on at least three days per week, accumulating a minimum of 1500 MET-minutes/week, or participation in any combination of walking, moderate-, or vigorous-intensity activities on seven or more days, achieving at least 3000 MET-minutes/week.
Moderate: Engaging in vigorous-intensity activity for at least 20 minutes per day on three or more days, or moderate-intensity activity or walking for at least 30 minutes per day on five or more days, or any combination of activities on five or more days, summing at least 600 MET-minutes/week.
Low: Participants not meeting the criteria for either the moderate or vigorous categories were classified as having low physical activity.
2.3.2. Anthropometric Measurements
Trained nursing personnel measured participants’ height and body weight using a calibrated and validated scale with an integrated stadiometer (Vogel Halke & Seca, serial number 4569, Hamburg, Germania) under standardized conditions. Body mass index (BMI) was subsequently calculated. Body composition parameters, including muscle mass, fat mass, bone mass, total body water, metabolic age, and basal metabolic rate, were measured using a Tanita RD-545 Segmental Body Composition Analyzer (Tanita Corporation, n.d., Tokyo, Japan).
2.3.3. Dietary Assessment
Food intake was assessed using a 98-item semi-quantitative Food Frequency Questionnaire (FFQ). Participants reported how often they consumed each food item over the past seven days. The FFQ provided frequency options ranging from “never or less than once per week” to “two or more times per day”, with a standard portion size for each listed food or drink item. Participants indicated whether their usual portion was smaller than, similar to, or larger than the standard portion. Daily intake (in grams per day) was then estimated by multiplying the reported consumption frequency by the adjusted portion size. Dietary energy and nutrient intakes were calculated using the Croatian food composition database [30], while certain nutrients needed for the calculation of the Dietary Inflammatory Index were taken from the Danish [31] and American [32] databases.
2.3.4. The Planetary Health Diet Index
Adherence to the EAT–Lancet Commission’s dietary recommendations was assessed using the Planetary Health Diet Index (PHDI), developed by Cacau et al. [12]. The PHDI consists of 16 components, each scored between 5 and 10 points, yielding a total score ranging from 0 to 150. Components with a maximum of 10 points include red meat, nuts and peanuts, legumes, poultry and substitutes, fish and seafood, eggs, fruits, vegetables, whole grains, dairy products, unsaturated fats, animal fats, and added sugars. Two additional components were the ratio of dark green leafy vegetables to other vegetables and the ratio of red and orange vegetables to other vegetables, which are each scored up to 5 points. Dietary intake for PHDI components was estimated based on average consumption reported in the FFQ. Participants were then categorized into quartiles according to their total PHDI score. PHDI ranged 20-100, therefore, the participants were divided into quartiles as follows: Quartile 1: PHDI 20-45; Quartile 2: PHDI 46-55; Quartile 3: PHDI 56-65; Quartile 4: PHDI 66-100.
2.3.5. Mediterranean Diet Score
The Mediterranean diet was used as an indication of diet quality due to its well-established health benefits [33,34] and its recognition as a sustainable dietary pattern [35,36]. Adherence to the Mediterranean diet was assessed using the Mediterranean Diet Score (MDS), which is based on nine dietary components comprising both food groups and nutrient ratios. Healthy components, such as vegetables, fruits and nuts, cereals and tubers, legumes, fish, dairy products, and the ratio of unsaturated to saturated fats, were assigned 1 point if intake was above the gender-specific median and 0 points if below. In contrast, components considered less healthy, such as meat (including processed meat) and alcohol, were scored inversely, with 1 point given for consumption below the median. The total MDS ranges from 0 to 9 points, with adherence in this study classified as low (≤4 points) or high (≥5 points).
2.3.6. Dietary Inflammatory Index
The Dietary Inflammatory Index (DII) was assessed in this study due to its ability to comprise the complex interactions among nutrients, bioactive compounds, and overall dietary patterns, rather than focusing solely on individual food components. Furthermore, the DII has been widely associated with a range of chronic disease outcomes, including all-cause mortality, depression, and intermediate risk factors such as elevated blood pressure and hypertension [37]. DII scores were calculated in this study using 42 of the possible 45 dietary components derived from participants’ average dietary intake, following the standardized protocol established by Shivappa et al. [38]. Briefly, for each dietary parameter, a z-score was computed by subtracting the global mean intake from the participant’s reported daily intake and dividing by the global standard deviation. These z-scores were then converted into centered percentiles and multiplied by the corresponding inflammatory effect score for each parameter. The resulting values were summed to generate an overall DII score for each participant. The DII score ranges from -8.87 (indicating a strongly anti-inflammatory diet) to +7.98 (indicating a strongly pro-inflammatory diet), with 0 representing a neutral inflammatory potential. For study analysis, participants were categorized into two groups: anti-inflammatory (DII ≤ 0) and pro-inflammatory (DII > 0).
2.3.7. Environment Impact Indicators
To evaluate the environmental impact of participants’ diets, two publicly available life cycle assessment databases were applied. These databases provide comprehensive environmental impact data for a wide range of food items and are characterized by demanding data standardization protocols and multiple environmental indicators [39,40]. The environmental impact values from each database were integrated and matched to the quantity of each food, composite dish and beverage item consumed by individual participants to estimate diet-related environmental burdens. The main environmental impact indicators assessed included carbon footprint (expressed as kilograms of CO₂ equivalents, kg CO₂ eq), ecological footprint (m²*year), and water footprint (m³). Additionally, energy-adjusted environmental impact values were calculated to account for variations in total dietary intake, standardizing the environmental impact per 1000 kilocalories consumed.
2.4. Statistical Analysis
Statistical analyses were performed using TIBCO Statistica, v. 13.3.0 (TIBCO Software Inc., Palo Alto, CA, USA; 2017). The Kolmogorov-Smirnov test was used to verify the variables' normality. Continuous variables were expressed as means and standard deviations, and categorical variables were expressed as absolute (n) and relative (%) frequencies. Participants were assigned to PHDI quartiles according to their score (1st quartile: 20-45 points; 2nd quartile: 46-55 points; 3rd quartile: 56-65 points; 4th quartile: 66-100 points). The Chi-square test was used for comparisons of categorical variables, while the Student’s t-test and ANOVA were used for continuous variables. All statistical tests were two-sided, and p values < 0.05 were considered statistically significant. The energy-adjusted method was used to adjust the usual nutrient intake for total energy intake, because nutrient consumption is associated with total energy intake either because they contribute directly to energy intake or because individuals who consume more total energy also eat, on average, more of all specific nutrient [41]. This was also done for environmental impact indicators and food components of the PHDI. To assess the associations between the PHDI and usual energy (kcal), energy-adjusted nutrient and PHDI food components intakes, mixed-effects linear regression models were adjusted for potential confounders; i.e. gender (male vs female), level of study (undergraduate vs graduate), body mass index classification (underweight, normal weight, overweight, obesity) and physical activity level (low, moderate, vigorous). Similarly, an identical model to evaluate the association between the PHDI, the MDS and the DII was used. For this analysis, the PHDI, the MDS and the DII were standardized as z-scores, because crude scores have different scoring ranges (i.e., 0–150 vs 0–9 points, and vs – 8.87-7.98, respectively).
3. Results
Participants’ characteristics and those across PHDI quartiles, and the average PHDI scores are presented in Table 1. A total of 224 students (54% men) participated in the study, with a mean age of 22.67 ± 2.19 years and a mean body mass index (BMI) of 24.11 ± 3.50 kg/m². Men had slightly higher PHDI scores than women (56.96 vs. 53.87; p=0.086). Graduate students (47%) had slightly higher PHDI scores compared to undergraduate students (56.27 vs. 55.83), however, these differences did not reach statistical significance (p=0.188). Smoking status was reported by 25% of participants, and no significant difference was observed regarding PHDI scores (smokers 54.64 vs. nonsmokers 54.87; p=0.563). BMI classification revealed that 28% of participants were overweight and 7% were obese (p<0.001). These groups showed slightly higher mean PHDI scores (overweight 56.56; obese 57.67), although differences were not statistically significant (p=0.750). Physical activity levels were significantly associated with PHDI distribution (p<0.001). Specifically, moderately active students (44%) had the lowest average PHDI score (53.98; p=0.101), while those engaging in vigorous physical activity had the highest scores (58.27), participating statistically more in the higher PHDI quartiles (Q3 51%, Q4 53%, p=0.001). Students had a mean MDS of 4.00, indicating moderate adherence to the MD, while a mean DII of 1.07, meaning that students’ average diet had a proinflammatory potential. An average PHDI score of 55.54 (range 20–100) indicated that students had a moderate adherence to the PHD. A significant proportion of students had poor adherence to the MD (63%; p<0.001) and consumed pro-inflammatory diets, as indicated by DII scores greater than zero (62%; p<0.001). High adherence to the MD (37% of all students) was significantly associated with higher PHDI scores (62.17 vs. 51.63 in low adherence; p<0.001). Similarly, students with anti-inflammatory diets (DII < 0) showed significantly higher PHDI scores compared to those with pro-inflammatory diets (62.76 vs. 51.12, respectively; p<0.001).
The mean PHDI across its quartiles was as follows: Q1 38.77 ± 7.52; Q2 52.85 ± 2.49; Q3 62.63 ± 2.52 and Q 4 73.06 ± 6.31; p<0.001 (data not shown). Quartile analysis based on PHDI scores revealed significant differences across several variables. Only 17% of students were categorized in the highest quartile (Q4), with a mean PHDI score of 73.06, which was nearly double that of the lowest quartile (Q1, 38.77; p<0.001). Male students were significantly represented in the second and third quartiles (Q2 57%, Q3 67%; p=0.038), whereas undergraduate students predominantly were in the lowest quartiles (Q1 79%, Q2 51%; p=0.004). Energy intake increased significantly across quartiles, reaching the highest value in Q3 (2692.25 ± 1135.83 kcal/day; p=0.007). MDS scores showed a consistent rising trend across PHDI quartiles (p<0.001), paralleled by a higher proportion of students adhering to anti-inflammatory diets and showing greater adherence to the MD (p<0.001). Conversely, poor adherence to the MD and pro-inflammatory dietary patterns was predominantly observed in the lower quartiles. The lowest quartile (Q1) had 86% of students with poor adherence to the MDS, and 93% of those with the proinflammatory diets (Table 1).
Figure 1 shows the average scores of the 16 PHDI components by quartiles. The 3rd and 4th quartiles had significantly higher scores for nuts and peanuts (p<0.001), legumes (p<0.001), fruits (p<0.001), vegetables (p=0.001), whole grains (p<0.001), eggs (p<0.001), fish (p=0.013), dairy (p<0.001), red meat (p=0.049), animal fats (p<0.001), and added sugars (p<0.001). No significant differences were found in scores for tubers and potatoes (p=0.682), vegetable oils (p=0.192), dark green vegetable ratio (p=0.191), red-to-orange vegetable ratio (p=0.191), or poultry and substitutes (p=0.069).
DGV, Dark green vegetables ratio; ROV, Red and orange vegetables ratio
Table 2 presents the means of energy-adjusted environmental impact indicators regarding students’ demographic, lifestyle, and dietary factors and the quartiles of the Planetary Health Diet Index (PHDI). Men have significantly higher environmental footprints than women across all three indicators (carbon footprint p=0.002; water footprint p=0.017; ecological footprint p<0.001). Level of study, BMI categories, physical activity, and smoking showed weaker or no significant associations with energy-adjusted environmental impact indicators. However, slight trends toward lower environmental impacts were observed among graduates and nonsmokers. Students with obesity showed the highest environmental footprints across all indicators, but differences were not statistically significant (carbon footprint p=0.176; water footprint p=0.242; ecological footprint p=0.278). Regarding physical activity, a slight U-shaped trend was observed where moderately active students had a higher carbon footprint than students engaged in the low or vigorous activities (p=0.216). Students with a diet that more adhered to the MD had somewhat lower water footprint, but this was slightly significant (p=0.052). There were no significant differences between pro-inflammatory and anti-inflammatory diets in relation to environmental impact. Still, there was a clear and strongly inverse relationship between PHDI score and all environmental impact indicators (all p<0.001). Carbon footprint values decreased from 2.46 (Q1) to 2.01 (Q4), water footprint decreased from 2.07 to 1.77 and ecological from 5.43 to 4.35 (Table 2).
Energy-adjusted environmental impact indicators were analyzed in association to the Planetary Health Diet Index (PHDI) (Table 3). A one-point increase in the PHDI score was statistically associated with lower carbon footprint (β=–7.94, p<0.001), water footprint (β=–13.88, p<0.001), and ecological footprint (β=–3.15, p<0.001), even after adjusting for gender, level of study, BMI category, and physical activity level (Table 3). Specifically, each one-point increment in the PHDI was associated with a reduction of 7.94 kg CO₂-eq, 13.88 m³ in water footprint, and 3.15 m³ in ecological footprint per 1000 kcal, after controlling for potential confounders.
Additionally, an analysis was made on the association between PHDI and the average energy-adjusted nutrient intake in students' diets. An one-point increase in the PHDI score was significantly associated with higher dietary intakes of energy (β=2.15, p=0.007), vegetable protein (β=1.94, p<0.001), monounsaturated fatty acids (β=0.80, p<0.001), polyunsaturated fatty acids (β=12.47, p=0.003), omega-3 fatty acids (β=19.26, p<0.001), dietary fiber (β=2.59, p<0.001), alcohol (β=0.36, p=0.020), folate (β 0.13, p<0.001), vitamin C (β=0.19, p<0.001), vitamin E (β=1.57, p 0.001), potassium (β=0.02, p<0.001), magnesium (β=0.18, p<0.001), and iron (β=2.68, p<0.001) (Table 4). Furthermore, flavonoid compounds showed statistically significant positive associations with the PHDI, including flavan-3-ols (β=0.15, p=0.010), flavones (β=7.16, p<0.001), flavanols (β=0.16, p<0.001), flavanones (β 0.11, p=0.008), and anthocyanidins (β=0.23, p=0.004) (Table 4). Conversely, a unit increase in the PHDI score was significantly associated with lower intakes of total protein (β=–0.38, p=0.017), animal protein (β=–0.46, p<0.001), saturated fatty acids (β=–1.67, p<0.001), omega-6 fatty acids (β=–39.76, p<0.001), trans fats (β=–14.50, p<0.001), and sodium (β=–0.01, p=0.027). No significant associations were observed between the PHDI and other nutrients examined (Table 4).
Regarding food groups, higher PHDI scores were significantly associated with increased consumption of nuts and peanuts (β=1.38, p<0.001), legumes (β=1.41, p=0.005), fruits (β=1.40, p<0.001), vegetables (β=3.56, p<0.001), fish (β=0.90, p<0.001), and vegetable oils (β=0.90, p<0.001), as well as a higher MDS (β=4.29, p<0.001) (Table 5). On the other hand, a one-point increase in the PHDI was significantly associated with lower intakes of dairy products (β=–0.46, p<0.001), poultry and meat substitutes (β=–0.90, p<0.001), animal fats (β=–18.11, p<0.001), and added sugars (β=–0.57, p<0.001). A significant inverse association was also observed with the Dietary Inflammatory Index (β=–2.91, p<0.001) (Table 5). This cross-sectional study found no significant associations between overall PHDI scores and the intake of whole grains, eggs, tubers and potatoes, red meat, dark green vegetables ratio, or red to orange vegetables ratio.
4. Discussion
This cross-sectional study examined the dietary patterns of 224 Croatian university students assessed with the Planetary Health Diet Index (PHDI) and focusing on its associations with demographic, lifestyle, nutritional, and environmental impact variables. Study results found significant insights into the relationship between diet quality, environmental sustainability, and health-related behaviours among the young population. Both the Mediterranean Diet (MD) and in this study used PHDI emphasise dietary patterns that promote health and sustainability. While the MD has verified specific health benefits and environmental advantages, the PHDI provides a structured basis for assessing adherence to sustainable dietary patterns across diverse populations. Integrating components from both approaches could give more insights and, by that, enhance public health nutrition strategies specifically aimed at the young population.
The average diet of students had moderate characteristics of the EAT-Lancet planetary health diet (PHD), while every sixth student had a diet that highly adhered to this environment-friendly eating pattern. Male students’ diet had slightly higher PHD characteristics than the diets of female students, although this difference was not statistically significant. This aligns with previous research indicating that gender differences in diet quality can be subtle and context-dependent [42]. Regardless of gender, university students tend to adopt similar unhealthy eating habits due to shared environments like campus cafeterias and limited cooking options [16,43]. Female university students, though, tend to have healthier eating habits and dietary patterns than male students, although unhealthy behaviours are common in both [16,44]. Subtle gender-specific differences in food choices and nutrient intake among students persist, indicating that the university setting only narrows gender differences rather than making distinctions [16,45]. Despite that, the study found that the dietary choices of male students were associated with a more unfavourable impact on the environment compared to the average dietary choices of female students. This study's graduate students had diets more characteristic of the PHD than undergraduates, and which dietary patterns presented significantly greater environmental pressures. It seems that this difference may reflect greater nutritional knowledge or health consciousness among older students [46]. The PHDI has been found to vary by lifestyle factors such as smoking status, with non-smokers showing higher scores [12], which is observed in this study, though without a significant difference. Smoking status was not associated with PHDI nor environmental impact indicators, although smoking and health behaviours often show that smokers have poorer health outcomes and lifestyle habits [47]. The findings of this study are consistent with some studies suggesting that smoking and diet quality may be independent behaviours in young adults [48]. Physical activity level was significantly associated with PHDI scores, with vigorous activity associated with higher diet quality. This supports evidence that physically active individuals tend to adopt healthier dietary patterns, possibly due to greater health motivation [49]. Furthermore, highly active students tend to consume more food to meet their performance needs, which may help them better adhere to the recommended food group intakes in the PHD, leading to higher PHDI scores. However, since the index was adjusted for energy intake, these higher scores indicate improved diet quality and balance rather than just greater food quantity. Obesity is generally recognised for its detrimental impact on both public health and environmental sustainability. Moreover, the dietary patterns that contribute to obesity typically do not align with the principles of the PHDI [12,50]. Several studies have reported an association between greater adherence to PHDI-aligned diets and lower body mass index [51,52,53]. Interestingly, however, other studies [26,54] reported higher compliance with sustainable dietary models among individuals classified as overweight or obese. Regarding these findings, the present study did not observe a statistically significant difference in PHDI scores across BMI categories among university students. A third of them were overweight or obese, which had slightly higher scores than other BMI categories, but the lack of significant differences suggests complex relationships between diet quality and body weight that indicate further longitudinal investigation [55]. It may also indicate the possibility that most students rely on the meal offer in the campus restaurant, meaning that the diet quality can be independent of BMI status in young adults [56].
On average, students’ diet showed poor adherence to the MD, and if the observed dietary patterns continue, it can increase risks of cardiovascular disease, metabolic disorders, some cancers, and neurodegenerative conditions [33,34]. A pro-inflammatory dietary profile of students’ average diet may also elevate risks for hypertension, insulin resistance, depression, and overall mortality [37]. Strong positive associations between PHDI and Mediterranean Diet Score and inverse associations with Dietary Inflammatory Index highlight the relationship of sustainable and anti-inflammatory dietary components that these indices share. Students with high adherence to the Mediterranean Diet and with more anti-inflammatory diets had significantly higher PHDI scores, as both indices capture dietary patterns that favour plant-based foods and are associated with improved nutrient profiles and health outcomes, confirming that diets beneficial for human health often align with planetary health principles [2]. This is also consistent with findings from recent studies indicating that Mediterranean-style diets contribute to both reduced inflammation and environmental impact [33]. The results are consistent to the findings of the EHU12/24 study [23], which reported that better nutritional quality was associated with healthier dietary patterns and a reduced carbon footprint, and to Arrazat et al. [25] who indicated that the environmental impact the Mediterranean Diet may be higher due to increased consumption of certain resource-intensive foods, such as fish and dairy. Currently available studies among university students also discuss the environmental impact of student diets, with findings that are consistent with the trends observed in this study, particularly on gender and Mediterranean Diet adherence [20- 22].
Since both low MD adherence and pro-inflammatory diets have been linked to increased risk of depression and poorer mental well-being, the actions for improvement of student’s dietary patterns are particularly relevant for them, who are in a critical period of cognitive and emotional development [57,58]. Adopting anti-inflammatory diets, such as the Mediterranean diet, can offer protective benefits for mental health in university students, who are not only crossing a critical stage of emotional and cognitive development but also preparing for their future roles as highly educated adults who can positively influence their environment.
The positive associations between PHDI and intakes of plant-based proteins, unsaturated fats, fibre, vitamins, minerals, and flavonoids underscore the nutritional benefits of diets aligned with planetary health principles. The inverse relationships with saturated fats, animal protein, trans fats, and sodium further emphasise the health-promoting nature of higher PHDI scores. These findings support the PHDI’s validity as a marker of both nutritional and environmental quality. This balance of nutrient intake suggests cardiometabolic benefits, reduced inflammation as supported by the inverse association with the Dietary Inflammatory Index, and a dietary pattern that may be protective against non-communicable diseases. The observed nutrient patterns among students are consistent with those observed in Mediterranean and plant-based diets, which have been beneficially associated with reduced chronic disease risk [59,60]. Regarding food groups, students’ higher PHDI scores were associated with adequate consumption of nuts, legumes, fruits, vegetables, whole grains, eggs, fish, dairy, animal fats, and added sugars. These observations are similar to the study conducted among the university population [26] and are consistent with findings from other recent studies of university students’ diets [23,25]. These dietary patterns reflect the emphasis of the PHD on plant-based foods and limited animal products, supporting both health and environmental sustainability [2]. Furthermore, the findings of this and similar studies reinforce the potential of the PHD model not only as a sustainable basis but also as a strategy for chronic disease prevention.
Interestingly, higher environmental impact indicators among observed subgroups of students may reflect higher overall energy intake or specific food choices that have higher resource demands [61], although this was significant only among men students. Reduced intake of animal fats, dairy, and processed foods, which are resource-intensive and contribute more to greenhouse gas emissions and land use, was also highly associated with the EAT-Lancet Planetary Health Diet in this study. However, adjusted for energy intake, higher PHDI scores were significantly associated with lower environmental impacts, indicating that diet quality improvements can reduce environmental burdens when controlling for the energy density of the diet. This finding aligns with previous research demonstrating that adopting planetary health diets can reduce per-calorie environmental footprints [62].
Strengths and Limitations
This cross-sectional study gave valuable insight into the dietary patterns of Croatian university students and their evaluation of the sustainability and environmental impact. According to the authors' present knowledge, this is the first research with these objectives among Croatian students. It is also the first study to use the PHDI and DII indices to assess the quality of the diet of Croatian students, and is the first to assess the ecological impact of their diet. Based on the study findings, the authors highlight the potential for university settings to act as intervention places for promoting sustainable and health-conscious dietary behaviors. This study has several limitations that should be acknowledged. First, its cross-sectional design prevents any interpretation of causality. Second, dietary intake data were self-reported and may be subject to recall bias, potentially affecting the accuracy of the findings. However, this was minimized by the assistance of an educated researcher during the fulfilment of the questionnaires. Although the sample included students from varying levels of studying, it was limited to university students, which may limit the generalizability of the results to the general Croatian population. Furthermore, the environmental impact estimates were derived from dietary intake data using standardized life cycle assessment metrics, which may not fully account for individual-level variability in food sourcing and production practices. The study was conducted entirely among students attending the University of Rijeka, and thus, the findings may not be representative of dietary patterns among students at other Croatian universities. These limitations underscore the need for further observational research involving a broader student population across multiple university institutions in Croatia. Such studies could provide a more comprehensive understanding of student dietary behaviors and inform specific strategies to improve both nutritional health and environmental sustainability among young adults.
5. Conclusions
The present study findings indicate a moderate level of adherence of their average diet to the Planetary Health Diet, with significantly higher adherence observed among graduate students and those with higher levels of physical activity. The study objectives confirmed strong associations with health-promoting dietary patterns assessed with indices such as the Mediterranean Diet Score and the Dietary Inflammatory Index. Although gender-based differences were found, male students’ diets tended to have a greater environmental impact. Importantly, higher diet quality was linked to reduced environmental burdens when adjusted for energy intake, strengthening the evidence for human and planetary health benefits of sustainable diets. However, diets characterized by greater adherence to planetary health principles may still express considerable variation in environmental impact, depending upon specific food selections and patterns of consumption [63]. Implementing strategies in university settings, such as educational initiatives, food cafeteria improvements, and behavior change interventions, has the potential to deliver benefits for individual and planetary environmental health, both important for the quality future of the young population [64]. Future research should explore longitudinal relationships to clarify causal pathways between diet quality, health outcomes, and environmental impacts among university students. Furthermore, qualitative studies could investigate barriers and facilitators to adopting planetary health diets among university students to inform tailored nutrition education programs. The observed complexity of diet-weight associations suggests that future research should explore longitudinal outcomes of sustainable dietary patterns and the role of campus food environments. Additionally, the independent relationship between smoking and diet quality indicates the need for integrated health behavior interventions. Future studies should also investigate the causal pathways between dietary habits, nutritional knowledge, lifestyle behaviors including physical activity, and environmental sustainability in university student populations from more universities in Croatia. Findings also underscore the importance of creating supportive university environments that facilitate access to nutritious and environmentally sustainable food options [65]. Examples may include an increase in the availability and visibility of plant-based, locally sourced, nutrient-dense and sustainably produced food options in cafeterias and dining places [66]. Furthermore, introducing a sustainability and health labelling on food and meals may help students identify environmentally friendly choices associated with the PHD and Mediterranean diet [66,67], while encouraging student populations to use application tools for diet assessments, they can foster awareness and self-monitoring of the ecological footprint of their dietary choices [68]. To increase awareness and empower students to make informed decisions, workshops and educational programs on sustainable cooking, meal planning, and the environmental impact of food choices can also be applied. Finally, this study findings can inform university and national policies on student nutrition, sustainability goals, and chronic disease prevention strategies aligned with planetary health frameworks. Updating national dietary guidelines as a reflection of the latest evidence on healthy and sustainable eating is important for improving health and reducing environmental impacts, and can complement broader and more explicit criteria of sustainability [69].
Author Contributions
Conceptualization, GKJ, SPŽ and GK; methodology, GKJ; software, GKJ and ED; validation, GKJ, ED, SPŽ and GK; formal analysis, GKJ and ED; investigation, GKJ, SPŽ, ED and GK; data curation, SPŽ; writing—original draft preparation, GKJ.; writing—review and editing, GKJ, SPŽ, ED and GK.; visualization, GKJ; supervision, GKJ and SPŽ.; project administration, ED.; funding acquisition, SPŽ. All authors have read and agreed to the published version of the manuscript.
Funding
This research was funded by the UNIVERSITY OF RIJEKA, grant number uniri-iskusni-biomed-23-89. The APC was funded by The University of Rijeka.
Institutional Review Board Statement
The study was conducted in accordance with the Declaration of Helsinki, and approved by the Institutional Ethics Committee of Teaching Institute of Public Health of Primorsko-goranska County (Approval No: 04-400-139/2-22; approval date 7 April 2022).
Informed Consent Statement
Informed consent was obtained from all subjects involved in the study.Written informed consent has been obtained from the participants to publish this paper.
Data Availability Statement
The data presented in this study are available on request from the corresponding author due to participants’ privacy and ethical reasons.
Acknowledgments
The authors wish to thank all the participants involved in this study, to administrative personnel, the university professors, as well as the healthcare professionals who helped with the measurements and data collections.
Conflicts of Interest
The authors declare no conflicts of interest. The funders had no role in the design of the study; in the collection, analyses, or interpretation of data; in the writing of the manuscript; or in the decision to publish the results.
Abbreviations
The following abbreviations are used in this manuscript:
| NCDs | Non-communicable diseases |
| PHD | Planetary Health Diet |
| MD | Mediterranean Diet |
| IPAQ-LF | International Physical Activity Questionnaire—Long Form |
| FFQ | Food Frequency Questionnaire |
| MET | Metabolic Equivalent of Task |
| BMI | Body mass index |
| PHDI | Planetary Health Diet Index |
| MDS | Mediterranean Diet Score |
| DII | Dietary Inflammatory Index |
References
- Fanzo, J.; Davis, C. Can diets be healthy, sustainable, and equitable? Current Obesity Reports 2019, 8(4), 495–503. [Google Scholar] [CrossRef] [PubMed]
- Willett, W.; Rockström, J.; Loken, B.; et al. Food in the Anthropocene: The EAT–Lancet Commission on healthy diets from sustainable food systems. The Lancet 2019, 0170), 447–492. [Google Scholar] [CrossRef] [PubMed]
- Tilman, D.; Clark, M. Global diets link environmental sustainability and human health. Nature 2014, 515(7528), 518–522. [Google Scholar] [CrossRef] [PubMed]
- Li, J.; Pandian, V.; Davidson, P. M.; Song, Y.; Chen, N.; Fong, D. Y. T. Burden and attributable risk factors of non-communicable diseases and subtypes in 204 countries and territories, 1990–2021: A systematic analysis for the Global Burden of Disease Study 2021. International Journal of Surgery 2025, 111(3), 2385–2397. [Google Scholar] [CrossRef]
- Institute for Health Metrics and Evaluation. Dietary risks – Level 2 risk. Institute for Health Metrics and Evaluation. 2024. https://www.healthdata.org/research-analysis/diseases-injuries-risks/factsheets/2021-dietary-risks-level-2-risk (accessed on 2 April 2024).
- Steel, N.; Bauer-Staeb, C. M. M.; Ford, J. A.; et al. Changing life expectancy in European countries 1990–2021: A subanalysis of causes and risk factors from the Global Burden of Disease Study 2021. The Lancet Public Health 2025, 10(3), e172–e188. [Google Scholar] [CrossRef]
- OECD; FAO. Environmental sustainability in agriculture 2023; Rome, Italy, 2023. [CrossRef]
- FAO. Greenhouse gas emissions from agrifood systems – Global, regional and country trends, 2000–2022; FAOSTAT Analytical Brief Series, No. 94; Rome, Italy, 2024. https://openknowledge.fao.org/handle/20.500.14283/cd3167en.
- FAO. Land statistics 2001–2022 – Global, regional and country trends; FAOSTAT Analytical Briefs, No. 88; Rome, Italy, 2024. [CrossRef]
- FAO. The State of Food and Agriculture 2024 – Value-driven transformation of agrifood systems; Rome, Italy, 2024c. [CrossRef]
- FAO. Sustainable Diets and Biodiversity – Directions and solutions for policy, research and action; Proceedings of the International Scientific Symposium on Biodiversity and Sustainable Diets: United Against Hunger; Rome, Italy, 2012. https://openknowledge.fao.org/handle/20.500.14283/i3004e.
- Cacau, L.T.; De Carli, E.; de Carvalho, A.M.; et al. Development and validation of an index based on EAT-Lancet recommendations: The Planetary Health Diet Index. Nutrients 2021, 13, 1698. [Google Scholar] [CrossRef]
- Aleksandrowicz, L.; Green, R.; Joy, E.J.M.; Smith, P.; Haines, A. The impacts of dietary change on greenhouse gas emissions, land use, water use, and health: A systematic review. PLOS ONE 2016, 11, e0165797. [Google Scholar] [CrossRef]
- Raghoebar, S.; Mesch, A.; Gulikers, J.; Winkens, L.H.H.; Wesselink, R.; Haveman-Nies, A. Experts’ perceptions on motivators and barriers of healthy and sustainable dietary behaviors among adolescents: The SWITCH project. Appetite 2024, 194, 107196. [Google Scholar] [CrossRef]
- Jurado-Gonzalez, P.; López-Toledo, S.; Bach-Faig, A.; Medina, F.-X. Barriers and enablers of healthy eating among university students in Oaxaca de Juarez: A mixed-methods study. Nutrients 2025, 17, 1263. [Google Scholar] [CrossRef]
- Almoraie, N.M.; Alothmani, N.M.; Alomari, W.D.; Al-Amoudi, A.H. Addressing nutritional issues and eating behaviours among university students: A narrative review. Nutr Res Rev 2025, 38, 53–68. [Google Scholar] [CrossRef]
- Pfeifer, D.; Rešetar, J.; Šteković, M.; Czlapka-Matyasik, M.; Verbanac, D.; Gajdoš Kljusurić, J. Diet quality and its association with lifestyle and dietary behaviors among Croatian students during two COVID-19 lockdowns. Foods 2023, 12, 2532. [Google Scholar] [CrossRef] [PubMed]
- Mieziene, B.; Burkaite, G.; Emeljanovas, A.; Tilindiene, I.; Novak, D.; Kawachi, I. Adherence to Mediterranean diet among Lithuanian and Croatian students during COVID-19 pandemic and its health behavior correlates. Front Public Health 2022, 10, 1000161. [Google Scholar] [CrossRef]
- Pavičić Žeželj, S.; Dragaš Zubalj, N.; Fantina, D.; Krešić, G.; Kenđel Jovanović, G. Adherence to Mediterranean diet in University of Rijeka students. Paediatr Croat 2019, 63, 31. [Google Scholar] [CrossRef]
- Tayhan, F.; Helvacı, G. Evaluation of university students' Mediterranean diet quality and sustainable eating behaviors: A cross-sectional study. Int. J. Environ. Health Res 2025, 35, 245–256. [Google Scholar] [CrossRef]
- Yolcuoğlu, İ. Z.; Kızıltan, G. Effect of nutrition education on diet quality, sustainable nutrition and eating behaviors among university students. Journal of the American Nutrition Association 2022, 41(7), 713–719. [Google Scholar] [CrossRef]
- Pınarlı Falakacılar, Ç.; Yücecan, S. The impact of sustainability courses: Are they effective in improving diet quality and anthropometric indices? Nutrients 2024, 16(11), 1700. [Google Scholar] [CrossRef]
- Telleria-Aramburu, N.; Bermúdez-Marín, N.; Rocandio, A. M.; et al. Nutritional quality and carbon footprint of university students' diets: Results from the EHU12/24 study. Public Health Nutrition 2022, 25(1), 183–195. [Google Scholar] [CrossRef]
- Arrazat, L.; Nicklaus, S.; de Lauzon-Guillain, B.; Marty, L. Behavioural determinants of healthy and environmentally friendly diets in French university students. Appetite 2024, 200, 107532. [Google Scholar] [CrossRef]
- Arrazat, L.; Nicklaus, S.; de Lauzon-Guillain, B.; Marty, L. Identification of three dietary groups in French university students and their associations with nutritional quality and environmental impact. Frontiers in Nutrition 2023, 10, 1323648. [Google Scholar] [CrossRef]
- Mortaş, H.; Navruz-Varlı, S.; Bilici, S. Adherence to the Planetary Health Diet and its association with diet quality in the young adult population of Türkiye: A large cross-sectional study. Nutrients 2024, 16(6), 868. [Google Scholar] [CrossRef]
- O’Leary, M.; Mooney, E.; McCloat, A. The relationship between nutrition knowledge and dietary intake of university students: A scoping review. Dietetics 2025, 4(2), 16. [Google Scholar] [CrossRef]
- Craig, C. L.; Marshall, A. L.; Sjöström, M.; et al. International physical activity questionnaire: 12-country reliability and validity. Medicine & Science in Sports & Exercise 2003, 35(8), 1381–1395. [CrossRef]
- Willett, W.; Sampson, L.; Stampfer, M. J.; et al. Reproducibility and validity of a semiquantitative food frequency questionnaire. American Journal of Epidemiology 1985, 122(1), 51–65. [Google Scholar] [CrossRef] [PubMed]
- Kaić-Rak, A.; Antonić, K. Tablice o sastavu namirnica i pića. Zavod za Zaštitu Zdravlja SR Hrvatske. 1990.
- National Food Institute, Technical University of Denmark. Food data (Version 4.2). Technical University of Denmark. 2022. Available online: https://frida.fooddata.dk/index.php?lang=en (accessed on day month year).
- U.S. Department of Agriculture, Agricultural Research Service. FoodData Central. U.S. Department of Agriculture. 2019. Available online: https://fdc.nal.usda.gov/ (accessed on day month year).
- Sofi, F.; Cesari, F.; Abbate, R.; Gensini, G. F.; Casini, A. Adherence to Mediterranean diet and health status: Meta-analysis. BMJ 2020, 337, a1344. [Google Scholar] [CrossRef] [PubMed]
- Serra-Majem, L.; Román-Viñas, B.; Sanchez-Villegas, A.; Guasch-Ferré, M.; Corella, D.; La Vecchia, C. Benefits of the Mediterranean diet: Epidemiological and molecular aspects. Molecular Aspects of Medicine 2019, 67, 1–55. [Google Scholar] [CrossRef]
- Germani, A.; Vitiello, V.; Giusti, A. M.; Pinto, A.; Donini, L. M.; Del Balzo, V. Environmental and economic sustainability of the Mediterranean diet. International Journal of Food Sciences and Nutrition 2014, 65(8), 1008–1012. [Google Scholar] [CrossRef]
- Dernini, S., Berry, E. M., Serra-Majem, L., La Vecchia, C., Capone, R., Medina, F. X., Aranceta-Bartrina, J., Belahsen, R., Burlingame, B., Calabrese, G.; Corella, D.; Donini, L. M.; et al. Med Diet 4.0: The Mediterranean diet with four sustainable benefits. Public Health Nutrition 2017, 20(7), 1322–1330. [CrossRef]
- Marx, W; Veronese, N.; Kelly, J. T.; et al. The dietary inflammatory index and human health: An umbrella review of meta-analyses of observational studies. Advances in Nutrition 2021, 12(5), 1681–1690. [CrossRef]
- Shivappa, N.; Steck, S. E.; Hurley, T. G.; Hussey, J. R.; Hébert, J. R. Designing and developing a literature-derived, population-based dietary inflammatory index. Public Health Nutrition 2014, 17(8), 1689–1696. [Google Scholar] [CrossRef]
- Mertens, E.; Kaptijn, G.; Kuijsten, A.; van Zanten, H. H. E.; Geleijnse, J. M.; van 't Veer, P. SHARP Indicators Database (Version 2) [Dataset]. DANS Data Station Life Sciences. 2019. [CrossRef]
- Petersson, T.; Secondi, L., Magnani, A.; Antonelli, M.; Dembska, K.; Valentini, R.; Varotto, A.; Castaldi, S. SU-EATABLE LIFE: A comprehensive database of carbon and water footprints of food commodities [Dataset]. figshare. 2021. [CrossRef]
- Willett, W. C. , Howe, G. R.; Kushi, L. H. Adjustment for total energy intake in epidemiologic studies. The American Journal of Clinical Nutrition 1997, 65(4 Suppl), 1220S–1231S. [Google Scholar] [CrossRef]
- Mertens, E.; Kuijsten, A. , Feskens, E. J. M. Gender differences in diet quality and nutrient intake in European adults. European Journal of Nutrition 2020, 59(3), 1241–1252. [Google Scholar] [CrossRef]
- Alkazemi, D. Gender differences in weight status, dietary habits, and health attitudes among college students in Kuwait: A cross-sectional study. Nutrition and Health 2019, 25(2), 75–84. [Google Scholar] [CrossRef]
- Gil, M.; Rudy, M.; Stanisławczyk, R.; Duma-Kocan, P.; Żurek, J. Gender differences in eating habits of Polish young adults aged 20–26. International Journal of Environmental Research and Public Health 2022, 19(22), 15280. [Google Scholar] [CrossRef]
- Sprake, E. F., Russell, J. M., Cecil, J. E., et al. Dietary patterns of university students in the UK: A cross-sectional study. Nutrition Journal 2018, 17(1), 90. [CrossRef]
- Valli, C.; D’Addezio, L., Rosi, A. Educational level and diet quality: A systematic review. Nutrients 2022, 14(5), 1035. [CrossRef]
- Alruwaili, A.; King, J. A.; Deighton, K.; et al. The association of smoking with different eating and dietary behaviours: A cross-sectional analysis of 80,296 United Kingdom adults. Addiction 2024, 119(10), 1737–1750. [Google Scholar] [CrossRef] [PubMed]
- Kim, S. A.; Park, S.; Kim, J. Associations between smoking status and diet quality among Korean adults. Nutrition Research and Practice 2019, 13(3), 212–220. [Google Scholar] [CrossRef]
- Martins, C.; Silva, A.; Lopes, C. Physical activity and diet quality in university students: A cross-sectional study. Public Health Nutrition 2021, 24(15), 4806–4814. [Google Scholar] [CrossRef]
- Macit-Çelebi, M. S.; Bozkurt, O.; Kocaadam-Bozkurt, B.; Köksal, E. Evaluation of sustainable and healthy eating behaviors and adherence to the Planetary Health Diet Index in Turkish adults: A cross-sectional study. Frontiers in Nutrition 2023, 10, 1180880. [Google Scholar] [CrossRef]
- Cacau, L. T.; Benseñor, I. M.; Goulart, A. C.; Cardoso, L. O.; Lotufo, P. A.; Moreno, L. A.; Marchioni, D. M. Adherence to the Planetary Health Diet Index and obesity indicators in the Brazilian Longitudinal Study of Adult Health (ELSA-Brasil). Nutrients 2021, 13, 3691. [Google Scholar] [CrossRef]
- Kocaadam-Bozkurt, B.; Bozkurt, O. Relationship between adherence to the Mediterranean diet, sustainable and healthy eating behaviors, and awareness of reducing the ecological footprint. International Journal of Environmental Health Research 2023, 33, 430–440. [Google Scholar] [CrossRef]
- Seconda, L.; Egnell, M.; Julia, C.; et al. Association between sustainable dietary patterns and body weight, overweight, and obesity risk in the NutriNet-Santé prospective cohort. American Journal of Clinical Nutrition 2020, 112(1), 138–149. [Google Scholar] [CrossRef]
- Marchioni, D. M.; Cacau, L. T.; De Carli, E.; Carvalho, A. M.; Rulli, M. C. Low adherence to the EAT-Lancet sustainable reference diet in the Brazilian population: Findings from the National Dietary Survey 2017–2018. Nutrients 2022, 14(6), 1187. [Google Scholar] [CrossRef]
- Smith, L.; Jacob, L.; Firth, J. Dietary patterns and obesity in young adults: A systematic review. Obesity Reviews 2023, 24(1), e13456. [Google Scholar] [CrossRef]
- Asghari, G.; Mirmiran, P.; Yuzbashian, E.; Azizi, F. A systematic review of diet quality indices in relation to obesity. British Journal of Nutrition 2017, 117(8), 1055–1065. [Google Scholar] [CrossRef]
- Camprodon-Boadas, P.; Gil-Dominguez, A.; De la Serna, E.; Sugranyes, G.; Lázaro, I.; Baeza, I. Mediterranean diet and mental health in children and adolescents: A systematic review. Nutrition Reviews 2025, 83(2), e343–e355. [Google Scholar] [CrossRef] [PubMed]
- Li, X.; Chen, M.; Yao, Z.; Zhang, T.; Li, Z. Dietary inflammatory potential and the incidence of depression and anxiety: A meta-analysis. Journal of Health, Population and Nutrition 2022, 41(1), 24. [CrossRef]
- Schwingshackl, L.; Hoffmann, G.; Lampousi, A. M. Adherence to Mediterranean diet and risk of cancer: An updated systematic review and meta-analysis. Nutrients 2017, 9(10), 1063. [Google Scholar] [CrossRef]
- Tang, H.; Zhang, X.; Luo, N.; et al. Temporal trends in the Planetary Health Diet Index and its association with cardiovascular, kidney, and metabolic diseases: A comprehensive analysis from global and individual perspectives. Journal of Nutrition, Health & Aging 2025, 29(5), 100520. [CrossRef]
- Clark, M.; Springmann, M.; Hill, J.; Tilman, D. Multiple health and environmental impacts of foods. Proceedings of the National Academy of Sciences 2020, 117(24), 13857–13866. [Google Scholar] [CrossRef]
- Springmann, M.; Godfray, H. C. J.; Rayner, M.; Scarborough, P. Analysis and valuation of the health and climate change co-benefits of dietary change. Proceedings of the National Academy of Sciences 2018, 113(15), 4146–4151. [Google Scholar] [CrossRef]
- Ye, Y. X.; Geng, T. T.; Zhou, Y. F.; et al. Adherence to a Planetary Health Diet, environmental impacts, and mortality in Chinese adults. JAMA Network Open 2023, 6(10), e2339468. [Google Scholar] [CrossRef]
- Grech, A.; Howse, E.; Boylan, S. A scoping review of policies promoting and supporting sustainable food systems in the university setting. Nutrition Journal 2020; 19, 97. [CrossRef]
- Franchini, C.; Biasini, B. , Rosi, A.; Scazzina, F. Best practices for making the university campus a supportive environment for healthy and sustainable diets. Current Opinion in Environmental Science & Health 2023, 32, 100436. [Google Scholar] [CrossRef]
- Graça, J.; Campos, L.; Guedes, D.; Roque, L.; Brazão, V.; Truninger, M.; Godinho, C. How to enable healthier and more sustainable food practices in collective meal contexts: A scoping review. Appetite 2023, 187, 106597. [Google Scholar] [CrossRef]
- Harrison, L.; Herrmann, A.; Quitmann, C.; Stieglbauer, G.; Zeitz, C.; Franke, B.; Danquah, I. Effects of a cafeteria-based sustainable diet intervention on the adherence to the EAT-Lancet planetary health diet and greenhouse gas emissions of consumers: A quasi-experimental study at a large German hospital. Nutrition Journal 2024, 23(1), 80. [Google Scholar] [CrossRef]
- Aguilos, M.; Leggett, Z.; Jeffries, S.; Lupek, M.; Ardon, M. University students’ ecological footprint and lifestyle changes: Awareness vs. action. Education Sciences 2025, 15(4), 432. [Google Scholar] [CrossRef]
- Springmann, M.; Wiebe, K.; Mason-D' Croz, D.; Sulser, T. B.; Rayner, M.; Scarborough, P. Health and nutritional aspects of sustainable diet strategies and their association with environmental impacts: A global modelling analysis with country-level detail. The Lancet Planetary Health 2018, 2(10), e451–e461. [Google Scholar] [CrossRef]
Figure 1.
Average scores of the 16 Planetary Health Diet Index (PHDI) components among 224 Croatian university students across the PHDI quartiles.
Figure 1.
Average scores of the 16 Planetary Health Diet Index (PHDI) components among 224 Croatian university students across the PHDI quartiles.
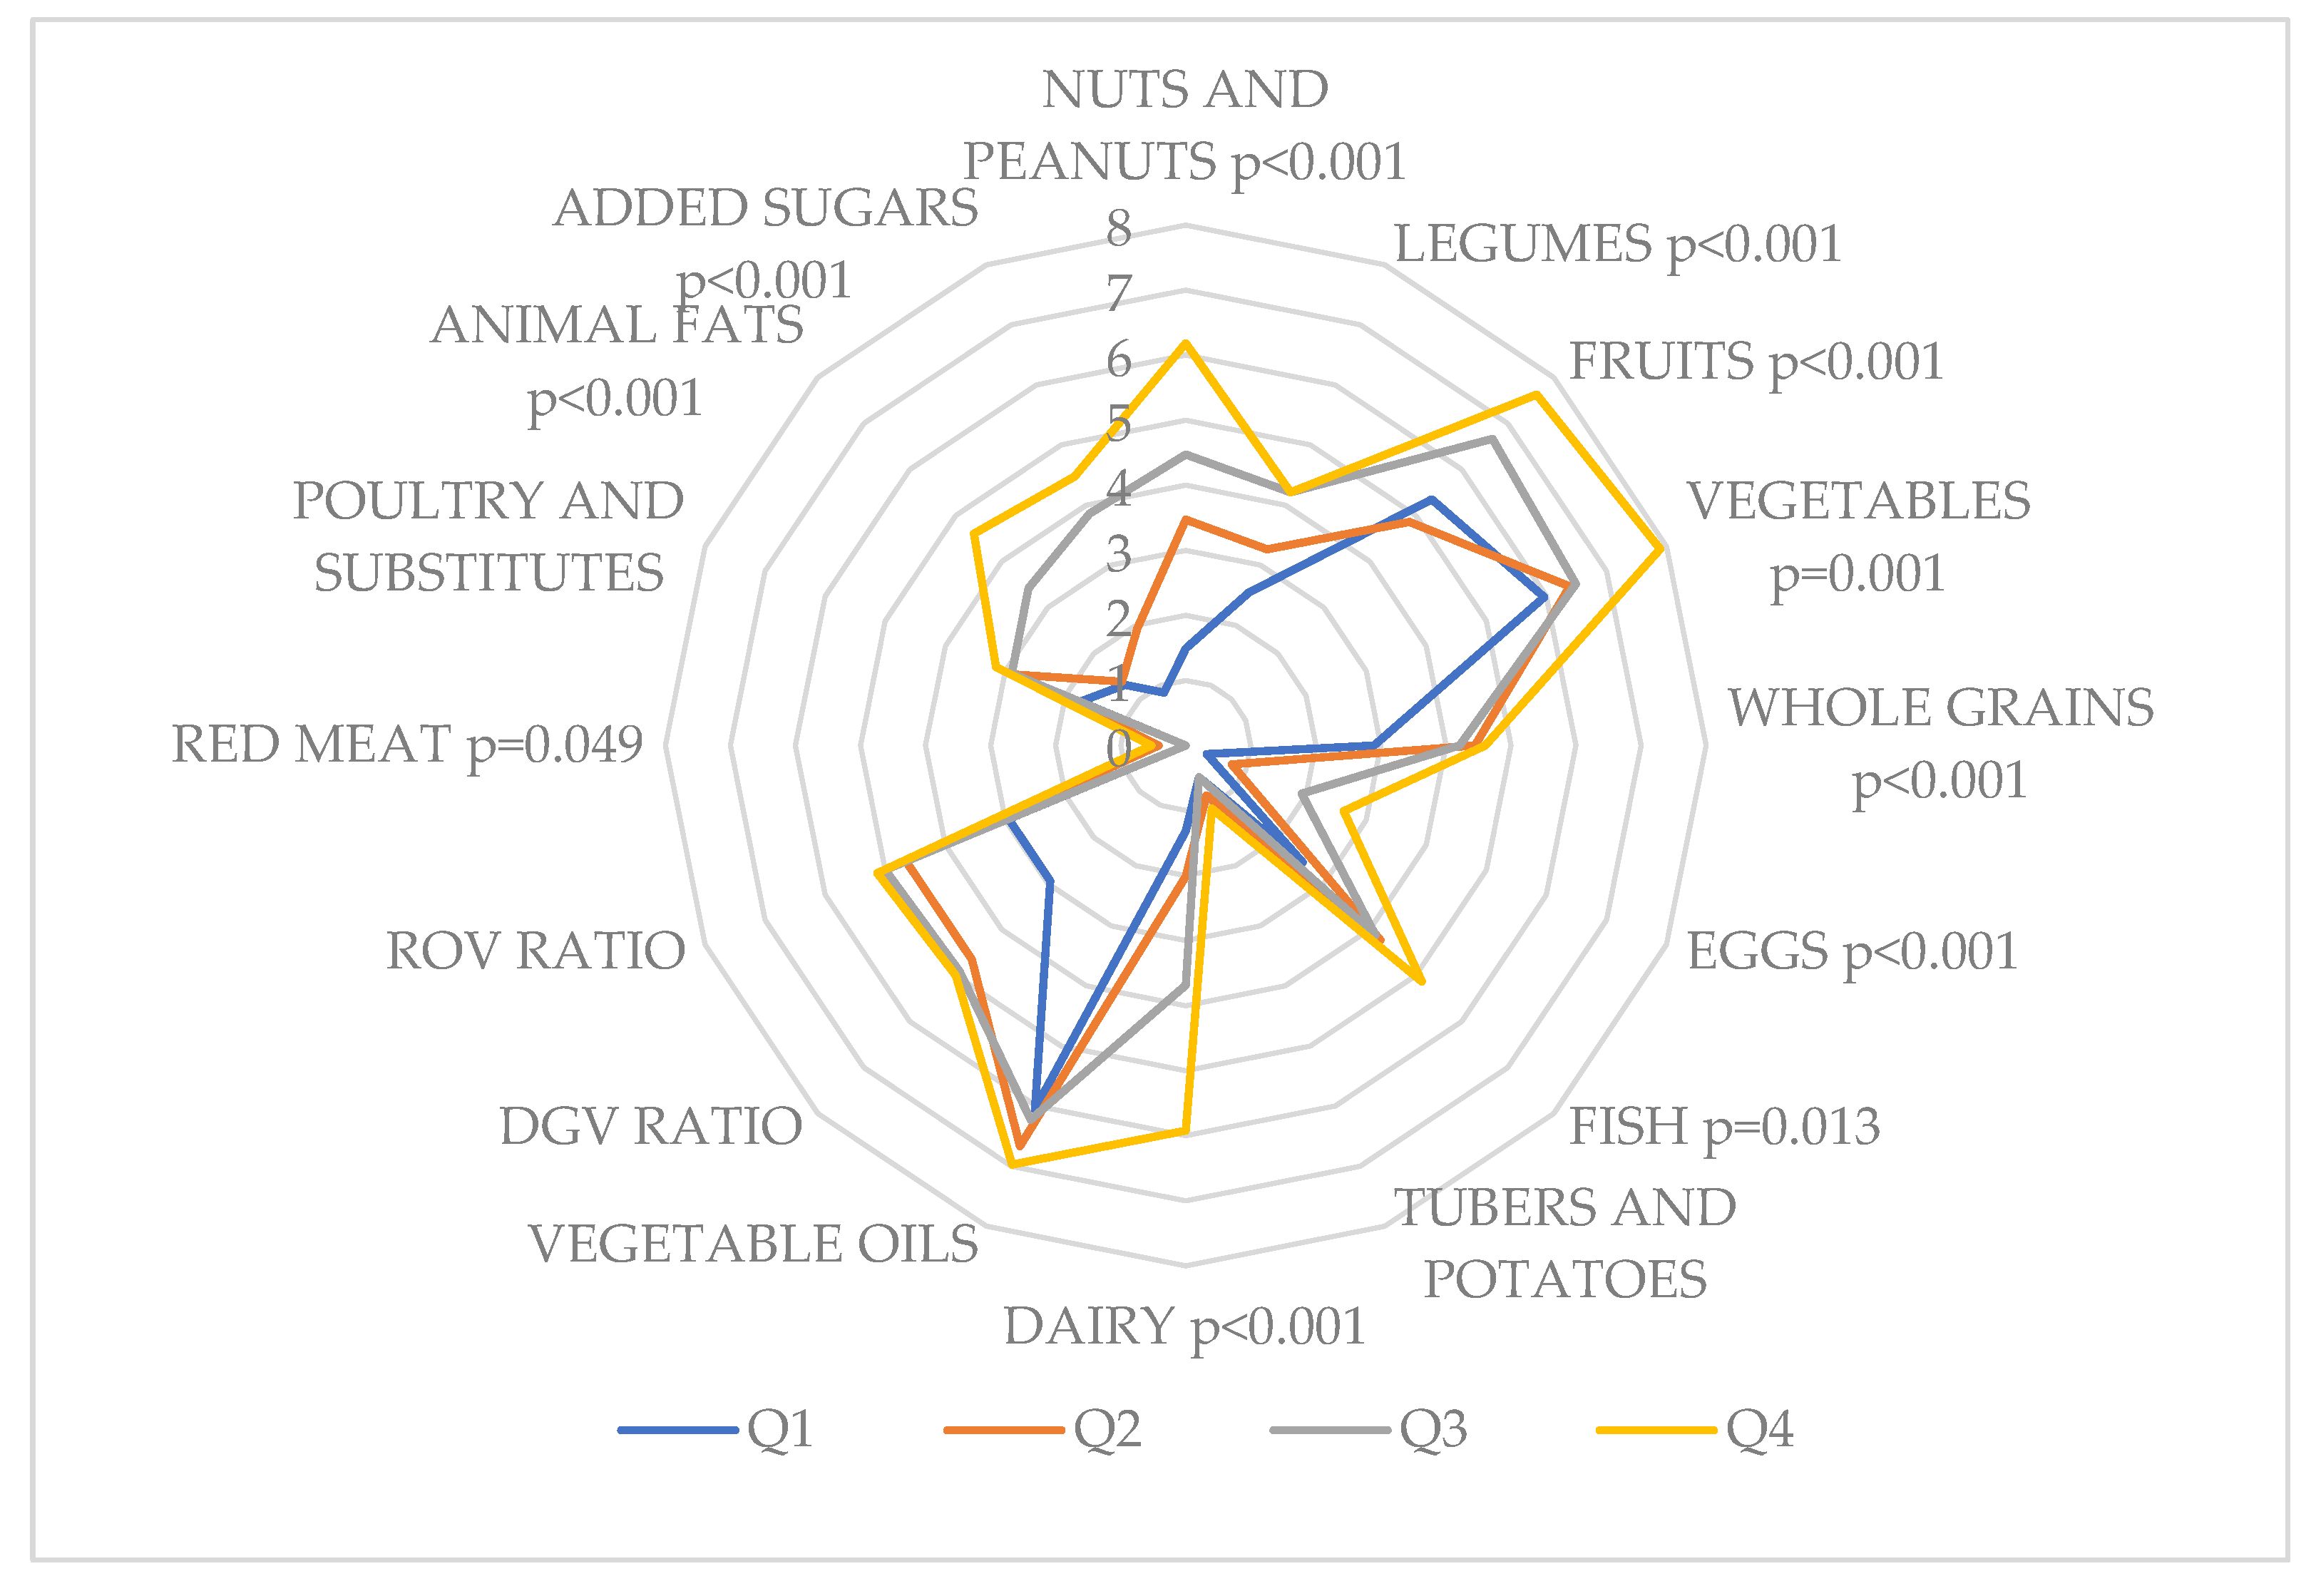

Table 1.
Characteristics of 224 Croatian university students according to the Planetary Health Diet Index (PHDI) quartiles (N (%) or mean ± SD).
Table 1.
Characteristics of 224 Croatian university students according to the Planetary Health Diet Index (PHDI) quartiles (N (%) or mean ± SD).
| Variables | N (%) | p-value | Planetary Health Diet Index | p-value | Quartile 1 (20-45) |
Quartile 2 (46-55) |
Quartile 3 (56-65) |
Quartile 4 (66-100) |
p-value |
| N | 224 (100) | 55.54 ± 13.30 | 57 (25) | 72 (32) | 57 (25) | 38 (17) | 0.019 | ||
| Men | 121 (54) | 0.229 | 56.96 ± 11.10 | 0.086 | 23 (40) | 41 (57) | 38 (67) | 19 (50) | 0.038 |
| Women | 103 (46) | 53.87 ± 15.48 | 34 (60) | 31 (43) | 19 (33) | 19 (50) | |||
| Age (years) | 22.67 ± 2.19 | 22.44 ± 1.97 | 22.89 ± 2.33 | 22.67 ± 2.25 | 22.58 ± 2.18 | 0.704 | |||
| Level of study | |||||||||
| Undergraduate | 118 (53) | 0.423 | 54.87 ± 12.50 | 0.188 | 45 (79) | 37 (51) | 27 (47) | 20 (53) | 0.004 |
| Graduate | 106 (47) | 56.27 ± 14.16 | 12 (21) | 35 (49) | 30 (53) | 18 (47) | |||
| Nonsmokers | 168 (75) | <0.001 | 55.83 ± 13.62 | 0.563 | 46 (81) | 51 (71) | 41 (72) | 30 (79) | 0.521 |
| Smokers | 56 (25) | 54.64 ± 12.35 | 11 (19) | 21 (29) | 16 (28) | 8 (21) | |||
| Body mass index (kg/m2) | 24.11 ± 3.50 | 23.29 ± 2.93 | 24.55 ± 3.86 | 24.08 ± 3.50 | 24.65 ± 3.50 | 0.181 | |||
| Underweight | 6 (3) | <0.001 | 53.33 ± 10.33 | 0.750 | 3 (5) | 1 (1) | 1 (2) | 1 (2) | 0.653 |
| Normal weight | 139 (62) | 54.93 ± 13.12 | 37 (65) | 43 (60) | 39 (68) | 20 (53) | |||
| Overweight | 64 (28) | 56.56 ± 13.74 | 15 (26) | 23 (32) | 12 (21) | 14 (37) | |||
| Obesity | 15 (7) | 57.67 ± 14.74 | 2 (4) | 5 (7) | 5 (9) | 3 (8) | |||
| Physical activity level | |||||||||
| Low | 45 (20) | <0.001 | 57.13 ± 11.32 | 0.101 | 11 (19) | 15 (21) | 12 (21) | 7 (18) | 0.001 |
| Moderate | 99 (44) | 53.98 ± 13.98 | 35 (62) | 37 (51) | 16 (28) | 11 (29) | |||
| Vigorous | 80 (36) | 58.27 ± 12.56 | 11 (19) | 20 (28) | 29 (51) | 20 (53) | |||
| Energy intake (kcal/day) | 2397.59 ± 1197.53 | 1951.67 ± 1233.90 | 2465.86 ± 1164.32 | 2692.25 ± 1135.83 | 2495.12 ± 1151.53 | 0.007 | |||
| Mediterranean Diet Score (MDS) | 4.00 ± 1.47 | 3.04 ± 1.27 | 3.96 ± 1.41 | 4.46 ± 1.39 | 4.82 ± 1.20 | <0.001 | |||
| Low adherence (MDS≤4) | 141 (63) | <0.001 | 51.63 ± 12.78 | <0.001 | 49 (86) | 49 (68) | 29 (51) | 14 (37) | <0.001 |
| High adherence (MDS ≥5) | 83 (37) | 62.17 ± 11.45 | 8 (14) | 23 (32) | 28 (49) | 24 (63) | |||
| Dietary Inflammatory Index (DII) |
1.07 ± 2.62 | 3.03 ± 2.13 | 1.25 ± 2.49 | -0.19 ± 2.13 | -0.31 ± 2.29 | <0.001 | |||
| Proinflammatory diet (DII > 0) | 139 (62) | <0.001 | 51.12 ± 13.28 | <0.001 | 53 (93) | 47 (65) | 25 (44) | 14 (37) | <0.001 |
| Anti-inflammatory diet (DII < 0) | 85 (38) | 62.76 ± 9.71 | 4 (7) | 25 (35) | 32 (14) | 24 (63) | |||
* Ordinal data are tested with a Chi-squared test; numerical data with an ANOVA test.
Table 2.
Energy-adjusted environmental impact indicators regarding demographic, lifestyle, and dietary characteristics of 224 Croatian university students (mean ± SD).
Table 2.
Energy-adjusted environmental impact indicators regarding demographic, lifestyle, and dietary characteristics of 224 Croatian university students (mean ± SD).
| Variables | Carbon footprint (kg CO2 eqv.)/1000 kcal |
Water footprint (m3)/1000 kcal |
Ecological footprint (m2*year)/1000 kcal |
|---|---|---|---|
| Total | 2.22 ± 0.53 | 1.90 ± 0.34 | 4.83 ± 1.37 |
| Men | 2.33 ± 0.53 | 1.95 ± 0.34 | 5.13 ± 1.33 |
| Women | 2.11 ± 0.50 | 1.74 ± 0.34 | 4.47 ± 1.33 |
| p-value | 0.002 | 0.017 | <0.001 |
| Level of study | |||
| Undergraduate | 2.27 ± 0.43 | 1.93 ± 0.31 | 4.98 ± 1.22 |
| Graduate | 2.17 ± 0.57 | 1.87 ± 0.37 | 4.65 ± 1.50 |
| p-value | 0.137 | 0.186 | 0.077 |
| Smoking status | |||
| Smokers | 2.25 ± 0.55 | 1.89 ± 0.34 | 4.81 ± 1.34 |
| Nonsmokers | 2.21 ± 0.53 | 1.90 ± 0.34 | 4.83 ± 1.38 |
| p-value | 0.643 | 0.812 | 0.920 |
| BMI category | |||
| Underweight | 2.26 ± 0.29 | 1.86 ± 0.12 | 4.76 ± 0.66 |
| Normal weight | 2.22 ± 0.57 | 1.91 ± 0.37 | 4.83 ± 1.48 |
| Overweight | 2.15 ± 0.48 | 1.85 ± 0.30 | 4.67 ± 1.23 |
| Obesity | 2.49 ± 0.32 | 2.05 ± 0.21 | 5.43 ± 0.78 |
| p-value | 0.176 | 0.242 | 0.278 |
| Physical activity level | |||
| Low | 2.18 ± 0.52 | 1.86 ± 0.34 | 4.72 ± 1.31 |
| Moderate | 2.27 ± 0.54 | 1.92 ± 0.35 | 4.90 ± 1.41 |
| Vigorous | 2.13 ± 0.51 | 1.88 ± 0.32 | 4.71 ± 1.32 |
| p-value | 0.216 | 0.632 | 0.587 |
| Mediterranean Diet Score | |||
| Low adherence (MDS ≤4) | 2.24 ± 0.57 | 1.93 ± 0.37 | 4.87 ± 1.44 |
| High adherence (MDS ≥5) | 2.19 ± 0.45 | 1.85 ± 0.27 | 4.75 ± 1.24 |
| p-value | 0.462 | 0.052 | 0.535 |
| Dietary Inflammatory Index | |||
| Pro-inflammatory diet (DII >0) | 2.20 ± 0.60 | 1.91 ± 0.39 | 4.76 ± 1.48 |
| Anti-inflammatory diet (DII <0) | 2.25 ± 0.41 | 1.88 ± 0.24 | 4.93 ± 1.11 |
| p-value | 0.492 | 0.448 | 0.333 |
| Planetary Health Diet Index | |||
| Quartile 1 | 2.46 ± 0.53 | 2.07 ± 0.36 | 5.43 ± 1.30 |
| Quartile 2 | 2.20 ± 0.50 | 1.89 ± 0.28 | 4.73 ± 1.27 |
| Quartile 3 | 2.15 ± 0.57 | 1.83 ± 00.39 | 4.66 ± 1.45 |
| Quartile 4 | 2.01 ± 0.41 | 1.77 ± 0.25 | 4.35 ± 1.26 |
| p-value | <0.001 | <0.001 | <0.001 |
Numerical data were tested for differences with a t-test between two groups and an ANOVA test between multiple groups. MDS, Mediterranean Diet Score; DII, Dietary Inflammatory Index.
Table 3.
Associations between the Planetary Health Diet Index (PHDI) and energy-adjusted environmental impact indicators among 224 Croatian university students.
Table 3.
Associations between the Planetary Health Diet Index (PHDI) and energy-adjusted environmental impact indicators among 224 Croatian university students.
| Environmental impact indicators | PDHI (z-score) | |||
| β | 95 % CI | p-value | ||
| Carbon footprint (kg CO2 equivalent)/1000kcal | ||||
| Model crude | -7.24 | -10.41 | -4.06 | <0.001 |
| Model adjusted | -7.94 | -11.17 | -4.72 | <0.001 |
| Water footprint (m3)/1000kcal | ||||
| Model crude | -12.96 | -17.81 | -8.11 | <0.001 |
| Model adjusted | -13.88 | -18.76 | -8.99 | <0.001 |
| Ecological footprint (m2*year) /1000kcal | ||||
| Model crude | -2.80 | -4.03 | -1.56 | <0.001 |
| Model adjusted | -3.15 | -4.41 | -1.89 | <0.001 |
Mixed effects linear regression models with a random intercept for gender (men, women), level of study (undergraduate, graduate), body mass index classification and level of physical activity.
Table 4.
Associations between the Planetary Health Diet Index (PHDI) and the energy-adjusted usual intakes of macro- and micronutrients among 224 Croatian university students.
Table 4.
Associations between the Planetary Health Diet Index (PHDI) and the energy-adjusted usual intakes of macro- and micronutrients among 224 Croatian university students.
| PDHI (z-score) | ||||
| β | 95 % CI | p-value | ||
| Energy (kcal/d) | 2.15 | 0.59 | 3.70 | 0.007 |
| Protein (g/d) | -0.38 | -0.69 | -0.07 | 0.017 |
| Animal protein (g/d) | -0.46 | -0.71 | -0.22 | <0.001 |
| Vegetable protein (g/d) | 1.94 | 1.24 | 2.64 | <0.001 |
| Total fat (g/d) | 0.14 | -0.14 | 0.32 | 0.324 |
| Saturated fat (g/d) | -1.67 | -2.24 | -1.10 | <0.001 |
| Monounsaturated fat (g/d) | 0.80 | 0.36 | 1.23 | <0.001 |
| Polyunsaturated fat (g/d) | 12.47 | 4.18 | 20.77 | 0.003 |
| Omega-3 fatty acids (g/d) | 19.26 | 13.92 | 24.61 | <0.001 |
| Omega-6 fatty acids (g/d) | -39.76 | -55.4 | -24.11 | <0.001 |
| Trans fatty acids (g/d) | -14.50 | -20.70 | -8.31 | <0.001 |
| Cholesterol (mg/d) | 0.01 | -0.01 | 0.03 | 0.211 |
| Carbohydrates (g/d) | -0.10 | -0.21 | 0.02 | 0.105 |
| Dietary fibres (g/d) | 2.59 | 1.99 | 3.19 | <0.001 |
| Alcohol (g/d) | 0.36 | 0.06 | 0.66 | 0.020 |
| Thiamine (mg/d) | 7.67 | -3.76 | 19.09 | 0.187 |
| Riboflavin (mg/d) | 4.34 | -1.18 | 11.05 | 0.113 |
| Niacin (mg/d) | 0.49 | -0.46 | 1.44 | 0.312 |
| Folate (μg/d) | 0.13 | 0.09 | 0.16 | <0.001 |
| Pyridoxine (mg/d) | 1.17 | -2.59 | 4.94 | 0.539 |
| Cobalamin (μg/d) | -0.51 | -2.53 | 1.51 | 0.622 |
| Vitamin C (mg/d) | 0.19 | 0.12 | 0.27 | <0.001 |
| Beta-carotene (mg/d) | 0.04 | 0.02 | 0.06 | <0.001 |
| Retinol (RE/d) | -0.01 | -0.02 | 0.07 | 0.518 |
| Vitamin D (μg/d) | 1.31 | -1.22 | 3.84 | 0.308 |
| Vitamin E (mg/d) | 1.57 | 1.20 | 1.94 | <0.001 |
| Sodium (mg/d) | -0.01 | -0.03 | -1.96 | 0.027 |
| Potassium (mg/d) | 0.02 | 0.01 | 0.03 | <0.001 |
| Calcium (mg/d) | -0.03 | -0.02 | 0.11 | 0.684 |
| Phosphorus (mg/d) | -0.02 | -0.00 | -0.15 | 0.815 |
| Magnesium (mg/d) | 0.18 | 0.13 | 0.22 | <0.001 |
| Iron (mg/d) | 2.68 | 1.71 | 3.64 | <0.001 |
| Zinc (mg/d) | 0.88 | -1.00 | 2.77 | 0.357 |
| Selenium (mg/d) | 0.21 | -0.11 | 0.52 | 0.206 |
| Iodine (μg/d) | -0.19 | -0.42 | 0.04 | 0.109 |
| Caffeine (mg/d) | -0.10 | -0.21 | 0.01 | 0.084 |
| Flavan 3-ol (mg/d) | 0.15 | 0.04 | 0.26 | 0.010 |
| Flavones (mg/d) | 7.16 | 5.20 | 9.13 | <0.001 |
| Flavanols (mg/d) | 0.16 | 0.11 | 0.21 | <0.001 |
| Flavonones (mg/d) | 0.11 | 0.03 | 0.20 | 0.008 |
| Anthocyanidins (mg/d) | 0.23 | 0.07 | 0.38 | 0.004 |
Mixed effects linear regression models with a random intercept for gender (men, women), level of study (undergraduate, graduate), body mass index classification and level of physical activity.
Table 5.
Associations between the Planetary Health Diet Index (PHDI), the energy-adjusted usual intakes of 16 PHDI component foods, the Mediterranean Diet Score and the Dietary Inflammatory Index among 224 Croatian university students.
Table 5.
Associations between the Planetary Health Diet Index (PHDI), the energy-adjusted usual intakes of 16 PHDI component foods, the Mediterranean Diet Score and the Dietary Inflammatory Index among 224 Croatian university students.
| PDHI (z-score) | ||||
| β | 95 % CI | p-value | ||
| Nuts and peanuts | 1.38 | 1.03 | 1.74 | <0.001 |
| Legumes | 1.41 | 1.43 | 2.40 | 0.005 |
| Fruits | 1.40 | 0.86 | 1.94 | <0.001 |
| Vegetables | 3.56 | 2.34 | 4.78 | <0.001 |
| Whole grains | 0.18 | -0.31 | 0.67 | 0.465 |
| Eggs | 0.44 | -0.19 | 1.07 | 0.167 |
| Fish | 0.90 | 0.41 | 1.40 | <0.001 |
| Tubers and potatoes | -0.03 | -0.44 | 0.38 | 0.876 |
| Dairy | -0.46 | -0.69 | -0.23 | <0.001 |
| Vegetable oils | 0.90 | 0.43 | 1.37 | <0.001 |
| Dark green vegetables ratio | -0.02 | -0.11 | 0.06 | 0.577 |
| Red to orange vegetables ratio | 0.06 | -0.02 | 0.10 | 0.158 |
| Red meat | -0.21 | -0.56 | 0.14 | 0.234 |
| Poultry and substitutes | -0.90 | -1.42 | -0.38 | <0.001 |
| Animal fats | -18.11 | -24.47 | -11.77 | <0.001 |
| Added sugars | -0.57 | -0.84 | -0.27 | <0.001 |
| Mediterranean Diet Score | 4.29 | 3.22 | 5.36 | <0.001 |
| Dietary Inflammatory Index | -2.91 | -3.51 | -2.32 | <0.001 |
Mixed effects linear regression models with a random intercept for gender (men, women), level of study (undergraduate, graduate), body mass index classification and level of physical activity.
Disclaimer/Publisher’s Note: The statements, opinions and data contained in all publications are solely those of the individual author(s) and contributor(s) and not of MDPI and/or the editor(s). MDPI and/or the editor(s) disclaim responsibility for any injury to people or property resulting from any ideas, methods, instructions or products referred to in the content. |
© 2025 by the authors. Licensee MDPI, Basel, Switzerland. This article is an open access article distributed under the terms and conditions of the Creative Commons Attribution (CC BY) license (http://creativecommons.org/licenses/by/4.0/).
Copyright: This open access article is published under a Creative Commons CC BY 4.0 license, which permit the free download, distribution, and reuse, provided that the author and preprint are cited in any reuse.


