Submitted:
12 May 2025
Posted:
13 May 2025
You are already at the latest version
Abstract
Breed bias exists within many of the top disciplines of equestrian sport. It is believed that Thoroughbreds (TB) are out-performed at the 5*L level of eventing by warmbloods. To our knowledge, no study has been performed to confirm this. Therefore, the objectiove of this study was to evaluate the influence of breed on performance at the 5*L level of eventing. To do so, the results of all 5*L events from 2014-2024 were assessed. Initially, TBs were compared to all non-TBs, and this was followed by assessing the ten primary breeds. Data included penalties accrued in dressage, cross country, show jumping, and overall. Additionally, likelihood to complete each phase was assessed. Statistics were performed on SAS 9.4, where an unpaired nonparametric t-test was used to assess penalties within phase. When comparing primary breeds, a one-way ANOVE was used to compare means. Finally, a chi-squared test was used to assess likelihood to finish. Significance was set to P<0.05. TBs accrued more dressage penalties than non-TBs (P<0.001). When comparing primary breeds, TBs were found to accumulate significantly more dressage penalties than HANN, ISH, KWPN, OLDBG, and SF (P<0.03). When assessing cross-country, TBs were more likely to finish without fault when compared to non-TBs (P<0.001). When comparing primary breeds, AA, HOLST, SF, SHBGB, and TB had fewer cross country faults than AES (P<0.01). Non-TBs were more likely to show jump without fault (P<0.001), while TB were found to have higher overall show jumping penalties in comparison to AES, HOLST, ISH, KWPN, OLDBG, and SF (P=0.01). When evaluating overall penalties accumulated throughout the event, there was no effect of breed (P=0.42). Overall, there was no advantage in competing a non-TB in comparison to a TB when considering total penalties accrued, indicating a level playing field within competition. Therefore, breed bias against TBs should be negated when selecting for upper level eventing prospects.
Keywords:
thoroughbred
; eventing
; 5*L
1. Introduction
Eventing is an equestrian sport that tests the training, athleticism, and stamina of multiple breeds of horses [1]. Competition within this sport begins at the national levels and proceeds to the international levels, where the culmination of the sport is seen at the five-star level (5*L). Few horse-and-rider combinations make it to this preeminent level. In fact, when assessing the years 2018-2024, 56,766 entries were noted at the 2* level, 40,073 entries at the 3* level, 21,887 entries at the 4* level, and only 1,947 entries at the 5* level [2]. Each year only seven 5*L events take place throughout the world, and these competitions attract horses and riders from a wide range of countries to take on the ultimate test.
A variety of breeds are noted at the top levels of this equestrian sport, with the majority being of either warmblood or hot blood lineage. The genetics of high performance within this sport have limited data to support breed bias, and yet incredible favoritism exists [3,4]. Due to the stamina required for successful completion of all three phases, an increase in Thoroughbred blood percentage (the amount of Thoroughbred genetics within the offspring) has been pursued at the upper levels of sport [5,6]. Unfortunately, full Thoroughbreds are commonly perceived to perform poorly in comparison to warmbloods at the top level of this sport. Therefore, various warmblood breeds are over-represented in the eventing discipline. This includes Irish Sport Horse, Selle Francais, and Trakehner, in addition to various breeds deriving from Germany; including Hanoverian, Oldenburg, and Holsteiner [7]. Warmbloods are believed to outperform the Thoroughbred in the dressage and show jumping phases due to genetic selection for these disciplines [8,9,10,11,12,13,14]. The classic long format of eventing, which included a steeplechase portion, favored the speed and high endurance seen in Thoroughbreds [7,15] and an increased number of Thoroughbred stallions represented in warmblood studbooks was noted during this era [16]. The long format was eliminated in 2005, and this coincided with an increase in the difficulty of the dressage and show jumping phases, potentially favoring horses selectively bred for these disciplines over the Thoroughbred. Other studies have looked at all traits of horses in eventing to evaluate the best combination of factors for success [7], but none have specifically focused on breed. Additionally, while breed may influence overall outcomes of events, other variables may be of greater impact, including experience of competitor, experience of horse, conditions of the day, and subjective opinion of judging.
Although public perception favors specific breeds and genetics, there is minimal data to support the correlation between breed and performance in the eventing discipline. Therefore, we aimed to evaluate the relationship between breed and performance at the 5*L level of eventing, with a key focus on dressage, cross-country, show jumping, and overall penalties. We hypothesized that breed will not impact the overall performance of the horse, and that the bias against Thoroughbreds will be unfounded.
2. Materials and Methods
2.1. Overall Data Entry
In this study, the results of all 5*L (previously 4*L) events were collected from 2014-2024. This included Adelaide (2014-2019; 2023-2024), Badminton (2014-2019; 2022-2024), Burghley (2014-2019; 2022-2024), Kentucky (2014-2019; 2021-2024), Luhmuhlen (2014-2019; 2021-2024), Maryland (2022-2024), and Pau (2014-2024). The majority of events did not take place in 2020 or 2021 due to the COVID-19 global pandemic. A total of 2,696 results were acquired, representing 71 breeds.
In the first analysis, participants were grouped as Thoroughbred (TB; n=330) or non-Thoroughbred (n=2,366). Comparisons were made regarding likelihood to complete, likelihood to complete cross country without jump penalties, likelihood to complete cross country without jump or time penalties, likelihood to complete show jumping without jump penalties, and likelihood to complete show jumping without jump or time penalties. Additionally, the total number of penalties noted in dressage, cross country, show jumping, and overall were compared between TB and non-TB. Dressage and overall penalties were also assessed as prior to the removal of the 1.5 dressage coefficient (2014-2017) or after (2018-2024).
Breeds were then grouped as primary or secondary based on a cut-off number of forty entries per breed, leaving 2,275 results to be analyzed. Primary breeds were further assessed for the number of dressage penalties, the number of cross country penalties, the number of show jumping penalties, and overall accumulated penalties. This was also assessed both within 2014-2017 in addition to 2018-2024 due to the change in dressage scoring coefficient that was implemented in 2018. Representative data for primary breeds can be seen in Table 1.
2.2. Statistics
All statistical analyses were performed in SAS 9.4® (SAS Institute, version 12.1.0). All data was assessed for normality and equal variances using a Shapiro-Wilk test and Bartletts test, respectively. The percentage of Thoroughbreds represented prior to the removal of the dressage coefficient (2014-2017 vs 2018-2024) was assessed using a chi-squared before continuing on with further analysis. When assessing Thoroughbreds to non-Thoroughbreds, an unpaired nonparametric t-test was used to assess dressage, cross country, show jumping, and overall penalties. For dressage and overall, this analysis was performed as 2014-2017 in addition to 2018-2024. Additionally, a chi-squared test was used to compare Thoroughbred to non-Thoroughbreds likelihood to finish, likelihood to jump clean in both phases, and likelihood to be faultless in both jumping disciplines. When assessing primary breeds, a one-way ANOVA was used to compare means. Post hoc analysis was performed using a Tukey test for multiple comparisons. Nonparametric t-tests are shown as the median ± interquartile range, while normal data is expressed as mean ± SE. Significance was set to P ≤ 0.05.
3. Results
3.1. Dressage
The percentage of Thoroughbreds competing within year was assessed prior to analyzing dressage scores due to the change in penalty coefficient that was implemented in 2018. A significant effect of year was noted (P<0.0001; Figure 1), analysis was performed within 2014-2017 and then again on the years between 2018-2024 following the redaction of the coefficient. Non-Thoroughbreds accrued significantly fewer dressage penalties when compared to Thoroughbreds between the year of 2014-2017 (50.8 vs. 54.4; P<0.001; Figure 2A). When evaluating the primary breeds represented during this time, significant differences were noted within breed (P<0.001; Figure 2B). The lowest number of dressage penalties was acquired by HANN, and this was found to be significantly lower than penalties acquired by AES (P=0.01), ISH (P<0.001), and TB (P<0.001). In contrast, TB were found to have significantly higher dressage penalties in comparison to those accrued by KWPN (P<0.001), OLDBG (P<0.001), or SF (P=0.01). Additionally, ISH were found to have significantly more dressage penalties in comparison to KWPN (P<0.001) and OLDBG (P=0.01).
When assessing dressage penalties accrued between the years 2018-2024, significant differences were still noted between non-Thoroughbreds and Thoroughbreds (33.3 vs. 36.1 P<0.001; Figure 2C), with non-Thoroughbreds accruing significantly fewer penalties. When comparing primary breeds, a different picture than what was noted during 2014-2017 was observed. HOLST acquired the least number of dressage penalties on average, and this was significantly lower than AES (P<0.001), ISH (P<0.001), KWPN (P=0.02), SF (P<0.01), SHGBG (P<0.001), and TB (P<0.001; Figure 2D). Additionally, TB acquired significantly more dressage penalties than HANN (P<0.001), ISH (P<0.001), KWPN (P<0.001), OLDBG (P=0.03), and SF (P<0.01).
3.2. Cross Country
When assessing cross country jump faults, there was no effect of breed on the likelihood to have no jump faults on cross country (P=0.78; Figure 4). Zero jump penalties were observed in 1,220/2348 of the non-Thoroughbred horses (51.4%) and this was not different than the 166/330 of Thoroughbreds (50.6%) that completed cross country without jump penalty. When assessing both jump and time faults, Thoroughbreds were significantly more likely to be faultless during cross country (P<0.001; Figure 4). Faultless rounds were observed in 46/330 Thoroughbreds (13%), which was significantly higher than in non-Thoroughbreds, where 199/2,351 entries were without fault on cross country (8.3%).
There was an effect breed on the number of total cross country penalties accrued (P=0.05), with Thoroughbreds accumulating fewer cross country penalties than non-Thoroughbreds (19.7 vs. 22.8; Figure 3A). There was also a significant effect of breed on total cross country faults when evaluating primary breeds (Figure 3B). This was noted as AA (P=0.02), HOLST (P=0.02), SF (P<0.01), SHBGB (P=0.04), and TB (P<0.01) having significantly fewer cross country faults when compared to AES. No significant differences were noted when evaluating HANN, ISH, KWPN, or OLDBG in comparison to any other breed (P>0.05).
3.3. Show Jumping
When assessing faults acquired during show jumping, only horses which were found of fit to continue during the final veterinary inspection were assessed, leaving 1,477 entries. There was no significant effect of breed on the percentage of horses that withdrew following the cross country phase (P=0.91), with 12.2% of Thoroughbreds and 12.4% of non-Thoroughbreds withdrawing following cross country. Of these found fit to compete, 212 were Thoroughbreds, and 1,265 were non-Thoroughbreds. Overall, non-Thoroughbreds had significantly less total jump penalties in show jumping compared to Thoroughbreds (7.0 vs. 10.4; P<0.001; Figure 3C). Additionally, non-Thoroughbreds were significantly more likely to jump a faultless show jumping round, with 316/1,471 (21.48%) non-Thoroughbreds jumping a fault-free round, while only 27/211 Thoroughbreds jumped a fault free round (P=0.003; Figure 4).
When assessing the primary breeds, TB were found to have significantly higher overall show jumping penalties in comparison to AES (P=0.05), HOLST (P<0.001), ISH (P<0.001), KWPN (P<0.001), OLDBG (P=0.01), and SF (P<0.001; Figure 3D). No significant differences were noted regarding overall show jumping penalties when comparing TB to AA (P=0.07), HANN (P=0.91), or SHBGB (P=0.16).
3.4. Overall
When assessing the likelihood to complete all three phases, there was no effect of breed (P=0.63), with Thoroughbreds being as likely to complete the event (211/330; 63.94%) as non-Thoroughbreds (1,472/2,352; 62.59%; Figure 4). Results were again analyzed as 2014-2017 and 2018-2024 due to the influence of the dressage coefficient removal. No significant differences were noted between non-Thoroughbreds and Thoroughbreds in overall penalties within either time frame assessed, and this included 2014-2017 (83.1 vs. 85.4; P=0.42) or 2018-2024 (61.0 vs. 65.7; P=0.12).
When evaluating overall faults with regards to primary breeds, analysis was again performed within 2014-2017 or 2018-2024. Prior to 2018, no significant effect of primary breed was noted on overall penalties accrued (P>0.05; Figure 5A,B). When assessing 2018-2024, a significant effect of primary breed was noted (P<0.001; Figure 5C). This was specifically noted in the AES, which accumulated significantly more total penalties in all three phases than HOLST (P<0.001) and SF (P=0.03; Figure 5D). There were no significant differences noted when comparing HANN, ISH, KWPN, OLDBG, SHBGB, or TB (P>0.05), indicating that none of these primary breeds was more likely to complete an event at the 5*L level with fewer faults than the others. In contrast, HOLST had the fewest accrued penalties overall, and this was significantly lower than ISH (P<0.01) and TB (P=0.01).
4. Discussion
Selection of genetics for performance purposes has been occurring for centuries. In the horse, performance is heavily biased and can be influenced by objective data (speed, height) or subjective opinion (trainability, jumping ability, movement). While the priority of genetic selection for Thoroughbreds lies in speed and stamina [17], the majority of warmblood studbooks prioritize jumping ability necessary for high level show jumping and/or movement for advanced dressage [18]. The sport of eventing requires a combination of these genetic aptitudes, and includes the movement for dressage, speed and stamina of cross country, and jumping ability for show jumping. To our knowledge, this is the first study to investigate the influence of breed on performance within the highest level of eventing.
Dressage is the first phase of a three-day event and requires the execution of specific movements that are judged for precision, cadence, and rhythm. When assessing the results of 5*L within the past decade, Thoroughbreds were found to accrue significantly more dressage penalties when compared to non-Thoroughbreds. The decrease in dressage penalties within the warmblood breeds is not surprising, as many of the breeds have been genetically selected for this phase, such as Holsteiners [19], Dutch Warmblood [13], Hanoverians [20], Selle Francais [21], and Oldenburgs [20]. When assessing Thoroughbreds, the dressage coefficient reduction in 2018 did not appear to impact overall performance, but an impact of this coefficient could be seen when evaluating other primary breeds. Between 2014-2017, Hannoverians and KWPN were found to have the lowest accrued dressage penalties, but this shifted from 2018-2024, where Holsteiners were found to have the least dressage penalties during this time. We are unsure as to the cause of this shift, but additional research into blood percentage, sire influence, and/or rider experience within this comparison is warranted.
In contrast to dressage, the prowess of the Thoroughbred was noted during the second phase of three-day eventing, as Thoroughbreds were more likely to complete cross country without jump or time penalty in comparison to their non-Thoroughbred counterparts. Almost 14% of all Thoroughbred entries at the 5*L level completed cross country penalty-free, and this was in contrast to only 8.3% of non-Thoroughbreds. Although no differences were noted in the percentage of entries that acquired jump penalties within the cross-country phase when comparing Thoroughbreds to non-Thoroughbreds, time penalties appeared to play a pivotal role in cumulative penalties, as Thoroughbreds accrued significantly fewer. Thoroughbreds have been genetically selected for speed and stamina for over 300 years [22,23,24,25,26]. At the 5*L level of eventing, horses are expected to gallop at 570 meters per minute for upwards of 5,000 meters, thereby galloping at speed for 10-11 minutes; a test for which the genetics of Thoroughbreds align with [22,23,24,27]. For this reason, Thoroughbreds have historically been infused into various warmblood studbooks for the purpose of increasing their speed and stamina, and most European warmblood breeds consist of at least 35% Thoroughbred [27]. Specific breed and breed locale appear to impact blood percentage, as breeds deriving from France have considerably more Thoroughbred blood (47.9%) than those deriving from Germany (31.6%) [27]. The Thoroughbred blood percentage of the non-Thoroughbreds within this study was not evaluated, but this topic deserves future research, and is needed to evaluate the relationship between Thoroughbred blood and cross country performance.
When assessing the number of penalties accrued during the show jumping phase of three-day eventing, a strong deviation was noted when comparing Thoroughbreds to non-Thoroughbreds. Non-Thoroughbreds were twice as likely to complete show jumping without jump penalty (30.4% vs. 15.5% respectively), but when time was considered, this was reduced to a smaller margin (21.8% vs. 12.6%), again indicating the influence of Thoroughbred speed on results. When comparing primary breeds, Holsteiners accrued the least number of penalties in the show jumping phase, with Irish Sport Horse, KPWN, Oldenburg, and Selle Francais being comparable. The Thoroughbred acquired the most show jumping penalties of all primary breeds assessed, but this was not significantly greater than Anglo-Arabians, Anglo-European Studbook, Hannoverians, or Sport Horses of Great Britain. These results are not surprising, as a large portion of the non-Thoroughbreds represented were presumably purpose-bred for show jumping [4,9,10,11,12,13,14,19,21]. Jumping ability is assessed within the inspection process of the vast majority of warmblood studbooks, with the objective being to evaluate a prospects ability to compete at the 1.60m+ of international show jumping [28]. Due to the strenuous demands of three-day eventing, the maximum height for 5*L show jumping is appreciably lower than this height, with the fences set to 1.35m. Therefore, is it not surprising that horses purpose bred for 1.60m+ will outperform a breed that is produced with genetic selection for galloping over flat surfaces.
While a breed difference is noted within the three phases of competition, the cumulative score is of greatest importance. Here, there was no impact of breed on likelihood to complete all three phases, as noted by 64% of Thoroughbreds completing which was not significantly different than the 62.6% of non-Thoroughbreds completing. Additionally, no overall impact of breed was noted within either 2014-2017 or 2018-2024, with Thoroughbreds accumulating similar overall penalties to non-Thoroughbreds. This indicates the heavy influence that cross country has on the overall competition, as the Thoroughbreds competence within the cross-country phase made up for deficits noted following dressage and show jumping. Primary breed did not influence overall penalties in 2014-2017 when the dressage coefficient impacted the influence of dressage, but by removing this coefficient, a significant effect of primary breed was noted. This was observed by Holsteiners accruing fewer penalties than most primary breeds, and this reduction in overall penalties was found to be significant when compared to Anglo-European Studbook, Irish Sport Horses and Thoroughbreds. Additionally, horses within the Anglo-European Studbook acquired significantly more overall penalties in comparison to Selle Francais. Interestingly, these two specific breeds (Holsteiner and Selle Francais) represent two of the top three warmblood studbooks with regard to Thoroughbred blood percentage, and come in at 45.8% and 52.7% respectively [29]. Therefore, it may be argued that Thoroughbred blood percentage plays an impactful role on the ability for warmbloods to succeed at the upper levels of eventing, a belief that has always been assumed but never proven. Future research is needed to disseminate the percentage of Thoroughbred within individual studbook for optimal performance.
It is unknown if the specific horses within the present study were purpose-bred for dressage, show jumping, eventing, or even racing, and this presents a limitation of this study. A clear breeding objective is important when selecting for intended progeny of any breed. Therefore, it is ideal for breed registries to have specific goals that include all biological traits perceived important for production, both competitively and economically [18]. Breeding for performance is difficult to monitor within a breed registry, as there are diverse desires for performance within studbook, in addition to the level for which the horse is intended to compete (amateur, national, international). This is particularly difficult for warmblood breeds due to the immense crossbreeding and diverse purposes [28]. A study from 2004 found only eleven of nineteen warmblood studbooks to breed specifically for eventing traits [18]. This was in contrast to sixteen organizations breeding specifically for show jumping, and fourteen breeding specifically for dressage. More recently, a survey was sent to all studbooks within the World Breeding Federation for Sporthorses (WBFSH), and only two of the responding studbooks identified eventing as a breeding objective [28]. In contrast, ten studbooks identified show-jumping and seven studbooks identified dressage as a priority. Overall, eventing is considered a low priority or objective for the majority of warmblood studbooks, and therefore utilizing studbook as an indicator for eventing performance is confounded. The majority of primary breeds represented in the present study are bred with intent to either show jump or do dressage, with specific phenotypes desired for each. The genotypes involved in this selection has been elucidated in Holsteiners [19], KWPN [13], Hanoverians [20], Selle Francais [21], and Oldenburgs [20], with a marked delineation in the genotype of a successful dressage horse in comparison to show jumper. Additionally, the genetics of these animals differs when attempting to produce either subtype [30]. An additional limitation of this study is that each entry is represented as an individual, when many horses have multiple results within the ten years assessed. Only 1,112 horses were represented within the 2,696 entries, with an average of 2.4 starts for each horse. This ranged from only a single start at the level to a subset of animals with long careers, including Reve du Rouet (OLDBG; 18 entries), Ringwood Sky Boy (ISH; 15 entries), and LCC Barnaby (ISH; 14 entries), which may lead to a horse influence on overall results. Additionally, the effect of rider and the experience of each rider was not assessed. As entries were assessed over 10 years, the experience of specific riders may have increased over time, lending influence to the success of individual horses. Additionally, with experience comes increased backing, funding, and promotion, which may lend to purchasing more expensive horses with increased genetic selection. This may lead to rider/breed bias, and future research is needed to investigate the actual Thoroughbred blood percentage, in addition to the influence of experience at the level on final scores.
5. Conclusions
In conclusion, bias and negative perception towards the Thoroughbreds ability to compete at the highest level of eventing should be disregarded. While Thoroughbreds did accrue significantly more penalties in both the dressage and show jumping phase of eventing, their speed, ability, and efficiency within the cross country phase made up for these shortcomings. There was no overall advantage in competing a non-Thoroughbred in comparison to a Thoroughbred when assessing total penalties accrued, indicating a level playing field within competition. Additionally, not all warmblood studbooks were found to be created equal, as only the Holsteiner was significantly more likely to finish a three-day event with fewer penalties than the Thoroughbred. In summary, the decrease in Thoroughbred entries at the 5* level is alarming. We hope that the present study assists in reducing bias when horses are selected as competitive prospects to reach this pinnacle level.
Author Contributions
For research articles with several authors, a short paragraph specifying their individual contributions must be provided. Conceptualization, CEF; methodology, KRW, MEM, CEF; software, CEF; validation, MEM & CEF; formal analysis, MEM & CEF; investigation, CEF; resources, CEF; data curation, KRW; writing—original draft preparation, CEF; writing—review and editing, KRW, MEM, & CEF; visualization, CEF; supervision, CEF; project administration, CEF; funding acquisition, N/A. All authors have read and agreed to the published version of the manuscript.” Please turn to the CRediT taxonomy for the term explanation. Authorship must be limited to those who have contributed substantially to the work reported.
Funding
This research received no external funding.
Data Availability Statement
Data is available and Forthcoming on Dryad. https://doi.org/10.5061/dryad.bcc2fqzr4
Conflicts of Interest
None
Abbreviations
The following abbreviations are used in this manuscript:
| AA | Anglo-Arabian |
| AES | Anglo-European Studbook |
| HANN | Hannoverian |
| HOLST | Holsteiner |
| ISH | Irish Sport Horse |
| KWPN | Dutch Warmblood |
| OLDBG | Oldenburg |
| SF | Selle Francais |
| SHBGB | Sport Horse of Great Britain |
| TB | Thoroughbred |
References
- Bennet, E.D., H. Cameron-Whytock, and T.D.H. Parkin, Federation Equestre Internationale eventing: Fence-level risk factors for falls during the cross-country phase (2008-2018). Equine Vet J, 2023. 55(3): p. 463-473.
- O’Connor, D.and G. Sinclair. Risk management data: 2024 Highlights of international statistics. in FEI Eventing Forum. 2025.
- Ricard, A. and I. Chanu, Genetic parameters of eventing horse competition in France. Genet Sel Evol, 2001. 33(2): p. 175-90.
- Nazari-Ghadikolaei, A., et al., Factor analysis of evaluated and linearly scored traits in Swedish Warmblood horses. J Anim Breed Genet, 2023. 140(4): p. 366-375.
- Chance, A. It’s in the Blood: LRK3DE Edition. 2020; Available from: https://useventing.com/news-media/news/its-in-the-blood-lrk3de-edition.
- Chance, A. Blood Percentage: We’ve Been Doing It Wrong. 2023; Available from: https://eventingnation.com/blood-percentage-weve-been-doing-it-wrong/.
- Pietrzak, S., T. Prochniak, and K. Osinska, The influence of certain factors on the results obtained by horses classified in eventing ranks of the International Federation for Equestrian Sports. Annales Universitatis Mariae Curie-Sklodowska Lublin-Polonia, 2013. XXXI: p. 34-9.
- Chapard, L., et al., Early life jumping traits: Are they good proxies for success in show jumping competitions in Belgian warmblood horses? J Anim Breed Genet, 2024. 141(2): p. 138-152.
- Chapard, L., et al., Adjusted fence height: an improved phenotype for the genetic evaluation of show jumping performance in Warmblood horses. Genet Sel Evol, 2023. 55(1): p. 12.
- Prochniak, T., et al., Pedigree Analysis of Warmblood Horses Participating in Competitions for Young Horses. Front Genet, 2021. 12: p. 658403.
- Ablondi, M., et al., Genomic Divergence in Swedish Warmblood Horses Selected for Equestrian Disciplines. Genes (Basel), 2019. 10(12).
- Rovere, G., et al., Effect of specialization on genetic parameters of studbook-entry inspection in Dutch Warmblood horses. J Anim Breed Genet, 2015. 132(6): p. 441-8.
- Rovere, G., et al., Genetic correlations between dressage, show jumping and studbook-entry inspection traits in a process of specialization in Dutch Warmblood horses. J Anim Breed Genet, 2017. 134(2): p. 162-171.
- Rovere, G., et al., Analysis of competition performance in dressage and show jumping of Dutch Warmblood horses. J Anim Breed Genet, 2016. 133(6): p. 503-512.
- Craig, L., et al., Changes in blood constituents accompanying exercise in polo horses. Cornell Vet, 1985. 75(2): p. 297-302.
- Bonow, S., et al., Consequences of specialized breeding in the Swedish Warmblood horse population. J Anim Breed Genet, 2023. 140(1): p. 79-91.
- Bailey, E., J.L. Petersen, and T.S. Kalbfleisch, Genetics of Thoroughbred Racehorse Performance. Annu Rev Anim Biosci, 2022. 10: p. 131-150.
- Koenen, E.P.C., L.I. Aldridge, and J. Philipsson, An overview of breeding objectives for warmblood sport horses. Livestock Production Science, 2004. 88: p. 77-84.
- Engel, L., et al., Mitochondrial DNA Variation Contributes to the Aptitude for Dressage and Show Jumping Ability in the Holstein Horse Breed. Animals (Basel), 2022. 12(6).
- Nolte, W., G. Thaller, and C. Kuehn, Selection signatures in four German warmblood horse breeds: Tracing breeding history in the modern sport horse. PLoS One, 2019. 14(4): p. e0215913.
- Brard, S. and A. Ricard, Genome-wide association study for jumping performances in French sport horses. Anim Genet, 2015. 46(1): p. 78-81.
- Kis, J., et al., Role of genes related to performance and reproduction of Thoroughbreds in training and breeding - A review. Acta Vet Hung, 2021.
- Sharman, P. and A.J. Wilson, Genetic improvement of speed across distance categories in thoroughbred racehorses in Great Britain. Heredity (Edinb), 2023. 131(1): p. 79-85.
- Han, H., et al., Selection in Australian Thoroughbred horses acts on a locus associated with early two-year old speed. PLoS One, 2020. 15(2): p. e0227212.
- Hill, E.W., et al., A sequence polymorphism in MSTN predicts sprinting ability and racing stamina in thoroughbred horses. PLoS One, 2010. 5(1): p. e8645.
- de Oliveira Padilha, D.A., et al., Estimation of genetic parameters for racing time and ranking in Thoroughbred horses. J Equine Vet Sci, 2025. 144: p. 105244.
- Roman-Popovici, A., S.D. Constantin, and I. GIlca, Study regarding the percentage of English Thoroughbred blood in the last five generations for the best jumping horses in the world. Czech Journal of Food Sciences, 2014: p. 98-101.
- Doyle, J.L., et al., An overview of international genetic evaluations of show jumping in sport horses. Transl Anim Sci, 2022. 6(2): p. txac038.
- Sobotkova, E., et al., Analysis of the current situation in international show jumping and assessment of the influence of the proportion of Thoroughbred in the pedigree, horse demographics and sport season on the performance of horses. J Vet Behav, 2022. 47: p. 12-21.
- Rovere, G., et al., Genetic connections between dressage and show jumping in Dutch Warmbloods. Acta Agriculturae Scand, 2014. 64: p. 57-66.
Figure 1.
Percentage of Thoroughbreds competing at the FEI 5*L level from 2014-2024. A significant decrease in the number of Thoroughbreds entered at the 5*L level was noted between the years of 2018 and 2024 in comparison to 2014 to 2017. While 12-20% of all entries at the 5*L level were Thoroughbreds prior to the dressage coefficient change, this was decreased to 5-13% following the elimination of the dressage coefficient. Due to this, 2014-2017 was analyzed separately from 2018-2024 for any variables that dressage penalties may influence.
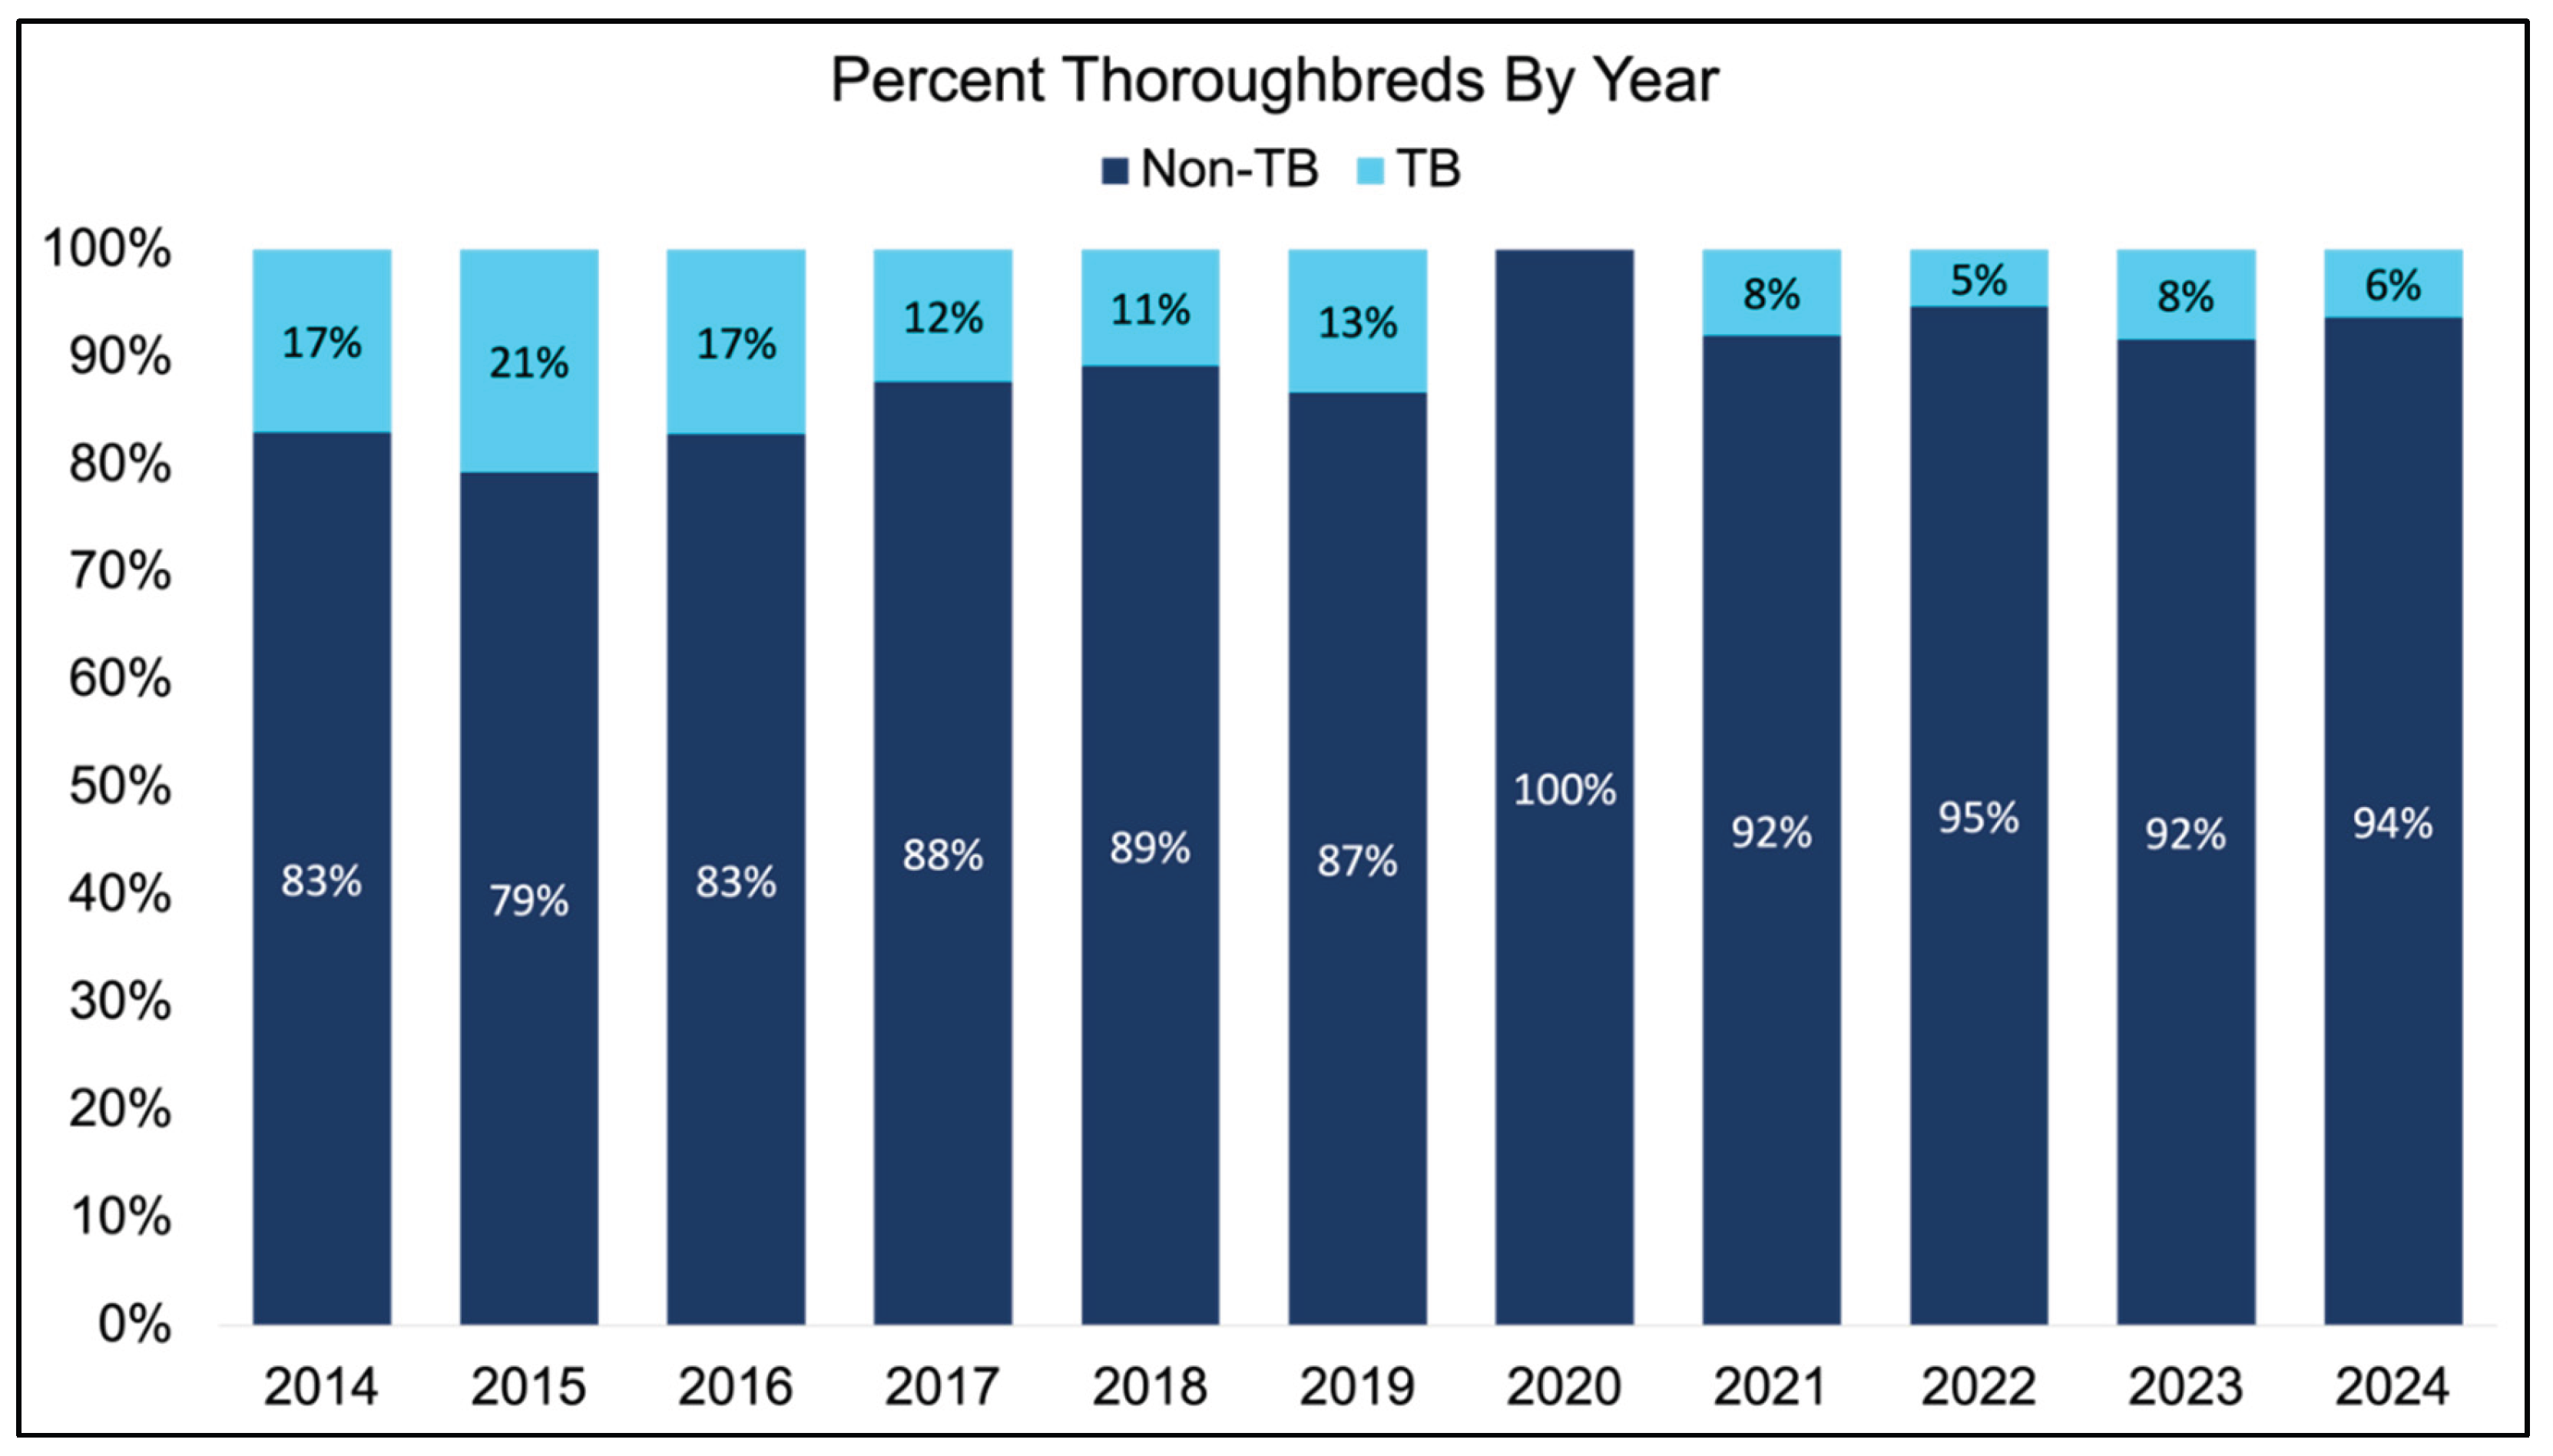
Figure 2.
Dressage penalties accumulated in Thoroughbred and non-Thoroughbred breeds at the FEI 5* level. When assessing dressage penalties, Thoroughbreds acquired more penalties than non-Thoroughbreds breeds. This was noted both within years where the coefficient was implemented (2014-2017) in addition to without coefficient (2018-2024). When assessing primary breeds influence on dressage penalties, a significant effect of breed was noted. Between 2014-2017, this was primarily noted as HANN and KWPN accruing the least dressage penalties, while TB accrued the most. In contrast, from 2018-2024, HOLST accrued the fewer dressage penalties, while TB continued to accrue the most penalties within this phase. Anglo-Arabian (AA), Anglo European Studbook (AES), Hannoverian (HANN), Holsteiner (HOLST), Irish Sport Horse (ISH), Koninlijk Warmbloed Paardenstamboek Nederland / Dutch Warmblood (KWPN), Oldenburg (OLDBG), Selle Francais (SF), Sport Horse of Great Britain (SHBGB), and Thoroughbred (TB)TB = Thoroughbred. *P<0.05, ****P<0.0001. a,b,c,d,e indicates significance.
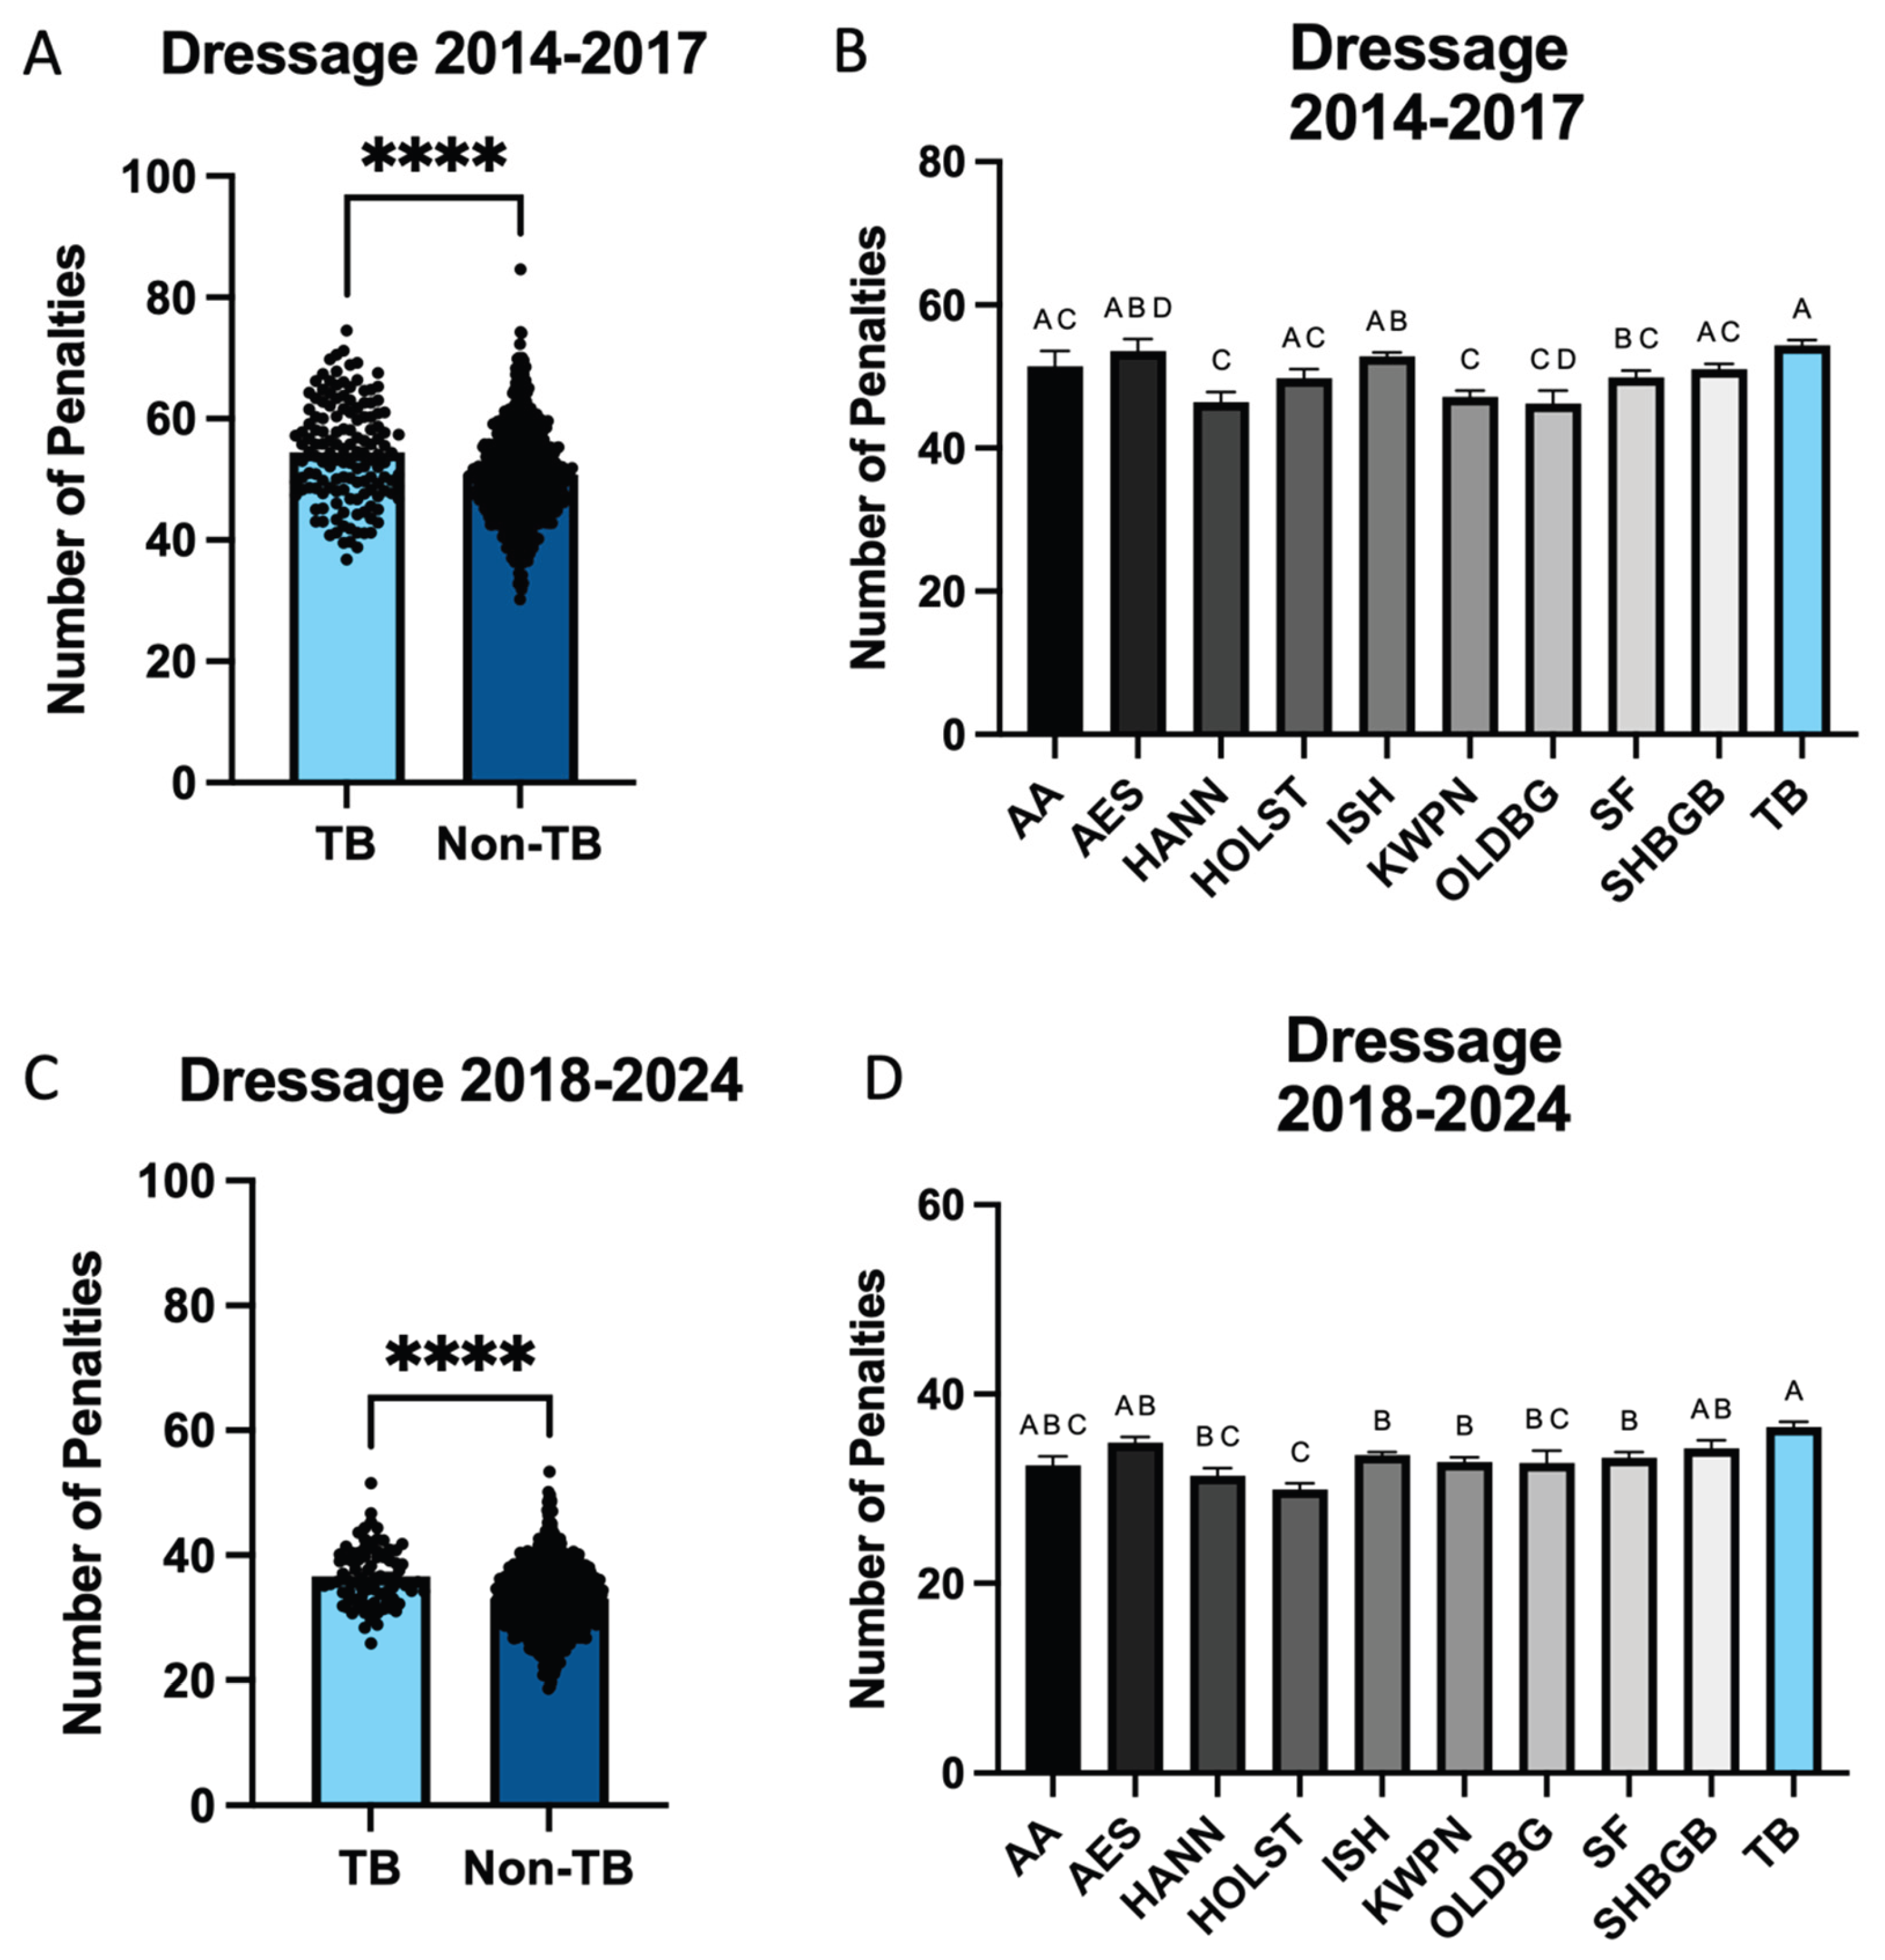
Figure 3.
Overall jump penalties accumulated at the FEI 5* level from 2014-2024. An overall influence of breed was noted when assessing overall cross country penalties, with Thoroughbreds accumulating fewer penalties than non-Thoroughbreds (A). When assessing primary breeds, a significant reduction in overall cross country penalties was noted for AA, HOLST, SF, SHBGB, and TB in comparison to AES (B). When assessing overall show jumping penalties, Thoroughbreds were significantly more likely to acquire penalties than non-Thoroughbreds. When assessing primary breeds, this was noted as HOLST, ISH, KWPN, OLDBG, and SF accruing significantly fewer show jump penalties than TB. Anglo-Arabian (AA), Anglo European Studbook (AES), Hannoverian (HANN), Holsteiner (HOLST), Irish Sport Horse (ISH), Koninlijk Warmbloed Paardenstamboek Nederland / Dutch Warmblood (KWPN), Oldenburg (OLDBG), Selle Francais (SF), Sport Horse of Great Britain (SHBGB), and Thoroughbred (TB). *P<0.05, ****P<0.0001. a,b indicates significance.
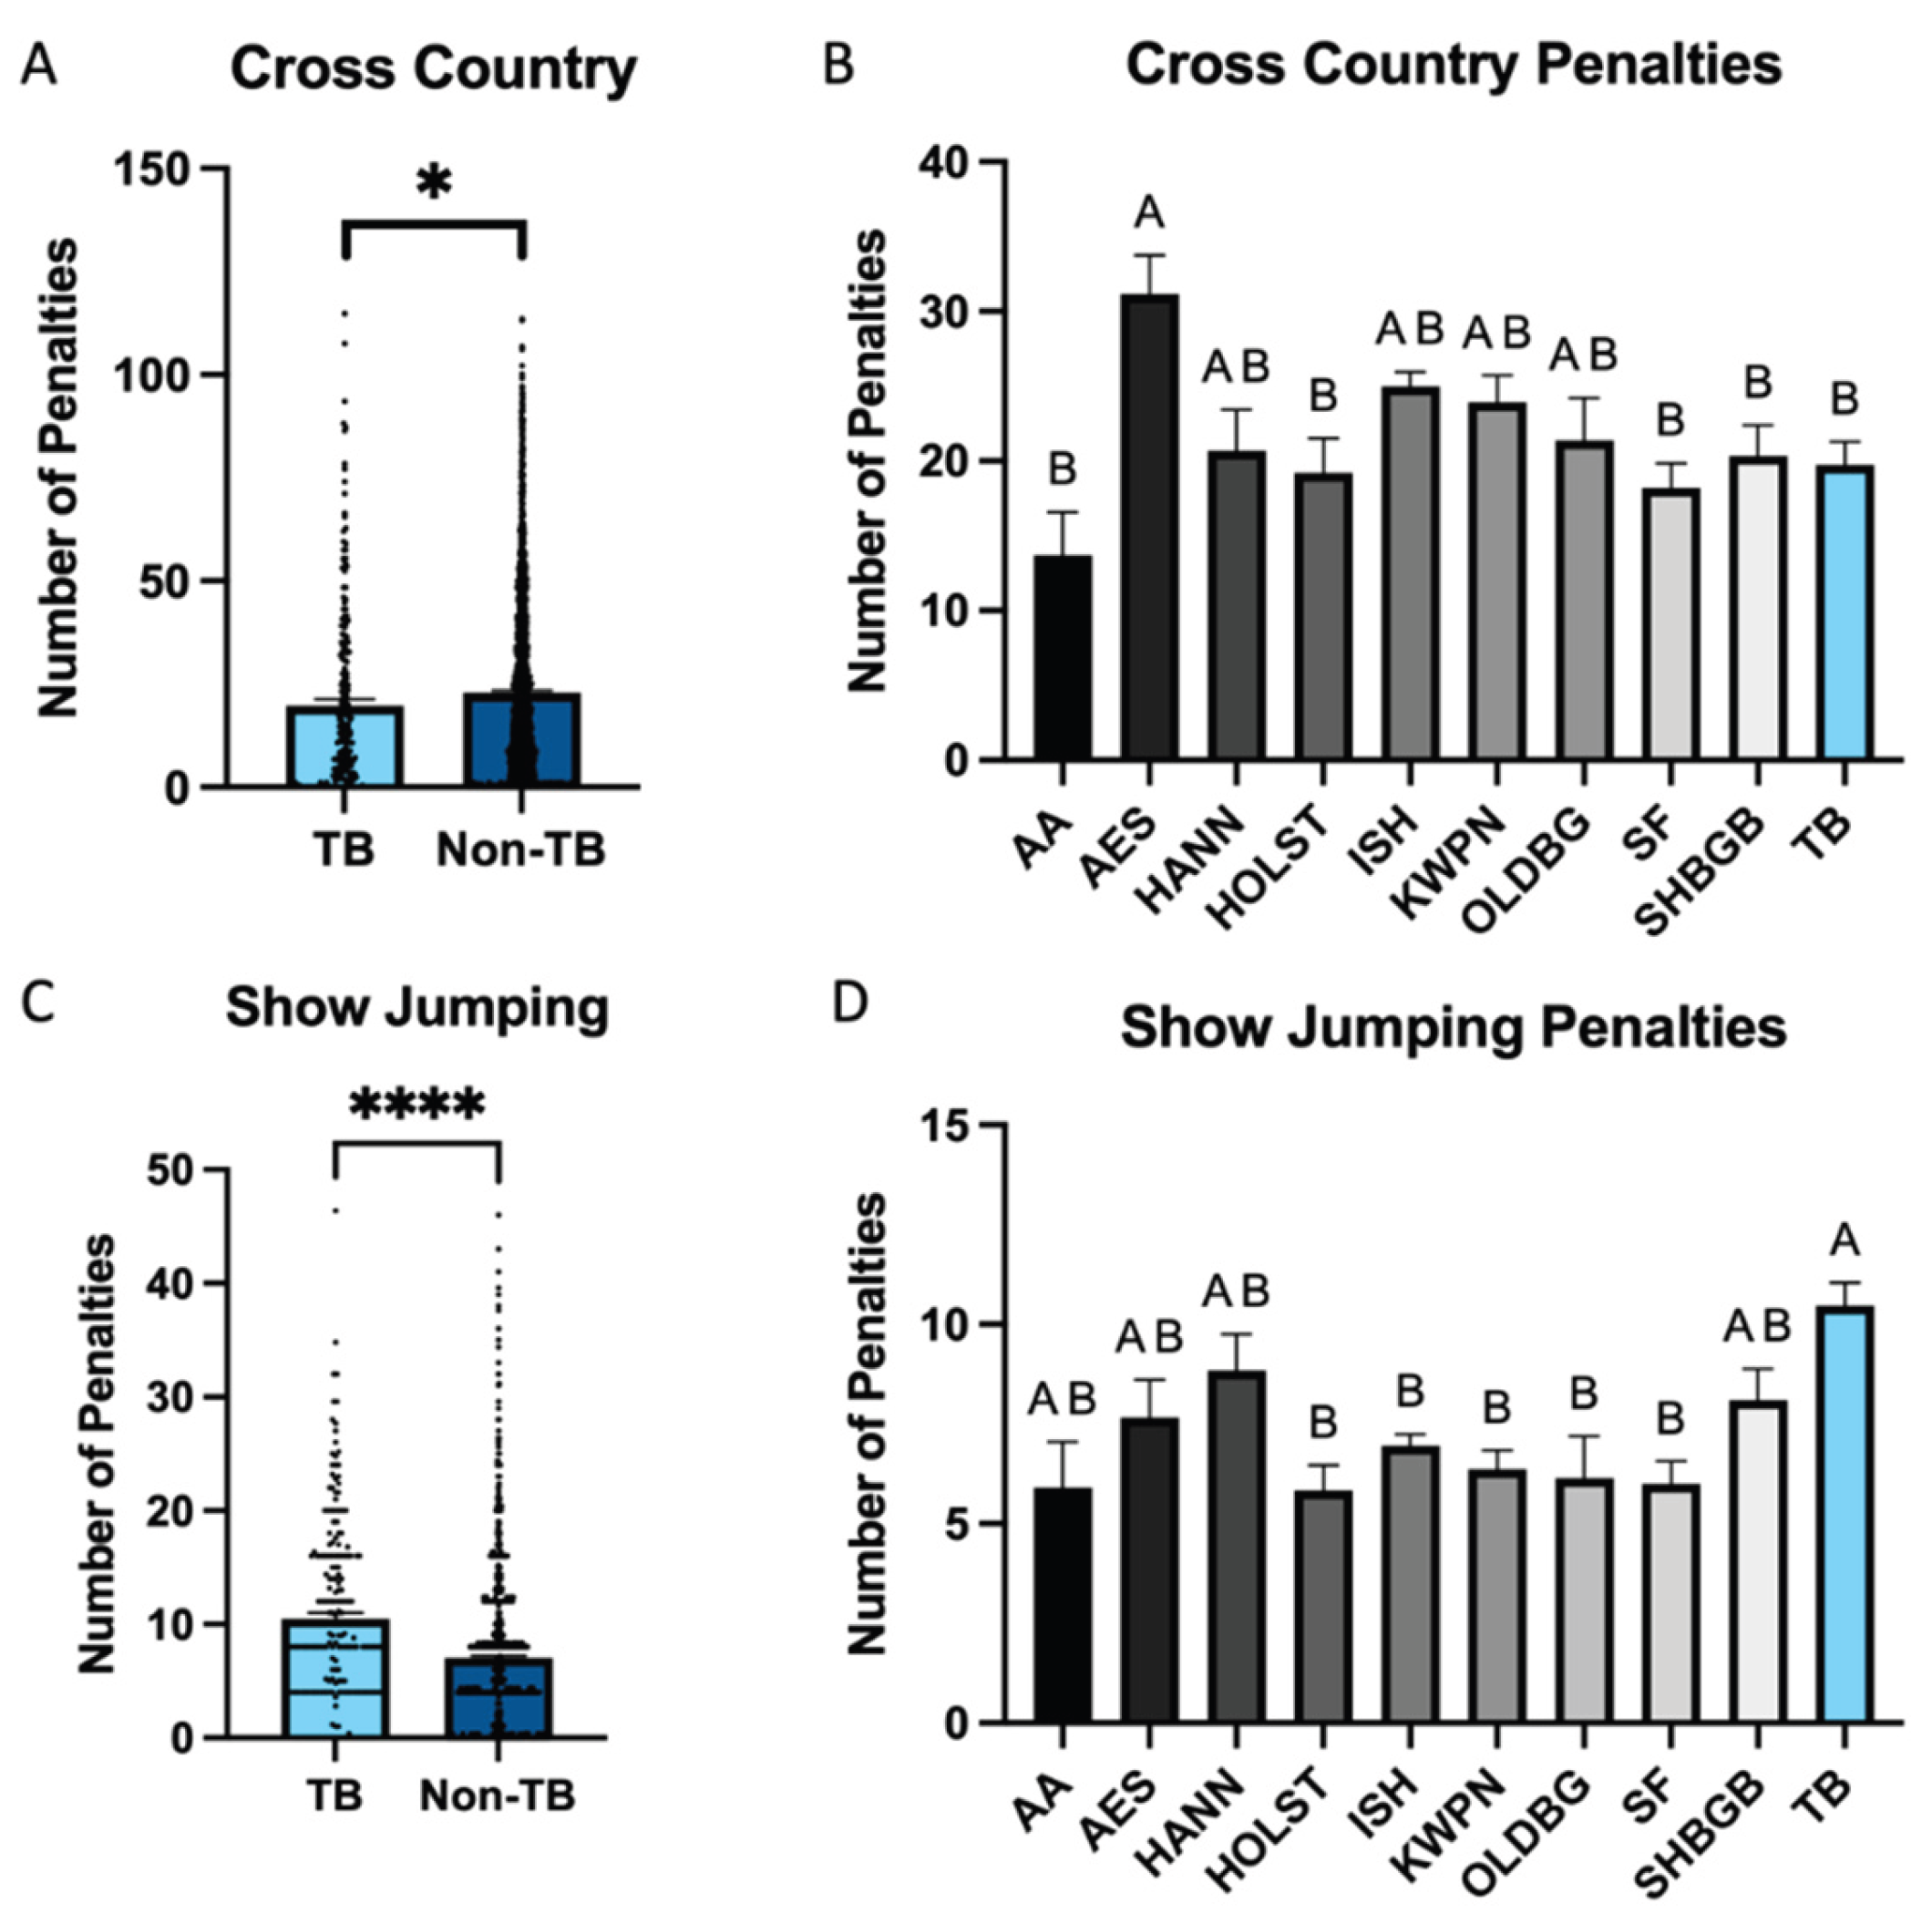
Figure 4.
Likelihood to complete at the FEI 5* level. When comparing Thoroughbreds to non-Thoroughbreds, no difference was noted in the likelihood to complete at the 5*L level. With regards to finishing, 64.5% of the 330 entries finished, while 63.02% of the 2,351 non-Thoroughbred entries finished. Of the 2,697 entries, roughly 50% of starters completed cross country without jump penalties. Of these, Thoroughbreds were significantly more likely to be without both jump and time penalty in cross country compared to non-Thoroughbreds. With regards to show jumping, 30.7% of non-Thoroughbreds completed this phase without jump penalty, and this was significantly higher than Thoroughbreds. When assessing both jump and time penalties in show jumping, this was reduced to 21.8% of non-Thoroughbreds, which was significantly higher than only 12.7% of Thoroughbreds. *P<0.05, **P<0.01, ***P<0.001.
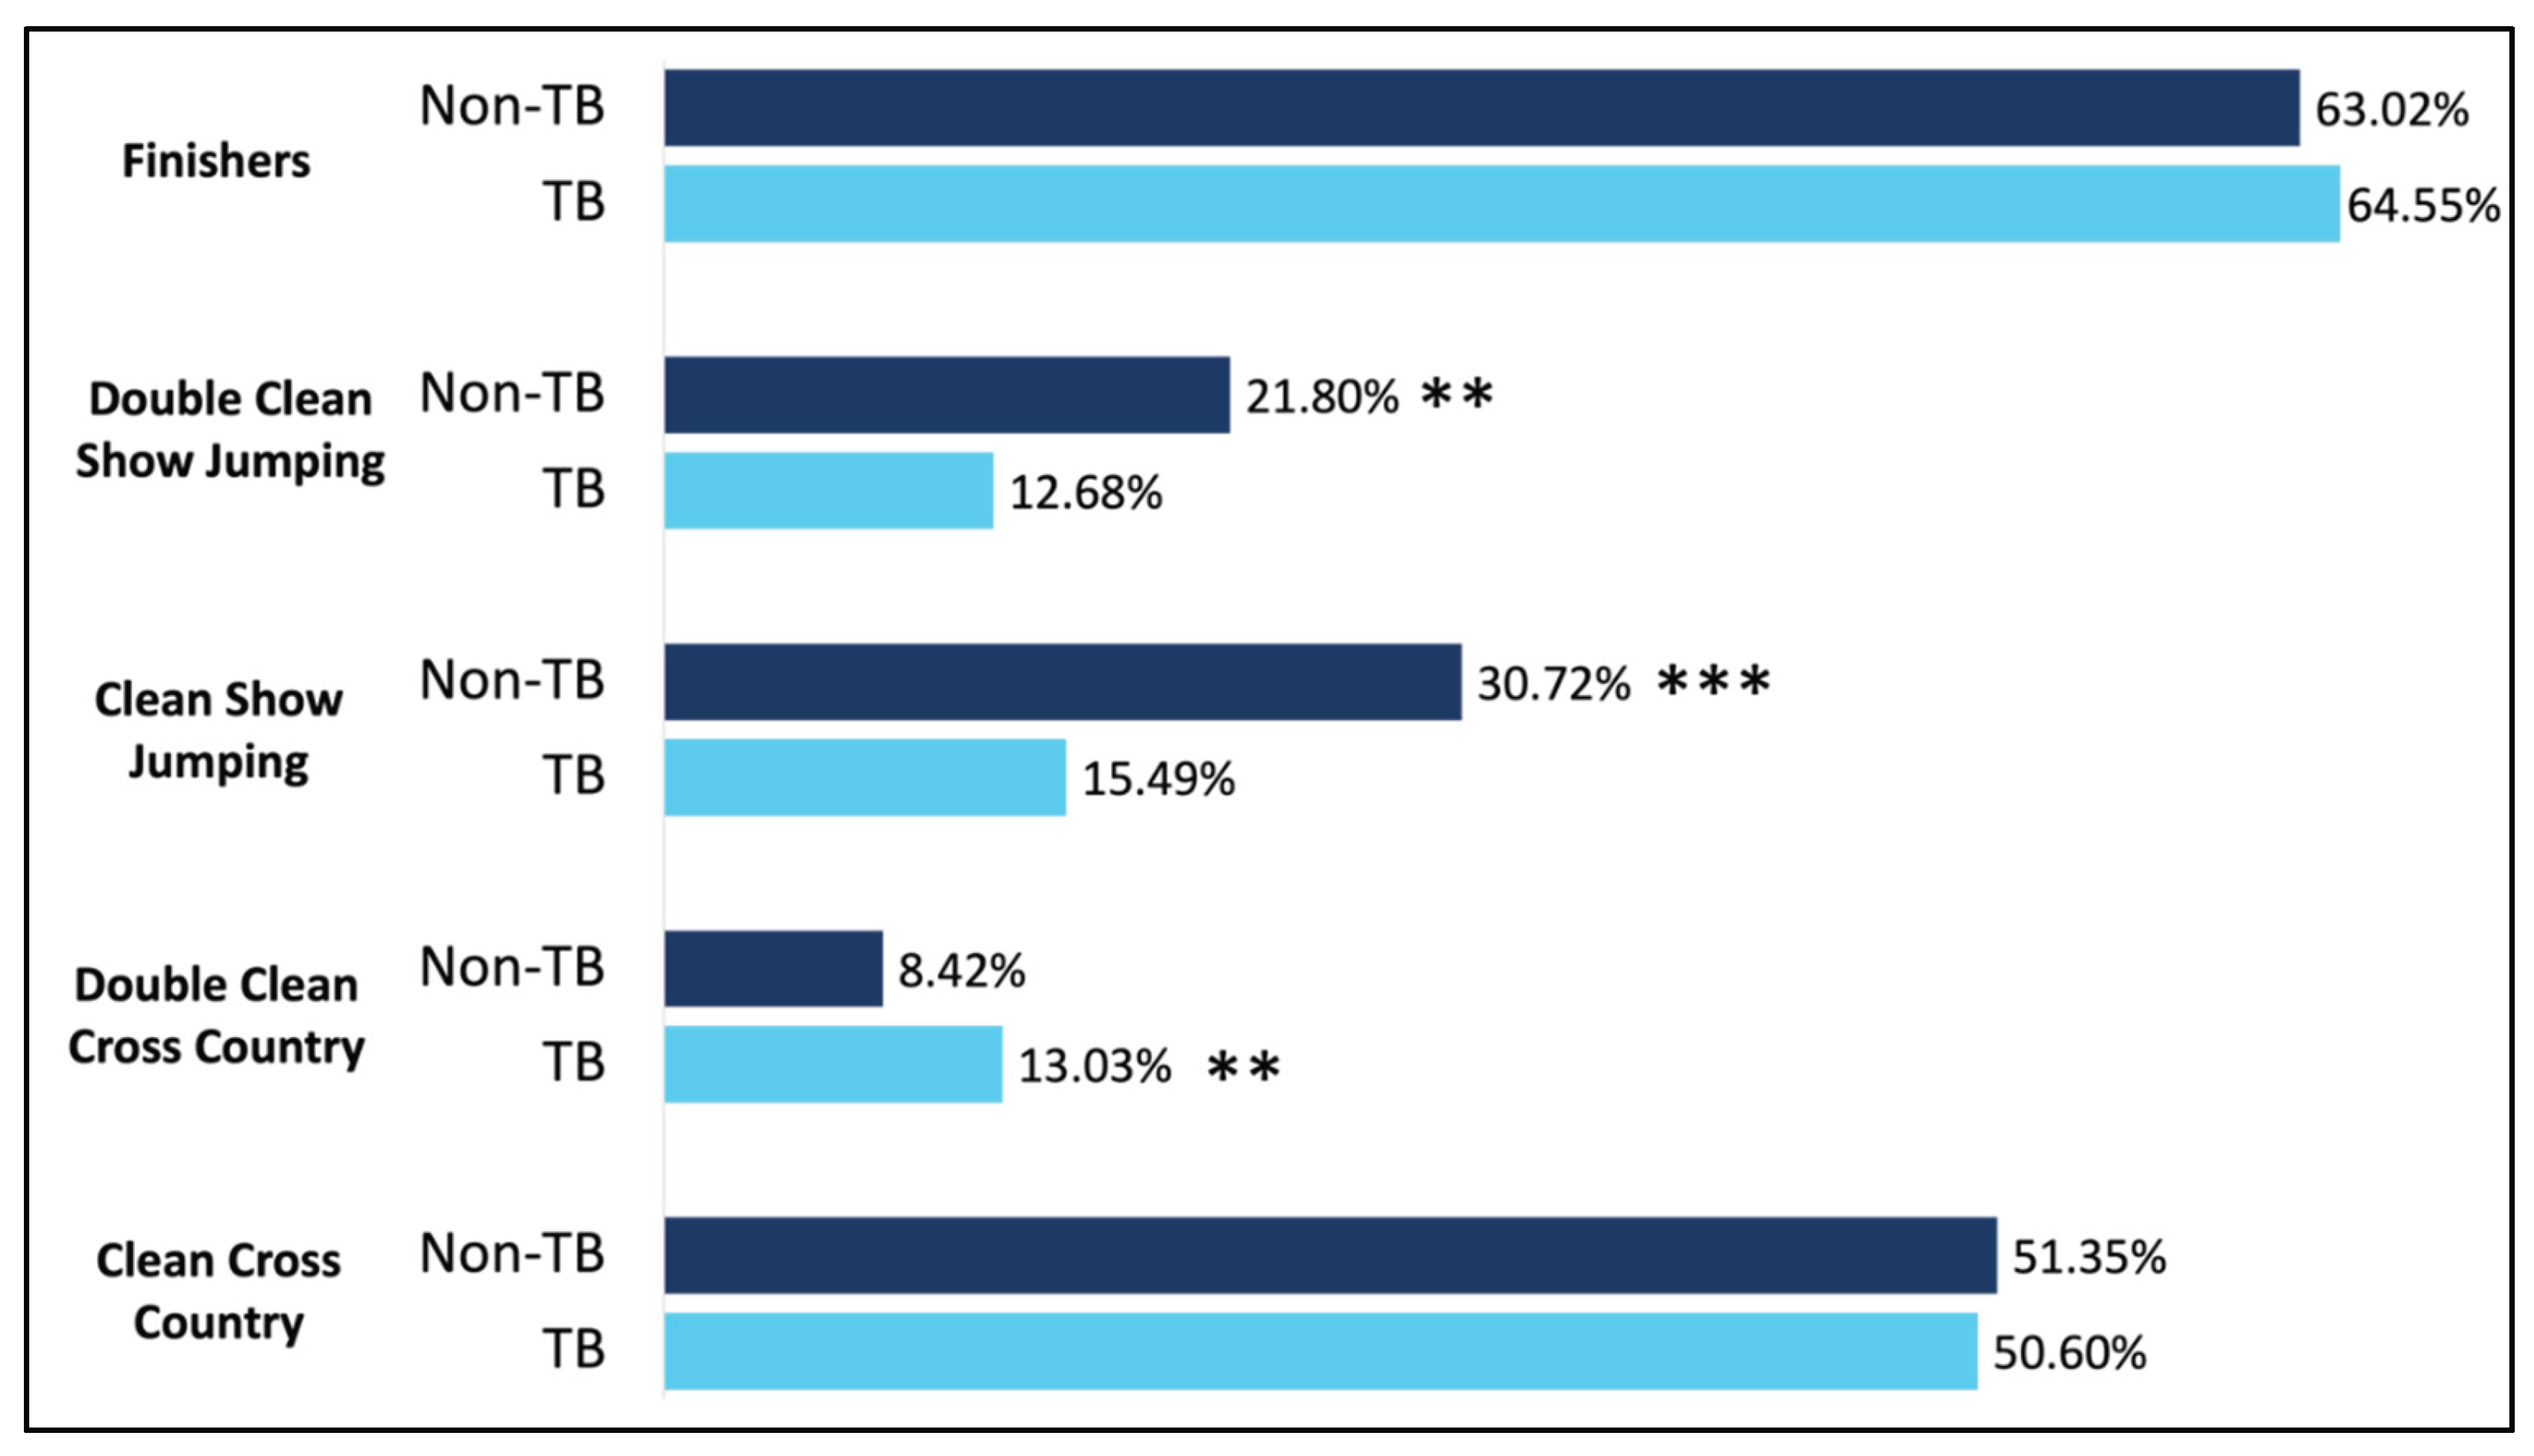
Figure 5.
Overall penalties accumulated at the FEI 5* level from 2014-2024. When assessing 2014-2017, no significant effect of breed was noted when comparing overall penalties accrued by either Thoroughbreds or non-Thoroughbreds (A), nor within any primary breed (B). When assessing 2018-2024, no significant effect of breed was noted when comparing overall penalties accrued by Thoroughbreds or non-Thoroughbreds (C), but a significant effect of breed was noted when comparing primary breeds. This was primarily noted as HOLST accruing significantly fewer overall penalties in comparison to AES, ISH, and TB. Additionally, AES accrued more penalties than SF. a,b,c indicates significance, ns = not significant.
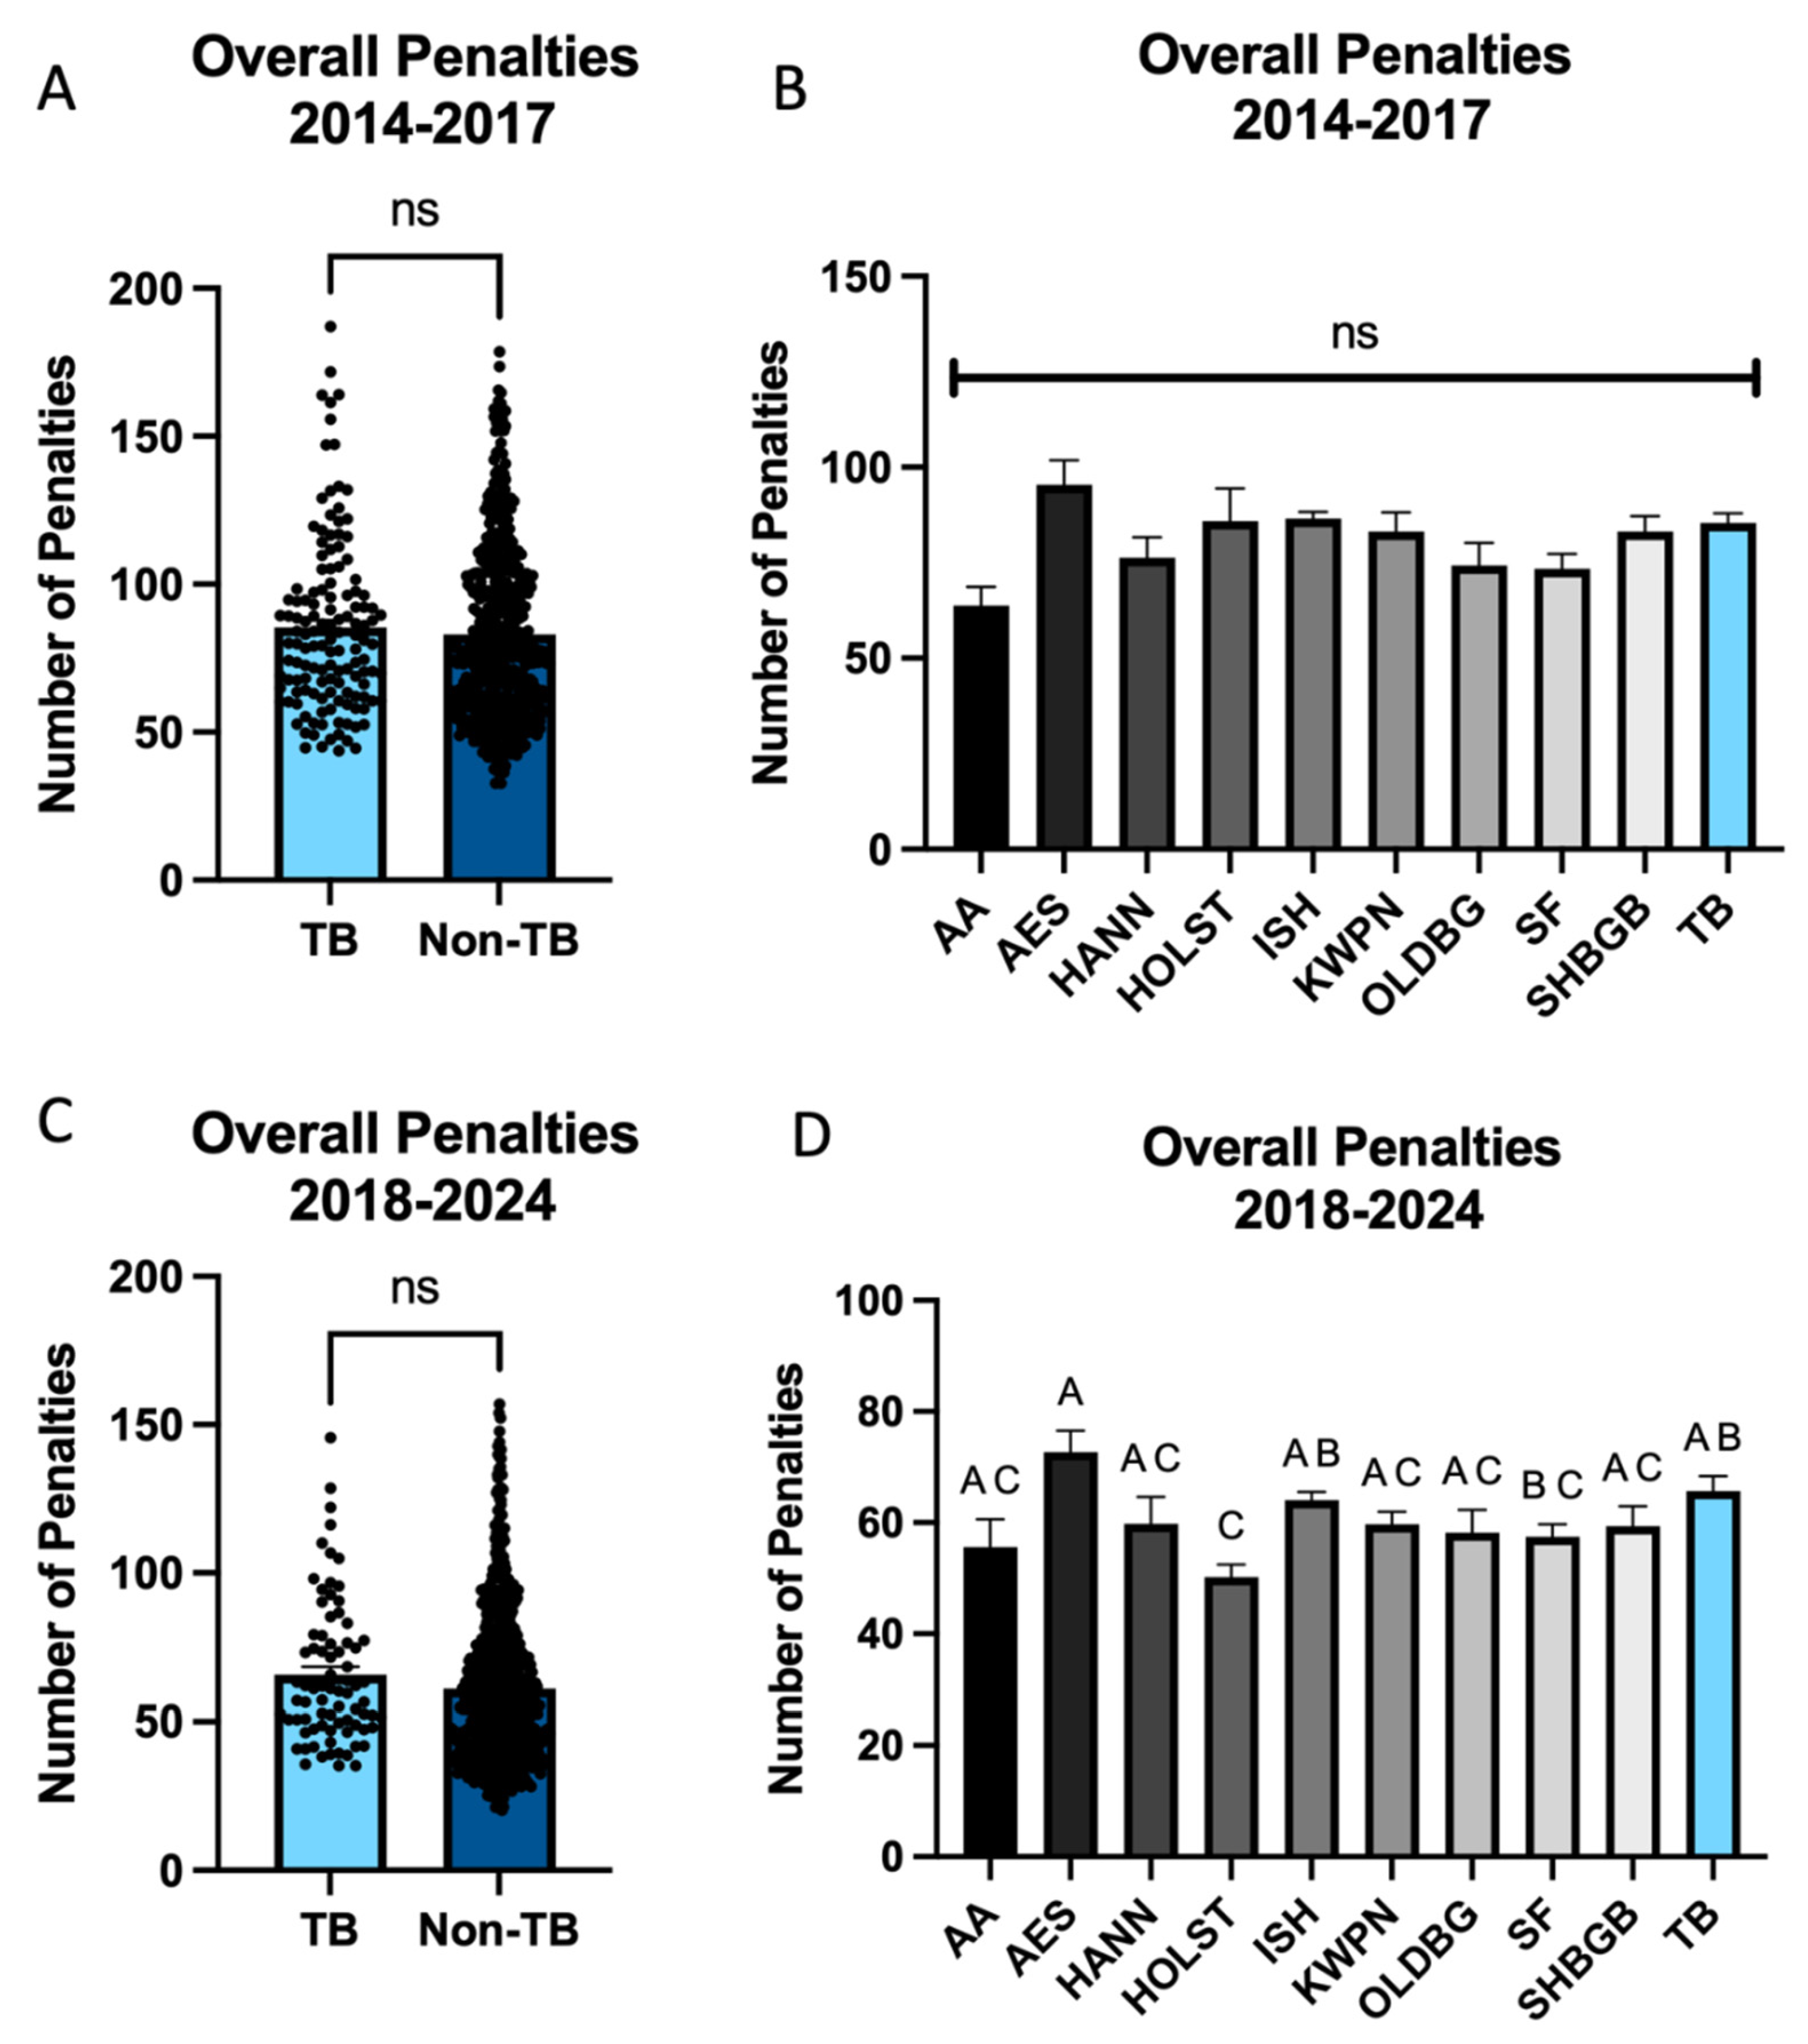

Table 1.
Summary of data assessed.
| Breed | Breed Abbreviation | Number of entries | Average Age at Competition |
|---|---|---|---|
| Anglo-Arabian | AA | 43 | 13.98 |
| Anglo-European | AES | 115 | 13.08 |
| Hannoverian | HANN | 111 | 12.57 |
| Holsteiner | HOLST | 126 | 12.82 |
| Irish Sport Horse | ISH | 864 | 12.91 |
| Dutch Warmblood | KWPN | 250 | 12.67 |
| Oldenburg | OLDBG | 71 | 12.46 |
| Selle Francais | SF | 197 | 13.08 |
| Sport Horse of Great Britain | SHBGB | 170 | 13.00 |
| Thoroughbred | TB | 330 | 13.79 |
Disclaimer/Publisher’s Note: The statements, opinions and data contained in all publications are solely those of the individual author(s) and contributor(s) and not of MDPI and/or the editor(s). MDPI and/or the editor(s) disclaim responsibility for any injury to people or property resulting from any ideas, methods, instructions or products referred to in the content. |
© 2025 by the authors. Licensee MDPI, Basel, Switzerland. This article is an open access article distributed under the terms and conditions of the Creative Commons Attribution (CC BY) license (https://creativecommons.org/licenses/by/4.0/).
Copyright: This open access article is published under a Creative Commons CC BY 4.0 license, which permit the free download, distribution, and reuse, provided that the author and preprint are cited in any reuse.


