
Submitted:
12 May 2025
Posted:
13 May 2025
You are already at the latest version
Abstract
Background: This retrospective study aims to analyze the age, gender, and systemic disease status of children and adolescents treated under general anesthesia and sedation, identify the types of pediatric dental treatments performed, and evaluate possible associations with systemic diseases. Methods: The study included 464 children and adolescents aged 3–16 who received dental treatment under general anesthesia and sedation at a university hospital between 2023 and 2024. Demographic and clinical data were obtained from patient records and archives. Data analysis was conducted using the R programming language. Mann-Whitney U, Chi-square, and Fisher’s Exact tests were used for statistical comparisons (p< 0.05). Results: The highest treatment rates were observed in 5-year-olds (28.23%) and 6-year-olds (26.29%). The gender distribution was 43.3% girls and 56.7% boys, with a systemic disease prevalence of 23.9%. The most common conditions were autism (9.5%), mental retardation (2.2%), and epilepsy (1.5%). Based on American Society of Anesthesiologists (ASA) classification, 75% of the children were ASA 1, 23.9% ASA 2, and 1.1% ASA 3. Systemic disease showed significant associations with both median age (p< 0.001) and gender (p=0.046). Composite restoration was the most common treatment (42.47%), followed by tooth extraction (25.24%), pulpotomy (13.65%), and stainless steel crowns (10.81%). Fissure sealants and extractions were significantly more common in children with systemic diseases (p< 0.001), while stainless steel crowns and pulpotomy were more frequent among healthy children (p< 0.001). Conclusions: This retrospective study evaluated the distribution of pediatric dental treatments performed under general anesthesia and sedation, as well as the influence of systemic diseases on treatment preferences. Fissure sealants and tooth extractions were more frequently performed in children with systemic diseases, while stainless steel crowns and pulpotomy were more common in healthy individuals. Multidisciplinary planning is essential in pediatric dental treatments requiring general anesthesia, and there is a need for comprehensive studies with long-term follow-up.
Keywords:
general anesthesia
; systemic diseases
; early childhood caries
; non- cooperative
; ASA Classification
; Pediatric Dental Treatments
1. Introduction
Dental caries is considered one of the most common chronic diseases worldwide [1], and untreated dental caries are known to affect approximately 0.62 billion children globally [2].
Early Childhood Caries (ECC) is defined as the presence of one or more decayed (cavitated or non-cavitated lesions), missing (due to caries), or filled tooth surfaces in any primary tooth in a child under six years of age. It is one of the most frequently encountered conditions in children and is considered a chronic and infectious disease [3,4]. ECC is an infectious condition that progresses rapidly in primary teeth and causes tissue loss; therefore, a comprehensive and effective treatment process is required to control dental pain and prevent the development of caries [5].
Delays in dental treatment can lead to the development of pain and infection in children, resulting in disruptions in nutrition and sleep patterns, increased school absenteeism, and interference with daily activities. This situation negatively affects not only the physical health of children but also their psychosocial well-being, leading to a significant decline in the quality of life for both the children and their parents [6]. In pediatric patients, anxiety and lack of cooperation pose significant challenges in diagnosis and treatment processes. In dental practice for these patients, non-pharmacological behavior guidance techniques supported by local anesthesia are commonly used. In pediatric dentistry, both pharmacological and non-pharmacological methods are frequently employed to ensure treatment continuity [7,8]. However, due to the young age of the children and lack of cooperation, sedation or general anesthesia is often required [9].
General anesthesia is a state in which patients lose the ability to respond to verbal commands and protective reflexes, cannot react to painful stimuli, and experience a temporary suppression of consciousness [10]. Before the operation, patients should be evaluated by an anesthesiologist in terms of existing illnesses, medication history, and the necessity of the procedure. The decisions made during this process should be shared with the patient and their parents, and patients should be classified according to the American Society of Anesthesiologists (ASA) criteria. Those in ASA 1-2 groups are suitable for sedation and general anesthesia, while anesthesia should only be applied under special conditions for those in ASA 3-4 groups [11].
The American Academy of Pediatric Dentistry (AAPD) recommends general anesthesia not only for cases of Early Childhood Caries (ECC), but also for patients with physical, emotional, mental, or medical disabilities; cases where local anesthesia cannot be applied; patients who are uncooperative due to excessive fear or anxiety; treatments requiring surgical intervention; patients in whom the risk can be reduced with sedation or anesthesia; and for urgent and comprehensive treatment cases [12].
Despite its high cost, the need for an experienced team and equipment, and the risks of mortality and complications, general anesthesia is preferred because it enables successful treatment in a single session in appropriately indicated patients, does not require patient cooperation, and improves quality of life [13,14]. The dental treatment plan for patients requiring general anesthesia may include restorations, pulp therapies, tooth extractions, surgical procedures, and preventive applications [15].
This retrospective study aims to analyze the age, gender, and medical information of non-cooperative healthy children or children/adolescents with medical problems or disabilities who underwent dental treatment under general anesthesia, and to identify and evaluate the types of dental treatments performed under general anesthesia and sedation.
2. Materials and Methods
2.1. Study Design and Ethical Approval
For this study, ethical approval was obtained from the Local Ethics Committee of the Faculty of Dentistry, Dicle University, in accordance with the Declaration of Helsinki (Date: 25.09.2024, Protocol No: 2024-23). In this retrospective study, archived data from pediatric patients who applied to our faculty were used, and routine informed consent forms allowing the use of pre-treatment records in scientific studies were obtained.
2.2. Sample Size Calculation
Based on the archived records, approximately 500 pediatric patients received dental treatment under general anesthesia and sedation between February 2023 and August 2024. Assuming a 95% confidence interval and a 5% margin of error, the minimum sample size was calculated as 218 using the parameters mentioned. The sample size calculation was performed using Raosoft’s sample size calculator (http://www.raosoft.com/samplesize.html).
2.3. Data Collection
In this retrospective study, archived general anesthesia files and patient records from the faculty’s medical software system were reviewed for patients treated under general anesthesia. During the examination process, patients were evaluated intraorally, extraorally, physically, systemically, and mentally, and it was decided whether they should be treated under general anesthesia or sedation. Routine hematological tests (hemogram) were requested from patients planned for treatment, and additional investigations were conducted if deemed necessary. Patients were referred to the Department of Anesthesiology and Reanimation for consultation. Prior to general anesthesia, detailed explanations were provided to the guardians about the dental procedures to be performed, procedures not recommended and their justifications, as well as the potential risks of general anesthesia. An informed consent form was signed. General anesthesia was not administered to children whose parents did not accept the procedures or the risks of anesthesia. In this study, demographic data (age and gender), presence of disability or systemic disease, ASA (American Society of Anesthesiologists) classification, and the dental treatments applied were retrospectively reviewed and recorded. Patients treated under general anesthesia in this retrospective study were classified according to the ASA classification system using the archived data [11] (Table 1).
2.4. Sample Selection
This study included pediatric patients aged between 3 and 16 years who received dental treatment under general anesthesia or sedation in the Department of Pediatric Dentistry at Dicle University Faculty of Dentistry between February 2023 and August 2024, and whose system records were complete. Inclusion criteria were being within the specified age range and either being healthy or having a medical condition or disability. Data that did not meet these criteria were excluded from the study.
2.5. Statistical Analysis
Data were analyzed using version 4.4.1 of the R programming language. Normality of the data distribution was assessed using the Kolmogorov–Smirnov test. The Mann–Whitney U test was used to compare variables that did not follow a normal distribution. Associations between categorical variables were examined using the Chi-square test, Yates correction, Fisher’s Exact test, and the Monte Carlo corrected Fisher’s Exact test. Quantitative data were presented as median (minimum–maximum), while categorical data were presented as frequency (percentage). A p-value of <0.05 was considered statistically significant.
3. Results
When examining the age distribution of the children included in our study, the highest proportion was observed in the 5-year-old group with 28.23%. This was followed by the 6-year-old group with 26.29%, the 7-year-old group with 16.38%, and the 4-year-old group with 8.62%. In the older age groups, the proportions gradually decreased, with 5.82% in the 8-year-old group, 3.66% in the 9-year-old group, and 2.16% in the 10-year-old group. Additionally, the proportions in the 11-, 12-, 13-, and 14-year-old groups ranged between 1.51% and 1.08%, while the lowest rates were recorded in the 15-year-old group (0.86%) and the 16-year-old group (1.29%) (Table 2). The distribution of children treated under general anesthesia by age group is illustrated using a 100% stacked column chart (Fig. 1).
Figure 1.
100% stacked column chart showing the age group distribution of children treated under general anesthesia.
Figure 1.
100% stacked column chart showing the age group distribution of children treated under general anesthesia.
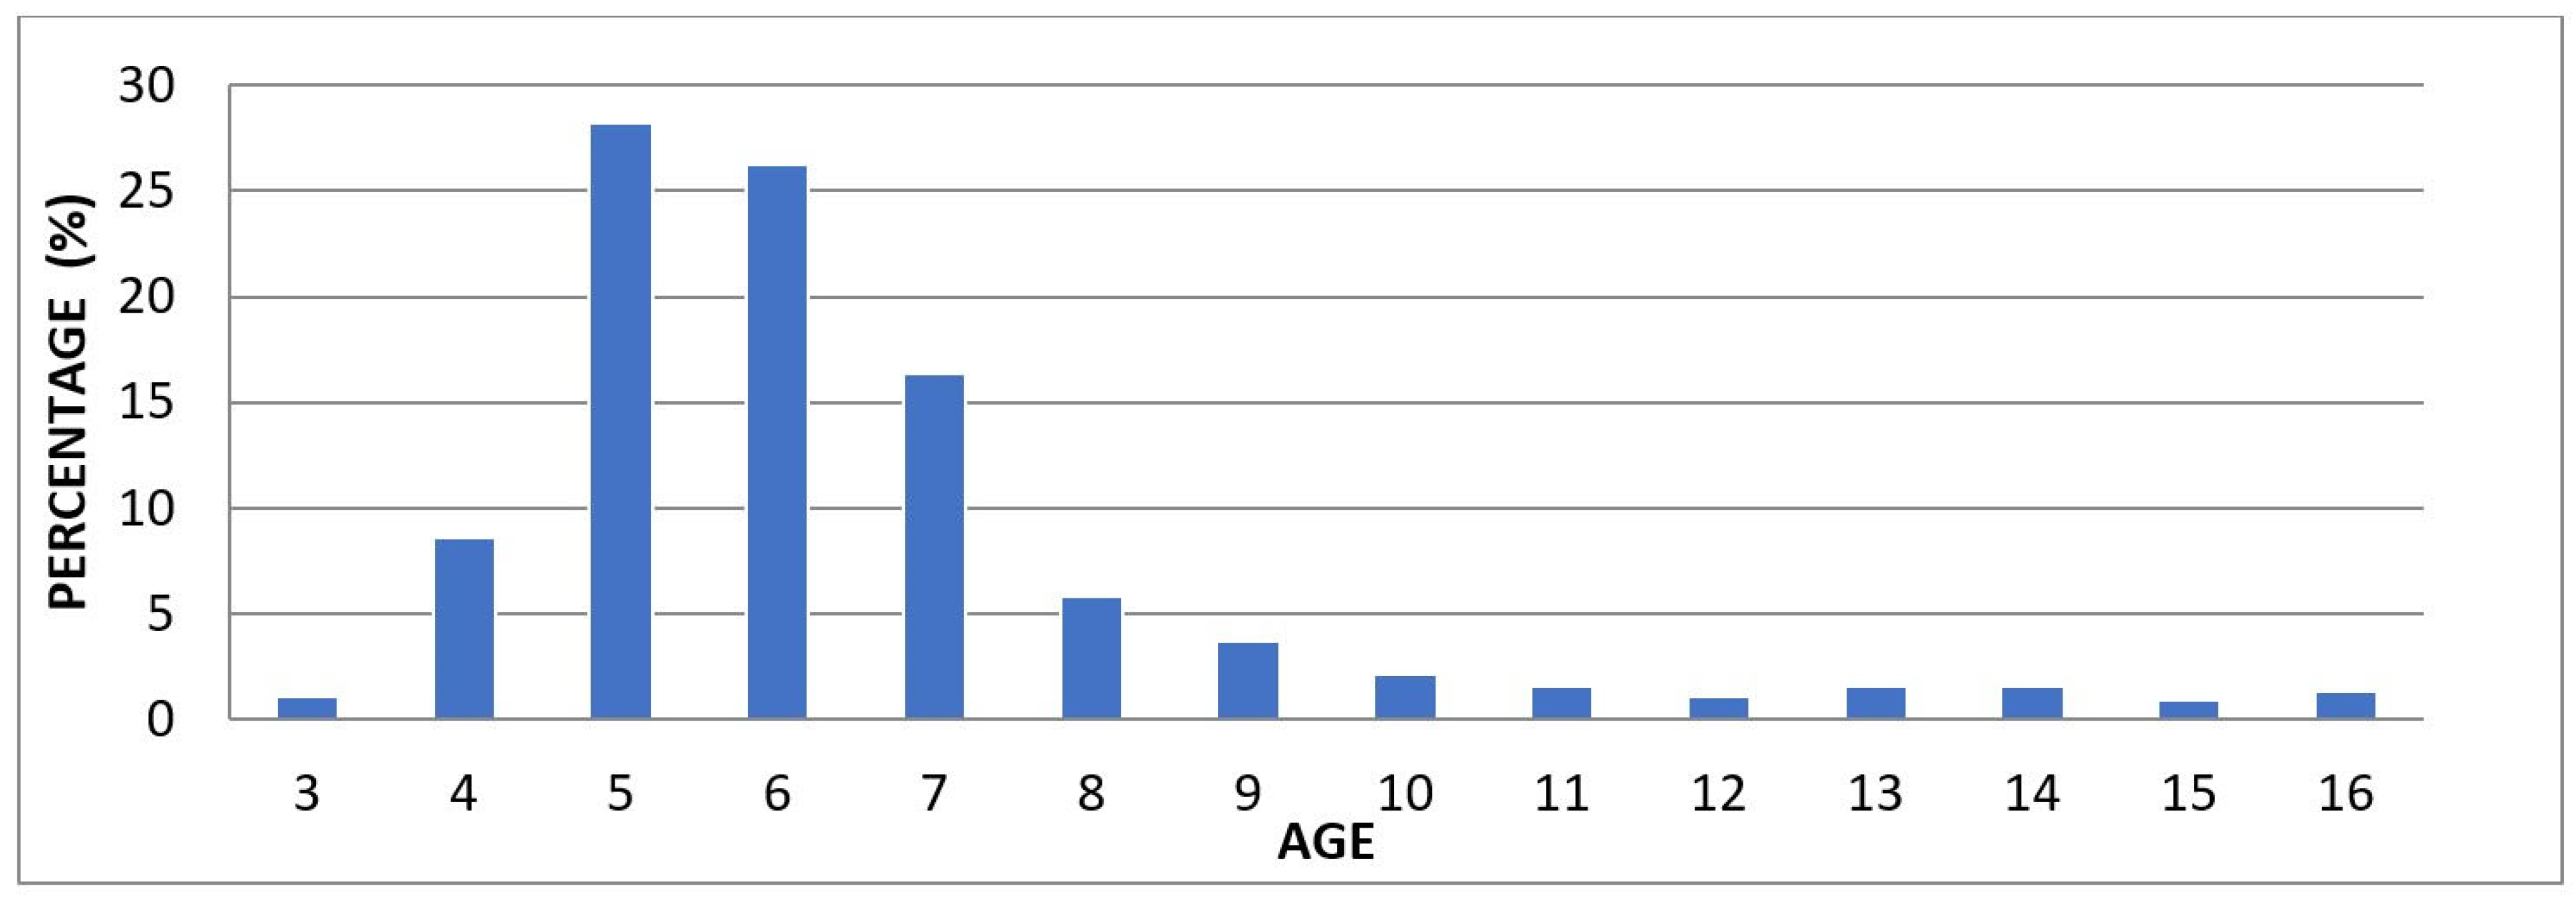

Table 2.
Distribution of children treated under general anesthesia by age group.
| Age | n | % |
|---|---|---|
| 3 | 5 | 1.08 |
| 4 | 40 | 8.62 |
| 5 | 131 | 28.23 |
| 6 | 122 | 26.29 |
| 7 | 76 | 16.38 |
| 8 | 27 | 5.82 |
| 9 | 17 | 3.66 |
| 10 | 10 | 2.16 |
| 11 | 7 | 1.51 |
| 12 | 5 | 1.08 |
| 13 | 7 | 1.51 |
| 14 | 7 | 1.51 |
| 15 | 4 | 0.86 |
| 16 | 6 | 1.29 |
According to gender data, 43.3% of the children were girls and 56.7% were boys. Based on systemic health status, 76.1% of the children were healthy, while 23.9% had a systemic disease. Among systemic diseases, the most frequently observed were Autism (9.5%), Mental Retardation (2.2%), Epilepsy (1.5%), Cerebral Palsy (1.5%), and Down Syndrome (1.3%). Atrial Septal Defect (ASD) (0.9%), Cleft Lip and Palate, Bronchitis, Asthma, and Penicillin Allergy were each observed at a rate of 0.7%. Less common conditions included Allergic Asthma, Developmental Delay, Hyperactivity, and Microcephaly (0.4%); Lung Cyst, Atopic Dermatitis, Refractory Rickets, Galactosemia, Goiter/ASD (Atrial Septal Defect), Hydrocephalus, Hypothyroidism, Allergy to Local Anesthetics, Sickle Cell Anemia, PFO, PFAPA (Periodic Fever, Aphthous Stomatitis, Pharyngitis, and Adenitis) Syndrome, Scoliosis, and Thalassemia Major (0.2%). According to the ASA classification, 75% of the children were categorized as ASA 1, 23.9% as ASA 2, and 1.1% as ASA 3. Strip crown application was performed in 0.2% of the children, while 99.8% did not receive this treatment. Scaling/polishing was performed in 16.6% of the cases and not performed in 83.4%. Fluoride application was carried out in 17.9% of the children, whereas 82.1% did not receive it (Table 3).
In our study, based on the data obtained from 464 children, the median age was found to be 6. Additionally, the median values for the types of treatments performed were as follows: 6 for composite fillings, 1 for stainless steel crowns, 0 for pulp capping, root canal treatment, and fissure sealants, 2 for pulpotomy, and 3 for tooth extraction (Table 4).
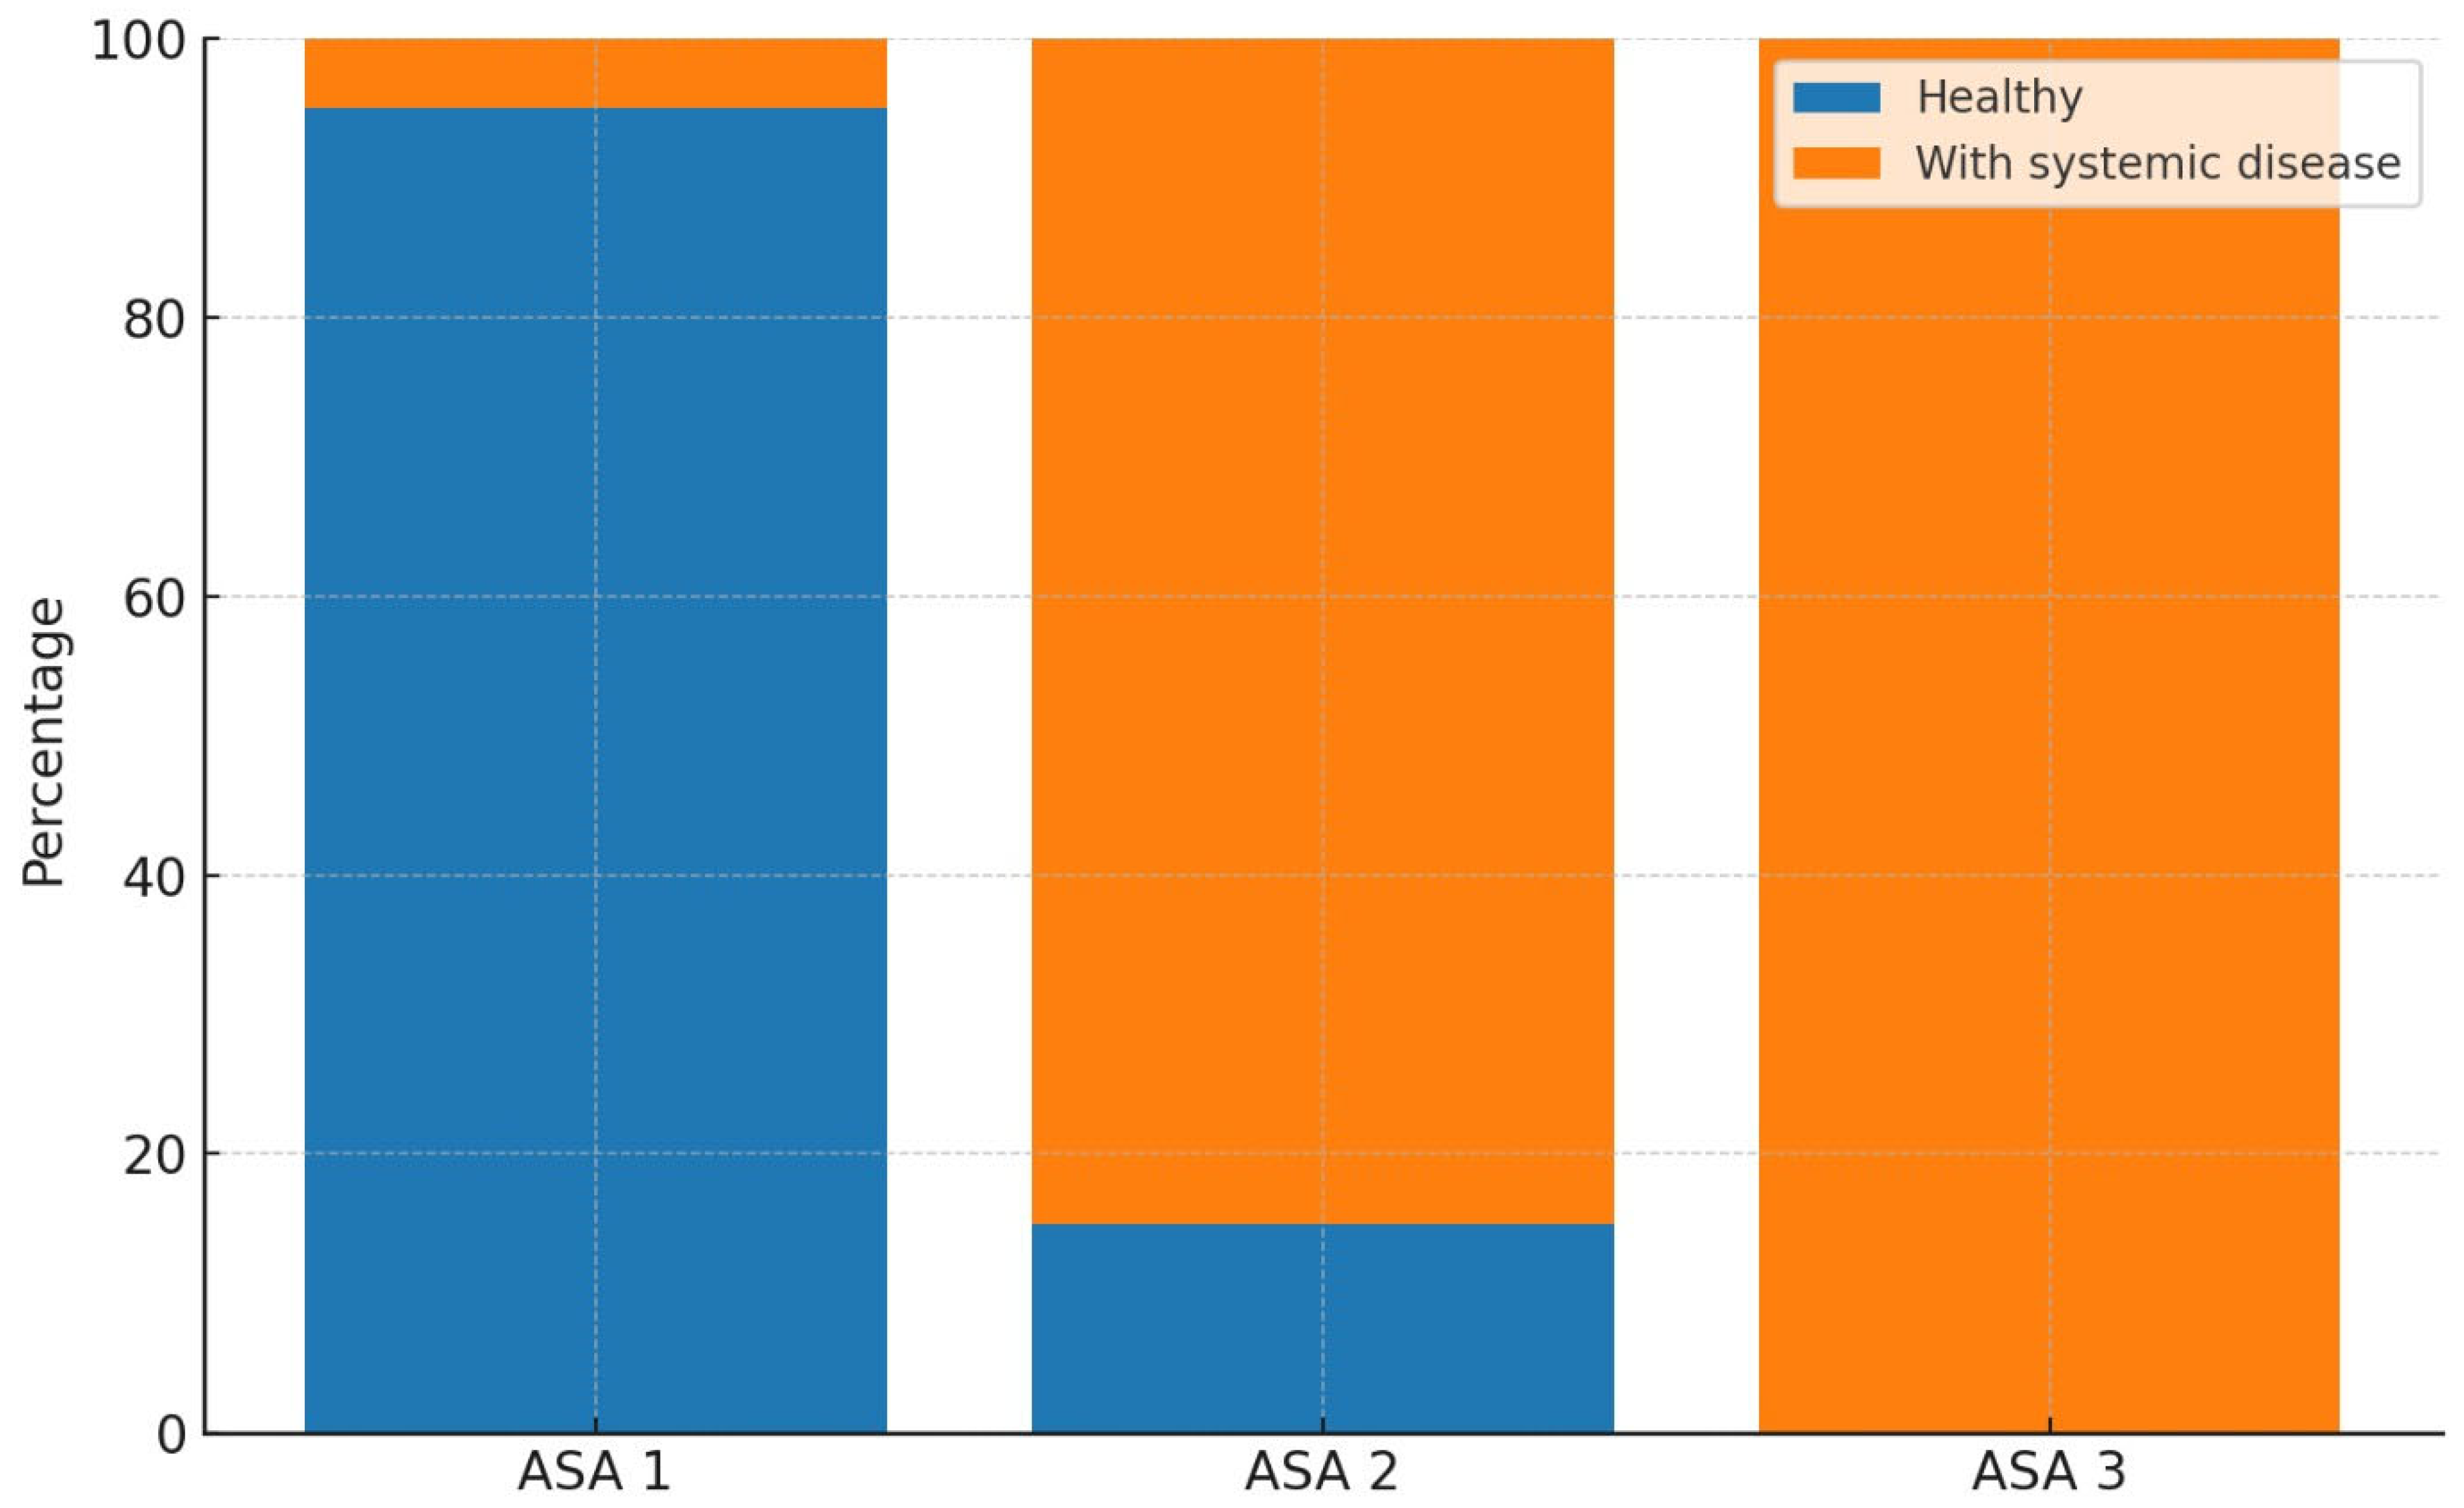
When examining the gender distribution among healthy children, the proportion of girls was 45.9%, while that of boys was 54.1%. In children with systemic diseases, the proportion of girls was 35.1%, and that of boys was 64.9%. A statistically significant relationship was found between gender and the presence of systemic disease (p = 0.046). Regarding the ASA classification among healthy children, 95.2% were classified as ASA 1, 4.8% as ASA 2, and 0% as ASA 3. Among children with systemic diseases, 10.8% were classified as ASA 1, 84.7% as ASA 2, and 4.5% as ASA 3. A statistically significant association was identified between ASA classification and the presence of systemic disease (p < 0.001) (Table 5a). The distribution of systemic diseases according to ASA classifications was visualized using a 100% stacked column chart (Fig. 2).
Figure 2.
100% stacked column chart showing the distribution of systemic diseases according to ASA classification.
Figure 2.
100% stacked column chart showing the distribution of systemic diseases according to ASA classification.
Among healthy children, 87.5% had not undergone scaling/polishing procedures, while 12.5% had received them. In contrast, within the group of children with systemic diseases, 70.3% had not received scaling/polishing, whereas the procedure had been performed in 29.7% of cases. The association between scaling/polishing and the presence of systemic disease was found to be statistically significant (p < 0.001). Regarding fluoride application, 81.6% of healthy children had not received fluoride treatment, while 18.4% had. In children with systemic diseases, 83.8% had not received fluoride application, and 16.2% had undergone the procedure. The analysis revealed no statistically significant association between fluoride application and the presence of systemic disease (p = 0.700) (Table 5b).
Table 5.
a. Analysis of the association between systemic disease and categorical variables.
| Healthy | With systemic disease | Test Statistic | p-value | |
|---|---|---|---|---|
| Gender | ||||
| Girl | 162 (45.9) | 39 (35.1) | 3.980 | 0.046y |
| Boy | 191 (54.1) | 72 (64.9) | ||
| ASA Classification | ||||
| ASA 1 | 336 (95.2)a | 12 (10.8)b | 307.369 | <0.001t |
| ASA 2 | 17 (4.8)a | 94 (84.7)b | ||
| ASA 3 | 0 (0)a | 5 (4.5)b |
yChi-square test; t Fisher’s Exact test with Monte Carlo correction, n (%), a–b: No significant difference between ratios with the same letter.
Table 5.
b. Comparison of systemic disease with strip crown, scaling/polishing, and fluoride application.
Table 5.
b. Comparison of systemic disease with strip crown, scaling/polishing, and fluoride application.
| Healthy | With systemic disease | Test Statistic | p-value | |
|---|---|---|---|---|
| Strip Crown Application | ||||
| Not applied | 352 (99.7) | 111 (100) | — | — |
| Applied | 1 (0.3) | 0 (0) | ||
| Scaling/Polishing Application | ||||
| Not applied | 309 (87.5) | 78 (70.3) | 16.961 | <0.001x |
| Applied | 44 (12.5) | 33 (29.7) | ||
| Fluoride Application | ||||
| Not applied | 288 (81.6) | 93 (83.8) | 0.148 | 0.700x |
| Applied | 65 (18.4) | 18 (16.2) |
x Yates’ correction, n (%).
Among healthy children, the median age was 6, whereas it was 8 among those with systemic diseases, and this difference was found to be statistically significant (p < 0.001). Regarding composite fillings, the median value was 6 in healthy children and 5 in children with systemic diseases; however, this difference was not statistically significant (p = 0.061). For stainless steel crowns, the median value was 1 in healthy children and 0 in those with systemic diseases, indicating a statistically significant difference (p < 0.001). The median values for pulp capping procedures did not differ significantly between the two groups (p = 0.014). A statistically significant difference was observed in the median values of pulpotomy treatments according to systemic health status (p < 0.001), with a median of 2 in healthy children and 1 in those with systemic diseases. The median value for root canal treatment was 0 in both groups, with no statistically significant difference based on systemic health status (p = 0.468). For fissure sealants, the median value was 0 in healthy children and 1 in those with systemic diseases, and this difference was statistically significant (p < 0.001). Lastly, the median number of tooth extractions was 3 in both groups, and no statistically significant difference was found (p = 0.326) (Table 6).
When examining the pediatric dental treatments performed, composite fillings were applied in 42.87% of healthy children and in 41.18% of children with systemic diseases. Composite filling was the most frequently performed treatment, accounting for 42.47% of all treated teeth. Stainless steel crown treatments were performed in 11.75% of healthy children, compared to 7.76% in children with systemic diseases. Pulp capping was rarely performed, with a rate of 0.1% in healthy children and 0.26% in those with systemic diseases. Pulpotomy was performed in 15.08% of healthy children and in 8.99% of children with systemic diseases. Root canal treatment was rarely administered in both groups, at rates of 0.46% for healthy children and 0.39% for those with systemic diseases. Fissure sealants were applied in 5.32% of healthy children and in 13.45% of those with systemic diseases. Tooth extraction was performed in 24.39% of healthy children and in 27.99% of children with systemic diseases. Strip crowns were applied only in healthy children, at a rate of 0.04%. A statistically significant relationship was found between the presence of systemic disease and both tooth extractions and fissure sealant treatments (p < 0.001). Additionally, a statistically significant association was observed between stainless steel crowns and pulpotomy treatments in healthy children (p < 0.001). No statistically significant differences were found between the two groups for the other treatment modalities (Table 7). The distribution of systemic diseases by treatment type was visualized using a 100% stacked column chart (Fig. 3).
Figure 3.
100% stacked column chart showing the distribution of systemic diseases according to treatments.
Figure 3.
100% stacked column chart showing the distribution of systemic diseases according to treatments.
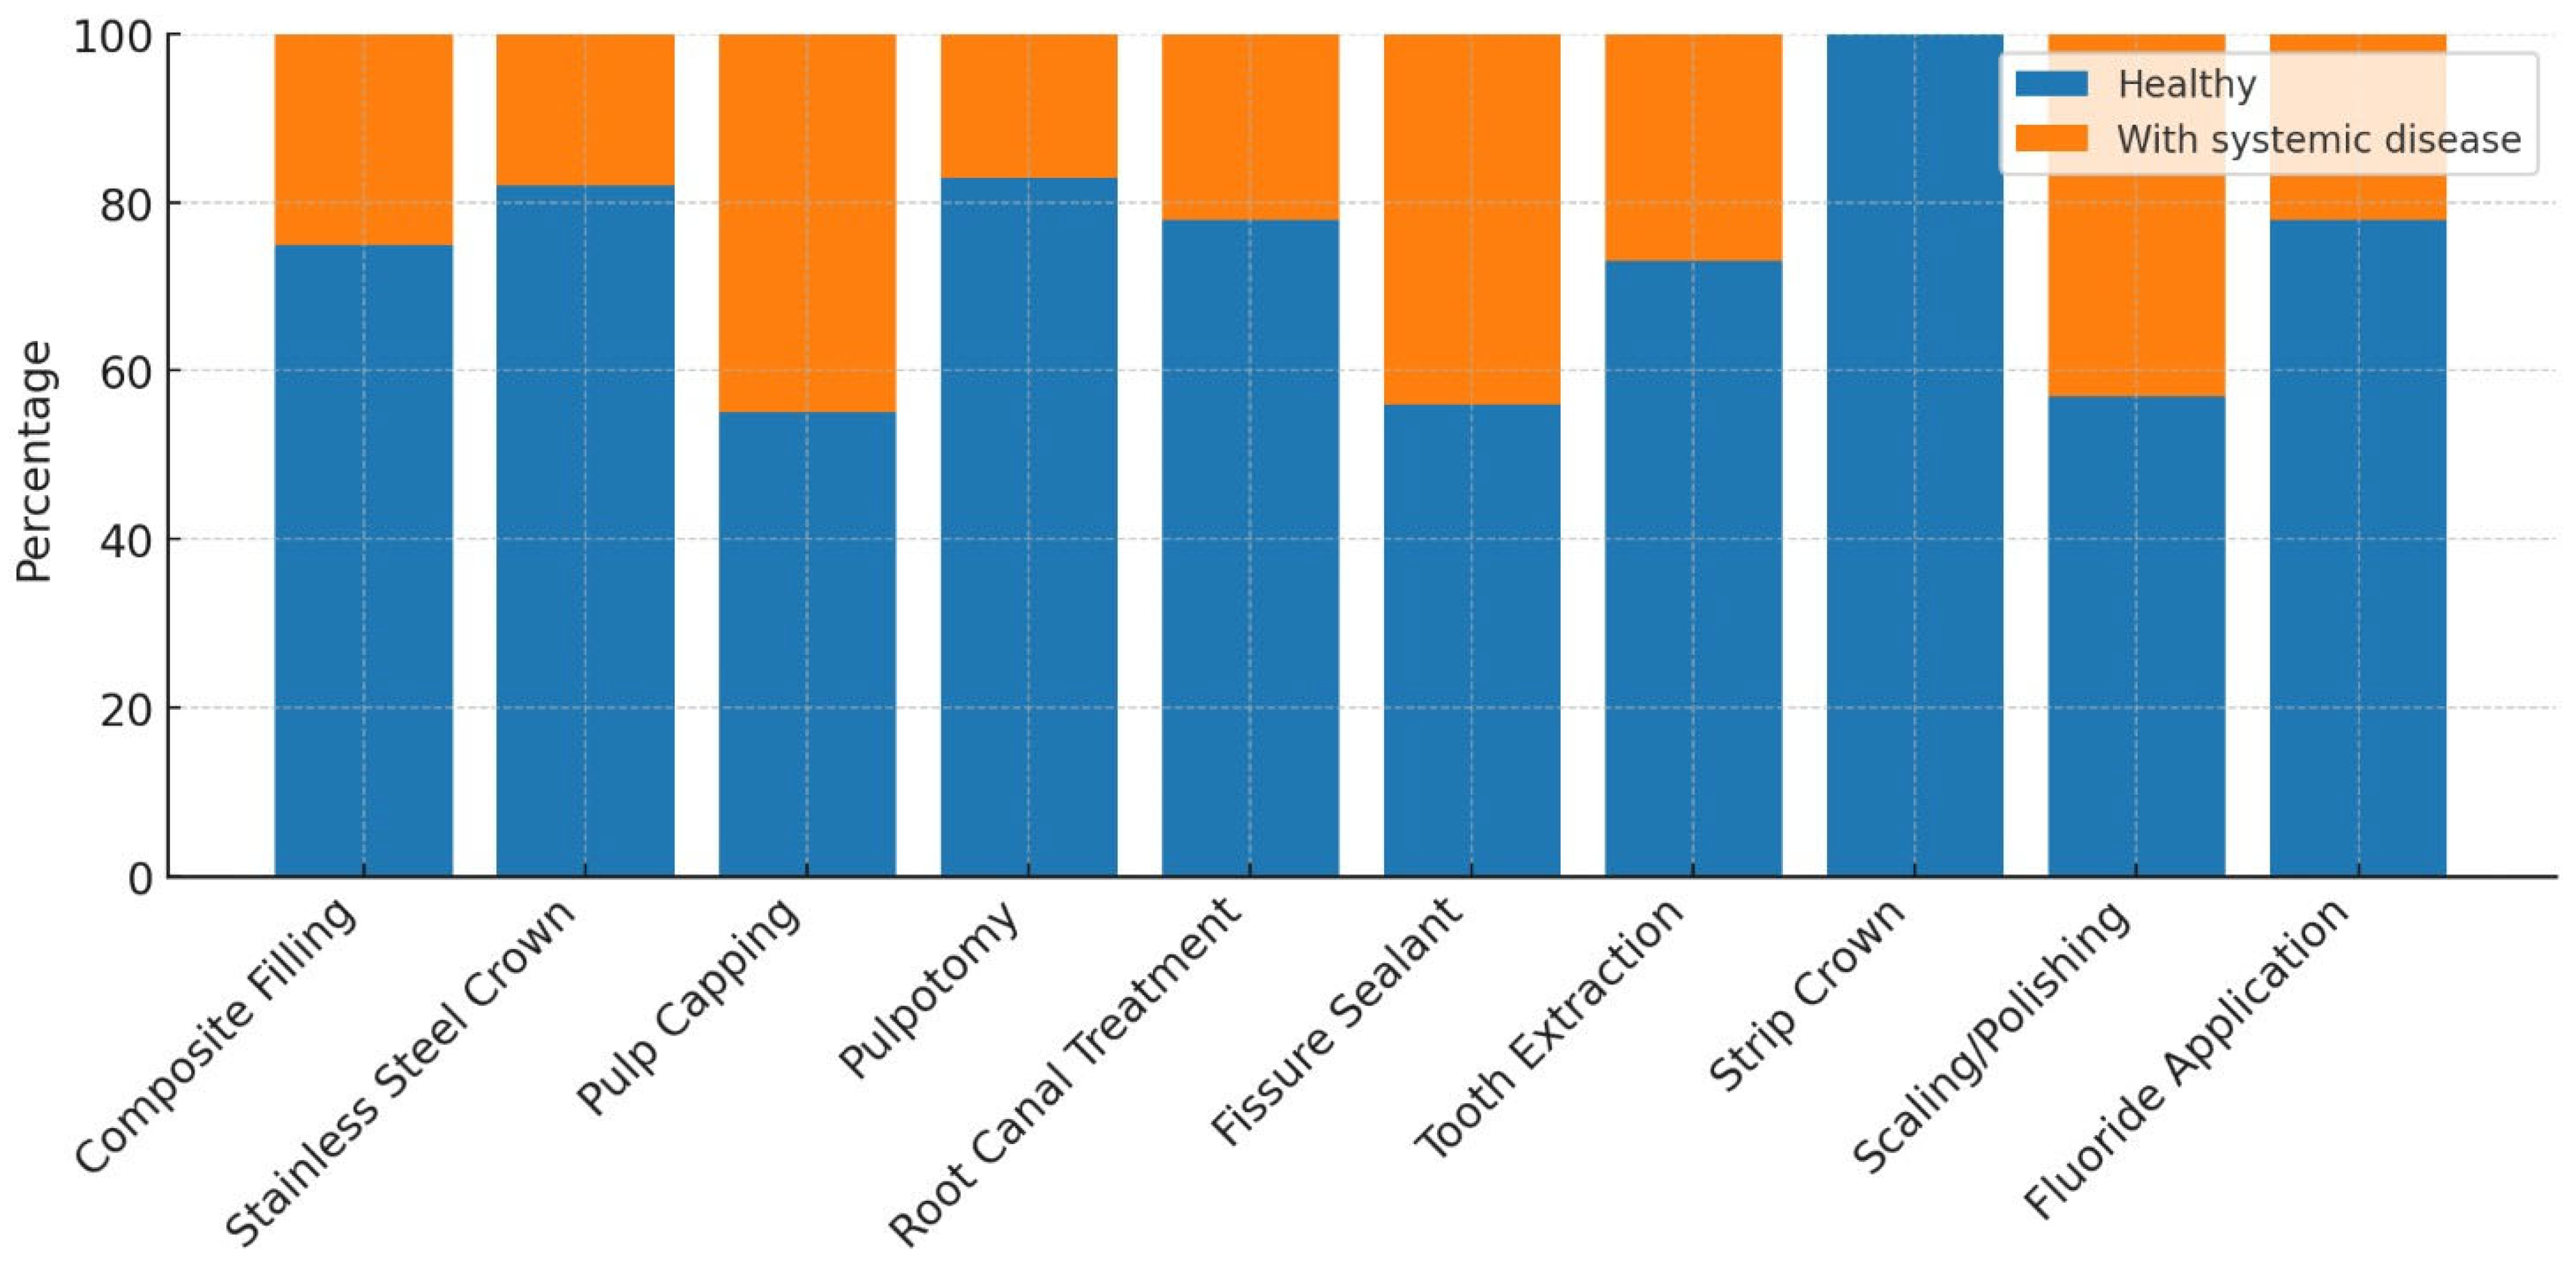
Table 7.
Comparison of the number of treatments based on systemic disease status.
| Treatment Type | Healthy | With systemic disease | Total | Test Statistic | p-value |
|---|---|---|---|---|---|
| Composite filling (n) | 2160 (42.87) | 637 (41.18) | 2797 (42.47) | 157.181 | <0.001 |
| Stainless steel crown (n) | 592 (11.75)a | 120 (7.76)b | 712 (10.81) | 157.181 | <0.001 |
| Pulp capping (n) | 5 (0.1) | 4 (0.26) | 9 (0.14) | 157.181 | <0.001 |
| Pulpotomy treatment (n) | 760 (15.08)a | 139 (8.99)b | 899 (13.65) | 157.181 | <0.001 |
| Root canal treatment (n) | 23 (0.46) | 6 (0.39) | 29 (0.44) | 157.181 | <0.001 |
| Fissure sealant (n) | 268 (5.32)a | 208 (13.45)b | 476 (7.23) | 157.181 | <0.001 |
| Tooth extraction (n) | 1229 (24.39)a | 433 (27.99)b | 1662 (25.24) | 157.181 | <0.001 |
| Strip crown (n) | 2 (0.04) | 0 (0) | 2 (0.03) | 157.181 | <0.001 |
Fisher’s Exact test with Monte Carlo correction, n (%), a–b: No significant difference between values sharing the same letter.
4. Discussion
Dental caries can lead to a variety of problems such as acute and chronic infections, pain, psychological disorders, sleep disturbances, behavioral changes, and difficulties in nutrition [16]. It is known that untreated dental caries have negative effects on the quality of life of children [17].
Behavior management techniques used in pediatric dentistry reinforce the sense of trust and facilitate the completion of treatment in cooperation by reducing stress and anxiety in children with high dental fear. However, for children and adolescents who cannot establish communication and cooperation due to psychological, emotional, mental, or physical conditions, dental treatment is performed under general anesthesia [18,19]. In our study, pediatric dental treatments performed under general anesthesia and sedation were evaluated in healthy children aged between 3 and 16 years, as well as in children and adolescents with systemic diseases or disabilities, who presented to our hospital between February 2023 and August 2024.
In the study by Zhao et al., it was observed that 48.94% of the 94 children examined were boys and 51.06% were girls. When analyzed by age groups, the highest proportion was found in the 4–5-year-old group with 44.68%, while the lowest proportion was among children under the age of 3, with 1.06%. Children aged 6 and above accounted for 9.57% of the study population [2]. In the study conducted by Schulz-Weidner et al., a total of 325 children aged 0–18 years were evaluated. According to age distribution, 165 children were in the preschool period (mean age 4.0 ± 1.2), of whom 75 were girls, 87 were boys, and 3 were unspecified. The remaining 160 children were of school age (mean age 9.2 ± 2.7), with 66 girls, 92 boys, and 2 unspecified [20]. In a study conducted in our country including 196 children aged between 1.6 and 11.8 years, the mean age was reported as 5.0 ± 1.9 years, with the study group consisting of 107 boys and 85 girls [21]. In our study, the mean age of the children was 6.56 ± 2.44 years, and the median age was 6 years (min: 3, max: 16). These findings are consistent with similar studies in the literature and support that dental treatments under general anesthesia are predominantly concentrated in the preschool period.
In another study conducted in our country involving 1,536 children aged between 1 and 14 years, it was reported that 45.70% (702 girls) of the evaluated children were girls and 54.30% (834 boys) were boys. The average age of the girls was found to be 6.32 years, while that of the boys was 6.74 years [22]. In the study by Bulut and Gönenç, it was reported that among 111 pediatric patients aged 1–12 years (mean age 5.28 ± 2.11) who completed their dental treatment under general anesthesia, 41 were girls and 70 were boys. They noted that approximately half (50.44%) of the treated children were in the 4–5 age group [23]. Studies evaluating children undergoing dental treatment under general anesthesia have found that male patients outnumber female patients [13,24]. In our study, when the gender distribution of the children was evaluated, the proportion of male patients (56.7%) was found to be higher than that of female patients (43.3%). This finding is consistent with the results of similar studies in the literature. The more frequent reporting of cooperation problems during dental treatment in boys, and the observation that girls tend to be more compliant during clinical procedures, may be factors contributing to the increased need for general anesthesia among boys.
In terms of age groups, literature reviews also show that children receiving dental treatment under general anesthesia most frequently belong to the 5-year-old group [25,26]. When the age distribution of the 464 patients included in our study was examined, the highest proportion was found in the 5-year-old group, with 28.23%. This may be attributed to the intense anxiety, fear, and communication difficulties experienced by children in this age group during dental treatment.
In the study by Gezgin, 73.50% (n=1129) of the individuals were non-cooperative patients with whom communication could not be established using behavior management techniques, while 26.50% (n=407) were patients with disabilities or systemic diseases who did not allow treatment in a clinical setting. It was reported that 6.18% of these individuals had mental retardation, 4.81% had autism/atypical autism, 3.12% had Down syndrome, 2.08% had cerebral palsy, and 1.37% had epilepsy [22]. In the study by Akdağ and Demir, it was reported that among 149 disabled patients treated under general anesthesia, 43.62% had mental retardation, 24.16% had epilepsy, 22.14% had autism, 11.4% had Down syndrome, and 10.73% had cerebral palsy [27]. In the retrospective study conducted by Çiftçi and Yazıcıoğlu, 79.5% of the patients treated under general anesthesia were individuals with special needs, while 20.5% were healthy individuals. Among the special needs patients, the most frequently observed conditions were epilepsy (30.1%), various syndromes (14.7%), autism (14%), Down syndrome (13.6%), and cerebral palsy (7.3%) [28]. In the study by Nasr and Moussa, out of 756 patients treated under general anesthesia, 641 were healthy non-cooperative individuals and 115 were patients with special needs. Among the special needs patients, the most commonly observed conditions were mental retardation (38.3%), cerebral palsy (20%), diabetes (13%), epilepsy (8.7%), and autism (7.8%) [29]. In the study by Karl et al., it was reported that 13.5% of 1,155 patients treated under general anesthesia had systemic diseases, with the most common being neurodermatitis (4%), asthma (1.7%), and autism (1%) [30]. In our study, 76.1% of the 464 children evaluated were healthy, while 23.9% had systemic diseases. The most frequently observed systemic conditions were autism (9.5%), mental retardation (2.2%), epilepsy (1.5%), cerebral palsy (1.5%), and Down syndrome (1.3%). The results of our study are consistent with the data in the literature.
Before dental treatments performed under general anesthesia, patients’ physical conditions are evaluated by anesthesiologists according to the ASA classification [31]. In one study, out of 243 pediatric patients, 169 (69.6%) were classified as ASA 1, 70 (28.8%) as ASA 2, and 4 (1.6%) as ASA 3 [32]. In the study by López-Velasco et al., 82.91% of the 192 patients were classified as ASA 1, 11.97% as ASA 2, and 5.13% as ASA 3 [33]. In the study conducted by Gezgin, among the patients evaluated during preoperative anesthesia examinations, 1,164 (75.78%) were ASA 1, 321 (20.89%) were ASA 2, 47 (3.05%) were ASA 3, and 4 (0.28%) were ASA 4 [22]. In our study, when the ASA classification distribution of the 464 evaluated patients was analyzed, 348 (75%) were ASA 1, 111 (23.9%) were ASA 2, and 5 (1.1%) were ASA 3. Similar to data reported in the literature, our study also found that a higher proportion of patients receiving dental treatment under general anesthesia were classified as ASA 1.
In the study by Akdağ and Demir, among 149 disabled patients treated under general anesthesia, 136 were classified as ASA 2 and 13 as ASA 3 [27]. In the study by Yılmaz et al., of the 225 children examined, 131 had special healthcare needs and 94 were healthy but non-cooperative. In the special healthcare needs group, the proportion of male patients was higher (60.5%), while in the healthy and non-cooperative group, the gender distribution was balanced. According to ASA classification, most patients in the special healthcare needs group were ASA 2 (77.9%) and ASA 3 (15.3%), whereas in the other group, only ASA 1 and ASA 2 patients were observed, with no ASA 3 cases reported [34]. In another study, it was reported that among patients with systemic diseases, the proportion of boys aged 2–5 years and girls aged 6–12 years was significantly higher (p=0.01). In the disabled patient group, the proportion of boys aged 6–12 years was significantly higher (p=0.01), and 75.7% of the patients were ASA 2, 16.1% were ASA 1, and 8.2% were ASA 3 [35]. In our study, the proportion of boys among children with systemic diseases (64.9%) was found to be significantly higher than that of girls (35.1%) (p=0.046). Among healthy children, the vast majority were classified as ASA 1 (95.2%), and a small portion as ASA 2 (4.8%), whereas among those with systemic diseases, ASA 2 was predominant (84.7%), with lower rates of ASA 1 (10.8%) and ASA 3 (4.5%). A statistically significant association was found between ASA classification and the presence of systemic disease (p<0.001). We believe that differences in gender distribution reported in the literature may be attributed to characteristics of the population, genetic factors, and environmental influences.
In a study examining the distribution of dental procedures performed under general anesthesia, restorative treatments were identified as the most frequently performed procedures (47.23%). These were followed by endodontic treatments (26.22%), tooth extractions (23.67%), and fissure sealant applications (2.86%). The majority of the endodontic treatments consisted of pulpotomies (84.37%), while a smaller portion were root canal treatments (15.63%). Additionally, 21.62% of the patients underwent scaling, and 37.83% received fluoride varnish. Fissure sealants were the least frequently performed procedure [23]. In the study by Sarı et al., the most commonly performed treatments were restorative procedures (25.6%) and tooth extractions (20.10%) [15]. In Gezgin’s study, the most frequently performed procedures under general anesthesia or sedation were restorative treatments (34.96%) and pulp amputations (31.62%), followed by root canal treatments, crown applications, extractions, and fissure sealants [22]. In the study by Akdağ and Demir, restorative treatment (53.63%) was the most frequently performed procedure under general anesthesia, followed by tooth extraction (26.75%) and fissure sealant (9.7%). Pulpotomy, root canal treatment, scaling-polishing, fluoride, and curettage procedures were performed less frequently. These findings show that restorative treatments are the most frequently applied procedures, followed by extractions and fissure sealants [27]. In Pecci-Lloret’s study, among 1,473 dental procedures performed on children with special healthcare needs under general anesthesia, the majority were restorative treatments (61%), followed by tooth extractions (21.7%), scaling (7.5%), pulpotomies (4.2%), stainless steel crowns (4%), and root canal treatments (1.6%). The most frequently performed individual procedure was composite fillings [36]. In the study by Ehlers et al., the oral health of 134 children treated under general anesthesia with a history of early childhood caries (ECC) was assessed. All children received fillings, followed by tooth extractions (60%), fissure sealants (11.4%), and stainless steel crowns (8.6%) [37]. In a study involving both healthy children and those with systemic diseases or disabilities treated under general anesthesia, 21.62% of the patients underwent scaling, while 37.83% received fluoride varnish [26]. In our study, the dental procedures performed on pediatric patients were examined, and composite fillings (42.47%), tooth extractions (25.24%), and pulpotomies (13.65%) were found to be the most frequently performed treatments. Stainless steel crowns (10.81%) and fissure sealants (7.23%) were applied less frequently, while root canal treatment (0.44%) and pulp capping (0.14%) were performed at lower rates. Additionally, 16.6% of the patients received scaling/polishing, and 17.9% were treated with fluoride applications. The findings of our study are consistent with the existing literature and indicate that restorative and surgical procedures are the most commonly performed treatments in pediatric patients, whereas preventive procedures are less frequently applied.
In the study by Manmontri et al., a total of 72 strip crowns applied to 41 patients were evaluated after an average follow-up period of 21.7 months. The crowns were reported to be highly successful in terms of aesthetics (79.2%) and biological outcomes (84.7%), while the functional success rate remained low (52.8%) [38]. In our study, strip crowns were among the least frequently performed procedures (0.03%). Considering this low frequency, we believe that more clinical applications and further evaluation of existing literature on strip crowns are needed.
In the study by Kaviani et al., the mean age of children with disabilities (6.5 years) was found to be statistically significantly higher than that of healthy children (4.5 years) [39]. Similarly, in the study conducted by Baygın et al., the mean age of patients with disabilities was reported to be higher than that of healthy patients [40]. In another similar study conducted in our country, the mean age of children with disabilities receiving dental treatment under general anesthesia (8.44 ± 0.37) was found to be significantly higher than that of healthy children (4.90 ± 0.15). It was noted that the timing of dental treatment in children with disabilities tended to occur at a later stage [41]. Contrary to these findings, Yılmaz et al. reported no statistically significant difference in age between children with special healthcare needs and healthy, non-cooperative children [34]. In our study, the median age of healthy children was determined to be 6 years, while that of children with systemic diseases was 8 years, and this difference was found to be statistically significant (p<0.001). This finding suggests that systemic conditions may delay the initiation of dental treatment in children and that the need for special care could contribute to the postponement of such treatments.
It has been reported that children with medical conditions undergo more tooth extractions in both primary and permanent dentitions compared to healthy children. This has been attributed to the preference for simpler and more radical treatments to minimize the risk of complications and prevent the need for retreatment [42]. Oral hygiene and health status in individuals with intellectual disabilities are poorer compared to their healthy peers, and as the degree of disability increases, oral health deteriorates further. In one study, it was found that individuals with intellectual disabilities aged 13–18 who were treated under general anesthesia required tooth extractions at a significantly higher rate than those in the healthy group [15]. In a retrospective study evaluating 480 patients who received dental treatment under general anesthesia between 2008 and 2014, restorative treatments and extractions were reported as the most frequently performed procedures in individuals with mental retardation [43]. It has also been reported that children with special healthcare needs treated under general anesthesia undergo more extractions and fewer pulp treatments compared to healthy children [44].
In the study by Kaviani et al., the rate of tooth extraction was higher in children with disabilities compared to their healthy peers, while preventive treatments such as fissure sealants, fluoride applications, and preventive resin restorations, as well as pulp therapies, were significantly lower. No significant difference was noted in restorative treatments [39]. In the study by Lee et al., dental treatments performed under general anesthesia were compared between healthy and disabled children, and it was reported that healthy children received more stainless steel crowns and pulp treatments, while disabled children underwent more tooth extractions [45]. Similarly, in the study by Tsai et al., the frequency of tooth extractions was found to be higher in children with disabilities [46]. In contrast, the study by Cantekin et al. reported no significant difference between healthy individuals and those with special healthcare needs in terms of restorative treatments, pulp therapies, and extractions [13]. Likewise, Ibricevic et al. found no statistically significant difference in the number of extracted teeth between healthy and disabled individuals [47]. Additionally, the study by Wang et al. reported that fissure sealants were more frequently applied to permanent teeth in patients with disabilities [48]. In our study, tooth extractions and fissure sealants were significantly more common among children with systemic diseases, while stainless steel crowns and pulpotomies were significantly more frequent among healthy children (p<0.001). No significant differences were observed in other treatment types. Our findings, in line with the literature, support the notion that more radical treatment approaches are preferred in children with disabilities to reduce the likelihood of repeat procedures and possible complications.
In a study conducted in our country, it was found that among patients aged 6–12 years, the rate of scaling procedures was statistically significantly higher in individuals with disabilities [35]. Similarly, in our study, a statistically significant relationship was identified between scaling/polishing procedures and the presence of systemic disease. This finding may be associated with increased plaque accumulation in children with systemic conditions, which can result from factors such as medication use, impaired motor skills, dietary habits, and difficulties in maintaining oral hygiene.
In the study by Sevekar et al., fluoride application was reported to be more frequently performed in individuals with disabilities compared to healthy individuals [44]. Biria et al. stated that regular fluoride application improves the success of dental treatments performed under general anesthesia [49]. In contrast to the findings in the literature, our study did not reveal a statistically significant relationship between fluoride application and the presence of systemic disease. This result may be attributed to the lack of routine planning of fluoride applications in children with systemic conditions, variability in caregivers’ awareness levels, or differences in clinical practice patterns.
The results of this study should be interpreted within the context of certain limitations. Due to the retrospective design of our study, the data collection process was not directly controlled by the researcher; instead, the data were obtained based on patient records. The fact that this was a single-center study limits the generalizability of the findings to other geographic regions and healthcare institutions. Additionally, our research was limited to the treatment process and demographic data, and long-term outcomes such as post-treatment complications, restoration success, and recurrent dental problems could not be evaluated. Although the effects of systemic diseases on general anesthesia and dental treatment were examined, detailed analyses focusing on specific disease groups were limited. Therefore, further studies with larger sample sizes, prospective designs, and long-term follow-up data are needed.
5. Conclusions
This retrospective study revealed the distribution of pediatric dental treatments performed under general anesthesia and sedation, as well as the impact of systemic diseases on treatment preferences. The findings indicate that the highest treatment need was observed among boys aged 5–6 years, with autism being the most prominent systemic condition. The rates of fissure sealants and tooth extractions were higher in children with systemic diseases, while stainless steel crowns and pulpotomies were more frequently performed in healthy children. Integrating preventive measures into treatment plans is of great importance to reduce the need for general anesthesia and to improve treatment success. To more robustly support these findings, further advanced studies with multi-center designs, larger sample sizes, and long-term follow-up data are needed.
Author Contributions
Conceptualization, Y.P., S.Ç., and E.C.T.; methodology, Y.P.; validation, Y.P., S.Ç., and E.C.T.; formal analysis, Y.P.; investigation, Y.P., S.Ç., and E.C.T.; writing—original draft preparation, Y.P.; writing—review and editing, Y.P., S.Ç., and E.C.T.; supervision, S.Ç.; project administration, E.C.T. All authors have read and agreed to the published version of the manuscript.
Funding
This research received no external funding
Institutional Review Board Statement
We have procured the necessary ethical clearances with the protocol number 2024-23 dated 25 September 2024 from the Local Ethics Committee of Dicle University Faculty of Dentistry, in accordance with the Declaration of Helsinki.
Informed Consent Statement
Informed consent was obtained from all subjects involved in the study.
Data Availability Statement
All data generated or analyzed during this study are included in this published article.
Conflicts of Interest
The authors declare no conflicts of interest.
Abbreviations
| AAPD | American Academy of Pediatric Dentistry; |
| ASA | American Society of Anesthesiologists; |
| ASD | Atrial Septal Defect; |
| ECC | Early Childhood Caries; |
| PFAPA | Periodic Fever, Aphthous Stomatitis, Pharyngitis, and Adenitis Syndrome; |
| PFO | Patent Foramen Ovale. |
References
- Selwitz, RH; Ismail, AI; Pitts, NB. Dental caries. Lancet. 2007, 369:51-9.
- Zhao, J; Yang, L; Lai, G; Wang, J. Clinical outcomes of dental treatment under general anesthesia and its effects on the caries activity and body growth of children: a 2-year retrospective study. Clin Oral Investig. 2022, 1-8. [CrossRef]
- American, Academy, of, Pediatric, Dentistry. Policy on early childhood caries (ECC): consequences and preventive strategies. The Reference Manual of Pediatric Dentistry. Chicago, Ill.: American Academy of Pediatric Dentistry; 2024. p.89-92.
- Kagihara, LE; Niederhauser, VP; Stark, M. Assessment, management, and prevention of early childhood caries. J Am Acad Nurse Pract. 2009, 21(1):1-10.
- Can, Kolcu, Öİ. Long-term success rates of dental treatments under general anesthesıa. Aydin Dent J. 2020, 6(2):115-27. (In Turkish).
- Percival, T; Bhagoutie, R. A preliminary study of the treatment outcomes of paediatric dental patients referred for general anaesthesia or sedation at a regional hospital in Trinidad. Children. 2021, 8(10):876. [CrossRef]
- Alhaidari, RI; AlSarheed, MA. Post-discharge effects and parents’ opinions of intranasal fentanyl with oral midazolam sedation in pediatric dental patients: a cross-sectional study. Children. 2022, 9(2):142. [CrossRef]
- López-Velasco, A; Puche-Torres, M; Carrera-Hueso, FJ; Silvestre, FJ. General anesthesia for oral and dental care in paediatric patients with special needs: a systematic review. J Clin Exp Dent. 2022, 13(3):e303. [CrossRef]
- Bücher, K; Tautz, A; Hickel, R; Kühnisch, J. Longevity of composite restorations in patients with early childhood caries (ECC). Clin Oral Investig. 2014, 18(3):775-82. [CrossRef]
- Karaduran, B; Kumaş, Solak, S; Koruyucu, M. General anesthesia in pediatric dentistry. Selcuk Dent J. 2022, 9(2):696-705.(In Turkish).
- American, Society, of, Anesthesiologists. ASA physical status classification system [Internet]. 2020 [cited 2025 Mar 23]. Available from: https://www.asahq.org/standards-andguidelines/asa-physical-status-classificationsystem.
- American, Academy, of, Pediatric, Dentistry. Behavior guidance for the pediatric dental patient. The Reference Manual of Pediatric Dentistry. Chicago, Ill.: AAPD; 2020. p.292-310.
- Cantekin, K; Doğan, S; Aydınbelge, M; Canpolat, DG; Yıldırım, MD; Avcı, S. Analysis of comprehensive dental rehabilitation under general anesthesia at a dental hospital in Turkey. J Pediatr Dent. 2014, 2(2):49. [CrossRef]
- Aytepe, FZ; Bakış, Çaynak, Ö. General anesthesia in pediatric dentistry. Turkiye Klin J Pediatr Dent-Special Topics. 2018, 4(2):168-72. (In Turkish).
- Sari, ME; Ozmen, B; Koyuturk, AE; Tokay, U. A retrospective comparison of dental treatment under general anesthesia on children with and without mental disabilities. Niger J Clin Pract. 2014, 17:361-5. [CrossRef]
- Ferrazzano, G; Sangianantoni, S; Mitrano, R; Ingenito, A; Alcidi, B; Cantile, T. Assessing changes in oral life and body growth in 3-5 years old children following dental treatment under general anaesthesia due to severe dental caries. Eur J Paediatr Dent. 2019, 20(3):214-8. [CrossRef]
- Ramos-Jorge, J; Pordeus, IA; Ramos-Jorge, ML; Marques, LS; Paiva, SM. Impact of untreated dental caries on quality of life of preschool children: different stages and activity. Community Dent Oral Epidemiol. 2014, 42(4):311-22. [CrossRef]
- Cameron, AC; Widmer, RP. Handbook of Pediatric Dentistry. 3rd ed. Edinburgh: Mosby; 2008.
- American, Academy, of, Pediatric, Dentistry. Guideline on behavior guidance for the pediatric dental patient. Pediatr Dent. 2016, 38(Spec No):185-98.
- Schulz-Weidner, N; Schlenz, MA; Jung, LG; Uebereck, CF; Nehls, A; Krämer, N. Dental treatment under general anesthesia in pre-school children and schoolchildren with special healthcare needs: a comparative retrospective study. J Clin Med. 2022, 11(9):2613. [CrossRef]
- Bakkal, M. Evaluation of dental treatments in children performed under general anesthesia. Bezmialem Sci. 2018, 6(4):248-52. (In Turkish). [CrossRef]
- Gezgin, O. Retrospective Evaluation of Dental Treatments Under General Anesthesia and Sedation . Selcuk Dent J. 2022, 9(2):359-63. (In Turkish).
- Bulut, M; Gönenç, N. Evaluation of dental treatments under general anesthesia in aged 1-12 years children: a retrospective study. Turkiye Klin J Dent Sci. 2022, 28(1):79-85. (In Turkish). [CrossRef]
- Demir, M; Tulumbacı, F. Retrospective evaluation of dental treatments under general anesthesia and sedation in pediatric patients. HRU Int J Dent Oral Res. 2022, 2(1):11-9. (In Turkish).
- Milsom, KM; Tickle, M; Humphris, GM; Blinkhorn, AS. The relationship between anxiety and dental treatment experience in 5-year-old children. Br Dent J. 2003, 194(9):503-6. [CrossRef]
- Schroth, RJ; Smith, WF. A review of repeat general anesthesia for pediatric dental surgery in Alberta, Canada. Pediatr Dent. 2007, 29(6):480-7.
- Akdağ, U; Demir, P. Evaluation of The Treatments, Demographic and Operational Data of Disabled Patients Under General Anesthesia : A Retrospective Study . Selcuk Dent J. 2023, 10(1):80-3. (In Turkish).
- Ciftci, V; Yazicioglu, İ. A retrospective comparison of dental treatment under general anesthesia provided for uncooperative healthy patients and patients with special health care needs. J Clin Pediatr Dent. 2020, 44(3):196-201. [CrossRef]
- Nasr, RA; Moussa, SA. Evaluation of comprehensive dental treatment under general anesthesia in healthy and disabled children. Egypt Dent J. 2020, 66(3):1435-44. [CrossRef]
- Karl, V; Scholz, KJ; Hiller, KA; Tabenski, I; Schenke, F; Buchalla, W; et, al. Retrospective cohort study on potential risk factors for repeated need of dental rehabilitation under general anesthesia in a private pediatric dental practice. Children. 2022, 9(6):855. [CrossRef]
- Lim, MAWT; Borromeo, GL. The use of general anesthesia to facilitate dental treatment in adult patients with special needs. J Dent Anesth Pain Med. 2017, 17(2):91-103. [CrossRef]
- Şahutoğlu, C; Karaca, N; Karaman, S; Kocabaş, NS; Alper, I; Uyar, M; et, al. Our practices of outpatient anesthesia and complications. Ege Journal of Medicine. 2021, 60(4):354-64. (In Turkish).
- López-Velasco, A; Carrera-Hueso, FJ; Puche-Torres, M; Silvestre, FJ; Vázquez-Ferreiro, P. Local anesthesia with and without conscious sedation versus general anesthesia for oral surgical procedures in pediatric patients: a retrospective cross-sectional study. Rev Port Estomatol Med Dent Cir Maxilofac. 2024, 65:197-204. [CrossRef]
- Yılmaz, MA; Berkel, G; Özalp, M; Kıraç, SB; Kargül, B. Analysis of dental treatment under general anesthesia in special health care needs and uncooperative healthy children. Meandros Med Dent J. 2023, 24(4). [CrossRef]
- Akarçay, Ç. Evaluation of treatment methods and age-genderdistributions under general anesthesia for healthy childpatients and child patients with special treatment needs:retrospective study [Specialist thesis]. Aydın Adnan Menderes University: Aydın.2023. Available at: https://tez.yok.gov.tr/UlusalTezMerkezi/tezSorguSonucYeni.jsp.
- Pecci-Lloret, MP; Guerrero-Gironés, J; López-González, B; Rodríguez-Lozano, FJ; Oñate-Cabrerizo, D; Oñate-Sánchez, RE; et, al. Dental treatments under general anesthesia on children with special health care needs enrolled in the Spanish Dental Care Program. J Clin Med. 2021, 10(2):182. [CrossRef]
- Ehlers, V; Callaway, A; Patyna, M; Pelkner, A; Azrak, B; Deschner, J. Oral health of children one to six years after dental treatment under general anaesthesia. J Clin Med. 2022, 11(13):3676. [CrossRef]
- Manmontri, C; Sirinirund, B; Langkapint, W; Jiwanarom, S; Kowan, V; Tantayanusorn, S; et, al. Retrospective evaluation of the clinical outcomes and patient and parental satisfaction with resin strip crowns in primary incisors. Pediatr Dent. 2018, 40(7):425-32.
- Kaviani, N; Ghafournia, M; Mirzaali, S; Marzoughi, S; Salari-Moghaddam, R. Comparison of dental treatments performed under general anesthesia for healthy and disabled children. Dent Res J (Isfahan). 2021, 18:109. [CrossRef]
- Baygin, O; Tuzuner, T; Kusgoz, A; Yahyaoglu, G; Yilmaz, N; Aksoy, S. Effects of medical and mental status on treatment modalities in patients treated under general anaesthesia at the KTU Faculty of Dentistry in Trabzon, Turkey: a comparative retrospective study. J Pak Med Assoc. 2017, 67(2):305-7.
- Keskin, SS. Evaluation of data on healthy and disabled children treated under general anesthesia: Three- year retrospective study. Selçuk University: Konya. 2018. Available at: https://tez.yok.gov.tr/UlusalTezMerkezi/tezSorguSonucYeni.jsp.
- Al-Ogayyel, S; Al-Haj, Ali, S. Comparison of dental treatment performed under general anesthesia between healthy children and children with special health care needs in a hospital setting, Saudi Arabia. Clin Exp Dent Res. 2018, 10(10):963-9.
- Ahuja, R; Jyoti, B; Shewale, V; Shetty, S; Subudhi, S; Kaur, M. Comparative evaluation of pediatric patients with mental retardation undergoing dental treatment under general anesthesia: a retrospective analysis. J Contemp Dent Pract. 2016, 17(8):675-8. [CrossRef]
- Sevekar, S; Jha, M; Avanti, A. Dental treatment under general anesthesia in healthy children and children with special healthcare needs: a retrospective study. Int J Clin Pediatr Dent. 2021, 14(2):157-61. [CrossRef]
- Lee, PY; Chou, MY; Chen, YL; Chen, LP; Wang, CJ; Huang, WH. Comprehensive dental treatment under general anesthesia in healthy and disabled children. Chang Gung Med J. 2009, 32:636-42.
- Tsai, CL; Tsai, YL; Lin, YT; Lin, YT. A retrospective study of dental treatment under general anesthesia of children with or without a chronic illness and/or a disability. Chang Gung Med J. 2006, 29:412-8.
- Ibricevic, H; Al-Jame, Q; Honkala, S. Pediatric dental procedures under general anesthesia at the Amiri Hospital in Kuwait. J Clin Pediatr Dent. 2001, 25:337-42. [CrossRef]
- Wang, N; Zhao, Y. Retrospective study of dental treatment under general anesthesia of 62 disabled children and adolescents. Beijing Da Xue Xue Bao Yi Xue Ban. 2018, 50(2):293-9.
- Biria, M; Ansari, G; Taheri, Z. Failure rate of dental procedures performed under general anesthesia on children presenting to Mofid Pediatric Hospital during 2010-2011. J Dent Sch. 2012, 30(1):1-8.
Table 1.
ASA (American Society of Anesthesiologists) Classification [11].
Table 1.
ASA (American Society of Anesthesiologists) Classification [11].
| ASA Classification | Description |
| ASA 1 | Healthy individuals with no systemic disease. |
| ASA 2 | Patients with mild systemic disease that does not significantly limit daily activities. |
| ASA 3 | Patients with severe systemic disease and significant functional limitations. |
| ASA 4 | Patients with severe systemic disease that is a constant threat to life. |
| ASA 5 | Moribund patients who are not expected to survive without surgery. |
| ASA 6 | Brain-dead patients undergoing organ donation surgery. |
Table 3.
Descriptive statistics for categorical variables.
| Variable | Frequency | Percentage (%) |
|---|---|---|
| Gender | ||
| Girl | 201 | 43.3 |
| Boy | 263 | 56.7 |
| Systemic Disease | ||
| Healthy | 353 | 76.1 |
| With systemic disease | 111 | 23.9 |
| Types of Systemic Diseases | ||
| Lung cyst | 1 | 0.2 |
| Allergic asthma | 2 | 0.4 |
| Asthma | 3 | 0.7 |
| Atopic dermatitis | 1 | 0.2 |
| Atrial septal defect (ASD) | 4 | 0.9 |
| Bronchitis | 3 | 0.7 |
| Resistant rickets | 1 | 0.2 |
| Down syndrome | 6 | 1.3 |
| Cleft lip and palate | 3 | 0.7 |
| Epilepsy | 7 | 1.5 |
| Galactosemia | 1 | 0.2 |
| Developmental delay | 2 | 0.4 |
| Goiter/ASD | 1 | 0.2 |
| Hydrocephalus | 1 | 0.2 |
| Hyperactivity | 2 | 0.4 |
| Hypothyroidism | 1 | 0.2 |
| Allergy to local anesthetics | 1 | 0.2 |
| Mental retardation | 10 | 2.2 |
| Microcephaly | 2 | 0.4 |
| Sickle cell anemia | 1 | 0.2 |
| Autism | 44 | 9.5 |
| Patent foramen ovale (PFO) | 1 | 0.2 |
| Penicillin allergy | 3 | 0.7 |
| PFAPA syndrome | 1 | 0.2 |
| Cerebral palsy | 7 | 1.5 |
| Scoliosis | 1 | 0.2 |
| Thalassemia major | 1 | 0.2 |
| ASA Classification | ||
| ASA 1 | 348 | 75 |
| ASA 2 | 111 | 23.9 |
| ASA 3 | 5 | 1.1 |
| Strip Crown Application | ||
| Not applied | 463 | 99.8 |
| Applied | 1 | 0.2 |
| Scaling/Polishing Application | ||
| Not performed | 387 | 83.4 |
| Performed | 77 | 16.6 |
| Fluoride Application | ||
| Not applied | 381 | 82.1 |
| Applied | 83 | 17.9 |
Table 4.
Descriptive statistics of quantitative variables.
| Mean ± SD | Median (min–max) | |
|---|---|---|
| Patient age | 6.56 ± 2.44 | 6 (3 – 16) |
| Composite filling (n) | 6.03 ± 3.27 | 6 (0 – 19) |
| Stainless steel crown (n) | 1.53 ± 1.84 | 1 (0 – 7) |
| Pulp capping (n) | 0.02 ± 0.21 | 0 (0 – 4) |
| Pulpotomy treatment (n) | 1.94 ± 1.74 | 2 (0 – 7) |
| Root canal treatment (n) | 0.06 ± 0.30 | 0 (0 – 3) |
| Fissure sealant (n) | 1.03 ± 1.82 | 0 (0 – 13) |
| Tooth extraction (n) | 3.58 ± 3.18 | 3 (0 – 16) |
Table 6.
Comparison of quantitative variables according to systemic disease.
| Healthy | With systemic disease | Test Statistic | p-value | |
|---|---|---|---|---|
| Patient age | 6 (3 – 16) | 8 (4 – 16) | 8343.500 | <0.001x |
| Composite filling (n) | 6 (0 – 17) | 5 (0 – 19) | 21891.000 | 0.061x |
| Stainless steel crown (n) | 1 (0 – 7) | 0 (0 – 7) | 24041.500 | <0.001x |
| Pulp capping (n) | 0 (0 – 4) | 0 (0 – 1) | 18998.500 | 0.014x |
| Pulpotomy treatment (n) | 2 (0 – 7) | 1 (0 – 7) | 25950.500 | <0.001x |
| Root canal treatment (n) | 0 (0 – 3) | 0 (0 – 2) | 19928.000 | 0.468x |
| Fissure sealant (n) | 0 (0 – 13) | 1 (0 – 10) | 13962.500 | <0.001x |
| Tooth extraction (n) | 3 (0 – 15) | 3 (0 – 16) | 18390.000 | 0.326x |
x Mann–Whitney U Test.
Disclaimer/Publisher’s Note: The statements, opinions and data contained in all publications are solely those of the individual author(s) and contributor(s) and not of MDPI and/or the editor(s). MDPI and/or the editor(s) disclaim responsibility for any injury to people or property resulting from any ideas, methods, instructions or products referred to in the content. |
© 2025 by the authors. Licensee MDPI, Basel, Switzerland. This article is an open access article distributed under the terms and conditions of the Creative Commons Attribution (CC BY) license (http://creativecommons.org/licenses/by/4.0/).
Copyright: This open access article is published under a Creative Commons CC BY 4.0 license, which permit the free download, distribution, and reuse, provided that the author and preprint are cited in any reuse.


