
Submitted:
05 August 2025
Posted:
06 August 2025
You are already at the latest version
Abstract
Caenorhabditis elegans (C. elegans) is a microscopic, free-living nematode widely used as a model organism for studying fundamental biological processes, including development. Moreover, because of its rapid growth and simple maintenance, C. elegans is widely used in high-throughput screening studies. However, conventional methods for analyzing these morphological and developmental characteristics often rely on manual microscopy and human evaluations. These methods are labor intensive, slow, prone to mistakes, and not easy to scale up, particularly for high-throughput studies where vast amounts of information are generated. To solve these problems, researchers can bypass these methodologies by employing machine learning which can perform consistent and error-free data processing. This review analyses how various machine learning methods have been employed to counteract the problems faced in traditional experimental approaches. Their impact on the enhancement of precision, effectiveness, and scalability of developmental studies in C. elegans has been discussed, as well as the issues that pose constraints to the adoption of these technologies in low-resource laboratories.
Keywords:
Caenorhabditis elegans
; morphology
; development
; machine learning
; neural network
; automation
1. Introduction to Caenorhabditis Elegans as a Model Organism
Caenorhabditis elegans (C. elegans) are microscopic, free-living nematodes that grow around ~1 mm in length. Regardless of its small size, C. elegans shares significant genetic similarities to higher living organisms including humans, and many of its key biological pathways are highly conserved as well [1]. C. elegans have a variety of nociceptors, including Amphid Sensory Head (ASH), Amphid Dorsal Left/Right (ADL), and Phasmid Posterior B (PHB) neurons, that detect noxious stimuli including mechanical pressure, high osmolarity, or chemical repellents [2,3]. C. elegans are non-sentient animals and lack pain perception, thus allowing researchers to adopt them as an ethical alternative animal model for preliminary research before proceeding to higher animal models, such as mice or rats. These attributes indicate C. elegans as a significant animal model for studying fundamental biological processes, disorders, and diseases.
Studies have shown the significance of C. elegans as a model organism in investigating the various developmental processes, including early embryogenesis [4], cell fate determination [5], organogenesis [6], neuronal development [7], and aging [8]. Furthermore, the cell lineage of C. elegans is completely mapped [9], and the entire developmental trajectory from a single-cell zygote to a mature adult is completely documented [5]. This allows researchers to investigate the fundamental developmental questions, including how cells divide, differentiate, and contribute to the organism’s final morphology. C. elegans have transparent bodies and exhibit distinct and quantifiable phenotypes, such as body size and shape, throughout their development process [10]. These characteristic features provide a significant advantage over other animal models for non-invasive, real-time tracking of developmental and morphological changes throughout its life cycle using microscopic techniques.
C. elegans has a short life cycle of ~3 days from egg to adult and a lifespan of ~2-3 weeks [10], allowing researchers to perform rapid experiments across generations. Furthermore, C. elegans produces many offspring (up to 300 per hermaphrodite), which is an advantage for experiments that require extensive sample sizes for statistical robustness. Despite their rapid generation turnover, the maintenance of C. elegans culture is easy and inexpensive, which requires minimal space, media, and resources [10]. Due to its microscopic size, C. elegans can be studied in multi-well plates [11] or microfluidic devices [12], allowing researchers to study many worms simultaneously. These suggest the potential of C. elegans as a powerful animal model for high-throughput experimental assays.
On the other hand, using C. elegans for high-throughput screening and analysis comes with challenges, including labor-intensive workflows, manual human errors during analysis, and the generation of large datasets (e.g., imaging or genetic screens) that require advanced computational tools for effective analysis and interpretation. This would be a big challenge, especially if the study results in generating a huge volume of data ranging from high-resolution images to complex cell lineage maps. Researchers have addressed these challenges in recent years by integrating machine learning approaches into their analytical workflows, automating the labor-intensive and error-prone processes. In the following sections, we discuss the fundamentals of machine learning, classification, and the role of different models in C. elegans developmental research.
2. Overview of Machine Learning
Machine learning is a branch of artificial intelligence that trains computers to recognize patterns in datasets and make predictions or decisions without explicit step-by-step programming. Instead of depending on logical rules, machine learning models use algorithms to predict relationships, correlations, and trends within the datasets which enables to improve their performance over time through experience [13]. Machine learning can be further classified into different types based on their learning paradigm and algorithm architecture (Figure 1).
2.1. Types of Machine Learning
Based on the learning paradigm, machine learning models are mainly categorized into four types: supervised learning, unsupervised learning, semi-supervised learning, and reinforcement learning. The supervised learning model uses labeled datasets, where input features are paired with corresponding outputs to predict the output for new unseen input. For example, using the amino acid sequence dataset of annotated enzymatic and structural proteins, a machine learning model can be trained to predict the unannotated proteins either as enzymes or non-enzymes based on their amino acid sequence features [14]. The unsupervised learning model predicts hidden patterns in the unlabelled dataset. For example, a machine learning model can be trained to learn to group proteins in a dataset based on their similar structural features without any functional annotation [15]. Semi-supervised learning model uses a small proportion of labeled data along with a large proportion of unlabelled data to improve learning accuracy. For example, a machine learning model can be trained to annotate the genes with unknown functions by using the characteristic features of a small set of genes with known functions [16]. The reinforcement learning model is iterative in nature and learns through feedback, such as rewards and penalties, rather than depending on the predefined labels. For example, a machine learning model can be trained to optimize the drug design by iteratively testing modifications of drug molecules and maximizing their binding affinity to a target protein [17].
2.1. Types of Machine Learning Architecture
Based on algorithm architecture, machine learning models can be broadly classified into two categories: classical machine learning models and artificial neural networks (Figure 1). The architecture of classical machine learning models is usually simpler and mostly used for analyzing structured and smaller datasets. They depend on statistical principles and mathematical algorithms to analyze and make predictions from data. A few of the key types of classical models include Regression models: used for predicting continuous numerical values (e.g., predicting gene expression levels based on the transcription factors concentration) [18]; Classification models: used for predicting discrete categories or labels (e.g., classify diseases based on the patient data) [19]; Clustering models: used to group similar data points (e.g., grouping patients into clusters based on their metabolic profiles) [20]; Dimensionality Reduction models: used to reduce the number of features while retaining important information (e.g., visualizing high-dimensional multi-omics data) [21]; Instance-based models: used to make predictions for new data based on similarities to the stored instances (e.g., predict drug-response phenotypes based on historical patient data) [22]; Probabilistic methods: used to predict outcomes by estimating the likelihood of different events or categories (e.g., predicting the likelihood of genetic diseases based on family history) [23]; Ensemble methods: used to improve accuracy, robustness, and stability by combining predictions from multiple models (e.g., predicting disease progression using clinical data and biomarkers) [24]; and Hybrid models: used to combine multiple machine learning approaches to improve flexibility and performance (e.g., identify patterns and relationships in clinical and pathological features, then apply classification model to predict cancer recurrence) [25].
On the other hand, artificial neural networks are the modern machine learning architecture inspired by the structure and functioning of the human brain. They consist of interconnected layers of artificial neurons called nodes that analyze data, learn patterns, and are specifically used to process complex and large datasets. The architecture of artificial neural networks consists of three layers. The input layer takes the input features. The hidden layer performs computations by applying mathematical and non-linear activation functions to learn patterns in the data. The output layer generates the final prediction [26]. Deep learning is a subset of machine learning that uses artificial neural network architecture with multiple hidden layers. The deeper architecture enables the model to analyze complex and hierarchical patterns in large datasets, making them suitable for intricate tasks such as image recognition, language processing, etc. A few key types of deep learning architectures include feedforward neural networks (FNNs)—the simplest type of artificial neural network used for tasks utilizing basic regression and classification (e.g., predicting disease states or classifying cancer subtypes based on a patient’s gene expression profiles) [27]; Convolutional Neural Network (CNN)—used for processing images through extracting special features (e.g., identifying and segmenting sub-cellular organelles in high-resolution cell images) [28]; and Recurrent Neural Network (RNN)—used for analyzing sequential data such as time series, text, etc. (e.g., predicting protein structure or function based on the amino acid sequence) [29,30]. The detailed discussion on specific components of machine learning, including model training, validation, deployment, evaluation metrics, and activation functions, is beyond the scope of this review. Readers interested in these aspects are encouraged to refer to comprehensive articles on machine learning methodologies [26].
3. Machine Learning in C. elegans Developmental Research
3.1. Classification and Morphological Phenotyping of C. elegans
Classification and phenotyping are fundamental to understanding the C. elegans developmental biology. These tasks can be automated using machine learning, which also helps the researcher recognize the various developmental stages, estimate the physiological age, and classify sexual phenotypes with great accuracy. Furthermore, the real-time tracking systems provide dynamic insights into the phenotypical changes that can be studied on a larger scale with less human intervention. This section discusses how these methods mitigate the phenomics data collection bottleneck and enhance the proficiency in accuracy and speed of C. elegans developmental studies.
3.1.1. Classification of Developmental Stages
It is crucial to accurately recognize and classify C. elegans at different stages to study the effect of a drug or gene of interest on the developmental process. This would be a tiring and challenging task if performed manually, especially recognizing the developmental stage from the large image datasets containing mixed populations of adult worms, larvae, and eggs. DevStaR (Developmental Stage Recognition) is an object recognition system based on a hierarchical principle developed for automatic recognition and classification of C. elegans developmental stages from high-throughput image datasets [31]. The DevStaR system consists of four hierarchical layers, each having a specific function and output groups of units, which are then used as the input for the consecutive layer. The first layer identifies the well region containing C. elegans by extracting contrast-based features using steerable filters. The second layer segments objects by analyzing the pixels within the area of interest and grouping them into connected components. The third layer deconstructs segmented objects into parts by analyzing their boundary contours and constructs a tree graph from boundary elements using a symmetry-based scoring system. The fourth layer extracts morphological features from object parts, including area, symmetry axis length, boundary contour length, and changes in width (Figure 2A). These features are then classified using the support vector machine (SVM) classifier trained on ~2000 labeled examples to categorize objects into developmental stages.
DevStaR achieves high precision and recall for adult worm classification and overall object-background separation. However, DevStaR has low precision and recall for larvae and eggs due to boundary pixel errors and clumping of eggs, respectively. Additionally, it can quantify the lethality and survival rates of C. elegans accurately by measuring the egg-to-larvae ratio and larvae-to-adult ratio, respectively. DevStaR surpasses manual annotations by efficiently processing large, high-resolution image datasets in near real-time. However, it does show segmentation errors when objects overlap or occlude each other, particularly in images where worms are curled or eggs form clusters.
3.1.2. 3-dimensional Morphological Reconstruction and Phenotyping
Comprehensive 3-dimensional (3D) morphological visualization of C. elegans anatomy enables researchers to observe the spatial organization of cells and tissues and quantitative phenotyping, which is critical for understanding developmental processes including organ formation and tissue generation. However, precise morphological phenotyping remains a challenge when using widefield or confocal microscopy techniques. This is because, at high magnification, the image resolution often degrades, and the signal can blur or lose intensity, thus leading to unclear and noisy images. Additionally, the 3D reconstruction of C. elegans is difficult due to the nematode’s irregular, flexible shape and varying developmental stages, which can cause errors in aligning the images resulting in inaccurate 3D reconstructions.
To overcome this challenge, a customized machine learning pipeline has been developed, integrated with a robotic sample rotation system, to improve the image quality, precise 3D morphological reconstruction, and enhance phenotyping of C. elegans embryos and worm bodies at different developmental stages [32]. The machine learning model enhances the image quality by reducing noise and improving the resolution and contrast, thus making subtle phenotypic features more visible. It segments the worm boundaries and aligns the 2D image stacks precisely, resulting in high-accuracy 3D reconstruction of C. elegans (IoU >95%) at various developmental stages (Figure 2B). Furthermore, using the 3D models, it accurately identifies key morphological readouts, including volume, surface area, length, maximum width, and the ratio of length to maximum width.
Although the system excels in static morphological phenotyping and could be adopted for high-throughput phenotyping, drug screening, and genetic interaction analysis, real-time or dynamic cell interactions during development have not yet been fully explored.
3.1.3. Physiological Age Estimation
Due to its short lifespan and rapid developmental characteristics, C. elegans serves as an excellent model for aging studies, including antiaging drug screening and genetic research. However, it is a challenge to identify the precise physiological age of C. elegans through manual visual inspection of morphological changes. This limitation is addressed by a CNN-based image processing approach that analyzes bright-field microscopic images of C. elegans worms to measure the physiological age with a granularity of days rather than broader age periods by using texture entropy [33] (Figure 2C). Among the five CNN architectures tested (ResNet50, InceptionV3, InceptionResNetV2, VGG16, and MobileNet), the InceptionResNetV2 model achieved the best performance with a mean absolute error (MAE) of less than 1 day. Other models performed worse, with ResNet50 reaching an MAE of 1.8 days and VGG16 at 2.38 days. The models were trained on a dataset of 913 images spanning 14 days of adulthood, with ~60 images per day.
Moreover, the inclusion of the “curved_or_straight” attribute, which captures the global contour of nematodes (either curved or straight), significantly improved the model’s accuracy by reducing classification errors. Additionally, two models were proposed: a linear regression model for continuous age prediction and a logistic regression for discrete classification of age into specific days, achieving an MAE of 0.94 days and 84.78% accuracy with a tolerance of one day, respectively. As shown in Figure 2C, the CNN-based model predicts physiological age with fine resolution. While logistic regression had higher accuracy, it exhibited greater variability in predictions compared to linear regression. However, the model’s reliance on the “curved_or_straight” attribute may introduce bias, as manual labeling of nematodes into curved or straight categories is subjective and influenced by preprocessing choices. While the model demonstrated strong internal cross-validation performance (MAE < 1 day), future studies should assess generalizability by testing independent external datasets.
3.1.4. Sexual Classification
Existing traditional image analysis tools, including WormSizer [34], Fiji [35], Quantworm [36], and WormToolbox [37] lack automation and comprehensive analysis of intricate phenotypical features, like continuous sexual phenotypes. WorMachine, a MATLAB-based software platform integrated with image processing, feature extraction, and machine learning capabilities, has been developed to automate the analysis of C. elegans morphological features, including area, length, mid-width, and tail/head diameter ratios (for sexual classification) [38]. WormNet, a CNN-based classifier, has been employed for worm identification and flagging defective or noisy images, thus enhancing the data quality by distinguishing valid worms from artifacts. Additionally, it quantifies RNAi-induced gene silencing, intracellular protein aggregation, and puncta distribution using the fluorescence features, including corrected total worm fluorescence (CTWF), local maxima of fluorescence intensity, and raw integrated density, thus broadening its application beyond sexual classification. WorMachine employs machine learning algorithms, specifically the SVM, for the binary classification task of distinguishing between male and hermaphrodite worms. Moreover, it uses dimensionality reduction techniques like PCA and t-SNE to quantify continuous phenotypical features, including masculinization or developmental stages, allowing users to quantify subtle variations in phenotypes (Figure 2D). Figure 2D demonstrates how WorMachine integrates morphological and fluorescence features for robust phenotyping. It demonstrated successful sexual classification of worms by using the morphological and fluorescence-based features extracted from the images with a high accuracy of up to 98%. This approach enabled detection of subtle masculinization phenotypes in temperature-sensitive sex-determination mutants, which were validated through genetic and RNAi perturbation assays. Its modular design allows the user to adapt to various experimental needs. However, the software has technical limitations, such as the size of images used for analysis cannot be more than 1 GB due to its memory constraints, and images should be of high contrast containing no overlapping or occluded worms, suggesting that it’s not suitable for analyzing images with a high density of worms.
3.1.5. Real-Time Tracking and Dynamic Phenotyping
Recent technological advancements allow researchers to adopt automation in their routine experimental workflows. WormPicker, a versatile automated robotic system, utilizes a motorized 3D stage and a robotic arm to perform complex workflows in C. elegans studies, including imaging, phenotyping, genetic manipulations, and transferring of worms onto standard nematode agar media [39]. The system uses a machine vision algorithm based on CNNs and Mask-Regional CNNs (Mask-RCNNs) to process images at different magnifications, precisely segment C. elegans, and identify features such as developmental stage, morphology, sex, and fluorescence expression. WormPicker also employs an electrically self-sterilized wire loop for efficient and contamination-free worm transfer.
The role of CNNs is to analyze low-magnification bright-field images to track worms and the robotic worm picks during real-time operations. On the other hand, the Mask-RCNN is used for detailed segmentation of worms from high-magnification bright-field images that help in the detailed phenotypical analysis, including developmental stage, sex, and morphology of individual worms (Figure 2E). Moreover, the machine vision system confirms the accuracy of phenotypical assessments by analyzing fluorescence intensity in specific channels (e.g., GFP, RFP) and correlating the fluorescence signals with the segmented worm contours captured from bright-field images.
Importantly, the integration of deep-learning-aided segmentation demonstrated that a robotic system could perform complex genetic procedures such as genetic mapping, genomic transgene integration, and phenotype-based sorting autonomously with improved accuracy and consistency. The system’s throughput is comparable to that of experienced human researchers, thereby reducing the need for labor-intensive manual intervention and minimizing human errors. In addition, the proposed system allows the flexibility of writing custom scripts to carry out tailored experimental workflows as well as integrating the machine vision system into various conventional genetic screens and analyses. However, the system does have limited capability for handling worms with unusual or extreme morphological variations; therefore, the algorithm may need to be custom trained for the efficient recognition and identification of strains with abnormal morphology and phenotypes.
Conventional developmental and motility-associated phenotypical studies of adult nematodes require long culture periods, therefore making large-scale screenings time-consuming. Interestingly, C. elegans embryos, due to their shorter developmental periods and immobile nature, serve as an attractive alternative for rapid phenotyping. However, traditional methods, such as mounting embryos on agar pads are laborious and time-consuming. To overcome this difficulty, a high-throughput microfluidic platform that combines machine learning and image processing has been developed to automate the phenotyping of C. elegans embryos [40]. The system is capable of handling up to 800 embryos simultaneously and employs a combination of AlexNet-based-CNN and standard image processing techniques to process images of embryos across different developmental stages. By training the CNN on labeled brightfield and fluorescent image patches, the model can classify and distinguish between different embryonic developmental stages, including bean stage, twitching stage, and hatching stage (Figure 2F). Furthermore, the model tracks temporal changes in embryo images to infer mobility and classify viability states, thus being able to distinguish between normal, dead, and late-hatching embryos. However, the model requires high-performance GPUs for optimal performance and the classification accuracy may decrease with fewer labeled images, suggesting areas for improvement, such as increased data labeling or model optimization.
3.2. Developmental Toxicity and Tissue Analysis in C. elegans
Evaluating developmental toxicity and evaluating tissue integrity is crucial to understanding the impact of environmental, genetic, and chemical factors on the developmental biology of an organism such as C. elegans. Machine learning plays a key role in the automation of these analyses, especially in high-throughput experimental procedures. From developmental toxicity screening to tissue damage examination and even tracking morphological changes, these techniques show the degree of external interference on the structural and functional integrity of the tissue. This section discusses the innovative machine learning solutions in these aspects, emphasizing their impact in minimizing biases, improving accuracy, and increasing research output.
3.2.1. Developmental Toxicity Testing
Developmental toxicity (DevTox) tests are experimental assays used to investigate the adverse effects of chemical substances on an organism’s normal development. Performing the DevTox test on mammalian animal models like mice, rats, and rabbits is often preferred by regulatory agencies and industries. Interestingly, recent scientific and technological advancements in test methodologies suggest that C. elegans can be used as an alternative animal model for rapid high-throughput toxicity testing [41,42]. Importantly, utilization of advanced microfluidic devices like vivoChip ensures rapid and consistent immobilization of large numbers of worms without anesthetics and eliminates overlap between worms [43]. Therefore, it allows us to capture clear images of individual worms without interference and serves as an ideal platform for high-throughput developmental toxicity studies.
However, the manual labor-intensive morphological phenotype analysis process during the test poses a limitation, especially in high-throughput screenings. A custom machine learning model named vivoBodySeg is developed using a 2.5D U-Net architecture to automatically segment and analyze the morphological features of immobilized C. elegans bodies from high-resolution images obtained from vivoChip devices [44]. Firstly, the age-synchronized worms are treated with the chemical substance of interest at different concentrations, followed by the immobilization of worms using the vivoChip microfluidic device that comprises 960 channels per chip. Secondly, the high-resolution time-lapse brightfield and z-stack fluorescence images of each channel are captured automatically using a customized automated microscope. Alternatives such as light-sheet microscopy or sparse sampling with computational super-resolution may reduce dependency on resource-intensive z-stacks [45,46]. Finally, the model segments individual immobilized worms and analyzes multiple morphological parameters, including body length, area, volume, and autofluorescence from the images (Figure 3A).
The model demonstrated to perform worm segmentation with a high accuracy of 97.8% and analyze large image datasets rapidly at 140x faster than manual methods. Moreover, the model demonstrates high statistical robustness with coefficients of variance between 3.7% and 8%, ensuring low variability and high reproducibility. These suggest that the implementation of the model in the DevTox test workflow would efficiently eliminate bias and variability associated with manual analysis. Furthermore, the vivoChip-vivoBodySeg system offers superior performance compared to traditional well-plate or flow cytometry methods by reducing user bias, improving measurement precision, and achieving higher throughput efficiency. However, the dependence on high-resolution images for accurate detection of body dimensions and autofluorescence intensity distribution, and the high-end GPUs and memory systems for optimal performance, are a challenge for labs with limited resources.
3.2.1. Analysing Tissue Damage and Egg Viability
Studying tissue damage and egg viability in C. elegans may provide insights into how environmental, genetic, and chemical factors affect tissue integrity, function, and organismal development. Multispectral imaging is a powerful analytical imaging technique that captures image data across multiple wavelengths of the electromagnetic spectrum. Unlike traditional imaging, which captures information using either a single wavelength or a combination of a broad spectrum of wavelengths (RGB images), multispectral imaging collects detailed spectral information for each pixel in the image [47]. Due to its ability to collect high-resolution spectral and spatial data, multispectral imaging is effective in studying subtle morphological and structural changes in tissues or organisms in a non-invasive manner that correlate with key developmental processes, including embryogenesis, cell differentiation, and structural integrity.
However, conventional approaches for assessing morphological alterations involve manual observation and simple measurements, which are labor-intensive, and subjective to errors. To address these challenges researchers have successfully implemented machine-learning approaches in their study to analyze tissue damage and egg viability from multispectral images [48]. In their study, worms and eggs were exposed to different bleaching treatment conditions, followed by capturing multispectral images of treated worms and eggs using 7 light wavelengths ranging between 450-950 nm. The captured images were then analyzed using machine learning algorithms like PCA to reduce the high dimensionality of multispectral imaging data to visualize and differentiate the tissue damage patterns. Whereas the SVM-DA has been employed to classify worms and eggs based on the degree of damage and to predict egg viability (Figure 3B).
The analysis revealed that increased alkaline hypochlorite concentrations correlated with reduced egg viability and altered tissue morphology in eggshell layers. Moreover, the machine learning framework algorithm identified specific zones of damage in worm bodies such as anatomical orifices including the mouth, vulva, and anus, where alkaline hypochlorite penetration has been most pronounced. Altogether, the algorithm framework effectively correlates imaging data with tissue damage and egg viability (R2 of up to 0.998) and demonstrates high classification accuracy for treatment levels and viability prediction with >90% sensitivity and specificity. The model’s ability to identify hypochlorite damage to anatomical openings was experimentally supported by comparing morphological changes across increasing bleach concentrations, thus confirming dose-response sensitivity. However, the approach heavily relies on sophisticated multispectral imaging systems and high computational configurations, thus it may pose a challenge for the successful adoption of this approach in labs with limited resources. Nevertheless, the proposed framework shows potential for application in studying the tissue damage of C. elegans exposed to different chemical substances. Multispectral imaging enables precise and pixel-level tissue health diagnostics by extracting high-dimensional spectral fingerprints. Its utility extends to identifying sub-lethal effects, mapping the diffusion and effects of toxic chemical exposures, and correlating these profiles with developmental delays. Future applications may include mapping the impact of stress granules, oxidative stress, or RNAi treatments on internal tissues like hypodermis and neurons.
3.2.1. Tissue Morphological Transitions
During development, the tissues are generated from newly synthesized biomolecules through morphogenic pathways, and during aging the tissues may undergo deterioration which is indicated via functional and structural declines [49]. Quantification of structural transition in the tissues over time can serve as a valuable biomarker marker in aging-related studies. However, these studies are laborious, and the sensitivity of analysis is limited to the user’s visual perception and expertise. This suggests that manual morphological analysis is limited to small-scale studies and may add significant variation to the study. To address these challenges, a pattern recognition-based machine learning algorithm has been developed to track structural changes in the pharynx across the lifespan of C. elegans and examine their correlation with aging and functional decline [50].
The algorithm extracts features such as texture statistics, polynomial decompositions, segmentation statistics, and image transforms from differential interference contrast (DIC) microscopy images to analyze morphological changes between age groups. The extracted features were assigned weights using Fisher Discriminant scores based on their ability to distinguish between different age groups. A trained morphology-based classifier then identifies morphological changes in pharynx structure between early, mid, and late adulthood worms by converting image data into a high-dimensional feature space and calculating similarities to predefined class centroids. The analysis revealed three distinct morphological states associated with aging: early adulthood (days 0-2), mid-life (days 4-8), and late adulthood (days 10-12) (Figure 3C). This transition suggests that pharynx morphology is dynamic in nature that undergoes characteristic, stepwise changes throughout adulthood and may serve as a specific and quantifiable biomarker for tracking aging-associated physiological changes.
Identified mid-life morphological states of the pharynx were then correlated with future functional decline using a longitudinal lifetime pumping ability model, which measured pharynx pumping rates across an organism’s lifespan. Altogether, the computational approach demonstrated accurate identification of morphological transitions during aging and provides quantitative insights into how structural changes influence tissue function during aging. However, the analysis is limited to pharynx tissue suggesting the need for additional validation for broader application to other tissues. Furthermore, the performance of the algorithm depends on the quality and uniformity of microscopy images.
3.2. Cellular Dynamics and Lineage Studies in C. elegans
Analysis of cellular dynamics and lineage pattern is crucial for understanding the developmental processes of C. elegans. The fusion of machine learning and modern imaging technology has drastically changed the analysis of single cell activities, lineage tracing, and multicellular interactions. These approaches allow whole-body cell segmentation, embryonic modeling and germline stem cell division tracking with unprecedented details, thus enable high-resolution insights into cellular behavior and fate determination. This section discusses advanced methodologies that enhance the understanding of C. elegans development on a cellular level and beyond.
3.2.1. Cell Lineage Tracing
Recent advances in microscopy imaging paved the way for tracking gene expression at single-cell resolution. This can be applied to annotate and track cell lineages during C. elegans embryonic development. StarryNite, an automated cell lineage tracing software, has been developed to recognize cells by identifying nuclear divisions from the 3D confocal microscopy images of developing embryos captured at high spatial and temporal resolution [51]. However, the software produces a few error types including false positives, false negatives, incorrect positioning, diameter estimation errors, and tracing errors, particularly during later stages of development due to the increased cell density and noise. To address the errors generated by the StarryNite software, an SVM classifier-based machine learning model has been developed [52]. The model analyzes the images by extracting features such as time indices, spatial distances, nuclear sizes, fluorescence intensities, and angles of nuclear movements. The SVM then classifies whether detected nuclear division calls are valid or mis-annotated (Figure 4A), thus improving annotation accuracy (AUC scores of ~0.933) and reducing manual curation time up to 30%. SVM demonstrated accuracy improvements over StarryNite’s baseline (83.8% to 94%). However, the performance of the algorithm may deteriorate on analyzing datasets with varying imaging resolutions or biological conditions. Furthermore, it does not address error types like false negatives or diameter estimation errors. Nevertheless, this opens the possibility of applying the proposed framework to correct the errors generated by various image analysis tasks.
Though cellular dynamics like cell division, migration, and cell fate determination are well studied during the developmental process, cellular morphological dynamics remain relatively under-characterized. Therefore, it creates a significant knowledge gap that limits the comprehensive understanding of developmental and cell biology. To address this, CShaper- an automated software pipeline integrated with the DMapNet-deep learning model has been developed to quantify cellular morphological dimensions of developing C. elegans embryos [53]. The CShaper analyzes 3D time-lapse confocal microscopy images of C. elegans embryos of different developmental stages ranging from 4-cell to 350-cell stages, and segments individual cells using fluorescently labeled membranes. Instead of the traditional binary segmentation, the DMapNet neural network executes the membrane segmentation by generating a discrete distance map to improve accuracy in identifying complex cell boundaries, achieving a Dice score of 95.95% albeit the densely packed cellular environment of the developing embryo. As a result, CShaper generates a comprehensive 3D cell morphological atlas containing key phenotypical metrics, including cell shape, volume, surface area, nucleus position, cell-cell contact, and spatial organization (Figure 4B). The pipeline enables the precise identification cell identities by combining membrane segmentation with cell lineage tracing produced by tools like StarryNite and AceTree. Moreover, it demonstrates the efficiency of processing large image stacks in ~30 minutes, making it suitable for high throughput studies, though it requires significant computational resources, particularly during distance map generation and segmentation. However, the lack of a user-friendly visualization platform limits the interactive exploration of cell morphological dynamics.
3.3.2. Whole-Body Cell Segmentation and Recognition
Accurate studies of the cell lineages, cell fates, and gene expression at the single-cell level resolution in C. elegans require precise segmentation and recognition of individual cells. However, it may be a problem due to the highly dense distribution, identical shapes, and non-uniform intensity profiles of whole-body cells observed in 3D fluorescence microscopy images. A novel Displacement Vector Field (DVF) based deep learning model has been developed for the automated segmentation and recognition of C. elegans whole-body cells from 3D fluorescence microscopy images [54]. The algorithm pipeline has been implemented using PyTorch, the algorithm consists of two key modules: a segmentation module that uses DVF for effective segmentation of densely packed cells with blurred boundaries and a recognition module that uses a statistical-structural matching-based cell recognition method. The recognition module generates a comprehensive statistical atlas of C. elegans whole-body cells, incorporating statistic priors like average spatial positions, spatial position variations, and topological structural variations for robust cell recognition (Figure 4C). Moreover, the pipeline demonstrated successful segmentation and recognition of all the 558 whole-body cells in L-stage larvae with high performance (F1 score of 0.8956) and accuracy of 0.8879. Moreover, the algorithm pipeline can also be adaptable to segment and recognize cells of other animal models including Platynereis and rat kidney cells. However, the algorithm requires precise statistical priors suggesting the demand for extensive manual annotations. Additionally, the algorithm’s efficiency is sensitive to segmentation errors which further affect the cell recognition pipeline. Nevertheless, it offers a promising framework for high-throughput and accurate cell segmentation and recognition across different biological datasets.
3.3.3. Modelling Cellular Dynamics in Embryogenesis
Scientists study the early-stage embryogenesis of C. elegans to understand the intricate process of cellular dynamics and behavior during development. Studies have demonstrated that agent-based modeling (ABM), a computational approach with a set of physical and biological rules can be used as a powerful tool for simulating complex biological systems including developmental biology [55,56]. However, these simulations still lack a comprehensive understanding of the regulatory mechanisms of cellular dynamics and thus require optimization. An observation-driven framework combining ABM and deep reinforcement learning has been shown to simulate the movement and behavior of individual cells within the complex embryonic environment [57]. Observational data from C. elegans embryos-derived 3D time-lapse fluorescence confocal microscopy enabled the simulation of cellular behaviors including cell fate, division, and movement. By integrating automated lineage tracing and tissue-specific fluorescently labeled gene expression, a developmental landscape has been constructed to model cell fate and differentiation pathways (Figure 4D). Overall, the framework demonstrated the ability to combine observational mobile cellular morphology data within computational models achieving a deep understanding of how these dynamics work at the cellular level. Nevertheless, there is still an issue with scalability in analyzing larger datasets or other organisms with more complex embryogenesis. The inclusion of hierarchical and multi-agent reinforcement learning approaches in future research may help to address these limitations.
Furthermore, integration of a Deep-Q-network-based reinforcement learning with ABM has been shown to optimize the cell migration paths during C. elegans early-stage embryogenesis [58] (Figure 4E). The model demonstrated the ability of cells to learn different migratory behaviors, particularly distinguishing between active (reader-like) and passive (follower-like) migratory roles. Importantly, the application of reinforcement learning improved the robustness of the simulation model in exploring unknown regulatory mechanisms to hypothesize and test unknown interactions. However, analysis of large-scale training and simulations require high computational requirements including the powerful GPUs, suggesting a potential bottleneck in the workflow.
3.3.4. Tracking Germline Stem Cell Dynamics in Embryos
Tracking the germline stem cells (GSCs) division in developing C. elegans embryos is essential for understanding the stem cell interaction. However, it would be technically challenging to analyze the large-scale datasets of dividing GSCs. To address this challenge, CentTracker, a machine learning-based automated image analysis tool has been developed to track the mitotic events in dividing GSCs in large-scale live image datasets [59]. The framework pipeline consists of four main modules: registration module, which corrects the sample movement during live imaging by registering images by identifying spindle midpoints and applying corrections that account for displacement; spot detection and tracking module, which identifies and tracks individual centrosomes, within the registered images; track pair classifier module, which uses random forest-based classifier to pairs centrosome tracks to true mitotic pairs; and scoring and analysis module, which analyzes paired tracks to extract mitotic features and enables users to score mitotic landmarks including nuclear envelope breakdown and anaphase onset (Figure 4F).
The framework has been reported to identify centrosome pairs with a high precision of 94.5%, with a discovery rate (identification of all mitotic cells) of 82.4%. However, the discovery rate depends on initial tracking quality, and the performance reduces under noisy datasets or severely perturbed spindle dynamics. Beyond technical performance, CentTracker revealed that GSC divisions are spatially clustered, and that spindle orientation is biased along the distal–proximal axis of the gonad. The system’s generalizability to other cell types and organisms highlights its potential for future large-scale stem cell studies.
3.3.5. Detection and Characterization of Multicellular Structures in Embryos
The analysis of cellular shapes provides critical biological insights into morphogenetic events and mechanisms in complex tissues, including cell intercalation and tissue morphogenesis. However, analyzing extensive 3D time-lapse images of tissues is a labor-intensive and time-consuming task. To address this, a generative adversarial network (GAN)-based deep learning model has been developed to identify multicellular rosette structures in C. elegans embryos with fluorescently labeled cell membranes [60]. The model combines unsupervised feature learning using GANs with feature transfer to an Alex-style CNN, which is then trained on a small, labeled dataset (Figure 4G). The GAN-based approach utilized 11,250 unlabeled images for initial training and required only 10–15 rosette images and 30–40 non-rosette images for supervised learning. This combined approach outperformed classical CNNs by achieving >80% classification accuracy and maintaining >90% of full-dataset performance using only 20% of the labeled data, thus demonstrating its robustness against data scarcity. While GANs exceeded 80% accuracy in low-labeled scenarios, traditional CNNs like AlexNet typically plateaued at ~65–70%, thereby underscoring the benefit of generative pretraining under data-scarce conditions. A sliding window approach and probability heat maps further enhanced rosette detection within large observation images. The model successfully detected multicellular rosette formations associated with early embryonic polarity defects, which were subsequently confirmed using live imaging of par-6 mutants. However, performance reduces with extremely small training datasets (<10%) and relies significantly on high-performance GPUs. Nevertheless, the framework can be adapted for other biological image classification tasks. Additionally, a public benchmark dataset has been created to support further research.
Among the reviewed models, CNN-based architectures (e.g., InceptionResNetV2, Mask-RCNN) appear most promising due to their high classification accuracy and adaptability to varied image types [33,39]. For instance, CNN-based models such as InceptionResNetV2 outperformed classical models like SVMs in age prediction tasks, achieving a MAE of less than 1 day compared to higher errors in classical models, thereby demonstrating superior performance in complex image-based phenotyping [33]. Classical models like SVM, while efficient, often struggle with overlapping worms or noisy inputs [31,51]. GANs are powerful in low-data scenarios but require extensive tuning [60]. Hence, tool selection should align with dataset quality, task complexity, and resource availability.
4. Future Perspectives and Limitations
Machine learning has become a powerful tool that has transformed experimental workflows into C. elegans research from classifying developmental stages and estimating physiological age to tracking cellular dynamics and phenotyping embryonic and adults. These algorithms have significantly improved the accuracy, reproducibility, and efficiency of data analysis. However, several challenges and limitations must be addressed to enable universal adoption of machine learning in developmental biology, especially in laboratories with limited resources. This section discusses the key hurdles to implementing the above-mentioned research workflows in labs with limited financial, technical, or computational resources. Table 1 represents the comparative summary of the machine learning models, input data types, pros, and cons discussed in this review.
One of the most critical limitations is the demand for high computational power. Many machine learning models, especially deep learning architectures require high-performance GPUs to function optimally [40,44,48,58,60]. While C. elegans is a economical and easily maintained model organism, the computational requirements of these pipelines often exceed what typical research or academic labs can afford. Future technological advances may help mitigate this by either reducing the computational complexity of models or lowering the cost of hardware or ideally, both. Another major limitation is the need for sophisticated instruments, which many of the discussed workflows depend on. These include robotic worm handling system [39], custom-designed microfluidic chips [40,44], multispectral imaging system [48], and advanced microscopy systems [50,52,53,54,57,58]. These instruments are essential for specific experiments and often inaccessible to laboratories with limited resources. In such cases, lower-cost alternatives are currently unavailable, limiting the broader application of these workflows.
Moreover, a further hurdle is the technical knowledge required to develop, adapt, or deploy machine learning frameworks, which often involves proficiency in programming languages including MATLAB, Python, and machine learning libraries like PyTorch or TensorFlow. Most biologists do not have practical exposure to coding, making it difficult for them to customize or implement these tools independently. Furthermore, many pipelines are tightly linked to code-based platforms, creating a steep learning curve for non-expert users. However, tools like WorMachine demonstrate how machine learning can be made more accessible through the implementation of a graphical user interface (GUI), allowing researchers with no programming experience to perform high-level phenotypic analysis [38]. This emphasizes the importance of user-friendly design in future pipeline development. Building machine learning platforms with intuitive GUIs would equalize access and significantly increase adoption among life science researchers. Finally, with the rise of open-source, code-free platforms such as KNIME [61] and Orange [62], there is an opportunity to develop and deploy machine learning workflows in more accessible ways. These tools provide drag-and-drop interfaces for data analysis and machine learning, reducing the technical obstacle for users while maintaining high functionality. Leveraging such platforms to design pipelines specific to C. elegans developmental biology could accelerate the widespread use of machine learning in everyday experimental workflows.
In addition to user-friendly and code-free platforms, further strategies can enhance accessibility for researchers in resource-limited environments. Cloud-based platforms such as Google Colab and Amazon Web Services (AWS) provide free or low-cost access to GPUs and scalable computer infrastructure, thus eliminating the need for local high-performance hardware [63,64]. Additionally, lightweight neural network architectures such as MobileNet and Tiny-YOLO, and model compression techniques like pruning and quantization can significantly reduce memory and processing demands without substantial compromise on accuracy [65]. Incorporating these approaches can enable the deployment of machine learning models on modest computational setups, thereby supporting broader adoption in under-resourced laboratories.
While this review primarily focused on developmental stages, the application of machine learning to adult C. elegans studies is equally an important area. Recent advances have leveraged using deep learning and object-tracking algorithms to assess motility, behavioral patterns, and lifespan in adult worms [66]. Tools such as CeleST [67] and WormRACER [68] use computer vision to analyze locomotion and neuromuscular decline across adulthood. In addition, machine learning models including bimodal neural networks and random forests have been developed to predict lifespan directly from imaging/data streams. For example, a bimodal neural network using time-series motility and survival data accurately predicted lifespan [69]. However, these applications often face challenges in distinguishing subtle behavioral patterns under varying experimental conditions. Notably, developmental-stage research in C. elegans provides foundational insights such as improved segmentation and phenotype classification, which can be applied to adult-stage studies [70]. Future work could benefit from integrating developmental stage classifiers with longitudinal tracking tools to better understand life-history traits, thereby bridging the gap between early development and adult aging research.
Automated phenotyping introduces ethical considerations, particularly in embryo manipulation or synthetic dataset augmentation. It is important to ensure data reproducibility through public datasets and external validation. Therefore, models should be benchmarked against independent test cohorts wherever possible. While this review focuses on C. elegans, the machine learning strategies discussed here are broadly applicable across other model systems. Recent studies have successfully applied deep learning to evaluate morphological and physiological changes in zebrafish [71], Drosophila [72], and murine models [73]. These tools hold promises in uncovering conserved developmental principles and enhancing translational relevance to human biology.
5. Concluding Remarks
Machine learning has emerged as an essential tool in advancing developmental studies of C. elegans. This review has covered a broad range of models and pipelines, that range from basic classifying algorithms to sophisticated deep learning frameworks, which have revolutionized the classification of developmental stages, phenotyping, estimation of physiological age, toxicity assays, cell lineage tracing and cellular modeling. Nonetheless, there is a gap in machine learning implementation for biological research due to the need for high-performance computational resources, specialized imaging systems, and programming expertise. Overcoming these limitations through affordable instruments, open-source and user-friendly interfaces will be crucial to facilitate the application of machine learning in biological development studies.
Author Contributions
K.R.B. wrote, edited and revised the manuscript.
Acknowledgements
The author acknowledges the UPES, Dehradun, India, for providing institutional support and infrastructure that enabled the development of academic resources and research insights contributing to this review. No specific funding was received for the preparation or publication of this article.
Declaration of interests
The authors declare no competing interests.
References
- Ray, A. K.; et al. A bioinformatics approach to elucidate conserved genes and pathways in C. elegans as an animal model for cardiovascular research. Sci Rep 2024, 14, 7471. [Google Scholar] [CrossRef] [PubMed]
- Valperga, G. & de Bono, M. Impairing one sensory modality enhances another by reconfiguring peptidergic signalling in Caenorhabditis elegans. Impairing one sensory modality enhances another by reconfiguring peptidergic signalling in Caenorhabditis elegans. Elife 2022, 11. [Google Scholar] [CrossRef]
- Vidal, B.; et al. An atlas of Caenorhabditis elegans chemoreceptor expression. PLoS Biol 2018, 16, e2004218. [Google Scholar] [CrossRef] [PubMed]
- Azuma, Y. , Okada, H. & Onami, S. Systematic analysis of cell morphodynamics in C. elegans early embryogenesis. Front Bioinform 2023, 3, 1082531. [Google Scholar] [CrossRef]
- Packer, J. S.; et al. A lineage-resolved molecular atlas of C. elegans embryogenesis at single-cell resolution. Science 2019, 365. [Google Scholar] [CrossRef]
- So, S. , Asakawa, M. & Sawa, H. Distinct functions of three Wnt proteins control mirror-symmetric organogenesis in the C. elegans gonad. Elife 2024, 13. [Google Scholar] [CrossRef]
- Godini, R. , Fallahi, H. & Pocock, R. The regulatory landscape of neurite development in Caenorhabditis elegans. Front Mol Neurosci 2022, 15, 974208. [Google Scholar] [CrossRef]
- Zhang, S. , Li, F., Zhou, T., Wang, G. & Li, Z. Caenorhabditis elegans as a Useful Model for Studying Aging Mutations. Front Endocrinol (Lausanne) 2020, 11, 554994. [Google Scholar] [CrossRef]
- Li, Y.; et al. A full-body transcription factor expression atlas with completely resolved cell identities in C. elegans. Nat Commun 2024, 15, 358. [Google Scholar] [CrossRef]
- Corsi, A. K. , Wightman, B. & Chalfie, M. A Transparent Window into Biology: A Primer on Caenorhabditis elegans. Genetics 2015, 200, 387–407. [Google Scholar] [CrossRef] [PubMed]
- O’Reilly, L. P. , Luke, C. J., Perlmutter, D. H., Silverman, G. A. & Pak, S. C. C. elegans in high-throughput drug discovery. Adv Drug Deliv Rev 2014, 69, 247–253. [Google Scholar] [CrossRef]
- Yuan, H.; et al. Microfluidic-Assisted Caenorhabditis elegans Sorting: Current Status and Future Prospects. Cyborg Bionic Syst 2023, 4, 0011. [Google Scholar] [CrossRef]
- An, Q. , Rahman, S., Zhou, J. & Kang, J. J. A Comprehensive Review on Machine Learning in Healthcare Industry: Classification, Restrictions, Opportunities and Challenges. Sensors (Basel) 2023, 23. [Google Scholar] [CrossRef]
- Buton, N. , Coste, F. & Le Cunff, Y. Predicting enzymatic function of protein sequences with attention. Predicting enzymatic function of protein sequences with attention. Bioinformatics 2023, 39. [Google Scholar] [CrossRef]
- Russo, E. T.; et al. DPCfam: Unsupervised protein family classification by Density Peak Clustering of large sequence datasets. PLoS Comput Biol 2022, 18, e1010610. [Google Scholar] [CrossRef]
- Mourad, R. Semi-supervised learning improves regulatory sequence prediction with unlabeled sequences. BMC Bioinformatics 2023, 24, 186. [Google Scholar] [CrossRef]
- Yang, R. , Zhang, L., Bu, F., Sun, F. & Cheng, B. AI-based prediction of protein-ligand binding affinity and discovery of potential natural product inhibitors against ERK2. BMC Chem 2024, 18, 108. [Google Scholar] [CrossRef]
- Zhang, L.; et al. A deep learning model to identify gene expression level using cobinding transcription factor signals. Brief Bioinform 2022, 23. [Google Scholar] [CrossRef]
- Wang, M. , Wei, Z., Jia, M., Chen, L. & Ji, H. Deep learning model for multi-classification of infectious diseases from unstructured electronic medical records. BMC Med Inform Decis Mak 2022, 22, 41. [Google Scholar] [CrossRef]
- Anwar, M. Y.; et al. Machine learning-based clustering identifies obesity subgroups with differential multi-omics profiles and metabolic patterns. Obesity (Silver Spring) 2024, 32, 2024–2034. [Google Scholar] [CrossRef] [PubMed]
- Ballard, J. L. , Wang, Z., Li, W., Shen, L. & Long, Q. Deep learning-based approaches for multi-omics data integration and analysis. BioData Min 2024, 17, 38. [Google Scholar] [CrossRef]
- Adam, G.; et al. Machine learning approaches to drug response prediction: challenges and recent progress. NPJ Precis Oncol 2020, 4, 19. [Google Scholar] [CrossRef]
- Guan, B. Z. , Parmigiani, G., Braun, D. & Trippa, L. Prediction of Hereditary Cancers Using Neural Networks. Ann Appl Stat 2022, 16, 495–520. [Google Scholar] [CrossRef] [PubMed]
- Poirion, O. B. , Jing, Z., Chaudhary, K., Huang, S. & Garmire, L. X. DeepProg: an ensemble of deep-learning and machine-learning models for prognosis prediction using multi-omics data. Genome Med 2021, 13, 112. [Google Scholar] [CrossRef]
- Firat Atay, F.; et al. A hybrid machine learning model combining association rule mining and classification algorithms to predict differentiated thyroid cancer recurrence. Front Med (Lausanne) 2024, 11, 1461372. [Google Scholar] [CrossRef] [PubMed]
- Choi, R. Y. , Coyner, A. S., Kalpathy-Cramer, J., Chiang, M. F. & Campbell, J. P. Introduction to Machine Learning, Neural Networks, and Deep Learning. Transl Vis Sci Technol 2020, 9, 14. [Google Scholar] [CrossRef]
- Ravindran, U. & Gunavathi, C. Deep learning assisted cancer disease prediction from gene expression data using WT-GAN. BMC Med Inform Decis Mak 2024, 24, 311. [Google Scholar] [CrossRef]
- Shimasaki, K.; et al. Deep learning-based segmentation of subcellular organelles in high-resolution phase-contrast images. Cell Struct Funct 2024, 49, 57–65. [Google Scholar] [CrossRef] [PubMed]
- Kandathil, S. M. , Lau, A. M. & Jones, D. T. Machine learning methods for predicting protein structure from single sequences. Curr Opin Struct Biol 2023, 81, 102627. [Google Scholar] [CrossRef]
- Cao, R.; et al. ProLanGO: Protein Function Prediction Using Neural Machine Translation Based on a Recurrent Neural Network. Molecules 2017, 22. [Google Scholar] [CrossRef]
- White, A. G.; et al. Rapid and accurate developmental stage recognition of C. elegans from high-throughput image data. Proc IEEE Comput Soc Conf Comput Vis Pattern Recognit 2010, 2010, 3089–3096. [Google Scholar] [CrossRef]
- Pan, P.; et al. High-Resolution Imaging and Morphological Phenotyping of C. elegans through Stable Robotic Sample Rotation and Artificial Intelligence-Based 3-Dimensional Reconstruction. Research (Wash D C) 2024, 7, 0513. [Google Scholar] [CrossRef]
- Lin, J. L.; et al. Using Convolutional Neural Networks to Measure the Physiological Age of Caenorhabditis elegans. IEEE/ACM Trans Comput Biol Bioinform 2021, 18, 2724–2732. [Google Scholar] [CrossRef] [PubMed]
- Moore, B. T. , Jordan, J. M. & Baugh, L. R. WormSizer: high-throughput analysis of nematode size and shape. PLoS One 2013, 8, e57142. [Google Scholar] [CrossRef]
- Schindelin, J.; et al. Fiji: an open-source platform for biological-image analysis. Nat Methods 2012, 9, 676–682. [Google Scholar] [CrossRef] [PubMed]
- Jung, S. K. , Aleman-Meza, B., Riepe, C. & Zhong, W. QuantWorm: a comprehensive software package for Caenorhabditis elegans phenotypic assays. PLoS One 2014, 9, e84830. [Google Scholar] [CrossRef]
- Wahlby, C.; et al. An image analysis toolbox for high-throughput C. elegans assays. Nat Methods 2012, 9, 714–716. [Google Scholar] [CrossRef]
- Hakim, A.; et al. WorMachine: machine learning-based phenotypic analysis tool for worms. BMC Biol 2018, 16, 8. [Google Scholar] [CrossRef]
- Li, Z.; et al. A robotic system for automated genetic manipulation and analysis of Caenorhabditis elegans. PNAS Nexus 2023, 2, pgad197. [Google Scholar] [CrossRef]
- Baris Atakan, H. , Alkanat, T., Cornaglia, M., Trouillon, R. & Gijs, M. A. M. Automated phenotyping of Caenorhabditis elegans embryos with a high-throughput-screening microfluidic platform. Microsyst Nanoeng 2020, 6, 24. [Google Scholar] [CrossRef]
- Boyd, W. A. , Smith, M. V., Kissling, G. E. & Freedman, J. H. Medium- and high-throughput screening of neurotoxicants using C. elegans. Neurotoxicol Teratol 2010, 32, 68–73. [Google Scholar] [CrossRef]
- Hunt, P. R. The C. elegans model in toxicity testing. J Appl Toxicol 2017, 37, 50–59. [Google Scholar] [CrossRef]
- Yoon, S.; et al. Microfluidics in High-Throughput Drug Screening: Organ-on-a-Chip and C. elegans-Based Innovations. Biosensors (Basel) 2024, 14. [Google Scholar] [CrossRef]
- DuPlissis, A.; et al. Machine learning-based analysis of microfluidic device immobilized C. elegans for automated developmental toxicity testing. Sci Rep 2025, 15, 15. [Google Scholar] [CrossRef] [PubMed]
- Chow, D. J. X.; et al. Quantifying DNA damage following light sheet and confocal imaging of the mammalian embryo. Sci Rep 2024, 14, 20760. [Google Scholar] [CrossRef] [PubMed]
- Tian, W. , Chen, R. & Chen, L. Computational Super-Resolution: An Odyssey in Harnessing Priors to Enhance Optical Microscopy Resolution. Anal Chem 2025, 97, 4763–4792. [Google Scholar] [CrossRef] [PubMed]
- Nigamatzyanova, L. & Fakhrullin, R. Dark-field hyperspectral microscopy for label-free microplastics and nanoplastics detection and identification in vivo: A Caenorhabditis elegans study. Environ Pollut 2021, 271, 116337. [Google Scholar] [CrossRef] [PubMed]
- Verdu, S. , Fuentes, C., Barat, J. M. & Grau, R. Characterisation of chemical damage on tissue structures by multispectral imaging and machine learning procedures: Alkaline hypochlorite effect in C. elegans. Comput Biol Med 2022, 145, 105477. [Google Scholar] [CrossRef]
- Dybiec, J. , Szlagor, M., Mlynarska, E., Rysz, J. & Franczyk, B. Structural and Functional Changes in Aging Kidneys. Structural and Functional Changes in Aging Kidneys. Int J Mol Sci 2022, 23. [Google Scholar] [CrossRef]
- Johnston, J. , Iser, W. B., Chow, D. K., Goldberg, I. G. & Wolkow, C. A. Quantitative image analysis reveals distinct structural transitions during aging in Caenorhabditis elegans tissues. PLoS One 2008, 3, e2821. [Google Scholar] [CrossRef]
- Bao, Z.; et al. Automated cell lineage tracing in Caenorhabditis elegans. Proc Natl Acad Sci U S A 2006, 103, 2707–2712. [Google Scholar] [CrossRef] [PubMed]
- Aydin, Z. , Murray, J. I., Waterston, R. H. & Noble, W. S. Using machine learning to speed up manual image annotation: application to a 3D imaging protocol for measuring single cell gene expression in the developing C. elegans embryo. BMC Bioinformatics 2010, 11, 84. [Google Scholar] [CrossRef]
- Cao, J.; et al. Establishment of a morphological atlas of the Caenorhabditis elegans embryo using deep-learning-based 4D segmentation. Nat Commun 2020, 11, 6254. [Google Scholar] [CrossRef]
- Li, Y.; et al. Automated segmentation and recognition of C. elegans whole-body cells. Bioinformatics 2024, 40. [Google Scholar] [CrossRef] [PubMed]
- Setty, Y. Multi-scale computational modeling of developmental biology. Bioinformatics 2012, 28, 2022–2028. [Google Scholar] [CrossRef]
- Wang, Z.; et al. An Observation-Driven Agent-Based Modeling and Analysis Framework for C. elegans Embryogenesis. PLoS One 2016, 11, e0166551. [Google Scholar] [CrossRef] [PubMed]
- Wang, D. , Wang, Z., Zhao, X., Xu, Y. & Bao, Z. An Observation Data Driven Simulation and Analysis Framework for Early Stage C. elegans Embryogenesis. J Biomed Sci Eng 2018, 11, 225–234. [Google Scholar] [CrossRef]
- Wang, Z.; et al. Deep reinforcement learning of cell movement in the early stage of C.elegans embryogenesis. Bioinformatics 2018, 34, 3169–3177. [Google Scholar] [CrossRef]
- Zellag, R. M.; et al. CentTracker: a trainable, machine-learning-based tool for large-scale analyses of Caenorhabditis elegans germline stem cell mitosis. Mol Biol Cell 2021, 32, 915–930. [Google Scholar] [CrossRef]
- Wang, D.; et al. Cellular structure image classification with small targeted training samples. IEEE Access 2019, 7, 148967–148974. [Google Scholar] [CrossRef]
- Kore, M. , Acharya, D., Sharma, L., Vembar, S. S. & Sundriyal, S. Development and experimental validation of a machine learning model for the prediction of new antimalarials. BMC Chem 2025, 19, 28. [Google Scholar] [CrossRef]
- Godec, P.; et al. Democratized image analytics by visual programming through integration of deep models and small-scale machine learning. Nat Commun 2019, 10, 4551. [Google Scholar] [CrossRef]
- Rajeev, P. A.; et al. Advancing e-waste classification with customizable YOLO based deep learning models. Sci Rep 2025, 15, 18151. [Google Scholar] [CrossRef]
- Dineva, K. & Atanasova, T. Health Status Classification for Cows Using Machine Learning and Data Management on AWS Cloud. Health Status Classification for Cows Using Machine Learning and Data Management on AWS Cloud. Animals (Basel) 2023, 13. [Google Scholar] [CrossRef]
- Mittal, P. A comprehensive survey of deep learning-based lightweight object detection models for edge devices. Artificial Intelligence Review 2024, 57. [Google Scholar] [CrossRef]
- Garcia Garvi, A. , Puchalt, J. C., Layana Castro, P. E., Navarro Moya, F. & Sanchez-Salmeron, A. J. Towards Lifespan Automation for Caenorhabditis elegans Based on Deep Learning: Analysing Convolutional and Recurrent Neural Networks for Dead or Live Classification. Sensors (Basel) 2021, 21. [Google Scholar] [CrossRef]
- Restif, C.; et al. CeleST: computer vision software for quantitative analysis of C. elegans swim behavior reveals novel features of locomotion. PLoS Comput Biol 2014, 10, e1003702. [Google Scholar] [CrossRef] [PubMed]
- Van Camp, B. T. , Zapata, Q. N. & Curran, S. P. WormRACER: Robust Analysis by Computer-Enhanced Recording. GeroScience 2025, 47, 5377–5387. [Google Scholar] [CrossRef]
- Garcia-Garvi, A. , Layana-Castro, P. E. & Sanchez-Salmeron, A. J. Analysis of a C. elegans lifespan prediction method based on a bimodal neural network and uncertainty estimation. Comput Struct Biotechnol J 2023, 21, 655–664. [Google Scholar] [CrossRef] [PubMed]
- Alonso, A. & Kirkegaard, J. B. Fast detection of slender bodies in high density microscopy data. Commun Biol 2023, 6, 754. [Google Scholar] [CrossRef]
- Yang, S. R. , Liaw, M., Wei, A. C. & Chen, C. H. Deep learning models link local cellular features with whole-animal growth dynamics in zebrafish. Life Sci Alliance 2025, 8. [Google Scholar] [CrossRef]
- Melkani, Y. , Pant, A., Guo, Y. & Melkani, G. C. Automated assessment of cardiac dynamics in aging and dilated cardiomyopathy Drosophila models using machine learning. Commun Biol 2024, 7, 702. [Google Scholar] [CrossRef]
- Aljovic, A.; et al. A deep learning-based toolbox for Automated Limb Motion Analysis (ALMA) in murine models of neurological disorders. Commun Biol 2022, 5, 131. [Google Scholar] [CrossRef] [PubMed]
Figure 1.
A hierarchical overview of artificial intelligence, machine learning paradigms, and algorithm architecture. The figure illustrates a layered representation of the relationship between Artificial Intelligence, Machine Learning, and its learning paradigms and architectures. The core represents artificial intelligence, encompassing machine learning as a subset. The next layer illustrates the primary learning paradigms in machine learning: supervised, unsupervised, semi-supervised, and reinforcement learning. The outermost layer highlights specific algorithmic models and architectures within classical machine learning, such as classification and regression models, etc., and deep learning, such as Feedforward Neural Networks (FNN), Convolutional Neural Networks (CNN), and Recurrent Neural Networks, etc.
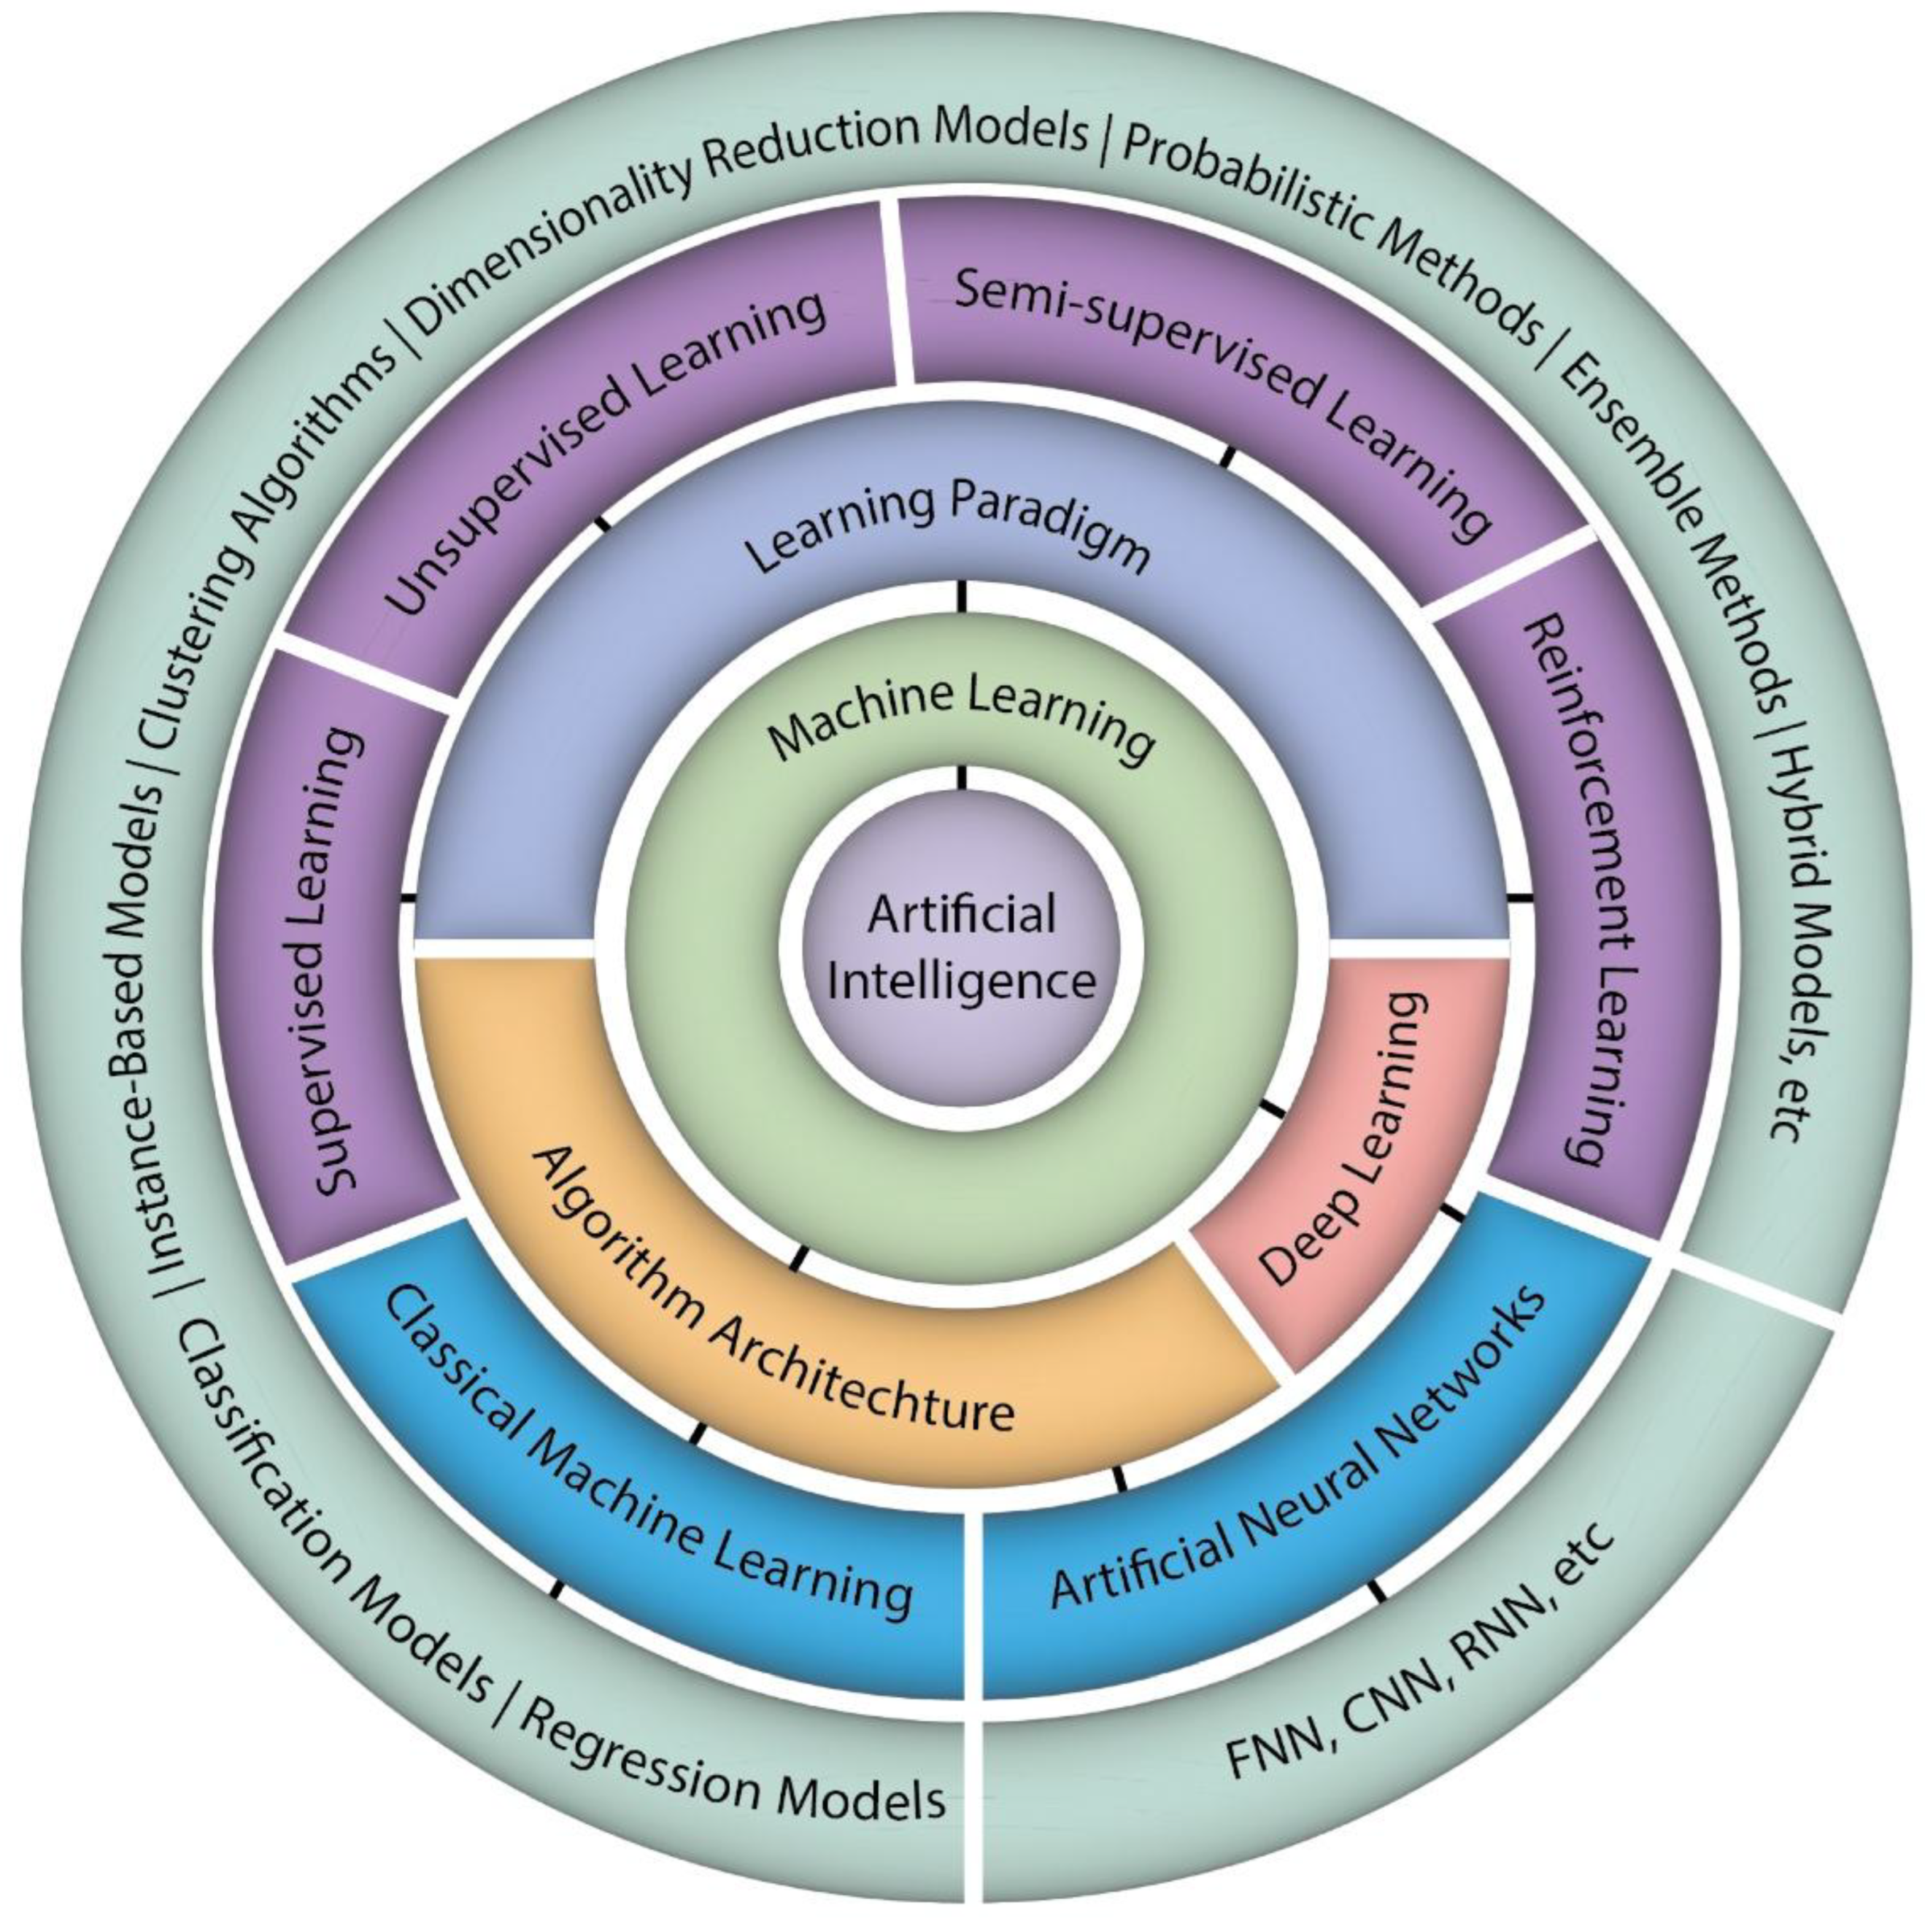
Figure 2.
Machine learning workflows for developmental stage recognition and phenotypic analysis in C. elegans. (A) DevStaR pipeline for automated classification of developmental stages in C. elegans. A hierarchical model segments the image, constructs object graphs, and categorizes objects into eggs, larvae, and adults using SVM. (B) 3D morphological reconstruction pipeline. Low-resolution images are enhanced through super-resolution and denoising, followed by segmentation, alignment, and volumetric reconstruction for detailed phenotypic measurements. LR, low-resolution; HR, high-resolution. (C) CNN-based physiological age prediction of adult C. elegans. Brightfield images are normalized and fed into InceptionResNetV2, incorporating curvature features to estimate age at daily resolution. (D) WorMachine pipeline for sexual classification and fluorescence-based phenotyping. CNN (WormNet) segments individual worms, extracts morphological and fluorescence features, followed by SVM and dimensionality reduction (PCA, t-SNE) for classification and continuous phenotype mapping. (E) WormPicker robotic system integrating CNN and Mask-RCNN for real-time phenotypic analysis and autonomous worm picking. Worms are tracked in low magnification images and analyzed for developmental stage, sex, and fluorescent expression at higher magnification. GFP, green fluorescent protein; RFP, red fluorescent protein. (F) High-throughput microfluidic embryo phenotyping using an AlexNet-based CNN. Embryos are loaded into microfluidic chips, imaged over time, and classified into developmental or viability categories (e.g., normal, dead, late hatching) based on mobility and morphology.
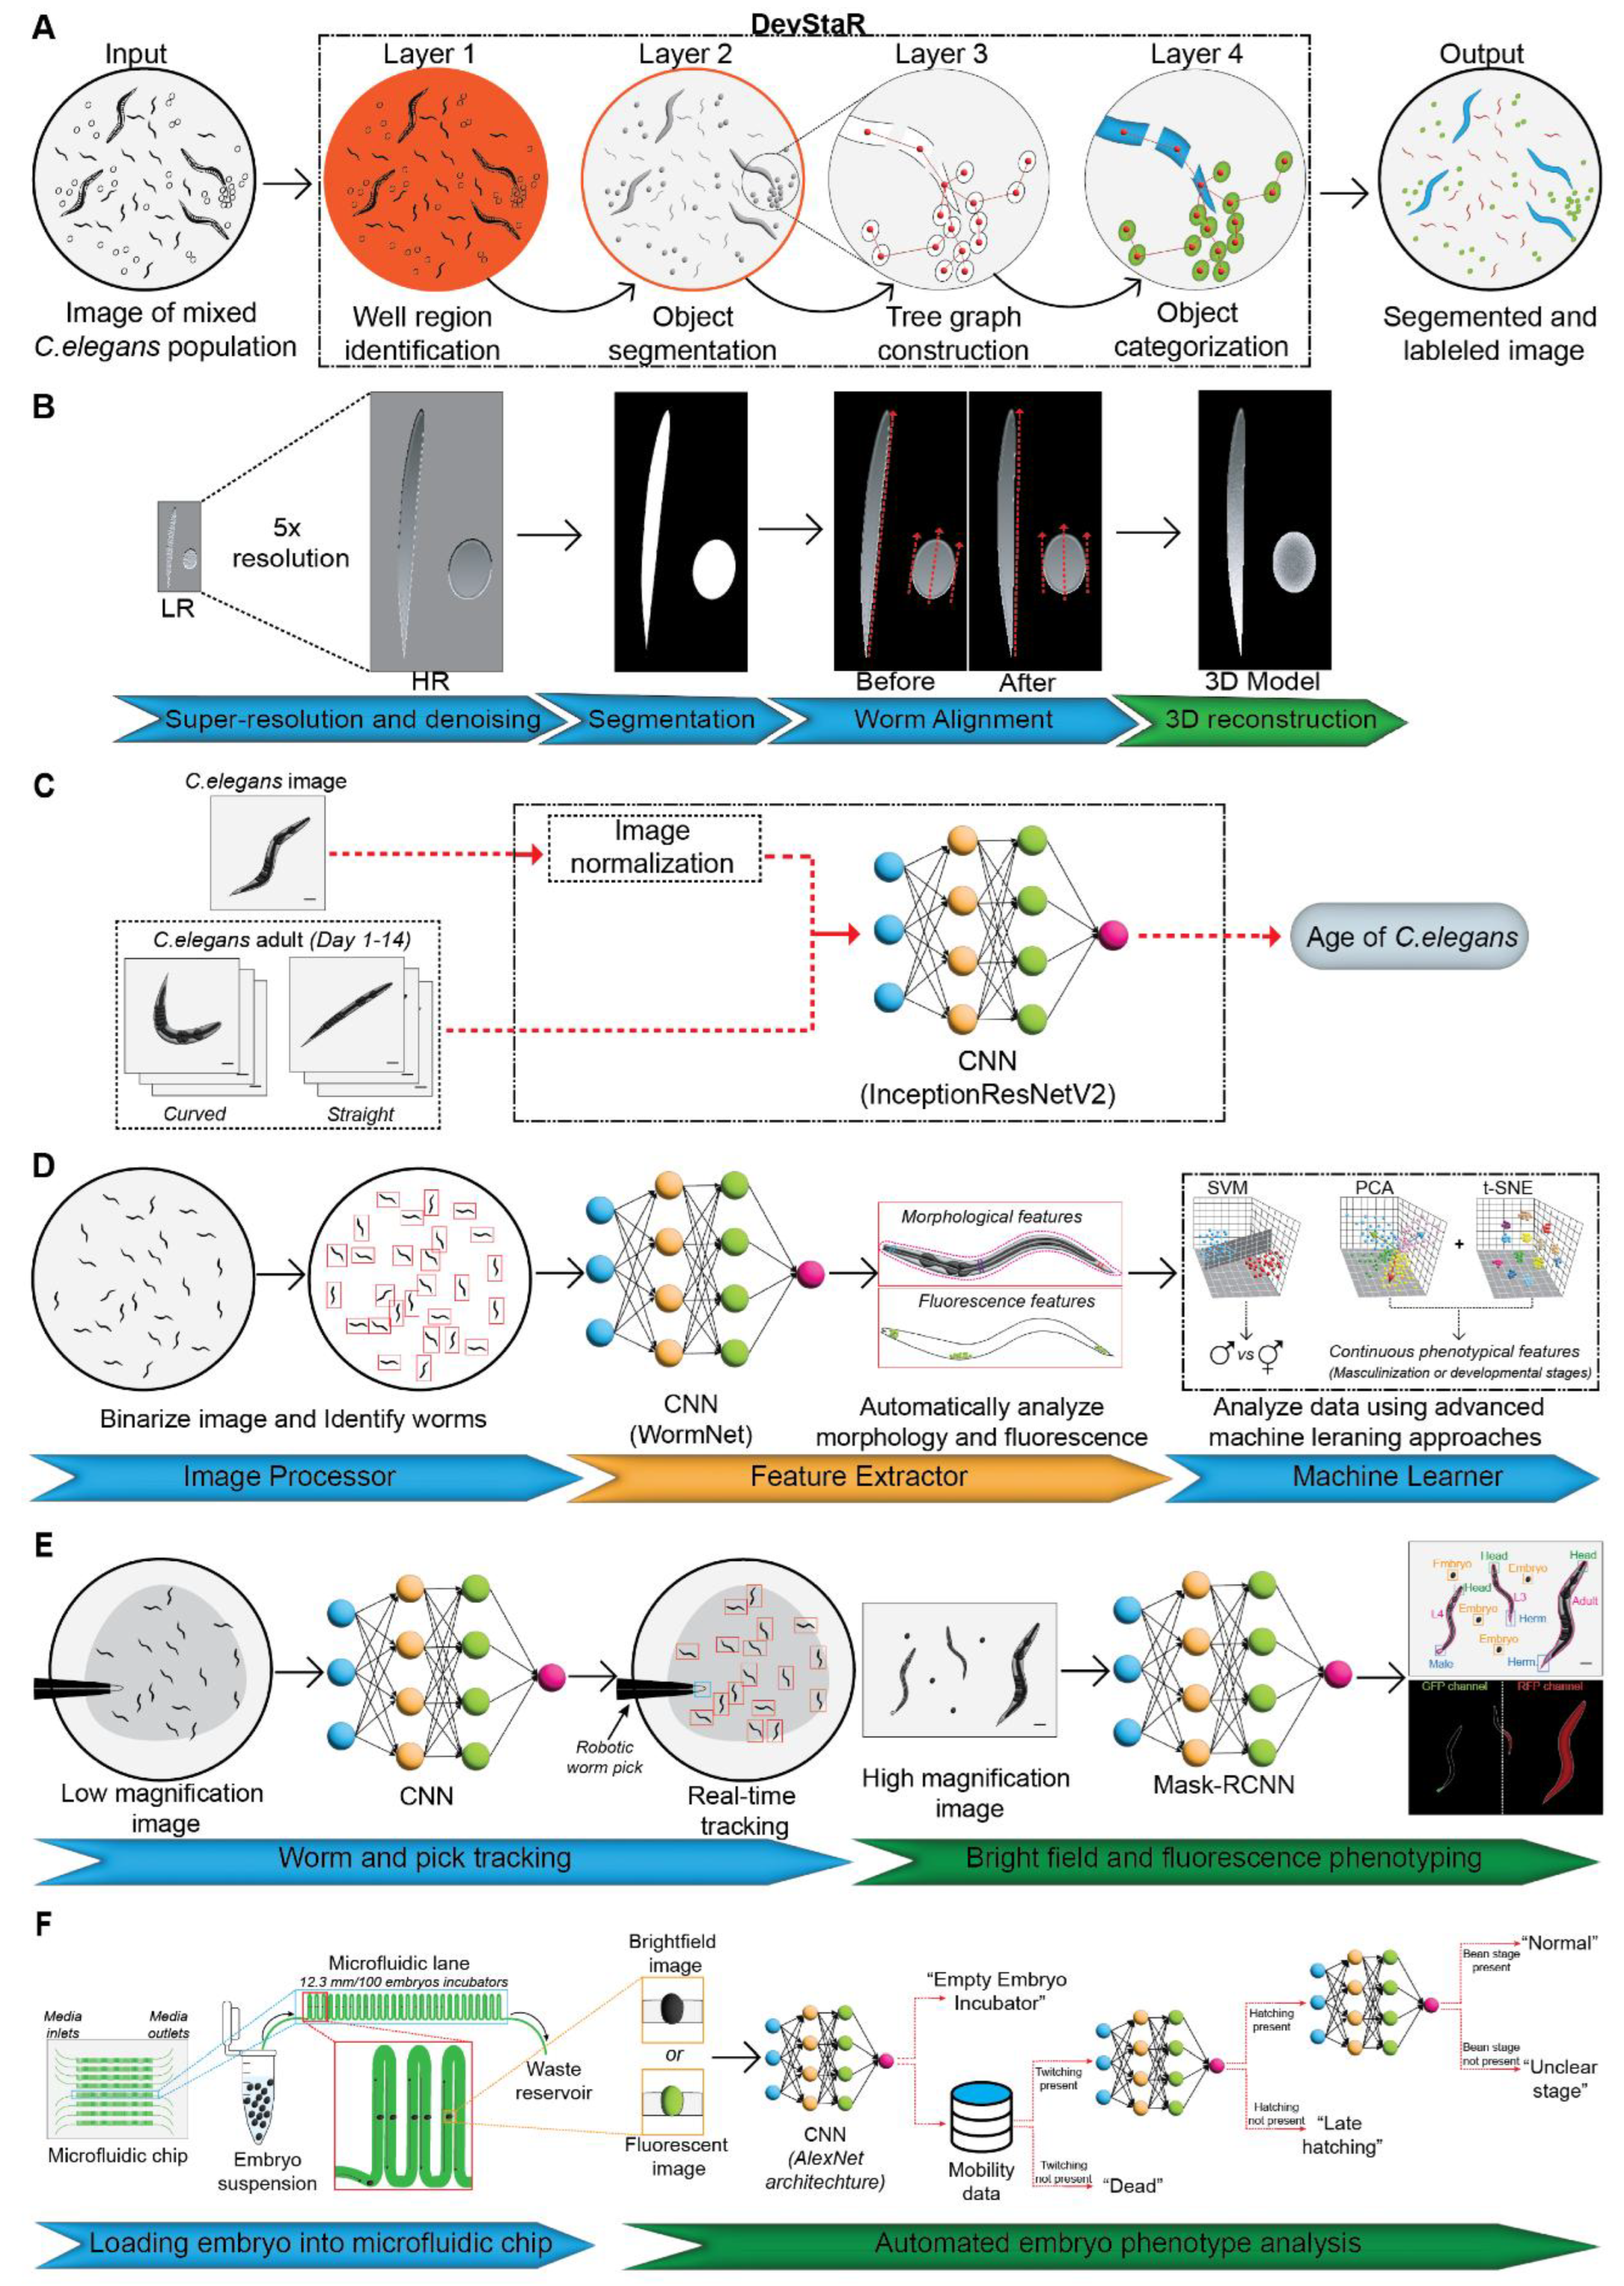
Figure 3.
Machine learning approaches for developmental toxicity screening and tissue integrity assessment in C. elegans. (A) The vivoChip-vivoBodySeg platform for high-throughput developmental toxicity testing. Immobilized worms in vivoChip devices are imaged in z-stacks and segmented using a 2.5D U-Net to extract morphological parameters, including body length, area, and autofluorescence. ViT, vision transformer. (B) Multispectral imaging-based tissue damage and egg viability assessment. Worms and eggs treated with varying bleach concentrations are imaged across multiple wavelengths, followed by region of interest (ROI) extraction and spectral profile generation. Machine learning algorithms (PCA and SVM-DA) classify damage levels and predict viability. (C) Morphometric analysis of pharynx tissue during aging. Differential interference contrast (DIC) microscopy images of C. elegans pharynx are converted into high-dimensional feature vectors, class centroids are calculated for age-defined groups, and morphological transitions are tracked to assign physiological age and predict functional decline.
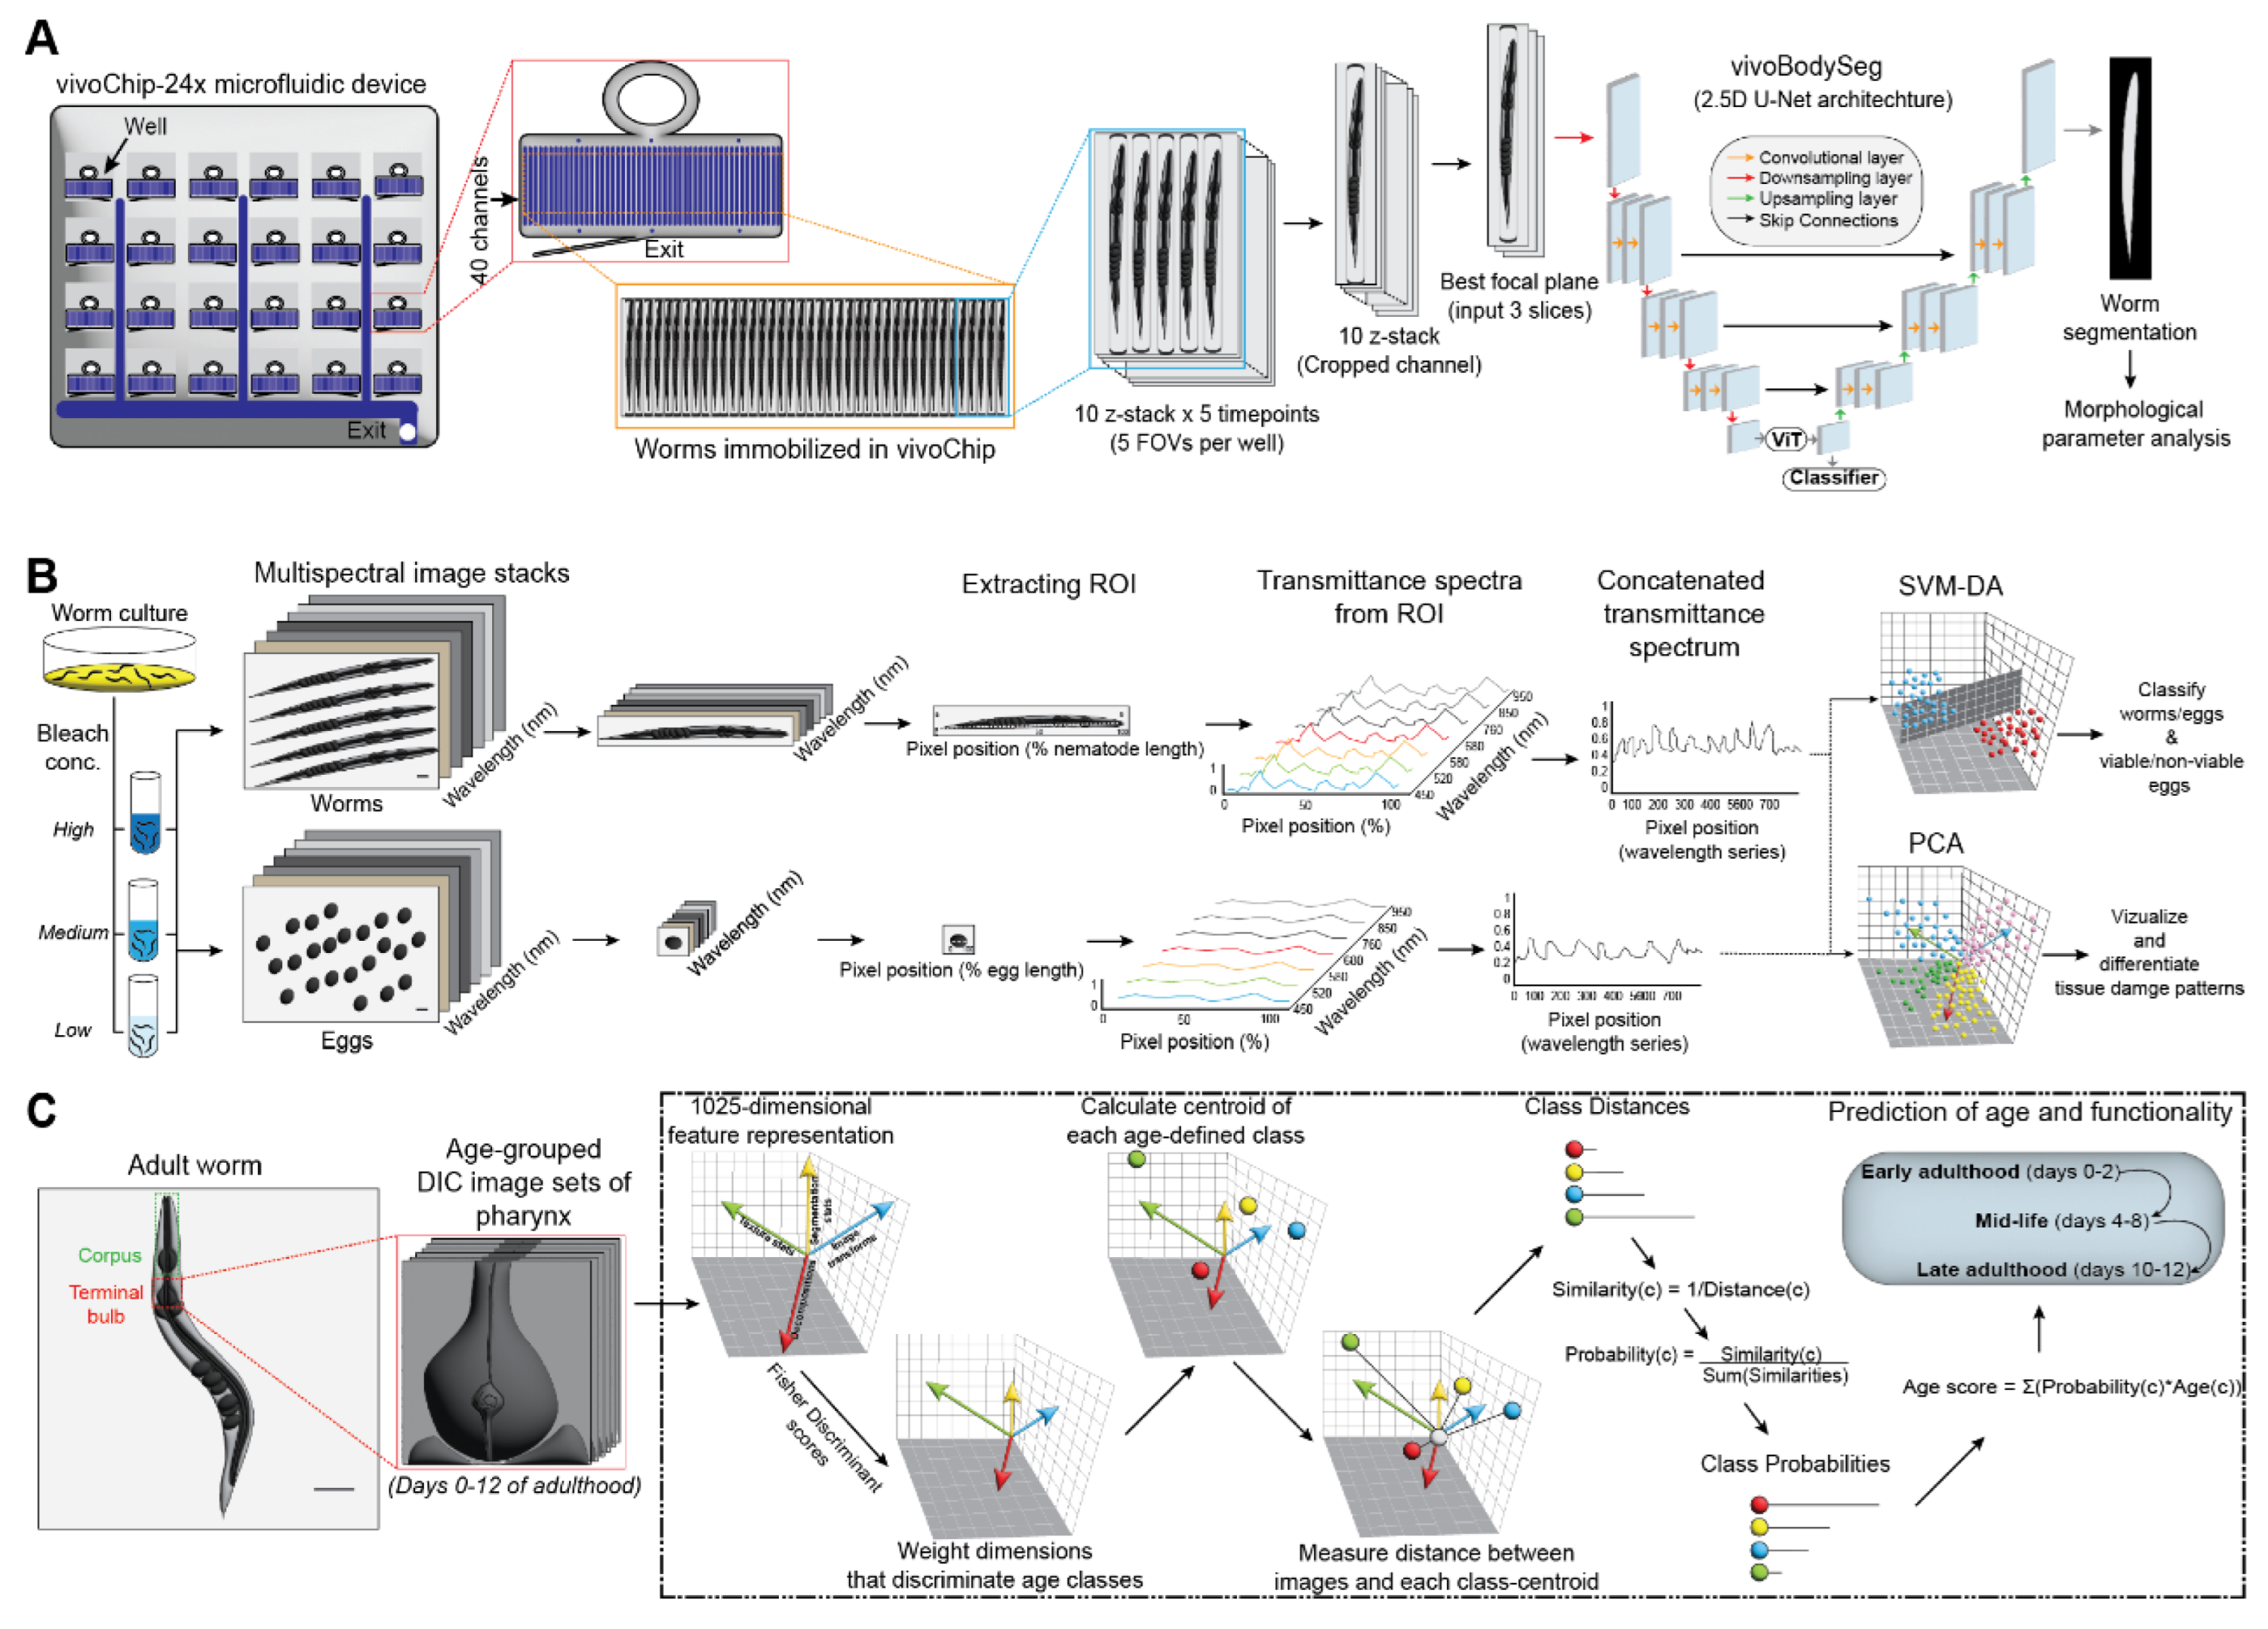
Figure 4.
Machine learning pipelines for single-cell lineage tracing, segmentation, and multicellular dynamics during C. elegans development. (A) StarryNite-based nuclear division annotation correction using SVM classifiers. Nuclear features (e.g., size, fluorescence, movement) are used to distinguish valid from mis-annotated divisions, improving lineage tracing accuracy. (B) CShaper pipeline for nucleus and membrane segmentation. DMapNet performs membrane segmentation from time-lapse stacks, enabling comprehensive cell shape lineage tracking in developing embryos. (C) Whole-body cell segmentation and recognition using a Displacement Vector Field-based deep learning model. A statistical structural atlas is used for cell identification across densely packed 3D images. (D) Integration of automated cell tracing and agent-based modeling (ABM) for simulating cell division and movement dynamics in embryogenesis. Data from 3D imaging informs ABM framework to model fate specification and spatial behavior. (E) Deep reinforcement learning integrated with ABM to optimize cell migration paths. Deep Q-network framework trains cells to mimic active and passive migratory behaviors within a developmental context. (F) CentTracker pipeline for large-scale tracking of germline stem cell (GSC) divisions. Modules include image registration, centrosome/Spot detection and tracking, track pair classification, and mitotic event scoring. DTC, distal tip cell; GFP, green fluorescent protein; mCh, monomeric cherry fluorescent protein; NEBD, nuclear envelop breakdown. (G) GAN-based framework for classification and detection of multicellular rosette structures in embryonic tissue. Feature learning is performed with unlabeled images, transferred to an AlexNet-style CNN for accurate classification using limited annotated data.
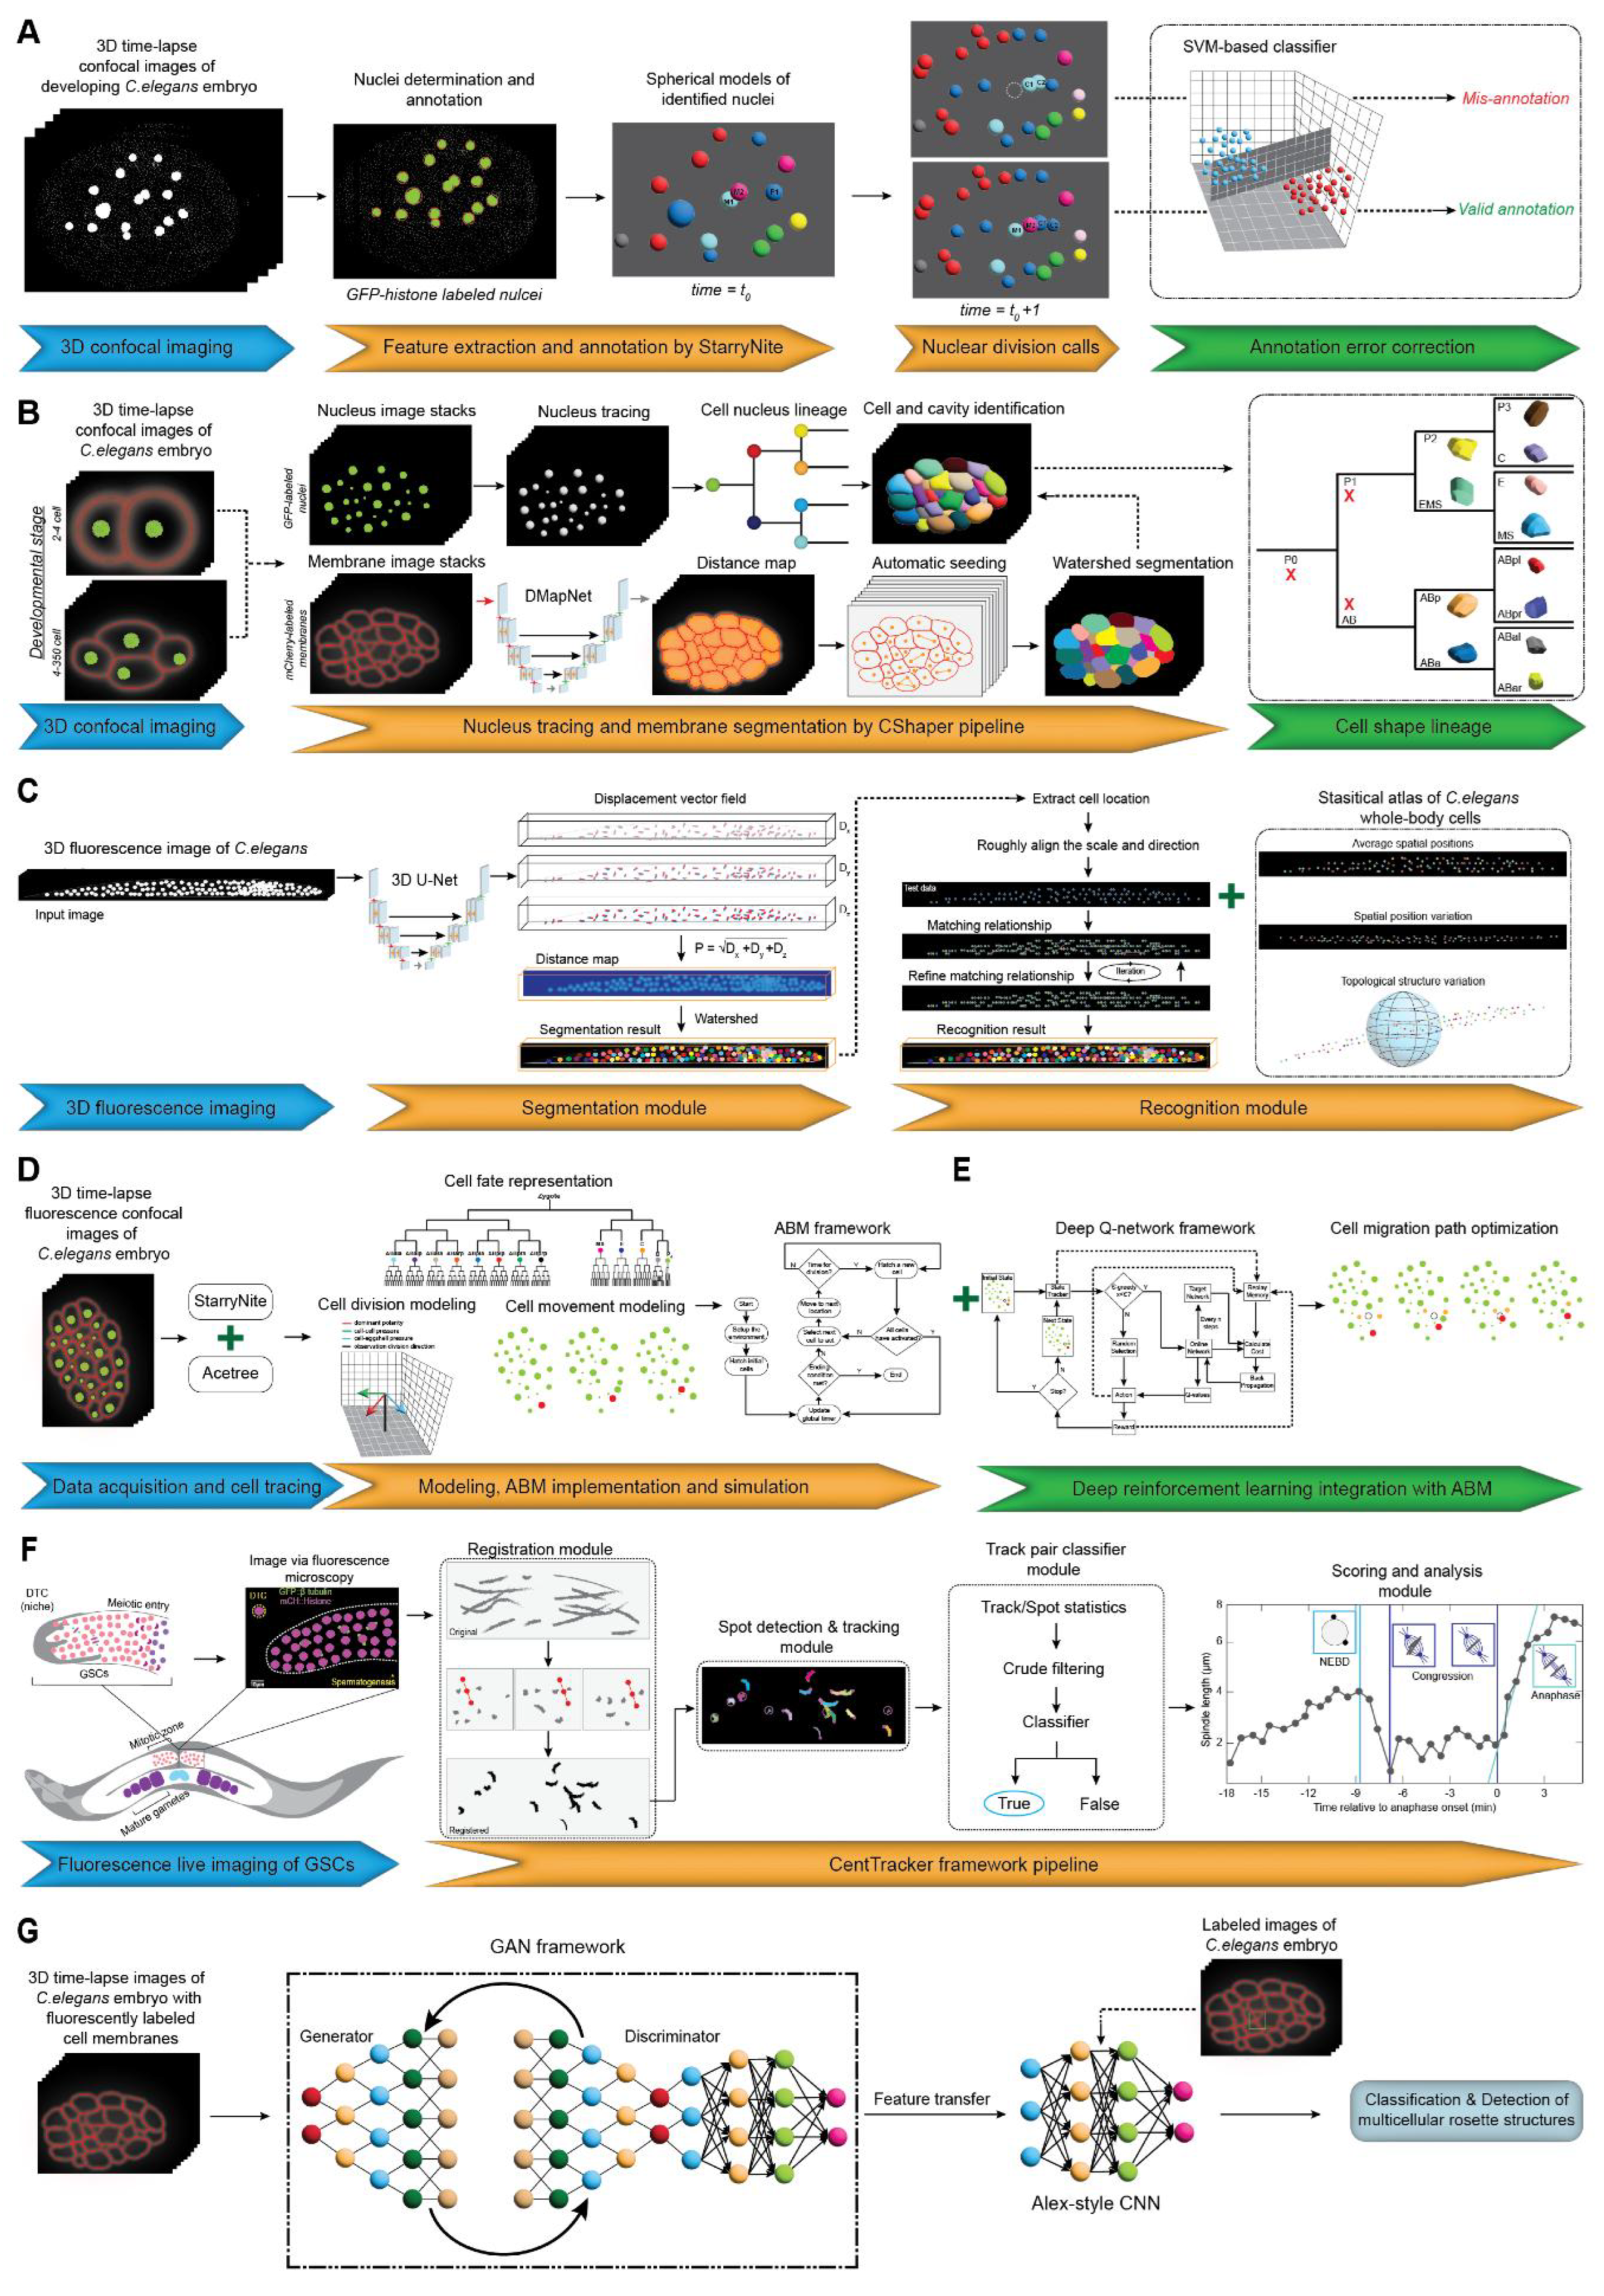

Table 1.
Summary of machine learning models for phenotypic analysis in C. elegans development.
| Sl. No | Phenotype | Input data | Machine learning model | Pros | Cons | Reference |
| 1 | Developmental stage classification (eggs, larvae, adult) | High-resolution image datasets (brightfield microscopy) | SVM | High precision for adults, reduces human errors | Low precision for eggs and larvae | [31] |
| 2 | 3D worm body structure, key morphological traits | Stacked 2D confocal or widefield microscopy images | Customized machine learning pipeline with noise reduction and segmentation | Accurate 3D reconstructions, applicable to drug screens | Limited real-time dynamic phenotyping | [32] |
| 3 | Physiological age estimation | Brightfield images of worms across 14-day lifespan | CNN (InceptionResNetV2) | Granular day-level age prediction | Potential bias due to manual preprocessing | [33] |
| 4 | Sex determination (male, hermaphrodite) | High-contrast fluorescence and morphological images | SVM with PCA and t-SNE for dimensionality reduction | High sexual classification accuracy | Memory constraints for large image files | [38] |
| 5 | Dynamic phenotypic changes during development | Brightfield and fluorescence microscopy images | CNN and Mask-RCNN | Reduces manual interventions | Limited for worms with extreme morphologies | [39] |
| 6 | Embryonic developmental stages, motility, and viability states | Brightfield and fluorescent image patches of embryos | AlexNet-based CNN with standard image processing | Rapid phenotyping of embryos, suitable for large-scale screenings, reduces manual interventions | Requires high-performance GPUs and is sensitive to labelled data quality and quantity | [40] |
| 7 | Morphological and developmental changes due to toxins | High-resolution brightfield and fluorescence images | 2.5D U-Net for segmentation | Low variability, high reproducibility | Requires high-performance GPUs and memory | [44] |
| 8 | Tissue damage, egg viability under stress conditions | Multispectral images (450-950 nm) of worms and eggs | PCA, SVM-DA (Discriminant Analysis) | Non-invasive imaging with high specificity | Sophisticated imaging systems needed | [48] |
| 9 | Pharynx structure changes across lifespan | DIC microscopy images of pharynx tissue | Pattern recognition-based machine learning algorithm | Quantitative insights into structural aging | Limited to pharynx tissue | [50] |
| 10 | Cell lineage development, nuclear divisions | 3D confocal microscopy images of embryos | SVM classifier integrated with StarryNite software | Reduces errors and manual curation time | Does not address false negatives | [52] |
| 11 | Cell shape, volume, surface area, nucleus position, and spatial organization | 3D time-lapse confocal microscopy images of embryos (4-cell to 350-cell stages) | DMapNet deep learning model (distance map-based segmentation) | Generates comprehensive 3D morphological atlas, high accuracy in densely packed cellular environments | Requires significant computational resources and lacks a user-friendly visualization platform | [53] |
| 12 | Whole-body cell identification and segmentation | 3D fluorescence microscopy images | DVF-based deep learning model | Adaptable to other animal models | Requires extensive statistical priors | [54] |
| 13 | Cell migration, division, fate determination | Time-lapse 3D confocal microscopy images | ABM combined with reinforcement learning | Provides cellular behavior insights | High computational requirements | [57,58] |
| 14 | Germline stem cell division dynamics | Live imaging of germline stem cells | Random forest-based track pair classifier | Spatial clustering analysis of GSCs | Performance drops in noisy datasets | [59] |
| 15 | Detection of multicellular rosette structures | 3D live images with fluorescently labeled cell membranes | GAN-based deep learning model with feature transfer | Efficient classification with small datasets | Performance depends on high-performance GPUs | [60] |
Disclaimer/Publisher’s Note: The statements, opinions and data contained in all publications are solely those of the individual author(s) and contributor(s) and not of MDPI and/or the editor(s). MDPI and/or the editor(s) disclaim responsibility for any injury to people or property resulting from any ideas, methods, instructions or products referred to in the content. |
© 2025 by the authors. Licensee MDPI, Basel, Switzerland. This article is an open access article distributed under the terms and conditions of the Creative Commons Attribution (CC BY) license (http://creativecommons.org/licenses/by/4.0/).
Copyright: This open access article is published under a Creative Commons CC BY 4.0 license, which permit the free download, distribution, and reuse, provided that the author and preprint are cited in any reuse.


