
Submitted:
08 May 2025
Posted:
09 May 2025
You are already at the latest version
Abstract
Paddy is a valued commodity considered paramount to Bhutanese food self-sufficiency goals. However, land-cover land-use change driven by various underlying factors have impacted agriculture systems affecting paddy production. As Punakha and Wangdue Phodrang are major paddy growing districts in the country, this study attempts to assess the spatial trends and patterns of land-use land-cover change and its relation to paddy production within the region. Supervised classification method and post classification technique were employed to generate and interpret the land-use land-cover change from the satellite images. The study showed that built-up areas have the highest net gain of 4.86% followed by vegetation and barren soil with 0.97% and 0.36% respectively from 2005 to 2020. On the contrary, agricultural land saw a loss in area by 5.3% while snow cover was reduced by 10.3% in the same period. Relative conversion index analysis of agricultural land indicated higher conversion intensity in central areas of the region with lower intensity at the external fringes. Paddy mapping displayed a net shrinkage in total paddy cultivation area by 13% in Punakha and 11% in Wangdue Phodrang from 2016 to 2021. Additionally, the rice self-sufficiency analysis also pointed to an increasing deficit with rice surplus of 127% in 2016 falling to a deficit of 6% in 2021 for Punakha while previously rice deficit of 17% in 2016 declined further to 57% in 2021 for Wangdue Phodrang indicating potential impacts of land-use change in the region calling for necessary intervention.
Keywords:
Image classification
; Land use land cover
; Paddy production
; Relative conversion index
; Self-sufficiency ratio
1. Introduction
For agricultural sustainability and food security, the intricate relationship between land use dynamics and food production is critical. Paddy, a staple food for many countries worldwide is a lifeline for billions and is of huge economic importance (Muthayya et al., 2014). Land use change refers to the process of change in land cover associated with the expansion or contraction of the area of land used for a specific purpose such as pasture, cropland or urban (Davis et al., 2019). More than half of the global land surface has experienced at least some form of change throughout the last millennia (Luyssaert et al., 2014).
Land-use land-cover [LULC] changes have long caused and are attributed to global biodiversity loss, land degradation and climate change (Oliver & Morecroft, 2014). Ever since the unprecedented industrialisation during the nineteenth century, LULC changes occurred more frequently and to a greater extent through rapid deforestation, conversion of open mostly agricultural land into settlement in some areas and through broader exploitation of natural resources and intensification of agriculture (Foley et al., 2005). A great deal of contemporary urbanisation has been characterised as urban sprawl, which is a highly extensive form of land take for urban uses having environmentally detrimental effects (Nuissl & Siedentop, 2021).
Bhutan is no exception to increase in built-up areas due to urbanization which leads to encroachment towards areas under vegetation and agriculture (Yangchen et al., 2015).. According to Gyeltshen et al. (2022), the rice self-sufficiency ratio of Bhutan stands at 34.7-51.03% thereby relying the rest on import.
Punakha and Wangdue Phodrang are the major paddy producing districts in Bhutan with a combined share of 17% of the total paddy production of the country in 2021 (NSB, 2021). As per the Ministry of Works and Human Settlement [MoWHS] (2008), Wangdue Phodrang followed by Punakha has the highest developmental potential from the Central-Western regions of Bhutan. Such a potential poses a threat to the continuity of rice production in these districts. Therefore, it is crucial to understand the spatial trend of LULC changes and its impact on the paddy production scenario so that the state and potential risks of particularly encroachment of already scarce agricultural land can be highlighted and discussed.
2. Materials and Methods
2.1. Study Area
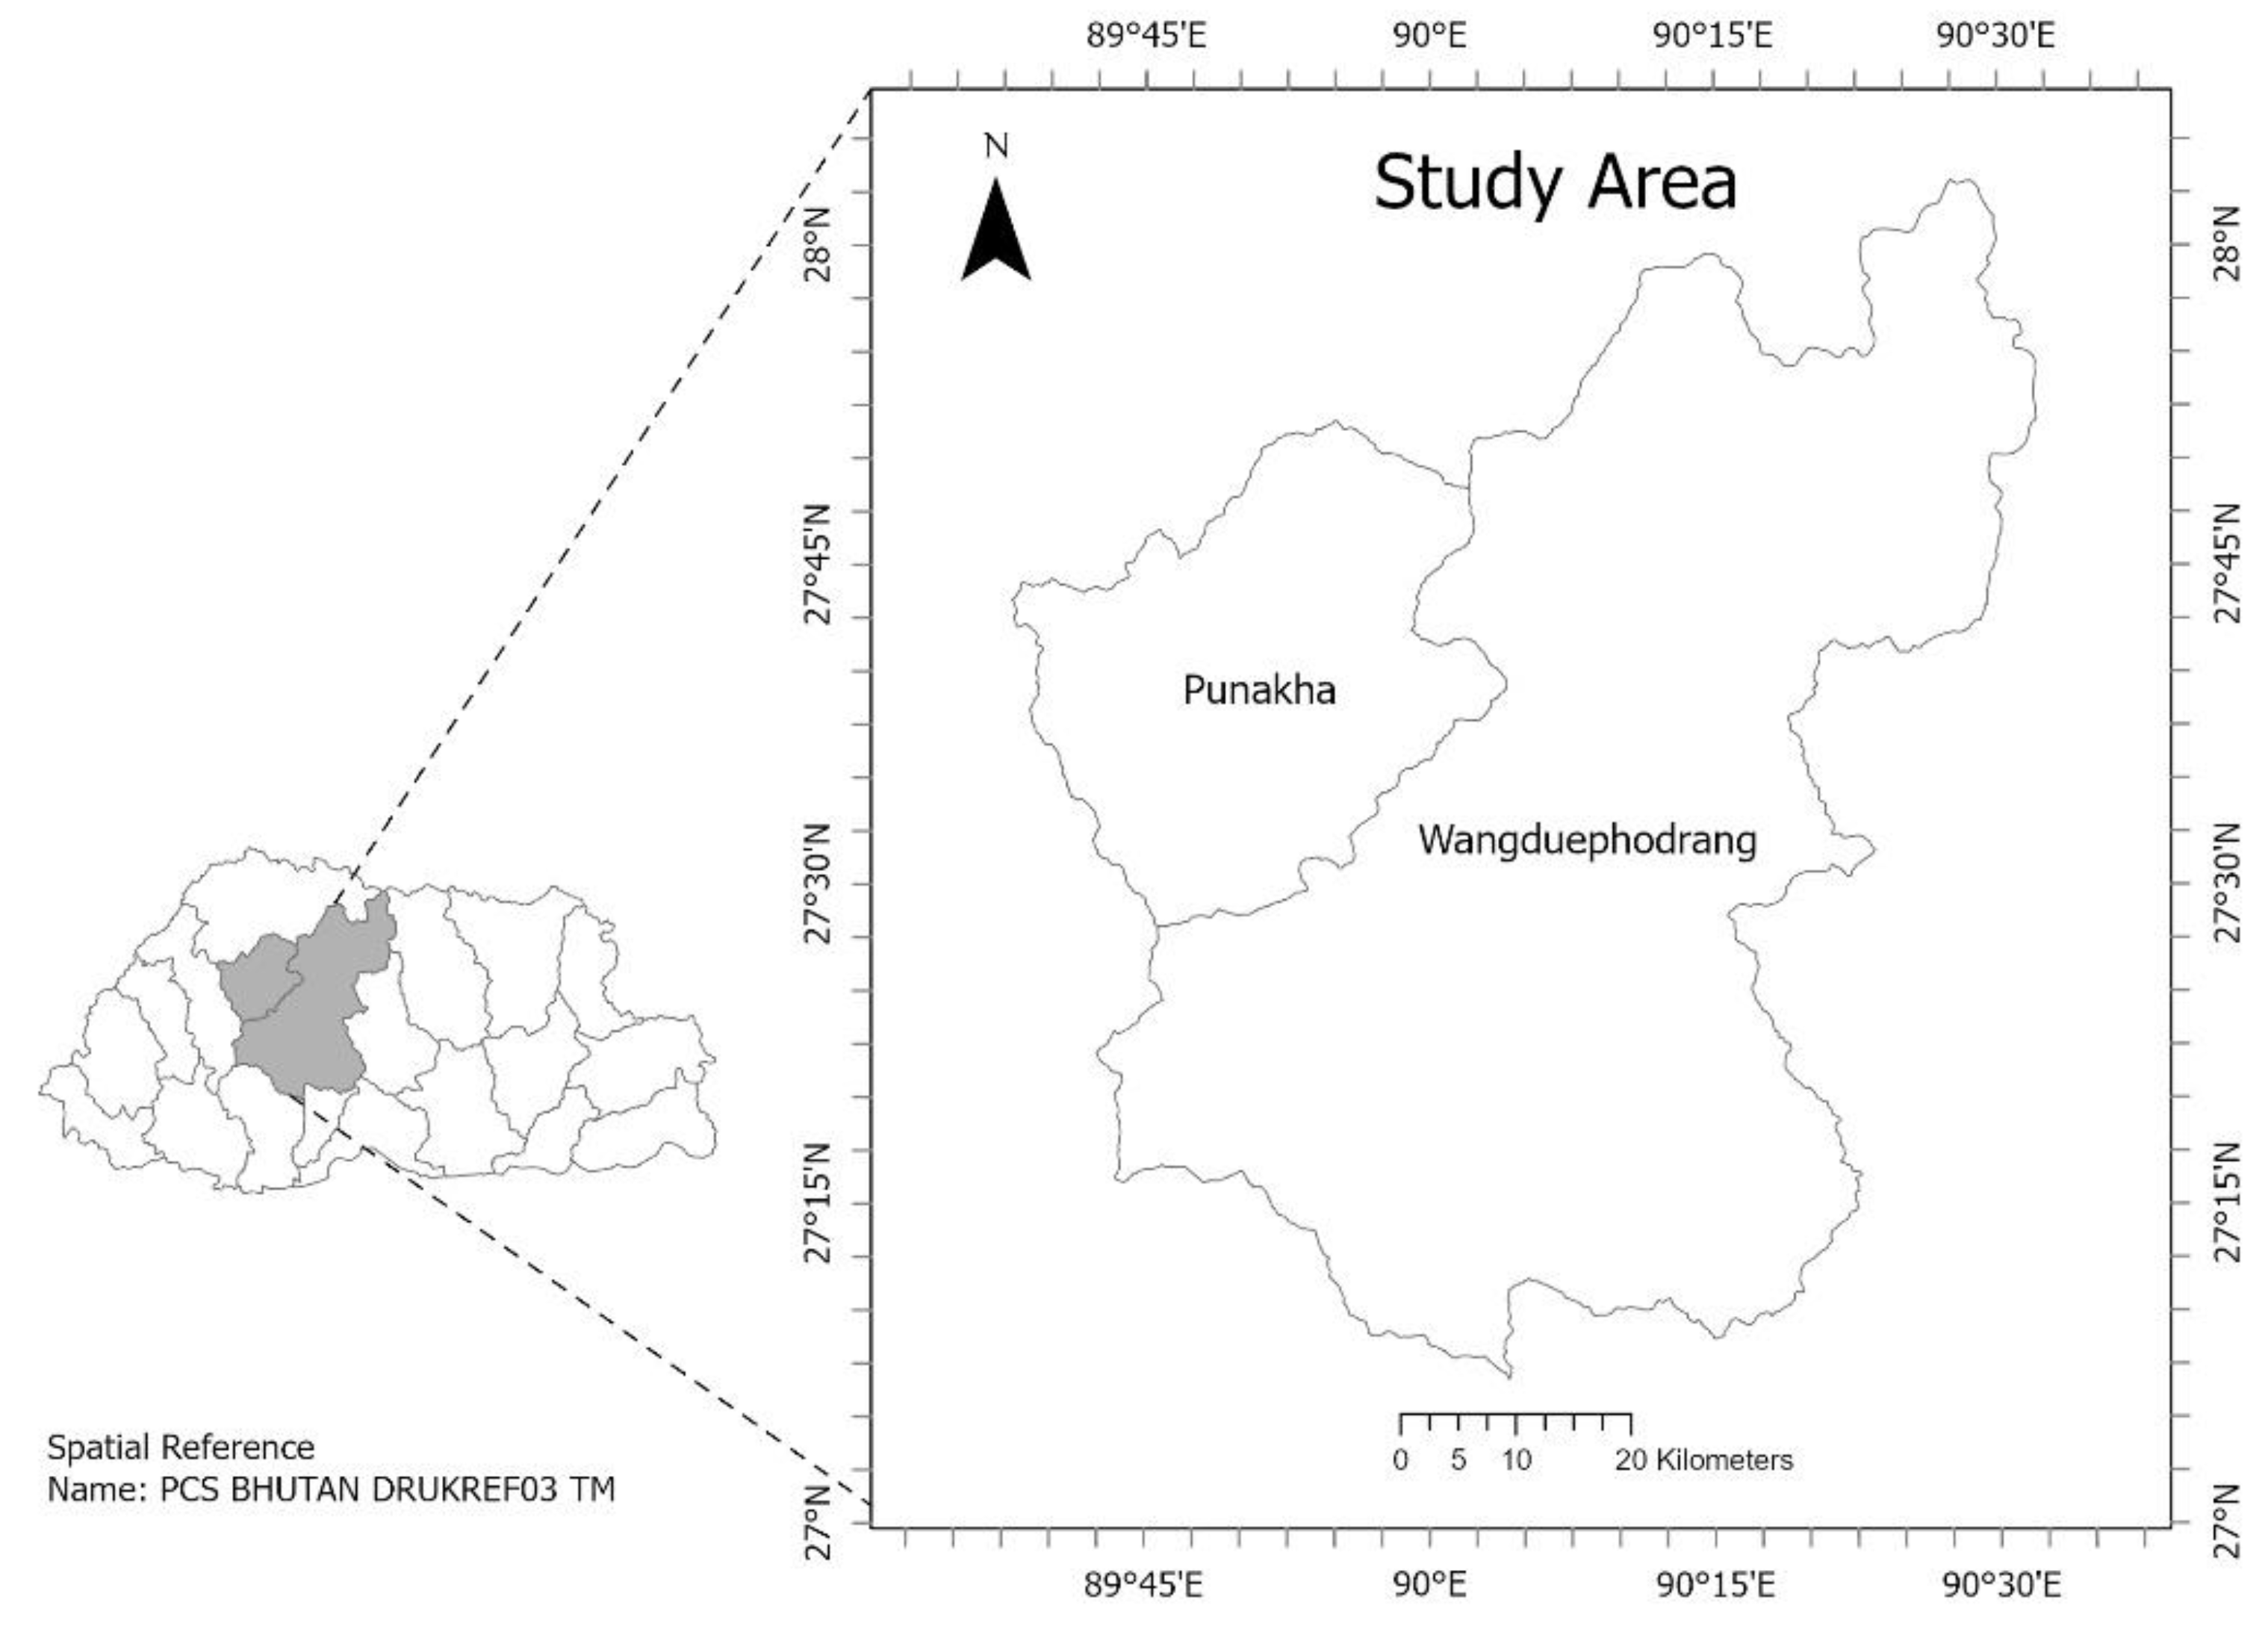
As shown in Figure 1, Punakha and Wangdue Phodrang districts are situated between 800 - 2500 metres above sea level in western-central Bhutan. The Punakha-Wangdue valley commonly experiences wet summers and dry winters due to its subtropical climate (Chhogyel & Bajgai, 2016). The favourable climatic and soil conditions of the districts allow for the growth of various cereals and fruits of which rice, wheat, mustard, potato and citrus are major cash crops cultivated (Punakha Dzongkhag Administration, 2019; Wangdue Phodrang Dzongkhag Administration, 2018).
2.2. Satellite Data Acquisition
Atmospheric correction of satellite data is an important step that needs to be conducted before it is used to reduce error caused by particles present in the atmosphere (Makarau et al., 2014). So, multi-spectral atmospherically corrected surface reflectance [SR] data of Landsat 7 Enhanced Thematic Mapper [ETM+] which were processed using Landsat Ecosystem Disturbance Adaptive Processing System [LEDAPS] algorithm version 3.4.0 for year 2005 and 2010 and atmospherically corrected surface reflectance data of Landsat 8 Operational Land Imager/Thermal Infrared Sensor [OLI/TIRS] using Land Surface Reflectance Code [LaSRC] for the year 2015 and 2020 was acquired respectively from the Google Earth Engine [GEE] data catalogue.
Figure 1.
Study area.
2.3. Cloud Masking
As cloud cover is an unavoidable problem which blocks the optical data of satellite images (Foga et al., 2017) cloud masking was also conducted through the bitmask function using the ‘QA_PIXEL’ band of the respective satellite data in GEE.
2.4. Image Classification
ArcGIS 10.8 was used to perform the LULC classification processes of the acquired images. A supervised classification method where pixels of images are compared and matched with known pixels of interest to assemble them and generate different classes was used to classify the images (Palaniswami et al., 2006). Fifty training sites were defined from the satellite image and merged together to create individual classes and then create a signature file to perform maximum likelihood classification. Five different classes were used to generate the LULC map of respective images namely Vegetation, Agricultural land, Snow cover, Built up and Barren area.
2.5. Accuracy Assessment of Classification
Accuracy assessment is a critical step in image classification in remote sensing to quantitively evaluate how the generated classes are assigned with correct real world land classes (Rwanga & Ndambuki, 2017). The accuracy of the image classification was determined through the kappa statistic as shown in equation 1 by generating 200 random points and comparing it with the basemap of ArcGIS (Rwanga & Ndambuki, 2017).
where, i is the class number, n is the total number of classified pixels that are being compared to actual data, nii is the number of pixels belonging to the actual data class i, that were classified with a class i, Ci is the total number of classified pixels belonging to class i and Gi is the total number of actual data pixels belonging to class i.
3. Data Analysis
3.1. Change Detection of LULC
The area statistics of all the classes of classified images were calculated using the raster calculator of respective years in ArcGIS. The rate of change of land usage from 2005 to 2020 use was determined by categorizing the study years into three time periods 2005-2010, 2010-2015 and 2015-2020 as a percentage of decrease or increase from the previous year as shown in equation 2 (Kafi et al., 2014).
where Yi is the first year and Yii is the second year.
3.2. Relative Conversion Index [RCI] of Agricultural Land
The intensity of agriculture land conversion in Punakha-Wangdue valley to other land uses was quantified using the Relative Conversion Index (equation 3) as described by Susilo (2016).
where RDk is the proportion of conversion of agricultural land in each sub-district (Gewog) (equation 3.1) and RTk is the proportion of agricultural land conversion in the entire study area (equation 3.2). The intensity of agricultural land conversion was also visually represented on a map by categorizing the RCI values as Low, Moderate and High (Figure 4).
3.3. Change in Paddy Production
Data of total paddy production from 2005 to 2021 for Punakha and Wangdue Phodrang respectively was extracted from annual agriculture statistics publications and was used to calculate the change in paddy production as a percentage from a previous year to a given year.
where Yi is the first year and Yii is the second year.
3.4. Calculation of Rice Self-Sufficiency Ratio
The rice self-sufficiency ratio for Punakha and Wangdue Phodrang was carried out using equation 5 as described by Gyeltshen et al. (2022) for 2016 to 2021.
where, DRP is the domestic rice production and TRC is the total rice consumption.
The domestic rice production was calculated by obtaining total paddy production data for Punakha and Wangdue Phodrang respectively from 2016 to 2021 from NSB (2021) and adjusted for rice milling recovery of 65% (Chhogyel et al., 2015; Gyeltshen et al., 2022).
The total rice consumption was determined using equation 6 as described by Firmansyah et al. (2021) for 2016 to 2021.
Since there was no official rice per capita consumption figure for Bhutan, the average national rice consumption per capita was taken as 147.7 kg as calculated by Gyeltshen et al. (2022). The regional population data for Punakha and Wangdue districts from 2016 to 2021 were obtained from NSB (2019).
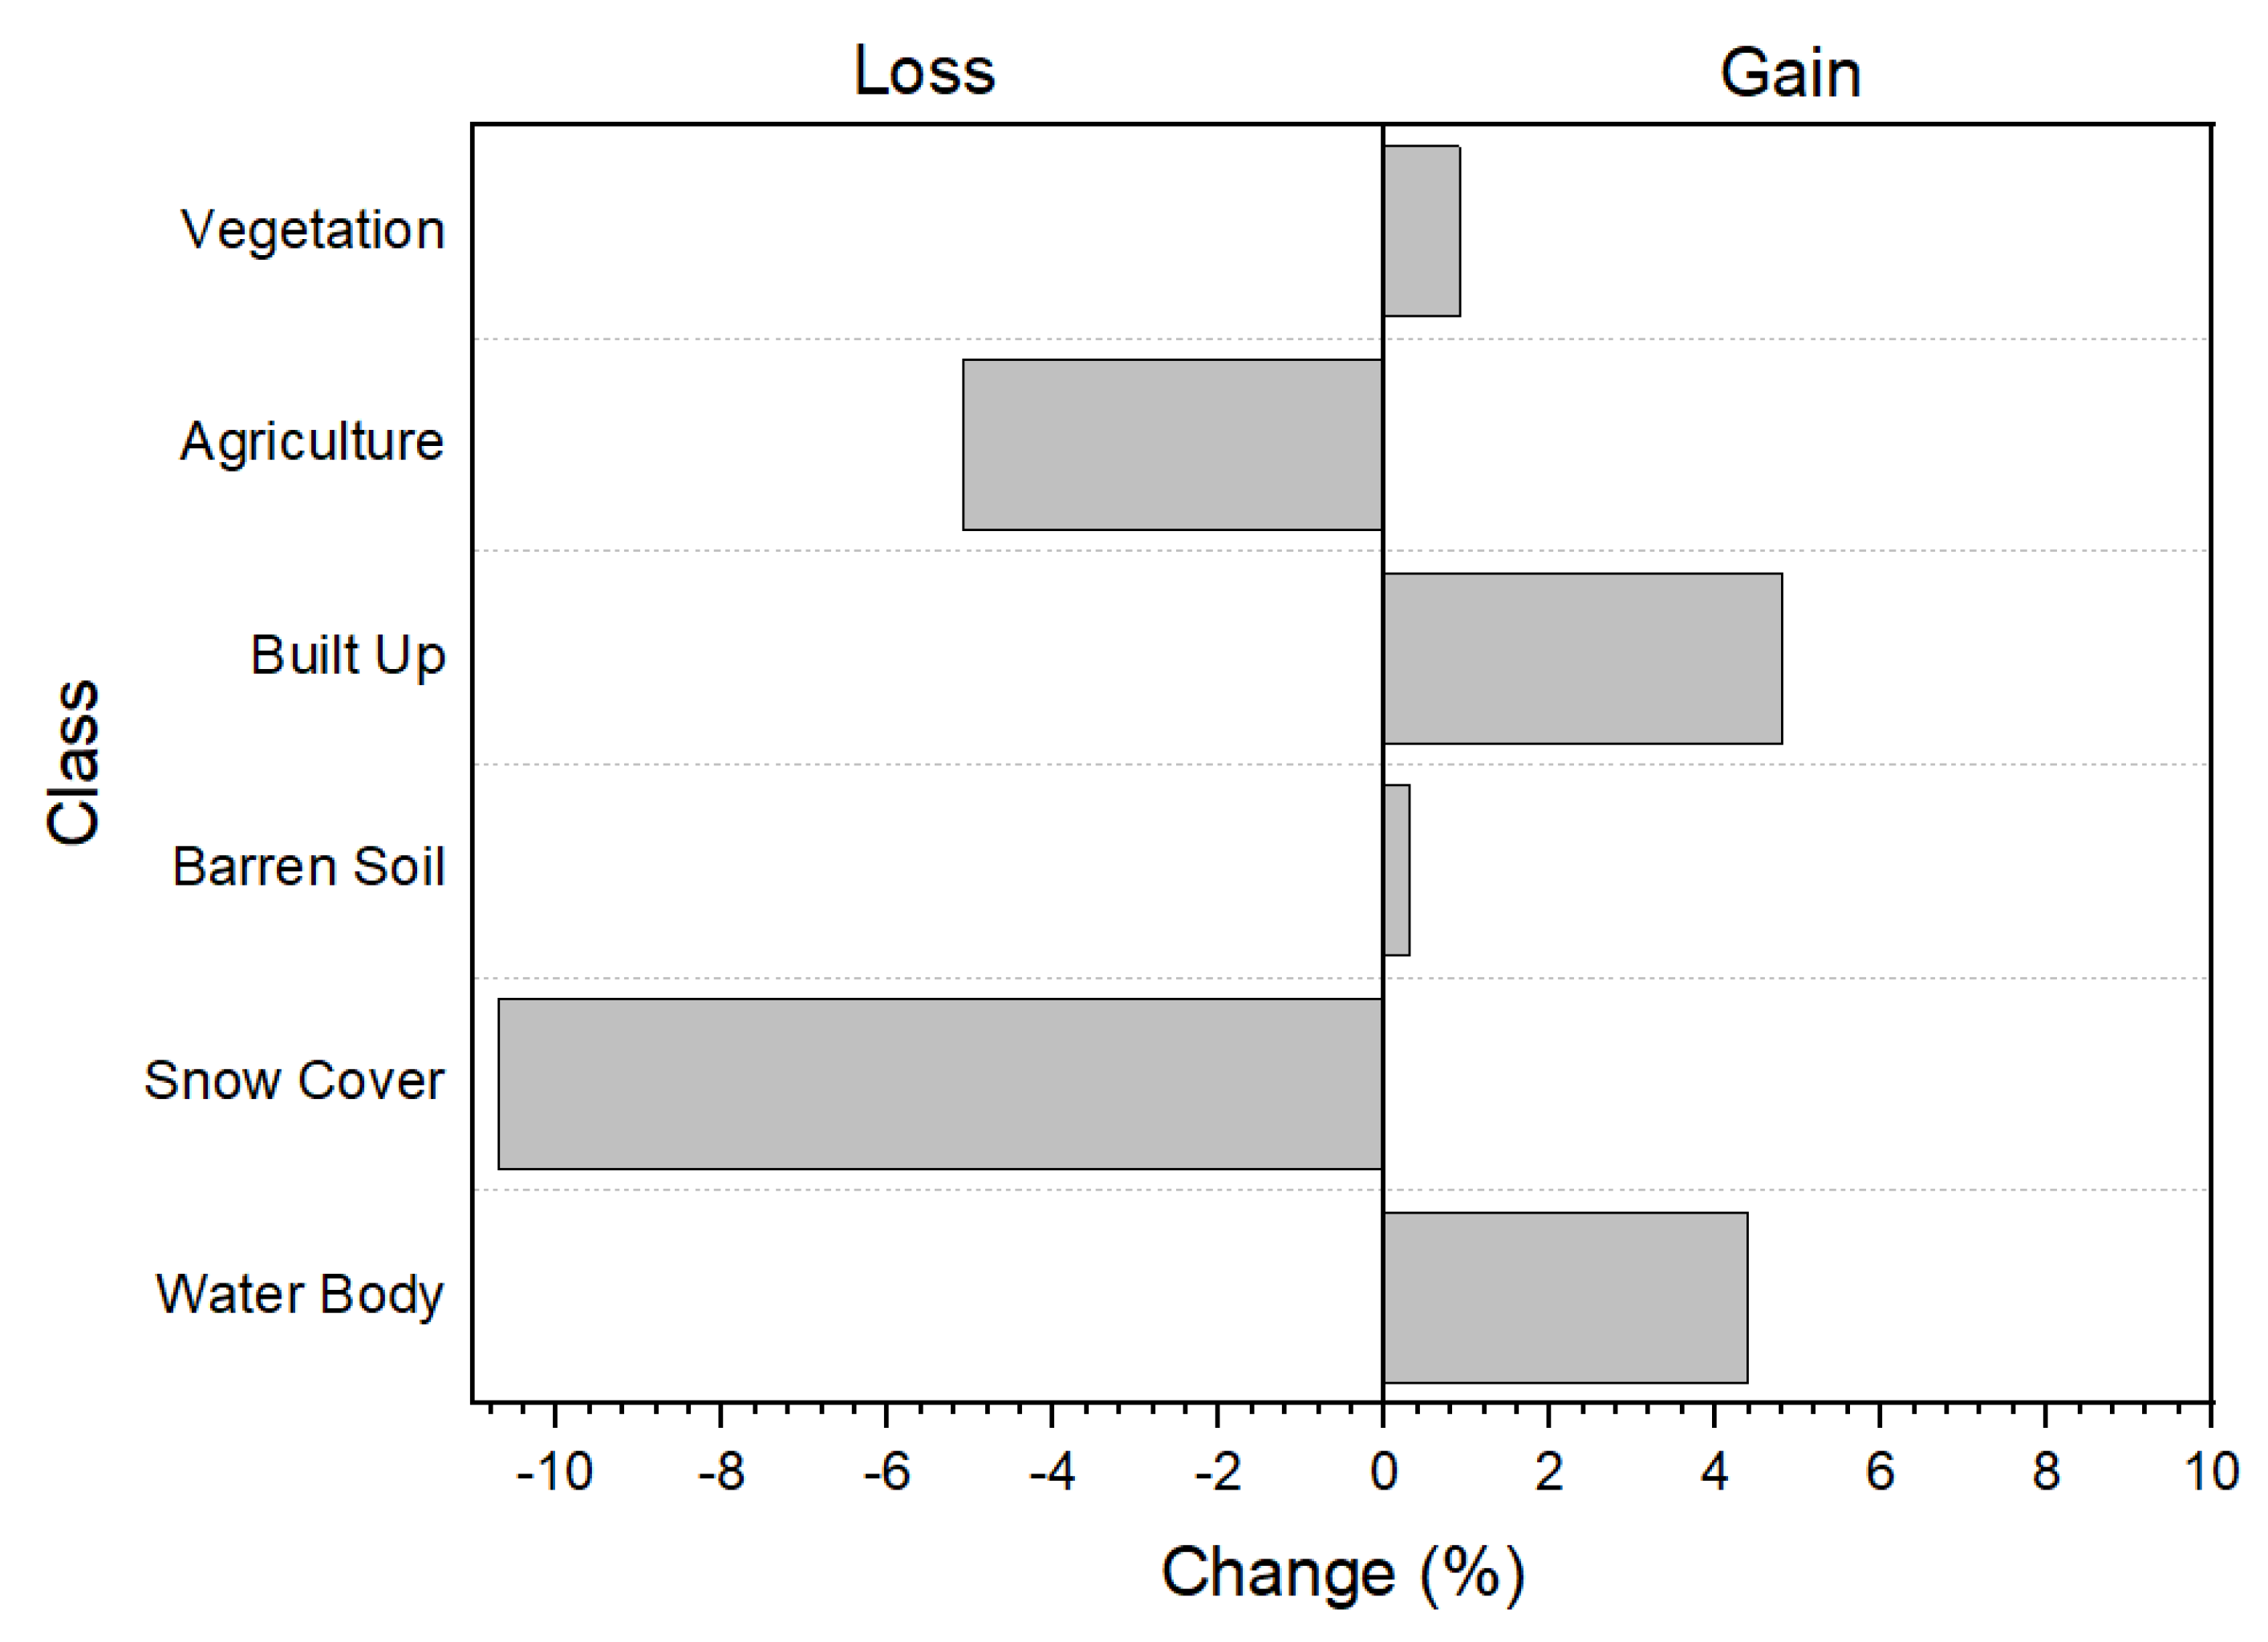
Figure 2.
Gain/Loss percent of individual classes between 2005-2020.
4. Results and Discussion
4.1. Accuracy Assessment
The kappa coefficients obtained for respective years are shown in Table 1.According to McHug (2012) kappa coefficient between 0.60 to 0.79 is substantial and the kappa coefficient between 0.80 to 0.90 represents a strong level of agreement. Since the kappa coefficient obtained for respective LULC maps falls between 0.60 and 0.90, the classification accuracy can be considered to have a substantial to strong level of agreement.
4.2. Change in Land Use Land Cover Analysis
There was an overall increase in vegetation (Figure 2) where similar study conducted by Gilani et al. (2015) also found that there was a net increase in vegetation cover in Bhutan with a gain in forest cover far outweighing the loss during the entire twenty-year study period from 1990 to 2010 in which major gains were observed in Bumthang and Wangdue Phodrang districts. The global forest resource assessment 2020 report Bhutan published by FAO (2020) also reported an overall increasing trend of vegetation in the country from 1990 to 2020 which aligned with Bhutan’s reforestation effort and activities carried out during the period. However, a slight decrease in vegetation in recent years from 2015 to 2020 in the region could be attributed to anthropogenic factors such as an increase in built-up areas and other developmental activities causing deforestation and thus reduction in vegetation (Dorji et al., 2022). Multiple forest fires that occurred in 2018 in Wangdue Phodrang could also have contributed to the loss of vegetation (Zangmo, 2018). Regardless, changes in forest cover remain fairly stable due to the country's conservation efforts and reforestation schemes as directed by its development philosophy (Bruggeman et al., 2016).
Agricultural land on the other hand reduced by 5.1% (Figure 2). The findings are in line with Yangchen et al. (2015) where the authors found a significant reduction in agriculture area in the country from 14% to 8% from 2000 to 2013. Another study conducted by Nepal (2024) to see the LULC change in Bhutan from 1930-2020 also points to the reduction in agricultural area citing the influence of urbanization and shift in land-use practices. The development of Bajothang town in 2008 required the conversion of 15 ha of fairly flat agricultural wetland which added to the declining trend of agriculture area in the region (Wangzom & Zangmo, 2018). According to Tenzin et al. (2019), challenges posed by climate change such as erratic rainfall patterns, windstorms and reduced water availability are a threat, particularly for Bhutanese agriculture systems.
Bhutan has seen a gradual increase in built-up areas over the decades as major planning for infrastructure development started in the 1960s (Wangchuk & Turner, 2019). The LULC analysis reveals that there was a rise in builit-up area by 4.8% in the region (Fig 1). As growing population leads to more and rapid development pressure for basic amenities, transportation facilities, entertainment and others infrastructure (Tobgye & Piyathamrongchai, 2019) the growth of urban population from 2,292 to 7,046 and 7,522 to 9,880 in Punakha and Wangdue Phodrang respectively could have driven the incremental growth of built up in the region. The reallocation and development of the new Bajothang town phase one also could have contributed to the rise of built up areas in the region (Wangzom & Zangmo, 2018). Construction of major hydropower projects such as Punatshangchu Hydroelectric Project I [PHP-I] that started in 2008 and PHP-II in 2010 in the region have also required the development of offices and labour settlements causing the built up areas to expand (Tshering, 2012).
Barren area in the region also increased (Figure 2) over the study period which according to Wang et al. (2018) could be attributed to the increased fallowing of lands that are adjacent to urban areas in anticipation of future town growth. Exposure of bare soils due to excavation and debris dumping activities carried out during huge construction projects such as PHP-I and PHP-II could have added to the barren area in the later year of the study period in the region (Wangdi, 2014).
The findings of the overall declining trend of snow cover in the region are in accordance with the findings of Gurung et al. (2011) where average Snow Cover Area [SCA] for the period between 2002 to 2010 was found to be decreasing in the country. Similar trends were also observed by Mahagaonkar et al. (2017) where they suggest evidence of extensive glacial retreats due to warming temperatures in the Himalayas of Bhutan. According to Slatyer et al. (2022), the rise in global temperature is one of the major factors responsible for widespread decline in snow cover regimes around the world. So, the decline in snow cover in the region could be attributed to rising air temperature over the study period in the region (NCHM, 2019).
Figure 3.
LULC transition map between 2005-2010, 2010-2015, 2015-2020.
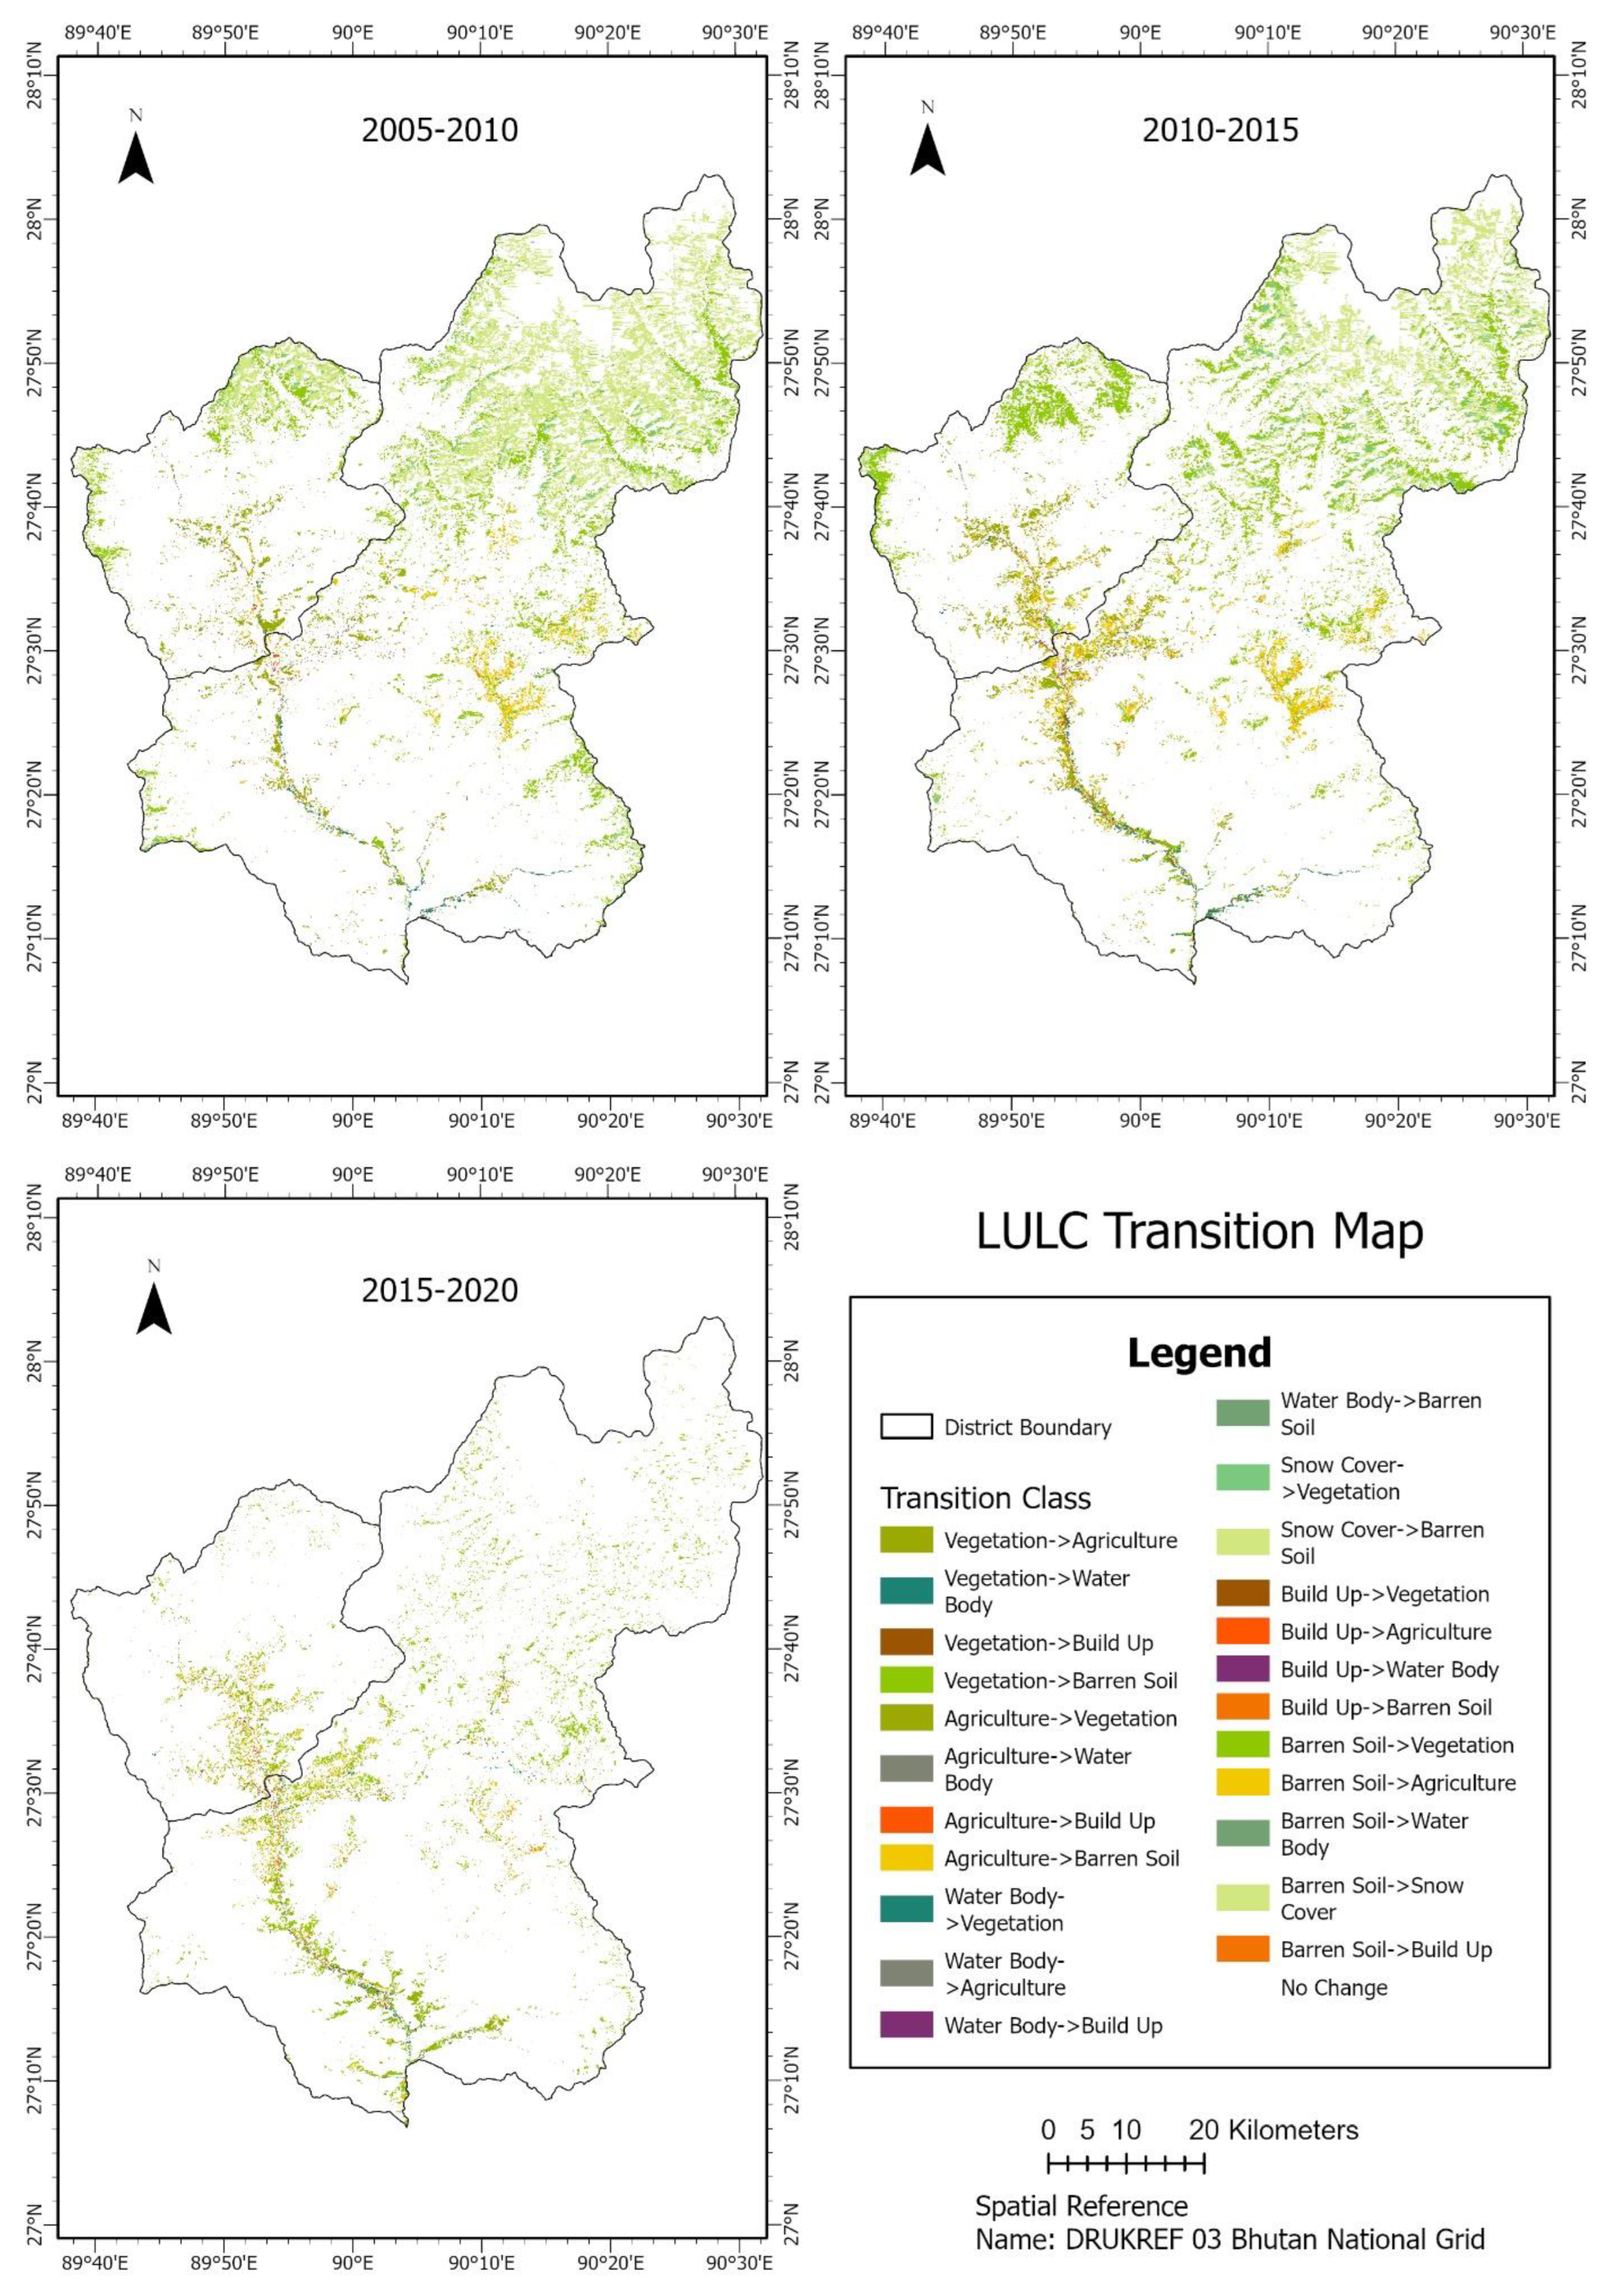

Table 2.
Change in area of individual classes between 2005-2010 and 2010-2015.
| Class | 2005-2010 | 2010-2015 | ||||
| Area (ha) | Change (%) | Area (ha) | Change (%) | |||
| From | To | From | To | |||
| Vegetation | 348983.3 | 355595.1 | 1.9% | 355595.1 | 355906.6 | 0.1% |
| Agriculture | 12660.6 | 12539.5 | -1.0% | 12539.5 | 12281.7 | -2.1% |
| Water Body | 2114.2 | 2218.0 | 4.9% | 2218.0 | 2291.9 | 3.3% |
| Snow Cover | 30728.1 | 27235.3 | -11.4% | 27235.3 | 28210.4 | 3.6% |
| Built Up | 1155.5 | 1169.0 | 1.2% | 1169.0 | 1178.9 | 0.8% |
| Barren Area | 119652.5 | 116537.2 | -2.6% | 116537.2 | 115424.6 | -1.0% |
Table 3.
Change in area of individual classes between 2015-2020 and 2005-2020.
| Class | 2015-2020 | 2005-2020 | ||||
| Area (ha) | Change (%) | Area (ha) | Change (%) | |||
| From | To | From | To | |||
| Vegetation | 355906.6 | 352366.0 | -1.0% | 348983.3 | 352366.0 | 1.0% |
| Agriculture | 12281.7 | 12023.5 | -2.1% | 12660.6 | 12023.5 | -5.0% |
| Water Body | 2291.9 | 2208.1 | -3.7% | 2114.2 | 2208.1 | 4.4% |
| Snow Cover | 28210.4 | 27445.7 | -2.7% | 30728.1 | 27445.7 | -10.7% |
| Built Up | 1178.9 | 1211.7 | 2.8% | 1155.5 | 1211.7 | 4.9% |
| Barren Area | 115424.6 | 120078.4 | 4.0% | 119652.5 | 120078.4 | 0.4% |
4.3. Relative Conversion Index Analysis of Agriculture Land
The areas with higher intensity of agricultural land conversion are spatially situated in the central regions of the study area whereas areas with lower intensity of agricultural land conversion are situated at the northern and eastern outskirts of the Punakha-Wangdue region (Figure 4). According to Chen et al. (2021), urbanisation influences the information entropy of land use structure disturbing the orderly natural landscape causing the land use intensity and transition to rise as the area transitions into a semi-artificial landscape before becoming fully artificial.
Figure 4.
Intensity of agriculture land conversion in Punakha and Wangdue Phodrang from 2005 to 2020.
Figure 4.
Intensity of agriculture land conversion in Punakha and Wangdue Phodrang from 2005 to 2020.
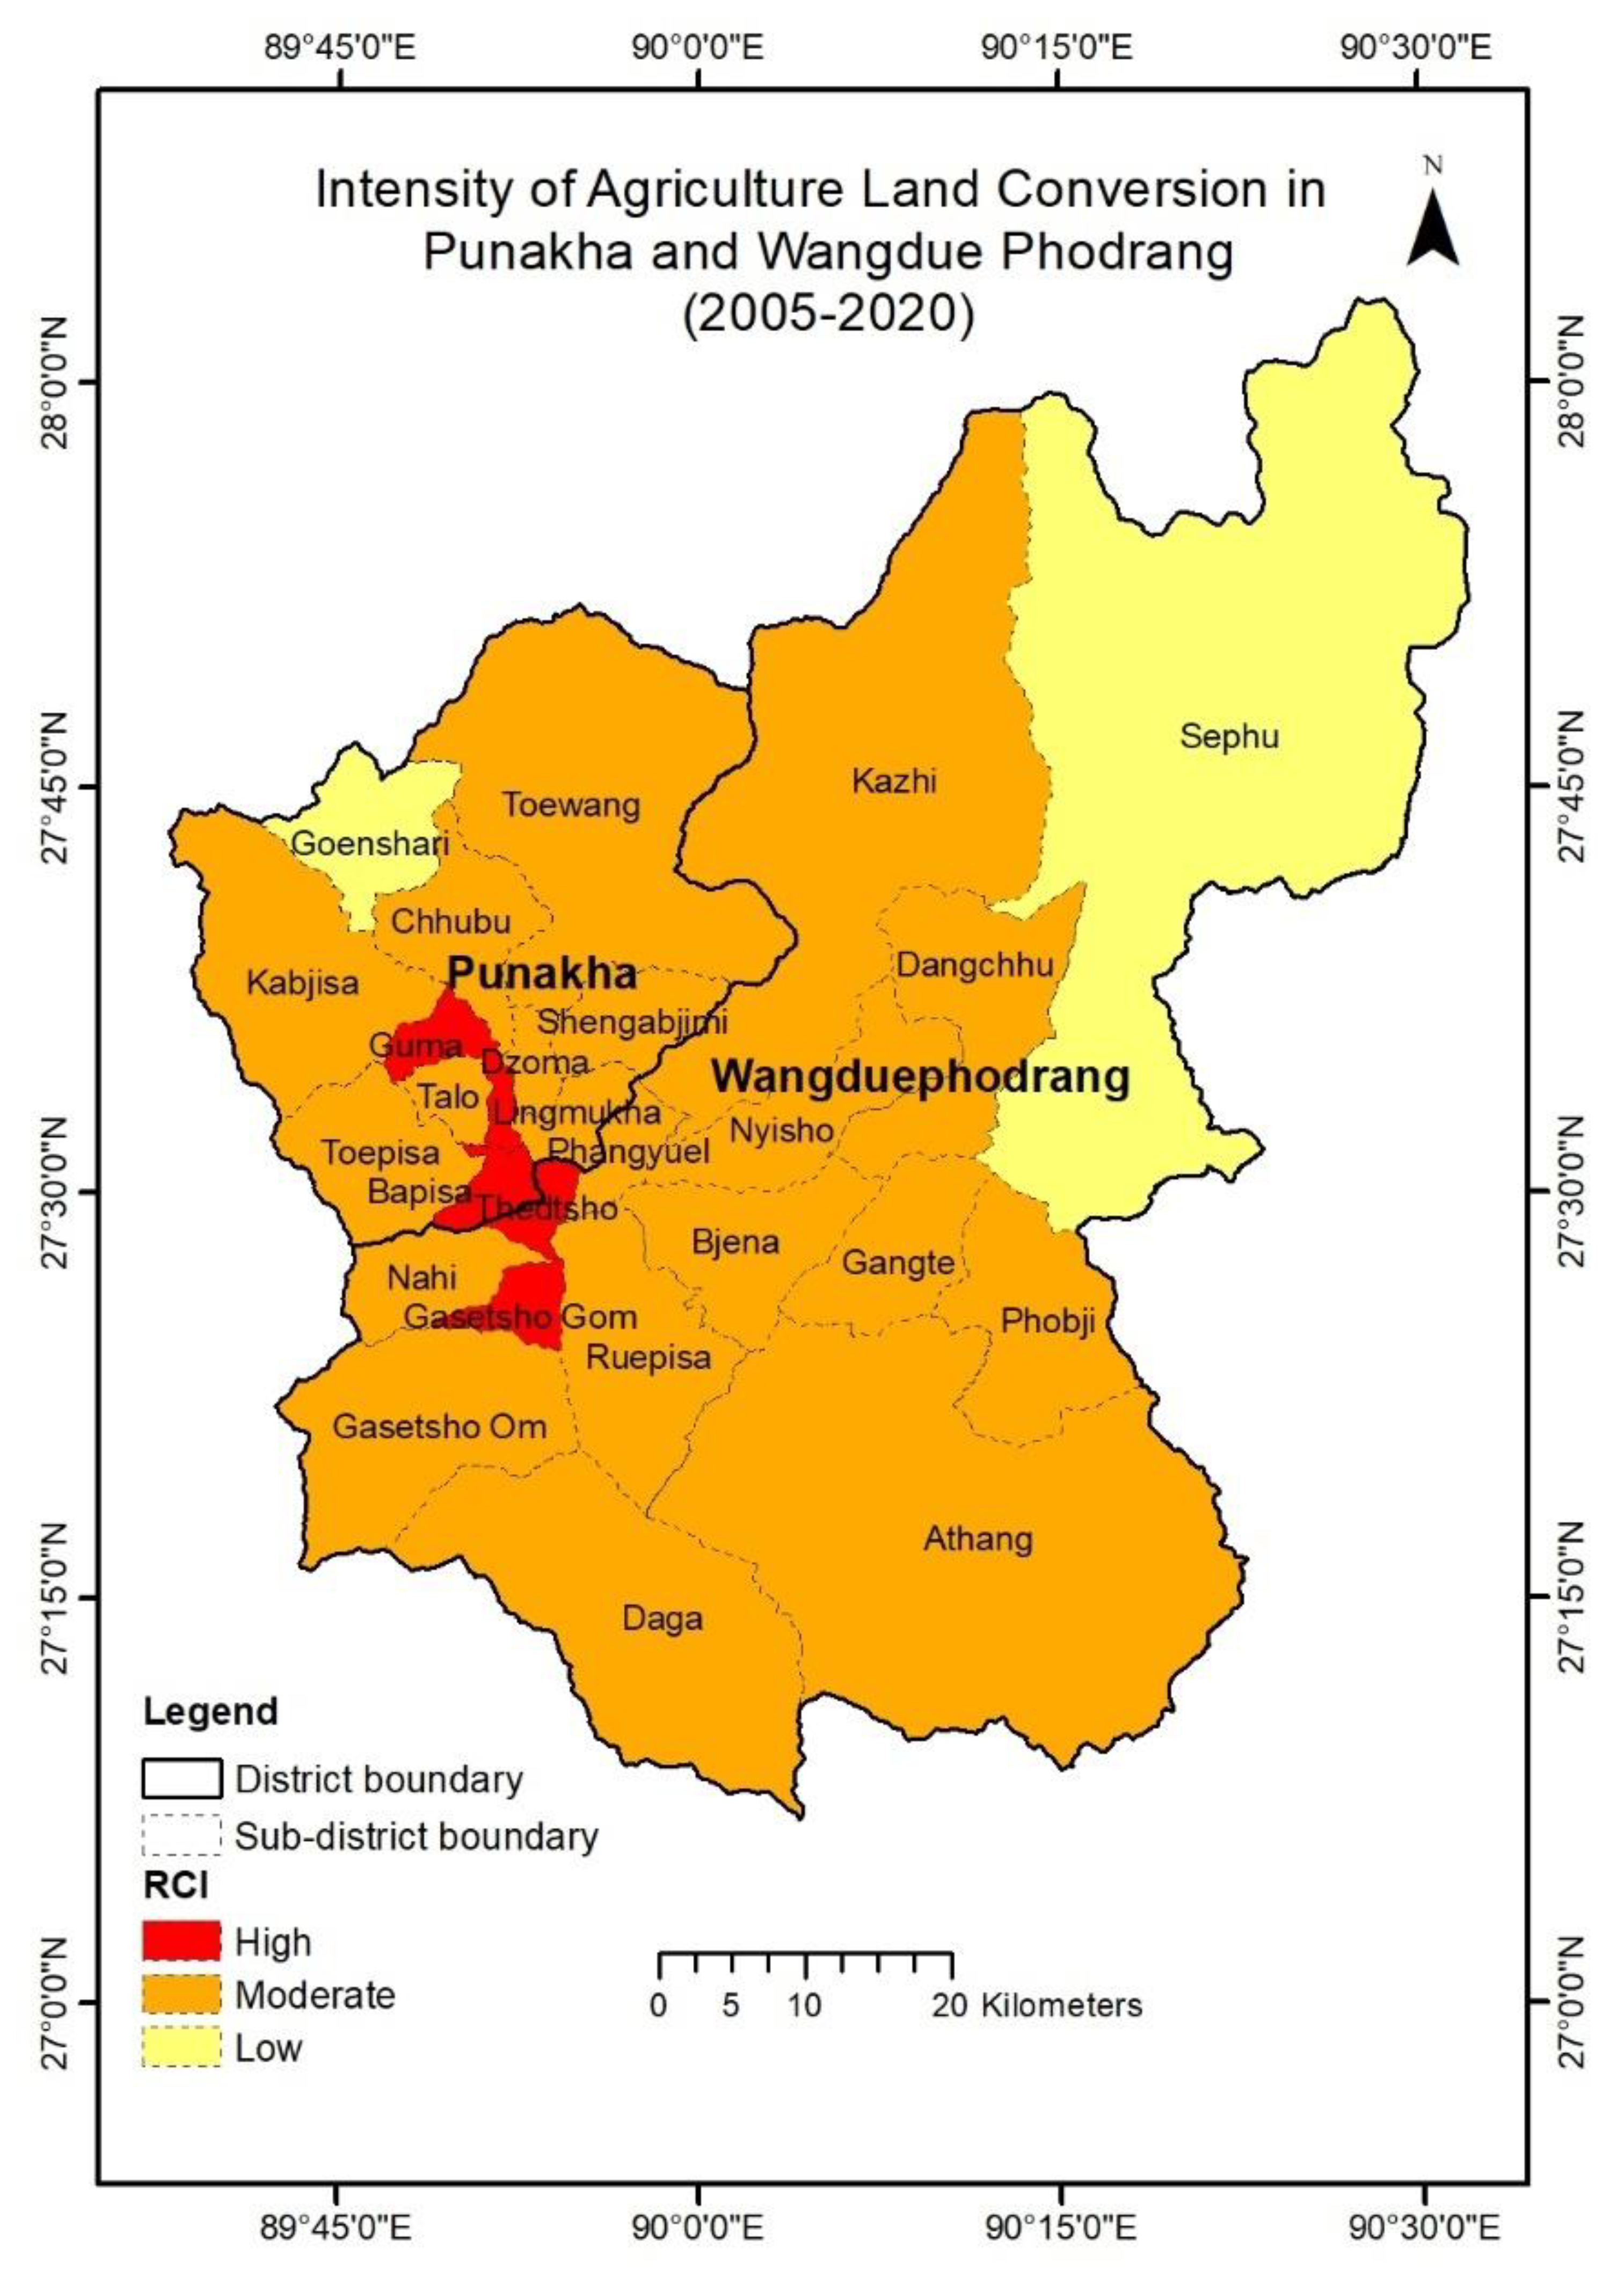
This phenomenon explains the concentration of Gewogs having high agricultural land conversion intensities at the central lower region as there are numerous clusters of settlements present at the location with key towns that are Bajothang and Khuruthang at Thoedtsho and Guma Gewogs respectively. Similarly, Bapisa Gewog encompassing key roadside stop point town Lobesa which connects people travelling via road from northern, southern and eastern Bhutan has also experienced significant conversions. Such influences were also observed by Naab et al. (2013) where agricultural lands were repurposed in peri-urban areas.
4.4. Change in Paddy Production
Paddy production in the region shows a fluctuating trend over the years from 2005 to 2021. There was a net reduction of paddy production in Wangdue Phodrang districts by 7.2% between 2005 to 2021. The district recorded the highest paddy production in 2014 with 9173 metric tonnes while the lowest was in 2011 with 2783 MT. Punakha district also had a decrease in overall paddy production by 5.9% compared to 2005 in 2021. In 2018, the district achieved its peak production of 16,389 MT of paddy, whereas the lowest production was observed in 2021, amounting to 6,509 MT (Figure 5).
Similar trend of initial increase in paddy production and decrease in recent years was also observed Gyeltshen et al. (2022). The initial positive trend of paddy production could be due to efforts taken by the government and agriculture research centres to release improved and high yielding rice varieties which in turn increased the productivity (per area production) (Tshering et al., 2021) in the districts as Chhogyel and Bajgai (2016) reported that the adoption of modern rice varieties stood at 68% and 62% in Wangdue Phodrang and Punakha respectively. However, reduced production in recent years could be attributed to decrease in harvest area due to increased fallowing (Ngawang, 2018), human wildlife conflict (Wangchuk et al., 2023), labour shortage and high production costs (Gyem et al., 2018; Tashi & Dendup, 2020), weeds and diseases (Tshewang et al., 2016), climate change (Chhogyel & Kumar, 2018) and inadequate water sources and irrigation infrastructure (Kusters & Wangdi, 2013).
4.5. Impact of LULC Change and Paddy Production on Rice Self-Sufficiency
From the rice self-sufficiency estimates drawn by calculating total rice consumption and production within the districts (Punakha and Wangdue Phodrang) with adjustments taken for rice milling recovery of 65%, it showed a declining trend for both Punakha (Figure 6) and Wangdue Phodrang (Figure 6) from 2016 to 2021. Over this period, fluctuations in production and consumption dynamics are evident. In 2016 and 2017, Punakha recorded significant surpluses, with production surpassing consumption by 127% and 120%, respectively, indicative of robust agricultural output exceeding local demands. However, subsequent years saw varying trends, with instances of both surplus and deficiency. Notably, in 2021, a deficiency of 6% was recorded, concerning the state of food security within the district (Figure 6).
Similarly, the results reveal a consistent pattern of deficiencies in rice production compared to consumption throughout 2016 to 2021 in Wangdue Phodrang (Figure 6). In 2016, the deficit stood at 17%, indicating a shortfall in meeting consumption demands. This trend persisted in subsequent years, with deficits of 8%, 32%, 42%, 40%, and 57% recorded in 2017, 2018, 2019, 2020, and 2021, respectively. These figures signify a widening gap between rice production and consumption, culminating in a significant deficiency by the year 2021. Such persistent deficiencies raise substantial concerns regarding food security within Wangdue Phodrang, necessitating urgent attention and strategic interventions to address rice production.
Bhutan has been striving towards attaining rice self-sufficiency though figures show otherwise with increasing rice imports with rice self-sufficiency ratios [SSR] calculated well below 50% between 2005 and 2019 (Gyeltshen et al., 2022). According to Biswajit et al. (2013), several other neighbouring South Asian countries such as Nepal, Bangladesh and Sri Lanka are also not rice self-sufficient except for India and Pakistan. Similarly, most African countries are also reliant on imports to meet local rice demand (Van Oort et al., 2015).
A variety of factors are responsible for influencing the paddy production and ultimately the rice SSR of a country. In a study conducted by Dawe (2013) to assess geographic determinants of rice self-sufficiency, he found that available land suitable for rice cultivation those are flat with enough water resources influences per capita production and harvest area thus increasing the rice self-sufficiency compared to those with challenging topography. This highlights the impacts that land use changes have on paddy production and ultimately rice self-sufficiency for particularly those countries with difficult terrain where suitable land is already limited as in Bhutan and Nepal (Bhandari et al., 2023). Other factors include nutrient deficiencies, poor harvest, rising cost of production, depleting water resources and environmental causes (Kumar et al., 2021). Challenges such as lack of transportation facilities, inefficient irrigation systems, and inadequate land for cultivation are also listed as core constraints for paddy cultivation in rural areas of Malaysia (Echoh et al., 2017).
In the Bhutanese context, pertinent rice production challenges apart from limited arable agricultural area are land use change where social and economic development is causing the loss of prime wetland and the preference of farmers to grow more economically competitive and less resource intensive crops instead (NSB, 2021), rural-urban migration causing labour shortages driving costs (Yoezer, 2019), vulnerability of Bhutanese rice farming systems to climate change impacts as a major portion of rice growers are dependent on monsoon and spring water for irrigation (Chhogyel & Kumar, 2018) and price volatility due to limited domestic and international trade options (Chhogyel et al., 2015; Gyem et al., 2018).
All these findings and evidences solidify the direct relation of land use change on paddy production within the districts as the region experienced declining production with increasing land use change be it fallowing, conversion to other uses or shift in agriculture systems where alternative crops are cultivated instead of paddy over the years. One key take from this study is the central role land use change have on paddy production as it encompasses all other influencing factors thus determining the paddy production (Figure 7) as the harvest area is strongly correlated to production (Yasar & Siwar, 2016). With the districts and country as a whole experiencing change in land use of which fallowing and conversion are dominant (Ngawang, 2018) it is a growing threat to agricultural production including paddy with findings from this study pointing its influence on production and its impact on rice self-sufficiency over the years.
5. Conclusions
The geospatial assessment revealed that major land use land cover changes happened in Punakha and Wangdue Phodrang districts from 2005 to 2020. Relative conversion index analysis of agriculture land indicated that higher conversion intensity was spatially located in the central areas of the region while lower intensity was observed at the outskirt areas of the region. Yearly estimates of the rice self-sufficiency ratio within the districts reveal an increasing deficit trend with a rice surplus of 127% in 2016 falling to a deficit of 6% in 2021 for Punakha while previously rice deficit of 17% in 2016 declined further to 57% in 2021 for Wangdue. Such trends though influenced by the interaction of various biophysical, social, economic and political factors, demand urgent intervention to reduce impacts.
Funding
No funding was there for this research.
Acknowledgement
I would like to thank the District Agriculture Officers and extensions of Punakha and Wangdue.
References
- Bhandari, S., Bhandari, S., Sanat, K. C., Badu, R., Dhital, P. R., & Khanal, A. (2023). Assessment of agricultural mechanization status in rice production and its challenges in the western Nepal. Archives of Agriculture and Environmental Science, 8(2), 236–243. [CrossRef]
- BHUTAN NATIONAL URBANIZATION STRATEGY. (2008). Ministry of Works and Human Settlement, Royal Government of Bhutan.
- Bishwajit, G., Sarker, S., Kpoghomou, M.-A., Gao, H., Jun, L., Yin, D., & Ghosh, S. (2013). Self-sufficiency in rice and food security: A South Asian perspective. Agriculture & Food Security, 2(1), 10. [CrossRef]
- Bruggeman, D., Meyfroidt, P., & Lambin, E. F. (2016). Forest cover changes in Bhutan: Revisiting the forest transition. Applied Geography, 67, 49–66. [CrossRef]
- Chhogyel, N., & Bajgai, Y. (2016). Modern rice varieties adoption to raise productivity: A case study of two districts in Bhutan. SAARC Journal of Agriculture, 13, 34. [CrossRef]
- Chhogyel, N., Ghimiray, M., Wangdue, K., & Bajgai, Y. (2015). Enhancing Bhutanese rice in the domestic market through increased production and favorable pricing regime. Journal of Bhutan Studies, 32, 26–44.
- Chhogyel, N., & Kumar, L. (2018). Climate change and potential impacts on agriculture in Bhutan: A discussion of pertinent issues. Agriculture & Food Security, 7(1), 1–13. [CrossRef]
- Davis, K. F., Dalin, C., DeFries, R., Galloway, J. N., Leach, A. M., & Mueller, N. D. (2019). Sustainable pathways for meeting future food demand.
- Dawe, D. (2013). Geographic determinants of rice self-sufficiency in Southeast Asia.
- Dorji, L., Shukla, S., Wangchuk, D., Dorji, K., Gyeltshen, K., Chettri, N., Aryal, K., Khameis, M., & Al. (2022). Evaluation of Land Use/Cover Change and Urban Sprawling Pattern Using Remote Sensing and GIS: A Case Study in Thimphu, Bhutan. Civil Engineering and Architecture, 10, 2572–2579. [CrossRef]
- Echoh, D. U., Nor, N. M., Gapor, S. A., & Masron, T. (2017). Issues and problems faced by rural farmers in paddy cultivation: A case study of the Iban paddy cultivation in Kuala Tatau, Sarawak. Journal of Regional and Rural Development Planning (Jurnal Perencanaan Pembangunan Wilayah Dan Perdesaan), 1(2), 174–182. [CrossRef]
- FAO. (2020). Global Forest Resources Assessment (FRA) 2020 Bhutan. Food and Agriculture Organization.
- Firmansyah, F., Susetyo, C., Pratomoatmojo, N. A., Kurniawati, U. F., & Yusuf, M. (2021). Land use change trend of paddy field and its influence on food security in Gerbangkertosusila Region. IOP Conference Series: Earth and Environmental Science, 778(1), 012023. [CrossRef]
- Foga, S., Scaramuzza, P. L., Guo, S., Zhu, Z., Dilley Jr, R. D., Beckmann, T., Schmidt, G. L., Dwyer, J. L., Hughes, M. J., & Laue, B. (2017). Cloud detection algorithm comparison and validation for operational Landsat data products. Remote Sensing of Environment, 194, 379–390. [CrossRef]
- Foley, J. A., DeFries, R., Asner, G. P., Barford, C., Bonan, G., Carpenter, S. R., Chapin, F. S., Coe, M. T., Daily, G. C., & Gibbs, H. K. (2005). Global consequences of land use. Science, 309(5734), 570–574. [CrossRef]
- Gilani, H., Shrestha, H. L., Murthy, M. S. R., Phuntso, P., Pradhan, S., Bajracharya, B., & Shrestha, B. (2015). Decadal land cover change dynamics in Bhutan. Journal of Environmental Management, 148, 91–100. [CrossRef]
- Gyeltshen, S., Dendup, C., & Tashi, T. (2022). Rice self-sufficiency in Bhutan: An assessment. Asian Journal of Agricultural Extension, Economics & Sociology, 18–28. [CrossRef]
- Gyem, T., Chhogyel, N., & Pulami, T. M. (2018). Economic analysis of Spring rice production at Rinchengang Wangduephodrang. Bhutanese J Agric, 1(1), 58–69.
- Kafi, K. M., Shafri, H. Z. M., & Shariff, A. B. M. (2014). An analysis of LULC change detection using remotely sensed data; A Case study of Bauchi City. IOP Conference Series: Earth and Environmental Science, 20(1), 012056.
- Kumar, N., Chhokar, R. S., Meena, R. P., Kharub, A. S., Gill, S. C., Tripathi, S. C., Gupta, O. P., Mangrauthia, S. K., Sundaram, R. M., & Sawant, C. P. (2021). Challenges and opportunities in productivity and sustainability of rice cultivation system: A critical review in Indian perspective. Cereal Research Communications, 1–29. [CrossRef]
- Kusters, K., & Wangdi, N. (2013). The costs of adaptation: Changes in water availability and farmers’ responses in Punakha district, Bhutan. International Journal of Global Warming, 5(4), 387–399. [CrossRef]
- Luyssaert, S., Jammet, M., Stoy, P. C., Estel, S., Pongratz, J., Ceschia, E., Churkina, G., Don, A., Erb, K., & Ferlicoq, M. (2014). Land management and land-cover change have impacts of similar magnitude on surface temperature. Nature Climate Change, 4(5), 389–393. [CrossRef]
- Makarau, A., Richter, R., Müller, R., & Reinartz, P. (2014). Haze detection and removal in remotely sensed multispectral imagery. IEEE Transactions on Geoscience and Remote Sensing, 52(9), 5895–5905. [CrossRef]
- McHugh, M. L. (2012). Interrater reliability: The kappa statistic. Biochemia Medica, 22(3), 276–282. [CrossRef]
- Muthayya, S., Sugimoto, J. D., Montgomery, S., & Maberly, G. F. (2014). An overview of global rice production, supply, trade, and consumption. Annals of the New York Academy of Sciences, 1324(1), 7–14. [CrossRef]
- Naab, F. Z., Dinye, R. D., & Kasanga, R. K. (2013). Urbanisation and its impact on agricultural lands in growing cities in developing countries: A case study of Tamale in Ghana. Modern Social Science Journal, 2(2), 256–287.
- Nepal, T. K. (2024). Change in Bhutan’s Land Use and Land Cover from 1930-2020. West Science Social and Humanities Studies, 2(02), 267–276. [CrossRef]
- Ngawang, N. (2018). Innovative Agricultural Technologies in Bhutan. Innovative Agricultural Technologies in South Asia, 52–76.
- NSB. (2019). Dzongkhag Population Projections 2017–2027. National Statistics Bureau.
- NSB. (2021). Agriculture Survey Report. National Statistics Bureau.
- Nuissl, H., & Siedentop, S. (2021). Urbanisation and Land Use Change. In T. Weith, T. Barkmann, N. Gaasch, S. Rogga, C. Strauß, & J. Zscheischler (Eds.), Sustainable Land Management in a European Context: A Co-Design Approach (pp. 75–99). Springer International Publishing. [CrossRef]
- Oliver, T. H., & Morecroft, M. D. (2014). Interactions between climate change and land use change on biodiversity: Attribution problems, risks, and opportunities. WIREs Climate Change, 5(3), 317–335. [CrossRef]
- Palaniswami, C., Upadhyay, A. K., & Maheswarappa, H. P. (2006). Spectral mixture analysis for subpixel classification of coconut. Current Science, 1706–1711.
- Punakha Dzongkhag Administration. (2019, March 12). About Dzongkhag. http://www.punakha.gov.bt/index.php/en/about-dzongkhag.
- Rwanga, S. S., & Ndambuki, J. M. (2017). Accuracy Assessment of Land Use/Land Cover Classification Using Remote Sensing and GIS. International Journal of Geosciences, 08(04), Article 04. [CrossRef]
- Susilo, B. (2016). Map analysis and spatial statistic: Assessment of spatial variability of agriculture land conversion at urban fringe area of Yogyakarta. IOP Conference Series: Earth and Environmental Science, 47(1), 012001. [CrossRef]
- Tashi, T., & Dendup, C. (2020). RICE PRODUCTION ECONOMICS OF SUB-TROPICAL AGROECOLOGY IN SOUTHERN BHUTAN. International Journal of Agriculture and Environmental Research, 06(06), 775–790. [CrossRef]
- Tenzin, J., Phuntsho, L., & Lakey, L. (2019). Climate smart agriculture: Adaptation & mitigation strategies to climate change in Bhutan. Climate Smart Agriculture: Strategies to Respond to Climate Change; Shrestha, RB, Boktiar, S., Eds, 37–61.
- Tobgye, L., & Piyathamrongchai, K. (2019). Urban growth simulation using remote sensing, GIS, and SLEUTH urban model in Gelephu City, Bhutan. Naresuan University.
- Tshering, K. (2012). STABILTY ASSESSMENT OF HEADRACE TUNNEL SYSTEM FOR PUNATSANGCHHU II HYDROPOWER PROJECT, BHUTAN. Institutt for geologi og bergteknikk.
- Tshering, L., Tshomo, S., Dorji, S., & Dendup, C. (2021). Impact of improved rice variety on productivity and crop diversity: A case of Singye Gewog (Block) in Sarpang District of Southern Bhutan. Asian Journal of Agricultural Extension, Economics & Sociology, 39(1), 96–104. [CrossRef]
- Tshewang, S., Sindel, B. M., Ghimiray, M., & Chauhan, B. S. (2016). Weed management challenges in rice (Oryza sativa L.) for food security in Bhutan: A review. Crop Protection, 90, 117–124. [CrossRef]
- Van Oort, P. A. J., Saito, K., Tanaka, A., Amovin-Assagba, E., Van Bussel, L. G. J., Van Wart, J., De Groot, H., Van Ittersum, M. K., Cassman, K. G., & Wopereis, M. C. S. (2015). Assessment of rice self-sufficiency in 2025 in eight African countries. Global Food Security, 5, 39–49. [CrossRef]
- Wang, X., Liu, S., Du, P., Liang, H., Xia, J., & Li, Y. (2018). Object-Based Change Detection in Urban Areas from High Spatial Resolution Images Based on Multiple Features and Ensemble Learning. Remote Sensing, 10(2), Article 2. [CrossRef]
- Wangchuk, D., & Turner, M. (2019). Aligning top-down and bottom-up in development planning: The case of B hutan. Public Administration and Development, 39(2), 59–68. [CrossRef]
- Wangchuk, S., Bond, J., Thwaites, R., & Finlayson, M. (2023). Exploring Human–Wildlife Conflict and Implications for Food Self-Sufficiency in Bhutan. Sustainability 2023, 15, 4175. [CrossRef]
- Wangdi, T. (2014). Land use change effect on habitat and White-bellied Heron population by hydropower project along Punatsangchu. partial fulfillment of the requirements for the B. Sc. Forestry Programme ….
- Wangdue Phodrang Dzongkhag Administration. (2018, March 12). About District. http://www.wangduephodrang.gov.bt/index.php/about-district.
- Wangzom, D., & Zangmo, S. (2018). Bhutan’s Urban Towns with Integration of Agricultural Land Use. 2018 International Conference and Utility Exhibition on Green Energy for Sustainable Development (ICUE), 1–6.
- Yangchen, U., Thinley, U., & Wallentin, G. (2015). Land use land cover changes in Bhutan: 2000-2013. Occasional Publication No 1.
- Yasar, M., & Siwar, C. (2016). Paddy Field Conversion in Malaysia: Issues and Challenges. Rona Teknik Pertanian, 9(2), Article 2. [CrossRef]
- Yoezer, M. K. (2019). EFFICIENCY AND TECHNICAL CHANGE IN THE BHUTANESE RICE SECTOR: A MALMQUIST TOTAL FACTOR PRODUCTIVITY APPROACH.
- Zangmo, R. (2018). Wangdue reports three forest fires last week. Kuensel Online. https://kuenselonline.com/wangdue-reports-three-forest-fires-last-week/.
Figure 5.
Paddy production in Punakha and Wangdue from 2005 to 2021.

Figure 6.
Rice production, consumption and surplus/deficiency percent for Punakha (A) and Wangdue Phodrang (B) from 2016 to 2021.
Figure 6.
Rice production, consumption and surplus/deficiency percent for Punakha (A) and Wangdue Phodrang (B) from 2016 to 2021.
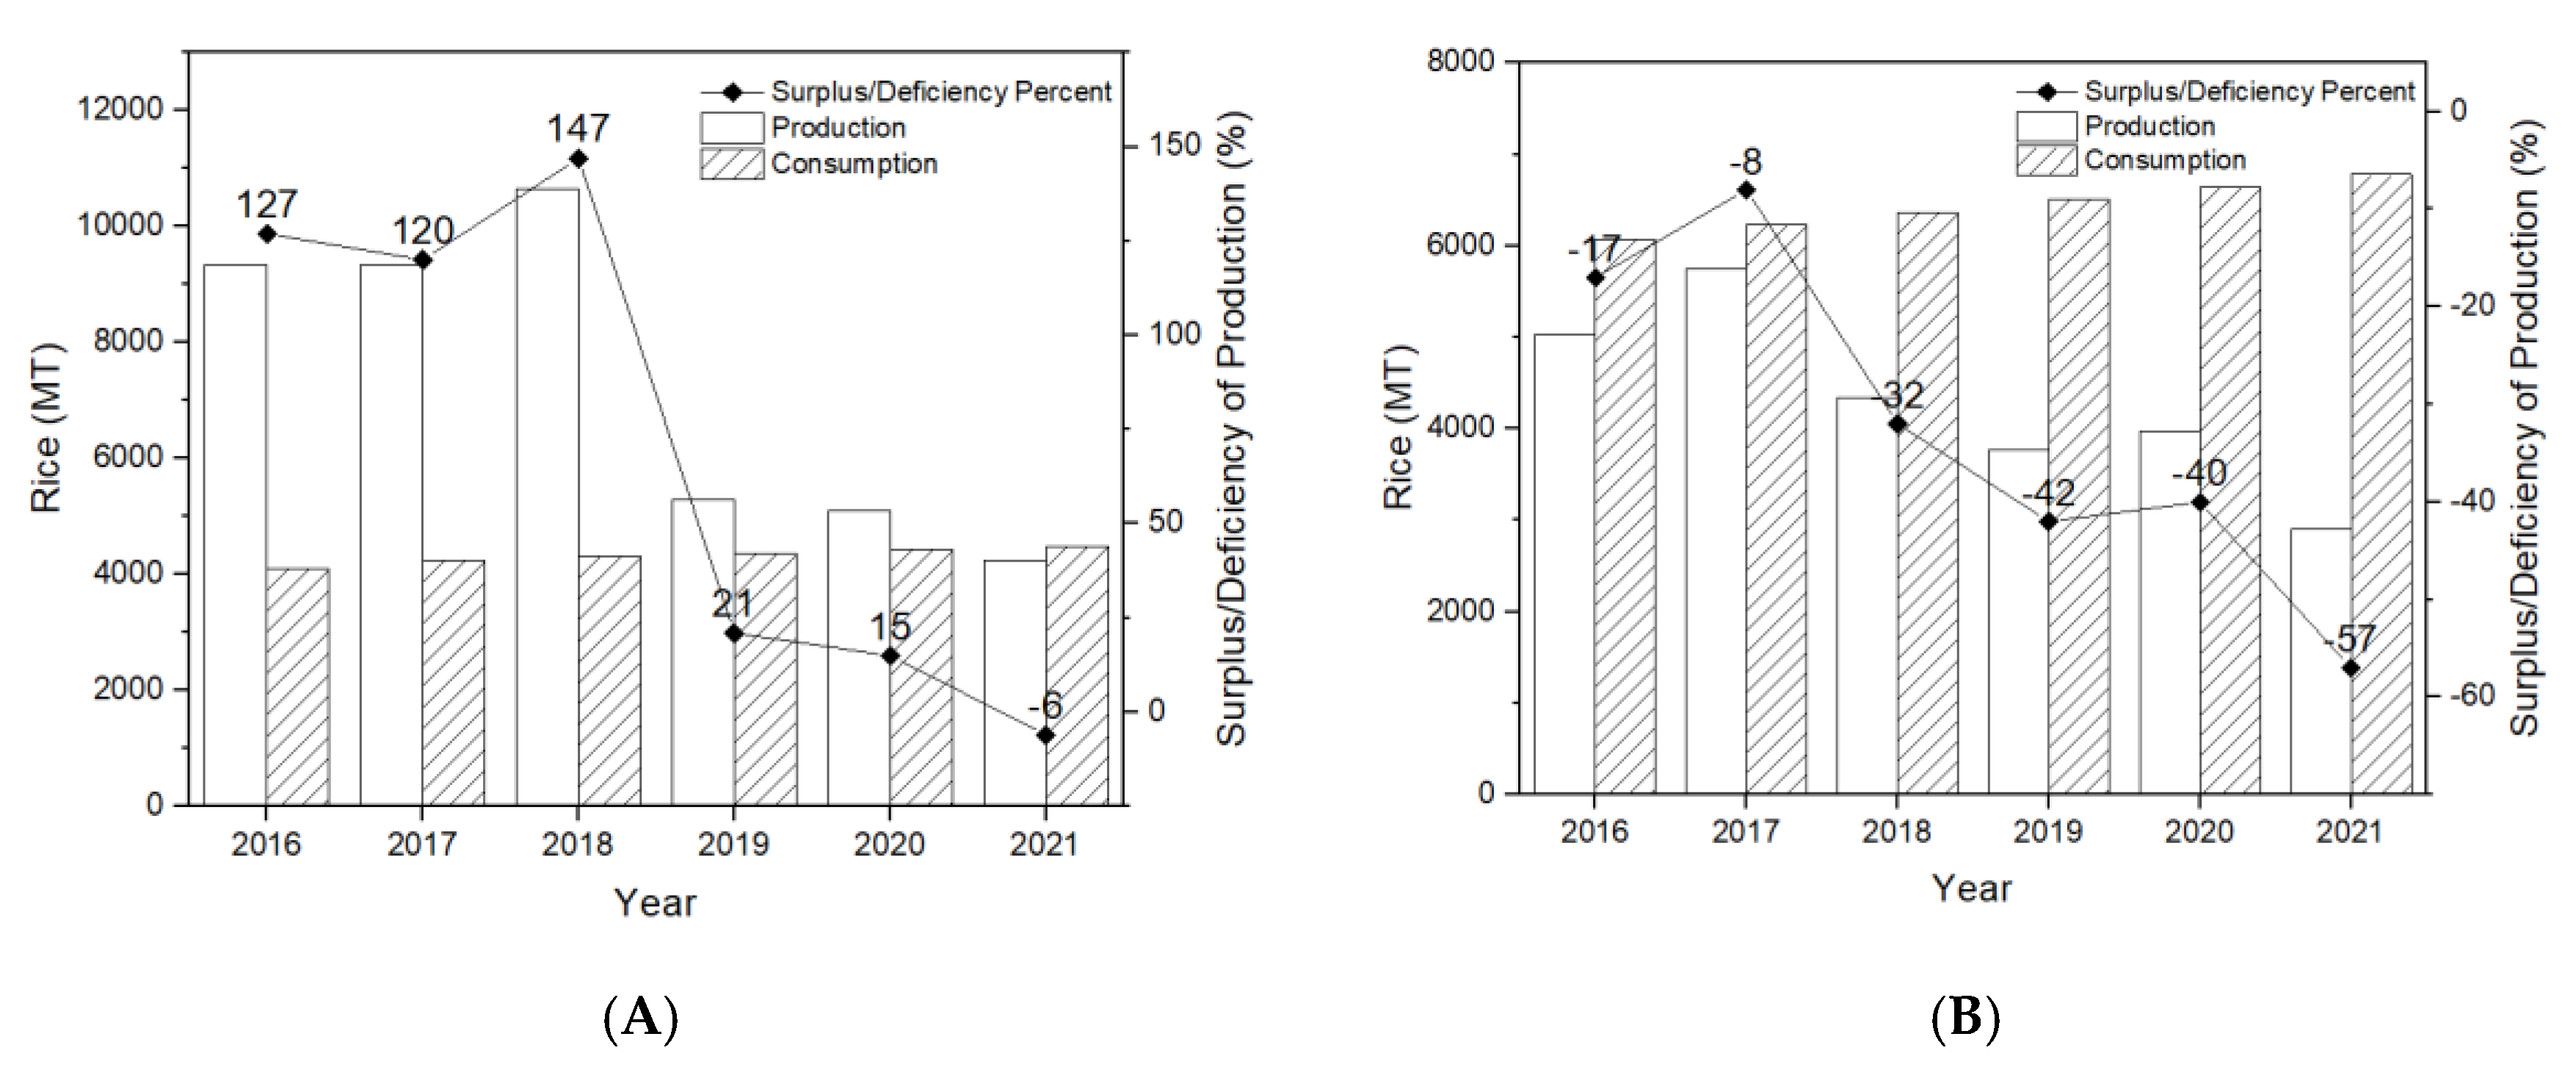
Figure 7.
Relation between factors, land-use change and paddy production.
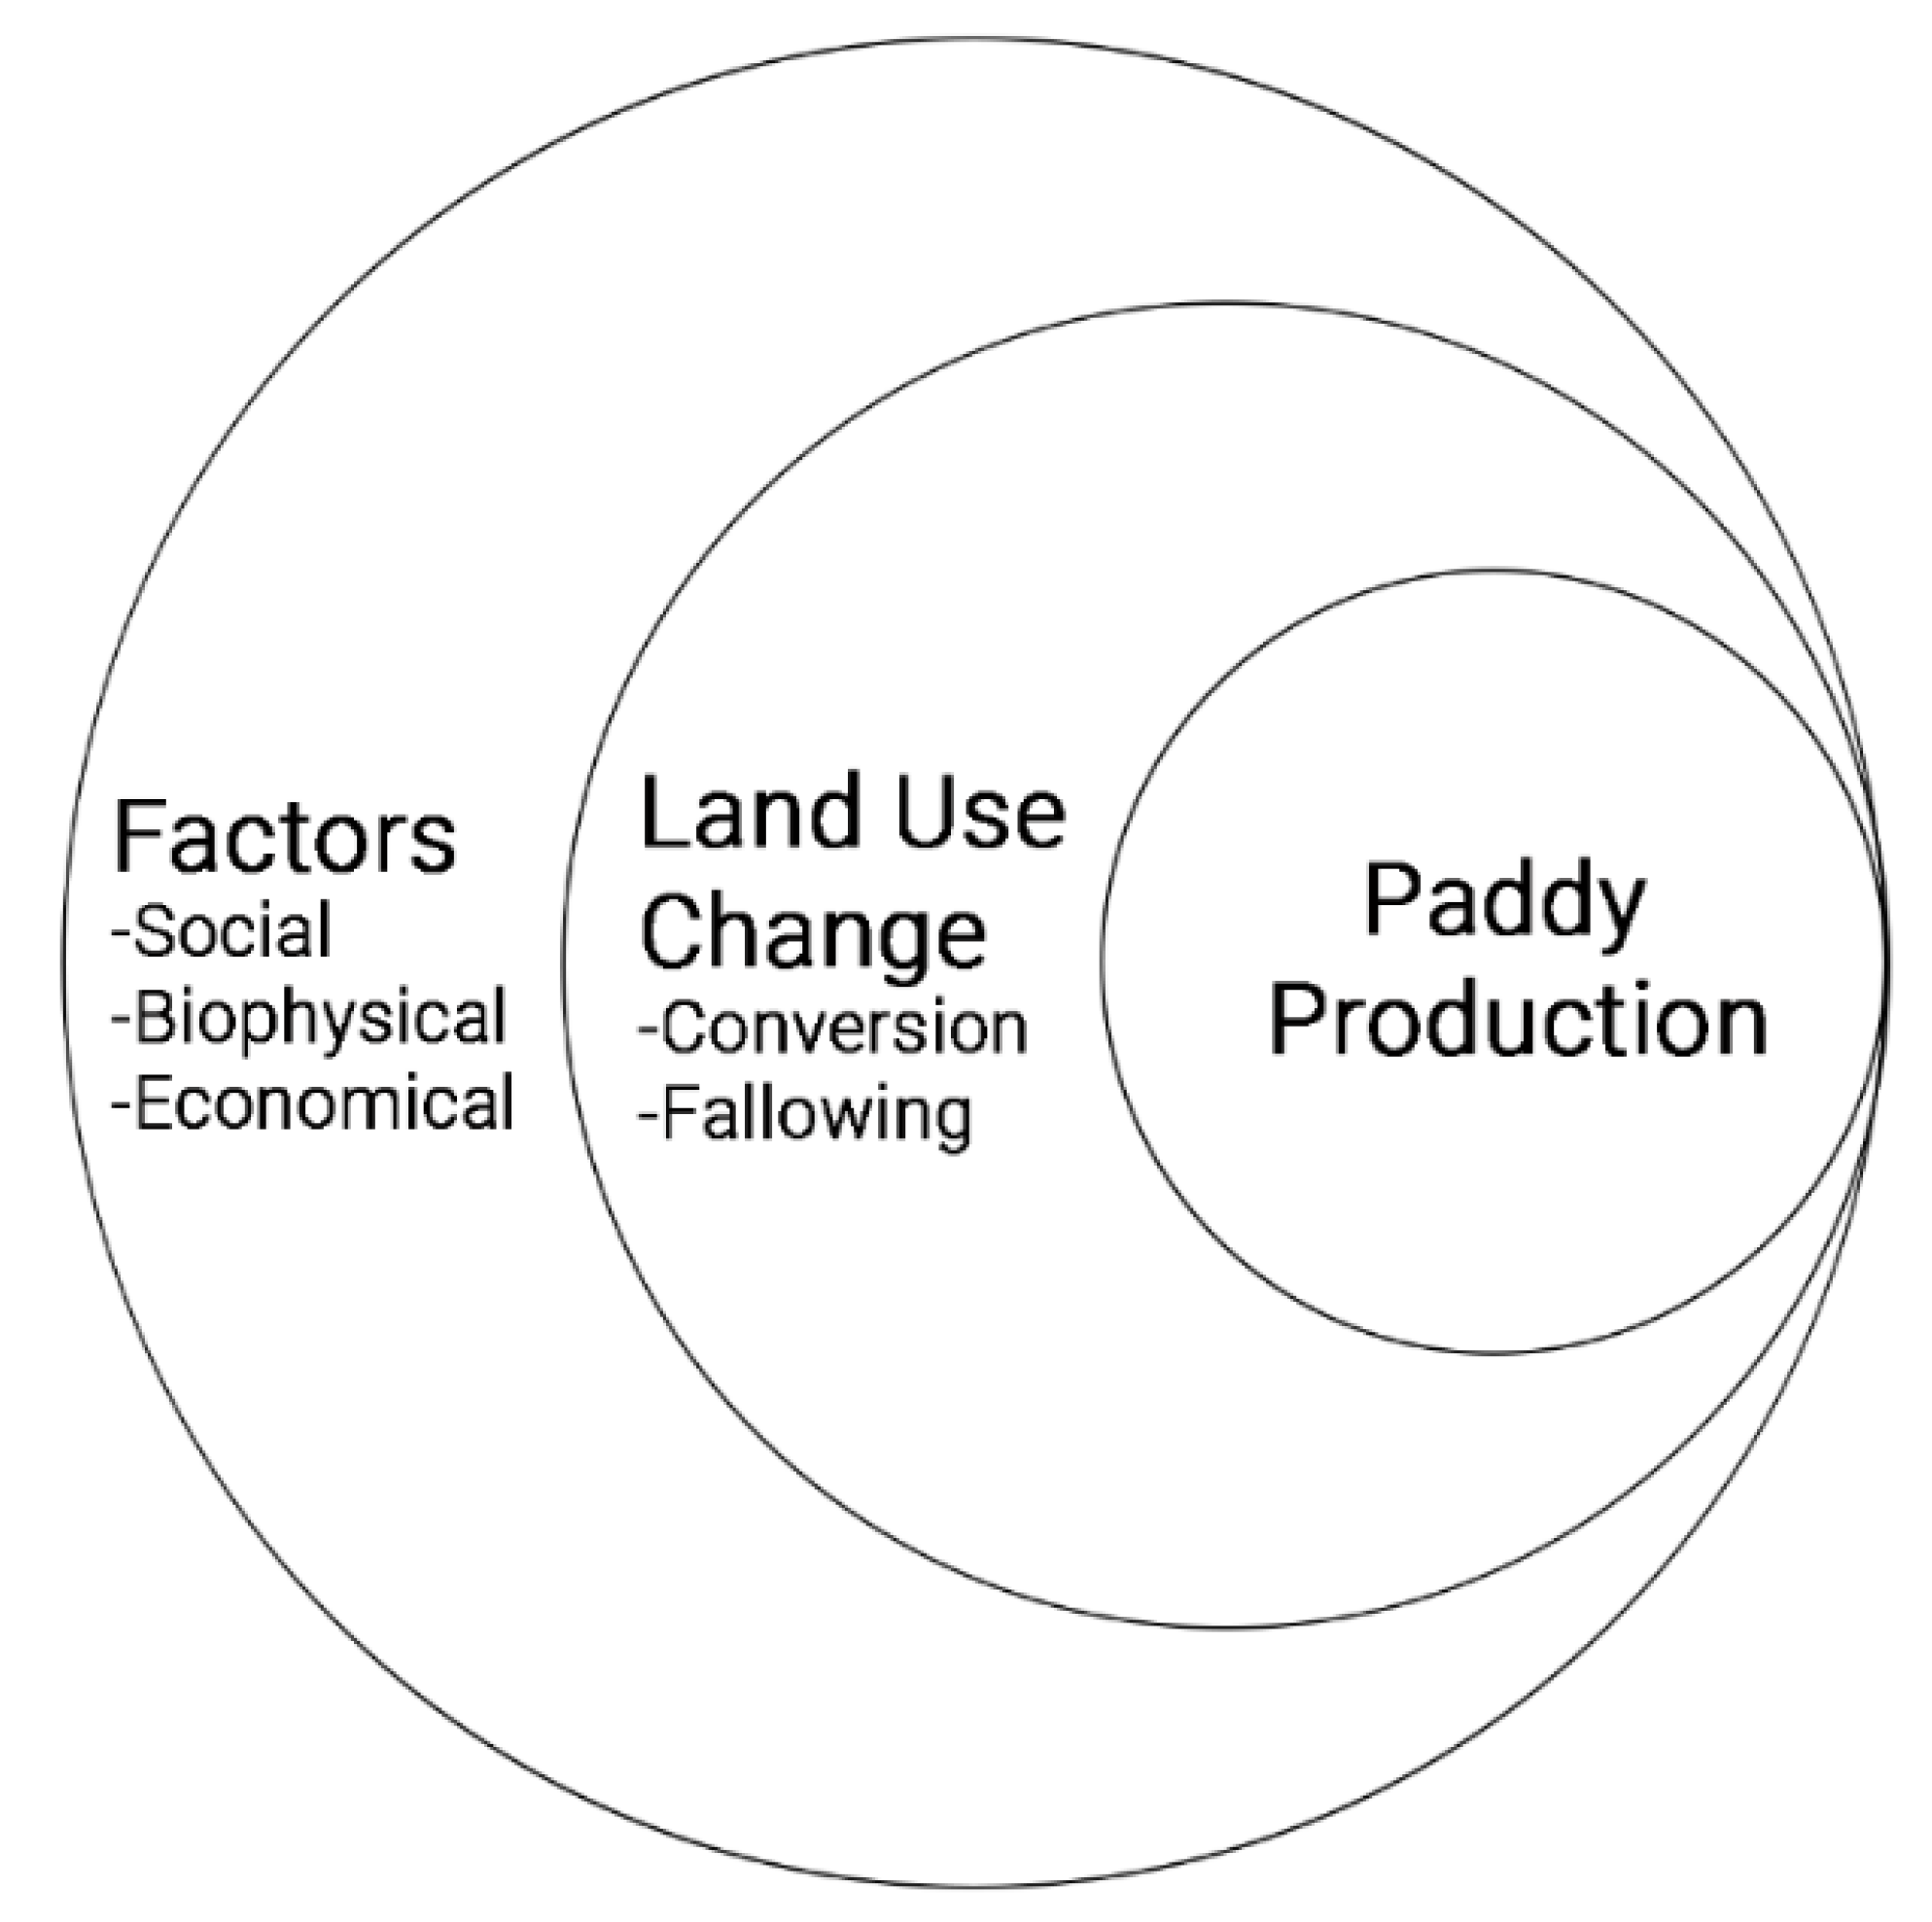
Table 1.
Accuracy assessment of respective LULC maps.
| Year | Kappa Coefficient |
| 2005 | 0.78 |
| 2010 | 0.75 |
| 2015 | 0.85 |
| 2020 | 0.73 |
Disclaimer/Publisher’s Note: The statements, opinions and data contained in all publications are solely those of the individual author(s) and contributor(s) and not of MDPI and/or the editor(s). MDPI and/or the editor(s) disclaim responsibility for any injury to people or property resulting from any ideas, methods, instructions or products referred to in the content. |
© 2025 by the authors. Licensee MDPI, Basel, Switzerland. This article is an open access article distributed under the terms and conditions of the Creative Commons Attribution (CC BY) license (http://creativecommons.org/licenses/by/4.0/).
Copyright: This open access article is published under a Creative Commons CC BY 4.0 license, which permit the free download, distribution, and reuse, provided that the author and preprint are cited in any reuse.


