
Submitted:
08 May 2025
Posted:
09 May 2025
You are already at the latest version
Abstract
MgO–C refractories containing various ratios of chemically synthesized alumina/titania nano additives were investigated concerning their physical and mechanical properties, oxidation resistance, and slag wettability. The fired refractories ' bulk density, apparent porosity, cold crushing strength, oxidation index, and closed porosity were evaluated and compared using conventional techniques and X-ray micro-computed tomography (µCT). The results of the physical and mechanical property measurements showed differing trends, with a slight degradation of physical properties and an enhancement of mechanical properties, particularly in the specimens with high alumina content. By comparing the X-ray tomography results concerning the oxidation and corrosion of the refractories with those obtained from conventional methods, the effectiveness of the technique was confirmed, as it allowed for the determination of the oxidation index without sectioning and provided improved analysis of internal corrosion within the samples. On the other hand, although the Archimedes method cannot detect closed porosity, unlike X-ray tomography, it provides more accurate measurements of the physical properties of the refractories. In this study, the conventional method demonstrated superior resolution in detecting pore sizes within the 1–2 μm range, compared to the μCT system employed, which had a resolution limit of 20 μm.
Keywords:
MgO-C
; refractory
; nano additives
; alumina
; titania
; μCT
; oxidation
; physical properties
; mechanical
; corrosion
; closed pores
1. Introduction
Micro- computed X-ray tomography (μCT) is a powerful non-destructive imaging technique used to study the internal structure of materials under high resolution. [1,2,3] The internal structure of materials as well as their microstructure plays a crucial role in defining their mechanical and physical properties. As a result, visualizing its internal structure and morphological characteristics is essential in material design and engineering. Especially in refractory materials, that method enables researchers to visualize and analyze the porosity, crack distribution, and phase composition in three dimensions without altering their integrity. [4,5,6]
By providing detailed insights into microstructural features, ΜCT helps understand the degradation mechanisms, optimize material properties, and improve the performance of refractories in high-temperature industrial applications. Furthermore, computer tomography enables before-and-after analysis, capturing the evolution of pore structures, cracks, and phase transformations due to corrosion or oxidation. The method can reveal the 3D infiltration pathways of corrosive agents, such as molten slag, alkalis, and acidic gases, as they penetrate pores and grain boundaries, exposing their depth and extent of damage. Besides, the oxidation of refractories leads to a decrease in their density due to the burning of graphite and amorphous carbon, which can be captured in tomographic images, providing a detailed record of the degree of oxidation of refractories. [6,7]
This technique offers several advantages over traditional methods used for studying refractories, such as optical microscopy, scanning electron microscopy (SEM), and mercury intrusion porosimetry. [5,8]
Earlier research on the microstructure of magnesia refractories has primarily relied on conventional techniques, such as the Archimedes method for assessing apparent porosity and the mercury intrusion porosimetry for analyzing the pore size distribution of interconnected pores. However, these approaches present several drawbacks. Firstly, they lack precision and may introduce measurement errors. Secondly, the vacuuming process involved can alter or damage the original internal structure of the sample. Thirdly, these methods provide only a macroscopic evaluation of porosity and pore size, making it difficult to accurately or visually examine the material’s characteristics. Additionally, liquid-based methods cannot penetrate sealed internal pores, leaving them undetected.
Besides, the commonly used microscopy methods, such as optical microscopy and SEM, are limited to analyzing the surface morphology of a sample, because they produce only two-dimensional images, making it impossible to observe the three-dimensional pore distribution, chemical composition, and structure of the entire sample. As a result, the detection outcomes may lack comprehensiveness, leading to a restricted understanding of the refractory’s structure and performance. [1,5] In contrast, computed tomography enables non-destructive, volumetric imaging, allowing comprehensive visualization and analysis of the entire sample in three dimensions.
On the other hand, it has not been confirmed whether the results of the X-ray tomography can accurately yield measurable properties of the refractory materials, such as their density, oxidation index, and total porosity, which are determined using classical methods. The reason is that the results of the tomography technique largely depend on the available resolution of the equipment used, which must be high enough to accurately capture the fine details of refractory materials, especially those with small pores or complex internal structures. [10] Furthermore refractory materials, especially those with similar densities or compositions, may have limited contrast in X-ray imaging. This makes it difficult to distinguish between different phases or materials, potentially reducing the accuracy of the analysis, whereas large refractory samples might be difficult to analyze due to the limited sample size capacity of commercial μCT equipment. This could restrict its use in industrial-scale applications where larger pieces need to be studied. [11]
Magnesia-carbon refractories belong to the category of basic refractories and are used in many steelmaking applications, such as converters, electric arc furnaces, and steel ladles. Their main properties are high refractoriness, high thermal conductivity, high resistance to thermal shock, high corrosion resistance, and low modulus of elasticity, resulting in the absorption of stresses with minimal deformation. [12,13]
The amount of graphite, the type of resin used, the particle size distribution of the magnesia raw materials, as well as the firing temperature, duration, and furnace atmosphere, play a crucial role in developing the desired properties of refractory materials.
Nanopowders, due to their small size and high surface area to volume ratio, have generated enormous technological interest in recent years due to their unusual properties (magnetic, electrical, optical, and mechanical) and the significant changes they cause in the materials they are added to, enhancing their microstructure and properties. [14,15]. In refractories, they act as additives by filling tiny voids during molding, aiding densification[15,17], serving as colloidal binders, strengthening the ceramic structure [15,17], lowering reaction temperatures, accelerating sintering, and enabling in-situ microstructure development with superior properties. [15]
Concerning the MgO-C refractories, it has been found that replacing micrometer-sized magnesia with 0.25–1.5% TiO₂ nanoparticles improves refractory properties due to the formation of TiC, TiN, and TiCN phases. [18] On the other hand, small amounts of 0.3 μm TiO₂ were observed to increase density and reduce porosity, while concentrations greater than 10% led to property degradation. [19] Additionally, nanoparticles have been shown to enhance refractory performance by forming non-oxide ceramic phases, although excessive amounts can cause aggregation and expansion issues. Furthermore, the addition of 1 μm TiO₂ and 45-75 μm Al to magnesia-carbon refractories leads to the formation of TiCN, TiC, Al4C3, Al2OC, and Al4O4C phases, improving oxidation and thermal shock resistance. [20] Finally, nano-iron has been found to enhance mechanical strength and corrosion resistance, while nano-alumina forms MgAl₂O₄ spinel, causing microcracks and reducing mechanical performance. [21]
This study explores the application of X-ray tomography for the quantitative characterization of magnesia-based refractory materials containing Al2O3 and TiO2 nanoparticles as additives. Specifically, compared with commonly used methods such as the Archimedes method and optical microscopy, physical properties such as density and pore volume were calculated, along with characteristic properties such as the oxidation index, depth, and degree of corrosion after corrosion and oxidation experiments.
2. Materials and Methods
2.1. Materials
Raw materials for preparing magnesia-carbon refractory included fused magnesia (3-5 mm, 1-3 mm, 0.5-1 mm, 0-05 mm and 200 mesh, Mathios refractories factory, Greece), flake graphite, fine grained graphite, Aluminum granular (<1 mm, ≥99.7 wt% trace metals basis, Sigma Aldrich) and boron carbide (<10 Micron powder, 99+%, Alfa Aesar). The used binders were thermosetting phenolic resins, in which one was in solid form and the other in liquid form. Aluminum nitrate and ammonia were used to prepare γ-alumina nanoparticles, while nitric acid and titanium (IV) isopropoxide were used to prepare TiO2-anatase nanoparticles.
2.1.1. Preparation of Alumina and Titania Nanoparticles
Aluminum nitrate (375.13 g) was stirred with 594 ml distilled water at 80oC until the precursor dissolved. Ammonia 25% (375.13 g) was added dropwise, and the solution was left to stir with a mechanical stirrer for one hour and then dried at 110oC for 24 hours. The dried material was calcined at 600 oC (2 o C/min) for 2 hours. After calcination, ball milling took place for 40 minutes (Figure 1). Distilled water (36 ml) and nitric acid (2 ml) were stirred while 30.33 ml of titanium (IV) isopropoxide was added dropwise. The solution was stirred continuously at 700 rpm for 30 minutes and then transferred to a 100-mL sealed teflon vessel placed in a microwave reactor (Milestone flexiWAVE). The heating ramp was set in 10 minutes with holding times of 20 minutes at 180 °C. After cooling at room temperature, the obtained powders were carefully washed at least three times with deionized water, centrifuged, and dried at room temperature.
2.1.2. Preparation of Magnesia-Carbon Bricks
Magnesia (supplied by Mathios Refractories S.A., Greece) in the range of 5-3, 3-1, 1-0.5, 0.5-0 mm and 200 mesh and fine grained and flake graphite (also supplied by Mathios Refractories S.A., Greece) were utilized as the main starting materials. Novolac liquid and powder resin were used as binders. All investigated compositions of magnesia-carbon bricks were listed in Table 1. The mixing sequence of raw materials was listed in Table 2. The mixture of raw materials was compacted under an applied pressure of 200 MPa using a Specac Hydraulic Press (15 tons) into specimens of cylindrical (radii of 15 mm and 6.5 mm) and rectangular (40 mm × 6 mm × 7.5 mm) shapes and subsequently heat-treated at 200 °C for one hour. Finally, the samples were heated at 1400˚C (5˚C/min) for 3 hours, fully covered with coal.
2.2. Methods
The phase composition of Al2O3 and TiO2 nanoparticles was investigated using X-ray diffraction analysis (XRD instrumental D8 advance, Bruker, Germany, monochromatic beam with CuKα 40kV, 40mA, λ=1.54178Å). The crystal size of the prepared nanoparticles was calculated from the XRD patterns using the following Scherrer equation:
Where d is the average crystallite size of the phase under investigation, K is a constant (K =0.9), β is the full-width half maximum (FWHM) expressed in radians, θ is Bragg’s angle, and λ is the wavelength of the X-ray beam used.
Porosity and density measurements were performed using Archimedes’ immersion method according to the ASTM C20-00 standard [22]. The determination procedure of the apparent porosity, water absorption, apparent specific gravity, and bulk density of the refractories involved: a) the drying of the specimens to constant weight and the determination of their dry weight (D), b) the immersion of the specimen into distilled water and its boiling for two hours, followed by cooling to room temperature, c) determination of the weight, S, of each test specimen after boiling and while suspended in water, d) Determination of the saturated weight, W (after determination the suspended weight, all drops of water from the surfaces were removed using a cotton cloth). Then, the calculation of Exterior Volume (V), Apparent Porosity (P), Water Absorption (A), Apparent Specific Gravity (T), and Bulk Density (B) of the specimens was obtained by the following equations:
| V (cm3) =W-S | (2) |
| P(%)=[(W-D)/V] ×100 | (3) |
| A(%)=[(W-D)/D] ×100 | (4) |
| T=D/D-S | (5) |
| B(cm3)=D/V | (6) |
SEM was utilized to observe the morphology of the CRMFoams. Images were taken with a JEOL JSM-5600 system, which is equipped with an energy dispersive spectrometry (EDS) by Oxford Instruments. The sample was gold sputtered before the measurements, to achieve easier high-resolution imaging.
X-ray computed microtomography (μCT) imaging was employed to investigate the internal microstructure of MgO-C specimens after typical corrosion and oxidation treatment processes. Radiographic imaging was carried out on a Bruker SkyScan 1275 (USA) scanner, equipped with a distortion-free 3 Mp active flat-panel detector. An accelerating voltage of 90 kV and a current of 110 μA were applied, while a 1 mm thick CU filter was used with to a pixel size of 20 μm. A 360° scan was performed with a 0.20° rotation step corresponding approximately to a 25 minutes scan duration. The reconstruction was performed on Bruker’s NRecon software. While CTan and Dataviewer were used for the image analysis. Specifically, the CTAn application was employed to calculate the porosity characteristics of the samples. Scans of the samples were acquired and processed using a custom routine. Initially, a Gaussian filter with a radius of 1 was applied to reduce noise and enhance image quality. Subsequently, automatic global thresholding was used to segment the void regions of interest from the rest of the sample. Following segmentation, a three-dimensional analysis was performed to quantify the structural properties of the samples.
Mechanical characterization in terms of cold crushing strength (CCS) was carried out for each composition, using specimens measuring 13 mm in diameter and 13 mm in height, by ASTM C-133-97 [23], employing an Autograph AGS-H testing machine (Shimadzu, Kyoto, Japan). The CCS of refractory materials is evaluated by positioning a suitably prepared specimen on a flat, rigid surface and applying a uniformly distributed load through a bearing block, using a calibrated mechanical or hydraulic compression testing machine. The load is increased steadily until the first visible crack occurs in the specimen, at which point the maximum load is recorded as the cold crushing strength. Throughout the test, the specimen must remain in a flat orientation to ensure uniform stress distribution. The cold crushing strength is typically reported in megapascals (MPa). The CCS is calculated according to the following relationship: CCS = Load/Area (7), where Load is the maximum applied force at failure, and Area refers to the loaded surface area of the specimen.
Oxidation and corrosion tests took place at the same time. The specimens (with a hole in the middle) filled with synthetic slag were placed in the furnace and heated at 1500˚C (10˚C/min) for 30 minutes. The synthetic slag consisted of 56% CaO, 11% SiO2, and 33% Al2O3, according to Jansson et. al.’s work [24]. The specimens are subsequently sectioned longitudinally through the central hole to reveal the internal structure for optical inspection or tomographic analysis.
3. Results and Discussion
3.1. Characterization of Nanoparticles
The X-ray diffraction pattern of Al2O3 nanoparticles after firing at 600˚C is shown in Figure 1 (top). The sample diffraction intensity is measured in the Bragg angle (2θ) range between 10-80˚. It becomes clear that the peaks are broad, which is due to the small size of the crystallites [25] and indicates the weak crystalline phase of the material [26]. It is observed that the only phase detected is that of γ-alumina (JCPDS No. 10-425), where the characteristic peaks at angles 2θ=20, 34, 38, 46, 60, 67˚ correspond to the reflections: (111), (220), (331), (222), (400), (511) and (440). [27,28] The crystallite size was calculated using the
Scherrer equation at the (400) and (440) planes with the highest diffraction intensity. The average particle size was found to be 5 nm. Figures 1a and 1b present the TEM images of γ-alumina before treatment with dry ball milling, while Figures 1c and 1d display the nanoparticles after treatment. As observed in the first case, the alumina nanoparticles exhibit significant agglomeration, with an average size of 10 nm, leading to clusters of approximately 300 nm. However, in the case where the powder has undergone ball milling, the agglomerate size is noticeably reduced, with an average size of approximately 150 nm.
Figure 1 (bottom) shows the X-ray diffraction pattern at angles of 20–80˚ of titanium oxide nanoparticles after being washed and dried at room temperature. The hydrothermal method without further thermal treatment of the sample led to the successful crystallization of titania with well-defined reflections characteristic of anatase-TiO2 (JCPDS No. 01-071-1166). However, for 2θ=30˚ there is a low intensity peak indicating the presence of brookite (JCPDS No. 01-076-1936). [29] The crystallite size was determined using the Scherrer equation applied to the (101) plane [30], which exhibited the highest diffraction intensity. The calculated value for the crystallite size was found to be 4.3 nm. In addition, the TEM image of the TiO₂ nanoparticles (right) shows a cluster of irregularly shaped particles with varying sizes, ranging from a few nanometers to around 20-30 nanometers in diameter. The particles are mostly spherical or slightly elongated, with some appearing darker due to higher electron density or overlapping.
3.2. Physical Properties of MgO-C Refractories
Figure 2 shows the determined physical properties of the fired bodies containing different contents of the nano alumina/titania powders. It can be observed that the bulk density of batch B-1, that contains specimens with no nanoparticles, exhibited the highest density value of 2.88 g/cm3. With the addition of alumina/titania nanoparticles, a drop in density was observed and a corresponding increase in porosity without any difference in the values of the different ratios. The only batch of samples that stood out with a slightly increased density was B-3 (75% Al2O3- 25% TiO2) from 2.66 g/cm3 to 2.78 g/cm3, and simultaneous apparent porosity diminished from ~20% to 16.76%. In previous studies on graphite percentages, it seems that the density values were higher, and the porosity was correspondingly lower. This behaviour at first is attributed to the use of a type of magnesia for the composition of the samples, as well as their larger size. Also, the difference in heat treatment played an important role. [31,32,33]
According to the literature, the addition of alumina/titania nanoparticles to the ceramic structure improved the physical properties of the specimens. However, the formation methods differ in terms of the granulometry of the raw materials, the crystalline phase and size of the specimens, the firing temperature, and even the choice of the percentage of nanoparticles and their crystalline phases, to avoid the appearance of agglomerates. [18,19,21,34,35] Along these lines, the addition of thermally untreated γ-alumina and titania nanoparticles to magnesia-carbon refractories leads to a noticeable reduction in bulk density, likely due to several interconnected factors. For instance, γ-alumina, a metastable phase with a high surface area and low bulk density, does not sinter effectively until it transforms into the stable α-phase at elevated temperatures [36]. Similarly, untreated titania, typically in the anatase or amorphous form, exhibits poor sintering behavior and lower density compared to the rutile phase. [37,38] These untreated nanoparticles tend to agglomerate due to surface hydroxylation and moisture adsorption, resulting in voids and reduced packing efficiency. Additionally, phase transitions such as the γ-to-α transformation in alumina and the anatase-to-rutile transformation in titania can induce microcracking and structural disruptions during firing.
3.3. Mechanical Properties of MgO-C Refractories
Figure 3 illustrates the cold crushing strength (CCS) of magnesia-carbon specimens from different batches as a function of the ratio R=Al2O3/TiO2. Regarding the incorporation of nanoadditives, it is observed that the addition of nano-alumina, along with a reduction in the proportion of nano-titania, leads to an improvement in the compressive strength of the specimens, surpassing that of specimens without nanoadditives. This enhancement is also observed in specimen B-4, beyond which the cold crushing strength of subsequent specimens shows a decreasing trend with increasing TiO₂ content, initially approaching the values of the reference samples S1 and S2 (specimen B-5), and ultimately exhibiting even lower strength values (specimen B-6). These results suggest that the presence of alumina enhances the mechanical strength of the specimens. The separate addition of aluminum oxide and titanium oxide nanoparticles to magnesia-carbon refractory composites has been reported to result in compressive strength values ranging from 35 MPa to 38 MPa for micro-alumina and from 35 MPa to 41 MPa for nano-alumina when incorporated at levels of 2–8%. [18,34] On the other hand, when only alumina or alumina-titanium nanoparticles were incorporated, the compressive strength of the reference refractory material increased from approximately 35 MPa to 40 MPa with an increase in nano-titania content from 0 to 1.5 wt% [18]. In our case, it appears that the use of alumina nanoparticles or a combination of alumina and titania nanoparticles (up to 1.5 wt%) leads to a significant improvement in the compressive strength of refractories, exceeding 50 MPa.These findings are in agreement with the existing literature. The observed deviation from the measurements of physical properties may be attributed to the fact that, when adequately dispersed, nanoparticles can function as crack arresters and fillers, bridging microcracks and improving stress distribution under load. Additionally, they may promote the in-situ formation of other robust ceramic microphases, such as spinels, which enhance the material’s load-bearing capacity.
3.4. μCT Study
3.4.1. Density Colour Mapping
X-ray micro-computed tomography (μCT) can provide high-resolution 3D visualization of the internal structure of magnesia-c refractories without the destruction of samples as takes place in microstructure studies using optical microscopy. It allows for the assessment of porosity, pore size distribution, and crack formation, which are crucial for understanding refractory performance and durability [1] . Additionally, μCT enables the visualization of phase distribution, including MgO grains, carbon, and secondary phases, while also providing insights into degradation mechanisms such as carbon oxidation and slag penetration. Below, we conduct a parallel study using optical microscopy and X-ray microtomography on magnesia-carbon refractories containing 7 wt.% alumina and titania nanoparticles in various ratios, aiming to investigate the accuracy and effectiveness of μCT for oxidation and corrosion studies of these refractories.
Figure 4 shows a representative cylindrical specimen of the prepared refractory (a), along with a schematic representation of its possible cross-sections (b). The specimen (a) has not undergone any processing, except for a small cylindrical hole that is visible at its center, which was created for the corrosion experiments. After the corrosion and oxidation experiments, the specimens were cut vertically along the ZX plane (Figure 1b), producing rectangular cross-sections to study the samples by visual observation.
Virtual sections of the specimens were generated from the X-ray tomography data. Two types of sections were created: (1) vertical sections in the zy plane, where the cuts pass through the small cylindrical holes and produce rectangular cross-sections defined by chords across the semicircular profiles (Figure 4b); and (2) horizontal sections in the xy plane, taken at different vertical positions (labeled 1, 2, and 3 in Figure 4b), where the cylindrical holes appear as circular or semicircular cross-sections.
The refractory samples contain MgO particles with different grain sizes, amorphous carbon produced from the pyrolysis of resin, graphite, alumina, and titania nanoparticles, as well as small amounts of aluminum and boron carbide. These materials have different densities, such as MgO (3.58gr/cm3), Carbon (2 gr/cm3), Graphite (2.2 gr/cm3), Al2O3 (3.98 gr/cm3) TiO2 ( 4.5 gr/cm3), Al (2.7 gr/cm3), which significantly affects the distribution of colors in the cross-sections obtained from μCT, in refractory samples. The colors in the context of the μCT colorbar correlate to an “Index”; each voxel within the reconstructed volume is assigned an intensity value, which typically corresponds to the material’s X-ray attenuation coefficient, and is related to physical properties such as sample density and composition. The colorbar provides a visual mapping between these intensity y values and specific colors. Lower index values generally represent lower attenuation and are assigned darker colors, while higher index values represent higher attenuation materials and are mapped to brighter or warmer colors. Thus, the colorbar index serves as a reference that links voxel intensity to material properties within the scanned object. For example, pores and cracks are usually shown in black. However, it should be noted that what a sample cross-section reveals largely depends on the resolution of the instrument, or the so-called voxel size of the tomograph, which refers to the 3D pixel resolution of the scanned volume. Thus, structures smaller than 20 µm cannot be reliably resolved, and features approximately the size of or smaller than the pixel size may not be visualized.
Figure 5b shows the tomographic circular cross-section recorded at the midpoint-2 of specimen B-1. A large number of particles corresponding to magnesia grains depicted as yellow and neon green-coloured areas (density of 3.58 g/cm³) with a broad size distribution can be observed, which are attributed to their high density and the initial batch formulation, which included three distinct magnesia grain sizes. These small and large magnesia grains appear embedded within a continuous matrix exhibiting lower intensity colors such as orange and purple, corresponding to regions of lower density. Additionally, a few black spots are present, representing empty pores or cracks.
The orange-coloured matrix is likely associated with amorphous or graphitic carbon, whose typical densities are approximately 2.2 g/cm³, and may also contain small, dispersed inorganic particles, primarily magnesia. The areas with purple colour can be attributed to densities < 2 g/cm3, due to poor sintering of the raw materials or oxidation of the carbon during the pyrolysis of the resin. The circular cross-section (Figure 5c) of the same sample, recorded near the base–point 3, appears similar to the cross-section at point 2, with no apparent differences, suggesting the same microstructure.
In contrast, the circular cross-section (Figure 5a), recorded near the surface of the sample – point 1, shows an intensity shift of the continuous phase towards purple, while the areas corresponding to voids (black areas) are present at higher frequency. The observed difference suggests a lower density of the continuous phase, which can be attributed to the oxidation of the carbon during the preparation of the specimen. The cross-section 5a is near the sample surface, with the consequence of a larger possibility for oxidation from the furnace atmosphere. It is also noted that at the center of the cross-section, a black circle is formed by the empty cylindrical space created for the corrosion tests and intersects with the tomographic section.
3.4.2. Oxidation Resistance
Figure 6a shows a photograph of sample B-4 (MgO-C refractory with the addition of titania and alumina NPs in a 1:1 ratio) after oxidation and corrosion tests. The specimen has been cut in half vertically (xz plane), and photographs have been taken in the direction z above the sample surface (xy plane according to Figure 4b). A rough surface with cracks is observed, while at the center, the corroded area with a white color or greenish tint has penetrated in a circular arc toward the interior of the sample.
On the other hand, the tomographic semicircular cross-section (Figure 6b), recorded near the surface of the sample – point 1, shows the presence of mainly two distinct phases, depicted with yellow and black colours, suggesting the complete oxidation of carbon and the formation of numerous voids that appear as pores and cracks. Only the corroded area appears to lack dark spots due to the phase of the corrosive agent. In contrast, the semicircular cross-sections (Figure 6 c,d ) of the same sample, recorded near the base, -point 3, and at the middle, -point 2, appear to have undergone the same oxidation only within a semicircular ring that starts from the perimeter of the sample and extends up to one-third of the ring’s radius. This section appears very similar, with a high degree of oxidation, as also indicated by the tomography cross-section in point 1. In the remaining area, both samples in their cross-sections exhibit a distinctively different microstructure region in the form of a semicircular inner disk, where a nearly continuous phase with a purple hue dominates. Within this phase, magnesia particles are observed. Simultaneously, a reduced number of void regions (corresponding to black areas) are present, this behaviour is attributed to the partial oxidation of the carbon, which decreases the density of the continuous phase (typical orange hue) but does not yet allow the formation of voids.
Figure 7 shows rectangular cross-sections of the MgO-C samples, obtained by cutting them perpendicularly along the ZX plane (see Figure 4b). The samples had been previously used in corrosion and oxidation experiments. This procedure was carried out to facilitate the study of their oxidation through direct visual observation. Based on the ratio of the areas of the two regions—black and beige colors—in the samples, the percentage of the non-oxidized refractory material [39,40] was calculated and compared with the corresponding tomography results. To compare the accuracy of tomography measurements, the oxidation index (OΙ) was calculated based on the tomographic slices for point 3 (Figure 4b, xy-plane) and compared with the values obtained through visual observation (VO). The oxidation index is used as an indicator to evaluate the oxidation resistance of MgO-C refractories. The calculation of the OI involves the measurement of the oxidized area of the refractory sample after heat treatment and the total area, as depicted in the Equation: OI (Area of oxidized zone/total area) x 100%.
Figure 8 compares the oxidation index calculated after cross-sectional analysis using μ-CT data and visual observation (VO). The oxidation index (OI) calculated by both methods follows the same trend. The OI values obtained through visual observation are higher, which is justified by the fact that the sections for visual observation (VO) include the holes created for the corrosion tests. These holes reduce the distance between the interior of the refractory material and the oxidizing atmosphere, increasing OI values. It is evident that, according to the results of both methods, when the refractories contain alumina and titania nanoparticles together as additives, the OI systematically decreases with increasing titania.
3.4.3. Corrosion Evaluation
X-ray microtomography was also utilized to investigate the corrosion of MgO-C refractories. Figure 9 (left, middle) displays the tomography image from the vertical cross-section of samples B-2 (xz), B-4(xz), and B-6(xz), taken in directions 1 and 2 (Figure 9-right). We observe that the tomographic images reveal the porous structure of the refractories after the slag attack (Figure 9, middle, direction 2), while the length and depth of the corrosion can also be accurately determined without the need to cut the specimens. On the contrary, the cross-sections in direction 1 (Figure 9, left), i.e., in the non-corroded section, do not exhibit significant porosity but only show traces of oxidation that alter the microstructure of the section.
3.4.4. Calculation of Closed Porosity
As already mentioned, the ability of X-ray microtomography to precisely identify and examine closed pores, which are otherwise challenging to view using conventional techniques, is one of its main advantages. The size, distribution, and morphology of closed pores—all of which have a significant impact on the mechanical strength, thermal insulation, and general performance of refractories—can be revealed by high-resolution imaging using μCT. (4) Thus, open and closed porosities of 2.8, 6.3, 6.0% and 1.3, 2.1, 1.46% for samples B-2, B-4, and B-6 were calculated, respectively. Figure 10a shows a representative 3D image of the B-4 specimen obtained by μCT through the CTVox software, whereas Figure 10b provides a visual representation of the calculated open and closed porosity of the sample (shown in light shading). The arrows in Figure 10b highlight areas with closed and open pores. Τhese values exhibit a significant deviation from the apparent porosity values of the same samples as calculated using the Archimedes method. It is important to note, however, that the Archimedes method exhibits significantly greater sensitivity, being capable of detecting pores as small as 1–2 μm. In contrast, the tomography system used in the present study is limited to resolving pores approximately 20 μm and larger. Despite this limitation, μCT measurements can capture both open and closed porosity, leading to the conclusion that the total porosity of the refractories—as measured by Archimedes (i.e., the apparent porosity)—should, by comparison, be considered at least 4-6% higher to account for the undetected closed pores.
4. Conclusions
In this study, Al₂O₃/TiO₂ nanoparticles were first incorporated to fabricate low-carbon MgO-C refractories, and their physical and mechanical properties, as well as their oxidation and corrosion resistance, were investigated. The alumina and titania nanoparticles employed as additives in the refractory materials were synthesized via precipitation and microwave-assisted hydrothermal methods respectively. Χ-ray diffraction and transmission electron microscopy analyses revealed the formation of γ-alumina and anatase nanoparticles with an average size of 10–20 nm, which tended to form aggregates of approximately 100–300 nm. The incorporation of these nanoparticles into magnesia-carbon refractories led to a deterioration of their physical properties, as indicated by a decrease in bulk density—from 2.88 g/cm³ to 2.78 g/cm³ in samples with 100% alumina nano-additives, and to approximately 2.66 g/cm³ in those containing both Al₂O₃ and TiO₂—accompanied by a corresponding increase in apparent porosity and water absorption, as well as a decline in overall material compactness. On the contrary, the addition of alumina nanoparticles or a combination of alumina and titania nanoparticles (up to 1.5 wt%) into MgO-C refractories resulted in a significant improvement in compressive strength, exceeding 50 MPa.
X-ray micro-computed tomography (μCT) was employed to reveal the distribution of raw materials within the refractories, based on their differing densities, as well as the presence of cracks, and open and closed pores. Four distinct color regions—black, yellow, orange, and purple—were identified, corresponding respectively to empty pores or cracks, magnesia phases, the presence of amorphous or graphitic carbon, and areas resulting from poor sintering of the raw materials or oxidation. Τhe oxidation index (OI) was calculated based on different tomographic slices, found to be 45-65%, and compared with values obtained through visual inspection. The results from both methods showed very good agreement. Additionally, tomography images from the vertical cross-sections of the samples revealed the porous structure of the refractories after slag attack, while 3D reconstruction allowed for the estimation of closed porosity, which was found to contribute an additional 4–6% to the total porosity compared to that calculated using the Archimedes method. However, it was found that fully leveraging the advantages of microtomography requires high-resolution equipment with a detection limit below 1 μm to effectively replace conventional methods.
Author Contributions
The following statements should be used “Conceptualization, M.A.K.; methodology, M.A.K., S.G., and C.E.S; formal analysis, S.G., K.C.V., M.A.K., A.N., V.I., A.P.; investigation, S.G., K.C.V.,C.G., A.N.; V.I., M.A.K.,; resources, M.A.K.,.C.E.S., and A.P.; data curation, S.G., M.A.K., C.E.S., C.G., K.C.V, V.I., A.N., and A.P.; writing—original draft preparation, S.G., A.N., and M.A.K.; writing—review and editing, S.G., M.A.K., A.N., and C.E.S., supervision, M.A.K.; project administration, M.A.K. and C.E.S.; funding acquisition, M.A.K. ; All authors have read and agreed to the published version of the manuscript.
Funding
This work was carried out in the framework of the project “Advanced Aluminosilicate Refractories and Magnesia Refractories of High Efficiency using Nanotechnology” that is co-financed by the European Regional Development Fund in the context of the special action “Industrial Materials” of the Operational Programme “Competitiveness, Entrepreneurship & Innovation (EPAnEK)”, ΕΣΠA 2014-2020 (acronym: NanoRefraMat; project code: T6YBP-00386).
Data Availability Statement
The data presented in this study are available upon request from the corresponding author.
Acknowledgments
Τhe authors would like to thank the company, MATHIOS REFRACTORIES S.A. (Athens , Greece) for supplying us with raw materials for the production of refractories.
Conflicts of Interest
The authors declare no conflicts of interest.
References
- Vásárhelyi L, Kónya Z, Kukovecz Á, Vajtai R. Microcomputed tomography–based characterization of advanced materials: a review. Mater Today Adv. 2020, 8, 100084. [Google Scholar] [CrossRef]
- Kong Y, Kato M, Kurumisawa K. Recent Advances in X-ray Computed Tomography for Alkali-Activated Materials: A Review. J Adv Concr Technol. 2023, 21, 573–595. [Google Scholar] [CrossRef]
- Cengiz IF, Oliveira JM, Reis RL. Micro-CT – a digital 3D microstructural voyage into scaffolds: a systematic review of the reported methods and results. Biomater Res. 2018, 22, 26. [Google Scholar]
- Fan J, Li Y, Gao Y, Zhang X, Jiang P. Evaluation of the morphology and pore characteristics of silica refractory using X-ray computed tomography. Ceram Int. 2021, 47, 18084–18093. [Google Scholar] [CrossRef]
- Razavi A, Hopp V, Hahn D, Sax A, Quirmbach P. Microstructural X-Ray Computed Tomography Investigation of the Defect Evolution in Refractory Castings Based on Andalusite. Ceramics 2024, 7, 1867–1879. [Google Scholar] [CrossRef]
- Stec J, Tarasiuk J, Wroński S, Kubica P, Tomala J, Filipek R. Investigation of Molten Metal Infiltration into Micropore Carbon Refractory Materials Using X-ray Computed Tomography. Mater Basel Switz. 2021, 14, 3148. [Google Scholar]
- Pankka I, Ahmed MS, Tammela J, Taskinen P, Lindberg D. Investigation of End-of-Life Chrome-Magnesia Refractories Using X-Ray Computed Tomography. JOM 2024, 76, 6650–6659. [Google Scholar] [CrossRef]
- Razavi A, Stein A, Quirmbach P. Tomographic Imaging of Bauxite Grains Leached Using Hydrochloric Acid. Minerals 2023, 13, 884. [Google Scholar] [CrossRef]
- E. Weber, M. E. Weber, M. Fernandez, P. Wapner, W. Hoffman. Comparison of X-ray micro-tomography measurements of densities and porosity principally to values measured by mercury porosimetry for carbon–carbon composites, 2009.
- Galvez-Hernandez P, Smith R, Gaska K, Mavrogordato M, Sinclair I, Kratz J. The effect of X-ray computed tomography scan parameters on porosity assessment of carbon fibre reinfored plastics laminates. J Compos Mater. 2023, 57, 4535–4548. [Google Scholar] [CrossRef]
- Rashidi A, Olfatbakhsh T, Crawford B, Milani AS. A Review of Current Challenges and Case Study toward Optimizing Micro-Computed X-Ray Tomography of Carbon Fabric Composites. Materials 2020, 13, 3606. [Google Scholar] [CrossRef]
- Behera S, Sarkar R. Nano carbon containing low carbon magnesia carbon refractory: an overview. Prot Met Phys Chem Surf. 2016, 52, 467–474. [Google Scholar] [CrossRef]
- Kundu R, Sarkar R. MgO-C Refractories: A Detailed Review of These Irreplaceable Refractories in Steelmaking. Interceram - Int Ceram Rev. 2021, 70, 46–55. [Google Scholar] [CrossRef]
- Rauta PR, Sahoo N. Properties enhancement of refractory bricks by incorporation of nano materials. In Proceedings of the 2015 International Conference on Nascent Technologies in the Engineering Field (ICNTE); 2015; pp. 1–6.
- Salomão R, Souza A, Fernandes L, Arruda C. Advances in nanotechnology for refractories: When very small meets hot, heavy, and large. Am Ceram Soc Bull. 2013, 92, 22–27b. [Google Scholar]
- Sobolev, K. How Nanotechnology Can Change the Concrete World Part Two of a Two-Part Series. Am Ceram Soc Bull. 2005, 84, 5. [Google Scholar]
- Antonovič V, Pundiene I, Stonys R, Česniene J, Keriene J. A review of the possible applications of nanotechnology in refractory concrete. J Civ Eng Manag - J CIV ENG MANAG. 2010, 16, 595–602. [Google Scholar] [CrossRef]
- Ghasemi-Kahrizsangi S, Dehsheikh HG, Karamian E. Impact of Titania nanoparticles addition on the microstructure and properties of MgO-C refractories. Ceram Int. 2017, 43, 15472–15477. [Google Scholar] [CrossRef]
- Kusiorowski, R. Effect of titanium oxide addition on magnesia refractories. J Aust Ceram Soc. 2020, 56, 1583–1593. [Google Scholar] [CrossRef]
- Aneziris CG, Hubálková J, Barabás R. Microstructure evaluation of MgO–C refractories with TiO2- and Al-additions. J Eur Ceram Soc. 2007, 27, 73–78. [Google Scholar] [CrossRef]
- Gómez Rodríguez C, Das Roy TK, Shaji S, Castillo Rodríguez GA, García Quiñonez L, Rodríguez E, et al. Effect of addition of Al2O3 and Fe2O3 nanoparticles on the microstructural and physico-chemical evolution of dense magnesia composite. Ceram Int. 2015, 41, 7751–7758. [Google Scholar] [CrossRef]
- ASTM C20-00(2022); Standard Test Methods forApparent Porosity, Water Absorption, Apparent Specific.
- Gravity, and Bulk Density of Burned Refractory Brick and Shapes by Boiling Water [Feb 28, 2022]. [CrossRef]
- ASTM-C133-97-2015; Standard Test Methods for Cold Crushing Strength and Modulus of Rupture of Refractories.
- Jansson S, Brabie V, Jönsson P. Corrosion mechanism and kinetic behaviour of MgO–C refractory material in contact with CaO–Al2O3–SiO2–MgO slag. Scand J Metall. 2005, 34, 283–292. [Google Scholar] [CrossRef]
- Siahpoosh SM, Salahi E, Hessari FA, Mobasherpour I. FACILE SYNTHESIS OF γ-ALUMINA NANOPARTICLES VIA THE SOL-GEL METHOD IN PRESENCE OF VARIOUS SOLVENTS. Sigma J Eng Nat Sci. 2017, 35, 441–456. [Google Scholar]
- Siahpoosh SM, Salahi E, Hessari FA, Mobasherpour I. Synthesis of γ-Alumina Nanoparticles with High-Surface-Area via Sol-Gel Method and their Performance for the Removal of Nickel from Aqueous Solution. Bull Société R Sci Liège 2016, 812–934.
- Singh IB, Gupta A, Dubey S, Shafeeq M, Banerjee P, Sinha ASK. Sol–gel synthesis of nanoparticles of gamma alumina and their application in defluoridation of water. J Sol-Gel Sci Technol. 2016, 77, 416–422. [Google Scholar] [CrossRef]
- Wang Z, Wu W, Bian X, Wu Y. Synthesis and characterization of amorphous Al2O3 and γ-Al2O3 by spray pyrolysis. Green Process Synth. 2016, 5, 305–310. [Google Scholar] [CrossRef]
- Falk GS, Borlaf M, López-Muñoz MJ, Fariñas JC, Rodrigues Neto JB, Moreno R. Microwave-assisted synthesis of TiO2 nanoparticles: photocatalytic activity of powders and thin films. J Nanoparticle Res. 2018, 20, 23. [Google Scholar] [CrossRef]
- Ghadiry M, Gholami M, Lai C, Ahmad H, Chong W. Ultra-Sensitive Humidity Sensor Based on Optical Properties of Graphene Oxide and Nano-Anatase TiO2. PloS One 2016, 11, e0153949. [Google Scholar]
- Bag M, Adak S, Sarkar R. Study on low carbon containing MgO-C refractory: Use of nano carbon. Ceram Int. 2012, 38, 2339–2346. [Google Scholar] [CrossRef]
- Bag M, Adak S, Sarkar R. Nano carbon containing MgO-C refractory: Effect of graphite content. Ceram Int. 2012, 38, 4909–4914. [Google Scholar] [CrossRef]
- Zhu T, Li Y, Sang S, Jin S. The influence of Al and Si additives on the microstructure and mechanical properties of low-carbon MgO-C refractories. 2016, 7, 127–134.
- Ghasemi-Kahrizsangi S, Gheisari Dehsheikh H, Boroujerdnia M. Effect of micro and nano-Al2O3 addition on the microstructure and properties of MgO-C refractory ceramic composite. Mater Chem Phys. 2017, 189, 230–236. [Google Scholar] [CrossRef]
- Su K, Zhang Q, Tian X, Ouyang D, Liu X, Cui J. Role of nano-Al2O3 particles in improving the properties of MgO–C slide plate materials. Ceram Int [Internet]. 2023 Apr 25 [cited 2023 ]. 23 May 0272. Available online: https://www.sciencedirect.com/science/article/pii/S0272884223011720.
- Lee WE, Rainforth WM. Ceramic Microstructures: Property control by processing 1994, 299–311.
- Anand Kumar Tripathi, Manish Kumar Singh, Mohan Chandra Mathpal, Sheo Kumar Mishra, Arvind Agarwal. Study of structural transformation in TiO2 nanoparticles and its optical properties | Request PDF. ResearchGate [Internet]. [cited 2025 ]. 2 May 2328. Available online: https://www.researchgate.net/publication/232815014_Study_of_structural_transformation_in_TiO2_nanoparticles_and_its_optical_properties.
- Koparde VN, Cummings PT. Phase transformations during sintering of titania nanoparticles. ACS Nano 2008, 2, 1620–1624. [Google Scholar] [CrossRef] [PubMed]
- Mahato S, Behera SK. Oxidation resistance and microstructural evolution in MgO–C refractories with expanded graphite. Ceram Int. 2016, 42, 7611–7619. [Google Scholar] [CrossRef]
- Nanda S, Choudhury A, Chandra KS, Sarkar D. Raw materials, microstructure, and properties of MgO–C refractories: Directions for refractory recipe development. J Eur Ceram Soc. 2023, 43, 14–36. [Google Scholar] [CrossRef]
Figure 1.
X-ray diffraction patterns and TEM images of the synthesized alumina (top) and titania (bottom) nanoparticles.
Figure 1.
X-ray diffraction patterns and TEM images of the synthesized alumina (top) and titania (bottom) nanoparticles.
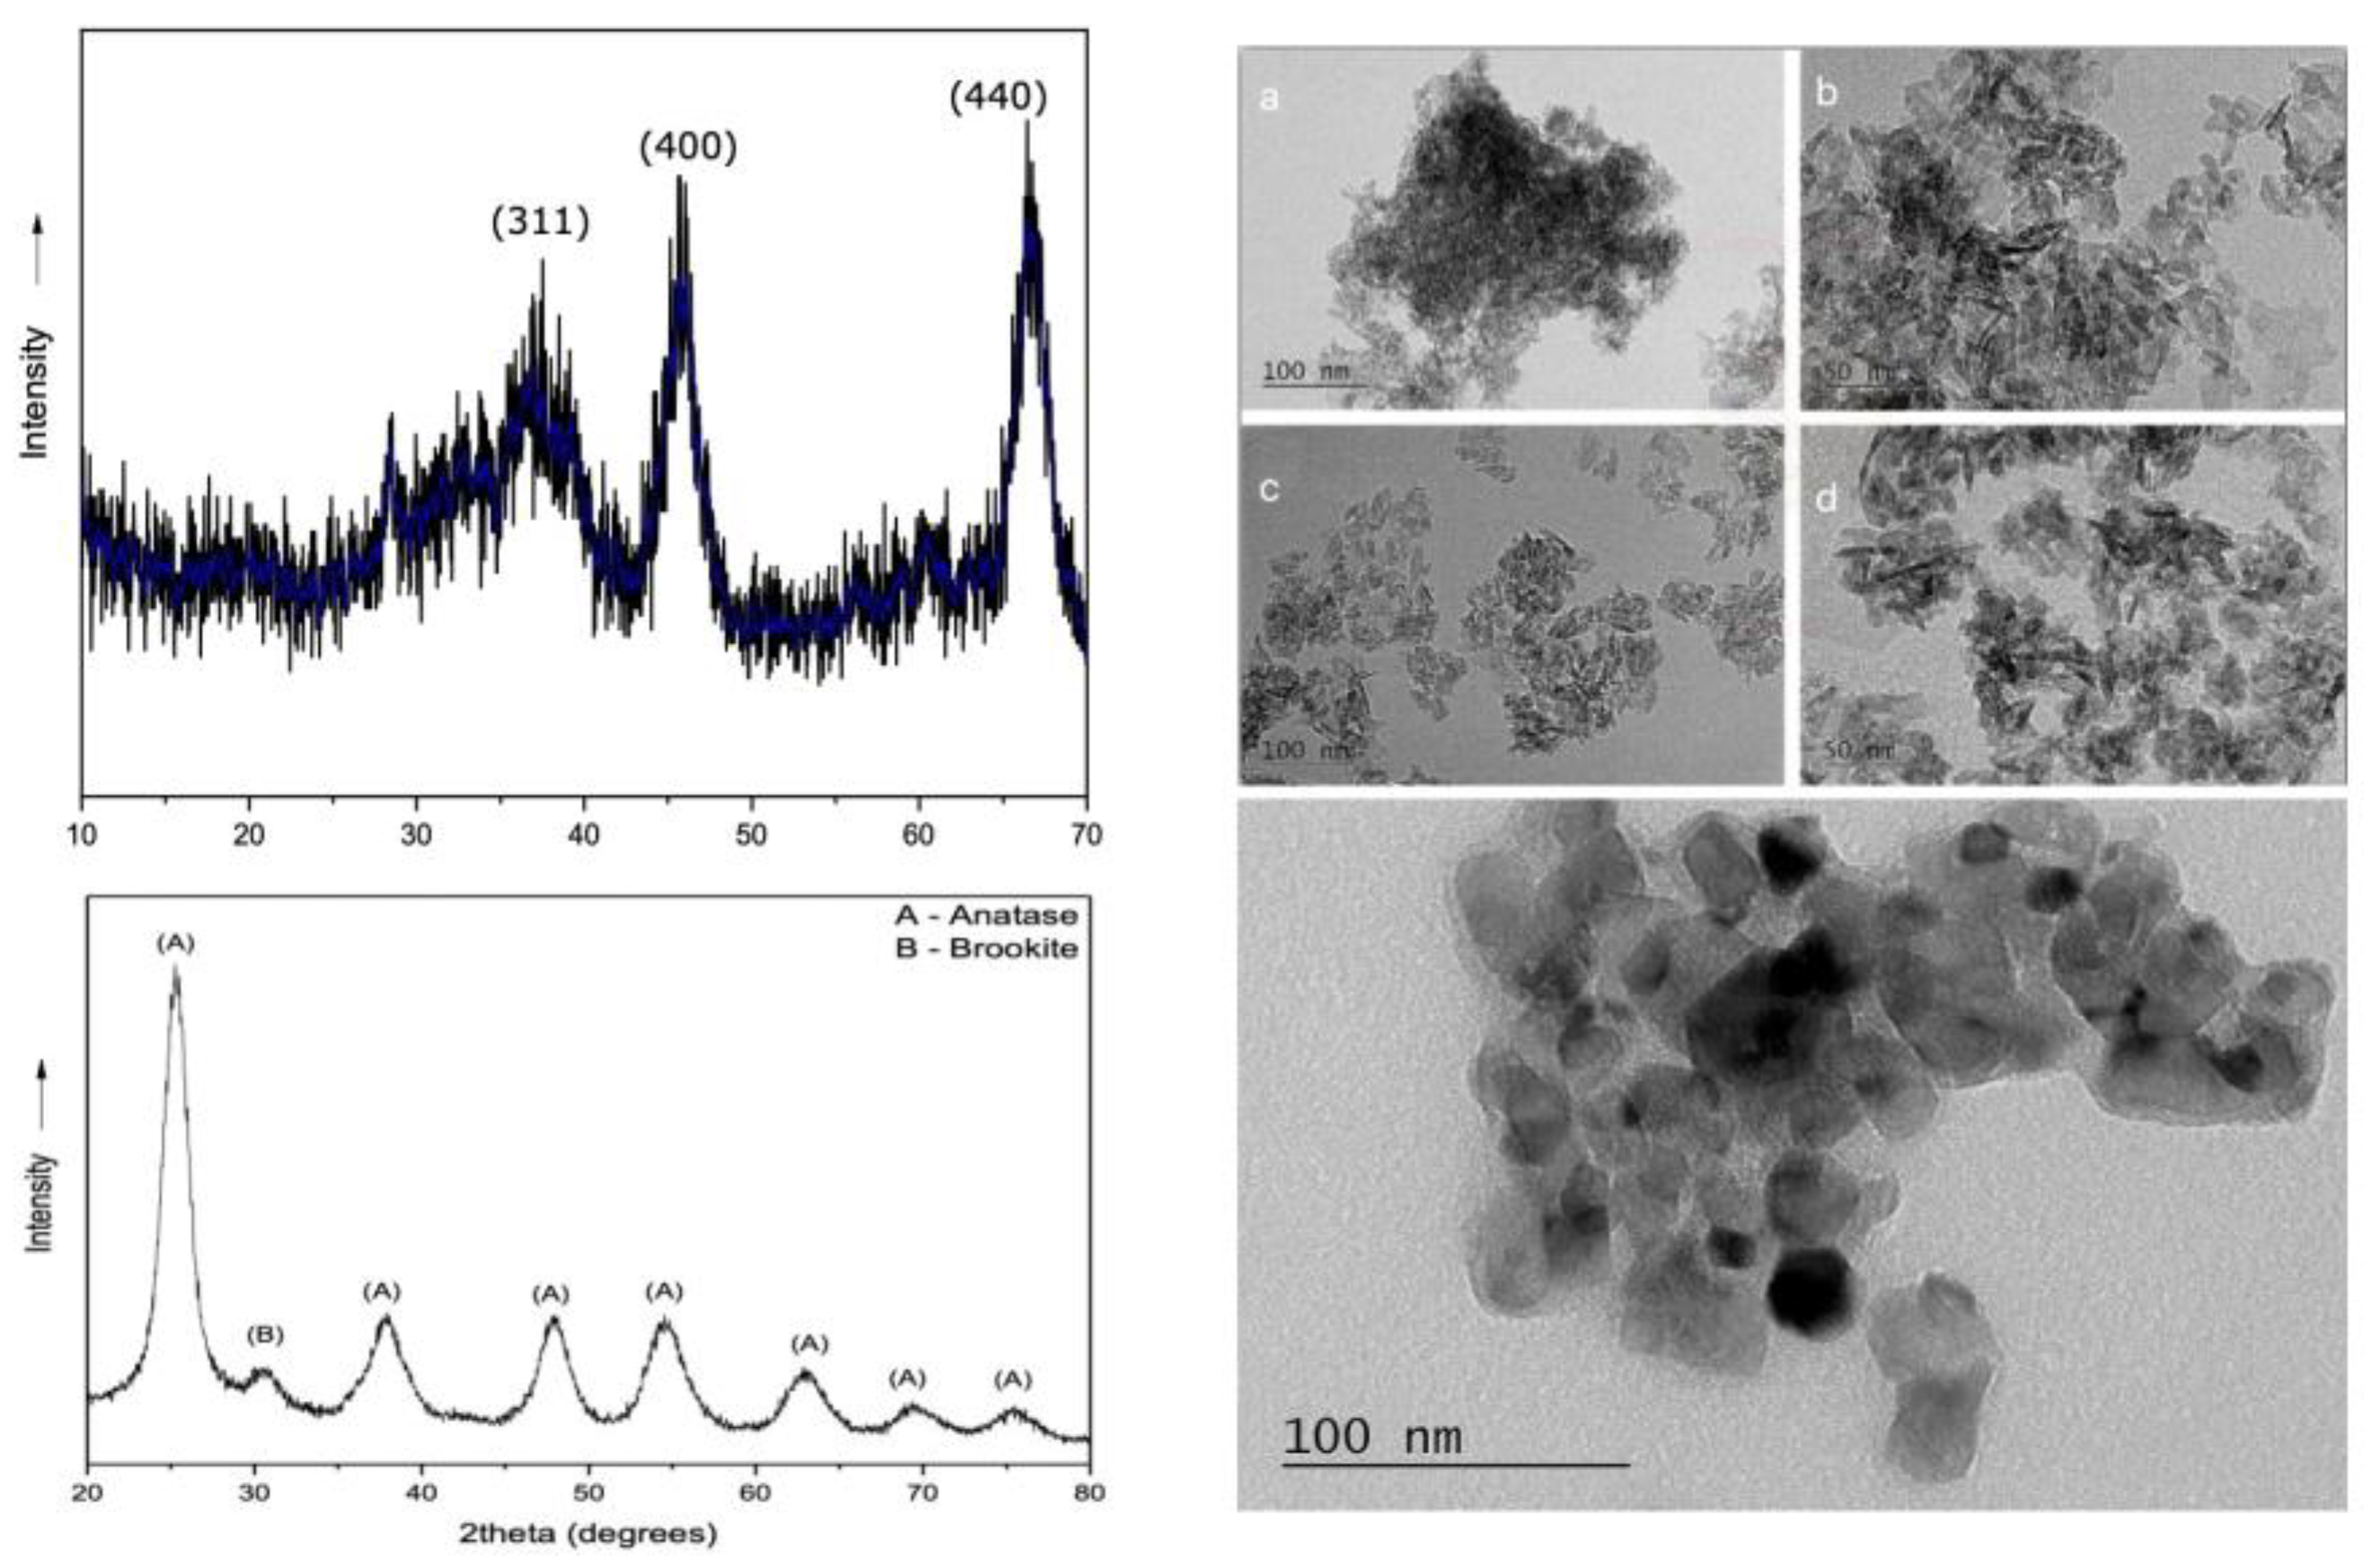
Figure 2.
Bulk densities and apparent porosities of MgO-C refractories as a function of Al₂O₃/TiO₂ ratio. Reference sample B-1 includes the average values of S₁ and S₂, two compositions containing 6% and 10% graphite, respectively.
Figure 2.
Bulk densities and apparent porosities of MgO-C refractories as a function of Al₂O₃/TiO₂ ratio. Reference sample B-1 includes the average values of S₁ and S₂, two compositions containing 6% and 10% graphite, respectively.
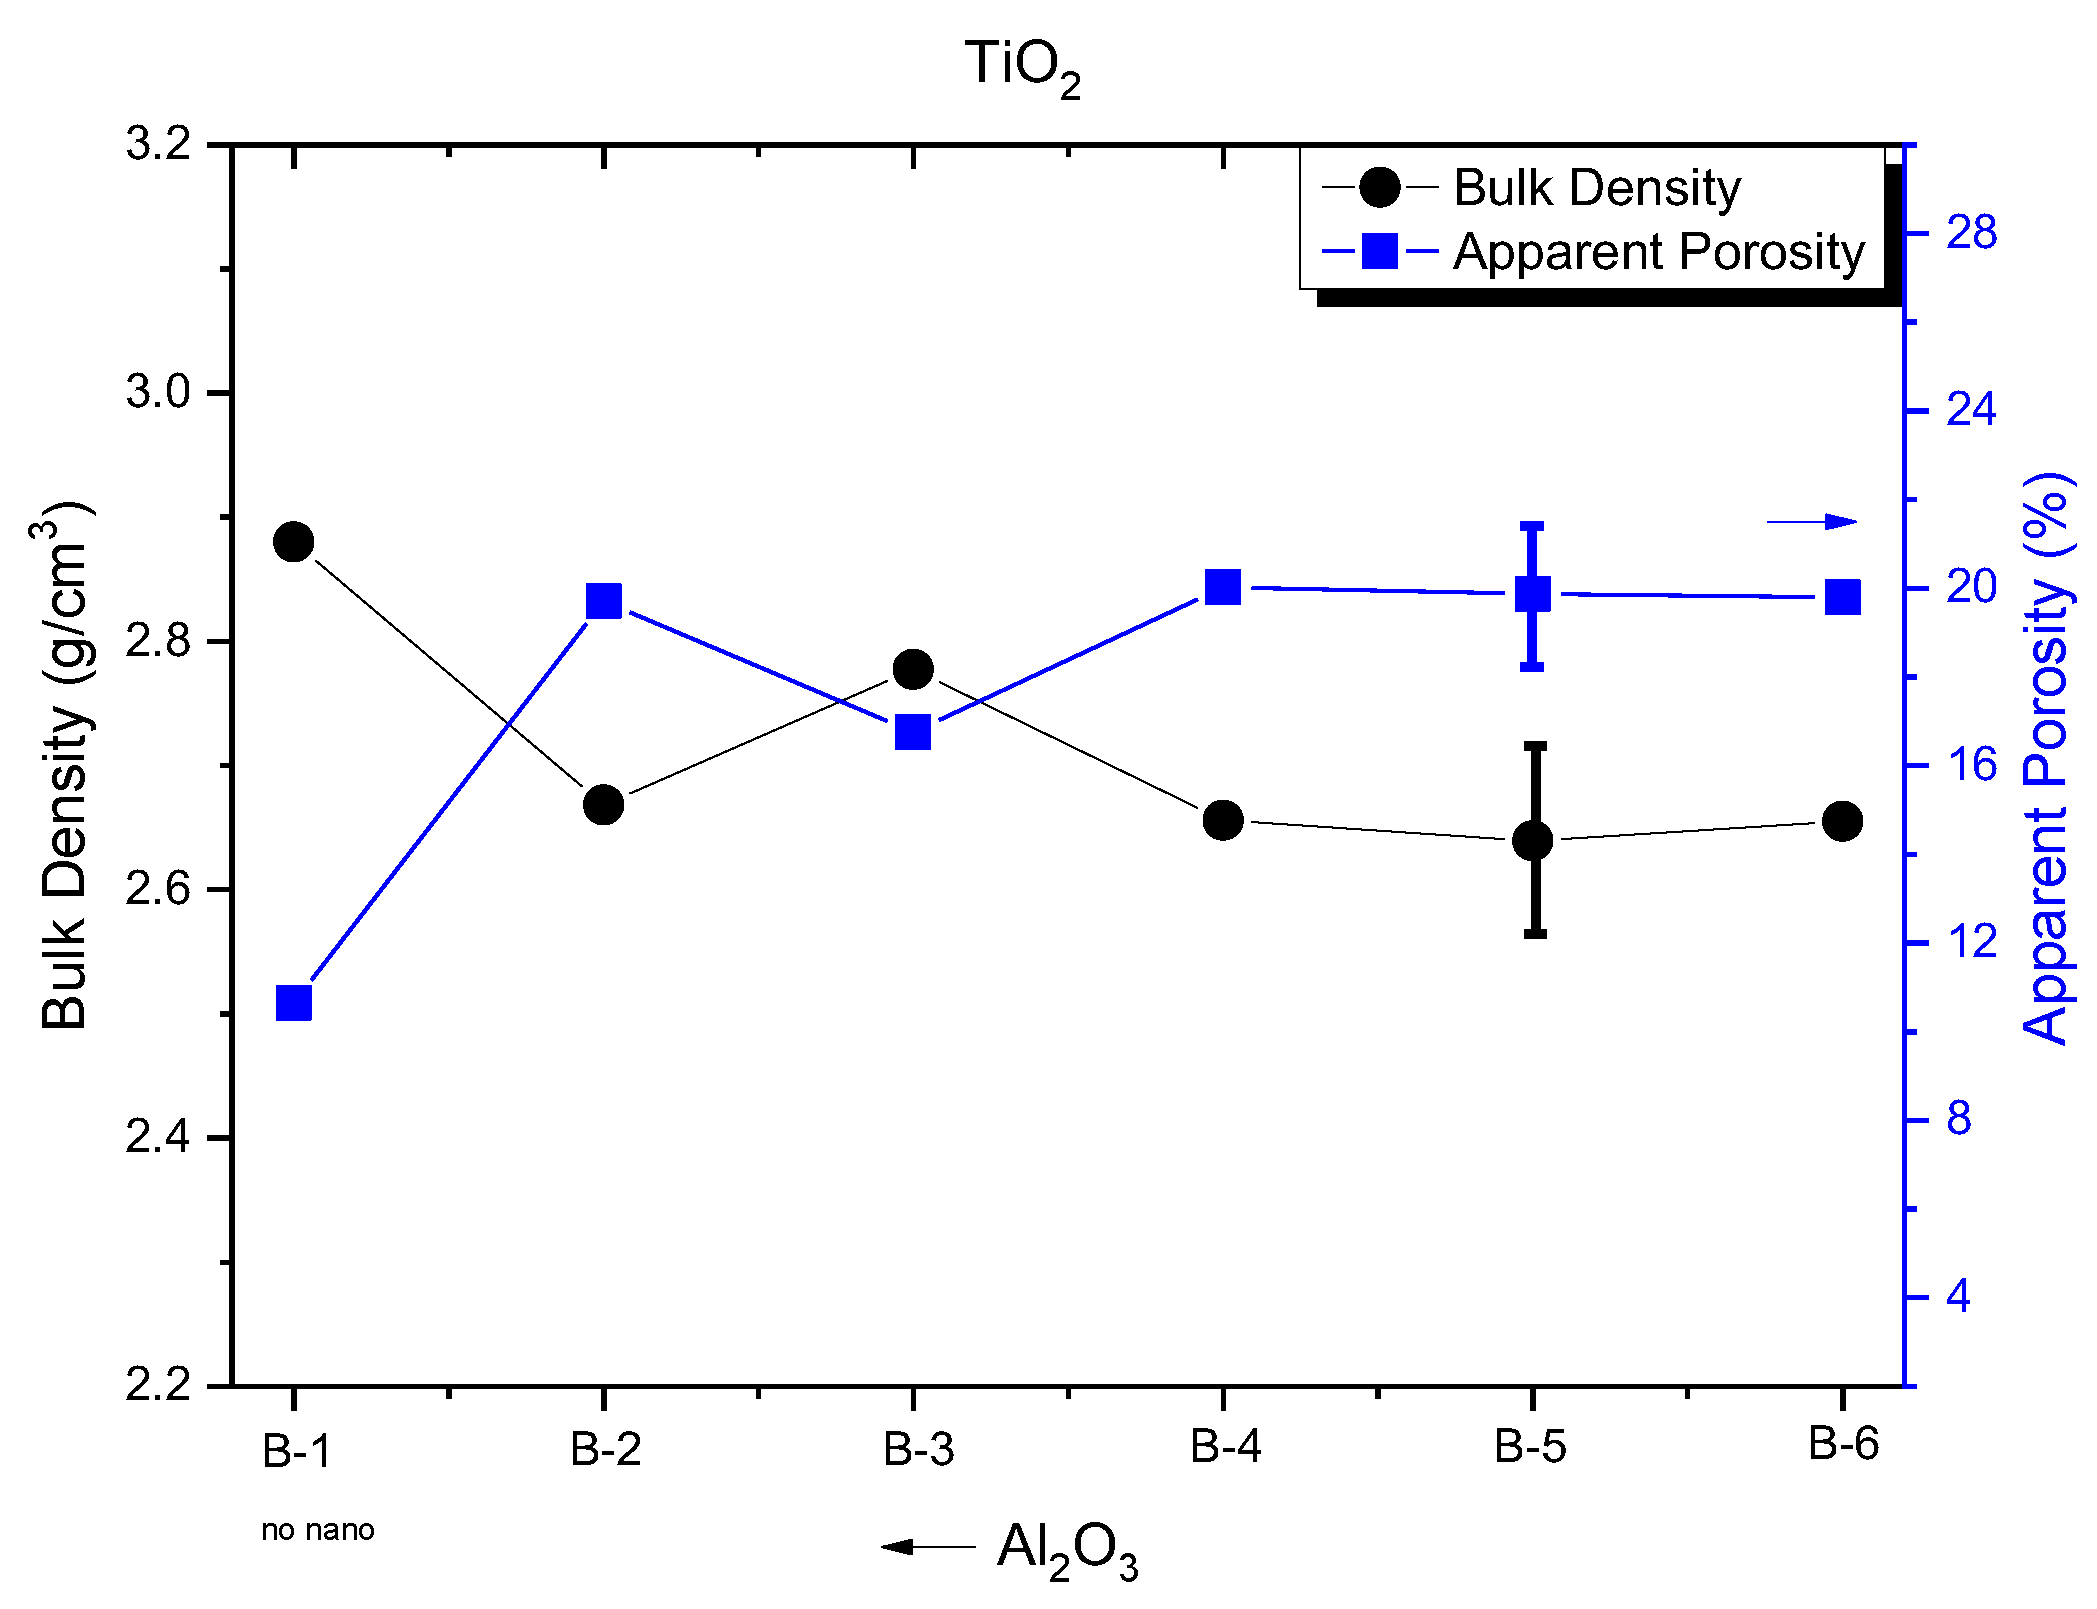
Figure 3.
Variation of cold crushing strength with the variation of Al₂O₃/TiO₂ ratio. S₁ and S₂ correspond to two compositions of the reference sample Β-1 containing 6% and 10% graphite, respectively.
Figure 3.
Variation of cold crushing strength with the variation of Al₂O₃/TiO₂ ratio. S₁ and S₂ correspond to two compositions of the reference sample Β-1 containing 6% and 10% graphite, respectively.
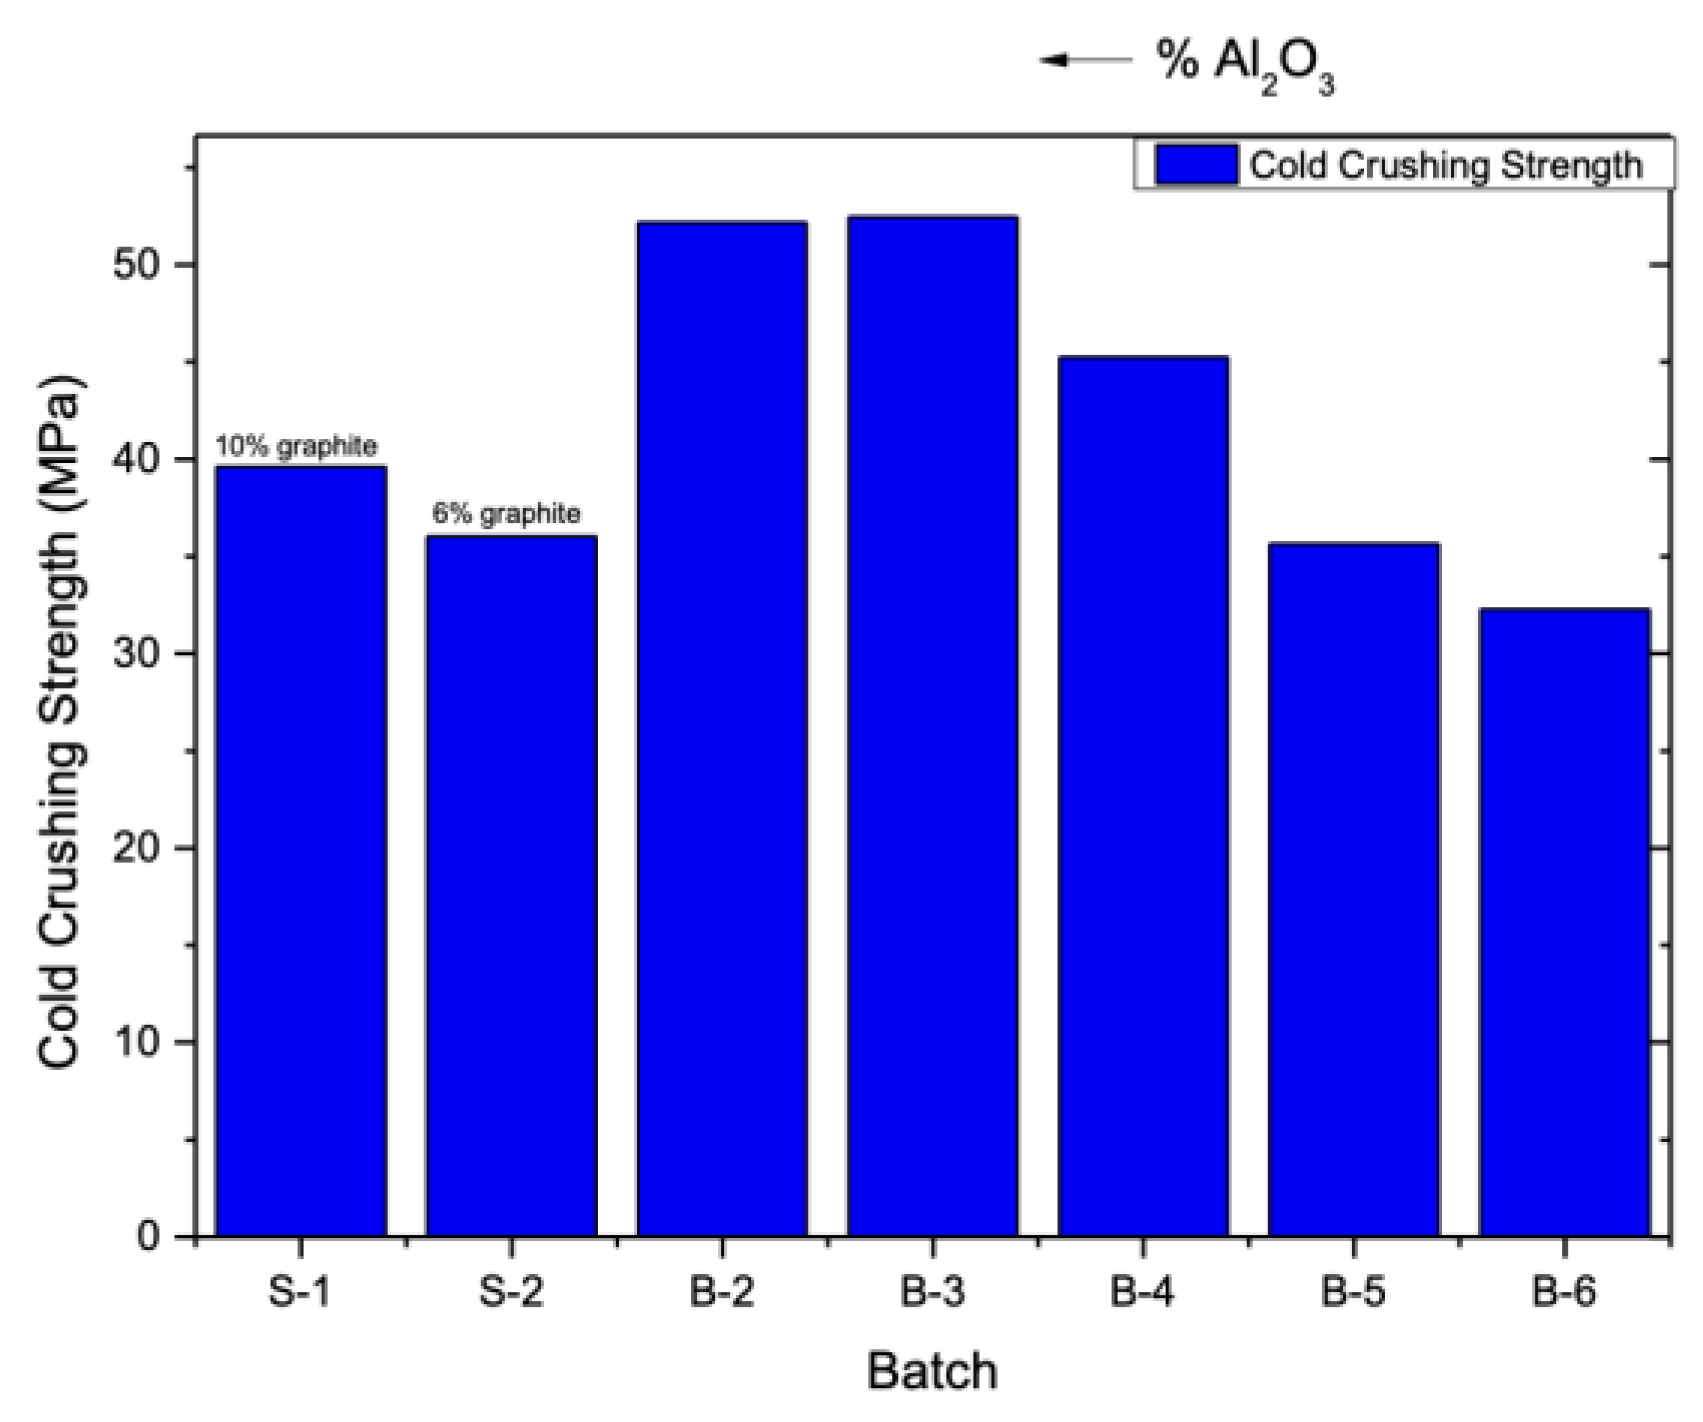
Figure 4.
Cylindrical specimen B-1 (a) and its possible sections for optical observations and tomography measurements (b).
Figure 4.
Cylindrical specimen B-1 (a) and its possible sections for optical observations and tomography measurements (b).

Figure 5.
Circular cross-sections of MgO-C refractory B-1, produced through horizontal cuts at various heights 1 (a), 2(b), and 3(c) using X-ray microtomography. Numbers 1, 2, and 3 correspond to cross-sections taken at the heights shown in Figure 4b.
Figure 5.
Circular cross-sections of MgO-C refractory B-1, produced through horizontal cuts at various heights 1 (a), 2(b), and 3(c) using X-ray microtomography. Numbers 1, 2, and 3 correspond to cross-sections taken at the heights shown in Figure 4b.
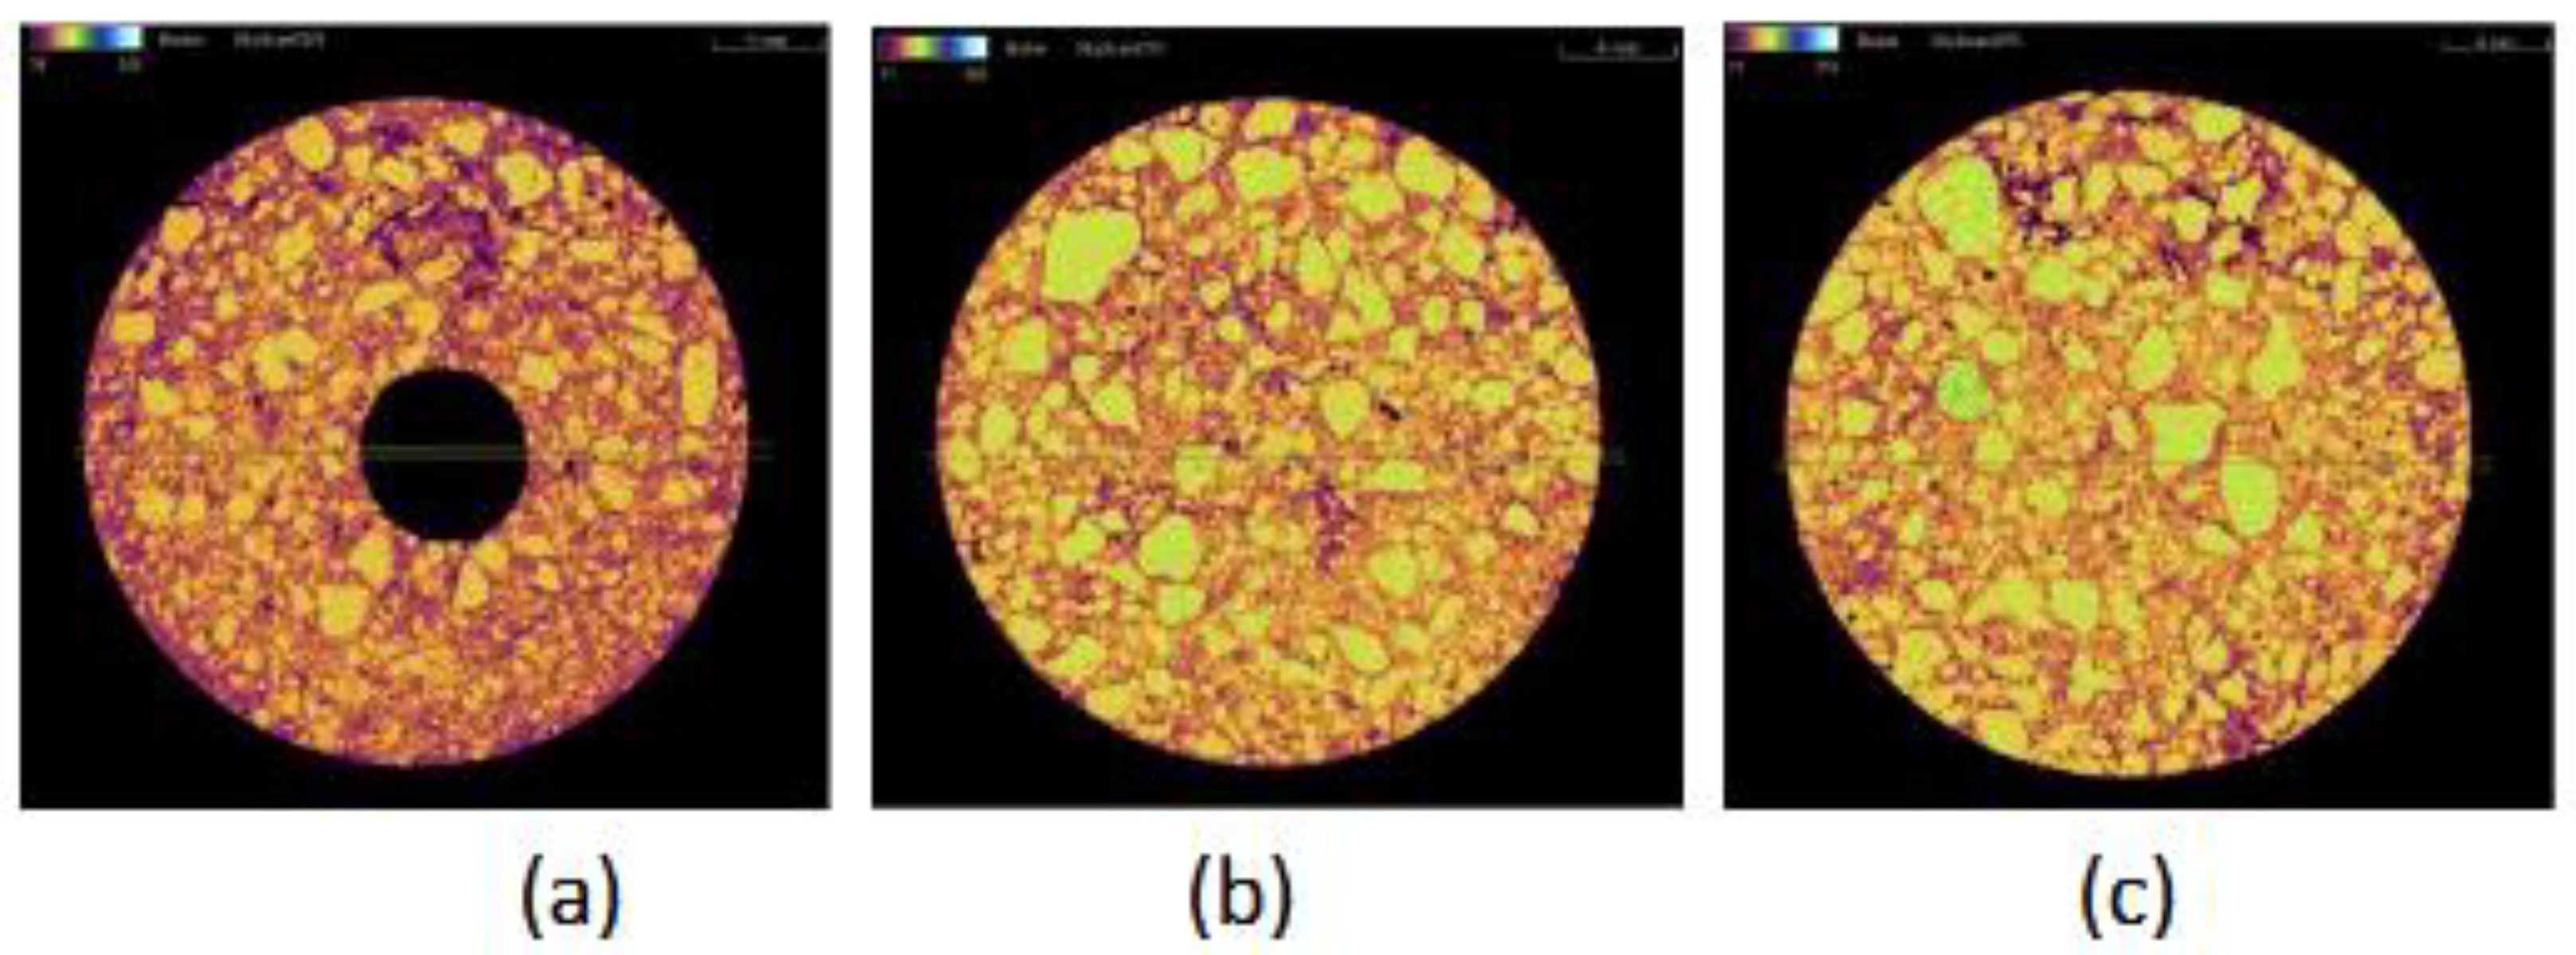
Figure 6.
Photograph of B-4 sample cut in half along its vertical axis (a) and its semicircular cross-sections produced through horizontal cuts at various heights 1 (b), 2(c), and 3(d) using X-ray microtomography. Numbers 1, 2, and 3 correspond to cross-sections taken at the heights shown in Figure 4b.
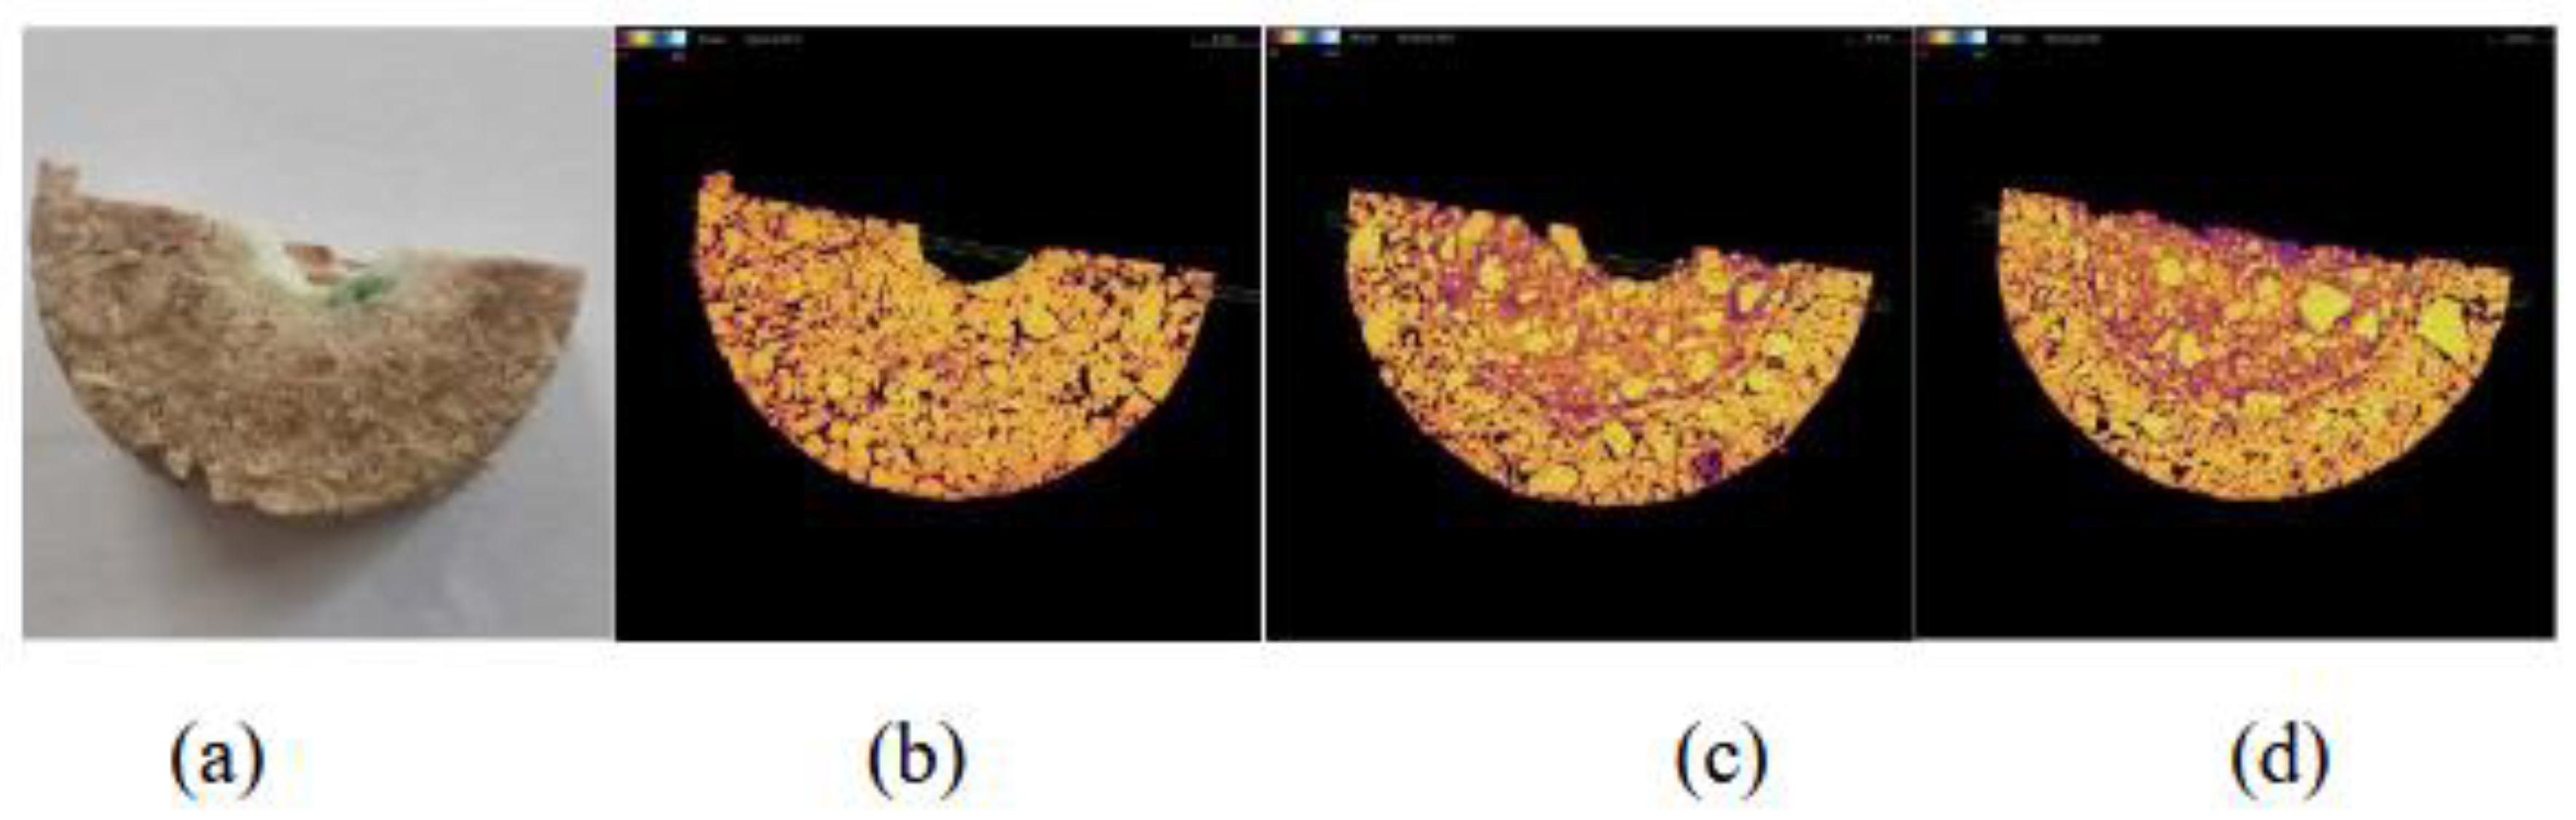
Figure 9.
Rectangular cross-section tomography images of MgO-C refractories B-2, B-4, and B-6, produced through a vertical cut in directions 1 (left) and 2(middle).
Figure 9.
Rectangular cross-section tomography images of MgO-C refractories B-2, B-4, and B-6, produced through a vertical cut in directions 1 (left) and 2(middle).
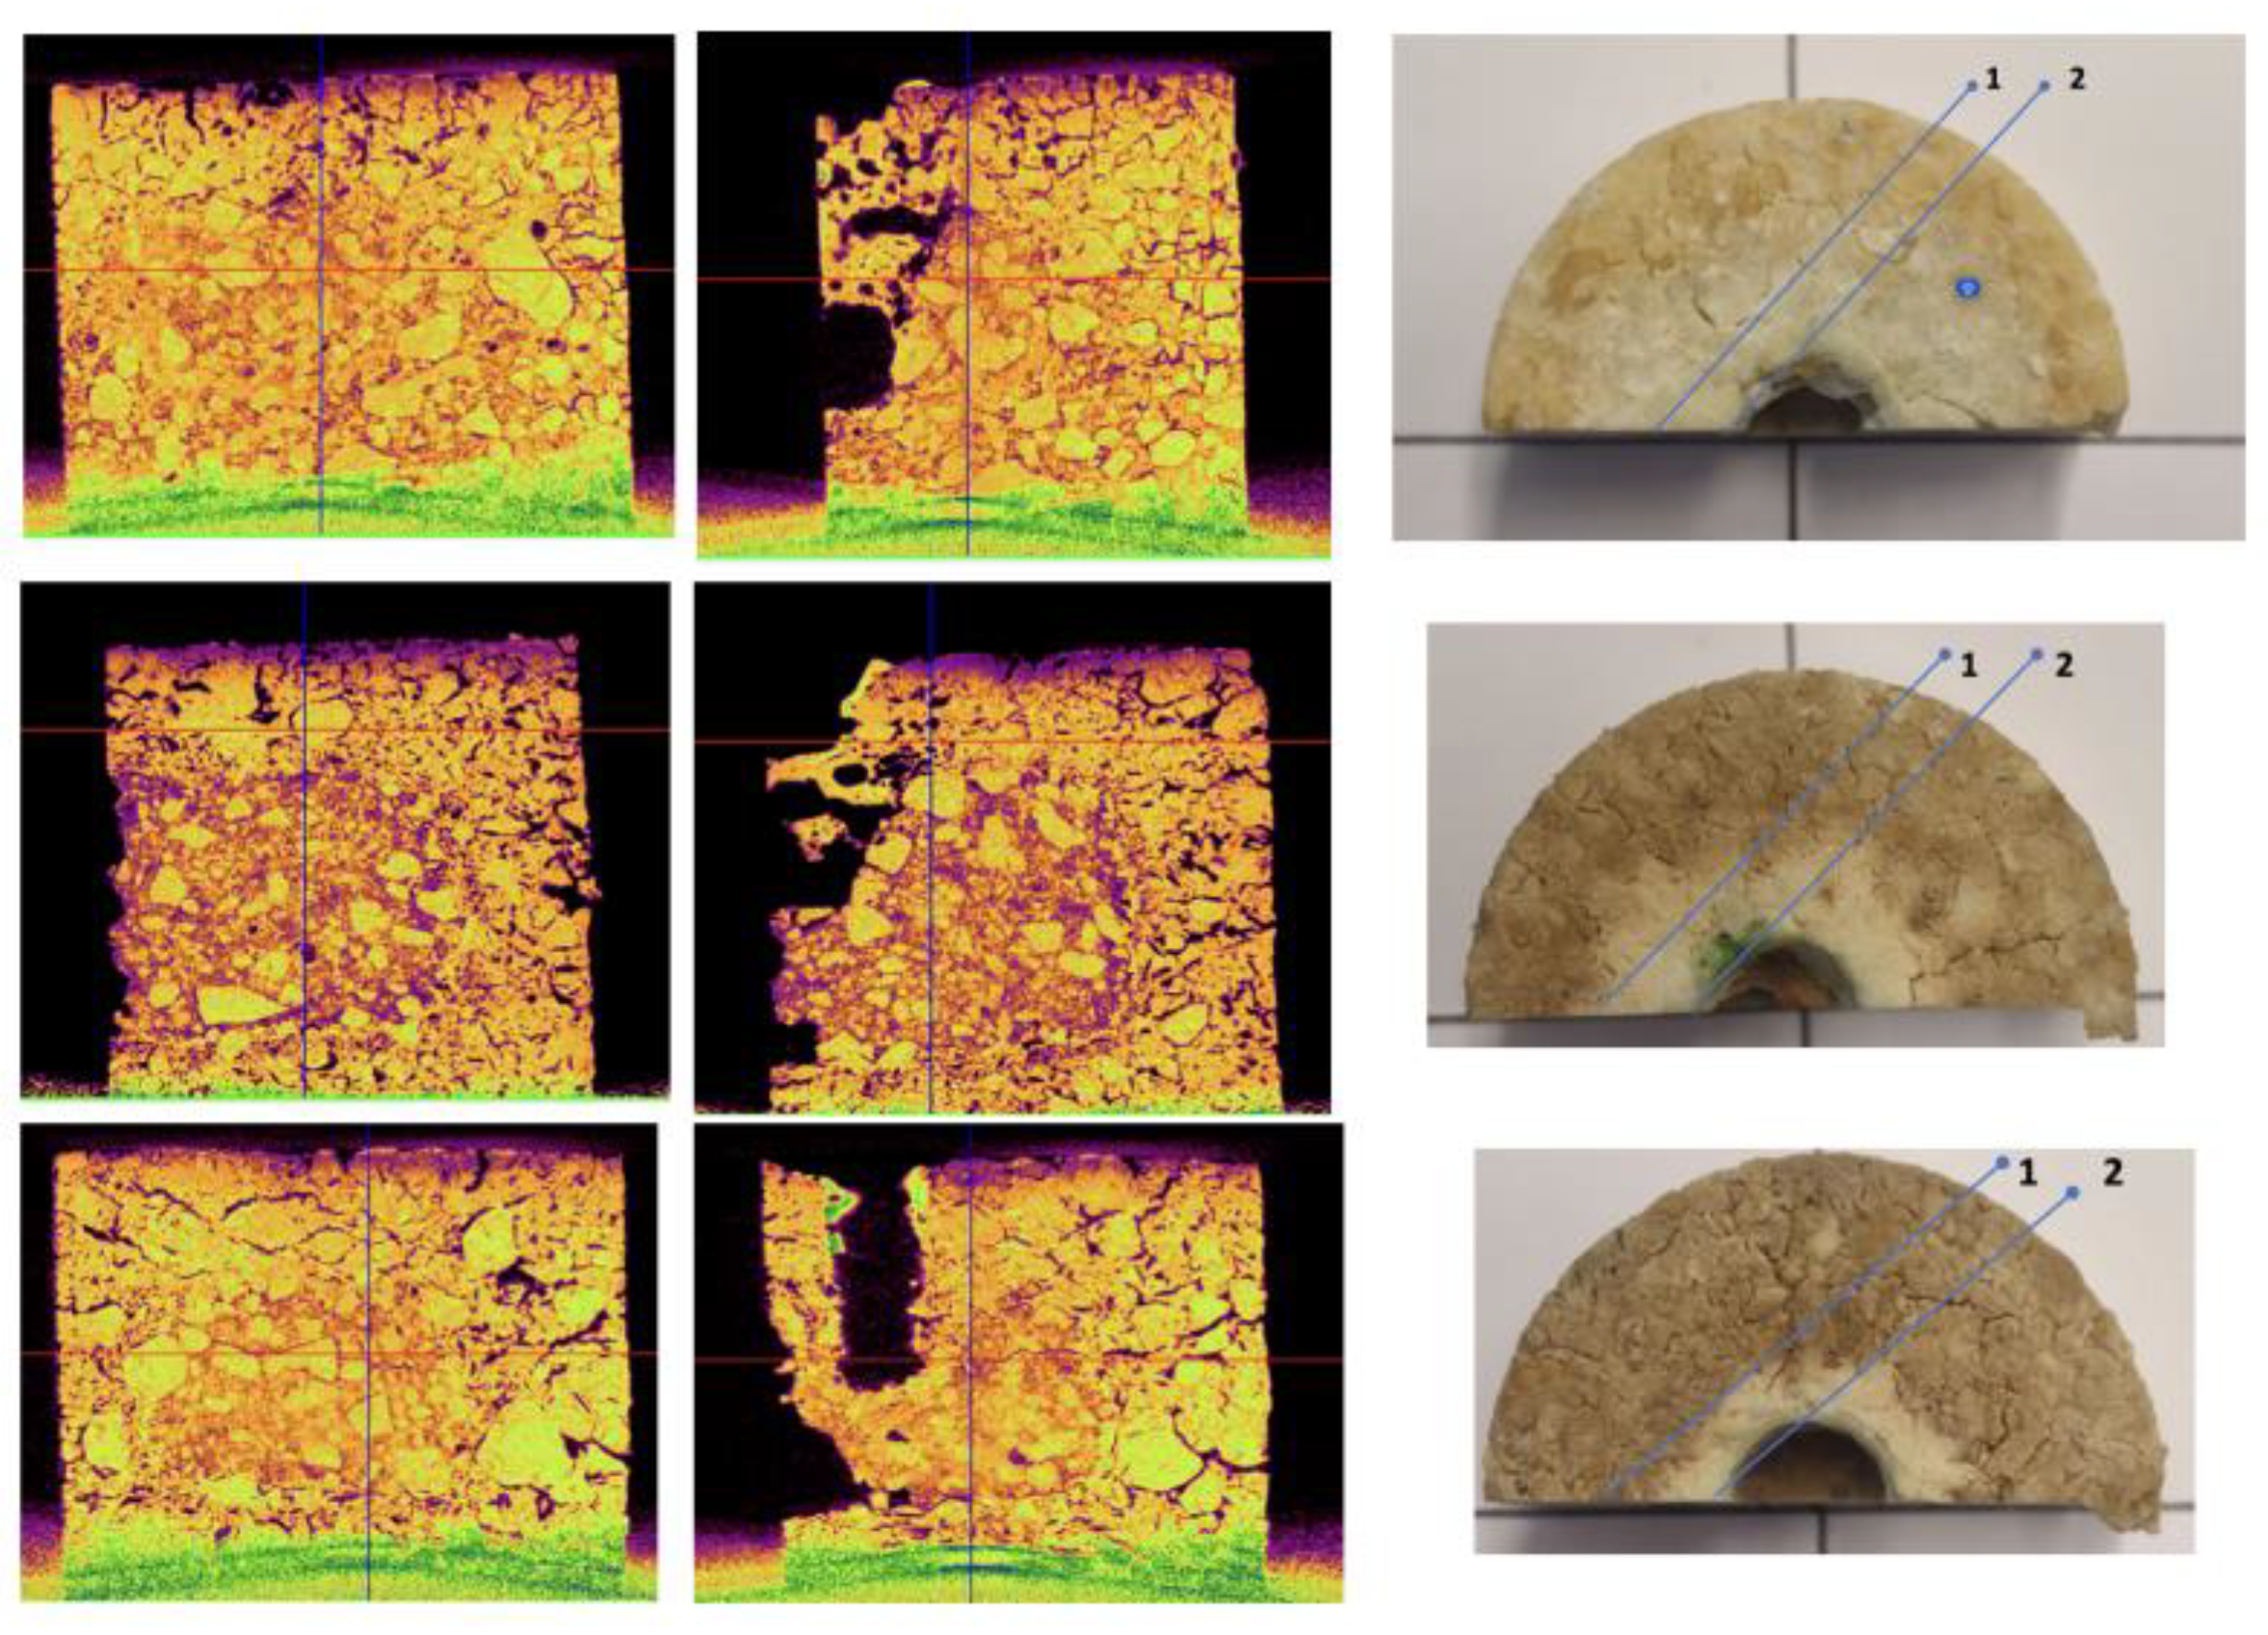
Figure 10.
(a) Representative 3D image obtained by μCT of reconstruction of the MgO-C refractory (B-4 specimen) (b) Visual representation of the isolated open and closed porosity of the sample (shown in light shading).
Figure 10.
(a) Representative 3D image obtained by μCT of reconstruction of the MgO-C refractory (B-4 specimen) (b) Visual representation of the isolated open and closed porosity of the sample (shown in light shading).
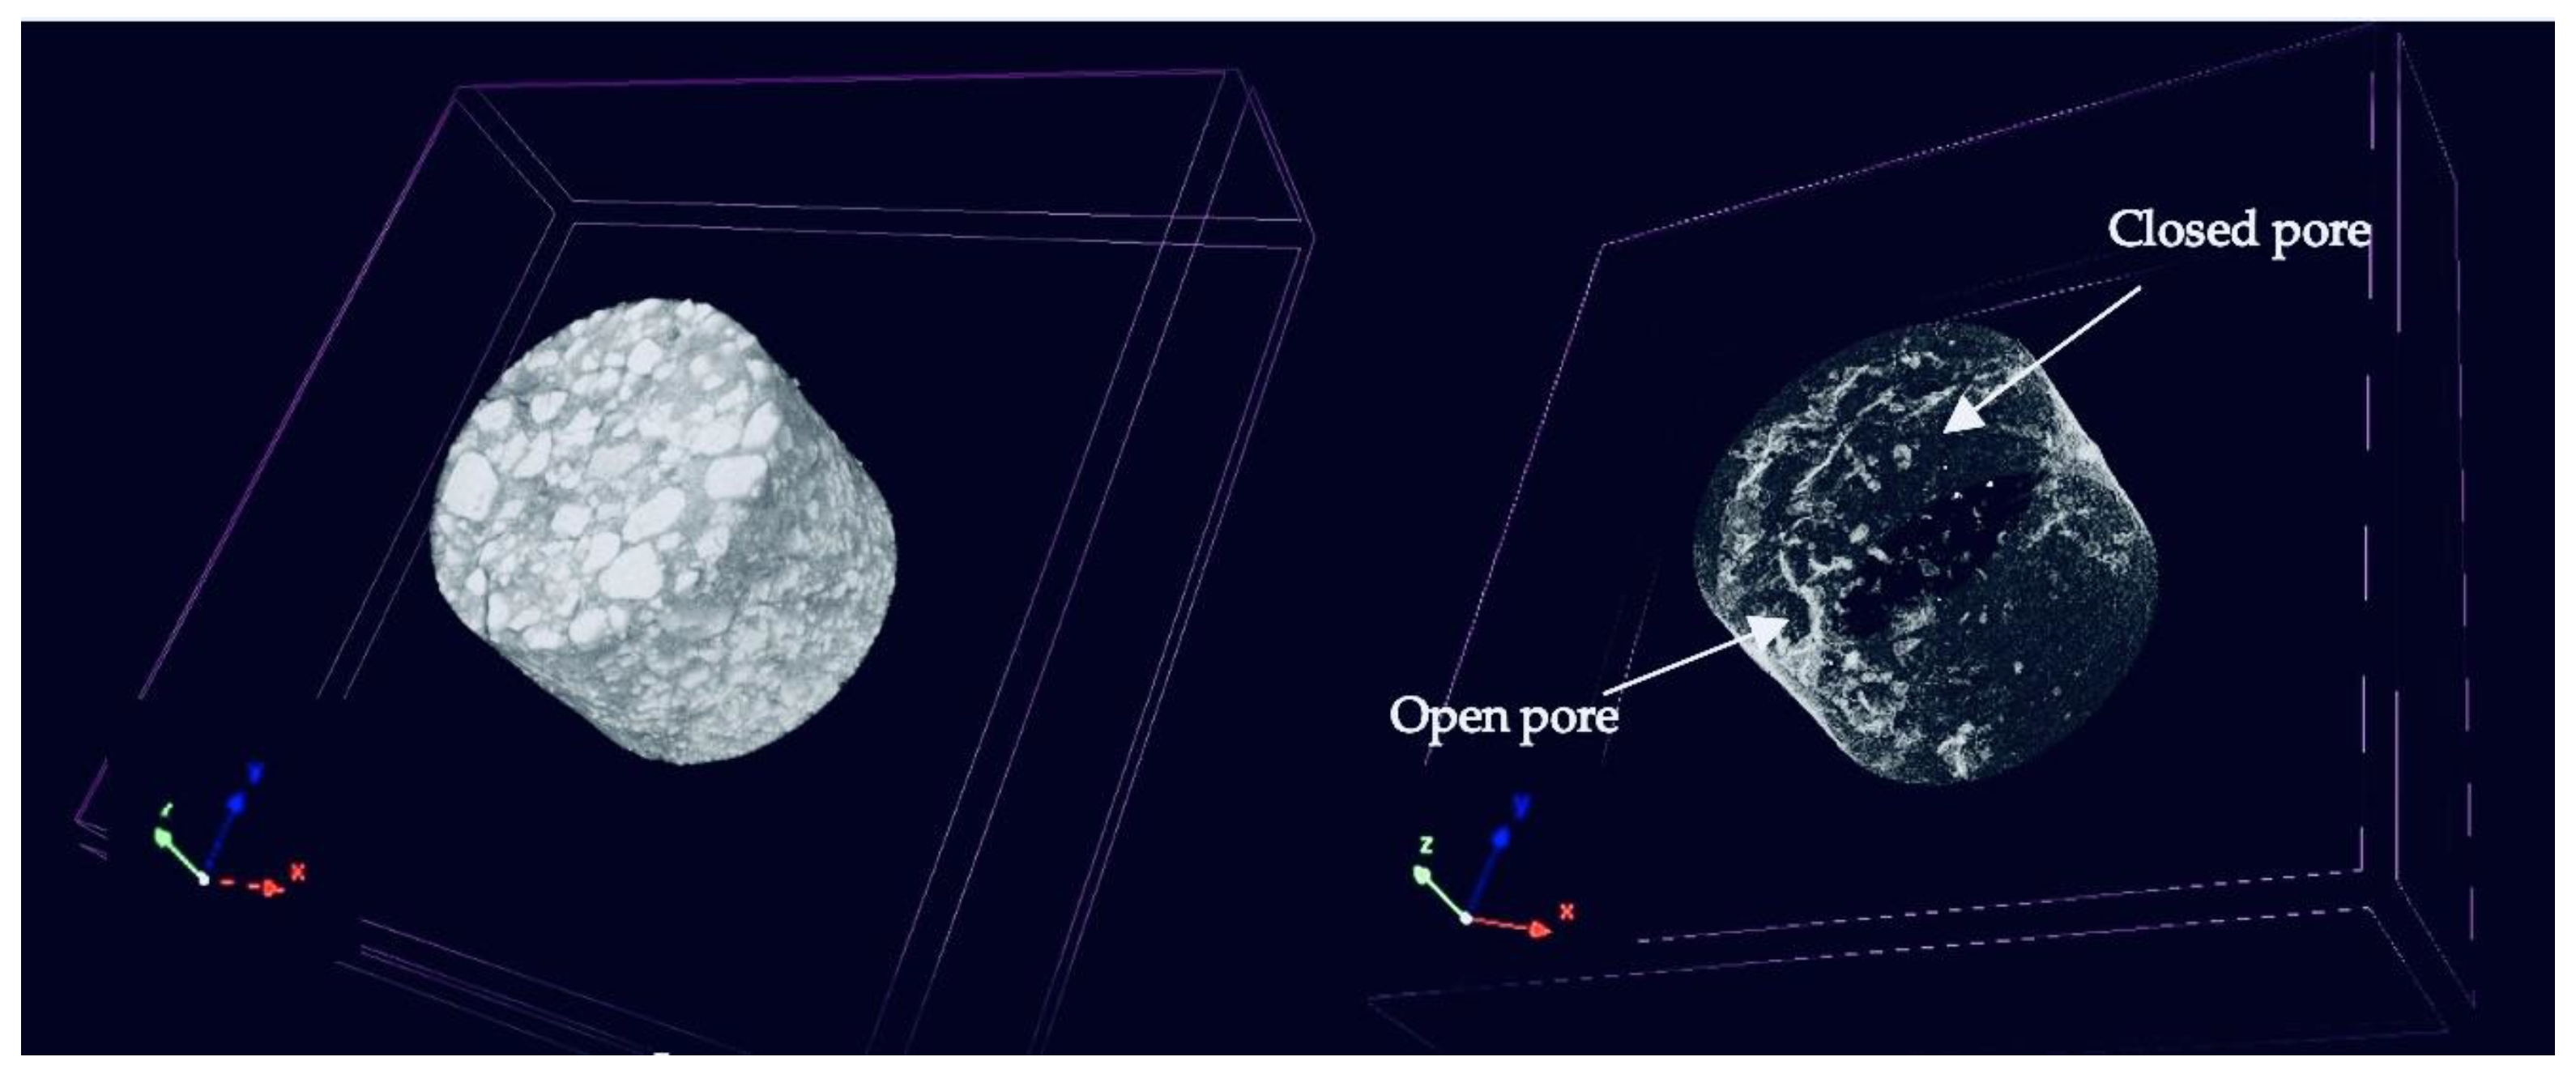
Figure 7.
Cross-sections of MgO-C specimens after oxidation and corrosion tests. The areas that appearing black indicate the presence of non-oxidized carbon (Al: Al2O3 NPs, Ti: TiO2 NPs).
Figure 7.
Cross-sections of MgO-C specimens after oxidation and corrosion tests. The areas that appearing black indicate the presence of non-oxidized carbon (Al: Al2O3 NPs, Ti: TiO2 NPs).
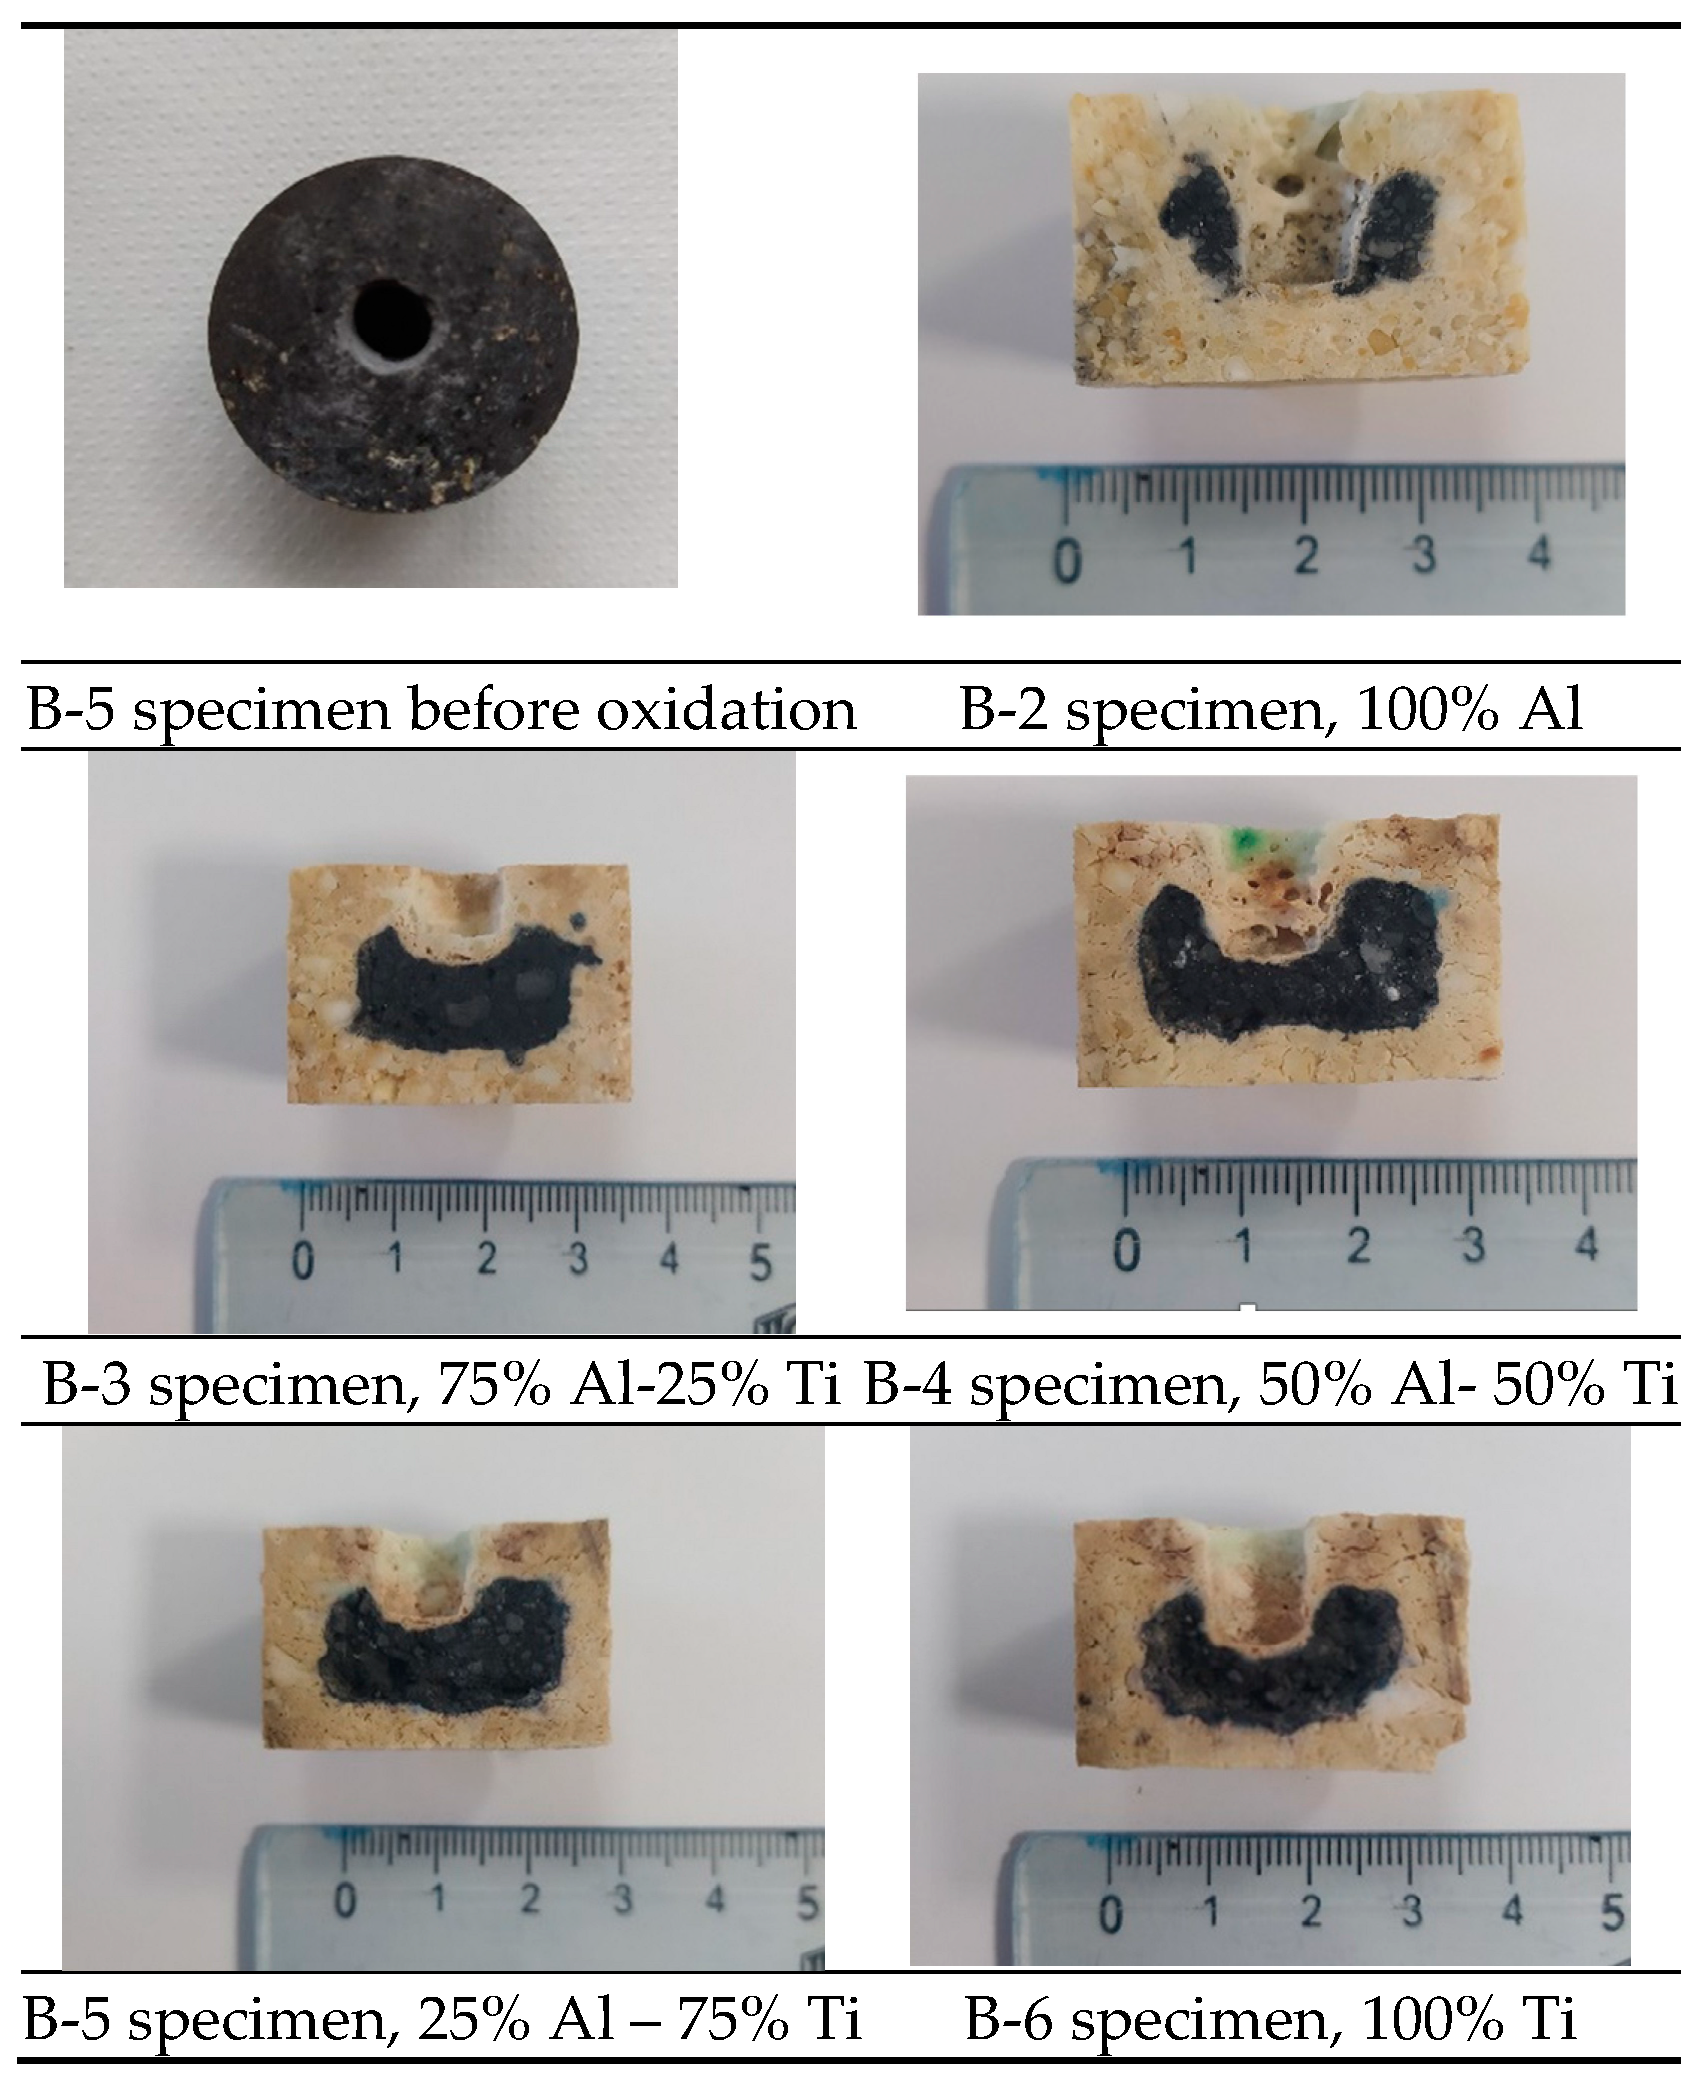
Figure 8.
Oxidation index of MgO-C samples obtained from cross-sectional analysis using μCT data and visual observation (VO). .
Figure 8.
Oxidation index of MgO-C samples obtained from cross-sectional analysis using μCT data and visual observation (VO). .
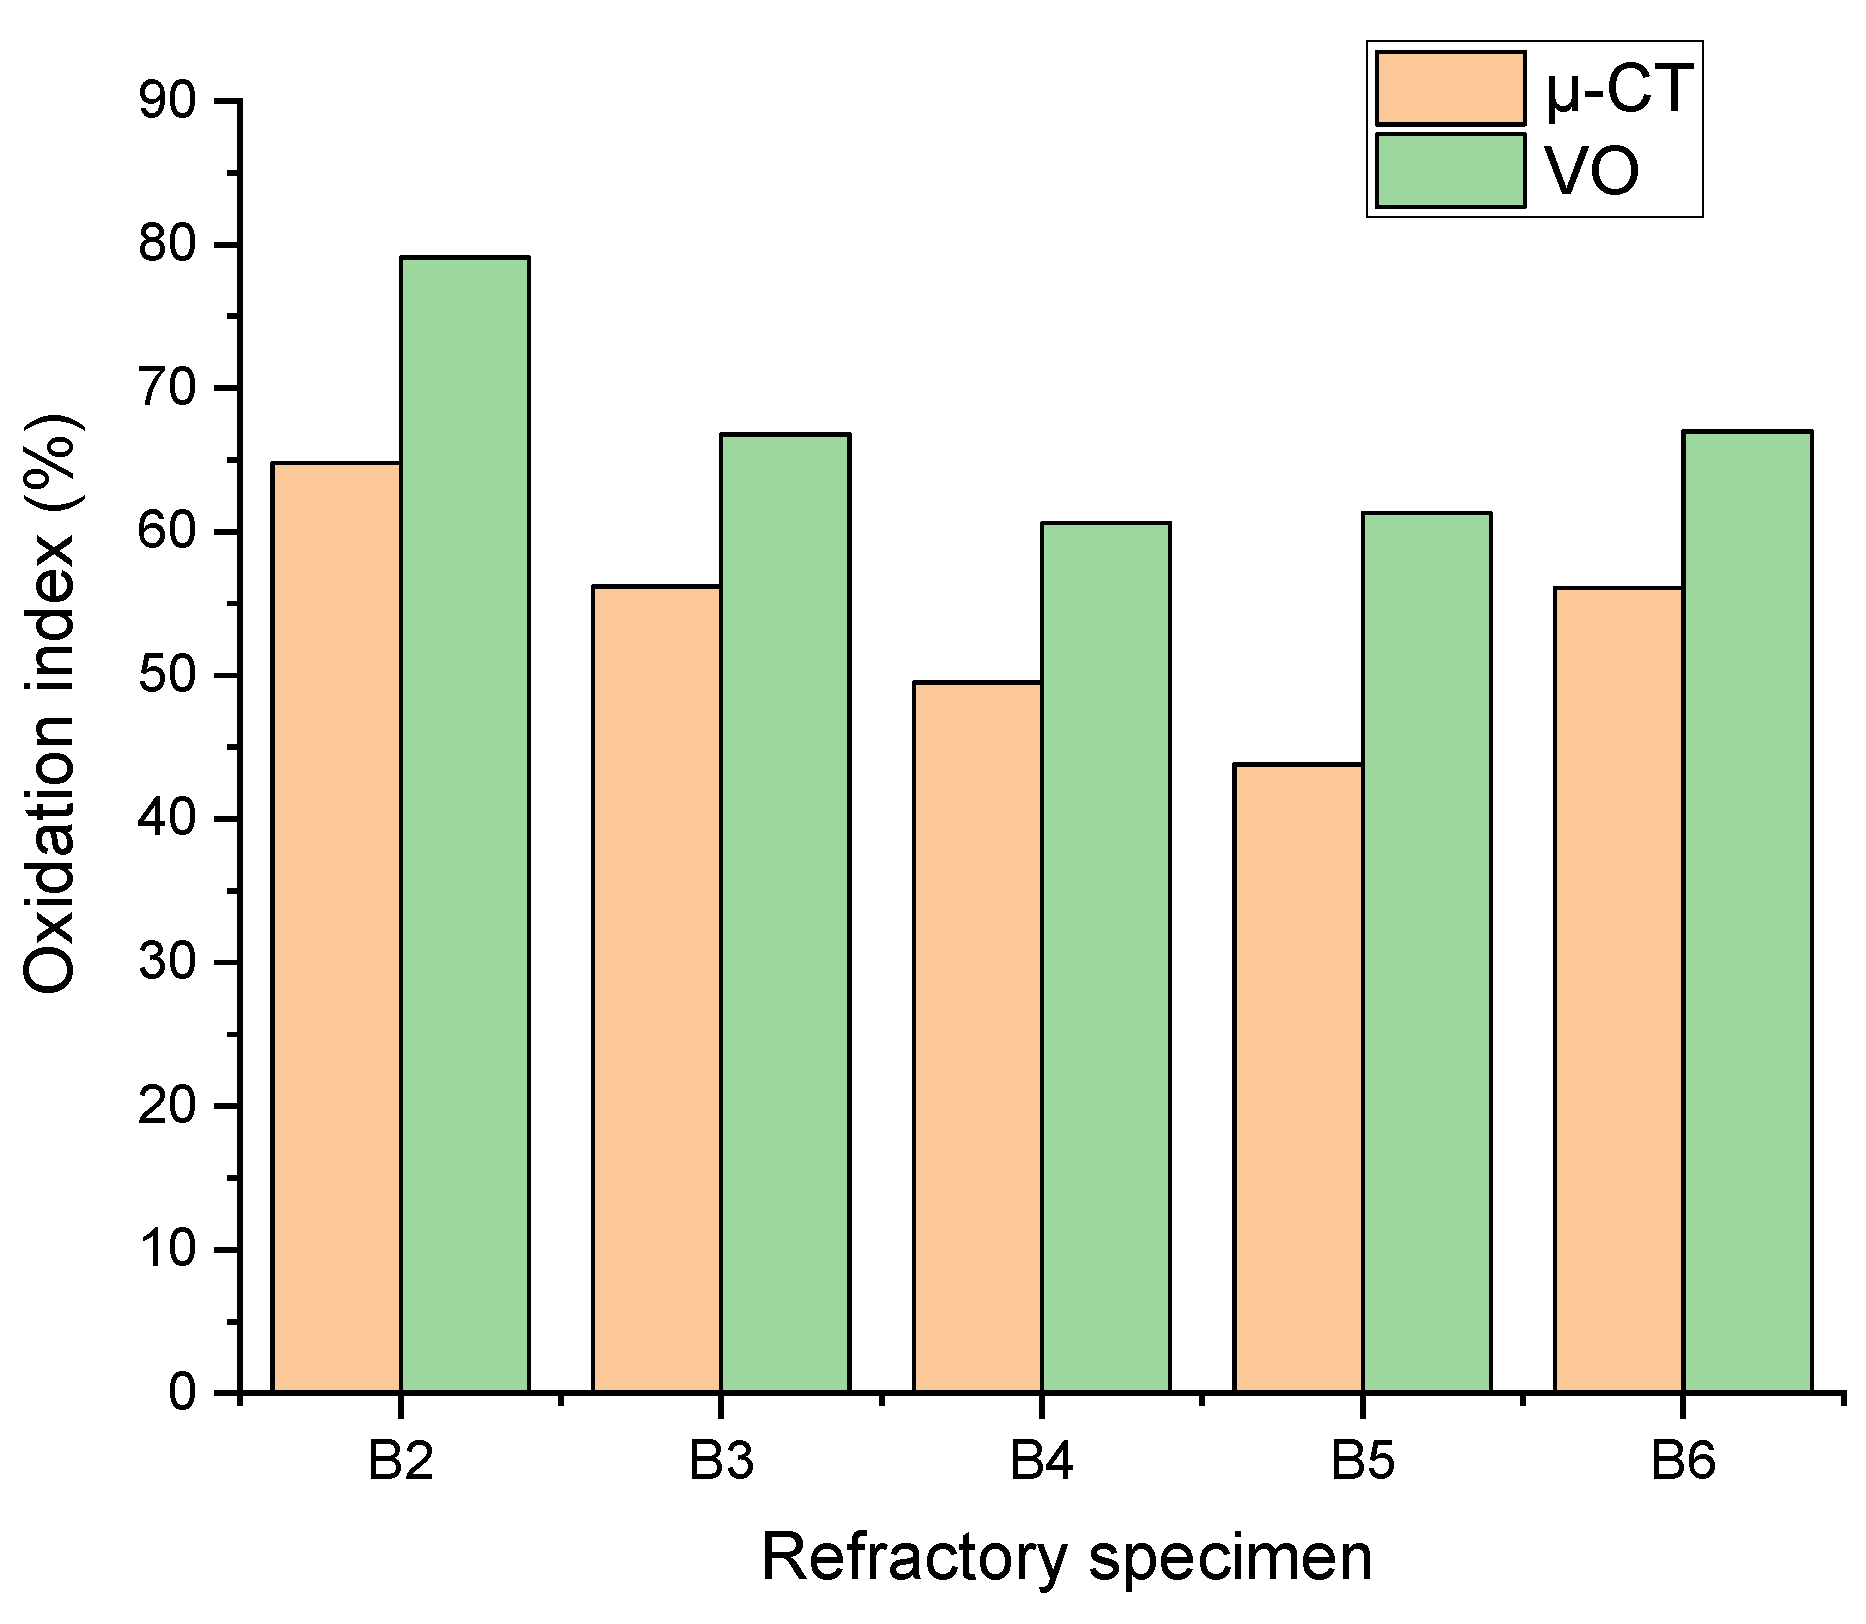

Table 1.
Batch composition.
| Raw materials/batch | B-1 | B-2 | B-3 | B-4 | B-5 | B-6 |
| MgO (3-5mm) | 3.68 | 3.68 | 3.68 | 3.68 | 3.68 | 3.68 |
| MgO (1-3mm) | 31.58 | 31.58 | 31.58 | 31.58 | 31.58 | 31.58 |
| MgO (0.5-1mm) | 14.74 | 14.74 | 14.74 | 14.74 | 14.74 | 14.74 |
| MgO (0-0.5mm) | 21.05 | 21.05 | 21.05 | 21.05 | 21.05 | 21.05 |
| MgO (200mesh) | 23.7 | 23.7 | 23.7 | 23.7 | 23.7 | 23.7 |
| Fine-grained graphite | 3 | 3 | 3 | 3 | 3 | 3 |
| Coarse graphite | 3 | 3 | 3 | 3 | 3 | 3 |
| Novolac Resin | 1.5 | 1.5 | 1.5 | 1.5 | 1.5 | 1.5 |
| Resol Resin | 5 | 5 | 5 | 5 | 5 | 5 |
| γ-alumina nanoparticles | - | 7 | 5.25 | 3.5 | 1.75 | - |
| anatase nanoparticles | - | - | 1.75 | 3.5 | 5.25 | 7 |
| Al metal powder | 0.5 | 0.5 | 0.5 | 0.5 | 0.5 | 0.5 |
| Boron carbide powder | 0.5 | 0.5 | 0.5 | 0.5 | 0.5 | 0.5 |
Table 2.
Mixing sequence of MgO-C specimens.
| Steps | Mixing sequence | Mixing time (min) |
| 1 | Coarse and medium magnesia | 1.0 |
| 2 | Addition of graphites, aluminium metal powder, boron carbide powder, novolak resin and a part of resol | 5.0 |
| 3 | Addition of magnesia 0-0.5mm, fine magnesia powder and the remaining resol resin | 10.0 |
Table 3.
Physical properties of MgO-C refractories concerning the ratio of Al2O3 and TiO2 nano additives.
Table 3.
Physical properties of MgO-C refractories concerning the ratio of Al2O3 and TiO2 nano additives.
| Batch | R (Al2O3/TiO2) |
B (g/cm3) |
P (%) |
W (%) |
T |
|---|---|---|---|---|---|
| B-1 | - | 2.88 | 10.65 | 3.70 | 3.22 |
| B-2 | 100 | 2.67 | 19.71 | 7.39 | 3.32 |
| B-3 | 75/25 | 2.78 | 16.76 | 6.03 | 3.34 |
| B-4 | 50/50 | 2.66 | 20.01 | 7.54 | 3.32 |
| B-5 | 25/75 | 2.64 | 19.87 | 7.54 | 2.39 |
| B-6 | 0 | 2.66 | 19.79 | 7.46 | 3.31 |
R: ratio of Al2O3/TiO2 nanoparticles equal to 7% wt of the initial batch. V: Exterior Volume, B: Bulk Density, P: Apparent Porosity, W: Water Absorption, T: Apparent Specific.
Disclaimer/Publisher’s Note: The statements, opinions and data contained in all publications are solely those of the individual author(s) and contributor(s) and not of MDPI and/or the editor(s). MDPI and/or the editor(s) disclaim responsibility for any injury to people or property resulting from any ideas, methods, instructions or products referred to in the content. |
© 2025 by the authors. Licensee MDPI, Basel, Switzerland. This article is an open access article distributed under the terms and conditions of the Creative Commons Attribution (CC BY) license (http://creativecommons.org/licenses/by/4.0/).
Copyright: This open access article is published under a Creative Commons CC BY 4.0 license, which permit the free download, distribution, and reuse, provided that the author and preprint are cited in any reuse.


