
Submitted:
09 May 2025
Posted:
09 May 2025
You are already at the latest version
Abstract
The paper aims to provide a flood prediction system in the Philippines to increase flood awareness, which may help reduce property damage and save lives. Real-time flood status can significantly increase community awareness and preparedness. A flood model will simulate the flood level with secured data flow from the sensor to the cloud. The algorithms embedded in the flood predicting model include Fuzzy Logic, LSTM neural network, and Genetic Algorithm. The project uses the Infineon security module to create a secure connection from the setup to the AWS. All data transmitted are encrypted when sending it to AWS IoT Core, Timestream, and Grafana. After training and testing, the Neuro-Fuzzy LSTM Network with Genetic Algorithm solution has improved flood prediction accuracy by 92.91% compared to the ADAM solver that predicts every 2 hours using an 0.02 initial learning rate, 1000 LSTM Hidden Layers, and 1000 epochs. The best solution predicts flood every 3 hours using an ADAM solver, a 0.01 initial learning rate, and 244 LSTM Hidden Layers for 158 epochs.
Keywords:
LSTM
; Fuzzy Inference System
; Genetic Algorithm
; Flood Prediction
1. Introduction
Every year, the Philippines experiences heavy rains and severe weather conditions brought by typhoons or monsoons, which cause high levels of floods. Brown, muddy waters covered most communities and cities in the Philippines. Several towns are submerged. This natural disaster often leads to the loss of life, damages properties, and halts economic growth. In addition, climate change worldwide is making floods severe by having a longer duration of rainfall and increased precipitation. Aside from this, the water drainage systems, rivers, and dams have only a limited amount of water to hold. Therefore, if heavy rainfall occurs, it will contribute to more flooding.
Aside from the Philippines, several states in India also suffer from severe flooding every year. The problem in India is improper early warning signs and heavy storms during monsoons [1]. In Malaysia, natural disasters and human errors also cause floods. The poor design of drainage systems and heavy monsoon rains cause damage to property and loss of lives [2]. Malaysia and the Philippines have the same classification of floods: flash floods that occur without warning and monsoon floods caused by winds [3]. Nevertheless, floods will invariably cause damage and loss of lives if the community is unprepared or disseminates little information.
Several studies have made progress on flood monitoring and prediction systems. A study on smart flood monitoring systems used IoT and Neural Networks (NN) to enhance the scalability and reliability of the system. Moreover, the system correlates the measured parameters such as humidity, temperature, pressure, rainfall, and river water level [1]. In another study on flood monitoring systems using IoT with machine learning, an ultrasonic sensor continuously monitors the water level and sends the data over the cloud using Arduino Uno and Raspberry Pi. People will receive alert messages on their phones whenever the water level reaches a critical level [2].
In this project, the Internet of Things (IoT) uses real-time data encryption for data security on the cloud while providing real-time flood monitoring necessary to develop the Neuro-Fuzzy Network-based flood prediction system. Even though the Internet of Things cannot prevent floods, the system will provide real-time encryption of the information and warning signals that an incoming flood is about to happen based on gathered data. The system will use different sensors to measure atmospheric pressure, surrounding temperature, presence of rain, relative humidity, and flood level, providing information for the flood prediction system to forecast the upcoming flood. Also, information will be available in real time for public announcements and actions.
Review of Related Literature
In Maritime Southeast Asia, the Philippines is considered a medium vulnerability to flood disasters. Yet, along with the clusters of countries that belong to this echelon, the country has the lowest efficiency in managing floods, ranking fourth to Thailand, Myanmar, and Indonesia, respectively [4]. This being said, there has been an increase in journal articles published that optimize the use of IoT and camera sensors to improve flood management [5,6,7,8]. Despite this increase, the articles highlight the lack of research on floods affecting coastal areas where the Philippines, as an archipelago, contains cities in these areas. This was further corroborated by the work of Song [9], in their bibliometric literature review, sharing that articles focusing on flood monitoring have increased since 2017. They concluded from their review that flood monitoring should be managed using multiple data sources as well as providing real-time data through open-source software, websites, and free online services [10]. The Internet of Things has also helped store such data, a common practice in developed countries [7].
In a systematic review and meta-analysis by Ahmed [11] using the PRISMA protocol, 60 papers have surfaced on low-cost sensors focusing on a similar study [10] focusing solely on coastal areas impacted by frequent flooding. This was an anti-thesis to the study of Islam [12], in which the study used sophisticated satellites [13] and concluded that the images should contain waterbody segmentation to alert the area prone to flooding. Iqbal [14] suggested using drones in monitoring and maintained that such a method would be the most effective. However, floods in the Philippines are usually caused by typhoons, a meteorological occurrence that brings heavy rains and strong winds; thus, utilizing a drone to monitor them is quite a risk. No study has been made on whether drones can withstand high-speed winds and capture images while on flight.
In summary, the flood monitoring literature has gradually increased, proposing various methods for monitoring water levels and optimizing technology. This paper aims to contribute to the body of knowledge by incorporating various technologies to aid in the current situation of a developing country with many coastal areas that annually receive heavy rainfall and flooding. This research will not focus on the monitoring alone but rather on forecasting to enable potential victims to evacuate sooner to safer areas.
Current Practices
The research team met with the City Engineering Department of the Local Government Unit on 28 May 2024 during their monthly meeting with various stakeholders. The meeting held in Century Park Hotel was attended by the Manila Electric Company, the Maynilad Water Services Inc., Consultants of the City Engineering Office - Woodlands Consultants, Inc., the education sector represented by various universities situated in the city, and Museo Pambata (a public museum for children), among others. The agenda of the meeting was the Drainage Masterplan of the City of Manila. The meeting addresses the prevalent issue of flooding in the city, which leads to regular work and school cancellations. Inviting various government agencies is significant because the drainage issue does not lie in the public works initiated by the local government unit alone. The findings of the consultancy company present the issue of the other structures that will be impacted by the drainage management system owned by the water and electric companies. The consultancy company presented its progress reports, such as the selected priority areas for drainage in Manila, the various drainage management schemes, and its selection criteria. Table 1 presents the selection criteria.
Using Table 1 as the criteria for consideration has important implications for ensuring the effectiveness of the drainage improvement schemes. There is a lack of standardization regarding the construction of drainage systems in the city, as the contractors have changed every time a new leadership in the LGU takes place over the years. To tackle this issue, the consultants presented three distinctive schemes that offer tailored solutions to accommodate the diverse conditions while focusing on the effectiveness and efficiency of addressing drainage problems. These schemes aim to implement improvements based on the specific needs of various areas. A scheme is defined as a comprehensive plan or strategy designed to enhance the capacity and efficiency of a drainage system [4].
Based on the foregoing brief literature review section of the introduction and current practices, this paper sees the need to achieve a flood monitoring and forecasting system framework that is relevant, focused, and connected to the current situation and scenario of a developing country. Despite previous research, the question of whether flood monitoring can predict or forecast a flood is still unavailable in the literature. This paper aims to investigate these two using the most economical methods that can easily be adaptive in the public sector of a developing country.
The remainder of this paper is structured as follows: related works on flood monitoring systems, flood prediction systems, and fuzzy logic; the methodology for how the systems were put together and finally, the conclusion and patents.
2. Related Works
2.1. Flood Monitoring Systems
Flood monitoring is a critical concern for many regions due to the potential for severe damage. Various studies have explored different approaches to designing effective flood monitoring systems such as wireless sensor networks, GPS, SMS, Satellites, IoT, and artificial neural networks. The studies on wireless sensor networks [15,16] allow the transmission of data and early warning signals over long distances that are essential for evacuation planning. Different algorithms are used to assess the situations such as Voting and Decision Tree [17]. Aside from this, some studies show the applications of GPS-based flood monitoring systems with alerts sent via SMS [18,19]. This approach ensures timely updates and alerts for residents, making it easier to respond to potential flooding situations.
The applications of the Internet of Things (IoT) have extended to flood monitoring systems because the Internet has become widely available to consumers. There are now several flood monitoring studies with IoT. Some studies monitor river levels that may affect nearby communities [1,2], and monitor road conditions affected by flood to provide alternative routes to decongest traffic [20].
Now, with the availability of Amazon Web Services (AWS), IoT-based flood monitoring data can be securely stored in the cloud. With data processing and analytics of flood data, rescue operations are possible with AWS [21]. In another study, Grafana in AWS was used to visualize data based on the water level inside the pipe [22]. Moreover, the formula for converting pressure inside the tube into height in meters is Eqn. (1).
Where is the total flood height, is the measured air pressure by the DPS310 sensor, is the atmospheric pressure, is the specific gravity of water, is the height of the tube, and is the offset of the pipe from the ground.
Some studies tried monitoring flood levels with different parameters such as rainfall rate and soil moisture [23,24]. Lastly, it is essential to determine the differences, strengths, and weaknesses of flood monitoring and forecasting systems [25]. In a flood warning system, the dissemination speed of the warning is very important because of the small amount of time to implement emergency response. On the other hand, flood forecasting systems aim to provide reliable information and effective dissemination of information. The forecasting systems are usually designed on different algorithms and models.
2.2. Flood Prediction Systems
When machine learning is applied to flood monitoring systems, flood prediction becomes possible. There are different types and different architectures with varying depths created and designed for specific applications such as image recognition, speech recognition, approximation, regression, classification, time series forecasting, and natural language processing. Now, cameras have become a crucial tool in flood monitoring due to the variety of algorithms that can be applied for specific applications. These algorithms enhance the capabilities of cameras to detect, analyze, and interpret flood-related data effectively. For instance, a Convolutional Neural Network (CNN) is used for image recognition and processing. It can analyze images to identify the status of rising water levels in gullies and drainages [26], and to classify 1-D data [27]. In some cases, CNN performs better than the Support Vector Machine (SVM) and Linear Regression algorithms.
When sensors collect data over time, it is called time-series data. Predicting such as flood levels becomes accurate because of patterns in time. Thus, the timestamp of each data is essential. Different studies on machine learning predict flood levels based on different parameters such as flood height readings of the ultrasonic sensor [28], flow rate [29], and weather patterns (temperature, humidity, atmospheric pressure, UV index, and rainfall intensity) [30]. When the Voting Classifier model is integrated with the Random Forest and Extreme Gradient Boosting Algorithm used to forecast flood at a rate of water, gauge height, turbidity, and temperature, the system is 99% accurate [31].
Other studies developed short-term flood prediction systems with Artificial Neural Network-Long Short-Term Memory (ANN-LSTM) based on sensor readings [32]. LSTM (Long-Short Term Memory) network is a specific type of Recurrent Neural Network (RNN), which is a type of Deep Neural Network (DNN). RNNs and LSTMs can remember the previous state and use it to predict the output, which is helpful for time series, text, and speech applications. In [33], the system predicts 5 days into the future to control water management and irrigation. Typically, Root mean square error (RMSE) is used to check the performance of the neural network. In [24], root mean square deviation (RMSD) was used to check the performance of the neural network. It is possible to combine CNN and LSTM called ConvLSTM for flood forecasting [34].
Some papers compare the performance of different neural networks to determine the best algorithm. For instance, LSTM performed better than the ARIMA algorithm [35] [36] based on RMSE and Mean Absolute Error (MAE). Another study [37] showed that CNN-GRU (Gated Recurrent Unit) performed better than ARIMA, WANN (Wavelet-based ANN), and LSTM models. Performance was based on the Nash-Sutcliffe efficiency coefficient (NSE), average relative error (MRE), and RMSE. Then, among the different MLP models (such as Optimized MLP, MLP-GA (Genetic Algorithm), MLP-BA (Bat Algorithm), and MLP-BA-GA), the MLP-BA-GA performed the best [38]. Finally, in [39] [36], the LSTM performed best when compared to MLP and GRU based on RMSE and NSE. However, the Hybrid system is better than LSTM [36]. This hybrid model uses the ADAM solver-based LSTM model followed by the Auto-Regressive Integrated Moving Average (ARIMA) System. Another paper showed a Hybrid system called a CNN-LSTM-ML hybrid prediction model for predicting groundwater levels in the Mojave Desert [40].
Among the papers discussed, [41] introduced a new type of loss function for the Timeseries Forecasting Model called DILATE (DIstortion Loss including shApe and TimE). Unlike the conventional performance metrics such as the RMSE loss function that predicts the average between the spike in data, this new loss function shows accurate predictions for sudden changes or spikes.
2.3. Reinforcement Learning
Machine learning is divided into three main categories, depending on the feedback signal or training data used in the system: Supervised learning, unsupervised learning, and reinforcement learning [42]. First, Supervised Learning can predict the output by training the labeled datasets. Meanwhile, an Unsupervised Learning algorithm is when the datasets are neither labeled nor classified. This algorithm can provide output by drawing inferences and determining data patterns and groupings. Lastly, Reinforcement learning is a category of machine learning that allows the system to determine the ideal behavior to maximize performance using simple reward feedback known as reinforcement signals. The outcome of the system came from current responses. In the study of urban flood modeling and flash flood management, IoT system reinforcement learning created a flood model based on the design parameters, output responses, and minimal losses [43] [44].
2.4. Fuzzy Logic
Two widely used models in designing fuzzy logic are Mamdani and Takagi-Sugeno-Kang (TSK). In a paper about the framework of fuzzy rule interpolation, Zhang and Shen [45] described when to use Mamdani and TSK models. TSK models use polynomials as rule consequents where the results apply to solving regression problems. On the other hand, Mamdani models need defuzzification to obtain crisp results since antecedents and consequents represent fuzzy sets. There are different implementations of fuzzy logic combined with neural networks called “Neuro-Fuzzy Systems” [46] such as cooperative, concurrent, and adaptive. In this study, the architecture for predicting flood uses the concurrent neuro-fuzzy system, wherein the inputs are preprocessed by fuzzy logic then the neural network processes the outputs.
An example of ANFIS (Adaptive Neural Fuzzy Inference System) architecture, [47] developed a weather prediction system with 100% accuracy. The system predicts rain or no rain based on the input parameters such as temperature, humidity, and wind speed. Each input has 3 membership functions. Every membership function has 3 rules. Thus, there are 27 rules. Finally, each rule has its own corresponding output membership function. All 27 outputs are combined into one output that predicts the weather.
2.5. Summary
Different studies have used sensors and IoT devices to develop flood monitoring systems. Based on the literature, flood monitoring systems are divided into several solutions: hardware-based systems, model-based systems, and hybrid systems. Hardware-based systems tend to tackle the problem by introducing sensors and microcontrollers that alert when a flood occurs. On the other hand, the researcher focuses on creating neural network models or machine learning algorithms for predicting floods for model-based systems. Lastly, the solution mixes the alert and prediction systems for hybrid systems. The methodologies show the latest solutions and recommended approaches to the problem.
3. Methodology
The complete framework of the Flood Monitoring and Prediction System is shown in Figure 1. Flood prediction requires the sensor node to collect essential time-series data such as environment temperature, temperature inside the pipe, presence of rain, relative humidity, and flood level inside the pipe of the local area. The sensor node consists of a microcontroller, sensors, and a security module. The Cypress Semiconductor PSoC Wi-Fi Board CY8CPROTO-062-4343W is the microcontroller of the sensor node. It will periodically monitor the sensors via the I2C bus and General-Purpose Input/Output (GPIO) ports and transmit the data to Amazon Web Services (AWS) – IOT Core, Timestream, and Grafana. Regarding flood height measurement, DPS310 senses the changes in atmospheric pressure inside the pipe of the simulated environment. Because of the Ideal Gas Law, the air pressure becomes proportional to the flood level when the flood closes the bottom of the pipe. When the flood level changes, the air inside the pipe is compressed by the water, which causes a change in air pressure. Also, the DPS310 sensor utilizes the I2C bus to communicate the data to the microcontroller.
On the other hand, some GPIO ports communicate with the following sensors: the DHT22 sensor (for humidity) and the rain sensor. Before sending data to AWS, the microcontroller has to perform several procedures. Initially, the microcontroller should generate a certificate from the Optiga Trust M security module. The AWS verifies the certificate from the microcontroller. Then, the PSoC connects to AWS via Wi-Fi. Every data transmitted by the sensor node is protected from eavesdropping, tampering, and message forgery by the Optiga Trust M. Finally, the data is published on the AWS Managed Grafana and assessed by the flood prediction system. The sensor node is powered by a 5V charger connected to a 220V AC wall outlet to ensure reliable monitoring.
If there are problems with the Wi-Fi connection (no signal) or an unsuccessful data transfer, the microcontroller PSoC6 has an external reset pin. The microcontroller is programmed to trigger the reset pin via the GPIO pin. On the other hand, if a power outage occurs, all data are lost during the outage because no data can be transmitted to AWS.
This paper simulated the monitoring of flood data. The simulated setup is placed in an open area where rain can be collected. In this experiment, the researcher created a flood level gauge using a container drum and DPS310 sensor. The container drum used is approximately 70 Liters, with two valves attached at the bottom for draining. The vertical pipe is 40 inches long. One end is open to let water in the pipe. The change in water level in the pipe is directly proportional to the atmospheric pressure read by the Infineon DPS310.
3.1. Short-Term Flood Prediction System
Short-term flood prediction is generated hours before the impending flood. The algorithms used in making predictions are LSTM Neural Network, Genetic Algorithm, and Fuzzy Logic. The latter two algorithms improve the accuracy of the results by optimizing the LSTM neural network hyperparameters based on the chosen performance metric and loss function and the normalization of all gathered data. Figure 2 illustrates the flow of creating a model for flood prediction.
Initially, all input data must be normalized. For the normalization of the temperatures, the thesis will use the architecture of a Concurrent Neuro-Fuzzy System wherein the temperatures go into the Fuzzy Logic Inference system, and the output is used as input for the LSTM neural network. With regards to the normalization of the humidity, since the humidity data is presented as percent, the data is simply divided by 100. Meanwhile, rain data has no changes because data is between 0 and 1. Lastly, the flood data is normalized by the Eqn. (2) before proceeding to the LSTM neural network.
Where is the normalized flood height, is the measured air pressure by the DPS310 sensor, is the atmospheric pressure (1013hPa) at 0 inches flood height, and is the atmospheric pressure (1076.77hPa) at 30 inches of flood height. Guided by the equation from [22], the atmospheric pressure is converted into flood height by Eqn. (3).
Where is the total flood height (inches), is the measured air pressure by the DPS310 sensor in Pascals, is the atmospheric pressure in Pascals, is the specific gravity of water (9810N/m3), is the height of the tube (0.84m), and is the offset of the pipe from the ground (0.01m).
During the neural network training, the accuracy of the prediction system increases because of the optimization of hyperparameters. One generation of a genetic algorithm encompasses one LSTM neural network training. The genetic algorithm will only stop optimizing the LSTM neural network when the generation has reached 20. After the Genetic Algorithm is finished to determine the chromosomes of the best individual in the population, this set of hyperparameters can be used for the neural network forecasting system. Figure 3 illustrates the usage of the optimized neural network for flood forecasting. The trained network based on the hyperparameters of the best solution provided will create forecasts of the inputs based on the previously loaded data. Every time previous data is used to forecast, the trained network is updated to continuously make predictions.
3.1.1. Fuzzy Inference System
Fuzzy logic has been helpful in different applications, such as control systems, image processing, and robotics. This paper uses the Mamdani Fuzzy Inference System (FIS) to fuzzify environmental temperature and temperature inside the pipe. Normalizing the data improves learning speed and faster convergence. Normalizing the data improves learning speed and faster convergence. Figure 4 shows the fuzzification process of temperature, showing that each output level corresponds to a specific range of temperatures.
Figure 5 shows the MATLAB FIS block diagram for applying temperature data to Mamdani FIS. Also, the figure includes the settings for fuzzification, aggregation, and defuzzification. During the fuzzification stage, the crisp input temperature value is converted to a fuzzy value by finding the degree of membership of the crisp input to the membership functions. Then, all membership-generated degrees are combined to form one summarized output in the aggregation stage. Finally, the aggregated result is defuzzified by using the defuzzication method mean of maximum (mom).
The temperature FIS uses min, max, and moment of inertia for implication, aggregation, and defuzzification. The design of the temperature FIS uses eleven Trapezoidal input membership functions shown in Figure 6.
Finally, the design uses eleven Gaussian output membership functions with a standard deviation of 0.01, as shown in Figure 7.
3.1.2. Long Short-Term Memory (LSTM)
The LSTM algorithm is an artificial recurring neural network architecture used in deep learning. The algorithm processes the data in terms of sequences. Moreover, LSTM networks recognize, detect, and predict time-based data. In this project, the LSTM algorithm makes predictions of the impending flood.
After all inputs have been normalized, the researcher creates two datasets for each partition dataset defined by prediction hours. The first dataset is [1 … n] length. The second dataset is [2 … n+1] length. The first dataset will be used in the trained neural network model to create predicted outputs (Ypred). While, the second dataset acts as the future values of the sensor node, and contains future flood levels (Ytest). These are necessary for creating the neural network and measuring its performance.
Figure 8 shows the base architecture for the LSTM Neural Network model. The first layer is the Sequential Layer because the inputs are time series data. The second layer is the LSTM layer, which is responsible for learning time series or sequential inputs. In this layer, the parameter for the number of hidden layers stores values that configure the model for flood prediction. The number of LSTM hidden layers is limited to 1000, as the system cannot compute the total parameters beyond this limit. The third layer is the fully connected layer, which maps the outputs of the last LSTM layer to 5 outputs. The last layer is the regression layer, which computes the RMSE (Root Mean Square Error) to evaluate the performance of the system. After creating the regression model, the next step is to train the neural network.
During forecasting, the regression LSTM Neural Network evaluates its performance by calculating the difference between the predicted value and the actual value of the testing dataset. The Root Mean Square Error (RMSE) defines the performance metric in Eqn. (3). The RMSE measures the prediction errors or the difference of predicted output from the actual value. The Genetic Algorithm finds the individual with the lowest (best) error.
Where is the performance of the Neural Network model for a given testing dataset, is the predicted flood level of the trained LSTM Neural Network model from the first dataset, is the future flood level from the second dataset, and is the length of the given testing dataset or prediction length.
3.1.3. Genetic Algorithm (GA)
A Genetic Algorithm (GA) is a metaheuristic method inspired by natural selection to generate optimized solutions using biologically inspired operators such as mutation, crossover, and selection. This algorithm aims to produce a solution using natural selection, wherein the offspring’s inherited characteristics came from their parent’s characteristics in the previous generation. The Genetic Algorithm will optimize the hyperparameters based on the computed RMSE between flood values in the testing dataset and predicted values. The following are the hyperparameters defined in this paper:
- Prediction Minutes: random integer among {1, 5, 15, 30, 60, 90, 120, 180}
-
Type of Solver: random number from 1 to 2
- ○
- 1: Stochastic Gradient Descent with Momentum (SGDM)
- ○
- 2: Adaptive Moment Estimation (ADAM)
- Initial Learning Rate: random number from 0.01 to 0.5
- LSTM Number of Hidden Layers: random number from 50 to 1000
- Maximum Number of Epochs: random number from 50 to 200
The first hyperparameter is the prediction minutes. With this hyperparameter, the system will predict the flood level for the next few minutes based on this value. The second hyperparameter indicates the solver to be used by the LSTM Neural Network.
The remaining three hyperparameters dictate the configuration of the LSTM Neural Network and its training options. The value of the fourth hyperparameter dictates the number of hidden layers of the LSTM layer. Finally, the third and fifth hyperparameters change the training options. The initial learning rate indicates the starting point of the learning rate. This will gradually decrease based on the learning rate factor and learning rate drop period. Lastly, the maximum number of epochs dictates the training duration.
In this paper, the genetic algorithm will have 50 individuals working for 20 generations. Each individual has five chromosomes as an indication of hyperparameters. There will be no individuals with identical chromosomes for every generation in the current or previous generations. During each generation, each individual will be evaluated based on their fitness score (defined as a performance metric) and sorted from lowest fitness score (best) to highest fitness score (worst). The top 40 performing individuals earned the right to be retained in the population. The bottom ten are evicted from the population and replaced by the children of the top 10 individuals. The following are the mutation rules:
- For the Top 10 individuals, no change in chromosome/hyperparameter
- For Top 11 to 40 individuals, three (3) random chromosomes mutate
- For the ten new children, two (2) random chromosomes mutate
4. Results and Discussion
4.1. The Datasets
This section discusses a simulated environment to test the flood prediction model. Figure 9 shows the relationship between atmospheric pressure and flood height. The equation is the equation relating the flood height and pipe pressure. The pipe has an offset of 10cm from the ground.
The datasets of atmospheric pressure, temperature, and presence of rain will be a time series. Designing the LSTM neural network model includes training, validating, and testing the gathered data from the cloud and sensor nodes. Different algorithms will help increase the performance of the neural network model by tuning the parameters based on the datasets. Data was gathered on March 23 2025 from 8:33 AM to 6:00 PM Philippine Standard Time. During this time, the sensor node transmits data every 3 seconds and up to 2 valves drains water from the drum. Each valve drains approximately 1.767 Liters per minute. With two valves open, the drum drains at a rate of approximately 3.534 Liters per minute.
Figure 10 shows the gathered data. The first plot shows the temperature measurements inside the pipe and the sensor node environment. The second plot shows the humidity of the sensor node environment. The third plot shows the rain duration. The fourth plot shows the flood level inside the pipe. The fifth graph shows the flood level converted from atmospheric pressure into height. The water for this controlled environment is provided by a garden hose. Based on the gathered data, it can be observed that flood levels rise when humidity increases and it is raining, while the temperature decreases. When it stops raining, the humidity decreases while the temperature increases.
Figure 10 shows the final preprocessed data of all gathered variables. All values are normalized and prepared for neural network training, testing, and validation.
4.2. Result: LSTM Neural Network (Without Genetic Algorithm)
In this section, the prepared data are partitioned every 120 minutes to form datasets. These datasets are used to predict the next 120 minutes using the LSTM Neural Network model that has 1000 LSTM Hidden Layers, Adaptive Moment Estimation (ADAM) solver with a 0.02 initial learning rate for 1000 epochs. The training, testing, and verification were executed on the GPU NVIDIA GeForce RTX2070 with Max-Q Design, and the Training results are illustrated in Figure 12.
Based on the results, the actual training time is 8 minutes and 21 seconds. Aside from the time parameters, performance metrics of mini-batch RMSE and mini-batch loss are displayed. The objective is to create a regression neural network with an ideal training RMSE of 0. After the training of the regression model, the performance of the neural network is 0.036986.
Figure 13 shows the Closed Loop Forecasting results on March 23 2025 from 8:33 AM to 6:00 PM for the 2-hour prediction. The blue line indicates the actual data gathered by the sensor node. On the other hand, the red dashed line indicates the flood predicted by the best solution.
4.3. Result: LSTM Neural Network (Genetic Algorithm)
In this section, the Genetic algorithm aims to find the best combination of the hyperparameters based on the lowest performance metric. The performance metric is the calculated Root Mean Square Error (RMSE) between the flood level data of the testing dataset and the predicted values generated by the newly trained network. After 6 hours and 57 minutes of running the program in MATLAB, the researcher displays the top 10 individuals and their fitness scores from generation 1 to 20, and highlights in green indicate new in the top 10.
Figure 14.
Top 10 of Generation 20
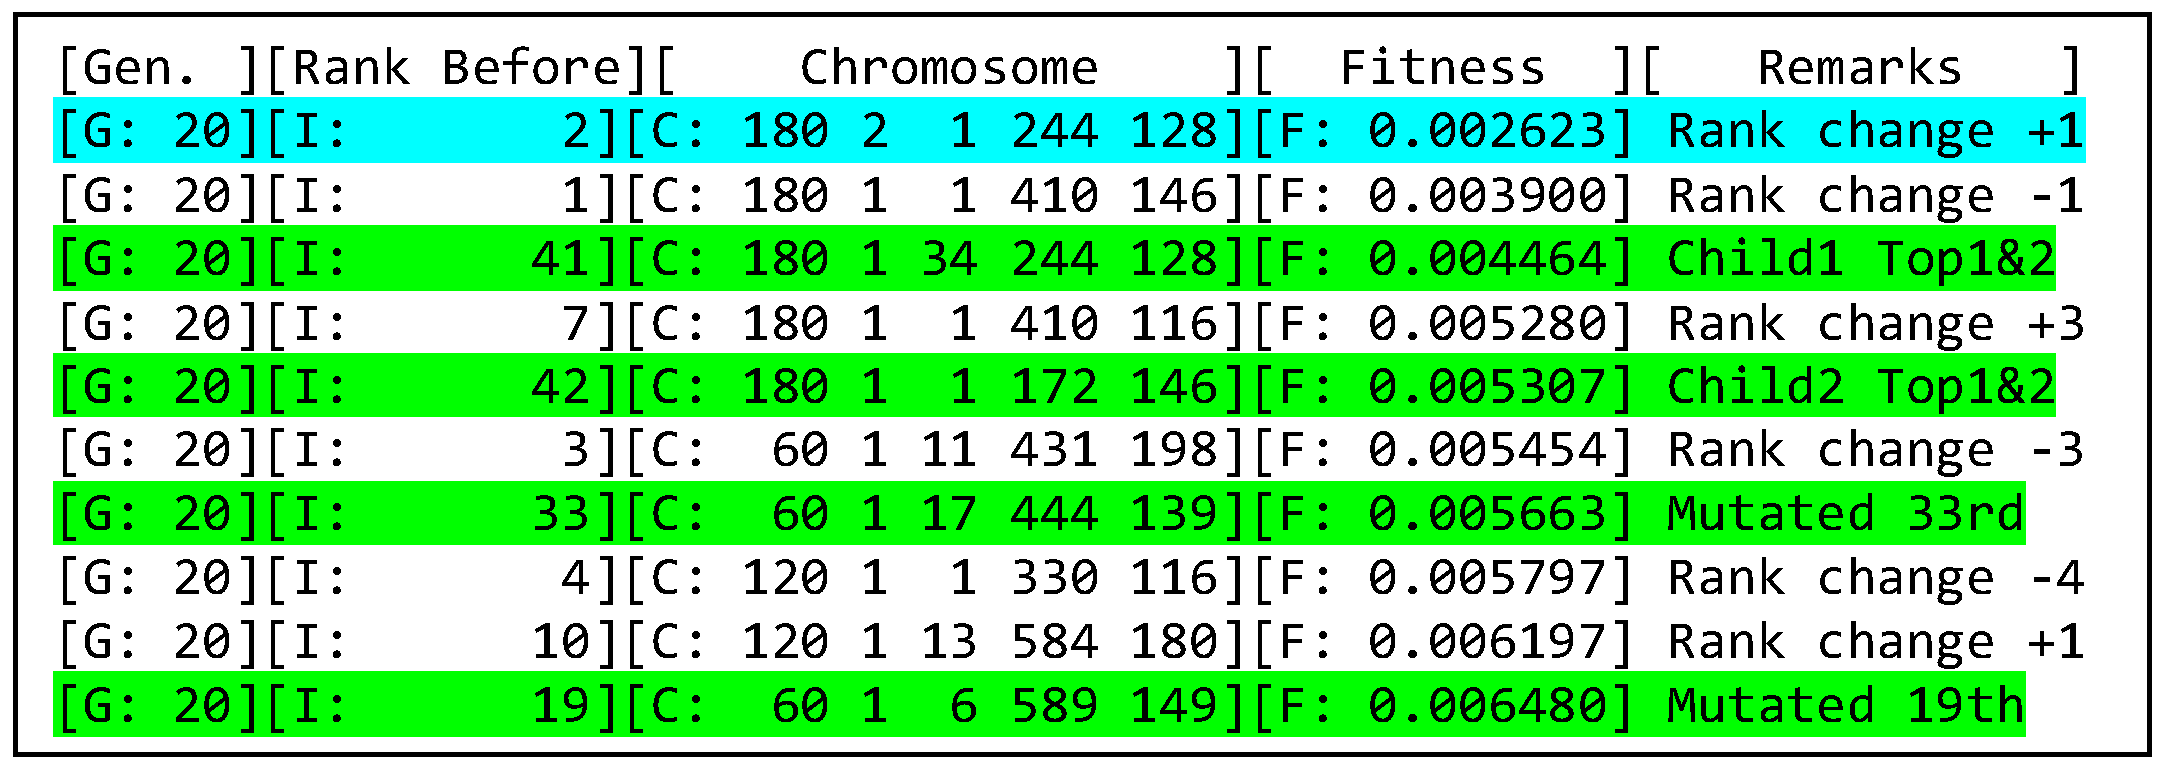
Based on the results of 20 generations, the Genetic algorithm suggests predicting flood level every 180 minutes using an Adaptive Moment Estimation (ADAM) solver with 244 LSTM Hidden Layers trained with a 0.01 initial learning rate for 128 epochs. Figure 15 shows forecasted results in March 23 2025 for the best solution. The blue line indicates the actual data gathered by the sensor node. On the other hand, the red dashed line indicates the flood predicted by the best solution.
4.2. Data Analysis
This section discusses the results of the statistical methods employed to evaluate the performance of the developed Flood Forecasting System. The first analysis focuses on the system’s accuracy. The first LSTM Neural Network, without Genetic Algorithm optimization, used 1000 hidden layers with an Adaptive Moment Estimation (ADAM) solver. It predicts every 120 minutes and was trained with an initial learning rate of 0.02 for 1000 epochs. The training time was 8 minutes and 21 seconds, which yields a performance metric of 0.036986. In contrast, the second LSTM Neural Network, optimized with a Genetic Algorithm, utilized 244 hidden layers with an Adaptive Moment Estimation (ADAM) solver. It predicts every 180 minutes, trained with an initial learning rate of 0.01 for 128 epochs. When trained in isolation, this configuration required only 19 seconds of training time and achieved a performance metric of 0.0026235, as shown in Figure 16. Table 4 provides a detailed comparison of the two LSTM Neural Networks. The solution provided by the Genetic Algorithm has an accuracy improvement of 92.91%.
Subsequently, a T-test analysis was conducted to identify significant differences in the performance of the two systems. This analysis utilized MATLAB’s T-Test function (ttest2), allowing for the calculation of the p-value, test statistic, confidence interval, and hypothesis test results. Upon checking and comparing the RMSE values or the accuracies of the two LSTM Neural Network systems, there is a significant difference between the two LSTM Neural Networks. T-test results and analysis are provided in Table 5.
Based on the analysis and results from accuracy and T-test, it can be concluded that there is a statistically significant difference in the performance of the two LSTM Neural Networks. The variations in their configurations in the number of hidden layers, solvers, and optimization techniques, the prediction capabilities provided by the Genetic Algorithm-optimized LSTM offer computational advantages with reduced training time and fewer hidden layers and provide better practical solutions for computational efficiency, reduced power consumption, and strong accuracy.
5. Conclusions
The created secured IoT-based flood monitoring and forecasting system using a Genetic Algorithm-based Neuro-Fuzzy network addresses the Philippines’ lack of flood prediction systems. The sensor node gathers atmospheric pressure, temperature, rain, and flood level data. Moreover, the Infineon CY8CPROTO-062-4343W PSoC™ 6 Wi-Fi BT Prototyping Kit handles data and network communications. Regularly, data is transmitted in real-time on Amazon Web Services. A secured data connection has been established between the sensor node and the AWS using the certificates and keys. Moreover, only the registered sensor nodes with the registered certificate from Infineon Optiga Trust M can communicate with AWS via the MQTT protocol.
For flood prediction, the study employed a Regression LSTM Neuro-Fuzzy model. Before inputting data into the LSTM Neural Network, all variables were normalized, with temperature data specifically normalized using Fuzzy Logic Inference Systems. The model predicts imminent flooding based on its training, and the Genetic Algorithm was used to optimize hyperparameters for the prediction model.
With regards to flood prediction results, the forecasting system evaluated on both a 1-month dataset and a simulated controlled environment dataset has demonstrated superior computational efficiency, reduced power consumption, and higher accuracy when optimized by the Genetic Algorithm. Across all 20 generations, the ADAM solver emerged as the most effective for flood prediction. The final system successfully forecasts flooding 2 to 3 hours in advance.
Author Contributions
Conceptualization, Hero Rafael Arante, Edwin Sybingco, Maria Antonette Roque, Leonard Ambata, Alvin Chua and Alvin Neil Gutierrez; Data curation, Hero Rafael Arante; Formal analysis, Edwin Sybingco, Maria Antonette Roque, Leonard Ambata and Alvin Chua; Funding acquisition, Alvin Chua; Investigation, Hero Rafael Arante; Methodology, Hero Rafael Arante and Edwin Sybingco; Project administration, Alvin Chua; Resources, Hero Rafael Arante, Edwin Sybingco and Alvin Chua; Software, Hero Rafael Arante, Edwin Sybingco and Alvin Chua; Supervision, Edwin Sybingco, Maria Antonette Roque, Leonard Ambata and Alvin Chua; Validation, Hero Rafael Arante and Edwin Sybingco; Visualization, Hero Rafael Arante; Writing – original draft, Hero Rafael Arante and Alvin Neil Gutierrez; Writing – review & editing, Hero Rafael Arante and Edwin Sybingco. All authors have read and agreed to the published version of the manuscript.
Funding
This research was funded by the Research and Grants Management Office of DLSU, grant number (03 IR R 1TAY22-2TAY23).
Acknowledgments
The authors would like to express their sincere gratitude to the Research and Grants Management Office of De La Salle University (DLSU) for funding this project, and Infineon Technologies for providing the necessary equipment and technical assistance. We are also grateful to the staff at the Electronics and Computer Engineering Department and the Mechanical Engineering Department of DLSU for their cooperation, assistance, and constructive feedback.
Conflicts of Interest
The authors declare no conflicts of interest.
References
- S. Bande and V. V. Shete, “Smart flood disaster prediction system using IoT & Neural Networks,” in 2017 International Conference On Smart Technologies For Smart Nation (SmartTechCon), Aug. 2017, pp. 189–194. [CrossRef]
- S. B. Zahir et al., “Smart IoT Flood Monitoring System,” J. Phys. Conf. Ser., vol. 1339, no. 1, p. 012043, Dec. 2019. [CrossRef]
- M. S. Mohd Sabre, S. S. Abdullah, and A. Faruq, “Flood Warning and Monitoring System Utilizing Internet of Things Technology,” Kinet. Game Technol. Inf. Syst. Comput. Network, Comput. Electron. Control, no. December, pp. 287–296, Oct. 2019. [CrossRef]
- “Consulting Services for the Drainage Masterplan of the City of Manila,” 2024.
- B. Arshad, R. Ogie, J. Barthelemy, B. Pradhan, N. Verstaevel, and P. Perez, “Computer Vision and IoT-Based Sensors in Flood Monitoring and Mapping: A Systematic Review,” Sensors, vol. 19, no. 22, p. 5012, Nov. 2019. [CrossRef]
- V. A. Leal Sobral et al., “A Cloud-Based Data Storage and Visualization Tool for Smart City IoT: Flood Warning as an Example Application,” Smart Cities, vol. 6, no. 3, pp. 1416–1434, May 2023. [CrossRef]
- A. Y. A. Abdelmajeed, M. Albert-Saiz, A. Rastogi, and R. Juszczak, “Cloud-Based Remote Sensing for Wetland Monitoring—A Review,” Remote Sens., vol. 15, no. 6, p. 1660, Mar. 2023. [CrossRef]
- F. V. Da Silva Júnior, M. X. C. Da Cunha, and M. F. De Souza Júnior, “IOTFlood: hardware and software platform using internet of things to monitor floods in real time,” Ambient. e Agua - An Interdiscip. J. Appl. Sci., vol. 16, no. 4, p. 1, Jul. 2021. [CrossRef]
- J. Song, Z. Shao, Z. Zhan, and L. Chen, “State-of-the-Art Techniques for Real-Time Monitoring of Urban Flooding: A Review,” Water, vol. 16, no. 17, p. 2476, Aug. 2024. [CrossRef]
- T. De Filippis et al., “Hydrological Web Services for Operational Flood Risk Monitoring and Forecasting at Local Scale in Niger,” ISPRS Int. J. Geo-Information, vol. 11, no. 4, p. 236, Apr. 2022. [CrossRef]
- T. Ahmed, L. Creedon, and S. S. Gharbia, “Low-Cost Sensors for Monitoring Coastal Climate Hazards: A Systematic Review and Meta-Analysis,” Sensors, vol. 23, no. 3, p. 1717, Feb. 2023. [CrossRef]
- M. S. Islam, X. Sun, Z. Wang, and I. Cheng, “FAPNET: Feature Fusion with Adaptive Patch for Flood-Water Detection and Monitoring,” Sensors, vol. 22, no. 21, p. 8245, Oct. 2022. [CrossRef]
- C. Albertini, A. Gioia, V. Iacobellis, and S. Manfreda, “Detection of Surface Water and Floods with Multispectral Satellites,” Remote Sens., vol. 14, no. 23, p. 6005, Nov. 2022. [CrossRef]
- U. Iqbal, M. Z. Bin Riaz, J. Zhao, J. Barthelemy, and P. Perez, “Drones for Flood Monitoring, Mapping and Detection: A Bibliometric Review,” Drones, vol. 7, no. 1, p. 32, Jan. 2023. [CrossRef]
- R. J. M. Mercado, “Design of wireless sensor networks using embedded Programmable System-on-Chip (PSoC) as applied to community-based flood early warning systems (CBFEWS),” in 2016 International Conference on Advances in Electrical, Electronic and Systems Engineering (ICAEES), Nov. 2016, pp. 214–223. [CrossRef]
- F. C. C. Garcia, A. E. Retamar, and J. C. Javier, “Development of a predictive model for on-demand remote river level nowcasting: Case study in Cagayan River Basin, Philippines,” in 2016 IEEE Region 10 Conference (TENCON), Nov. 2016, pp. 3275–3279. [CrossRef]
- M. V. R. Lozanes et al., “Web-based Riverbank Overflow Forecasting and Monitoring System,” in 2020 IEEE REGION 10 CONFERENCE (TENCON), Nov. 2020, vol. 2020-Novem, pp. 602–607. [CrossRef]
- G. A. Amagsila, M. E. Cabuhat, J. E. Tigbayan, E. Uy, and E. Ramirez, “A framework for mobile application of flood alert monitoring system for vehicle users using Arduino device,” in 2017IEEE 9th International Conference on Humanoid, Nanotechnology, Information Technology, Communication and Control, Environment and Management (HNICEM), Dec. 2017, vol. 2018-Janua, pp. 1–6. [CrossRef]
- A. N. Yumang et al., “Real-time flood water level monitoring system with SMS notification,” in 2017IEEE 9th International Conference on Humanoid, Nanotechnology, Information Technology, Communication and Control, Environment and Management (HNICEM), Dec. 2017, vol. 2018-Janua, pp. 1–3. [CrossRef]
- M. I. Alipio, J. R. R. Bayanay, A. O. Casantusan, and A. A. Dequeros, “Vehicle traffic and flood monitoring with reroute system using Bayesian networks analysis,” in 2017 IEEE 6th Global Conference on Consumer Electronics (GCCE), Oct. 2017, vol. 2017-Janua, no. Gcce, pp. 1–5. [CrossRef]
- A. I. Pathan, N. L. Gaikwad, A. P. Kulkarni, and P. M. Powar, “An IoT and AI based Flood Monitoring and Rescue System,” Int. J. Eng. Res., vol. V9, no. 09, Sep. 2020. [CrossRef]
- A. C. Dublin et al., “A NOVEL COST-EFFECTIVE PRESSURE SENSOR BASED FLOOD MONITORING SYSTEM WITH IOT,” ASEAN Eng. J., vol. 14, no. 3, pp. 53–61, Aug. 2024. [CrossRef]
- A. E. Retamar et al., “HydroMet: Deployment of a large scale nationwide hydrometeorological sensor network for flood warning and monitoring,” in 2017 IEEE Global Humanitarian Technology Conference (GHTC), Oct. 2017, vol. 2017-Janua, pp. 1–10. [CrossRef]
- F. R. G. Cruz, M. G. Binag, M. R. G. Ga, and F. A. A. Uy, “Flood Prediction Using Multi-Layer Artificial Neural Network in Monitoring System with Rain Gauge, Water Level, Soil Moisture Sensors,” in TENCON 2018 - 2018 IEEE Region 10 Conference, Oct. 2018, vol. 2018-Octob, no. October, pp. 2499–2503. [CrossRef]
- A. B. Ranit and P. V. Durge, “Different Techniques of Flood Forecasting and Their Applications,” in 2018 International Conference on Research in Intelligent and Computing in Engineering (RICE), Aug. 2018, pp. 1–3. [CrossRef]
- B. K. Mishra, D. Thakker, S. Mazumdar, D. Neagu, M. Gheorghe, and S. Simpson, “A novel application of deep learning with image cropping: a smart city use case for flood monitoring,” J. Reliab. Intell. Environ., vol. 6, no. 1, pp. 51–61, Mar. 2020. [CrossRef]
- D. S. Rani, G. N. Jayalakshmi, and V. P. Baligar, “Low Cost IoT based Flood Monitoring System Using Machine Learning and Neural Networks: Flood Alerting and Rainfall Prediction,” in 2020 2nd International Conference on Innovative Mechanisms for Industry Applications (ICIMIA), Mar. 2020, no. Icimia, pp. 261–267. [CrossRef]
- N. Suresh, I. Behera, P. Bhagat, and P. Thakur, “Early Flood Monitoring System using IoT Applictions,” Int. Res. J. Eng. Technol., vol. 07, no. 05, pp. 3348–3353, 2020, [Online]. Available: https://www.irjet.net/archives/V7/i5/IRJET-V7I5642.pdf.
- S. I. Abdullahi, M. H. Habaebi, and N. A. Malik, “Intelligent flood disaster warning on the fly: developing IoT-based management platform and using 2-class neural network to predict flood status,” Bull. Electr. Eng. Informatics, vol. 8, no. 2, pp. 706–717, Jun. 2019. [CrossRef]
- M. Sadhukhan, S. Dasgupta, and I. Bhattacharya, “An Intelligent Weather Prediction System Based on IOT,” in 2021 Devices for Integrated Circuit (DevIC), May 2021, pp. 528–532. [CrossRef]
- A. K and M. Vijay Anand, “Flood Prediction System with Voting Classifier,” in 2024 2nd International Conference on Device Intelligence, Computing and Communication Technologies (DICCT), Mar. 2024, pp. 306–311. [CrossRef]
- E. Samikwa, T. Voigt, and J. Eriksson, “Flood Prediction Using IoT and Artificial Neural Networks with Edge Computing,” in 2020 International Conferences on Internet of Things (iThings) and IEEE Green Computing and Communications (GreenCom) and IEEE Cyber, Physical and Social Computing (CPSCom) and IEEE Smart Data (SmartData) and IEEE Congress on Cybermatics (Cybermatics), Nov. 2020, pp. 234–240. [CrossRef]
- Y. Sudriani, I. Ridwansyah, and H. A Rustini, “Long short term memory (LSTM) recurrent neural network (RNN) for discharge level prediction and forecast in Cimandiri river, Indonesia,” IOP Conf. Ser. Earth Environ. Sci., vol. 299, no. 1, p. 012037, Jul. 2019. [CrossRef]
- M. Moishin, R. C. Deo, R. Prasad, N. Raj, and S. Abdulla, “Designing Deep-Based Learning Flood Forecast Model With ConvLSTM Hybrid Algorithm,” IEEE Access, vol. 9, pp. 50982–50993, 2021. [CrossRef]
- V. Gude, S. Corns, and S. Long, “Flood Prediction and Uncertainty Estimation Using Deep Learning,” Water, vol. 12, no. 3, p. 884, Mar. 2020. [CrossRef]
- W. A. M. Prabuddhi and B. L. D. Seneviratne, “Long short term memory modelling approach for flood prediction: An application in deduru oya basin of Sri Lanka,” 20th Int. Conf. Adv. ICT Emerg. Reg. ICTer 2020 - Proc., no. ICTer, pp. 226–231, 2020. [CrossRef]
- M. Pan et al., “Water Level Prediction Model Based on GRU and CNN,” IEEE Access, vol. 8, pp. 60090–60100, 2020. [CrossRef]
- G. Suddul, K. Dookhitram, G. Bekaroo, and N. Shankhur, “An Evolutionary MultiLayer Perceptron Algorithm for Real Time River Flood Prediction,” in 2020 Zooming Innovation in Consumer Technologies Conference (ZINC), May 2020, pp. 109–112. [CrossRef]
- F. S. Mousavi, S. Yousefi, H. Abghari, and A. Ghasemzadeh, “Design of an IoT-based Flood Early Detection System using Machine Learning,” in 2021 26th International Computer Conference, Computer Society of Iran (CSICC), Mar. 2021, pp. 1–7. [CrossRef]
- P. William, O. J. Oyebode, G. Ramu, S. Lakhanpal, K. K. Gupta, and H. M. Al-Jawahry, “Framework for IOT Based Real-Time Monitoring System of Rainfall Water Level for Flood Prediction Using LSTM Network,” in 2023 3rd International Conference on Pervasive Computing and Social Networking (ICPCSN), Jun. 2023, pp. 1321–1326. [CrossRef]
- V. Le Guen and N. Thome, “Deep Time Series Forecasting With Shape and Temporal Criteria,” IEEE Trans. Pattern Anal. Mach. Intell., vol. 45, no. 1, pp. 342–355, Jan. 2023. [CrossRef]
- P. Shengguang, “Overview of Meta-Reinforcement Learning Research,” in 2020 2nd International Conference on Information Technology and Computer Application (ITCA), Dec. 2020, pp. 54–57. [CrossRef]
- Y. Wang, X. Chen, L. Wang, and G. Min, “Effective IoT-Facilitated Storm Surge Flood Modeling Based on Deep Reinforcement Learning,” IEEE Internet Things J., vol. 7, no. 7, pp. 6338–6347, Jul. 2020. [CrossRef]
- H. R. Goyal, K. K. Ghanshala, and S. Sharma, “Flash flood risk management modeling in indian cities using IoT based reinforcement learning,” Mater. Today Proc., vol. 46, no. xxxx, pp. 10533–10538, Feb. 2021. [CrossRef]
- P. Zhang and Q. Shen, “A Novel Framework of Fuzzy Rule Interpolation for Takagi-Sugeno-Kang Inference Systems,” in 2019 IEEE International Conference on Fuzzy Systems (FUZZ-IEEE), Jun. 2019, vol. 2019-June, pp. 1–6. [CrossRef]
- J. Vieira, F. Dias, and A. Mota, “Neuro-fuzzy systems: a survey,” … Neural Networks Appl. Udine …, pp. 1–6, 2004, [Online]. Available: http://dme.uma.pt/people/faculty/fernando.morgado/Down/483-343.pdf.
- A. H. Setyaningrum and P. M. Swarinata, “Weather prediction application based on ANFIS (Adaptive neural fuzzy inference system) method in West Jakarta region,” in 2014 International Conference on Cyber and IT Service Management (CITSM), Nov. 2014, pp. 113–118. [CrossRef]
- N. Kumar, P. Goyal, G. Kapil, A. Agrawal, and R. Ahmad Khan, “Flood risk finder for IoT based mechanism using fuzzy logic,” Mater. Today Proc., no. xxxx, Nov. 2020. [CrossRef]
Figure 1.
Model of Flood Monitoring and Prediction System
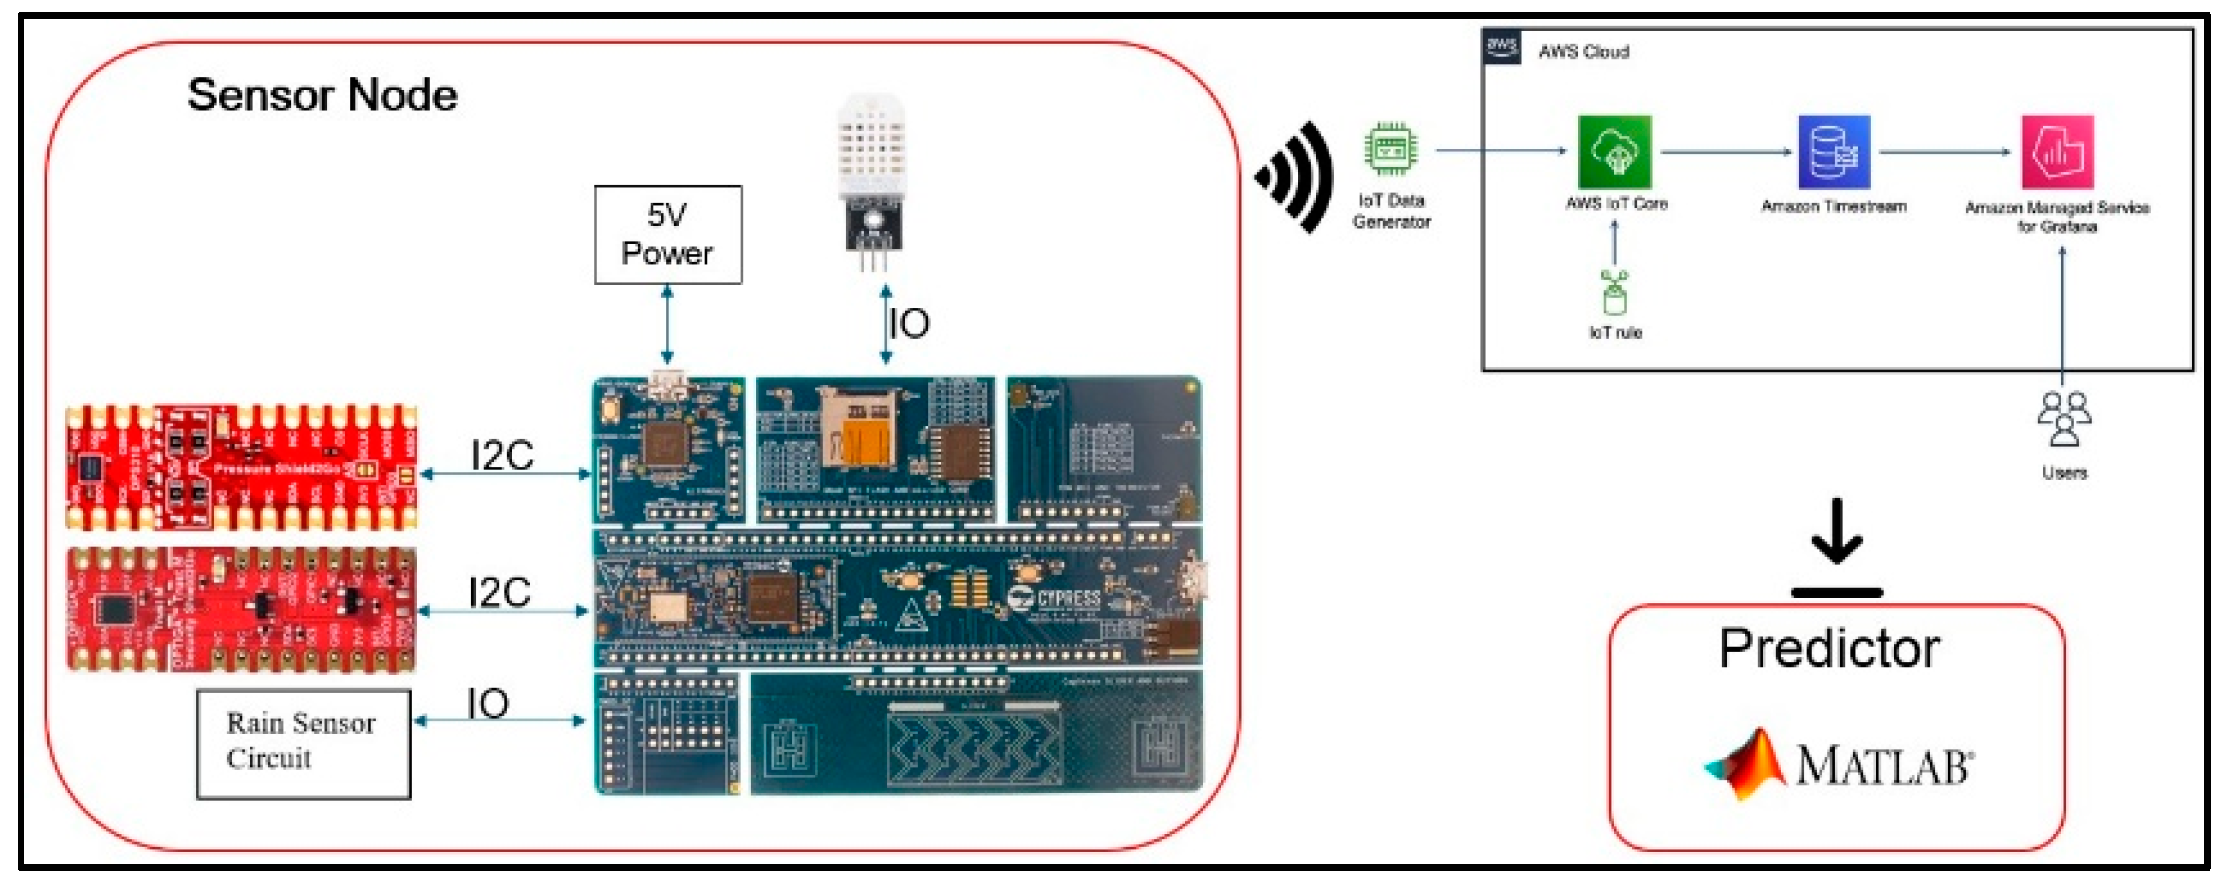
Figure 2.
Genetic Algorithm-Based Neuro-Fuzzy Network Forecasting System
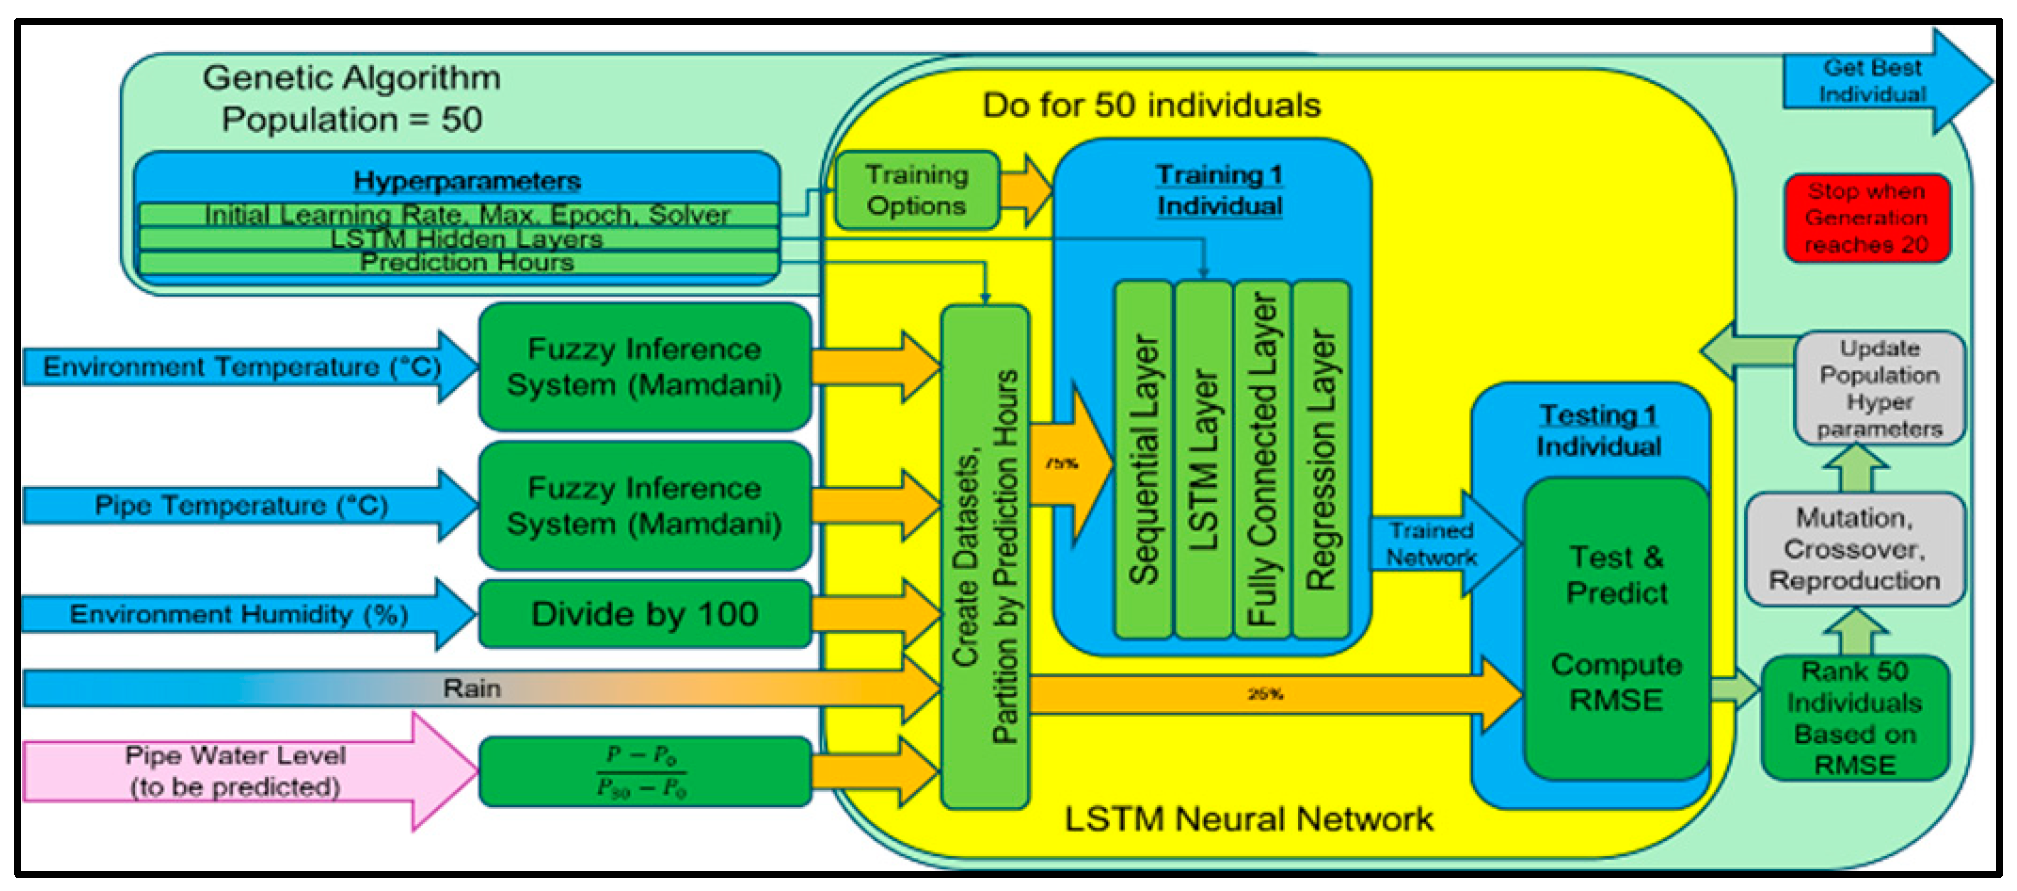
Figure 3.
Optimized Neural Network for Flood Forecasting System
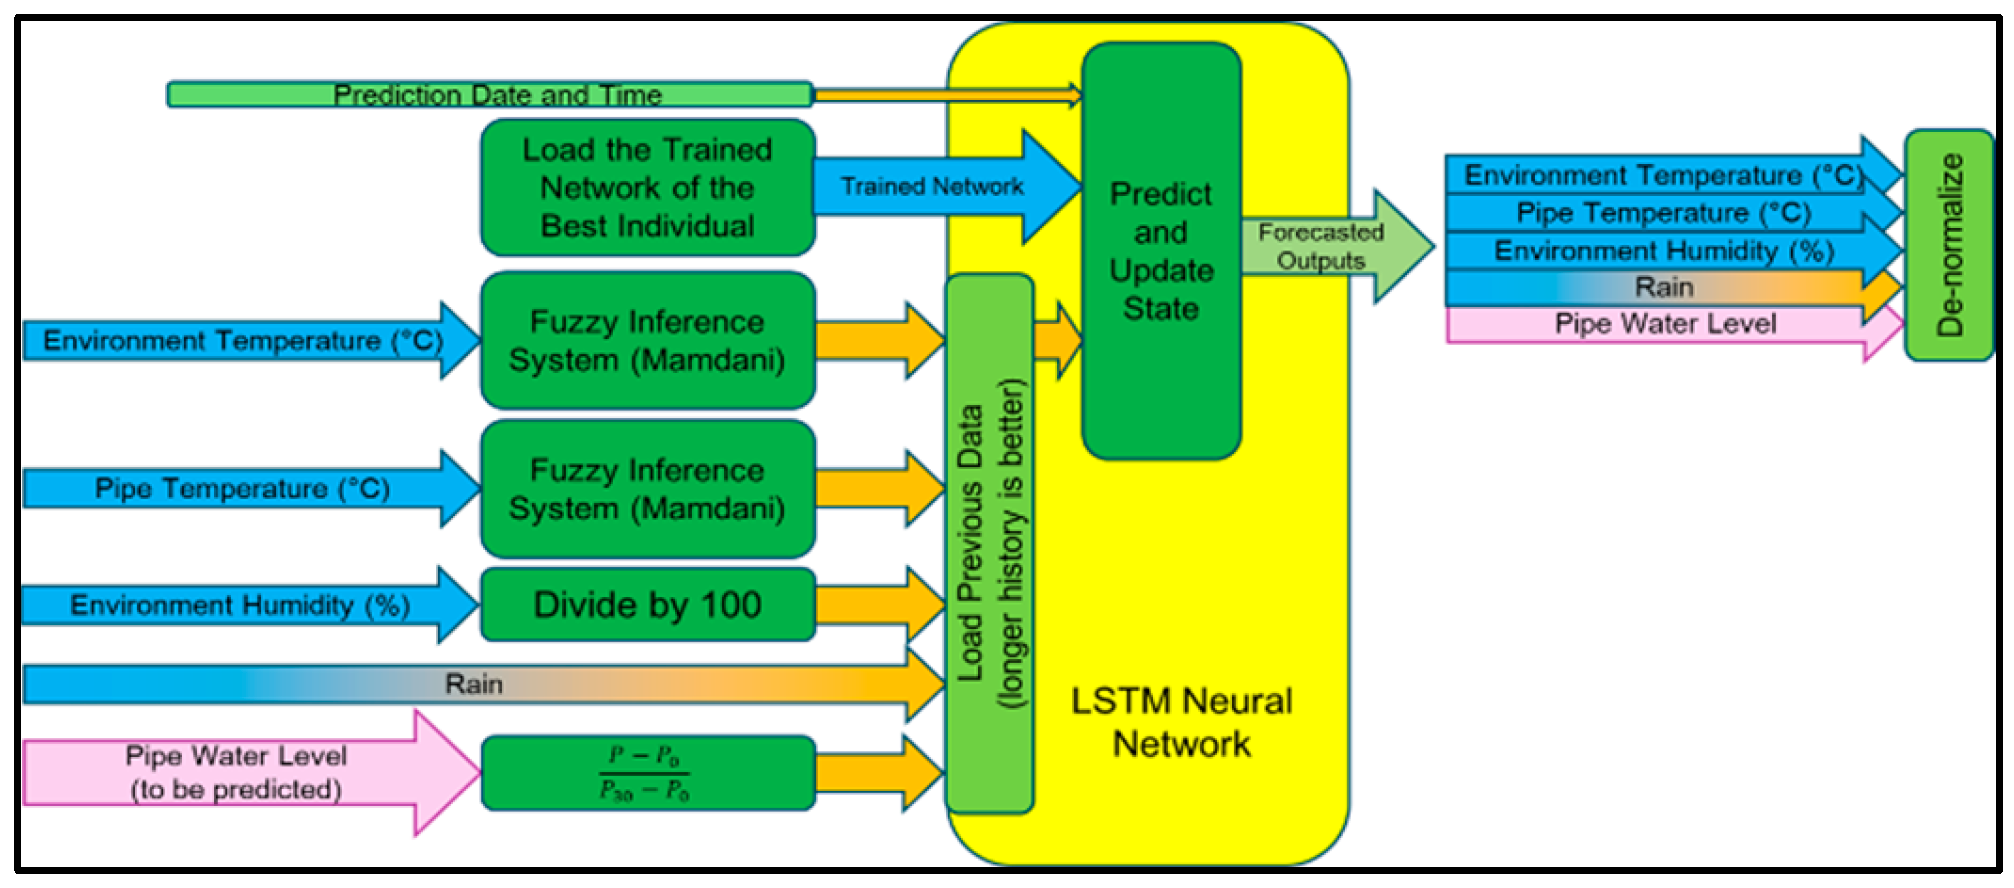
Figure 4.
Mamdani FIS for Temperature
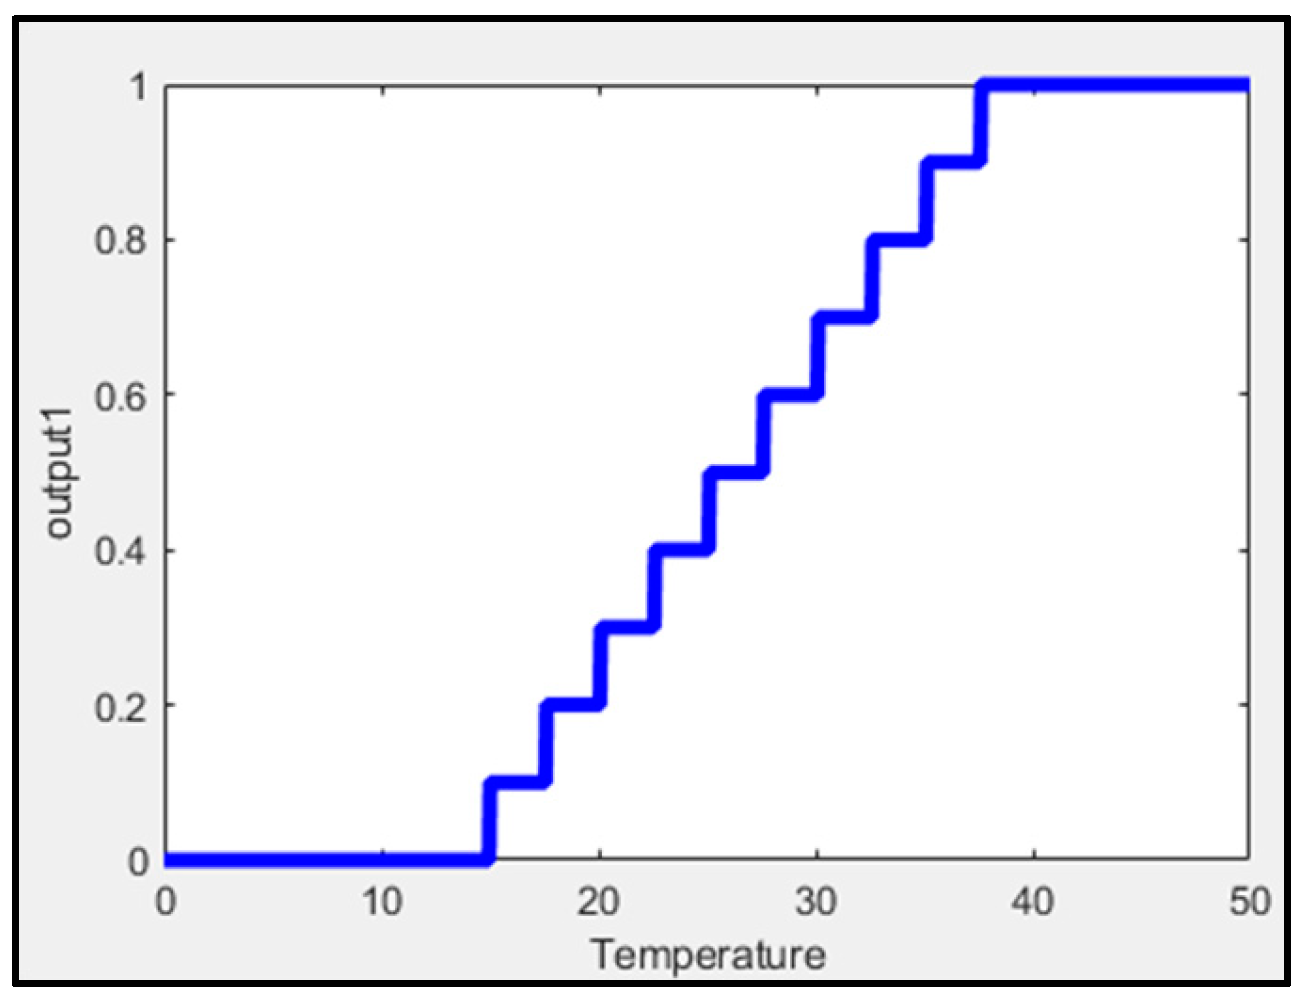
Figure 5.
Temperature Data Preparation using Mamdani FIS
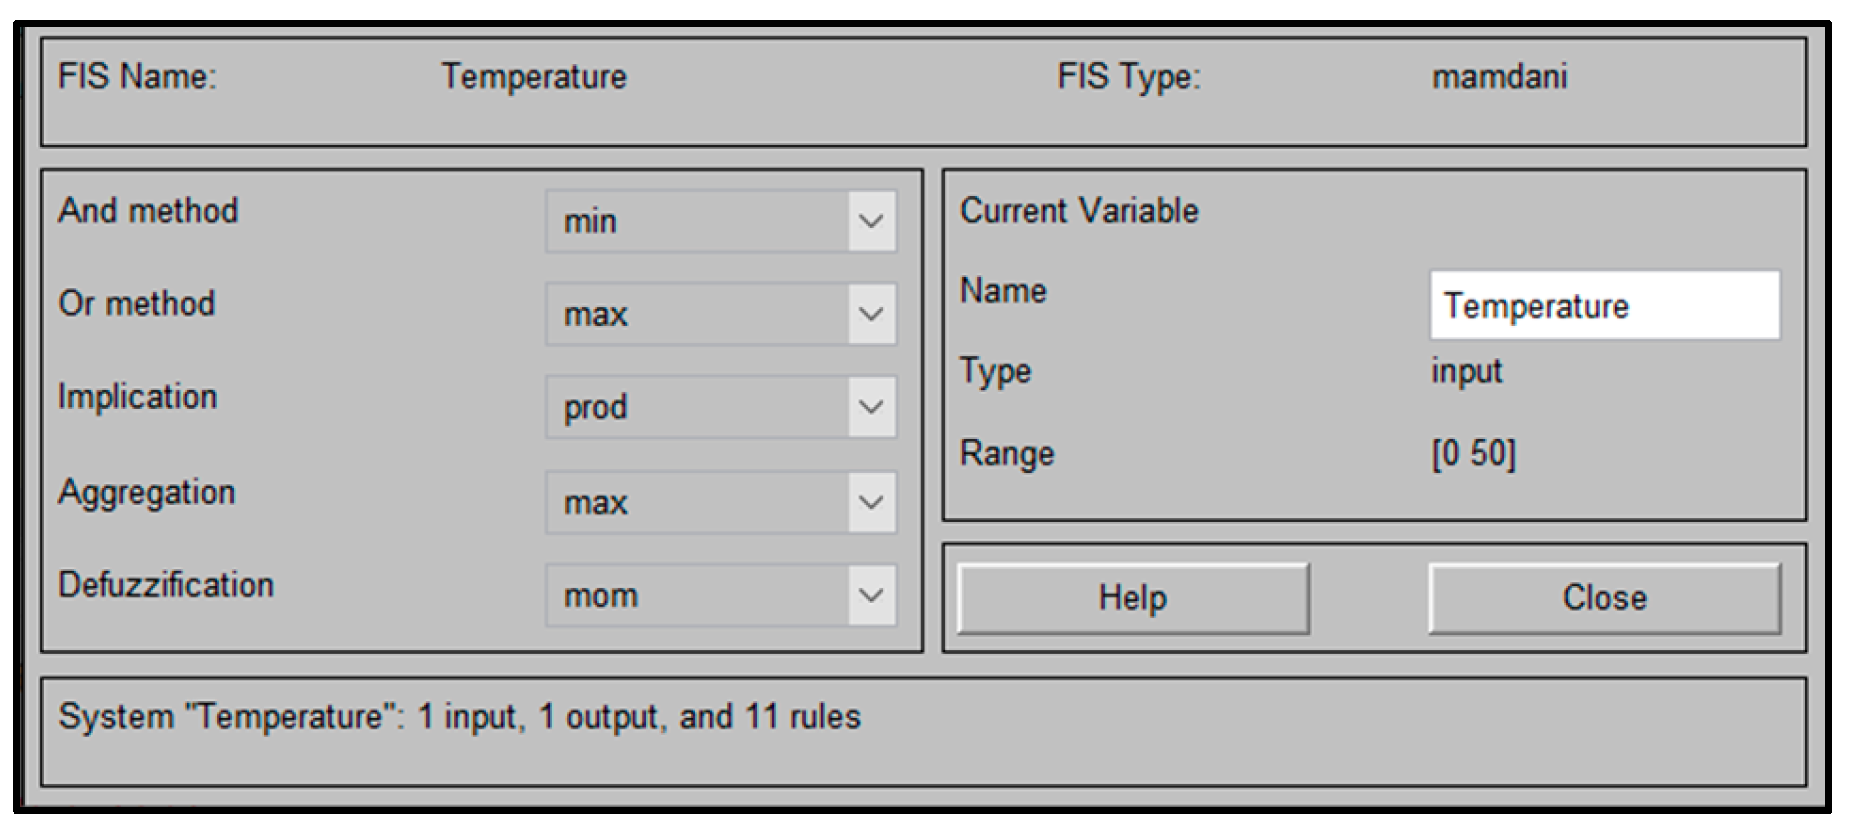
Figure 6.
Configurations of the Input Membership Functions
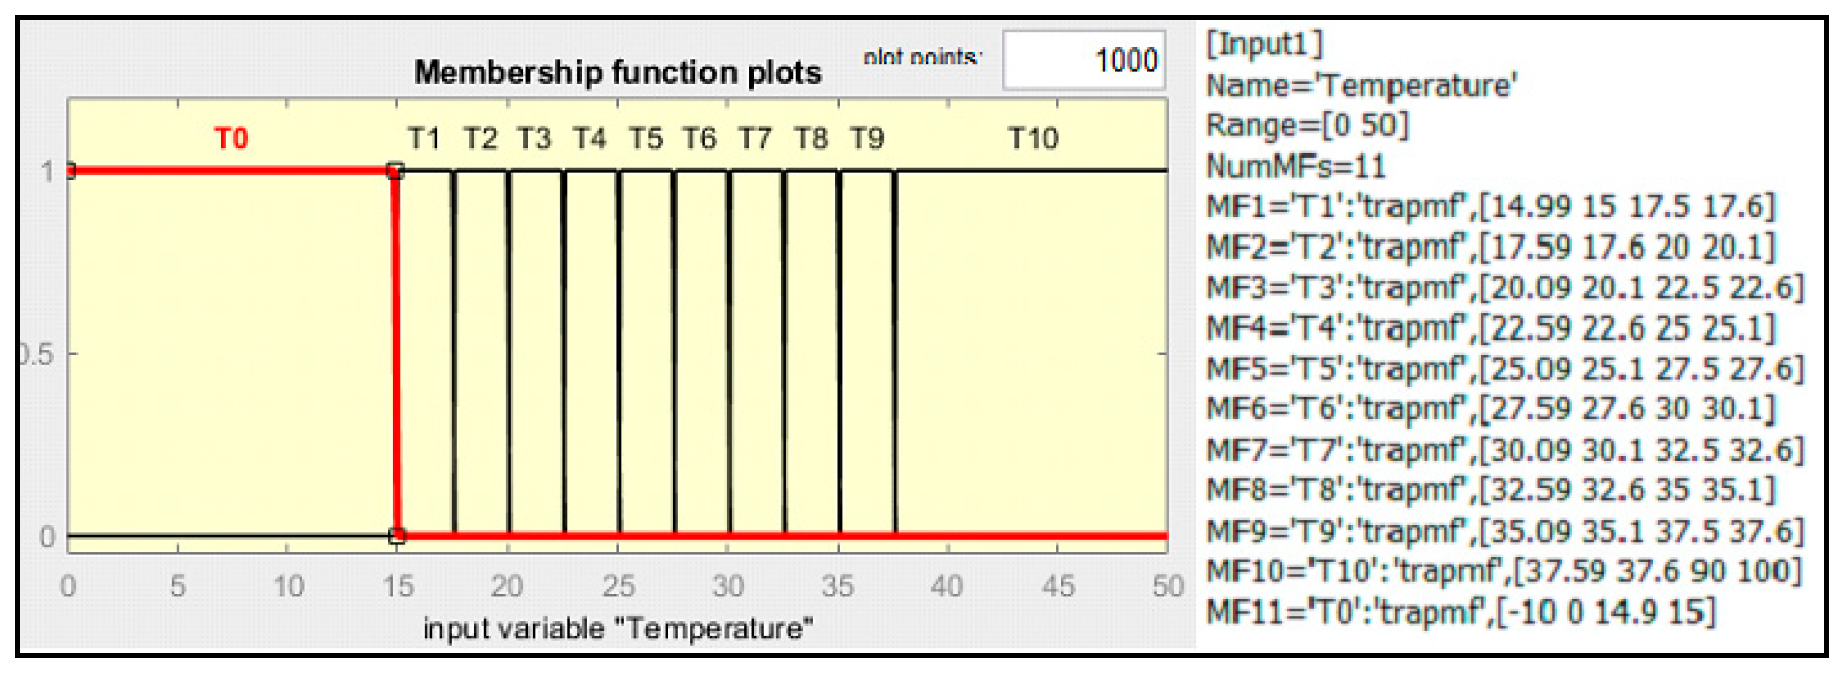
Figure 7.
Configurations of the Output Membership Functions
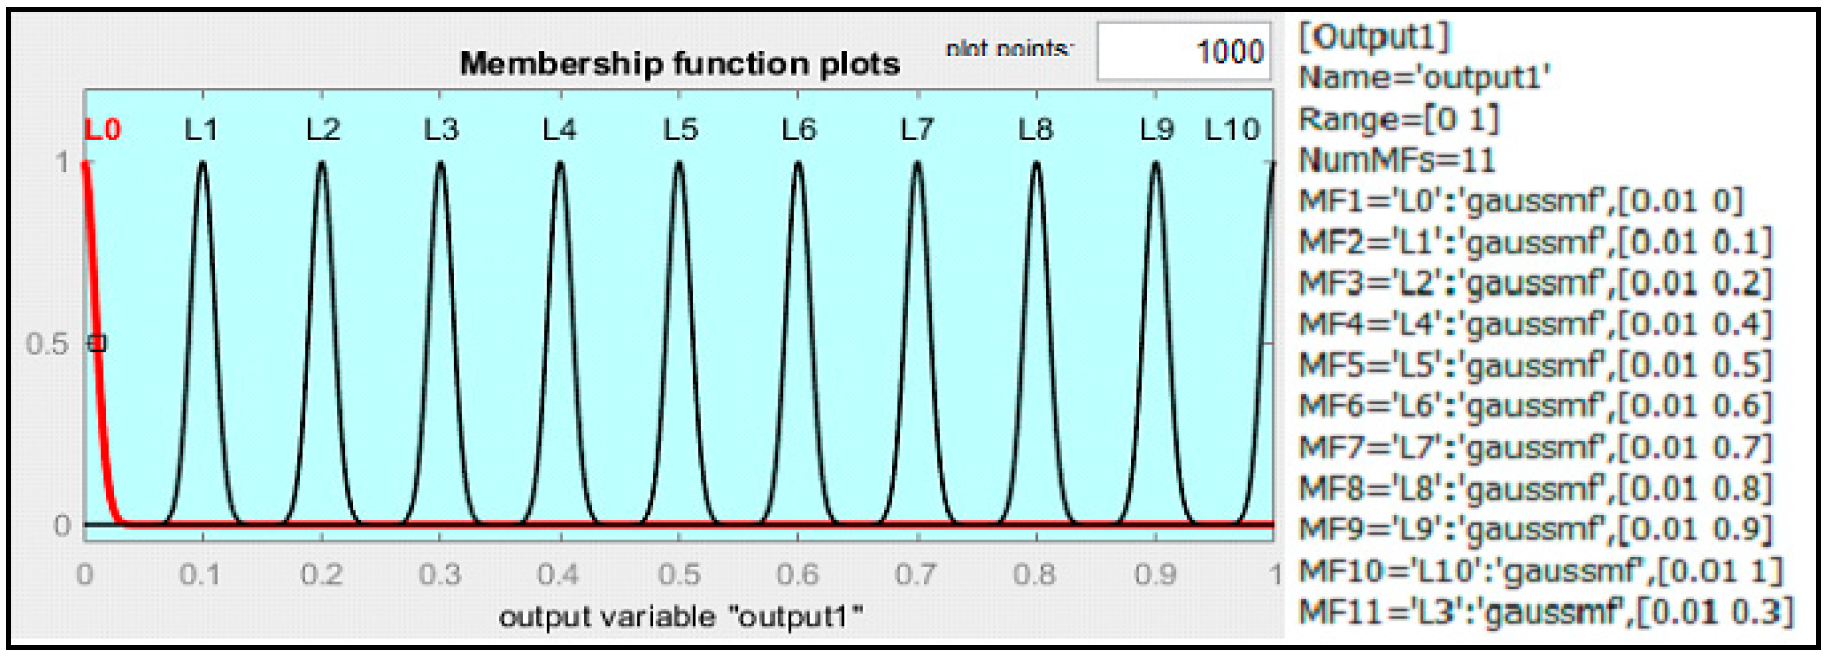
Figure 8.
LSTM Neural Network Architecture

Figure 9.
Relationship of Pipe Pressure to Flood Height
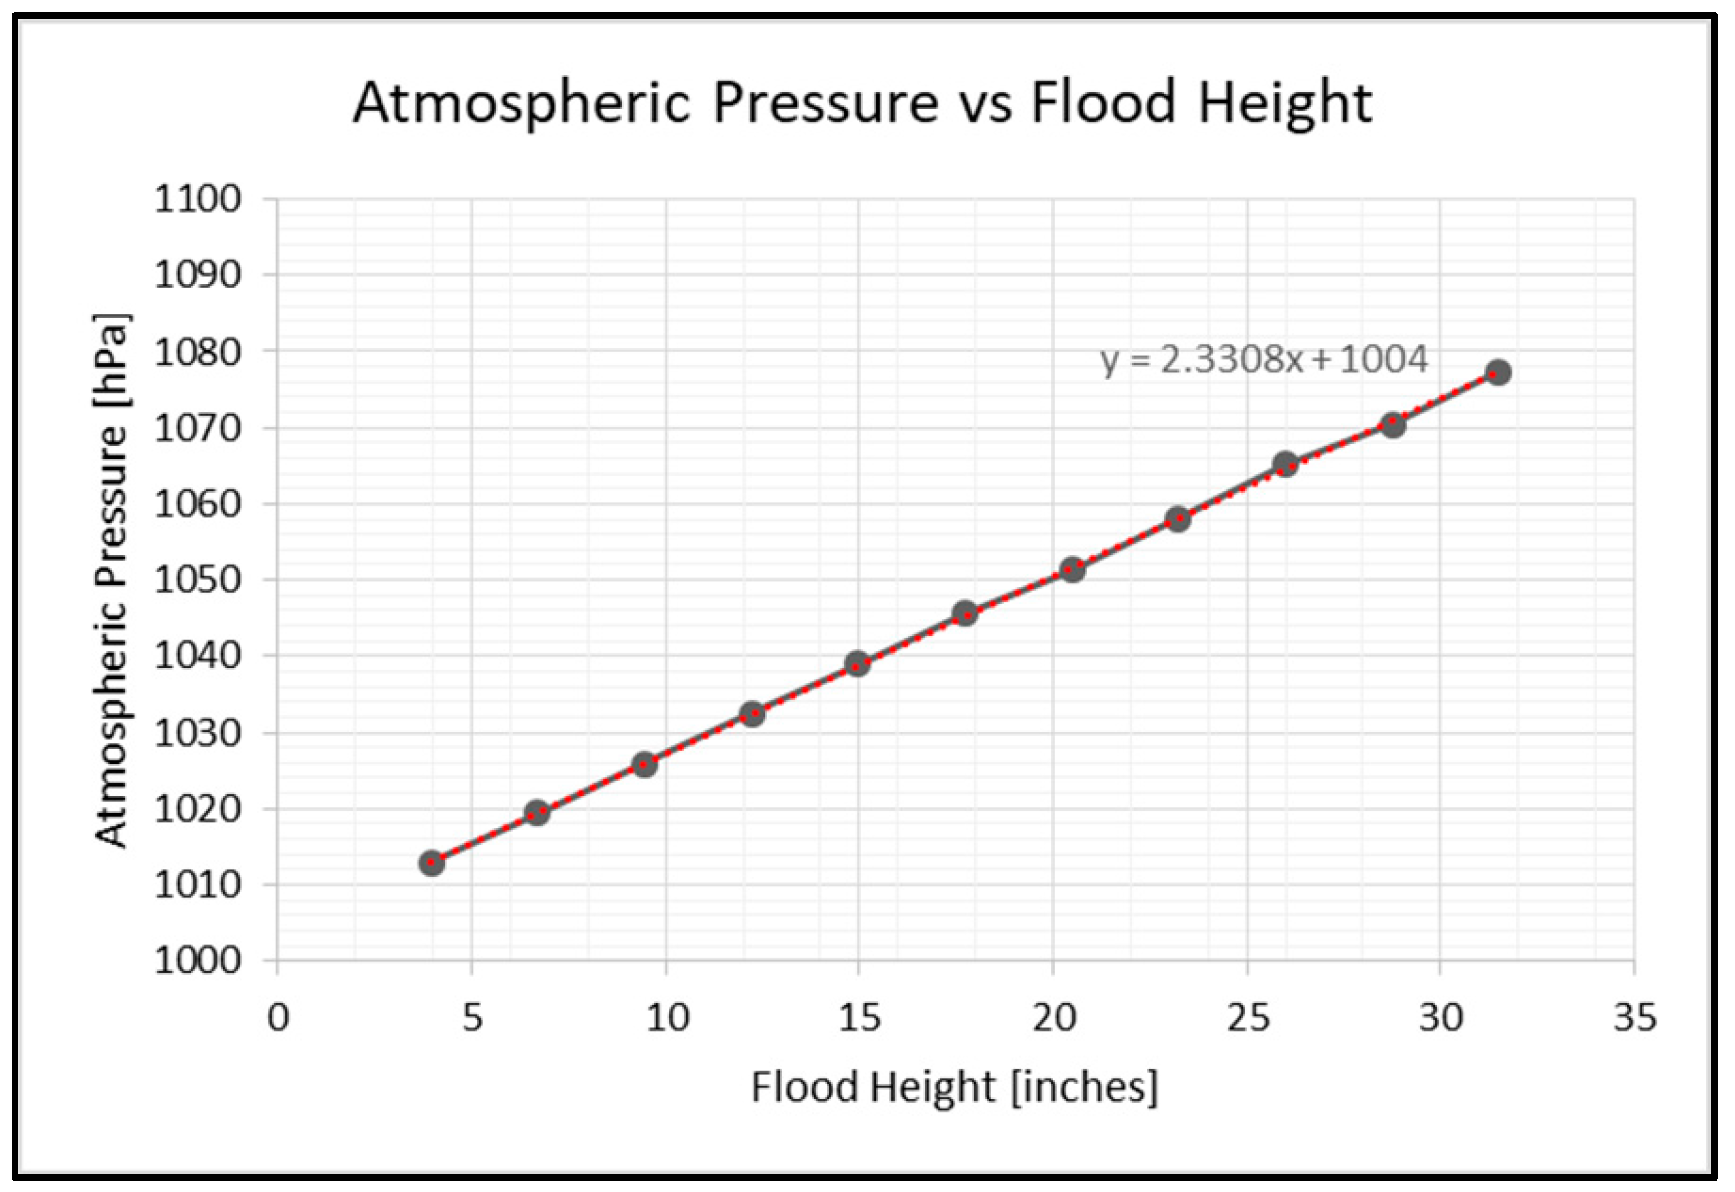
Figure 10.
Complete Data: March 23, 2025
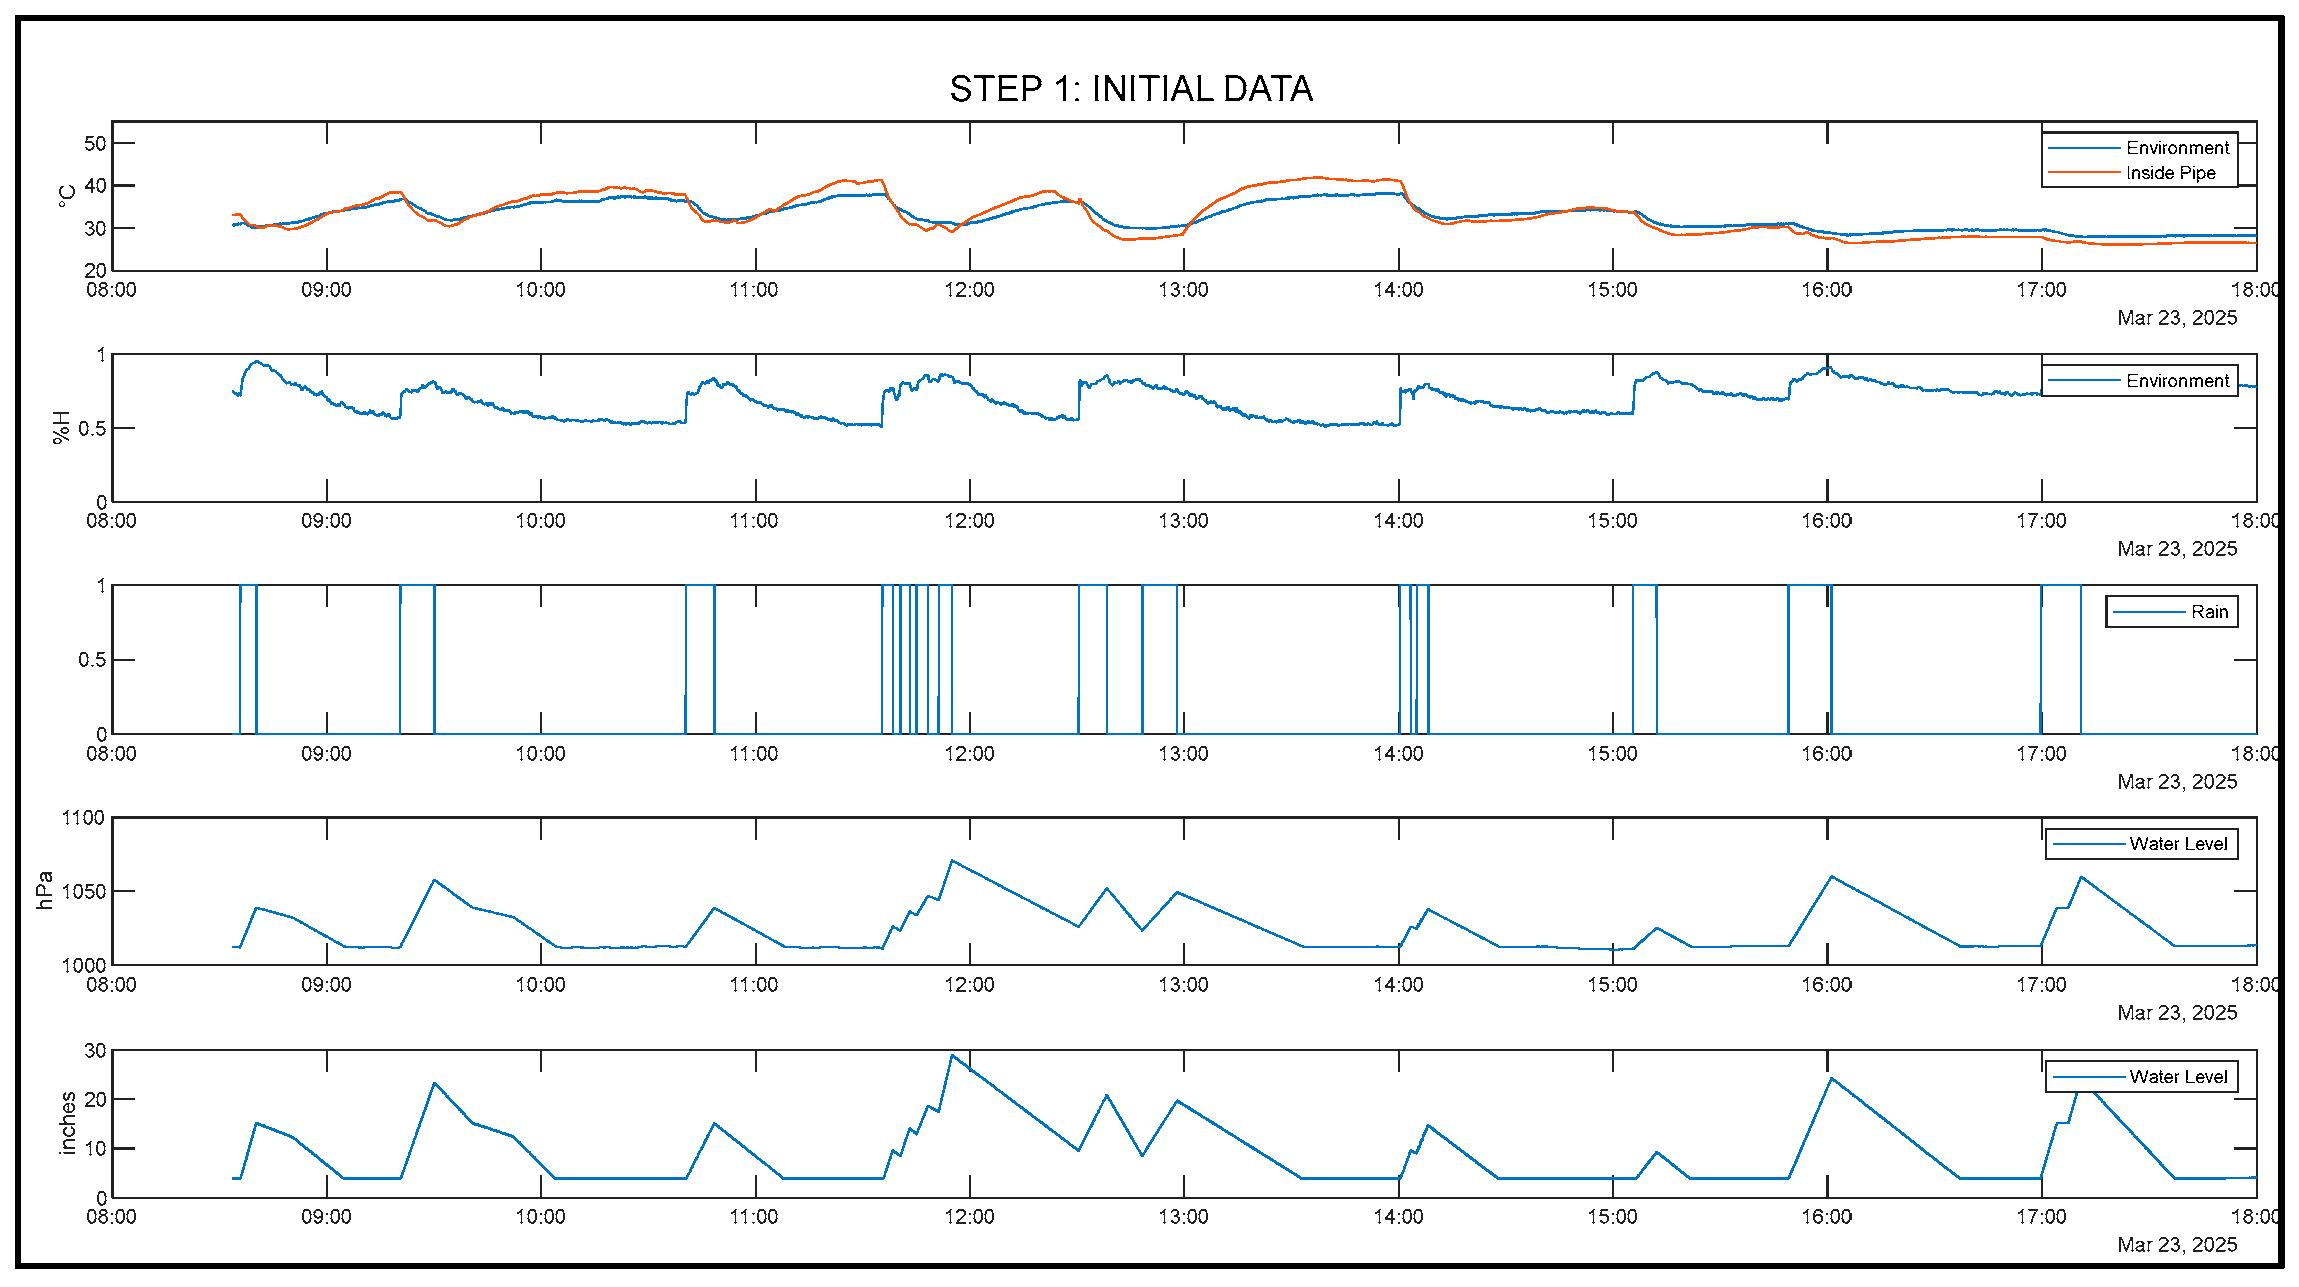
Figure 11.
Normalized Data: March 23, 2025
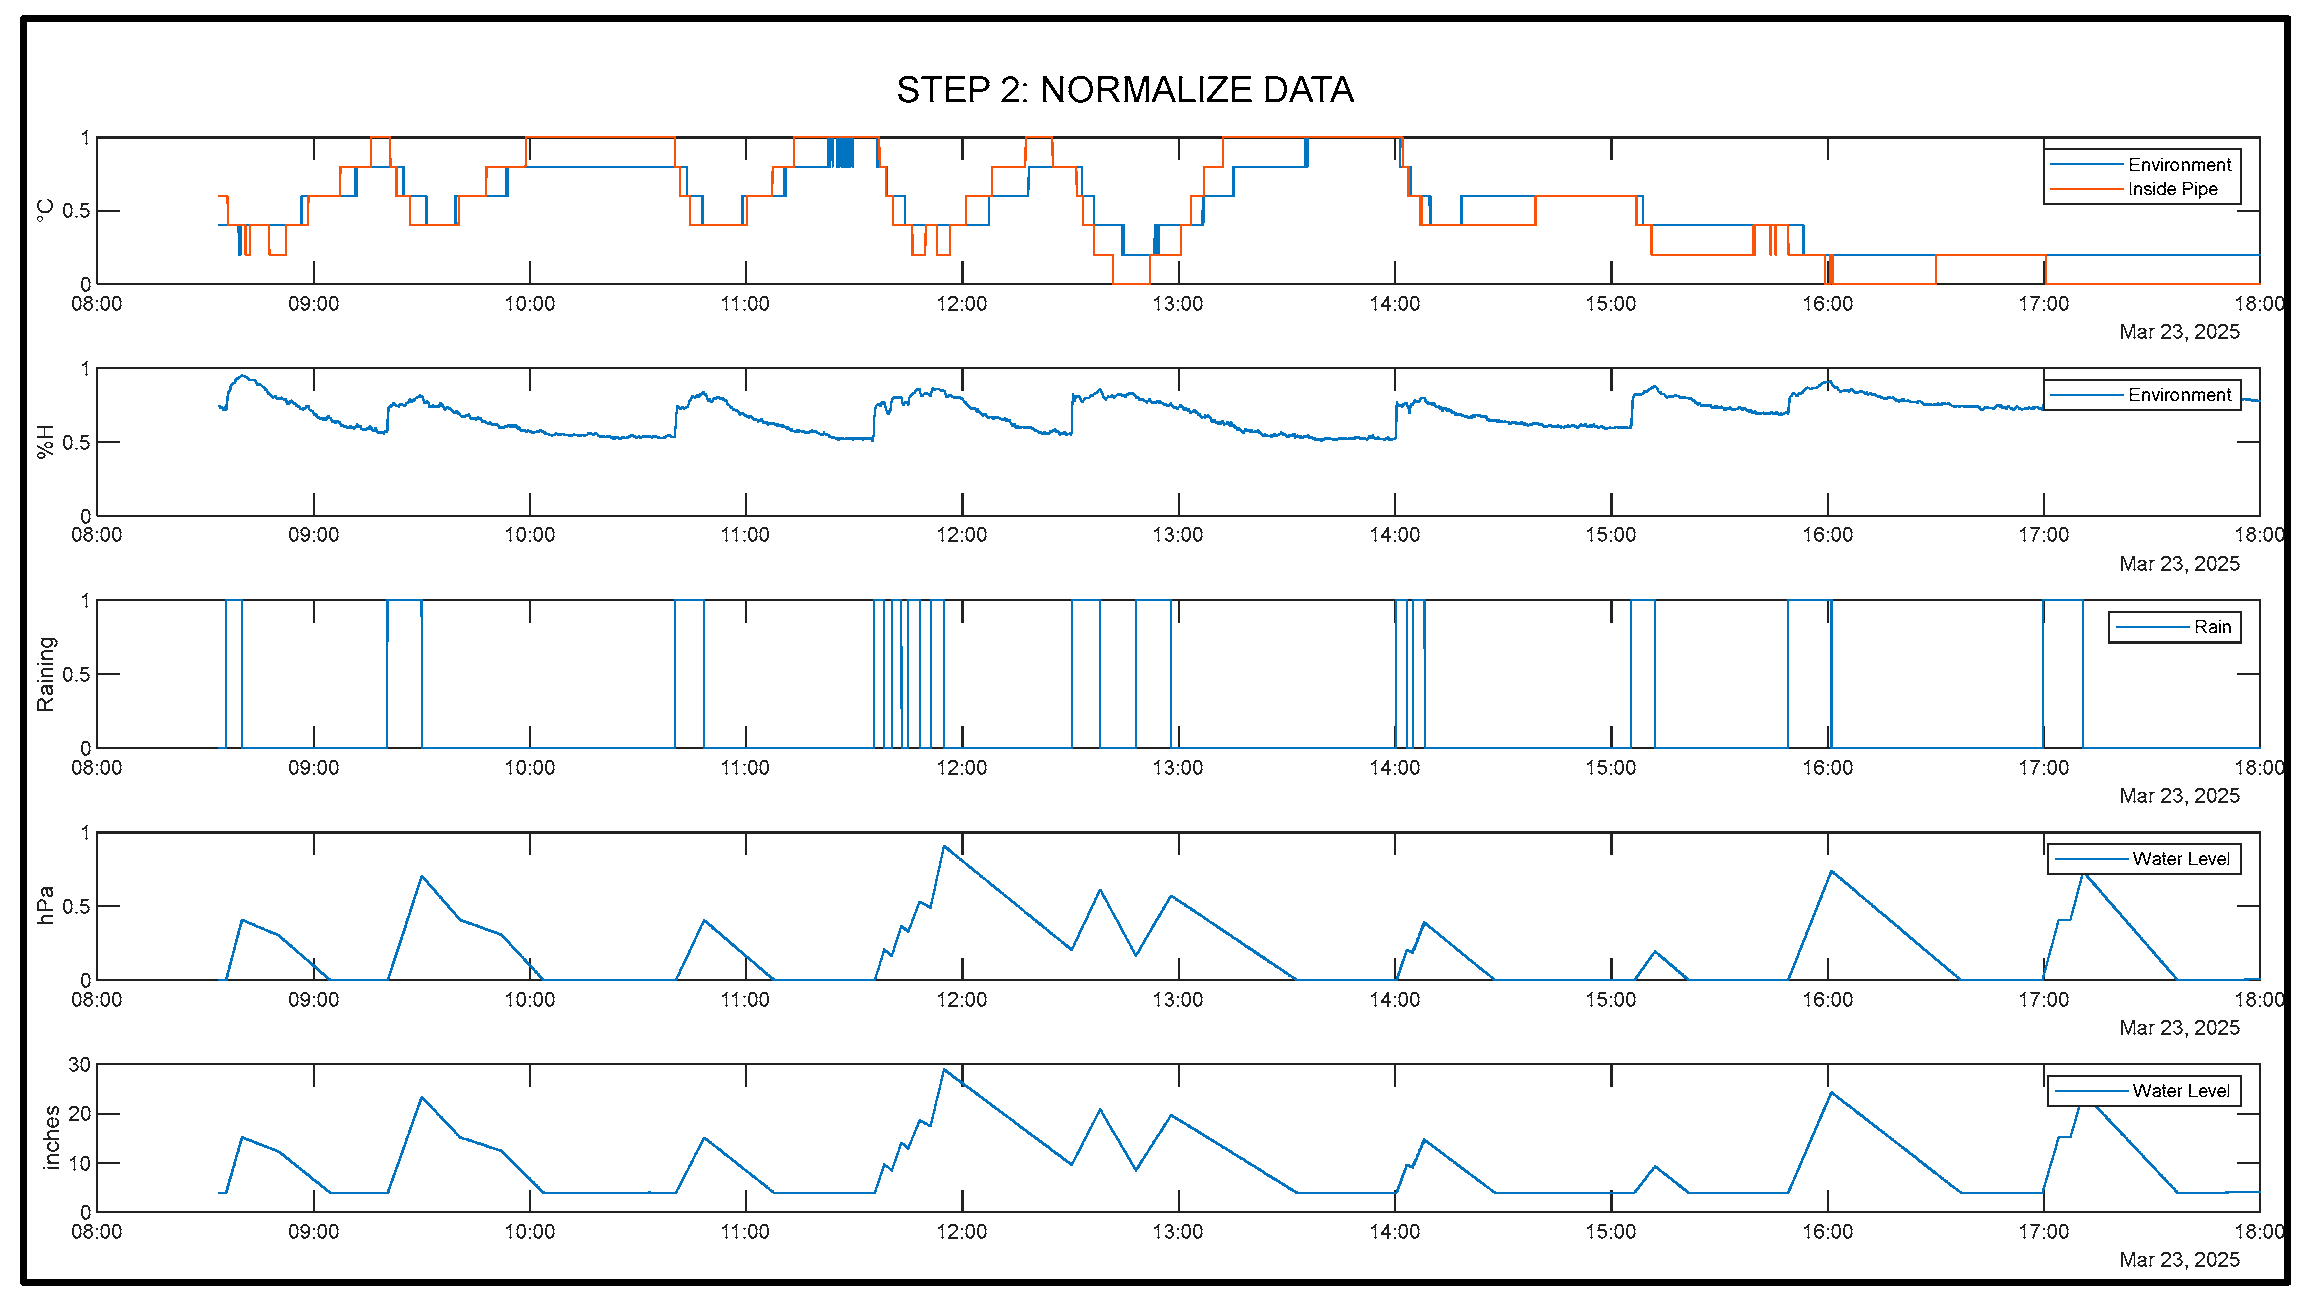
Figure 12.
Training Results of 1000 Epochs (Regression)
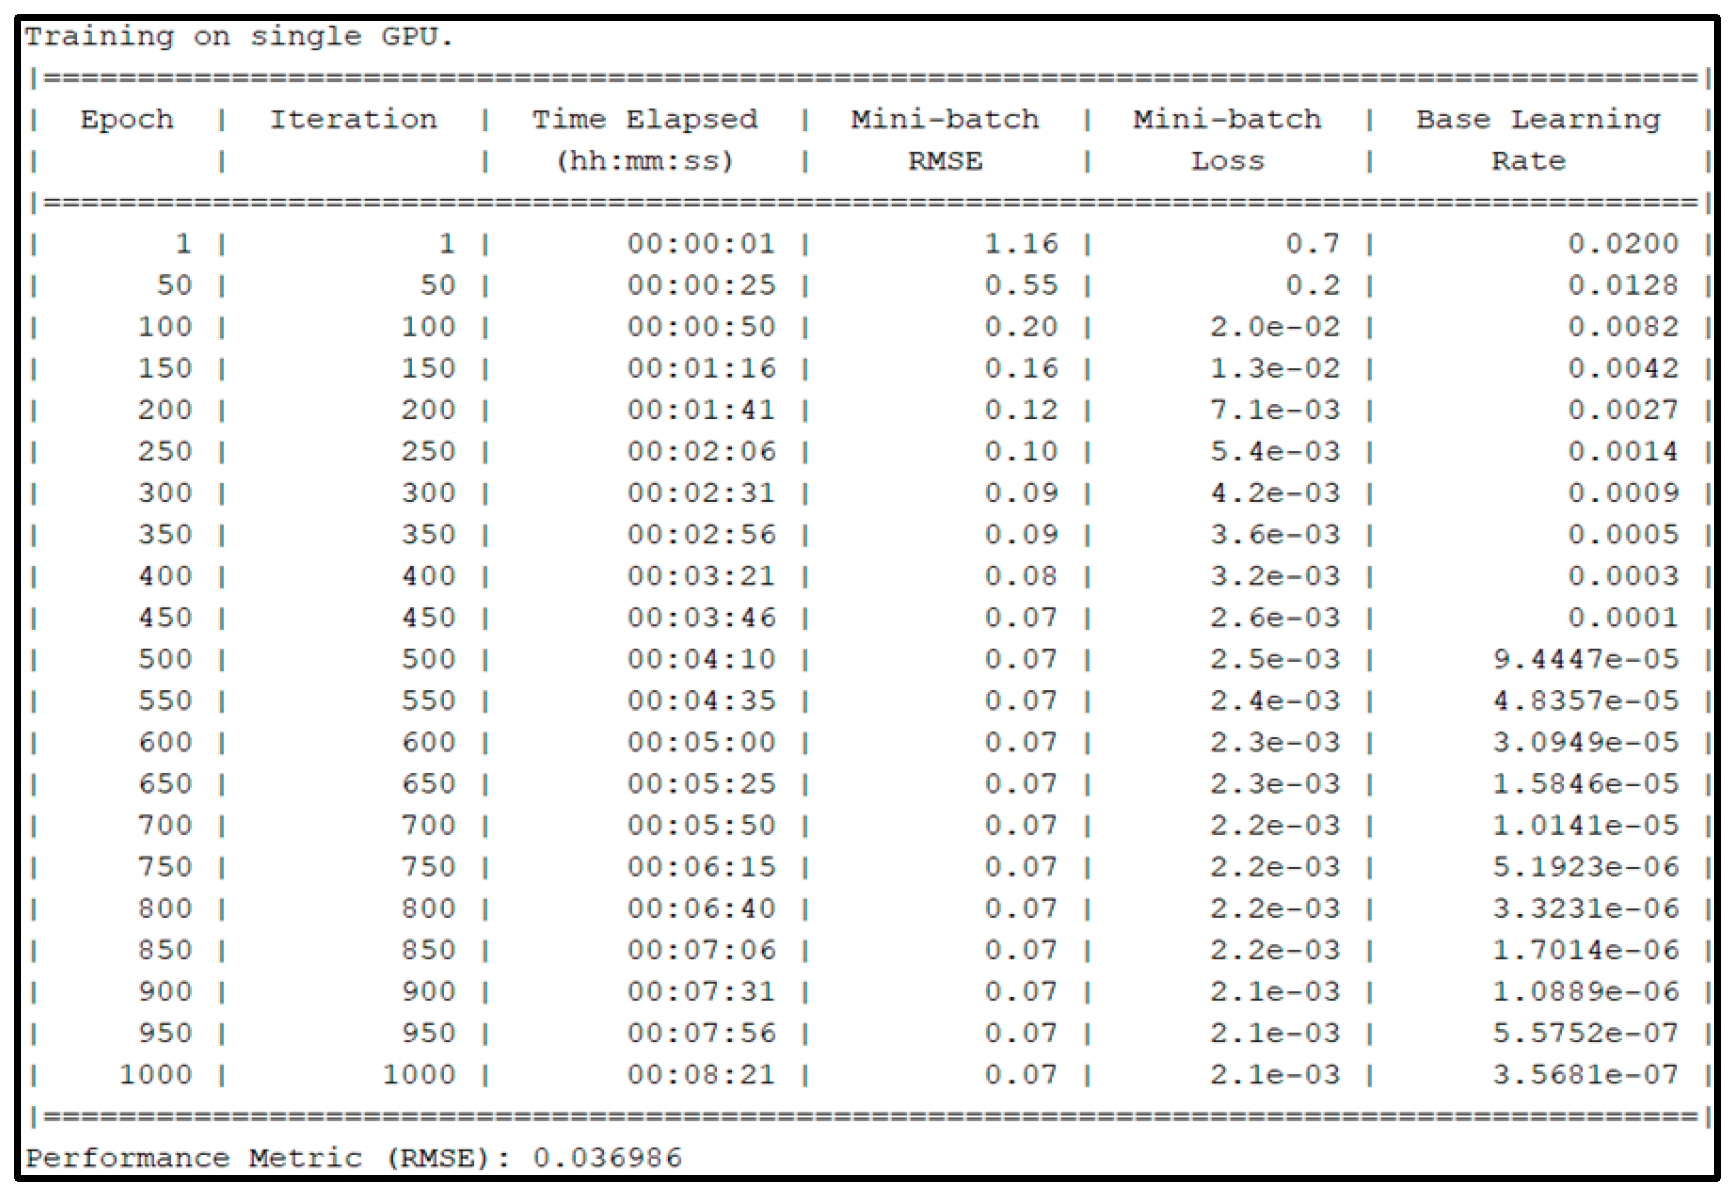
Figure 13.
Closed Loop Forecasting 2023 October 2-3
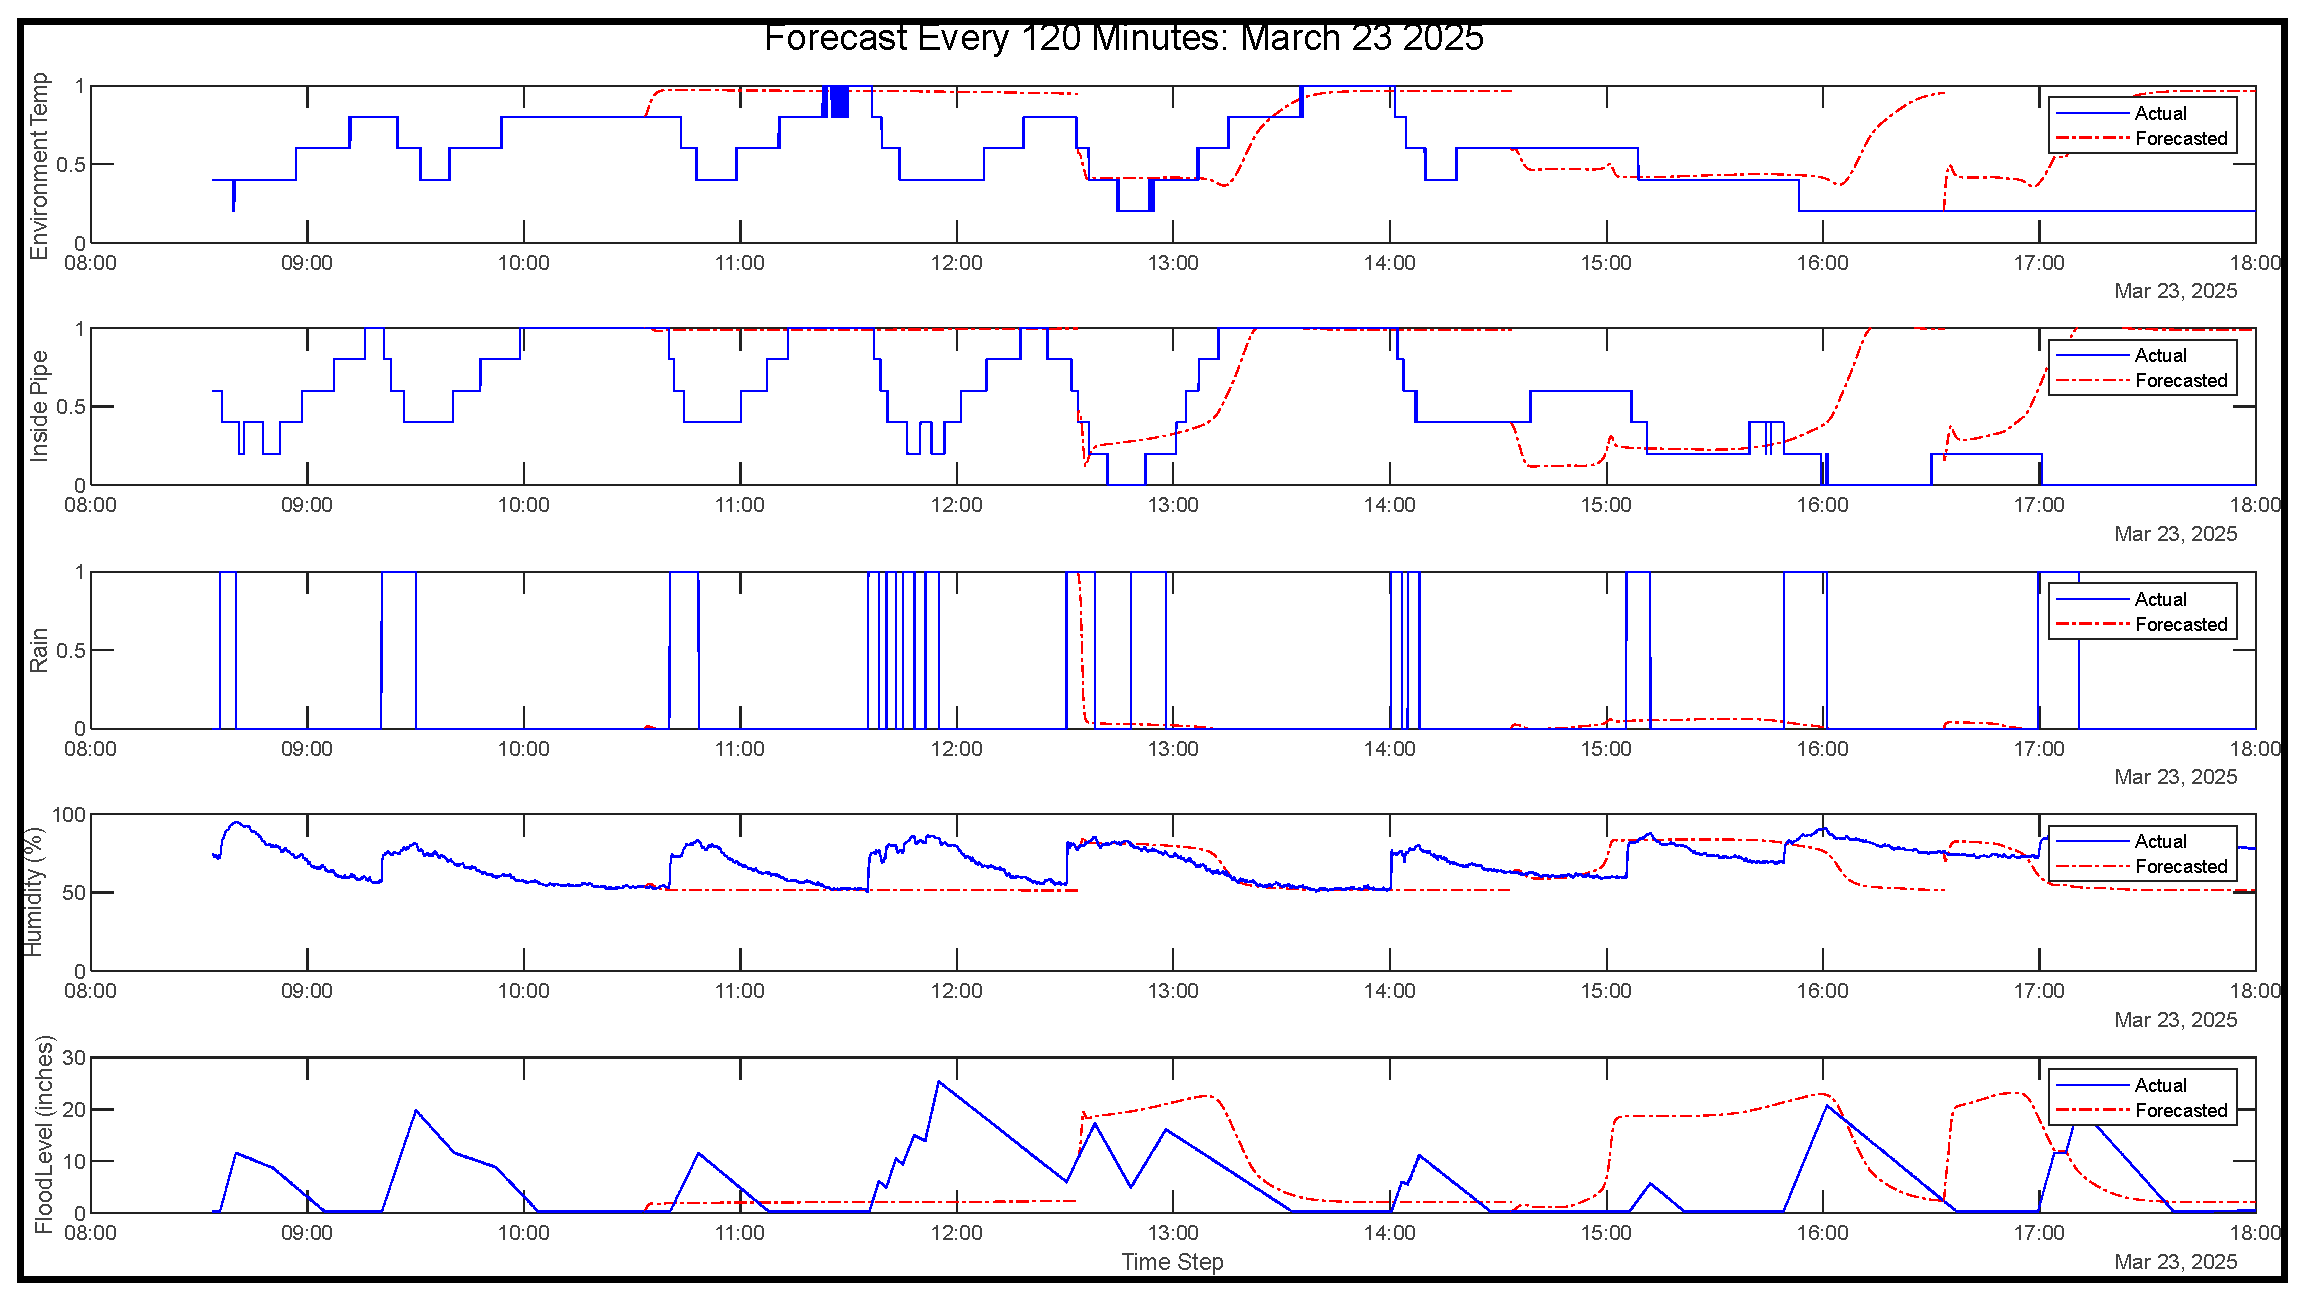
Figure 15.
Closed Loop Forecasting (March 23 2025)
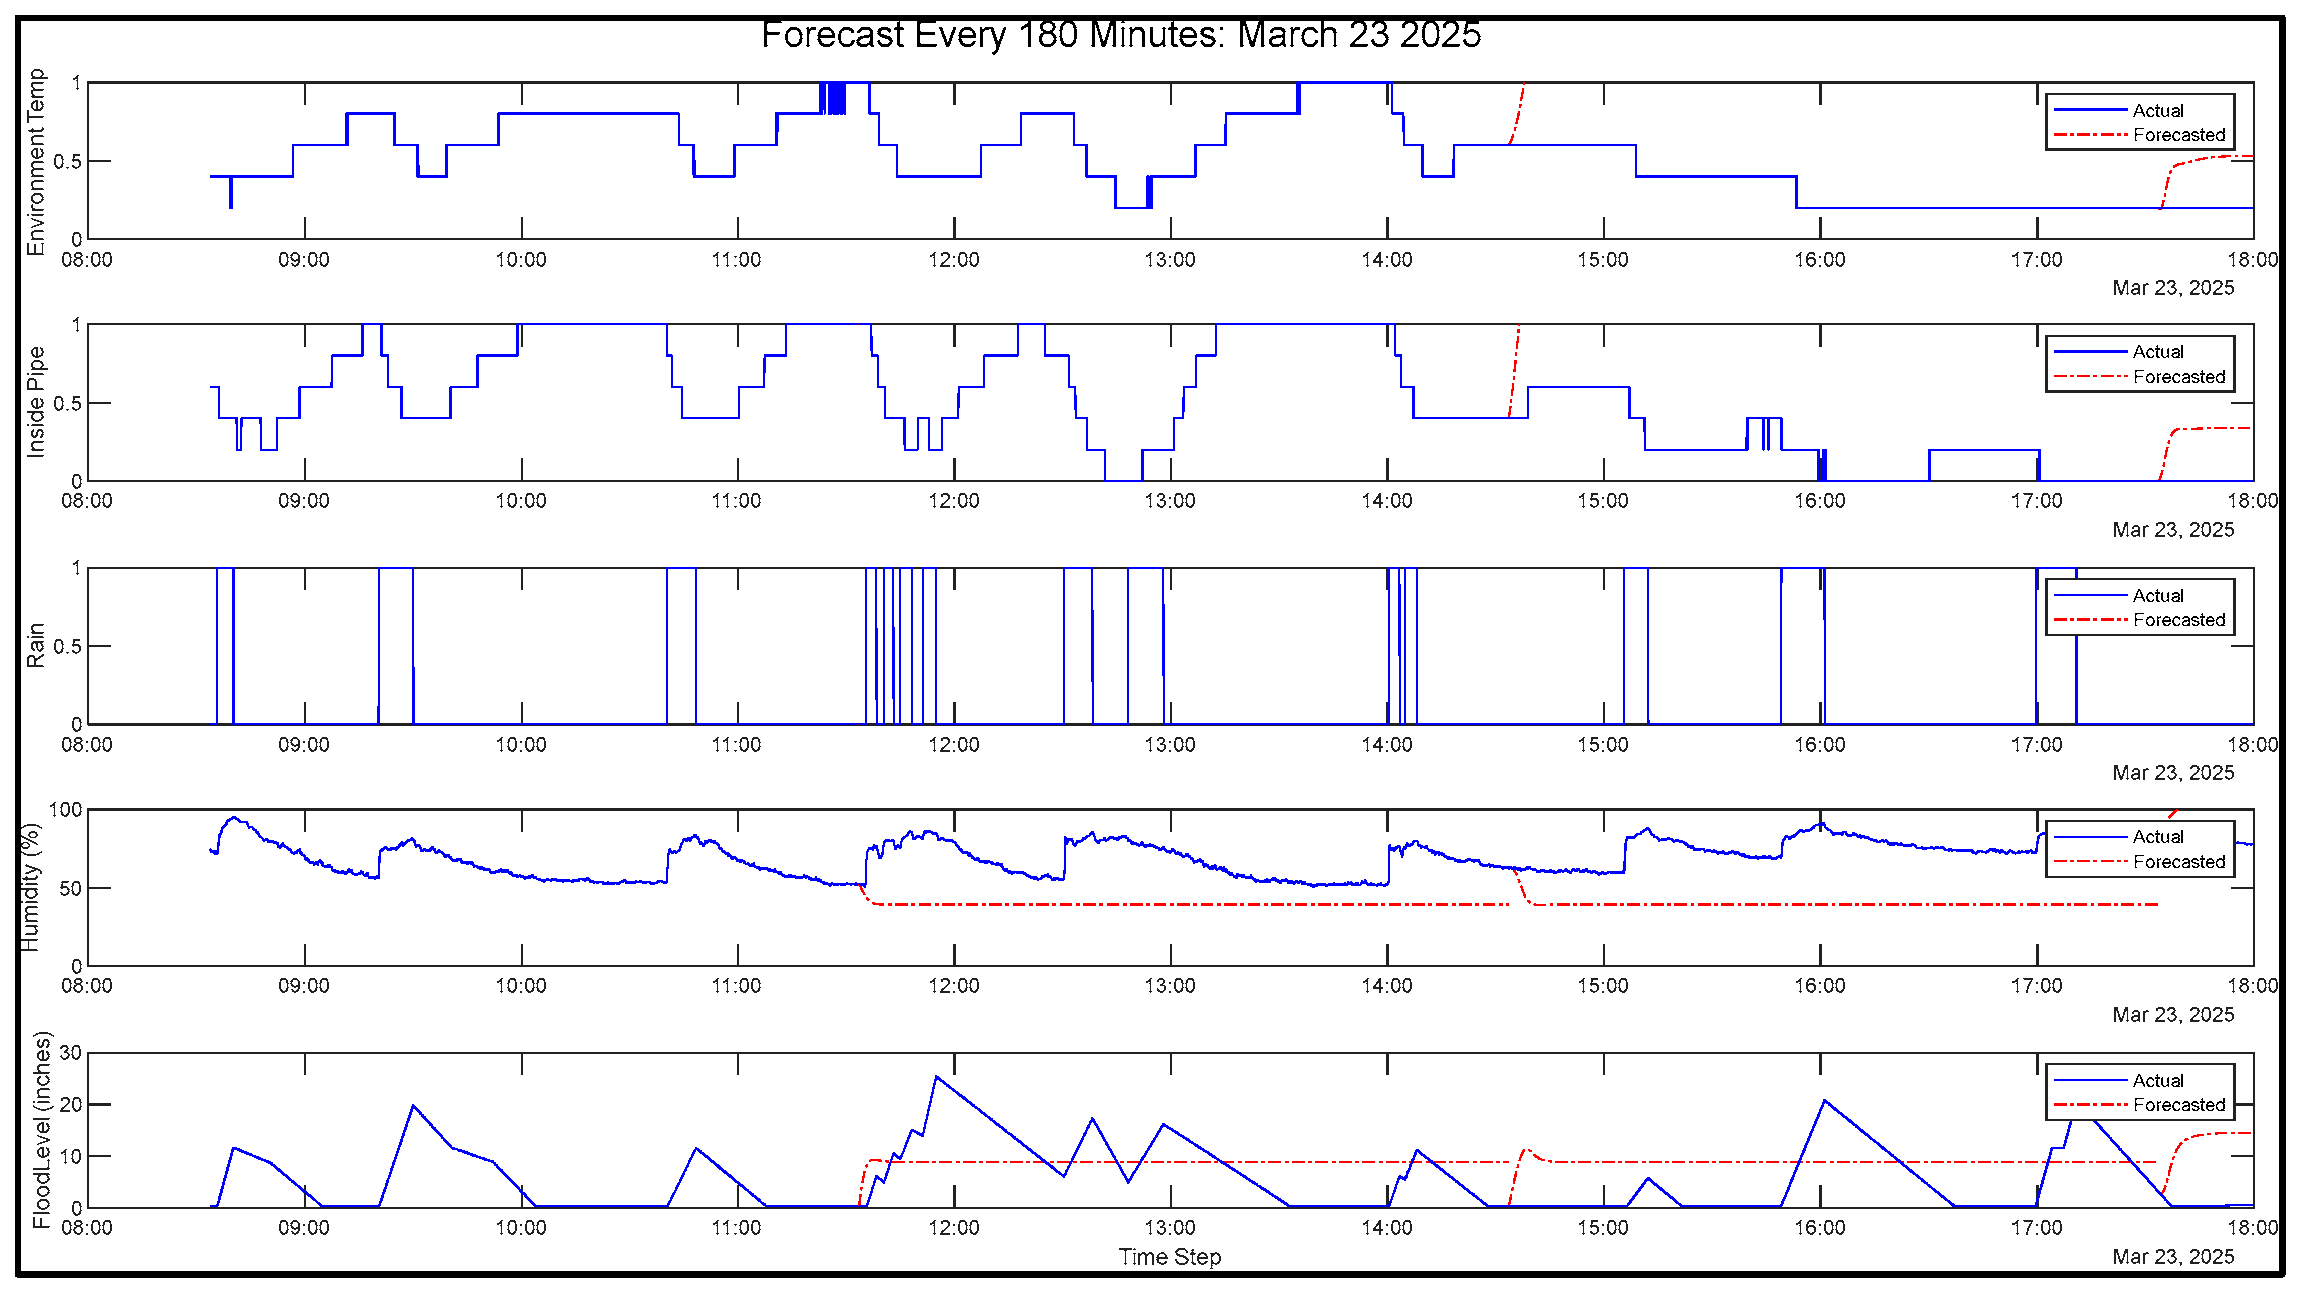
Figure 16.
Training Results of the Best Solution
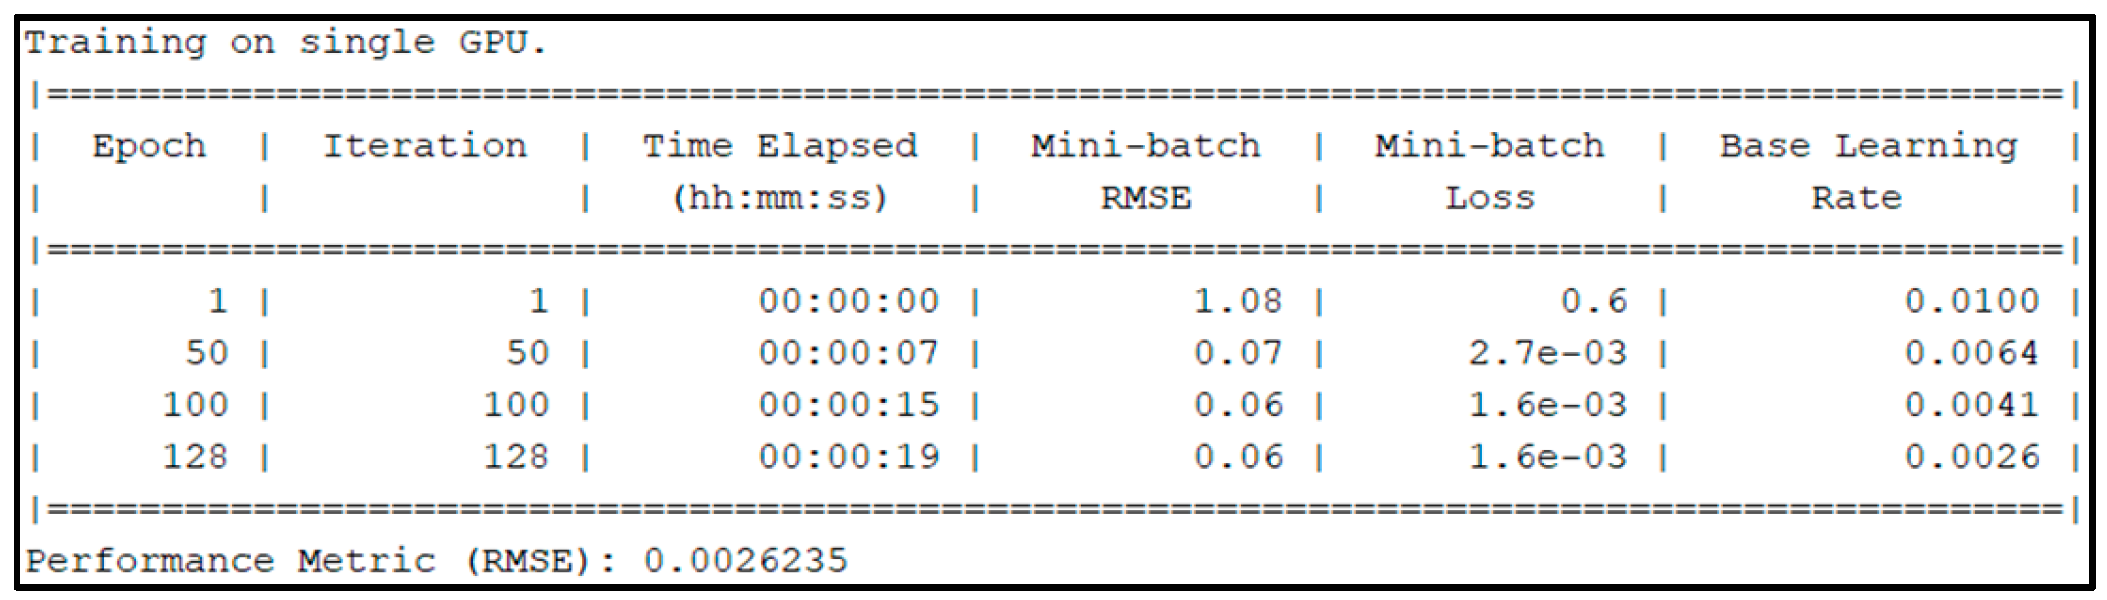

Table 1.
Technical Factors for Manila City Drainage Assessment (MCDA) (Woodlands Consultants, Inc. 24 May 2024)[4].
Table 1.
Technical Factors for Manila City Drainage Assessment (MCDA) (Woodlands Consultants, Inc. 24 May 2024)[4].
| Technical Factors for Selection Criteria |
Description |
|---|---|
| Technical Complexity | deals with the complexity of design, construction methods, and the technology involved |
| Adaptability | deals with the capacity for long-term adjustments, including accommodating future expansions, changes in the use, and integrating emerging technologies |
| Flexibility | deals with the immediate responsiveness to short-term changes, allowing for adjustments in flow rates, component operations, and operational strategies. |
| Lifetime | deals with the durability and longevity in terms of the quality of materials used, construction standards, and maintenance practices to determine the expected lifespan of the infrastructure |
| Maintenance Requirements | deals with the long-term maintenance requirements, including the frequency and complexity of the maintenance activities needed to ensure the continued functionality and performance of the drainage system. |
Table 2.
Fuzzification of Water Level and Rainfall
| Water Level | Equation | Rainfall |
|---|---|---|
| Below Average (0) | ≤Water Level – 10% x Water Level | No Rain (0) |
| Average (0.5) | Else | Rain (1) |
| More than Average (1) | ≥Water Level + 10% x Water Level |
Table 3.
Defuzzification of Risk
| Water Level | Rainfall | Risk Assessment |
|---|---|---|
| Below Average (0) | No rain (0) | No-Risk (0) |
| Rain (1) | No Risk (0) | |
| Average (0.5) | No rain (0) | No Risk (0) |
| Rain (1) | No Risk (0.5) | |
| Above Average (1) | No rain (0) | No Risk (0) |
| Rain (1) | High Risk (1) |
Table 4.
Comparison Summary of the two LSTM Neural Networks
| Hyperparameters | LSTM without GA | LSTM with GA |
|---|---|---|
| Type of Solver | Adaptive Moment Estimation | Adaptive Moment Estimation |
| LSTM Hidden Layers | 1000 | 244 |
| Epoch | 1000 | 128 |
| Prediction Minutes | 120 | 180 |
| Initial Learning Rate | 0.02 | 0.01 |
| Training Time | 8 minutes 21 seconds | 19 seconds |
| Accuracy | 0.036986 | 0.0026235 |
Table 5.
Comparison Summary of the two LSTM Neural Networks
| Statistical Parameters | Criteria for Significant Difference | Result |
|---|---|---|
| P-Value | <0.05 | 0 |
|
Confidence Interval |
Does not include 0 | [2.8664, 2.8664] |
| Hypothesis Test Result | 1 | 1 |
Disclaimer/Publisher’s Note: The statements, opinions and data contained in all publications are solely those of the individual author(s) and contributor(s) and not of MDPI and/or the editor(s). MDPI and/or the editor(s) disclaim responsibility for any injury to people or property resulting from any ideas, methods, instructions or products referred to in the content. |
© 2025 by the authors. Licensee MDPI, Basel, Switzerland. This article is an open access article distributed under the terms and conditions of the Creative Commons Attribution (CC BY) license (http://creativecommons.org/licenses/by/4.0/).
Copyright: This open access article is published under a Creative Commons CC BY 4.0 license, which permit the free download, distribution, and reuse, provided that the author and preprint are cited in any reuse.


