
Submitted:
09 May 2025
Posted:
12 May 2025
You are already at the latest version
Abstract
This study examines the impact of firm agglomeration on foreign direct investment (FDI), public investment, export revenues, and industrial income in Gabon’s forestry sector, comparing the Nkok Special Economic Zone (SEZ) with areas outside the SEZ. Using robust econometric approaches—including ordinary least squares (OLS) time-series and bias-corrected (BC) panel models—the analysis highlights socio-economic and geographic disparities within Gabon’s forestry industry. The study also assesses the effects of FDI and public investment on firm clustering, exports, and industrial income in both zones. Following an evaluation of disparities in Gabon’s forestry sector, the study proposes a Dynamic Governance Model for Uneven Growth (DGMUG) to manage accelerated development and mitigate resulting inequalities. The findings reveal that the Nkok SEZ benefits from favorable industrialization conditions, marked by strong growth, sustained exports, and concentrated FDI supported by public investment. In contrast, peripheral regions experience slower and less stable growth due to structural challenges and insufficient targeted investments. Furthermore, while FDI combined with public investment has a positive impact in Nkok, it exerts a negative effect outside the SEZ, exacerbating geographic polarization. Post-2018, investments in the SEZ declined, likely due to market saturation and weakened public-private cooperation, whereas investments outside the SEZ remained limited. To address these imbalances, the study introduces the DGMUG as a complementary framework to existing strategies, such as those of the World Bank (2011). This model outlines three phases: (1) initial polarization, (2) an acceleration phase with potential scenarios (lethal, stagnation, or acceleration-diversification), and (3) a transition toward regional equilibrium. The study underscores the mechanisms of polarization and resulting inequalities while proposing strategies to mitigate disparities and foster more balanced regional development.
Keywords:
development clusters
; unbalanced regional growth
; SEZs
; business clusters
; FDI
; monitoring-evaluation
; planning and dynamic management of imbalances
Introduction
Corporate agglomeration, a crucial phenomenon for economic development, is all the more significant in developing countries, where it plays a major role in investment, industrial growth and exports. Agglomeration externalities, such as lower production costs, easier access to skilled human capital and shared infrastructure and knowledge, bring many benefits. Studies such as those by Krugman (1991) [1], Venables (1996) [2] and Fujita (1999) [3] have demonstrated that these agglomerations stimulate competitiveness, innovation and regional attractiveness, while promoting international trade. However, the impact of these dynamics varies from one context to another, and public policy must take care to avoid reinforcing regional inequalities.
Foreign direct investment (FDI), particularly in Special Economic Zones (SEZs), brings significant benefits to developing countries. They generate positive effects such as job creation, reduced unemployment, technology transfer and improved infrastructure (Farole & Akinci, 2011; Zeng, 2016) [4,5]. These zones attract quality investments, increasing exports and improving foreign exchange earnings, while facilitating the integration of local companies into global value chains, thereby enhancing international competitiveness (Gereffi & Fernandez-Stark, 2016) [6]. In addition, FDI in SEZs contributes to the development of local infrastructure, such as roads and ports, thus benefiting local communities.
Econometric research has explored the impact of firm agglomeration on FDI, industrial growth and exports in developing countries, using a variety of methodologies such as panel regressions and computable general equilibrium models. These studies have shown that agglomeration generally favors industrial growth, FDI attraction, competitiveness on world markets and exports (Krugman, 1991; Venables, 1996; Fujita, Krugman and Venables, 1999) [1,2,3]. FDI plays an essential role in modernizing local industrial sectors, notably through the introduction of advanced technologies and improved managerial skills (Borensztein et al., 1998; Javorcik, 2004) [7,8]. However, the effects of FDI vary according to the sector of activity and the degree of integration of countries into the global economy, underlining the importance of the specific context of each country.
Decision-support tools for SEZs include profitability assessment models, geographic information systems (GIS), performance scorecards (PSC) and cost-benefit analyses. These tools aim to assess the economic and social impacts of SEZs and adjust strategies based on the results obtained (UNIDO, 2009; Kuroda et al., 2012) [9,10]. In addition, the participatory approach in SEZ strategic planning ensures the involvement of all stakeholders, including governments and local communities, in order to meet the specific needs of the regions concerned (Sharma et al., 2015) [11].
However, the concentration of economic activities in SEZs often creates socio-economic and geographic imbalances. This phenomenon leads to the marginalization of peripheral regions, reinforcing regional inequalities (Dunning, 2000; Pistorius & Dufresne, 2016) [12,13]. Furthermore, the agglomeration of companies in sectors such as logging in South America can lead to negative ecological effects, such as deforestation and ecosystem degradation, with consequences for biodiversity and local communities dependent on natural resources (Sunderland & Ndoye, 2015; Berge, 2015) [14,15].
In Central Africa, particularly Gabon, although progress has been made in the sustainable management of forest resources, several challenges persist, not least the weakness of local institutions. These weaknesses complicate the regulation of Special Economic Zones (SEZs), the management of natural resource exploitation and the redistribution of benefits, contributing to poor governance (Berge, 2015) [15]. Dynamic, planned resource management remains limited, and the absence of regional policy monitoring and planning tools accelerates socio-economic imbalances, hindering the implementation of sustainable development strategies. Furthermore, excessive dependence on foreign direct investment (FDI) exposes the Gabonese economy to fluctuations in world markets, thus weakening the local economy (Dunning, 2000) [12]. Weak transfer of local technologies and skills by foreign companies also hampers sustainable development, particularly in the forestry sector where priority is often given to short-term exploitation, neglecting long-term solutions for local populations (Pistorius & Dufresne, 2016) [13].
Regional development policies in Gabon are often fragmented, preventing coherent coordination between the country's different regions and limiting the impact of SEZs on sustainable growth. There is an urgent need for an integrated vision of development, taking into account the specificities of local territories and needs, to maximize the effectiveness of SEZs. To overcome these challenges, the study proposes a sustainable governance system based on several pillars, including inclusive and decentralized governance, local capacity building, the promotion of sustainable agriculture and industry in SEZs, and public-private partnerships to ensure transparent and sustainable management of natural resources and SEZs.
The originality of this study lies in its innovative methodological approach, its focus on geographical disparities within SEZs, and its governance model for addressing unbalanced regional growth. By examining the interaction between FDI, public investment and business agglomeration in distinct geographical contexts, the study proposes an integrated framework of decision-support tools to better understand territorial and economic dynamics in developing countries. This research contributes to the strategic management of SEZs and regional development planning, while paving the way for future studies on the impact of differentiated industrial policies.
The study has three main objectives. The first is to analyze the impact of business agglomeration on FDI, public investment, export revenues and industrial revenues, by comparing two distinct economic areas of Gabon: the Nkok SEZ, a homogeneous area, and the areas outside this SEZ, a heterogeneous area. The aim is to divide the Gabonese forestry sector into two zones to highlight socio-economic disparities. The econometric approach is based on the robust ordinary least squares (OLS) method, which corrects for estimation bias and problems of autocorrelation, normality and homoscedasticity of residuals. The second objective is to study the impact of FDI and public investment on firm agglomeration, export revenues and industrial revenues in the two geographical areas. Finally, the study proposes a governance model to address unbalanced regional growth, emphasizing endogenous growth, multinational FDI and public-private initiative. This model envisages that, under certain conditions, unbalanced regional growth associated with SEZs can accelerate regional development. It also proposes a decision-making tool for strategic planning of regional development policies, using SEZs as levers for industrialization and sustainable development, and aims to strengthen the resilience of local economies while improving the monitoring and evaluation of development hubs in developing countries.
Literature Review
- The effects of corporate agglomeration on investment, industrial growth and exports in developing countries
There is a wealth of academic research on the impact of firm agglomeration on investment, industrial growth and exports in developing countries. An important point of this literature review is to focus on the econometric methods used and the main results obtained. Several major studies are discussed, each using different approaches to analyze the effects of industrial agglomerations. For example, Krugman (1991) [1] uses a theoretical model to show that agglomerations generate increasing returns, thus favoring the geographic concentration of economic development. Fujita, Krugman and Venables (1999) [3] extend this dynamic by analyzing the impact of agglomerations on international competitiveness and productivity, particularly in developing countries. Other studies, such as those by Michaels (2008) [16] and Duranton and Puga (2004) [17], examine the impact of agglomerations on innovation, exports and the attraction of foreign investment. Finally, Rodríguez-Clare (1996) [18] focuses on the division of labor and its role in specialization and FDI attraction. The econometric approaches most commonly used in these studies include panel regressions, computable general equilibrium (CGE) models, endogenous growth models, as well as methods such as difference-in-difference (DiD) and spatial models. In terms of results, industrial agglomeration is generally associated with higher industrial growth, greater foreign direct investment, enhanced competitiveness on world markets and increased exports. However, the benefits of agglomeration can sometimes accentuate regional disparities if the effects are concentrated in a few geographical areas.
Research into the impact of foreign direct investment (FDI) on firm agglomeration, industrial growth and exports in developing countries has explored various facets of this phenomenon, including productivity gains, infrastructure improvements, technology transfers and competitiveness on international markets. The methodologies employed in these studies are varied, including panel regression models, cointegration and Granger causality approaches, as well as spatial and difference-in-difference methods to examine the effects of FDI in a temporal and spatial framework. The results show that FDI promotes industrial growth, particularly in countries that attract quality investments, such as those bringing advanced technologies and managerial skills. For example, FDI can modernize production capacities and introduce more efficient technologies, as demonstrated by Borensztein et al. (1998) [7]. FDI also stimulates the agglomeration of companies, contributing to the creation of industrial clusters that improve economies of scale and the diffusion of knowledge, as shown in the study by Javorcik (2004) [8]. As far as exports are concerned, FDI facilitates the integration of local companies into global production chains, boosting their international competitiveness, particularly in sectors such as electronics, textiles and automobiles, as shown in the study by Blomström and Kokko (1998) [19]. However, the impact varies according to the sector of activity and the degree of integration into the global economy, underlining the importance of the specific context of each country.
- II.
- Decision support tools for monitoring, evaluation and strategic planning of SEZs in developing countries:
Special Economic Zones (SEZs) play a crucial role in the economic development of developing countries by attracting investment, stimulating job creation and promoting industrial growth. However, to maximize their impact, decision-support tools (DSTs) are essential to ensure rigorous monitoring, appropriate evaluation and effective strategic planning. Various researchers and institutions have developed specific tools and methods to optimally manage and evaluate SEZs.
Decision Support Tools for SEZs
- SEZ profitability assessment models
These models seek to assess the profitability of SEZs in terms of tax revenues, jobs created and technology transfers. They rely on quantitative methods to predict short- and long-term returns on investment. A notable example is the model proposed by UNIDO (2009) [9], which helps quantify the economic, social and environmental benefits of SEZs.
- 2.
- Geographic Information Systems (GIS)
GIS is used to analyze the location and geographical distribution of SEZs. They enable existing economic zones and infrastructures to be mapped, thus facilitating decision-making on the location of SEZs. Kuroda et al (2012) [10]. have demonstrated the use of GIS to plan the location of new SEZs in Africa and Asia.
- 3.
- Performance Scorecards (PSC)
The BSC is a tool for monitoring SEZ performance across several key indicators, including profitability, social and environmental impact. It is used to continuously assess elements such as the number of jobs created or the quality of the business environment, as shown by the case studies in Bangladesh and Nigeria.
- 4.
- Cost-Benefit Analysis (CBA) models
This method compares the costs of setting up a SEZ with the expected benefits, whether financial or non-financial, such as job creation or technology transfer. Hinkle et al (2011) [20] have applied this method in sub-Saharan Africa to assess the profitability of SEZs, by comparing operating costs with impacts on employment and exports.
- 5.
- Simulations and Modeling of Economic Impacts
These tools aim to predict the long-term economic impact of SEZs, taking into account export growth and job creation. For example, Lall et al (2004) [21] used computable general equilibrium (CGE) models to simulate the effects of SEZs in Asia and Africa.
- 6.
- SWOT analysis
SWOT analysis is used to assess the strengths, weaknesses, opportunities and threats associated with SEZs. This strategic tool is often integrated into planning processes to adjust development strategies. Farole and Akinci (2011) [4] used SWOT analysis to assess the factors influencing the success of SEZs in Africa, notably governance and infrastructure.
- 7.
- SEZ Strategic Planning Methods
- 7.1.
- Participatory approach
This method involves all stakeholders (government, business, local community) in SEZ planning, in order to take their needs and expectations into account. Sharma et al (2015) [11] have shown in India the importance of this approach in ensuring the long-term effectiveness of SEZs, particularly for local communities.
- 7.2.
- Long-term planning and dynamic management
SEZ planning requires flexible strategies that take account of economic and technological developments. Dynamic planning includes periodic reviews to adapt policies in line with observed results. Farole, Thomas in a World Bank paper (2011) [22] recommended long-term planning for African SEZs, with continuous adjustments according to local and global economic changes.
Methodology
There is a wealth of academic research on the impact of firm agglomeration on investment, industrial growth and exports in developing countries. An important point of this literature review is to focus on the econometric methods used and the main results obtained. Several major studies are discussed, each using different approaches to analyze the effects of industrial agglomerations. The summary table presenting academic studies on the impact of business agglomeration on investment, industrial growth and exports in developing countries, with a focus on the econometric approaches used and the results obtained:
- Existing approaches and methods and definition of the methodological approach for the Gabon case study
- Summary of studies on the effects of corporate agglomeration
Table 1, Table 2 and Table 3 summarize the main academic studies and their econometric approach, while highlighting the key results relating to the impact of business agglomeration on developing countries.
- 2.
- Studies on the impact of foreign direct investment (FDI) on enterprise agglomeration, industrial growth and exports in developing countries.
They have explored several dimensions of FDI and its effect on the economy. This phenomenon is often studied from the angle of productivity gains, infrastructure improvements, technology diffusion effects, and increased competitiveness on international markets.
Here is a summary table:

Table 4.
Studies on the impact of foreign direct investment (FDI).
| Aspect | Econometric methods used | Results | Examples |
|---|---|---|---|
| 1. Industrial growth | - Panel regression models (Fixed and Random Effects) - Granger cointegration and causality models | FDI has a positive effect on industrial growth, particularly in countries that attract quality FDI (advanced technologies, managerial know-how). | - Borensztein et al (1998) show that FDI has a positive impact on growth in developed countries, amplified by a high level of education. |
| 2. Company cluster | - Spatial Econometrics - Difference-in-difference (DID) methods | FDI favors the geographic concentration of companies, creating industrial clusters that improve efficiency and competitiveness. | - Javorcik (2004) shows that FDI in manufacturing favors agglomeration and leads to greater competitiveness and higher exports. |
| 3. Impact on exports | - Propensity Score Matching (PSM) models - Panel regression models | FDI improves local companies' access to world markets, boosting exports in sectors such as electronics and textiles. | - Blomström and Kokko (1998) show that FDI stimulates exports, particularly in export-oriented sectors (electronics, automobiles, textiles). |
- 3.
- Reference decision-support tools for monitoring, evaluation and strategic planning of SEZs in developing countries:
Here is a summary table of decision-support tools for monitoring, evaluation and strategic planning of SEZs in developing countries:
Table 5.
Reference decision-support tools for monitoring and evaluation.
| Decision Support Tool | Method | Example |
|---|---|---|
| SEZ profitability assessment models | Discounted cash flow (DCF) method to assess the profitability of SEZs. | UNIDO model for quantifying the economic, social and environmental benefits of SEZs. |
| Geographic information systems (GIS) | Collection and analysis of spatial data to optimize location and resource allocation. | Case studies in Africa and Asia to determine suitable areas for setting up SEZs (Kuroda et al., 2012). |
| Performance dashboards (BSC) | Ongoing monitoring of performance indicators (jobs, exports, quality of business environment). | Application of BSC in Bangladesh and Nigeria to improve strategic management of SEZs. |
| Cost-benefit analysis (CBA) models | Calculation of infrastructure costs and tax incentives, compared with profits generated. | Applying CBA in sub-Saharan Africa to compare costs and employment impacts (Hinkle et al., 2011). |
| Simulations and modeling of economic impacts | Computable general equilibrium (CGE) models to simulate the economic effects of SEZs. | CGE model used to study the impacts of SEZs in Asia and Africa (Lall et al., 2004). |
| SWOT analysis | Identification of strengths, weaknesses, opportunities and threats affecting SEZs. | Using SWOT analysis to assess SEZs in Africa, focusing on governance and infrastructure (Farole & Akinci, 2011). |
Table 6.
Strategic planning methods for SEZs.
| Method | Description | Example |
|---|---|---|
| Participatory approach | Involve all stakeholders (government, business, local community) in the planning process. | Study on SEZs in India, highlighting the importance of participation in ensuring effectiveness (Sharma et al., 2015). |
| Long-term planning and dynamic management | Flexible strategies and periodic adjustments in response to economic and technological developments. | World Bank guidance for African SEZs, with periodic adjustments (World Bank, 2011). |
This table summarizes the tools and methods for effective, strategic SEZ management, enabling developing country governments to maximize benefits while minimizing risks.
This study has three main objectives:
- To analyze the impact of company agglomeration on FDI, public investment, export revenues and industrial revenues in two distinct geographical areas of Gabon: the Nkok Special Economic Zone (SEZ) (homogeneous area) and areas outside this SEZ (heterogeneous area). The aim is to divide the forestry sector into two zones in order to highlight socio-economic and geographical disparities. The econometric approach uses the robust ordinary least squares (OLS) method to correct for estimation bias and problems of autocorrelation and normality of residuals, given the small temporal size of the sample (T=12).
- To study the impact of FDI and public investment on business agglomeration, export revenues and industrial income in these two geographical areas. The aim is similar to that of the first, to highlight the socio-economic and geographical differences between the Nkok SEZ and other areas of the country.
- Propose a governance model for unbalanced regional growth, focusing on endogenous growth, multinational FDI and public-private initiative. This model is based on the idea that unbalanced regional growth, associated with SEZs and development poles, can stimulate accelerated regional development, provided certain conditions are met. It aims to provide a decision-support tool for strategic planning of regional development policies, in particular the use of SEZs as levers for industrialization and sustainable development, thus strengthening the resilience and monitoring of development poles in developing countries.
II. Data sources
The software used to produce the estimates and descriptive statistics was Stata 18. For this study, four (4) macroeconomic variables were selected to establish the industrial balance sheet (Table 7). The variables are described as follows :
The data series used for the homogeneous zone (In Free Zone) were obtained from secondary documentary sources from the Gabonese Ministry of the Economy (Dashboard of the Gabonese economy of 2014 à 2022). The dashboards contain annual statistics on the economic performance of the timber industry in general and the Nkok Special Economic Zone (In Free Zone) in particular. The data series used for the "Macroenvironment" section were obtained from the FAOSTAT database, which contains aggregate macroeconomic variables for forestry sectors in countries around the world, and in Gabon in particular.
- Modeling agglomeration effects
To model agglomeration effects, three variables have been selected. The dependent variable (representing the agglomeration variable) is determined by the number of companies in the SEZ and outside the SEZ. The Exp_TUSD and Ind_P_TUSD variables represent timber export revenues and industrial revenues respectively. These two variables respectively measure export growth and industrial growth, which are indicators of accelerated regional growth and industrial and commercial development. The model used to measure agglomeration effects is a non-parametric time series model, based on the ordinary least squares (OLS) method, which is robust to the relatively small temporal sample size (T=12).
- Modeling the dynamic and static spatial effects of FDI associated with public investment
In this part of the study, the estimation method used is an innovative panel data method with correction for estimation biases linked to the weak time dimension. The model also uses a non-parametric (robust) method for estimation. Data for the heterogeneous space (Out SEZ of Nkok) were obtained by subtracting the data for the space (In SEZ of Nkok) from those for the "Macroenvironment" space. Econometric panel modelling with N = 2 and T = 9 was carried out for the homogeneous and heterogeneous areas. For the "Macroenvironment" area, panel modeling with N =3 and T=9 was carried out, combining the three (3) types of geographical areas.
The study enables us to produce three models in three types of geographical areas:
- The first model allows static and dynamic panel estimations with N =2 and T=9. The results of these estimations allow us to study the effects of the "In SEZ of Nkok" space on the "Macroenvironment" space;
- The second model allows static and dynamic panel estimations with N =2 and T=9. The results of these estimations allow us to study the effects of the "Out SEZ of Nkok" space on the "Macroenvironment" space;
- The third model allows static and dynamic panel estimations with N =3 and T=9. The results of these estimations enable us to study the simultaneous effects of the "In Free Zone" and "Out Free Zones" on the "Macroenvironment" space.
II.2 Deterministic macroeconomic functions
Based on the main aggregates used in this study, a balance of deterministic equations can be drawn up in order to understand stochastic models and draw up a forestry and industrial balance sheet.
- Total industrial income in value terms is obtained by subtracting total income from non-industrial income. This means :
Equation (2) yields the total industrial revenue in value (million USD) corresponding to the first variable of interest for the stochastic model.
Equations (3) (4) (5) yield export revenues in value (million USD) for homogeneous and heterogeneous spaces for stochastic models. We obtain:
Equations (6) (7) (8) yield industrial revenues by value (million USD) for homogeneous and heterogeneous spaces for stochastic models. We obtain:
Equations (9) (10) (11) give the number of companies for homogeneous and heterogeneous spaces for the stochastic model. We obtain :
Equations 12 and 13 illustrate the "OLS (Robust)" method.
III. Estimation using the "OLS (Robust)" method
- Basic OLS regression model
OLS models are used to model the internal imbalances (internal disparities) of homogeneous and heterogeneous spaces (equations 12 and 13) during the process of polarization of the Gabonese forestry sector over the period 2011-2022, using a non-parametric estimation method ("OLS (Robust)") with T=12.
Ordinary least squares (OLS) models can be written in the following form:
Where:
- Y = (Investissement ,Direct , Étranger + Investissement , Public , Total (FDI + PITUSD. )
- Y(t) = The dependent variable
- X1 and X′1 = The sum total of industrial revenues in the forestry sector (Ind_P_TUSD).
- X2 and X′2 = Receipts from exports of forest products from Gabon (Exp_TUSD
- X3 and X′3 = Nomber of Companies in the forestry sector
- βi and β′i = Regression coefficients of independent variables
- β0 and β′0 = Original orders
The vector of coefficients is estimated using the ordinary least squares (OLS) method:
Where:
- X is the matrix of observations of the explanatory variables;
- Y is the vector of observations of the dependent variable;
- X′ is the transposed X matrix.
- Correction for heteroscedasticity and autocorrelation (HAC)
In a time series, errors can be autocorrelated and heteroscedastic. A robust estimation of the OLS model can be obtained by fitting the variance-covariance matrix of the errors using the Newey-West correction:
- is a robust estimate of the variance-covariance matrix of the estimated coefficients
- Where is the estimated residual
This correction enables us to obtain robust standard errors, adapted to the problems of heteroscedasticity and autocorrelation.
IV. Bias-Corrected Estimation Of Linear Dynamic Panel Data Models
The "Bias-corrected estimation of linear dynamic panel data models" method is a recent approach developed to correct the estimation bias introduced by Nickell (1981) [23]. It is a bias-corrected (BC) estimator, based on the method of moments, and developed by Breitung, Kripfganz and Hayakawa (2022) [24]. This approach is applied to linear dynamic panel data models with unobserved group-specific effects, assuming that all independent variables are strictly exogenous with respect to the idiosyncratic error. In its Fixed Effects (FE) version, this estimator is equivalent to the adjusted profile likelihood estimator proposed by Dhaene and Jochmans (2016) [25], and is particularly useful for models including a single lag of the dependent variable, using the bias-corrected iterative estimator of Bun and Carree (2005) [26].
Traditional Fixed Effects (FE) and Random Effects (RE) estimators for panel data models with a lagged dependent variable are often biased, especially when the time dimension (T) is small, as shown by Nickell (1981) [23]. Generalized method of moments (GMM) estimators (Kripfganz, 2016, 2019) [27,28] offer a flexible solution for dealing with predetermined or endogenous repressors through the use of suitable instrumental variables. The Bias-Corrected Estimator (BC) proposed by Breitung, Kripfganz and Hayakawa (2022) [24] features finite-sample properties, making it possible to correct estimation biases associated with a small size of the model's time dimension. This estimator directly adjusts the moment conditions to correct biases at their origin, while retaining the low variance of traditional estimators such as Fixed Effects (FE) and Random Effects (RE) models.
The BC Estimator can also be used to estimate higher-order autoregressive models, and is based on the method of moments with a well-known asymptotic distribution, facilitating the calculation of standard errors. These errors can be adjusted to be robust to cross-sectional dependence. An error correction vector, "vcetype", is used in this approach, specifying the type of standard error reported, including both errors based on conventional asymptotic theory and those robust to certain misspecifications. The robust version of the vector, denoted "vce(robust)", is particularly suitable for non-parametric estimates and small sample sizes (N).
IV1. General form of the dynamic linear panel data model
The general form of the "Bias-Corrected Estimation of linear dynamic panel data models" is as follows:
The basic model assumptions are as follows:
- The minimum individual and temporal dimensions are N=2 and T=2, which can be extended to infinity.
i = 1,2,...,N, t = 1,2,...,T
- The autoregressive (higher-order) model with lags P of the dependent variable and only minimal regularity conditions on the initial observations;
- The strictly exogenous repressors x itwith respect to the idiosyncratic error term are:
E [xit u is] = 0 for all t and s;
- For specific fixed and random effects on unobserved groups,
- Uncorrelated idiosyncratic errors in series are as follows:
Results
- Descriptive statistics
1.1. Description of variables in homogeneous space
The graph (Figure 1) shows the logarithmic evolution of several economic indicators over time, from 2011 to 2022. Here is a description of the various curves and the variables they represent:
-
Number of companies (blue curve):
- ○
- This curve shows the evolution of the number of companies in the forestry sector. It shows a significant increase from 2015 onwards, reaching strong growth after this year. The number of companies remains stable before 2015 and rises sharply in subsequent years.
-
Foreign Direct Investment associated with public investment in Logarithm (LogFDI_PI_TUSD - Red curve):
- ○
- This curve shows the trend in foreign direct investment (FDI) in logarithmic form. It shows a slight upward trend, with a moderate increase between 2010 and 2020. However, the curve is not rising as fast as the number of companies, suggesting that foreign investment is growing at a slower pace.
-
Logarithmic exports (LogExp_TUSD - Green curve) :
- ○
- This curve shows the development of exports in logarithmic form. It follows a general upward trend, indicating strong export growth from 2015 onwards, with a particularly marked peak around 2020. This probably reflects the growth of industrial production in the Nkok SEZ and its impact on exports.
-
Log Industrial Income (LogInd_P_TUSD -Yellow curve):
- ○
- The yellow curve shows the trend in industrial revenues, also in logarithmic form. It shows a very sharp increase, especially from 2015 onwards, reflecting the effect of the "Big Push" on industrial production in the Nkok SEZ. This curve has the steepest slope, indicating a high rate of growth in industrial revenues over the years.
In summary, we see strong growth in the various economic indicators (number of companies, exports and industrial revenues) from 2015 onwards, with a particular peak for industrial revenues (LogInd_P_TUSD) and exports (LogExp_TUSD). Foreign investments (LogFDI_PI_TUSD) show more moderate growth in comparison.
1.2. Description of variables in heterogeneous space
The graph above (Figure 2) shows the evolution of several economic indicators in logarithmic form from 2010 to 2025. Here is a description of the various curves :
-
Foreign direct investment associated with public investment (LogFDI_PI_TUSD: Blue curve):
- ○
- This curve shows the evolution of foreign direct investment (FDI). It shows little variation over the years, remaining stable at a relatively low level. The increase is minimal, and there is no significant change in this curve until 2025, indicating little dynamism in foreign investment over the period studied.
-
Number of companies (red curve):
- ○
- The red curve shows the number of companies. Although this curve shows a slight upward trend, it remains stable overall, with few fluctuations. The number of companies does not seem to have increased significantly over this period, which contrasts with the more marked evolution of other indicators.
-
LogExp_TUSD (Green curve) :
- ○
- The green curve shows exports in logarithmic form. It shows a moderate upward trend, but more pronounced than that of foreign investment and the number of companies. There is a visible increase in exports from 2015 onwards, indicating a gradual growth in export activity.
-
LogInd_P_TUSD (Yellow curve):
- ○
- The yellow curve represents industrial revenues. This curve shows steady and relatively rapid growth from 2015 onwards. It follows an almost linear upward trend, reaching higher values compared to the other curves, reflecting a strong increase in industrial revenues over the years.
Overall descriptive analysis:
The curves show more marked growth in exports (LogExp_TUSD) and industrial revenues (LogInd_P_TUSD) than in foreign direct investment (LogFDI_PI_TUSD) and the number of companies. The green and yellow curves (exports and industrial revenues) show an increasing trend, while the blue curve (foreign investment) and the red one (number of companies) indicate relative stability with small variations. This suggests continued improvement in certain sectors such as industrial production and exports, but a lack of dynamism in foreign investment and new business creation.
I. Growth dynamics of the number of businesses by space:
Since the creation of the Nkok Special Economic Zone (SEZ) in Gabon, the number of companies operating in the forestry sector has increased considerably, both in the homogeneous area (inside the SEZ) and in the heterogeneous area (outside the SEZ).
Figure 3.
Growth in the number of companies by area.
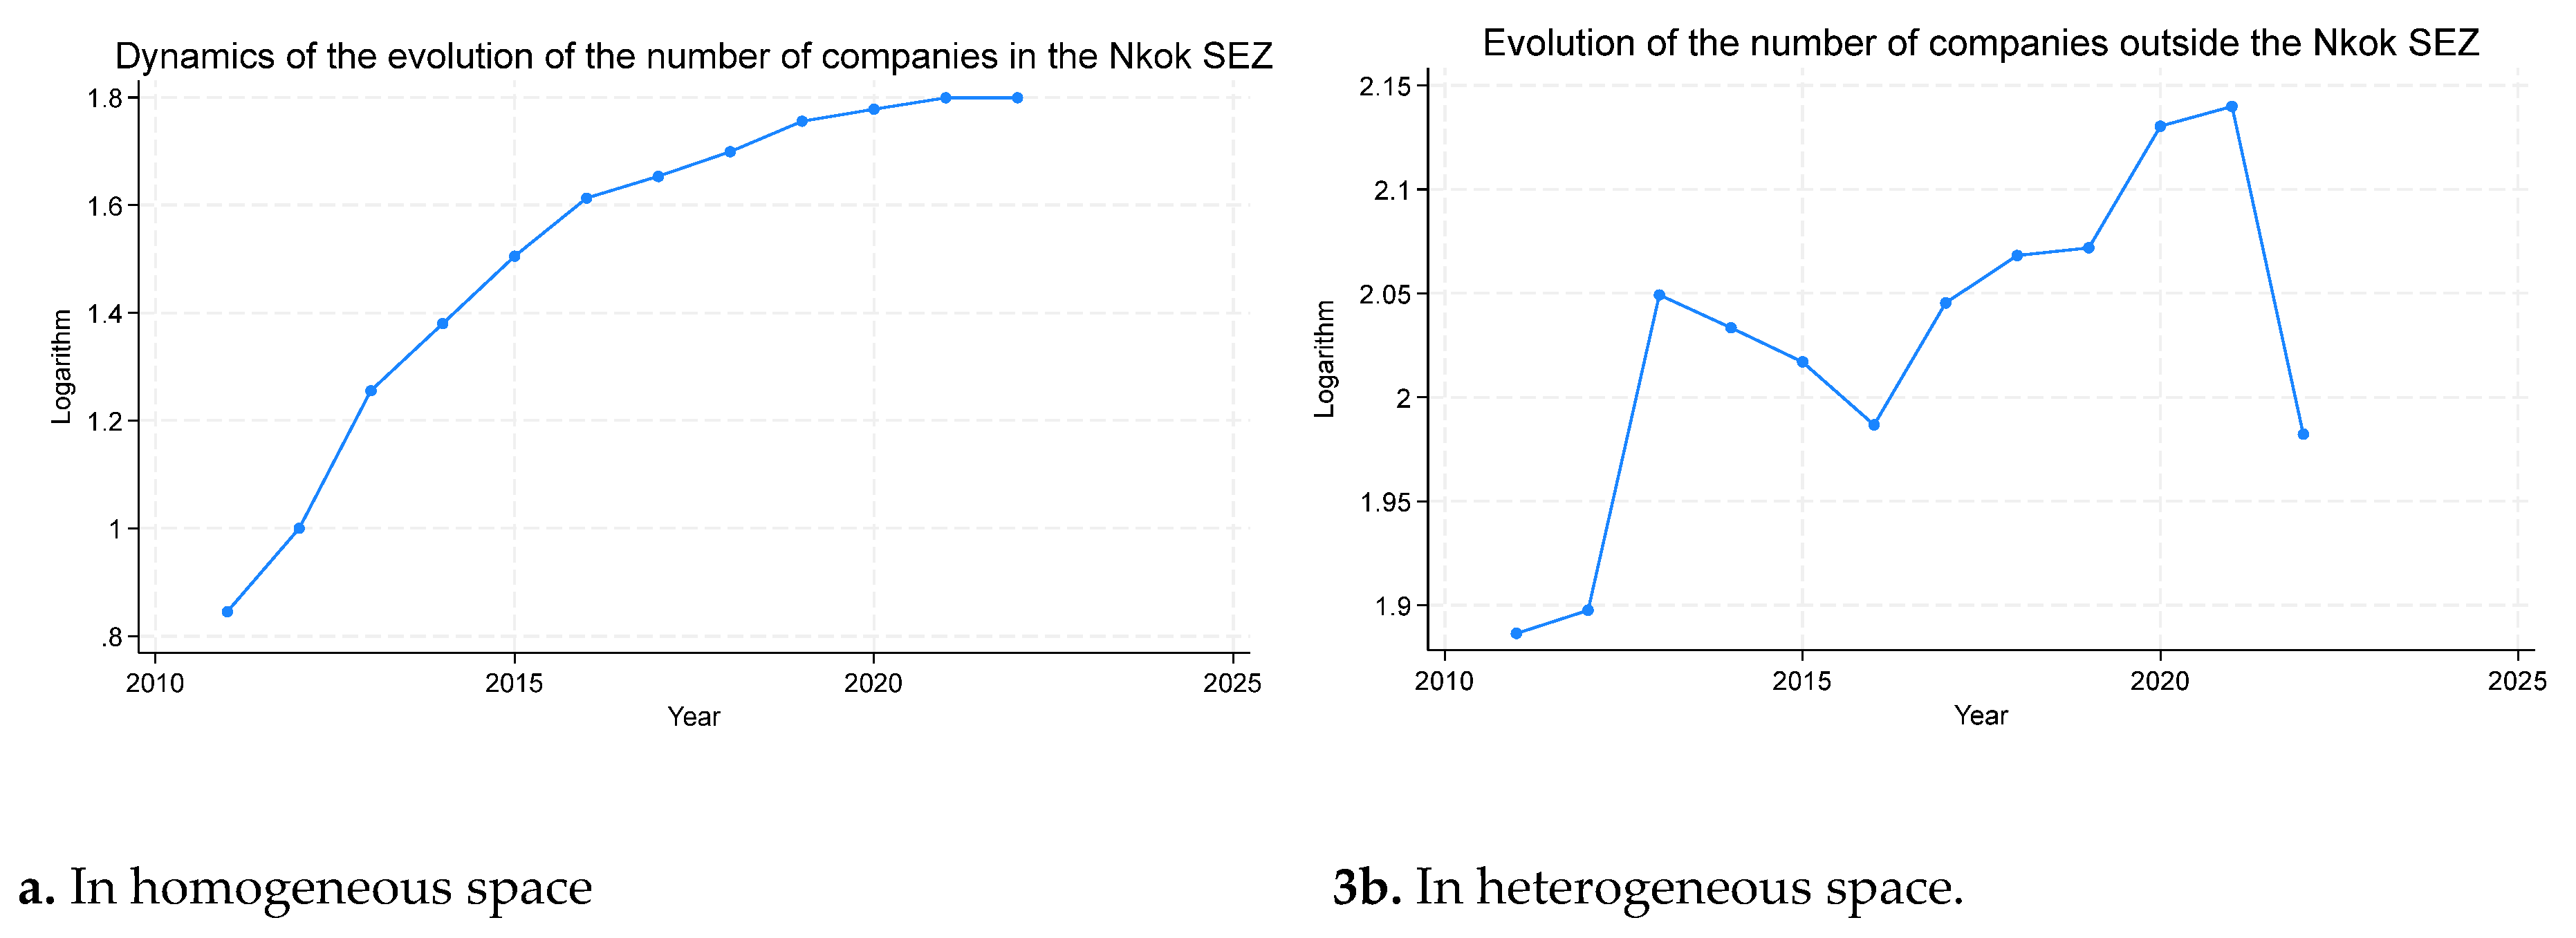
I.1 Growth in the number of companies in the homogeneous area (Nkok SEZ)
In 2011, the Nkok SEZ counted 7 companies in the forestry sector. Since then, the number of companies in this area has increased considerably, rising from 7 to 63 between 2011 and 2022, an average growth of around 6 companies per year. This evolution shows a high concentration of companies in a limited space, characteristic of polarization theory (Hirschman, 1958; Perroux, 1955) [29,30], where industrial dynamism is accelerating thanks to strategic investments and well-developed infrastructures. Growth is continuous, without interruption, until 2022, demonstrating the efficiency of the integrated development model within the SEZ.
I.2 Growth in the number of companies in the heterogeneous area (outside the Nkok SEZ)
Outside the SEZ, business growth is slower and more irregular. In 2011, there were 77 companies, and between 2011 and 2022, this number rose from 79 to 96, with an average increase of around 2 companies per year. Although the initial period saw strong growth, this was followed by a decline, reaching a peak of 138 companies in 2021, before falling back. This uneven dynamic reflects differences in infrastructure, access to resources and institutional support compared to the SEZ, illustrating the limited impact of development efforts in outlying areas, despite some initial dynamism.
II. Dynamics of foreign direct investment (FDI) associated with public investment
Investments in the Nkok SEZ between 2010 and 2022 show a general downward trend, peaking in 2018 at USD 116.62 million, before falling back to USD 48.7 million in 2022. These investments have mainly financed the zone's infrastructure and administration, promoting industrialization and exports. The low level of public initiatives and declining collaboration in public-private partnerships (PPPs) explain this trend.
Figure 4.
Trends in foreign direct investment + public investment in Gabon's forestry sector from 2010 to 2022. Funds from a public-private partnership between a multinational and the Gabonese government.
Figure 4.
Trends in foreign direct investment + public investment in Gabon's forestry sector from 2010 to 2022. Funds from a public-private partnership between a multinational and the Gabonese government.
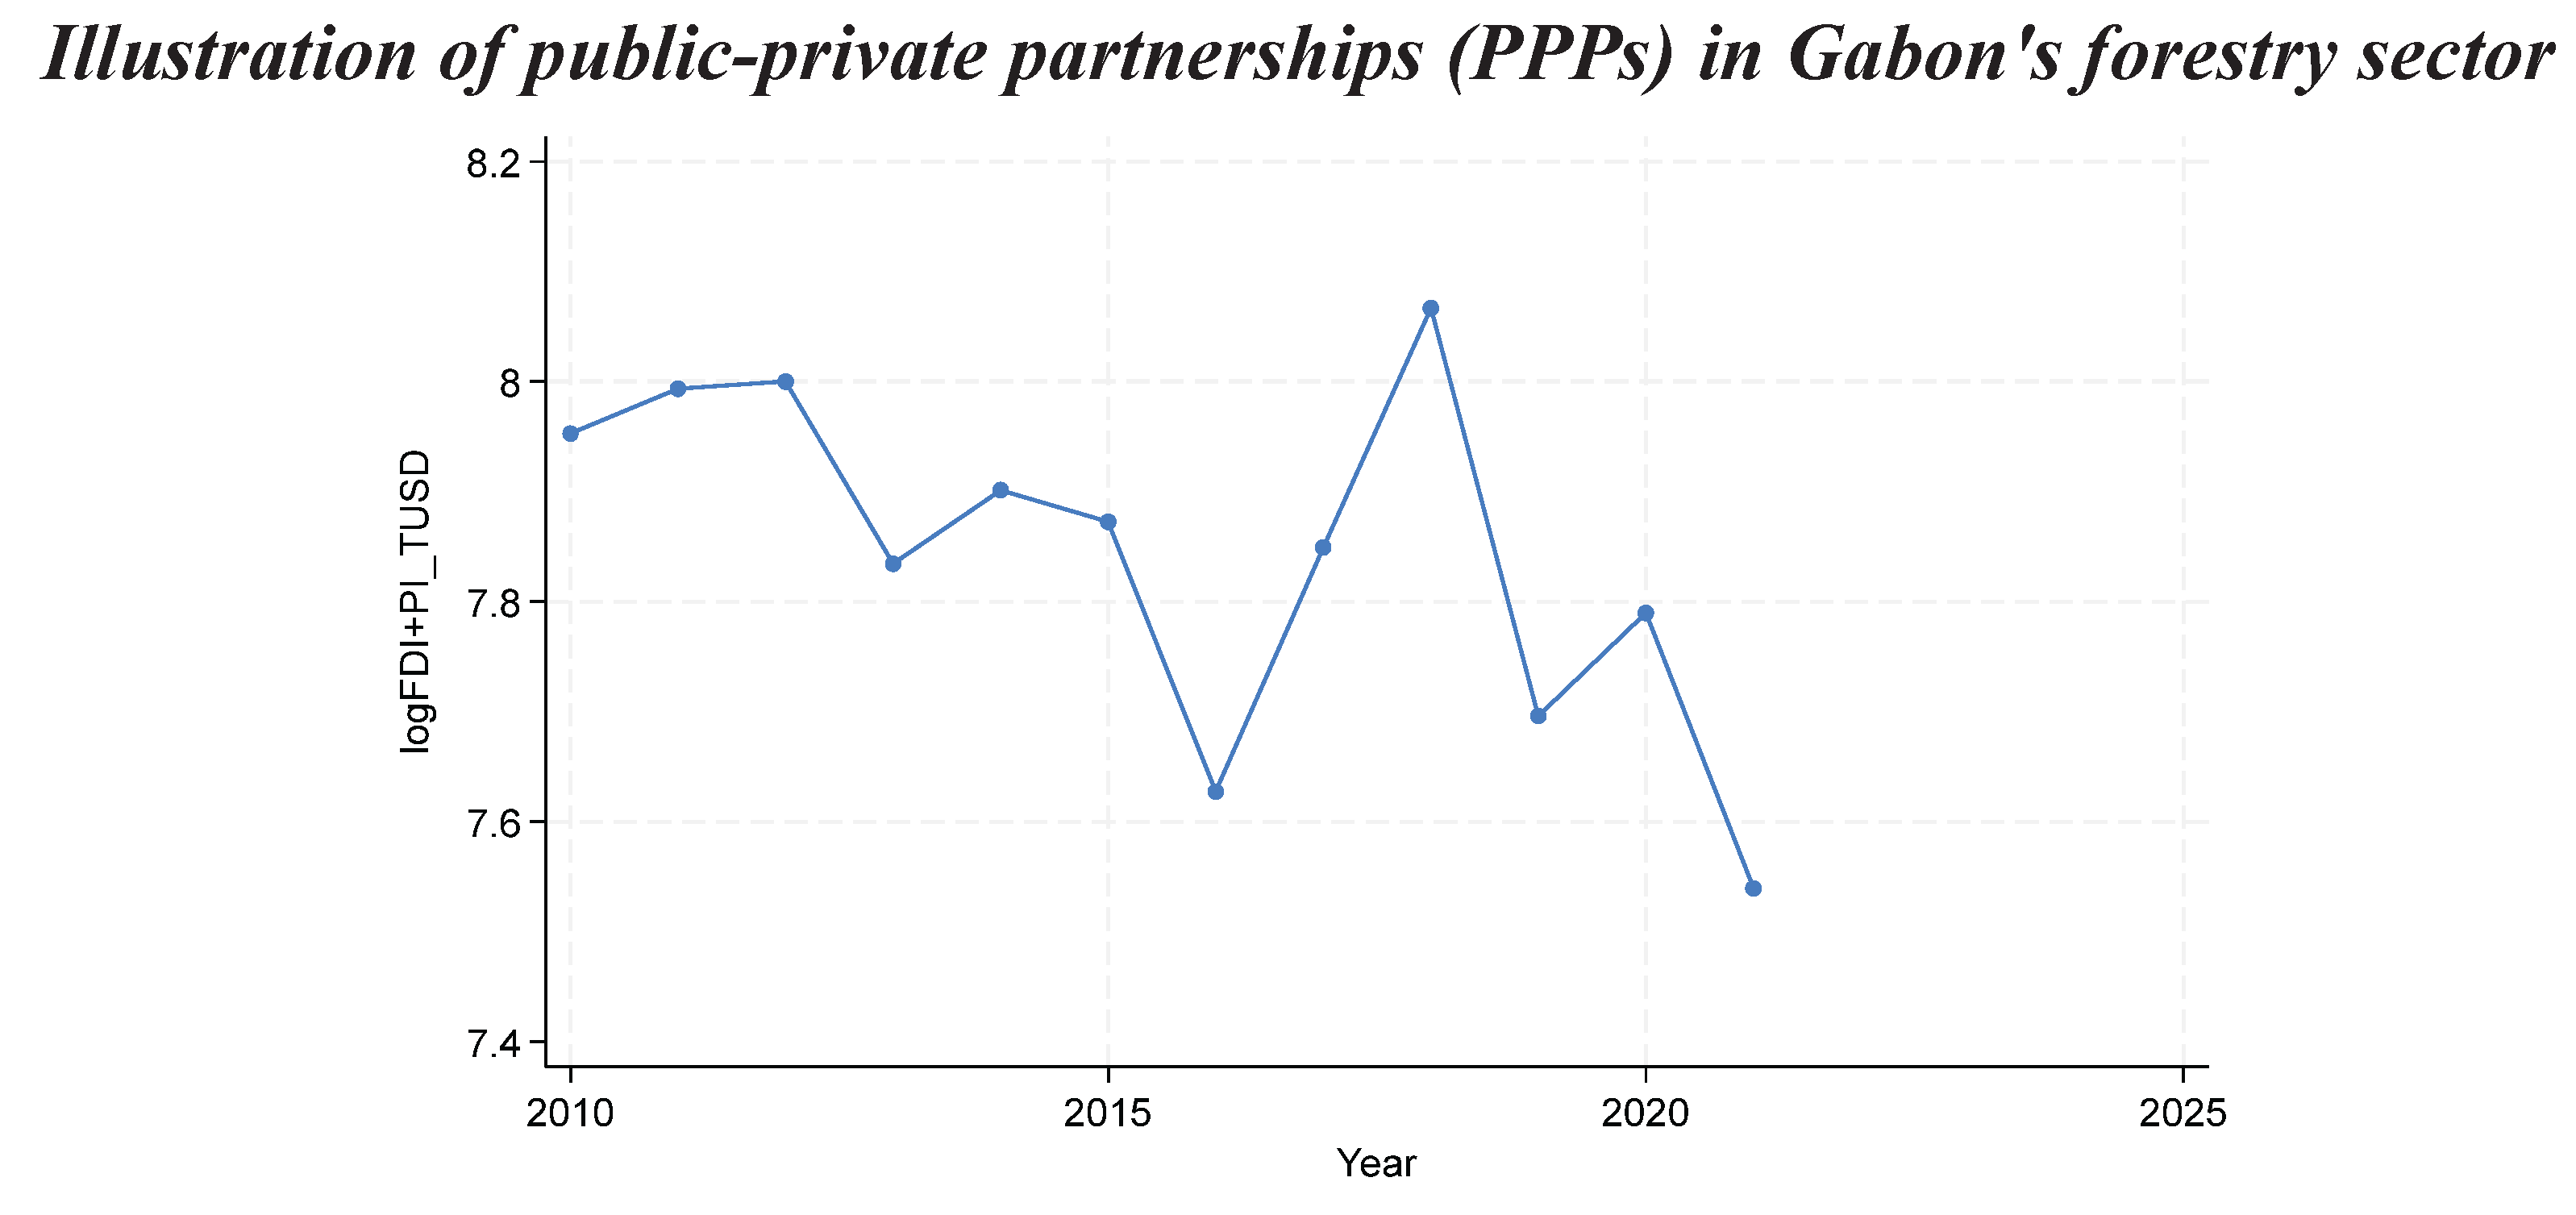
II.1 Investments in the homogeneous area (Nkok SEZ)
Investment in the SEZ enabled rapid infrastructure development, reinforcing its role as a major player in the polarization process. Investment, although fluctuating, created a framework conducive to sustained growth in industrialization and exports, reinforcing Rosenstein-Rodan's (1943) "Big Push" model [31]. The impact was particularly marked in the homogeneous space where investment was concentrated.
II.2 Investments in the heterogeneous area (outside the Nkok SEZ)
In peripheral areas, investment has been less sustained and less visible. The lack of strategic infrastructure and the weakness of PPPs have limited economic leverage in these areas. The lack of significant investment has slowed the revitalization of these areas, despite their important contribution to natural resources and industrial production.
III. Trends in export revenues and forest products
Between 2014 and 2022, exports of forest products (in m³) have grown spectacularly in the homogeneous SEZ area, almost one hundredfold, accompanied by a sharp increase in industrial production.
Figure 5.
Evolution of export revenues and forest products.
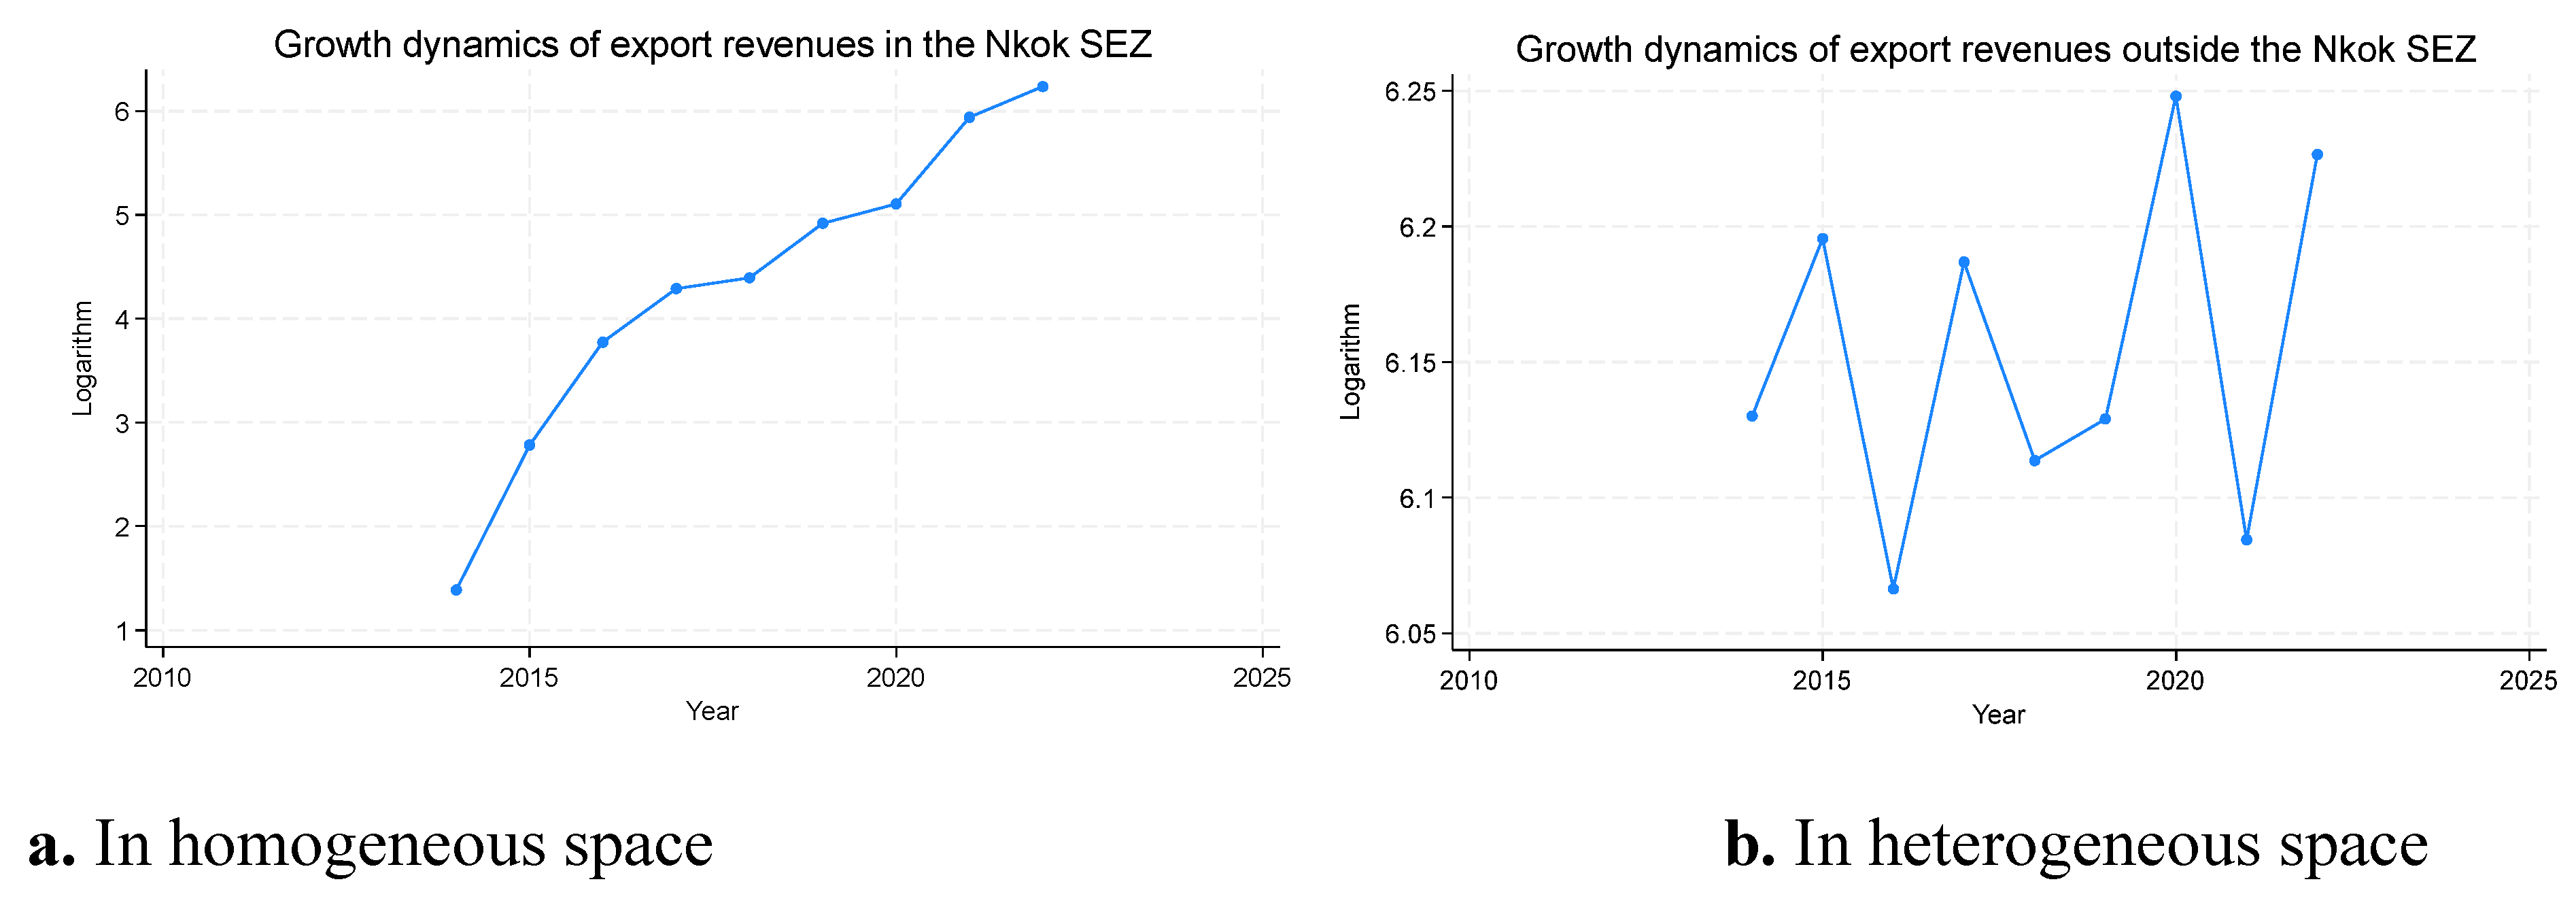
III.1 Evolution of export revenues in the homogeneous area (Nkok SEZ)
Exports of forest products in the homogeneous area have risen steadily, mainly thanks to the concentration of industrial capacity and a strong export orientation. The homogeneous area has thus seen a spectacular increase in export revenues, reinforcing its dominant position on the international market.
III.2 Evolution of export revenues in the heterogeneous area (outside the Nkok SEZ)
Outside the SEZ, export growth has been less marked and irregular. Although this area contributes significantly to the production of raw materials, its ability to diversify and increase exports is limited by a lack of infrastructure and government support. Export earnings in this area have been unstable, fluctuating according to economic fluctuations and available resources.
IV. Growth dynamics of industrial forestry revenues in polarized areas
Between 2014 and 2022, industrial production in the homogeneous space grew exponentially, reaching 608,000 m³ in 2022, compared to just 6,798,346 m³ in 2014. In contrast, growth in the heterogeneous space has been less impressive, with lower and more volatile revenues and production.
Figure 6.
Growth in industrial forestry revenues in polarized areas.
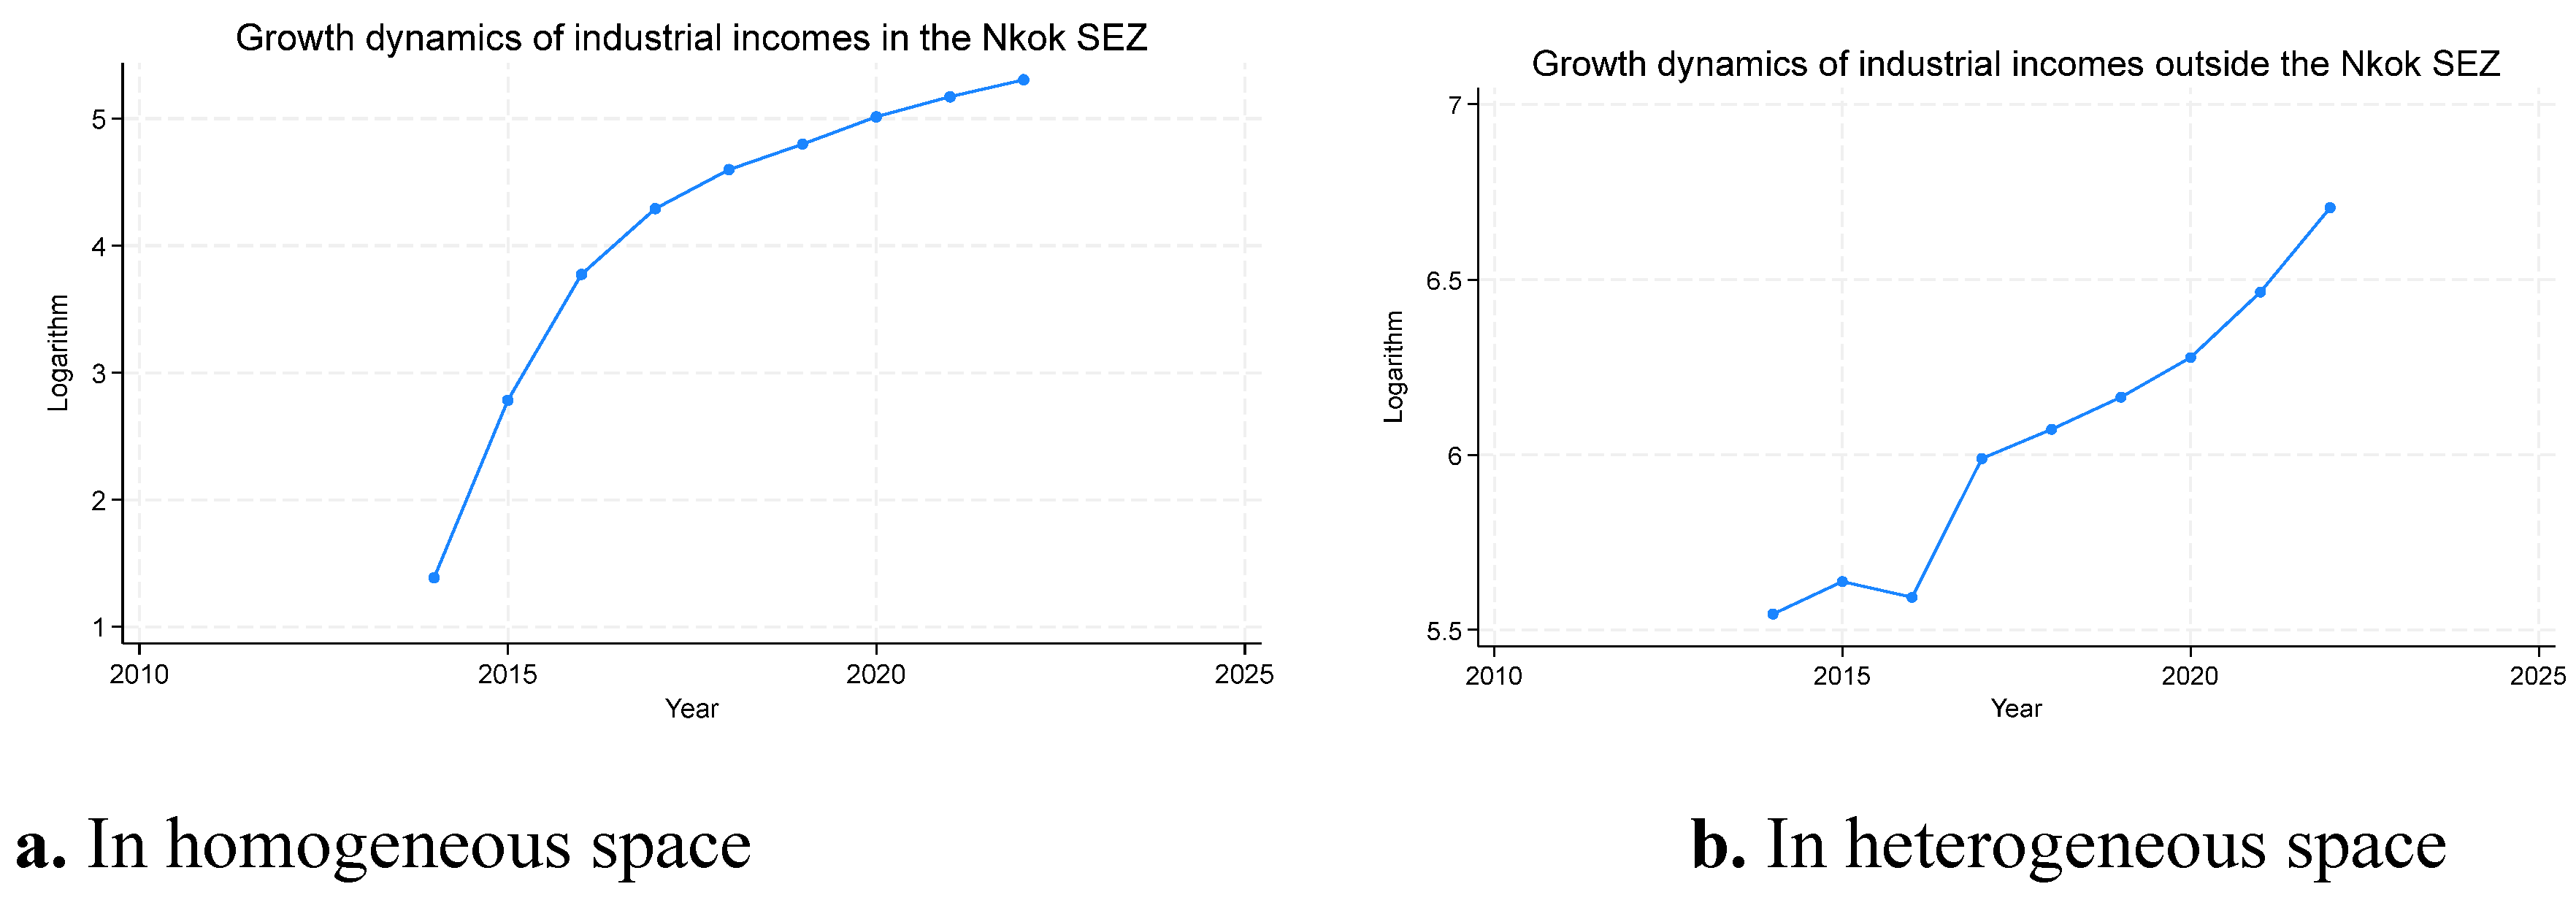
IV.1 Growth in industrial forestry revenues in the homogeneous area
In this area, industrial growth has been boosted by strategic investment and a concentration of appropriate infrastructure. Production has increased almost a hundredfold, reflecting a positive dynamic fuelled by the optimization of resources and policies to support exports.
IV.1 Growth in industrial forestry revenues in heterogeneous areas
The heterogeneous area, on the other hand, suffers from low investment and insufficient infrastructure. Although this area is the main supplier of natural resources (timber, etc.), it has not experienced the same rate of industrial growth. The lack of integration between the peripheral zones and the SEZ limits the effects of polarization and slows down development in this part of the country.
Partial conclusion:
Analysis of growth dynamics in the homogeneous (Nkok SEZ) and heterogeneous (outside the SEZ) zones reveals marked disparities. The homogeneous zone benefits from more favorable conditions for industrialization, with targeted investments, strong industrial growth and sustained exports. By contrast, the heterogeneous area is experiencing slower, less stable growth, hampered by structural limitations and a lack of targeted investment. These disparities clearly illustrate economic polarization and the effects of asymmetrical development, where areas close to the SEZ benefit more from agglomeration dynamics, while peripheral areas struggle to develop independently.
Static effects of spatial agglomeration on income and investment
Interpretation of the results presented in the Table 8 requires analysis of the coefficients, statistical significance and comparison between the two zones studied, i.e. inside (In Nkok SEZ) and outside (Out Nkok SEZ) the Nkok Special Economic Zone (ZES).
V.1 Agglomeration effects in homogeneous space (within the Nkok SEZ)
The value of R 2 (0.999) is very high, meaning that the model explains almost all the variance in the number of companies in this homogeneous space. This suggests that the independent variables (Exports and Industrial Income) explain almost all the variation in the number of companies in Nkok SEZ.
V.1.1. Agglomeration effects on export and forest product revenues
The coefficient of 0.410* is statistically significant (with a p-value < 0.001), suggesting that export income has a strong and significant positive impact on the number of companies in the homogeneous Nkok SEZ. This relationship indicates that, in this homogeneous space, an increase in export income is associated with an increase in the number of businesses, which could reflect an environment conducive to business development linked to export growth.
V.1.2. Agglomeration effects on industrial revenues from forest products
The coefficient of 0.730* is also highly significant (p-value < 0.001), meaning that industrial income has a very strong impact on the number of companies. This suggests that in this homogeneous space, industrial growth has a greater influence on the number of companies than exports. This could indicate that the local industrial base is a major driver of business creation in this area.
The constant (1.016*) is statistically significant with a low p-value (p < 0.005), showing that there is a basic number of companies even without the direct impact of the explanatory variables. This constant can be interpreted as the number of initial companies in the homogeneous space before taking into account the effects of exports and industrial income.
V.2 Agglomeration effects in heterogeneous space (outside the Nkok SEZ)
The value of R 2(0.986) remains high, indicating that the model still explains the variance in the number of companies well, but less perfectly than in the homogeneous space. This suggests that there is more variability in the heterogeneous space, and that other variables not taken into account in this model may play a more important role.
V.2.1. Agglomeration effects on export and forest product revenues
The coefficient of 0.132* is statistically significant (p < 0.062), but much weaker than in the homogeneous space. This indicates that, although exports still have a positive effect on the number of companies, this effect is weaker in the heterogeneous space. It is possible that other factors (e.g. infrastructure, local policies) have a greater influence on the number of companies in the heterogeneous area than exports alone.
V.2.2. Agglomeration effects on industrial revenues from forest products
The coefficient of 0.157* is significant at the p < 0.010 level, but it is also much weaker than in the homogeneous space. This suggests that in this heterogeneous space, the impact of industrial income on the number of firms is less significant than in the homogeneous space, which may reflect a greater diversity of factors influencing firm growth in this space.
The constant (0.440) is not statistically significant (p = 0.407), suggesting that in the heterogeneous space, the basic number of companies, without taking into account the effects of exports or industrial income, is not significantly different from zero. This could indicate that the heterogeneous space is less stable and that the number of companies is more influenced by external and contextual factors.
Partial conclusion:
In the homogeneous area, exports and industrial income play a major role in business creation, with very significant impacts. In contrast, in the heterogeneous area, the impact of these variables is less marked, suggesting that other factors, possibly contextual or external, have a greater influence on the number of businesses. This could reflect distinct economic development dynamics between the two types of area.
VI. Spatial dynamic and static effects of foreign direct investment (FDI) associated with public investment
The results above (Table 9) concern the impact of foreign direct investment (FDI) associated with public investment (LogFDI_PIUSD on the number of companies in the specific areas of the Nkok SEZ, outside the SEZ, and in the overall macroeconomic environment. It is also interesting to note that the analysis looks at the autocorrelation of past investments (L. LogFDI_PI_TUSD) and other variables such as exports (LogExp_TUSD) and industrial revenues (LogInd_P_TUSD).
The hypothesis of the Arellano-Bond test for autocorrelation of residuals in first difference at first and second order is: "H0: no autocorrelation of order 1 or 2". The p. values are inside the brackets and the Z-statistics are outside the brackets.
VI.1 Model (1): Effect of homogeneous space (Nkok SEZ) on the macro-environment
VI.1.1. Dynamic autoregressive effect of FDI associated with public investment
The coefficient 0.093*** is positive and significant, meaning that an increase in past foreign direct investment (FDI) in the Nkok SEZ has a positive effect on future investment. In other words, FDI in the previous year increases investment in the following year in this area, indicating that FDI in the SEZ has a positive leverage effect and a certain stability in financial flows. This could explain the downward trend in investment after 2018: although past FDI had a positive effect, its decline in subsequent years led to a decrease in investment in the Nkok SEZ.
VI.1.2. Static effect of FDI associated with public investment on the number of enterprises
The coefficient 2.350* is positive and highly significant, suggesting that an increase in the number of companies in the SEZ leads to a significant increase in the effect of the SEZ on investment in the macroenvironment. This could mean that an entrepreneurial environment, with a high concentration of businesses, attracts more investment, particularly in a structured setting like the Nkok SEZ.
VI.1.3. Static effect of FDI associated with public investment on export earnings
The coefficient -0.114 is negative, but not significant, indicating a drop in FDI associated with public investment. This could indicate that export revenues from the Nkok SEZ are not sufficient to attract FDI globally in the macro-environment. And with FDI declining overall, there is a real need to encourage multinational firms to invest and find alternative mechanisms to attract more FDI. Public investment should increase in proportion to the tax and customs revenues collected, and PPPs need to be strengthened.
VI.1.4 Static effect of FDI associated with public investment on industrial income
The coefficient -0.243* is significant and negative, indicating that the increase in industrial revenues in the Nkok SEZ has a negative effect on future investments in the macro-environment. This could suggest a "saturation" or concentration effect dynamic, where growth in industrial revenues in the Nkok SEZ does not directly lead to more investment in Gabon's overall forestry sector environment, but rather to a stabilization of capital in the zone. The most likely reason for this is that the industrial matrix of the Nkok SEZ is dominated by multinational firms, and there could be significant capital flight. A rent effect is to be feared in the long term. Public policies should pay particular attention to long-term investment, encouraging multinational firms to invest in infrastructure development projects, industrial expansions and support for local SMEs via CSR projects within and outside the Nkok SEZ.
VI.2 Model (2): Effects of heterogeneous space (outside the SEZ) on the macro-environment
VI.2.1 Dynamic autoregressive effect of FDI combined with public investment
The coefficient -0.276* is negative and significant, indicating that FDI associated with past public investment in the area outside the SEZ has an inverse effect in relation to the SEZ itself. This means that increased foreign investment in the previous year has a negative influence on investment in the following year in this space and, more broadly, in the macroenvironment. This could reflect an imbalance in investment flows, where investment tends to be concentrated in the SEZ rather than in outlying areas.
VI.2.2. Static effect of FDI associated with public investment on the number of enterprises
The coefficient 1.106* is positive and significant, suggesting that an increase in the number of companies in outlying areas leads to growth in investment in the forestry sector as a whole. This could indicate that, although FDI is lower in these areas, internal company growth is still stimulating investment.
VI.2.3. Static effect of FDI associated with public investment on export earnings
The coefficient -0.115* is negative and significant, indicating that the increase in export revenues from the heterogeneous area has a negative effect on investment in the forestry sector as a whole (macroenvironment). This could suggest that exports from the heterogeneous area are not generating a dynamic of investment growth in peripheral areas and the forestry sector as a whole. And the heterogeneous area, in particular the peripheral zones, could be suffering from a lack of infrastructure or other limiting factors. The most likely reason would be that the industrial matrix outside the Nkok SEZ (particularly in the logging areas, which are peripheral zones) is dominated by multinational firms, and that there could also be significant capital outflows, as reported for the Nkok SEZ. And so a rent effect is also to be feared in the long term in these zones. Public policies should pay particular attention to long-term investment by encouraging multinational firms to invest in infrastructure development projects, industrial expansions and support for local SMEs via CSR projects outside the Nkok SEZ. A significant proportion of tax revenues should be used to finance development policies targeting local SMEs. Other alternative means of financing need to be deployed to mobilize more public-private investment.
VI.2.4. Static effect of FDI associated with public investment on industrial income
The coefficient -0.249* is negative and significant, suggesting that the increase in industrial revenues in peripheral areas is also having a negative impact on investment in the sector as a whole. This dynamic could reflect imbalances in the distribution of resources, with industry becoming more concentrated in the SEZ, leaving peripheral areas to grow more slowly. But as with export revenues, there is also confirmation of the rentier behavior of multinational firms operating in logging zones and other areas of the heterogeneous space. A rentier behavior not observed by local actors in charge of public policies. Industrial revenues from logging units and other multinational and local productive entities should have a significant and positive impact on FDI and public investment in order to have a positive and optimal impact on polarized growth. These results point to a low level of monitoring and evaluation, and an insufficient willingness or absence of effective strategies on the part of strategic stakeholders to maintain a stable or growing level of investment over the long term.
VI.3 Model (3): Macroenvironment effects (Global macroeconomic environment)
VI.3.1. Dynamic autoregressive effect of FDI associated with public investment
The coefficient -0.262* is negative and significant, indicating that, at the macroeconomic level, an increase in past FDI leads to a decrease in future investment. This could suggest a general tendency for investment to concentrate in specific areas (such as the Nkok SEZ), leaving other areas out of the investment loop.
VI.3.2. Static effect of FDI associated with public investment on the number of enterprises
The coefficient 1.576* is positive and significant, indicating that an increase in the number of companies in the overall environment leads to an increase in investment. This probably reflects the polarization effect, where areas with a high number of companies attract more investment.
VI.3.3. Static effect of FDI associated with public investment on export earnings
The coefficient -0.045 is negative, but not significant, meaning that exports have no major impact on investment at the macro level. This could suggest that, although exports are increasing in some areas, this does not necessarily lead to a general increase in investment in the environment as a whole.
VI.3.4. Static effect of FDI associated with public investment on industrial income
The coefficient -0.244* is negative and significant, indicating that industrial revenues have a negative effect on investment in the overall environment. This could reflect a centralization of industrial investment in the SEZ, with a less direct impact in other zones.
Partial conclusion:
The results of the effects of FDI associated with public investment show a concentration of investment in the Nkok SEZ, but with a general downward trend after the 2018 peak, probably due to market saturation and declining collaboration in public-private partnerships (PPPs). Outside the SEZ, foreign investment associated with public investment is less effective, and the increase in exports and industrial revenues appears to be having only a limited impact. The analysis also points to a dynamic of economic polarization, where investment is concentrated in the SEZ, with limited effects in outlying areas, despite a growing number of companies in the latter.
In order to respond effectively to and complement existing management, governance and strategic planning tools for development poles, in particular SEZs, we propose a model to accompany the model proposed by the World Bank in 2011. This is a governance model of the unbalanced growth process for development poles in underdeveloped regions of southern countries, divided into three phases. Indeed, the World Bank has proposed to advise models for African SEZs, with periodic adjustments (Farole, Thomas, 2011) [22] integrating flexible strategies and periodic adjustments in response to economic and technological evolutions, with the aim of achieving long-term planning and dynamic management.
VII. Dynamic governance model for unbalanced regional growth processes (DGMUG) based on development poles in the South.
Based on observations of the dynamics of poles in the regions of emerging countries and certain underdeveloped countries with poles, notably Special Economic Zones at advanced stages of development, and empirical modelling of the spatio-temporal dynamics of imbalance in the Nkok SEZ in Gabon, a model of the processes of imbalance in the underdeveloped regions of Southern countries has been identified (fig.10). The resulting model comprises three (3) phases, the last two of which are made up of scenarios. Phase 1 is made up of 3 possible scenarios and phase 2 is made up of two scenarios. This model should be considered by stakeholders in clusters, especially SEZs, as a decision-making and strategic planning tool for unbalanced regional or spatial growth from clusters, especially SEZs. However, the modelling of unbalanced growth processes in underdeveloped regions of the South must in turn be seen as a tool and a step preceding the modelling of balanced growth in these same regions or spaces. Thus, the proposed unbalanced growth modelling is composed as follows:
Phase 0: Start-up prerequisites
Phase 0 (zero) is the initial phase of the polarization process. It brings together the conditions on which the initiating players must work, at the risk of ending up in a lethal scenario, and there are 17 of them (with average preparation periods ranging from 5 to 10 years). These conditions are the starting point for a dynamic, evolving ecosystem:
- Public and private initiatives: proactive and assertive government leadership in the face of the power of multinational corporations (MNCs).
- Public-private partnerships: These must be fair and enable governments to make the most of FDI. Portfolios of alliances with multinational companies must be managed transparently, intelligently and efficiently, with ideas and strategies clearly identified by the governments of the countries concerned.
- Attractive tax and customs framework: tax exemption policies must be preceded by market studies of SEZs and FDI at international level, in order to offer tax advantages with optimum short-, medium- and long-term profitability for the countries concerned. Coopetition systems (coexistence between cooperation and competition) must be set up between cluster initiators in developing countries.
- Appropriate regulatory framework: it must be stable over time in order to reassure investors. In particular the holders of FDIs.
- 5. Simplify administrative procedures and optimize processing times.
- Strategic planning: using the unbalanced growth model proposed by this study to help conceptualize the future balanced growth model.
- Strategic monitoring of international and national markets: necessary to obtain essential strategic information to increase visibility and improve governance and competitiveness. It must be carried out periodically and on an ongoing basis.
- Infrastructure: in strategic locations to stimulate growth and attractiveness.
- Driving industries: ensuring the creation and attractiveness of multinational and national companies.
- Secondary industries: Secondary industries should support the driving industries in peripheral regions or regions far from the main centers (homogeneous areas).
- Propelled companies and industries: organize upstream and downstream industries; vital for the activities of propelled companies and therefore the polarization of growth;
- Strategic locations: hubs should be close to population centers and land-based infrastructures such as airports, ports, power grids, etc.
- Innovation systems: These need to be conceptualized by host governments. Technology transfer strategies planned by host governments must create the conditions for capturing, absorbing and managing innovation in the short, medium and long term. These strategies must lay the foundations for creative and synthetic innovation;
- Creating a framework for collaboration between strategic players: strategic players must include governments, decentralized administrations, multinational companies, national companies, development partners, research laboratories, incubators and higher education establishments. The collaborative framework must give rise to a system of governance within and between each cluster (coordination of governance between localized economic spaces). The main clusters, secondary clusters and secondary economic systems theorized by Milton Santos (1974) [32], as well as the rest of the propelled industries, must all be interconnected by an inter-cluster participative governance model. The inter-pole governance system must be associated with a second governance system that incorporates a geographical dimension. This is the inter-territorial and inter-regional governance system. The inter-territorial governance system must involve players from all territorial levels within the same country. The inter-regional governance system, on the other hand, must involve players from homogeneous regions (with similar economic and geographic profiles) within the same country, right up to the economic communities of sub-regional and regional states.) However, these organizational dynamics need to be established over the long term in the regions of developing countries.
- Create a cognitive system: set up R&D programs, think tanks and working groups made up of strategic players, and build up universities, laboratories and research centers. Setting up support systems for innovative entrepreneurship in each homogeneous economic area (clusters or SEZs). Support systems for innovative entrepreneurship, including incubators, gas pedals and business developers, need to be set up. These programs should be supported by certified strategic partners in the area.
- Satisfactory social policies: these must be implemented to reduce and prevent tensions and inequalities within companies, and enable a gradual improvement in working conditions. Participative governance methods need to be implemented in companies.
- Satisfactory societal policies: must be implemented to reduce and prevent tensions and inequalities within the territories, regions and communities impacted by the clusters. They must also enable the implementation of participatory, inclusive and representative modes of governance in the regions impacted.
Figure 7.
Modeling the processes of economic, social and geographic imbalance in the planned centers of the South.
Figure 7.
Modeling the processes of economic, social and geographic imbalance in the planned centers of the South.
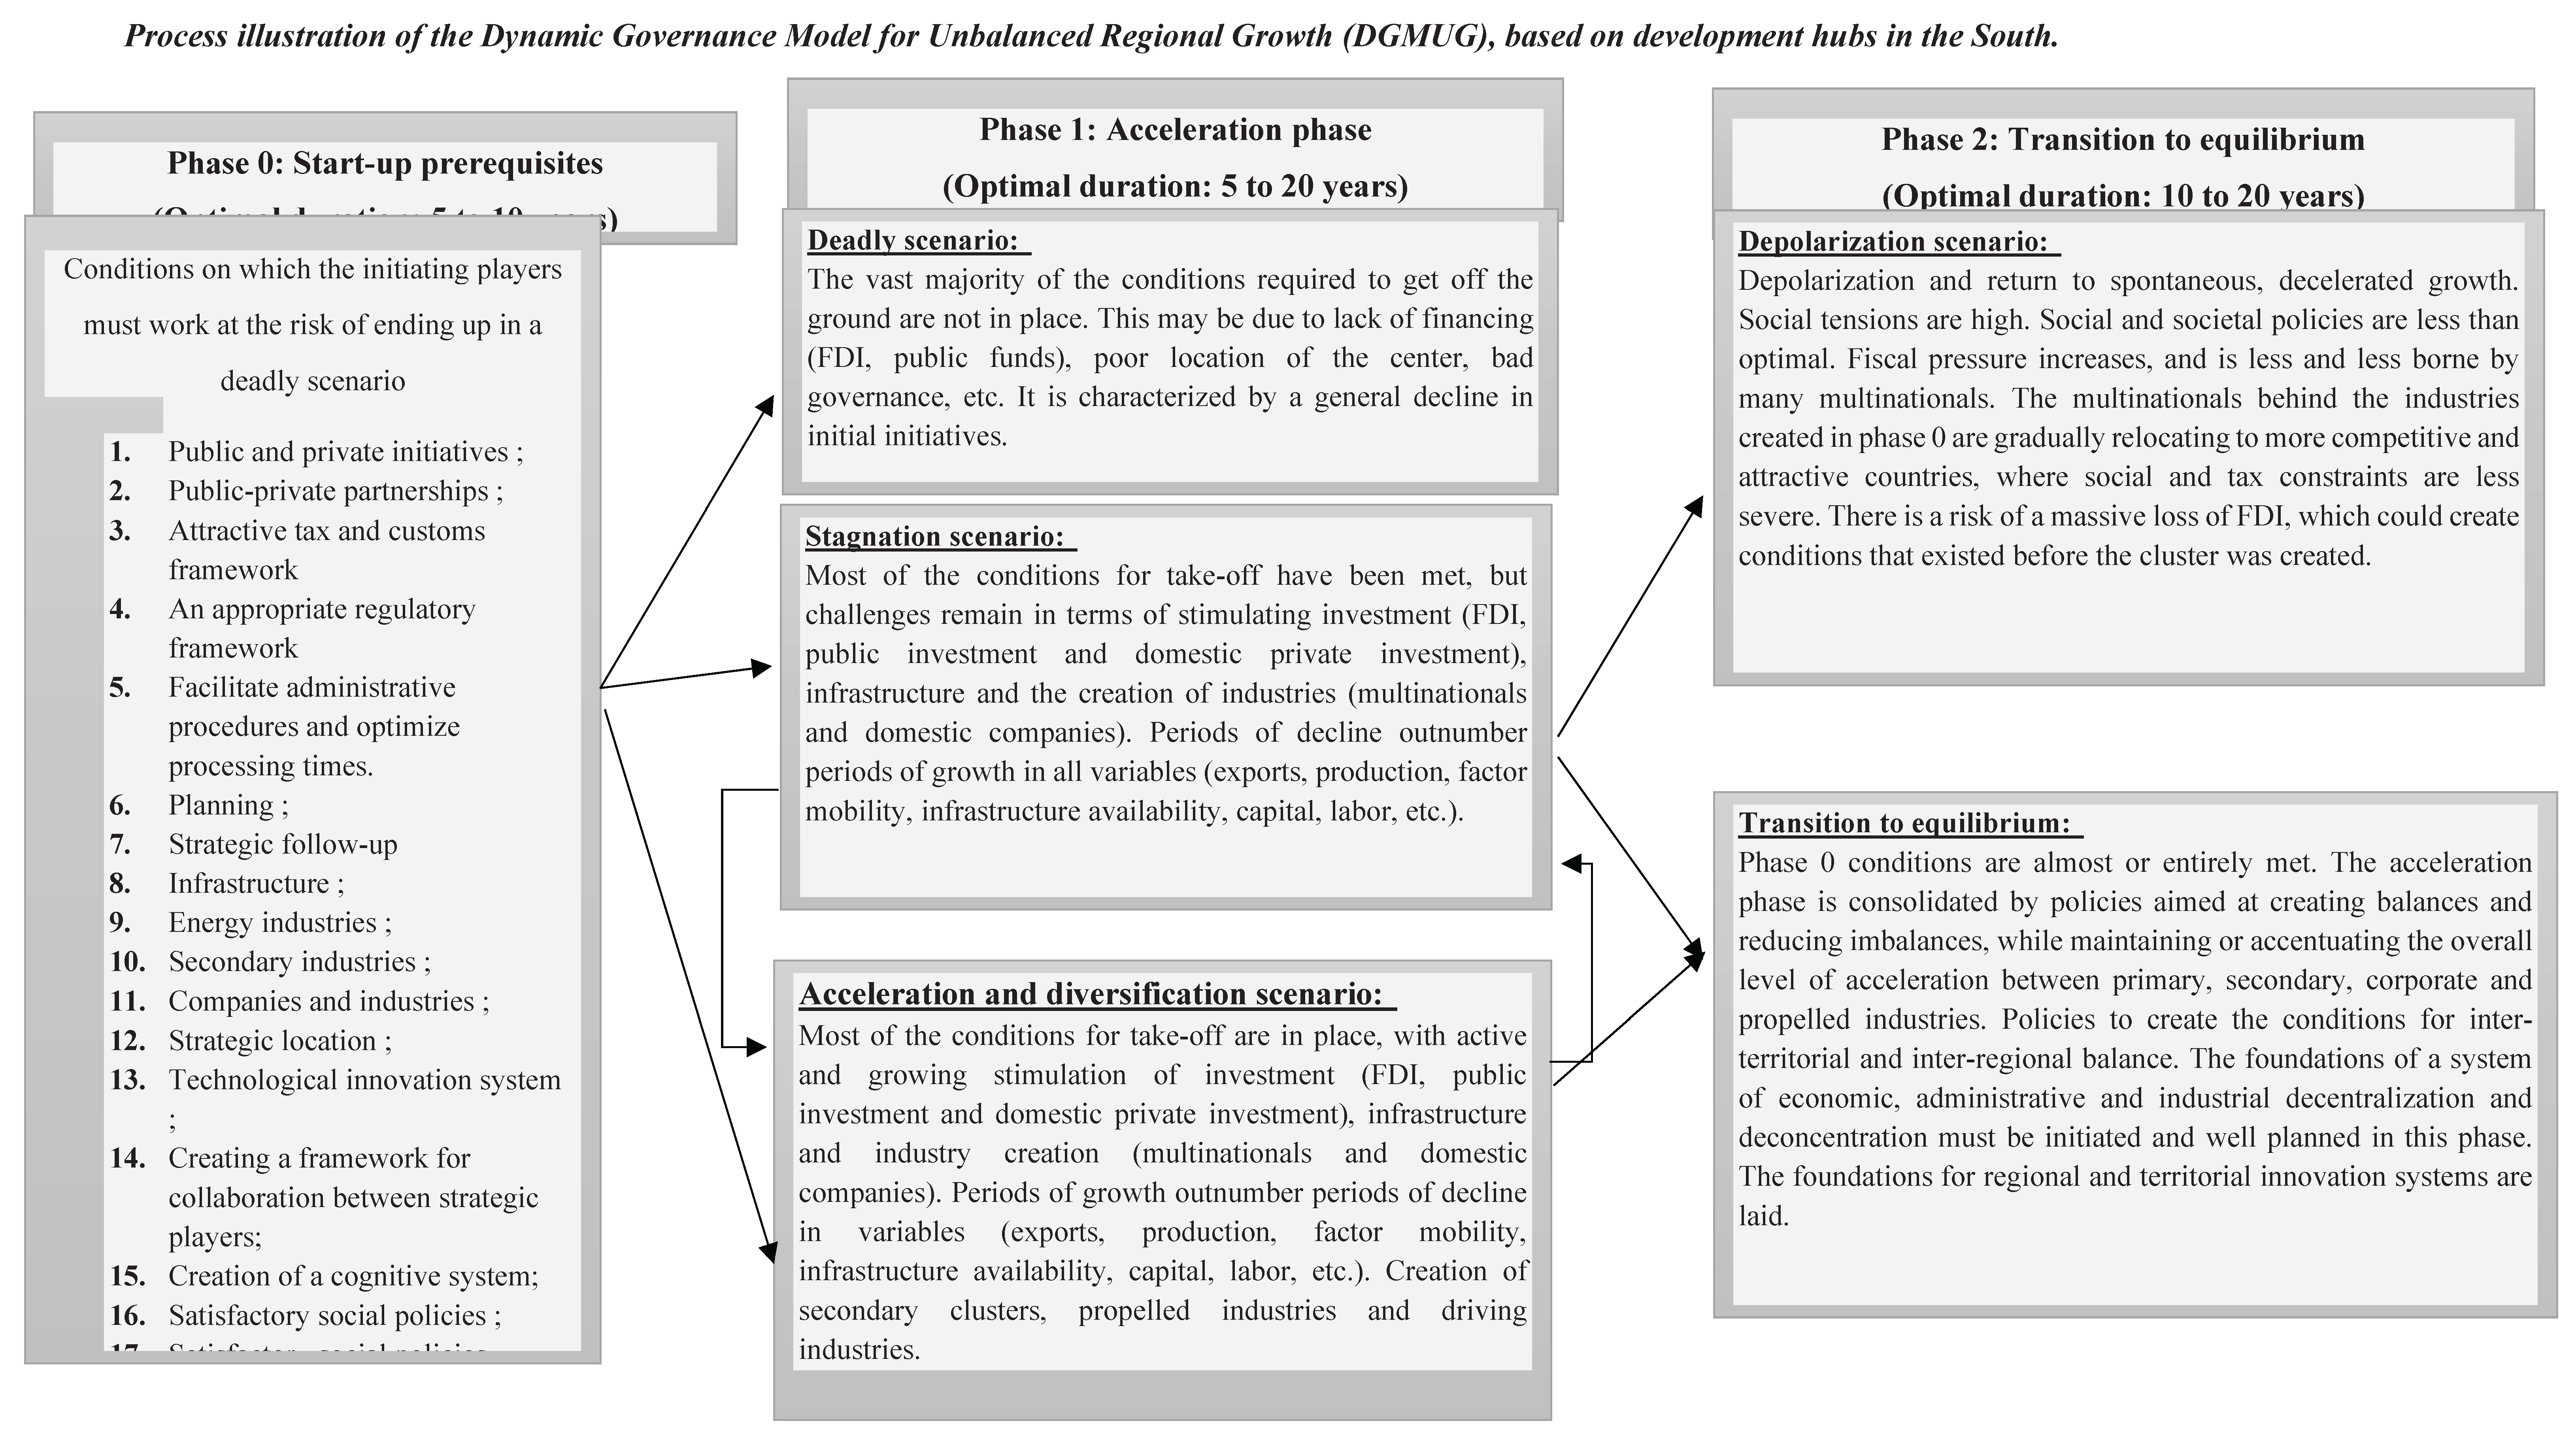
Phase 1: Acceleration phase
Phase 1, also known as the acceleration phase, is when the various economic zones experience the effects predicted by theories of unbalanced regional growth. In particular, the circular causality theory of Myrdal (1957) [33], the accelerated polarization theory of Perroux (1995) [30] and Hirschman (1958) [29]. It should last between 10 and 20 years.
- Scenario 1: Deadly scenario
In this scenario, in the vast majority of cases, the conditions for take-off are not in place. This may be due to lack of funding (FDI, public and private funds), poor location of the center, poor governance, etc. It is characterized by a generalized setback to initial initiatives, leading to the initial state of development or to situations worse than the initial state.
- Scenario 2: Stagnation scenario
Most of the conditions for take-off have been met, but challenges remain in terms of stimulating investment (FDI, public investment and domestic private investment), infrastructure and the creation of industries (multinational and domestic firms). Periods of decline outnumber periods of growth in all variables (exports, production, factor mobility, availability of infrastructure, capital, labor, etc.). This scenario is also characterized by a delay in the process of diversification and structural transformation of products. The majority of goods remain in primary processing or manage to reach secondary processing. Manufacturing industries remain in light industry (agri-food, textiles, cosmetics, basic pharmaceutical production, etc.). However, it may lead directly to the transition scenario towards equilibrium, or go through waves of acceleration alternating with long-term stagnation scenarios such as the Maquiladoras in Mexico or the settlers in Panama.
- Scenario 3: Acceleration and industrial diversification scenario
In this scenario, new, more profitable products are produced than in the start-up phase. There is also a structural transformation of processing levels within the same value chain (from primary to secondary and tertiary processing predominate). Most of the conditions for take-off have been met, and there is active and growing stimulation of investment (FDI, public investment and private domestic investment), infrastructure and the creation of industries (multinational and domestic firms). Periods of growth outnumber periods of decline in variables (exports, production, factor mobility, availability of infrastructure, capital, labor, etc.). There is also a shift from light industry to technology (digital, electronics, pharmaceuticals, etc.). The finance and real estate sectors need to develop. More and more secondary hubs, motorized industries and power industries are being created. This scenario leads directly to the transition phase towards equilibrium.
Phase 2:Transition to equilibrium
- Scenario 1 :Depolarization scenario
This scenario is characterized by depolarization and a return to spontaneous, decelerated growth. Social tensions are high. Social and societal policies are not optimal in this scenario. Tax pressure increases, and is borne less and less by many multinational enterprises (MNEs). The multinationals behind the industries created in phase 0 relocate to more competitive and attractive countries, where social and fiscal constraints are less severe. Tax pressure increases, and there is a risk of a massive loss of FDI, which could create conditions similar to those prevailing prior to creation. However, stimulus policies can help prevent this scenario from materializing.
- Scenario 2: transition to the equilibrium phase
This scenario is characterized by a consolidation of the acceleration phase through policies aimed at creating balances and reducing imbalances, while maintaining or accentuating the overall level of acceleration between primary, secondary, corporate and propelled industries. Policies to create the conditions for inter-territorial and inter-regional balance. The foundations of a system of economic, administrative and industrial decentralization and deconcentration must be initiated and well planned in this phase. The foundations of a regional and territorial innovation system must be created. Innovation systems are well developed and connected in this scenario. National and multinational companies, universities, research centers and incubators must be interconnected and work with centralized governments to diversify industry and improve productivity. Growth clusters are becoming competitiveness clusters, and a labeling system is to be set up. There is less dependence on multinational firms, and national industries must increasingly take the lead in the industrialization process. Beyond the phases of unbalanced growth modeled by this study, a look at the post-unbalanced phase is needed to guide cluster initiators over the long term.
To improve the dynamic governance model for SEZ development clusters using existing tools and models, here are some suggestions that can strengthen each phase and scenario taking into account the proposed approaches:
- VIII.
- Summary of strategic criteria for the various phases and scenarios
Table 10 summarizes the strategic criteria of the various DGMUG phases and scenarios, and the assessment and planning tools for improving SEZ governance.
-
Phase 0 : Start-up requirements
- ○
- This phase aims to lay a solid foundation for SEZs by establishing an attractive framework for investors.
- ○
- Tools such as SWOT analysis, profitability assessment models (UNIDO 2009), performance dashboards (BSC) and geographic information systems (GIS) are used to optimize planning, anticipate risks and maximize economic and social attractiveness.
- ○
- The focus is on strategic infrastructure, appropriate tax and regulatory policies, as well as innovation and collaboration between stakeholders.
-
Phase 1 : Acceleration
- ○
- At this stage, the growth of SEZs depends on the quality of investment and strategic management.
- ○
-
There are three possible scenarios:
- ▪
- Lethal scenario (project failure due to poor governance and insufficient funding).
- ▪
- Stagnation scenario (slower growth due to limited diversification and uneven infrastructure development).
- ▪
- Acceleration and diversification scenario (advanced industrialization and move upmarket into technology sectors).
- ○
- Tools such as CBA, BSC dashboards and economic simulations enable us to anticipate bottlenecks and adjust strategies in real time.
-
Phase 2 : Transition to equilibrium
- ○
- This phase aims to ensure the sustainability and stabilization of the SEZs.
- ○
-
Two scenarios may emerge:
- ▪
- Depolarization (loss of attractiveness of SEZs, resulting in the departure of multinationals and economic and social tensions).
- ▪
- Transition to equilibrium (increased independence of local industries and successful diversification).
- ○
- Tools such as strategic planning, GIS and economic impact modeling are used to monitor industrial diversification and reduce territorial imbalances.
Table 10 highlights the importance of an integrated approach combining strategic analysis, economic modeling and participatory governance to ensure the sustainable, balanced development of SEZs. The adoption of monitoring and optimization tools makes it possible to anticipate risks, adjust policies and improve the competitiveness of development clusters.
Global summary
Table 10 highlights the importance of a continuous strategic approach to strengthening SEZ governance. The tools proposed (SWOT, BSC, GIS, CBA, economic modelling) make it possible to :
- Identify risks and opportunities.
- Optimize investments.
- Monitor performance.
- Ensure balanced growth by reducing spatial disparities and promoting industrial diversification.
This integrated approach aims to minimize the risk of failure and maximize the economic, social and environmental benefits of SEZs.
A look at the main post-balance-sheet phases:
Theories of balanced and unbalanced regional growth are based on strict assumptions. In the modern context of regional hubs in emerging or industrialized countries, we are witnessing the implementation of diagnostics, management systems, technology transfers, innovation systems and rigorous planning to enable balanced absorption and diffusion in the short, medium and long term. These approaches present challenges for countries in the South, making them difficult to apply in underdeveloped regions. In these contexts, rapid economic liberalization can lead to social and political instability, and the results can be disastrous in terms of regional balance. What's more, although regional growth theories are logically coherent and useful, their long-term applications are more difficult for countries in the South. They reveal more and more problems across time and space, underlining the need for more pragmatic and resilient approaches. These would combine: market dynamics, constant commitment, substantial credits, government regulations and other strategic local players for balanced and sustainable regional, then national, development.
Although the polarization process in Gabon's forestry sector is at a stage where the theory of unbalanced regional growth prevails, it is of crucial importance to continue positive and prospective studies. We need to consider that polarization is a dynamic process that can follow different trajectories in time and space. In the current context, with the globalization of production processes and the specific problems of underdeveloped countries, understanding present and future issues can be increasingly complex. Determining and studying favorable scenarios is becoming increasingly complex in underdeveloped environments. Thus, in underdeveloped conditions, researchers, public and private players and development partners need to consider the process of pole evolution in three (3) major very long-term phases.
- First major phase: Priority to the application of theories of unbalanced regional growth in underdeveloped regions, with particular attention to the contexts of globalization of production processes, FDI theory and international trade.
The first major phase should use the approaches of traditional unbalanced regional growth theorists, while considering some of the ideas of balanced regional growth theorists such as Rosenstein-Rodan (1943) [31] and Douglass North (1990) [34]. However, the application of unbalanced regional growth theories must prevail. In addition, intensified research in underdeveloped conditions, throughout the process, on international trade theories and the theory of FDI or the theory of multinational firms, their stakes and implications for poles in underdeveloped conditions must prevail in the first major phase.
- Second major phase: Priority given to the application of balanced regional growth theories, with particular attention paid to the globalization of production processes, FDI theory, international trade, the internal regional specificities of the country in question, and the community space to which it belongs.
The second major phase should be devoted to applying traditional theories of balanced regional growth. This phase must pay particular attention to the involvement of public and private players, as well as development partners. By asking questions and providing answers on how to reduce the fragilities and inequalities generated by the application of unbalanced regional growth theories. Whether for centralized or decentralized economic systems under conditions of underdevelopment. However, decentralized systems would present many advantages and facilities for the application of balanced regional growth theories, while centralized systems would present greater challenges. During this phase, the analyses of Milton (1974) [32] and RP. Misra (1990) [35] will be of great use in providing solutions for the reduction of imbalances after the phase of intense polarization under conditions of underdevelopment. Indeed, Milton (1974) [32] had already shown the existence of characteristics specific to growth poles in underdeveloped countries, through the creation and disregard of "secondary productive circuits" which would increasingly suffer the negative effects of unbalanced polarization. Hence the proposal for regional centers or growth points based on the size of the population pool and infrastructural situations. All linked and coordinated, from the smallest growth point to the major industrial centers located in the country's largest urban centers, would provide numerous solutions and guide research for the rebalancing phase.
- Third major phase: In addition to the priorities of major phases 1 and 2, pay particular attention to new theories of territorialized economic and cognitive systems, hybrid cluster models adapted to the contexts of developing countries, and cluster labeling.
The third major phase should be devoted to the application of recent theories on the development of territorialized and decentralized economic systems. Indeed, models such as territorialized innovation systems, territorialized food systems and those derived from the theory of corporate social responsibility (CSR) should be predominant in this phase. Of course, economic, administrative and industrial governance systems need to be fully decentralized. In this way, conditions will be more conducive to the creation and accreditation of competitiveness clusters and localized production systems.
It should be noted that, although the chronology of phases must be respected, some ideas from the current or next phase can be applied to previous phases, or vice versa. In this way, the proposed model should offer flexibility and room for manoeuvre in line with the spatio-temporal specificities of the regions and countries concerned.
Discussion
The results of this study, focused on analyzing the impact of business agglomeration, foreign direct investment (FDI), public investment and unbalanced regional growth in Gabon, reveal complex dynamics that highlight both the benefits and challenges associated with industrialization in differentiated economic spaces such as the Nkok Special Economic Zone (SEZ) and peripheral areas. The study provides new insights into the geographical and socio-economic effects of SEZs, particularly in the context of developing countries.
1. Concentration of investment in the Nkok SEZ and geographical disparities
The main result of this study confirms a marked economic polarization between the Nkok SEZ, characterized by more favorable conditions for business agglomeration, and areas outside this SEZ, which are more heterogeneous and less industrialized. This polarization is in line with the findings of previous studies on the phenomenon of agglomeration externalities, where investment and economic benefits tend to concentrate in certain geographical areas to the detriment of outlying regions. In Nkok, the concentration of FDI, coupled with targeted public investment, has generated strong industrial growth and sustained exports. By contrast, peripheral areas, despite a growing number of companies, have shown little capacity to capture FDI, limiting their industrial and economic development.
This corroborates the work of Krugman (1991) [1] and Fujita, Krugman, and Venables (1999) [3], who suggest that the positive externalities associated with agglomeration are crucial for boosting regional competitiveness. However, in the Gabonese context, agglomeration seems to reinforce the centralization of economic benefits to the detriment of balanced development on a national scale. The geographical disparities highlighted in the study illustrate asynchronous economic development that could exacerbate regional and social inequalities, with consequences for the country's social cohesion and political stability.
2. Dynamics of FDI and public investment: a rollercoaster ride
The trend in investment in the Nkok SEZs follows an interesting trajectory, marked by an initial concentration of investment and a gradual decline after 2018. This trend could reflect the saturation of the local market, as suggested by the study. This dynamic, while expected in developing economies where initial investments create higher marginal returns, raises an important question: how can developing countries maintain the attractiveness of their SEZs in the long term, beyond the initial peak of foreign investment?
The results also show that foreign investment in areas outside the SEZ has a relatively weak, even negative, effect on industrial growth. This finding highlights the structural limitations of these regions, such as lack of infrastructure, weak local capacity and inappropriate public policies. It is therefore crucial that public investment is better directed towards supporting the industrialization of peripheral areas, and not just the already privileged central zones.
3. The governance model for unbalanced regional growth: a response to Gabon's challenges
One of the major contributions of this study is the proposal of a dynamic governance model for managing unbalanced regional growth. This model, inspired by the work of the World Bank (Farole, Thomas, 2011), stands out for its flexible approach and its three successive phases, from the creation of preconditions for polarization to the transition to equilibrium. This model could provide a useful strategic framework for reducing economic imbalances, not only in the Nkok SEZ, but also in the country's peripheral areas.
Phase 1, the so-called acceleration phase, is particularly important, as it focuses on industrialization and the integration of the local economy into global value chains. However, the study shows that this phase is likely to lead to stagnation or polarization scenarios, raising questions about the sustainability of the economic strategies put in place. The effective implementation of this model will require a strong commitment from stakeholders, in particular to avoid the "lethal" scenario of further marginalization of peripheral areas. Particular attention will need to be paid to mechanisms for redistributing economic benefits to ensure inclusive development.
4. Environmental impact and sustainability: the need to integrate ecological issues
Finally, a fundamental aspect that emerges from the results of the study is the question of the sustainability of industrial agglomeration in the forestry sector. While the Nkok SEZ has encouraged industrialization and increased exports, the environmental consequences of this industrialization, notably deforestation and the unsustainable exploitation of natural resources, cannot be ignored. This dynamic, while economically beneficial in the short term, could have far-reaching ecological repercussions, as previous studies on ecosystem degradation in Central Africa have shown.
To ensure sustainable development, it is crucial that SEZs are not just conceived as economic hubs, but that they incorporate strict environmental criteria. The proposed governance model could be enriched by the adoption of sustainable development strategies, encouraging more environmentally responsible agriculture and industry. In addition, better regulation of natural resources and greater involvement of local communities in resource management are needed to limit negative impacts on biodiversity and forest-dependent populations.
This study provides a detailed analysis of the effects of industrial agglomeration and investment in the context of SEZs in Gabon. The results highlight the need to revise regional development policies to avoid excessive concentration of economic benefits and further marginalization of peripheral areas. The proposed governance model, in particular its adaptation and transition phases, offers a useful strategic framework for managing the challenges associated with unbalanced growth, but its effectiveness will largely depend on the implementation of public policies and the involvement of the various players in the development process. Finally, the integration of environmental issues into SEZ planning will be essential to ensure the sustainability of industrialization and economic growth in Gabon.
Involvement Policies and Recommendations
I. Policy implications and general recommendations
- Geographic and social polarization: The results of this study highlight the economic polarization created by SEZs, particularly the Nkok SEZ, which concentrates investment and economic benefits to the detriment of peripheral areas. This polarization reinforces regional inequalities and can accentuate social tensions, particularly between industrialized urban areas and neglected rural areas. Political intervention is therefore needed to prevent uneven growth and promote a more equitable distribution of economic resources.
- Need for flexible regulations: The study reveals that foreign and public investment in the Nkok SEZ is tending towards saturation, suggesting that growth policies based solely on specific zones may not be sustainable in the long term. It is therefore crucial to put in place flexible regulations that allow for periodic adjustments to meet economic and technological challenges, while promoting balanced development in different geographical areas.
- Development of stronger public-private partnerships: Public-private partnerships (PPPs) in the Nkok SEZ are showing signs of weakness after 2018, which may indicate a loss of dynamism in collaboration between public and private players. Stronger political involvement could reorient these partnerships to foster more inclusive and sustainable growth. It is necessary to encourage dynamic governance, capable of adapting to market changes and the needs of peripheral areas.
- Strengthening local governance: The governance of SEZs and development hubs needs to be strengthened through decentralized management, with local authorities and communities playing a key role in defining economic and social priorities. This could include stricter control mechanisms over how resources are allocated and used in these zones.
General recommendations
- Diversifying investment in peripheral areas: To counter the concentration of investment in SEZs and encourage more balanced growth, public policies should include incentives to attract investment to areas outside SEZs. This could include subsidies, tax breaks or low-interest loans to encourage companies to locate in less developed regions.
- Strengthening infrastructure in peripheral areas: Investment in transport, energy and communications infrastructure is essential to improve the attractiveness of peripheral areas. These infrastructures would not only facilitate access to local and international markets, but also contribute to better economic integration of remote regions.
- Improving natural resource management: In the forestry sector, it is crucial to adopt sustainable natural resource management practices to ensure that economic growth does not come at the expense of the environment. This includes environmental certification mechanisms, reforestation policies and the promotion of greener production technologies.
- Implementing the dynamic governance model: The proposed Dynamic Governance Model (DGMUG) could be a useful roadmap for developing country governments, particularly those in the South, to structure a more flexible and adaptable approach to regional growth. It is recommended that this model be tested in pilot areas to assess its effectiveness before being rolled out on a larger scale.
- Focus on endogenous growth and regional self-sufficiency: As a complement to foreign investment, policies must also support endogenous growth by promoting local entrepreneurship, innovation and capacity building for local businesses. This could include training programs, tax incentives and investment funds for small and medium-sized enterprises (SMEs).
II. Policy implications and alternatives in the face of declining investment in Gabon's forestry sector
1. Identifying the problem: Rentier behavior and declining investments
An analysis of foreign direct investment (FDI) and public investment in the Nkok Special Economic Zone (SEZ) and its outlying areas reveals a phenomenon of rentier behavior on the part of multinational firms. This behavior is characterized by :
- Concentration of investment in key areas without balanced redistribution in the global economy.
- Significant capital outflows limiting local growth.
- Stagnating investments due to industrial saturation.
- A lack of significant reinvestment in infrastructure development and support for local SMEs.
2. Effects of reduced investment in the forestry sector
In and around the Nkok SEZ, the decline in investment in the forestry sector is particularly worrying. This is attributable to several factors :
- Lack of diversification of economic activities outside the SEZ.
- Excessive dependence on multinational companies, which do not systematically reinvest their profits in the local economy.
- Export revenues do not directly stimulate local investment.
- A public strategy insufficiently focused on promoting long-term investment.
3. Political Alternatives and Solutions
3.1 Reforming the Attractiveness of FDI and Public Investment
- Targeted tax incentives to encourage local reinvestment of FDI.
- Strengthening Public-Private Partnerships (PPPs) to develop industrial and logistics infrastructures.
- Introduction of reinvestment requirements for multinational companies, making the granting of concessions conditional on a commitment to support local development.
3.2 Diversification and support for local SMEs
- Creation of investment funds for the development of SMEs specializing in wood processing.
- Support for the structuring of local value chains to reduce dependence on raw material exports.
- Introduction of incentive policies to encourage companies to integrate local SMEs into their supply chains.
3.3 Strengthening sustainable investment policies
- Integration of sustainable development criteria in the granting of logging licenses.
- Promoting Corporate Social Responsibility (CSR) initiatives to encourage investment in local strategic infrastructure.
- Encouraging companies to adopt local processing practices to increase the added value of exported products.
3.4 Optimizing tax and customs revenues
- Allocation of a significant proportion of tax revenues to development projects targeting local SMEs.
- Improved transparency in the collection and use of tax revenues to ensure effective financing of public investment.
- Adoption of alternative financing mechanisms, such as green bonds and sovereign wealth funds, to stimulate investment in the forestry sector.
The decline in investment in Gabon's forestry sector, particularly in and around the Nkok SEZ, reflects a dynamic of industrial concentration and rentier behavior on the part of multinational firms. To reverse this trend, it is imperative to adopt more strategic public policies, favoring a balance between attracting FDI and strengthening local capacities. SME development, economic diversification and better redistribution of tax revenues must be at the heart of government initiatives to ensure sustainable and inclusive growth in the forestry sector.
Perspectives for Future Studies
- Assessing the long-term effects of SEZs: Longitudinal studies should be carried out to observe the long-term effects of SEZs on peripheral areas and the distribution of economic benefits. Such a study could offer insights into the sustainability of economic polarization strategies and provide empirical data for adjusting public policies.
- Comparative studies between different regions of the South: Comparing the development model based on SEZs and development poles with other African or developing regions could help explore the dynamics of growth and industrialization in different geographical and political contexts. Such studies could offer a more comprehensive view of best practices and pitfalls to be avoided.
- Modeling the transition to equilibrium: Phase 2 of the dynamic governance model proposes a scenario of transition to equilibrium. Future studies could deepen the modeling of this phase to better understand the factors of success or failure in the transition to a more balanced regional development. A detailed analysis of depolarization and successful transition policies in other contexts could provide practical guidelines.
- Studies on the social and environmental effects of SEZs: It is essential to complement the economic study with studies on the social and environmental effects of SEZs, particularly in sectors such as forestry. These studies could assess the impact of business agglomeration on local communities, the environment and the quality of life of people living in outlying areas.
- Impact of new technologies and innovation: With the rapid evolution of technologies, it would be relevant to explore how the integration of new technologies in SEZs and development hubs can influence regional growth. This includes the impact of digital innovations, cleaner production technologies and digital value chains on developing areas.
Conclusions
In conclusion, this study highlights the complex dynamics of Special Economic Zones (SEZs) and their impact on socio-economic and geographic disparities in Gabon. Through a comparative analysis of the Nkok SEZ and outlying areas, we observed that the agglomeration of companies in the SEZ generates faster and more stable growth in terms of foreign direct investment, industrial revenues and exports, while areas outside the SEZ experience slower and more uneven growth. These results underline the economic polarization that results from agglomeration strategies, accentuating inequalities between regions close to SEZs and peripheries far from them.
The study also revealed the limits of foreign investment in outer zones, where the impact of FDI on industrial growth and exports is less marked. In contrast, the Nkok SEZ benefits from a concentration of investments and public-private partnerships, although this dynamic is showing signs of saturation, with a downward trend in investments after 2018.
To address these challenges, we propose a dynamic governance model of the unbalanced regional growth process (DGMUG), which could accompany and complement existing development strategies, such as those proposed by the World Bank in 2011 (Farole, Thomas, 2011). This three-phase model (prerequisite, acceleration and transition to equilibrium) offers a flexible framework for managing regional imbalances, while aiming to reduce socio-economic disparities and consolidate sustainable growth. By incorporating an inclusive and dynamic approach, this model can serve as a basis for strategic planning of regional development policies, thus promoting balanced and resilient development in developing countries.
References
- Krugman, P. Increasing Returns and Economic Geography. Journal of Political Economy 1991, 99, 483–499. [Google Scholar] [CrossRef]
- Venables, A. J. Equilibrium Locations of Vertically Related Industries. International Economic Review 1996, 37, 341–359. [Google Scholar] [CrossRef]
- Fujita, M.; Krugman, P.; Venables, A.J. The Spatial Economy: Cities, Regions, and International Trade; MIT Press, 1999. [Google Scholar]
- Farole, T.; Akinci, G. Special Economic Zones: Progress, Emerging Challenges, and Future Directions; World Bank, 2011. [Google Scholar]
- Zeng, D.Z. Building engines for growth and competitiveness in China: The experience of special economic zones and industrial clusters; World Bank, 2016. [Google Scholar]
- Gereffi, G.; Fernandez-Stark, K. Global value chain analysis: a guide, 2nd edition. 2016. Retrieved from https://hdl.handle.net/10161/12488.
- Borensztein, E.; De Gregorio, J.; Lee, J.W. How does foreign direct investment affect economic growth? Journal of International Economics 1998, 45, 115–135. [Google Scholar] [CrossRef]
- Javorcik, B.S. Does foreign direct investment increase the productivity of domestic firms? In search of spillovers through backward linkages. American Economic Review 2004, 94, 605–627. [Google Scholar] [CrossRef]
- UNIDO. Guidelines for the design and implementation of special economic zones; United Nations Industrial Development Organization, 2009. [Google Scholar]
- Kuroda, M.; Sato, M.; Yamagata, T. Spatial analysis of the location of Special Economic Zones in Asia: an econometric approach. Asian Economic Policy Review 2012, 7, 289–314. [Google Scholar]
- Sharma, S.; Jha, S.; Verma, R. Sustainable supply chain management: A comprehensive framework and future research agenda. Journal of Cleaner Production 2015, 108, 599–610. [Google Scholar] [CrossRef]
- Dunning, J.H. The eclectic paradigm as an envelope for economic and business theories of multinational enterprise activity. International Business Review. 2000.
- Pistorius, T.; Dufresne, M. Governance of special economic zones in Africa: Policy challenges and opportunities; World Bank Group, 2016. [Google Scholar]
- Berge, J. Economic zones in Africa: Lessons from Gabon's forestry sector. Journal of African Development Studies. 2015.
- Sunderland, T.; Ndoye, O. Forest resources and governance in Africa; CIFOR (Center for International Forestry Research), 2015. [Google Scholar]
- Michaels, G. The effect of trade on the demand for skills: Evidence from the Labor Market. Review of Economics and Statistics 2008, 90, 877–891. [Google Scholar] [CrossRef]
- Duranton, G.; Puga, D. Micro-foundations of Urban Agglomeration Economies. In Handbook of Regional and Urban Economics; Henderson, J.V., Thisse, J.F., Eds.; Elsevier: Amsterdam, The Netherlands, 2004; Volume 4, pp. 2063–2117. [Google Scholar]
- Rodríguez-Clare, A. The Division of Labor and Economic Development. Journal of Development Economics 1996, 50, 15–45. [Google Scholar] [CrossRef]
- Blomström, M.; Kokko, A. Multinational corporations and spillovers. Journal of Economic Surveys 1998, 12, 247–277. [Google Scholar] [CrossRef]
- Hinkle, L.E.; Ndulu, B.J. Assessing the development impact of special economic zones in sub-Saharan Africa. African Development Review 2011, 23, 449–462. [Google Scholar]
- Lall, S.; Mengistae, T. Special Economic Zones in Africa: Comparative Insights from East Asia. World Bank Policy Research Working Paper 3184. 2004. [Google Scholar]
- Farole, Thomas. Special economic zones in Africa: comparing performance and learning from global experience (anglais). Directions in development|trade Washington, DC: Banque mondiale. 2011. http://documents.worldbank.org/curated/en/996871468008466349.
- Nickel, S. Deviations in dynamic models with fixed effects. Econometrics 1981, 49, 1417–1426. [Google Scholar] [CrossRef]
- Breitung, J.; Kripfganz, S.; Hayakawa, K. Offset correction method for moment estimator of dynamic panel data model. Econometrics and Statistics: The Future. 2021. [Google Scholar]
- Dhaene, G.; Jochmans, K. Likelihood reasoning in autoregression with fixed effects. Econometric Theory 2016, 32, 1178–1215. [Google Scholar] [CrossRef]
- Bun, M.J.G.; Carree, M.A. Bias correction estimation in dynamic panel data model. Journal of Business and Economic Statistics 2005, 23, 200–210. [Google Scholar] [CrossRef]
- Kripfganz, S. Quasi-maximum likelihood estimation of linear dynamic short-T panel data models. Stata Journal 2016, 16, 1013–1038. [Google Scholar] [CrossRef]
- Kripfganz, S. A general method for estimating the moments of a linear dynamic panel data model. Proceedings of the STATA 2019 London conference: applying the employment equation. Economic Research Review 2019, 58, 277–297. [Google Scholar]
- Hirschmann, A.O. Economic development strategy; Yale University Press: New Haven, 1958. [Google Scholar]
- Perroux, F. Note sur la notion de "pôle de croissance". Économie appliquée 1955, 8, 307–320. [Google Scholar] [CrossRef]
- Rosenstein-Rodan, "The International Development of Economically Disadvantaged Regions", International Affairs v 20 (1944) #2 (avril), pp. 157-65.
- Milton, S. Sous-développement et pôles de croissance économique et sociale. Persée In : Tiers-Monde 1974, 15, 271–286. [Google Scholar]
- Myrdal, G. Economic theory and underdeveloped regions; Duckworth: London, 1957. [Google Scholar]
- North, D.C. Institutions, Institutional Change and Economic Performance; Cambridge University Press: Cambridge, MA, USA, 1990; pp. 107–140. [Google Scholar]
- Misra, R.P. Regional planning and national development, édition Goodreads; Vikas Publishing: New Delhi, Inde, 1978; ISBN 10: 0706905555 / ISBN 13: 9780706905557. [Google Scholar]
Figure 1.
Description of variables within the homogeneous space.
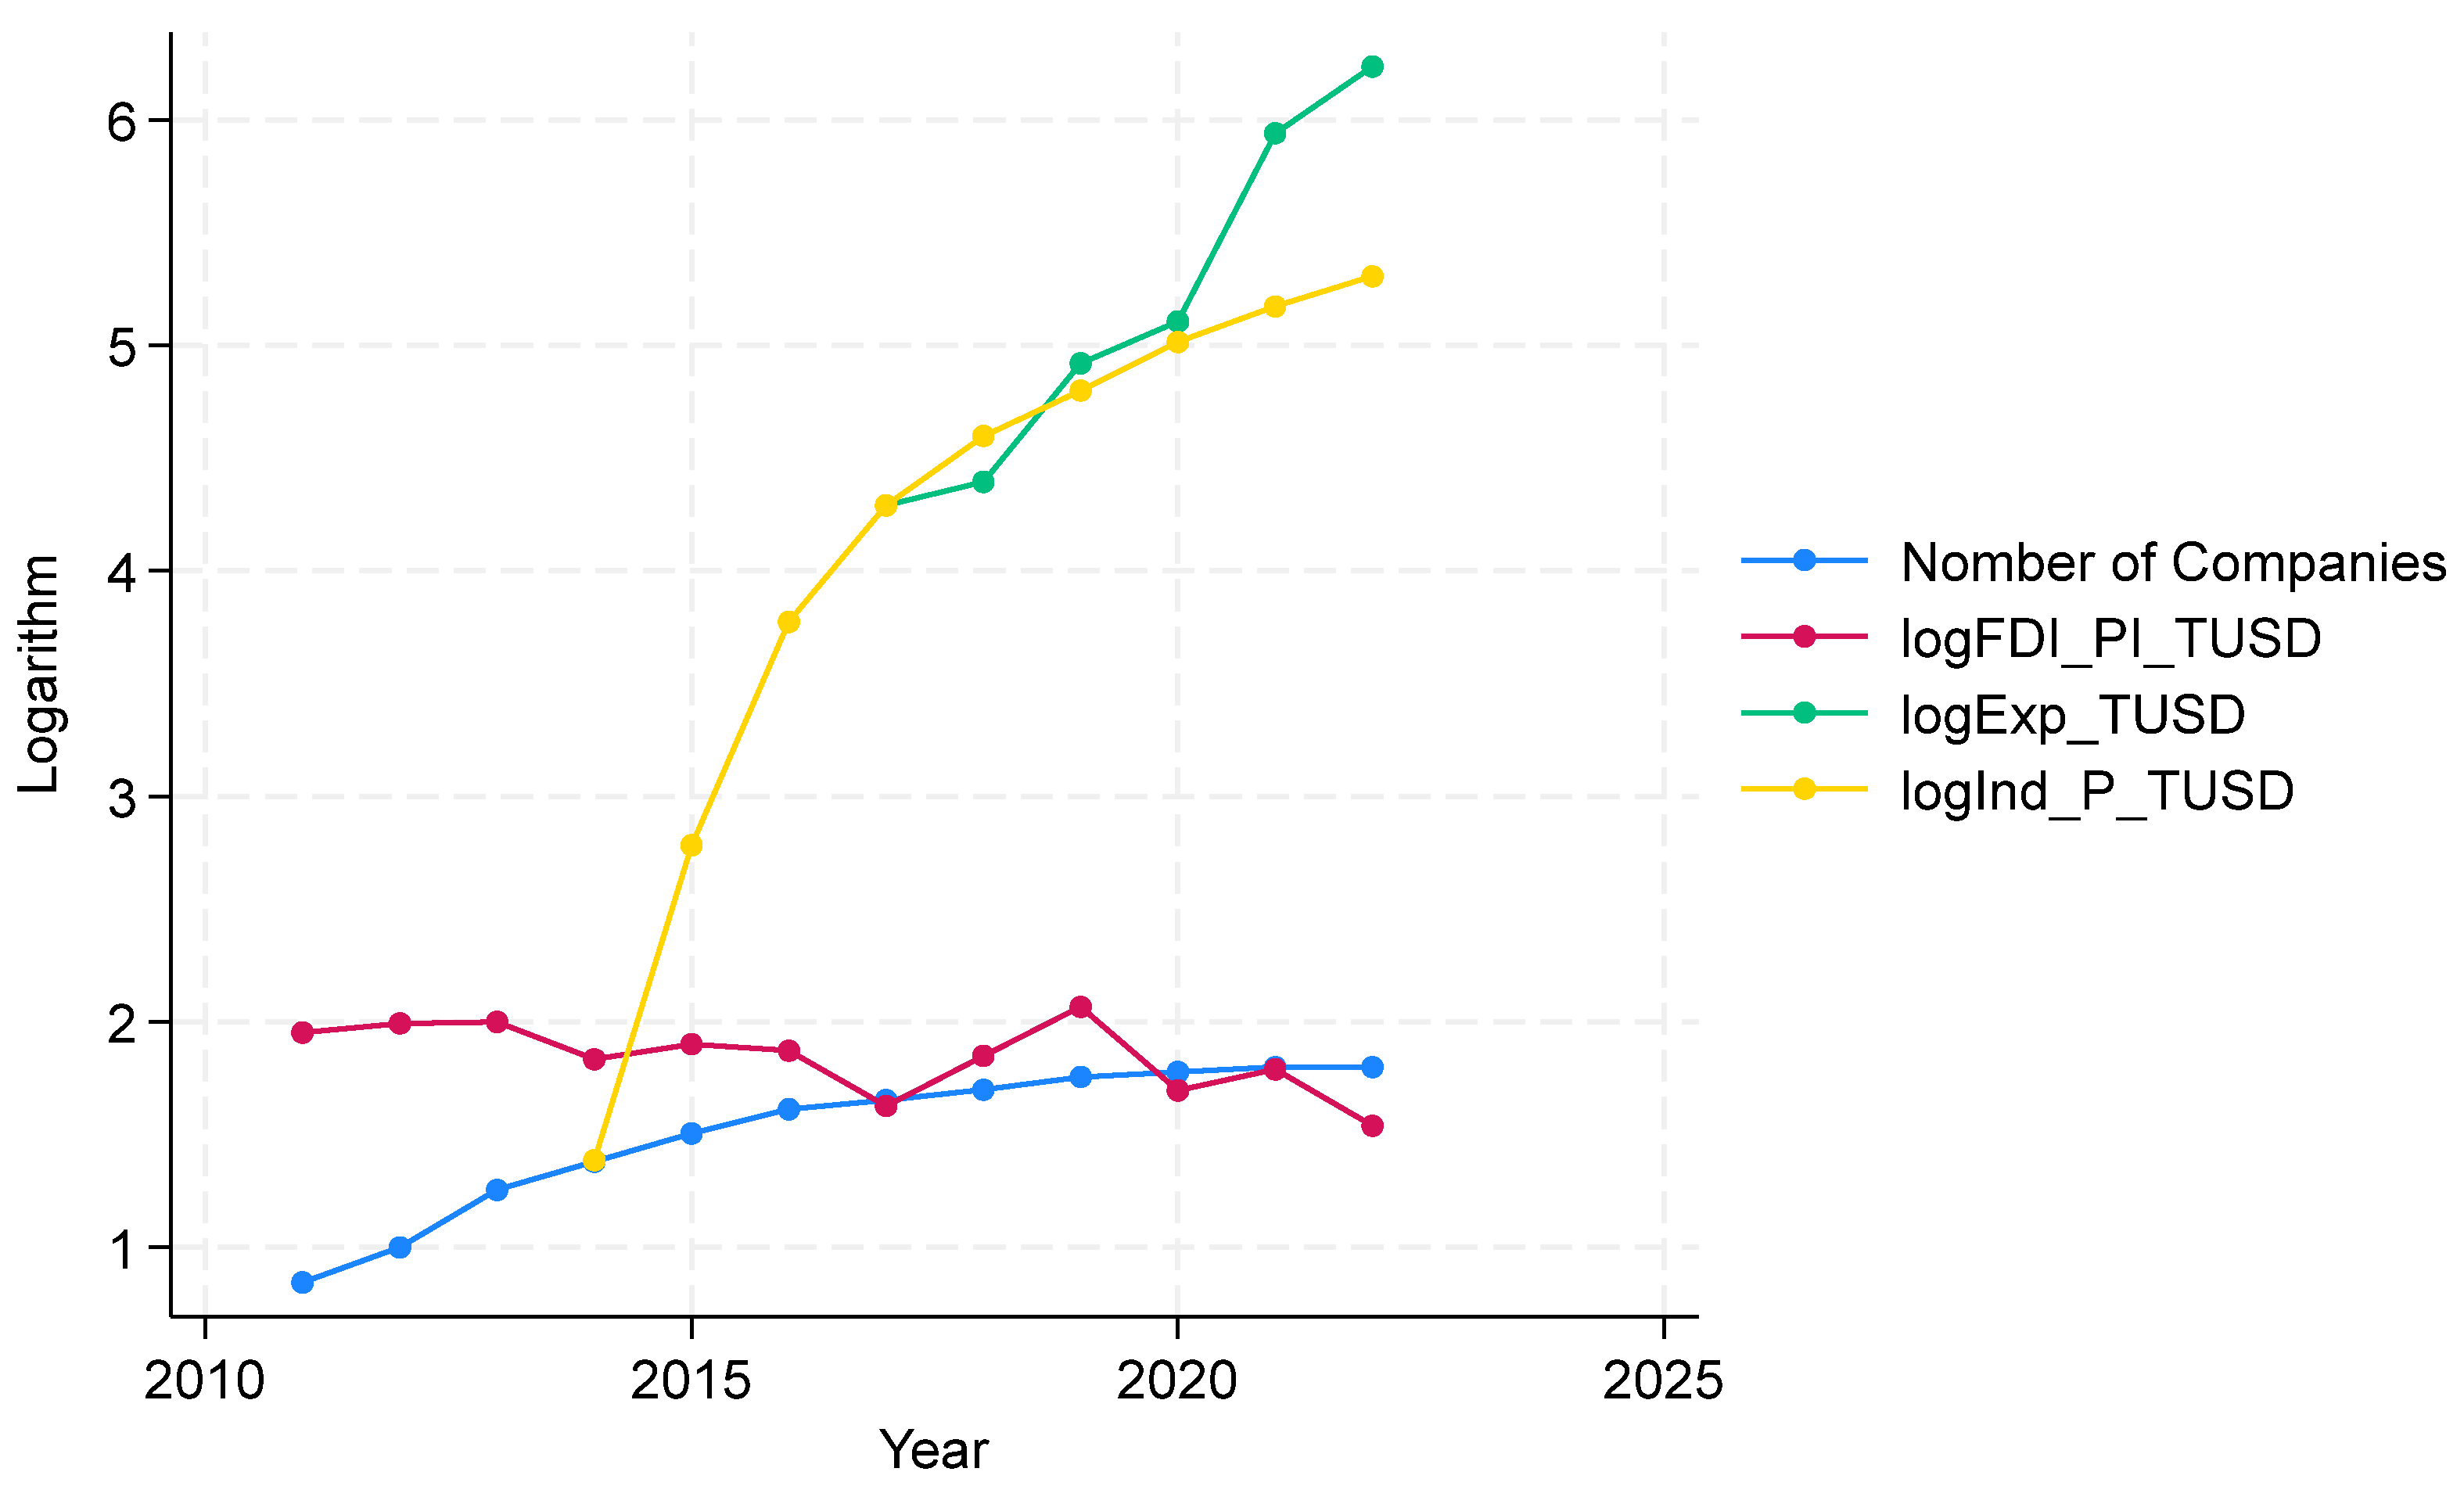
Figure 2.
Description of variables within the heterogeneous space.

Table 1.
Summary of studies on the effects of corporate agglomeration.
| Authors & Studies | Econometric approach | Main results | Reference |
|---|---|---|---|
| Krugman (1991) - "Increasing Returns and Economic Geography" (rising yields and economic geography) | Theoretical model with increasing returns and economies of scale | Agglomeration creates increasing returns, reducing production costs and encouraging innovation, leading to differences in growth between regions. | Krugman, P. (1991). Increasing Returns and Economic Geography. Journal of Political Economy. |
| Venables (1996) - "Equilibrium Locations of Vertically Related Industries". | Spatial competition model integrating transport costs and agglomeration effects | Agglomeration economies increase international competitiveness, reduce intermediation costs and stimulate exports. | Venables, A. J. (1996). Equilibrium Locations of Vertically Related Industries. International Economic Review. |
| Fujita, Krugman, Venables (1999) - "Spatial economics: Cities, regions and international trade". | Computable General Equilibrium (CGE) model | Agglomeration boosts productivity, improves international competitiveness and helps developing countries overcome barriers to exports. | Fujita, M., Krugman, P., & Venables, A. J. (1999). The Spatial Economy: Cities, Regions, and International Trade. MIT Press. |
| Michaels (2008) - "The Effect of Trade on the Demand for Skill". | Panel regressions | Industrial agglomerations foster innovation, increase exports and attract foreign investment. | Michaels, G. (2008). The Effect of Trade on the Demand for Skill. Review of Economics and Statistics. |
| Duranton & Puga (2004) - "Micro-foundations of Urban Agglomeration Economies". | Spatial modeling and panel data analysis | Agglomeration boosts productivity, innovation and specialization, providing a favorable environment for industrial investment and export growth. | Duranton, G. and Puga, D. (2004). Micro-foundations of Urban Agglomeration Economies. Handbook of Regional and Urban Economics. |
| Rodríguez-Clare (1996) - "The division of labor and economic development". | Theoretical model with panel data | Agglomeration economies enable greater specialization, stimulating exports and attracting foreign direct investment. | Rodríguez-Clare, A. (1996). The Division of Labor and Economic Development. Journal of Development Economics. |
Table 2.
Econometric approaches used in the studies:.
| Approach | Description |
|---|---|
| Panel regressions | Analysis of long-term effects, controlling for differences between countries and periods. |
| Computable general equilibrium (CGE) models | Simulation of the impact of agglomeration policies on the overall economy, including exports and growth. |
| Endogenous growth models | Integration of agglomerations to study their influence on innovation, productivity and exports. |
| Difference-in-difference (DiD) methods | Evaluate the effects of public policies by comparing regions before and after interventions. |
| Spatial models | Analysis of the transnational effects of conurbations, taking into account the interconnections between regions. |
Table 3.
Main results of the studies.
| Impact | Details |
|---|---|
| Industrial growth | Agglomeration promotes growth by improving productivity, specialization and innovation. |
| Investment | Attract foreign direct investment (FDI) by reducing production costs and facilitating access to industrial networks. |
| Exports | Increase exports through economies of scale and improved competitiveness. |
| Regional disparities | Agglomeration can increase inequality if benefits are concentrated in certain regions. |
Table 7.
Description of variables.
| Variables | Units | Descriptions | Sources |
|---|---|---|---|
| Nomber of Companies | Number of businesses: Number of businesses in the areas studied. | Source 1: Dashboard of the Gabonese economy (Link: http://www.dgepf.ga/23-publications/25-tableau-de-bord-de-l-economie/169-tableau-de-bord-de-l-economie/). | |
|
FDI+PI_T USD (Foreign direct investment + Total public investment) |
Millions of dollars (USD) | (Foreign direct investment (FDI) plus total public investment in the construction, management and development of the Nkok SEZ). Rated: FDI+PI_TUSD. |
Source 2: EY and Mays Mouissi Consulting (2023) (Link: https://www.mays-mouissi.com/?utm). |
|
Exp_T USD (Export income) |
Millions of dollars (USD) | Total exports, in millions of dollars, represent Gabon's export earnings from wood products. Noted : Exp_T USD. |
Source 3 : FAOSTAT (Link : https://www.fao.org/faostat/en/#data/FO). |
|
Ind_P_TUSD (Industrial income) |
Millions of dollars (USD) | Total industrial production by value (million USD), represents the sum total of industrial revenues from companies in the timber forestry sector in Gabon. Rated : Ind_P_TUSD. | Source 3: FAOSTAT (Link : https://www.fao.org/faostat/en/#data/FO). |
Table 8.
Static effects of spatial agglomeration of companies
| (1) | (2) | |
| VARIABLES | In the Nkok SEZ (homogeneous space) | Out Nkok SEZ (heterogeneous space) |
| Dependant Variable (Nomber of Companies) | ||
| LogExp_TUSD | 0.410*** | 0.132* |
| (0.001) | (0.062) | |
| LogInd_P_TUSD | 0.730*** | 0.157*** |
| (0.001) | (0.010) | |
| Constant | 1.016*** | 0.440 |
| (0.005) | (0.407) | |
| Comments (N) | 12 | 12 |
| R-squared | 0.999 | 0.986 |
Standard errors in brackets*** p<0.01, ** p<0.05, * p<0.1
Table 9.
Foreign direct investment (FDI) associated with public investment.
| (1) | (2) | (3) | |
| Independent variables | In SEZ of Nkok | Out SEZ of Nkok | Macroenvironment |
| Dependent variable (LogFDI_PI_TUSD) | |||
| L.LogFDI_PI_TUSD | 0.093*** | -0.276*** | -0.262*** |
| (0.019) | (0.088) | (0.078) | |
| Nomber of Companies | 2.350*** | 1.106*** | 1.576*** |
| (0.772) | (0.189) | (0.427) | |
| LogExp_TUSD | -0.114 | -0.115*** | -0.045 |
| (0.086) | (0.041) | (0.055) | |
| LogInd_P_TUSD | -0.243*** | -0.249*** | -0.244*** |
| (0.030) | (0.003) | (0.037) | |
| Constant | -0.164 | 2.197*** | 0.757 |
| (1.025) | (0.528) | (0.655) | |
| Autocorrelation order 1 | -1.4138 (0.1574) | -1.4135 (0.1575) | -1.7239 (0.1247) |
| Autocorrelation order 2 | 0.9171 (0.3591) | -1.1573 (0.2471) | -1.2262 (0.2201) |
| (N/T) | 2/16 | 2/16 | 3/24 |
Standard errors in brackets*** p<0.01, ** p<0.05, * p<0.1.
Table 10.
Summary of DGMUG's Strategic Criteria and Strengthening Tools.
| Phase / Scenario | Strategic criteria | Reinforcement Tools and Models | Description |
|---|---|---|---|
| Phase 0: Start-up requirements | Public and private initiatives | SWOT analysis | Identify opportunities and threats to better guide decisions. |
| Public-Private Partnerships (PPP) | SEZ Strategic Planning Methods | Involvement of local and international players for balanced alliances. | |
| Attractive tax and customs framework | SEZ profitability assessment models (UNIDO, 2009) | Assessing the economic, social and environmental impact of tax exemptions. | |
| Appropriate regulatory framework | Performance Scorecards (PSC) | Monitoring the regulatory stability and attractiveness of SEZs. | |
| Simplified administrative procedures | SWOT analysis | Identification of bureaucratic obstacles and optimization solutions. | |
| Strategic planning | SEZ Strategic Planning Methods | Integration of a participative and interactive governance model. | |
| Strategic market intelligence | Simulations and Modeling of Economic Impacts | Forecasts of economic and industrial trends. | |
| Strategic infrastructure | Geographic Information Systems (GIS) | Mapping of existing infrastructures and identification of strategic locations. | |
| Power industries | Cost-Benefit Analysis (CBA) models | Evaluation of priority industries to maximize return on investment. | |
| Secondary industries | SEZ profitability assessment models | Value chain analysis and support for complementary industries. | |
| Propelled businesses and industries | Strategic Planning & SWOT | Organization of upstream and downstream value chains. | |
| Strategic location | Geographic Information Systems (GIS) | Better spatial management of development hubs. | |
| Innovation system | SEZ Strategic Planning Methods | Strategy for capturing and managing technological innovation. | |
| Collaborative framework between stakeholders | Performance Scorecards (PSC) | Monitoring interactions between governments, companies and research institutions. | |
| Cognitive system (R&D, incubators, universities, laboratories) | Performance Scorecards (PSC) | Monitoring R&D initiatives and the impact of incubators and universities. | |
| Satisfactory social policies | SWOT analysis | Reducing inequalities and improving working conditions. | |
| Satisfactory corporate policies | Performance Scorecards (PSC) | Monitoring social inclusion and participation of local populations. | |
| Phase 1 : Acceleration | Scenario 1 : Lethal | SWOT & CBA analysis | Identify causes of failure and make strategic adjustments. |
| Scenario 2 : Stagnation | Performance scorecards (PSC), CBA | Assessment of investment and infrastructure delays. | |
| Scenario 3 : Acceleration and diversification | Economic Impact Simulations & Modeling | Industry expansion forecasts and economic impact. | |
| Phase 2 : Transition to equilibrium | Scenario 1 : Depolarization | Performance Dashboards, Profitability Evaluation Models | Monitoring the impact of company departures and readjusting policies. |
| Scenario 2 : Transition to equilibrium | Strategic Planning, GIS, Economic Impact Modeling | Monitoring industrial diversification and economic stabilization. |
Disclaimer/Publisher’s Note: The statements, opinions and data contained in all publications are solely those of the individual author(s) and contributor(s) and not of MDPI and/or the editor(s). MDPI and/or the editor(s) disclaim responsibility for any injury to people or property resulting from any ideas, methods, instructions or products referred to in the content. |
© 2025 by the authors. Licensee MDPI, Basel, Switzerland. This article is an open access article distributed under the terms and conditions of the Creative Commons Attribution (CC BY) license (http://creativecommons.org/licenses/by/4.0/).
Copyright: This open access article is published under a Creative Commons CC BY 4.0 license, which permit the free download, distribution, and reuse, provided that the author and preprint are cited in any reuse.


