Submitted:
09 May 2025
Posted:
09 May 2025
You are already at the latest version
Abstract
Background: Atherosclerosis (AS) is a vascular disease driven by lipid deposition and chronic inflammation, with pathogenesis linked to genetic and immune dysregulation. This study aimed to systematically identify AS-associated genes, elucidate their molecular mechanisms, and explore therapeutic targets by integrating multi-omics analyses and experimental validation. Methods: AS-associated genes were screened through differential gene expression analysis of Gene Expression Omnibus (GEO) datasets and expression quantitative trait loci (eQTL)-based Mendelian randomization (MR) analysis to infer causal relationships. Functional insights were derived from Gene Ontology (GO) and Gene Set Enrichment Analysis (GSEA). Experimental validation included quantitative real-time PCR (qPCR), Western blotting, and immunohistochemistry in oxidized low-density lipoprotein (ox-LDL)-stimulated macrophages and apolipoprotein E-deficient (ApoE-/-) mouse models. Results: CLEC5A and ISG20 were significantly upregulated in AS patients, with MR confirming their positive causal associations with AS risk (CLEC5A: OR=1.001, P=0.047; ISG20: OR=1.001, P=0.030), while HOXA2 showed a negative association.Functional enrichment linked CLEC5A and ISG20 to immune activation, inflammatory pathways, and lipid metabolism.Experimental validation revealed marked ISG20 upregulation in ox-LDL-stimulated macrophages (P< 0.01) and aortic tissues of ApoE-/- mice, with immunohistochemistry localizing its high expression to endothelial layers and macrophage-rich regions of AS plaques. Conclusions: This study identifies ISG20 as a novel pro-atherogenic factor and potential therapeutic target, while CLEC5A and HOXA2 underscore the genetic-immune interplay in AS pathogenesis. These findings advance mechanistic insights and provide a foundation for targeted interventions.
Keywords:
Atherosclerosis
; Mendelian randomization
; Expression quantitative trait locus (eQTL) analysis
; CLEC5A
; ISG20
; Macrophages
1. Introduction
Atherosclerosis (AS) is a chronic inflammatory vascular disease characterized by lipid accumulation in the arterial wall and inflammatory cell infiltration, ultimately leading to vascular stenosis and atherosclerotic plaque formation [1]. This pathological process serves as the primary etiology of cardiovascular diseases (CVD), which remain a leading global cause of mortality and disability. Despite advances in research, the pathogenesis of AS remains elusive, driven by multifaceted interactions among genetic susceptibility and environmental triggers. Consequently, systematic identification of molecular regulators governing atherosclerotic plaque dynamics is essential to pioneer targeted therapies.
Recent years have seen significant advancements in atherosclerosis research. The role of immune mechanisms in this disease has been increasingly recognized, with studies demonstrating that diverse immune cells—including macrophages, T cells, and dendritic cells—play pivotal roles in disease progression [2]. Inflammatory biomarkers such as C-reactive protein (CRP) and interleukins (ILs) have demonstrated clinical utility in both diagnosis and prognostic assessment of atherosclerosis [3]. From a pathophysiological perspective, the critical involvement of inflammatory responses in driving disease progression has received considerable attention. Specifically, immune cell activation and subsequent inflammatory cytokine release have been shown to directly contribute to plaque destabilization [3]. Moreover, cutting-edge technologies like single-cell RNA sequencing (scRNA-seq) have unveiled the heterogeneity of macrophages and monocytes within atherosclerotic lesions, providing transformative perspectives for understanding disease pathogenesis [4].
Genetic factors are pivotal contributors to the pathogenesis of atherosclerosis. Studies have established that specific genetic polymorphisms contribute to atherosclerosis development. Of particular significance, variants in the proprotein convertalisin subtilisin/kexin type 9 (PCSK9) gene directly influence low-density lipoprotein cholesterol (LDL-C) metabolism and significantly increase atherosclerosis risk [5]. Emerging epigenetic research has established that DNA methylation dynamics and histone modifications are central regulatory mechanisms in atherosclerosis pathogenesis. Disease progression is mechanistically linked to dysregulated DNA methylation patterns, where promoter hypermethylation of anti-inflammatory genes coexists with global hypomethylation in pro-atherogenic regions [6]. These epigenetic modifications disrupt transcriptional homeostasis, directly driving atherosclerotic plaque progression through sustained activation of pro-inflammatory pathways.
In recent years, the rapid development of genetic analytical technologies has provided powerful tools for investigating the genetic basis of atherosclerosis. Expression quantitative trait loci (eQTL) analysis, a cornerstone of functional genomics, systematically maps cis-regulatory variants that quantitatively modulate transcriptional activity [7]. This approach identifies causal genetic polymorphisms influencing mRNA abundance, thereby mechanistically linking non-coding SNPs to disease etiology through transcriptome-wide association studies (TWAS). Mendelian randomization (MR) applies genetically proxied instrumental variables through mendelian inheritance principles to establish causal effects of modifiable exposures on disease endpoints. This instrumental variable analysis effectively mitigates residual confounding and reverse causation biases pervasive in observational epidemiology, contingent upon satisfying three core assumptions: genetic variant-exposure association, exclusion restriction, and independence from pleiotropic pathways [8].
The GEO (Gene Expression Omnibus) database represents a pivotal repository of gene expression data, providing researchers with detailed sample metadata. Through integration of expression quantitative trait loci (eQTL) analyses with Mendelian randomization approaches, this platform facilitates robust discovery of atherosclerosis-associated genes in large-scale genomic datasets. These integrative strategies not only elucidate the genetic architecture underlying disease pathogenesis but also provide novel mechanistic insights to inform translational research and therapeutic development. Through integration of GEO-derived expression quantitative trait loci (eQTL) data with Mendelian randomization frameworks, we report the novel identification of CLEC5A and ISG20 as susceptibility genes exhibiting genetically proxied causal associations with atherosclerosis pathogenesis. These candidate biomarkers hold promise as clinically actionable diagnostic biomarkers, with their encoded proteins emerging as potential therapeutic targets. This dual functional characterization offers innovative translational opportunities for precision risk stratification and targeted intervention in atherosclerotic cardiovascular disease.
2. Materials and Methods
2.1. GEO Data Collection
Gene expression datasets associated with atherosclerosis were obtained from the Gene Expression Omnibus (GEO) database (https://www.ncbi.nlm.nih.gov/geo/). The search strategy utilized the keywords "atherosclerosis" and "plaque" with species restriction to Homo sapiens. Datasets meeting the following inclusion criteria were selected:Minimum sample size of 20 per dataset;vailability of both raw and normalized high-quality data;Comparative experimental design comprising case groups (patients with atherosclerosis) and control groups (healthy donors or non-atherosclerotic subjects);Microarray-based expression profiles with platform-matched probe annotation files.
2.2. Data Preprocessing and DEG Identification
Raw data from datasets GSE9820, GSE34822, GSE40231, and GSE100927 were processed using R software (version 4.3.2). Initial preprocessing included batch effect correction for individual datasets. Subsequently, the four datasets were merged, and batch effects were further minimized using the ComBat function from the sva package. High-dimensional data were reduced to a three-dimensional space through principal component analysis (PCA) for visualization.Differentially expressed genes (DEGs) were identified using the limma package, with significance thresholds set at an adjusted P-value < 0.05 and absolute logfold change (logFC) > 0.585. Results were visualized via volcano plots and heatmaps to illustrate differential expression patterns.
2.3. Preparation of Exposure Data (Gene eQTL Data)
To identify genetic variants associated with gene expression, this study utilized summary-level gene expression quantitative trait loci (eQTL) data from the GWAS Catalog (https://gwas.mrcieu.ac.uk/) as exposure data, with all datasets derived from European ancestry populations. The R package "TwoSampleMR" was employed to select strongly associated single nucleotide polymorphisms (SNPs) meeting a genome-wide significance threshold (p<5e-08) as instrumental variables. Linkage disequilibrium (LD) clumping was performed using parameters of r2 < 0.001and a window size of 10,000 kb, thereby excluding SNPs within 10,000 kb that exhibited LD (r2<0.001) with the index SNP. SNPs with weak instrument bias (F-statistic < 10) were excluded to ensure robust causal inference.
2.4. Outcome Data Preparation
Outcome data were obtained from the IEU OpenGWAS database (https://gwas.mrcieu.ac.uk/), a repository of genome-wide association study (GWAS) summary statistics. The specific GWAS dataset (ID: ukb-d-I9_CORATHER) comprised 361,194 samples, including 346,860 controls of European ancestry, and contained 13,586,589 single nucleotide polymorphisms (SNPs). All GWAS summary statistics used in this study are publicly available and freely downloadable. Ethical approval for this study was waived as it relied solely on de-identified, aggregate-level genetic data from pre-existing resources.
2.5. Mendelian Randomization Analysis
Mendelian randomization (MR) analyses were performed using the "TwoSampleMR" R package. Five MR methods were employed: MR-Egger, Weighted median, Inverse-variance weighted (IVW), Simple mode, and Weighted mode, to infer causal relationships between genetic instruments and atherosclerotic outcomes. Genes associated with atherosclerosis were identified through a three-step filtering strategy:IVW-derived P < 0.05;Concordant odds ratio (OR) directions across all five methods;Removal of genes exhibiting horizontal pleiotropy (P < 0.05 in MR-Egger intercept test or MR-PRESSO global test).Genes surviving these filters were considered robustly associated with atherosclerosis pathogenesis.
2.6. Identification of Overlapping Genes
Key genes associated with atherosclerosis (AS) were identified by intersecting the results of differential expression analysis and Mendelian randomization (MR) analysis. Specifically, upregulated genes were intersected with high-risk genes (odds ratio [OR] > 1), and downregulated genes were intersected with low-risk genes (OR < 1), yielding overlapping upregulated and downregulated gene sets. The intersection results were visualized using Venn diagrams to illustrate the shared genetic signatures between analytical approaches.
2.7. Mendelian Randomization Analysis of Overlapping Genes
The overlapping genes identified through cross-analysis—comprising upregulated and downregulated genes—were further subjected to Mendelian randomization (MR) analysis to determine their causal relationships with atherosclerotic outcomes. In these analyses, the overlapping genes served as exposures, and disease status (AS) was modeled as the outcome. The analytical framework included:Heterogeneity assessment using Cochran’s Q test;Horizontal pleiotropy evaluation via MR-Egger intercept and MR-PRESSO global tests;Sensitivity validation through leave-one-out analysis to identify influential SNPs.Robustness of causal estimates was further confirmed by consistency across MR methods (IVW, weighted median, MR-Egger). Results were visualized using scatter plots (exposure-outcome associations), forest plots (effect size consistency), and funnel plots (symmetry of genetic instrument effects).
2.8. GO and GSEA Enrichment Analysis
Gene Ontology (GO) enrichment analysis is a pivotal method for elucidating gene functions and biological pathways. Key genes were functionally annotated and subjected to GO enrichment analysis using Bioconductor packages, including clusterProfiler, to identify potential functional pathways and pathogenic mechanisms. Bioconductor packages specialize in statistical analysis and interpretation of high-throughput genomic data. Enrichment significance was filtered at an adjusted P-value < 0.05.
Gene Set Enrichment Analysis (GSEA) was employed to determine whether predefined biological functions or pathways associated with key genes were enriched at the top or bottom of the ranked gene list, reflecting upregulated or downregulated trends, respectively. GSEA further investigated the activity levels of related functions or pathways within transcriptomic profiles. Significance thresholds were set at a nominal P-value < 0.05, with false discovery rate (FDR) < 0.25 applied to identify statistically enriched gene sets.
2.9. Immune Cell Infiltration Analysis
The relative abundance of immune cell subtypes within each sample was quantified using computational deconvolution algorithms. Specifically, the CIBERSORT algorithm implemented in R software was applied to transcriptomic profiles to estimate immune cell proportions. CIBERSORT employs a predefined reference gene expression signature matrix encompassing 22 immune cell types, including seven T-cell subsets (e.g., naive, memory, regulatory), B-cell lineages (naive B cells, memory B cells, plasma cells), natural killer (NK) cells, and myeloid subpopulations. Permutations (n = 1000) were performed to validate the robustness of the deconvolution results.The output provided the relative proportions of each immune cell type across samples, visualized via stacked bar plots to illustrate inter-sample heterogeneity in immune infiltration. Furthermore, Pearson correlation analysis was conducted to explore associations between immune cell abundances and key gene expression levels, with results visualized using heatmaps and correlation matrices.
2.10. Validation Cohort Differential Analysis
Raw data from dataset GSE28829 were processed and quality-controlled using R software (version 4.3.2). Differential expression analysis of key genes between the control and experimental groups was performed to validate their disease association. Validation results were systematically compared with prior Mendelian randomization (MR) findings to assess consistency. Statistical significance was evaluated using Student’s t-test (adjusted P < 0.05) and effect size concordance (logFC).
2.11. Experimental Validation
2.11.1. Experimental Animals
All animal experiments were conducted in accordance with protocols approved by the Institutional Animal Care and Use Committee (IACUC) of Guizhou Medical University. Six mice aged 5–8 weeks, including three ApoE-/- mice (generously provided by Dr. Hailong Ou) and three C57BL/6J wild-type mice, were assigned to atherosclerosis (AS) model and control groups. Mice were housed in a specific pathogen-free (SPF) facility at the Animal Laboratory of the Stem Cell Research Center, Guizhou Medical University. ApoE-/- mice were fed a high-fat diet (HFD) (40% fat, 1.25% cholesterol; Beijing Botai Honggang Biotechnology Co., Ltd., #1140B) for 8 weeks, while wild-type mice received a standard chow diet. Aortic tissues were harvested following euthanasia for downstream analyses.
2.11.2. Histology and Immunostaining
Serial sections (5μm thickness) of paraffin-embedded aortic sinus lesions were prepared using a microtome. Sections were deparaffinized, rehydrated, and subjected to antigen retrieval. Non-specific staining was blocked with 3% hydrogen peroxide, followed by incubation with 10% goat serum for 1 hour. Sections were then incubated with ISG-20 primary antibody (1:200 dilution; San Ying, Wuhan, China) at 4℃ ovenight. After washing, sections were incubated with HRP-conjugated secondary antibody (1:1000 dilution; Saierwei, Wuhan, China) for 60 minutes. Negative controls were prepared by omitting the primary antibody.Color development was performed using 3,3′-diaminobenzidine (DAB), followed by counterstaining with hematoxylin, differentiation, dehydration, and mounting with neutral resin. All immunostained images were captured using a bright-field microscope and analyzed for staining intensity with ImageJ software (NIH, USA).
2.11.3. Cell Culture
To investigate ISG20 expression at the cellular level, RAW264.7 macrophages (a murine macrophage cell line) were cultured in high-glucose DMEM medium supplemented with 10% fetal bovine serum (FBS), 50 U/mL penicillin, and 50 U/mL streptomycin. When cells reached 40–50% confluency, theywere stimulated with 100μg/mL oxidized low-density lipoprotein (ox-LDL)
(Solarbio, Beijing, China) for 24 hours. Post-stimulation, total protein and RNA were extracted for subsequent Western blotting and quantitative real-time polymerase chain reaction (RT-qPCR) analyses.
2.11.4. Western Blotting
The protein concentrations of all macrophage lysates were quantified using the bicinchoninic acid (BCA) assay. Normalized protein samples were resuspended in SDS sample buffer and separated by sodium dodecyl sulfate–polyacrylamide gel electrophoresis (SDS-PAGE). Proteins were then transferred onto polyvinylidene difluoride (PVDF) membranes. After blocking with 5% non-fat milk for 2 hours, membranes were incubated with diluted primary antibodies under gentle agitation at 4℃ overnight. Following washing, membranes were incubated with horseradish peroxidase (HRP)-conjugated secondary antibodies at room temperature for 1 hour. Protein bands were visualized using an enhanced chemiluminescence (ECL) system (NeoBioscience, Suzhou, China) and quantified via densitometric analysis using ImageJ software (National Institutes of Health, USA).
2.11.5. Quantitative Real-Time Polymerase Chain Reaction (RT-qPCR)
The total RNA from the macrophages was isolated using the Total RNA Extraction Kit (NeoBioscience, Suzhou, China). For reverse transcription, 1 μg of total RNA was converted to first-strand complementary DNA (cDNA) in a 20μL reaction volume using the Reverse Transcription Kit (Yeasen, Shanghai, China) according to the manufacturer's protocol. SYBR Green-based RT-qPCR (Yeasen, Shanghai, China) was performed on a QuantStudio 3 Real-Time PCR System (Thermo Fisher Scientific, USA). Gene expression levels were normalised to GAPDH, and data were analysed using GraphPad Prism 9.5 (GraphPad Software, USA).The following primers were used:
The sequences for the forward and reverse primers for the mouse GAPDH gene are 5′-GGTTGTCTCCTGCGACTTCA-3′and 5′-TGGTCCAGGGTTTCTTACTCC-3′, respectively. The sequences for the forward and reverse primers for the mouse ISG20 gene are 5′-TGGGCCTCAAAGGGTGAGT-3′and 5′-CGGGTCGGATGTACTTGTCATA-3′, respectively.
3. Results
3.1. Overview of Five GEO Datasets
This study utilized four merged microarray datasets from the Gene Expression Omnibus (GEO) database as the experimental cohort and one independent dataset as the validation cohort. The experimental cohort comprised 212 disease samples (atherosclerotic lesions) and 335 healthy controls, while the validation cohort included 16 disease samples and 13 healthy controls.For the validation cohort, gene expression values were normalized and merged using R software (version 4.3.2). Batch effects were mitigated through principal component analysis (PCA) to ensure data homogeneity, thereby enhancing the accuracy and reliability of downstream analyses (see Supplementary Figure S1)
3.2. Identification of Differentially Expressed Genes (DEGs)
The results demonstrated that smaller P-values corresponded to higher reliability in gene ranking and differential expression. A total of 98 upregulated DEGs and 25 downregulated DEGs were identified (see Supplementary Table S1 for detailed gene annotations).A heatmap (Figure 1) visualized the expression patterns of the top 50 upregulated DEGs and all 25 downregulated DEGs, revealing distinct clustering between atherosclerotic and control samples. The volcano plot (Figure 2) further illustrated genome-wide differential expression across the integrated GEO datasets, highlighting genes surpassing the significance threshold (adjusted P < 0.05,logFC> 0.585).
3.3. Mendelian Randomization (MR) Analysis
After stringent filtering, 25,224 SNPs were retained as instrumental variables (IVs), all satisfying the three core assumptions of Mendelian randomization. All selected SNPs exhibited F-statistics > 10 (see Supplementary Table S2 for detailed SNP characteristics). Using MR analysis and five predefined filtering criteria, we identified 319 atherosclerosis-associated genes (annotated in Supplementary Table S3). Cross-analysis further revealed three overlapping genes between disease-related genes and MR-derived eQTL results: two upregulated genes (CLEC5A, ISG20) and one downregulated gene (HOXA2) (Figure 3).
Subsequent MR analysis of these key genes demonstrated their causal effects on atherosclerosis. Inverse-variance weighted (IVW) analysis revealed significant positive causal associations for upregulated genes:CLEC5A: OR = 1.001 (95% CI: 1.001–1.005; P = 0.047),ISG20: OR = 1.001 (95% CI: 1.002–1.007; P = 0.030).Conversely, the downregulated gene exhibited a significant negative causal association:HOXA2: OR = 0.997 (95% CI: 0.997–0.998; P = 0.016),Consistently, all MR methods confirmed increased disease risk for upregulated genes (OR > 1) and reduced risk for the downregulated gene (OR < 1) (Figure 4).Heterogeneity (Cochran’s Q test, P > 0.05) and horizontal pleiotropy (MR-Egger intercept test, P > 0.05) analyses revealed no significant bias, indicating negligible confounding effects from these sources. Sensitivity analyses via the leave-one-out method demonstrated that sequential exclusion of individual SNPs did not markedly influence effect estimates, thereby supporting the robustness of the causal inferences (see Supplementary Table S4 for full results).
Visual summaries of the three prioritized genes—including scatter plots (exposure-outcome linearity), forest plots (effect size consistency), funnel plots (instrument symmetry), and leave-one-out sensitivity trajectories—are consolidated in Figure 5. Chromosomal locations of these genes were annotated on a circular genomic ontology (GO) map (Figure 6), elucidating their functional and positional relevance within the genome.
3.4. GO and GSEA Enrichment Analysis
Through Gene Ontology (GO) and Gene Set Enrichment Analysis (GSEA), we further investigated the functional implications of these three key genes. GO enrichment analysis revealed that the genes are predominantly involved in biological processes such as osteoblast development and differentiation, viral assembly and life cycle regulation, and negative regulation of myeloid cell apoptosis (see Supplementary Figure S2A–C).
Gene Set Enrichment Analysis (GSEA) revealed distinct pathway activation patterns associated with expression levels of the three key genes. For CLEC5A, the high-expression group showed prominent activation of immune-related pathways including chemokine signaling, cytokine-cytokine receptor interaction, Leishmania infection response, lysosomal activity, and Toll-like receptor signaling (Supplementary Figure S3), while the low-expression group displayed enhanced DNA maintenance mechanisms through base excision repair, mismatch repair, and nucleotide metabolism (purine/pyrimidine) alongside ribosome biogenesis. ISG20 exhibited divergent functional profiles: its high-expression state was characterized by cell cycle regulation, recurrent cytokine-cytokine receptor interaction, JAK-STAT signaling, and T-cell receptor activation (Supplementary Figure S4), contrasted by the low-expression group's metabolic specialization in lysosomal functions, glycosaminoglycan catabolism, oxidative phosphorylation, and coordinated degradation of porphyrin/chlorophyll metabolites and branched-chain amino acids (valine/leucine/isoleucine). Notably, HOXA2 demonstrated unique immunological associations in its high-expression group, with pathway activation spanning asthma pathogenesis, complement-coagulation cascades, ECM-receptor interactions, and systemic lupus erythematosus markers (Supplementary Figure S5), whereas no statistically significant pathway enrichment was observed in its low-expression counterpart.
Functional enrichment analysis further delineated the biological processes influenced by these genes. For CLEC5A, the high-expression group exhibited activation of immune-related processes including cellular response to biotic stimuli, granulocyte migration (specifically neutrophil migration), regulation of tumor necrosis factor superfamily signaling, and positive regulation of immune activation, while the low-expression group showed predominant enrichment in cellular components such as ribosome structure and ribosomal subunits (Supplementary Figure S6A). ISG20 demonstrated distinct functional polarization, with its high-expression group associated with positive regulation of leukocyte adhesion and T-cell activation, contrasting with the low-expression group's enrichment in metabolic processes including lipid catabolism, monocarboxylic acid metabolism, ficolin-1-rich granule formation, and vacuolar membrane reorganization (Supplementary Figure S6B). Notably, HOXA2 displayed unique functional patterns: high-expression profiles were linked to extracellular matrix organization through protein complexes involved in cell adhesion and integrin binding, along with primitive germ layer formation, whereas low-expression states correlated with specialized transport processes (aromatic compound transport and copper detoxification) and enhanced regulation of reactive oxygen species biosynthesis (Supplementary Figure S6C).
3.5. Immune Cell Infiltration Analysis
The CIBERSORT deconvolution algorithm was systematically applied to quantify immune cell infiltration landscapes and delineate associations between co-expressed genes and immunophenotypic profiles in atherosclerosis. Comprehensive immune profiling across all samples revealed heterogeneous distributions of 22 immune cell subtypes, with notable depletion of naïve B cells (CD19+CD27−IgD+) and follicular helper T cells (CD4+CXCR5+PD-1+) in atherosclerotic (AS) lesions compared to control tissues (P < 0.01, Figure 7A,B).Correlation analysis with the 22 immune cell types (Figure 7C) revealed distinct association patterns for the co-expressed genes.Specifically, CLEC5A demonstrated significant positive correlations with pro-inflammatory immune cells: strong positive correlations with M1 macrophages (Cor≥0.4, p<0.05), activated neutrophils (Cor≥0.4), and activated CD8+ T cells (Cor=0.25), suggesting its critical role in inflammatory responses. Concurrently, it exhibited significant negative correlations with regulatory T cells (Tregs, Cor=-0.5, p<0.05) and M2 macrophages (Cor=-0.25), indicating its potential to promote inflammatory progression by suppressing immunosuppressive microenvironments. ISG20 displayed broad associations with adaptive immune cells, showing moderate-to-strong positive correlations (p<0.05) with activated dendritic cells (Cor=0.4–0.6), activated NK cells (Cor=0.25–0.4), and activated CD4+ memory T cell subsets (Cor=0.2–0.4), suggesting its involvement in antigen presentation and antiviral immune regulation. Conversely, weak negative correlations were observed with resting mast cells (Cor=-0.25) and M0 macrophages (Cor=-0.2), implying potential regulation by cellular activation states. In contrast, HOXA2 exhibited a heterogeneous anti-inflammatory signature, positively correlating with eosinophils (Cor≥0.4), resting dendritic cells (Cor=0.25–0.4), and M2 macrophages (Cor=0.2–0.4) (p<0.05), but inversely associating with activated CD4+ memory T cells (Cor=-0.25) and neutrophils (Cor=-0.2), highlighting its potential in maintaining immune homeostasis through balancing pro- and anti-inflammatory cell subsets. Collectively, these findings underscore that CLEC5A, ISG20, and HOXA2 orchestrate immune dynamics through divergent mechanisms—pro-inflammatory activation, adaptive immune modulation, and anti-inflammatory equilibrium, respectively—thereby providing molecular insights into immune crosstalk within pathological microenvironments.
3.6. Validation Cohort Differential Analysis
Following data annotation and quality control of dataset GSE28829 (validation cohort), the expression levels of the three key genes were validated. Results demonstrated that the upregulated genes CLEC5A and ISG20 exhibited significantly higher expression in the experimental group (atherosclerosis samples) compared to healthy controls (P < 0.01 and P < 0.05, respectively). In contrast, the downregulated gene HOXA2 showed no significant differential expression between experimental and control groups (Figure 8).
3.7. Experimental Validation
We experimentally validated the prioritized gene ISG20 through both cellular and animal models.
3.7.1. ISG20 Expression in Foam Macrophages
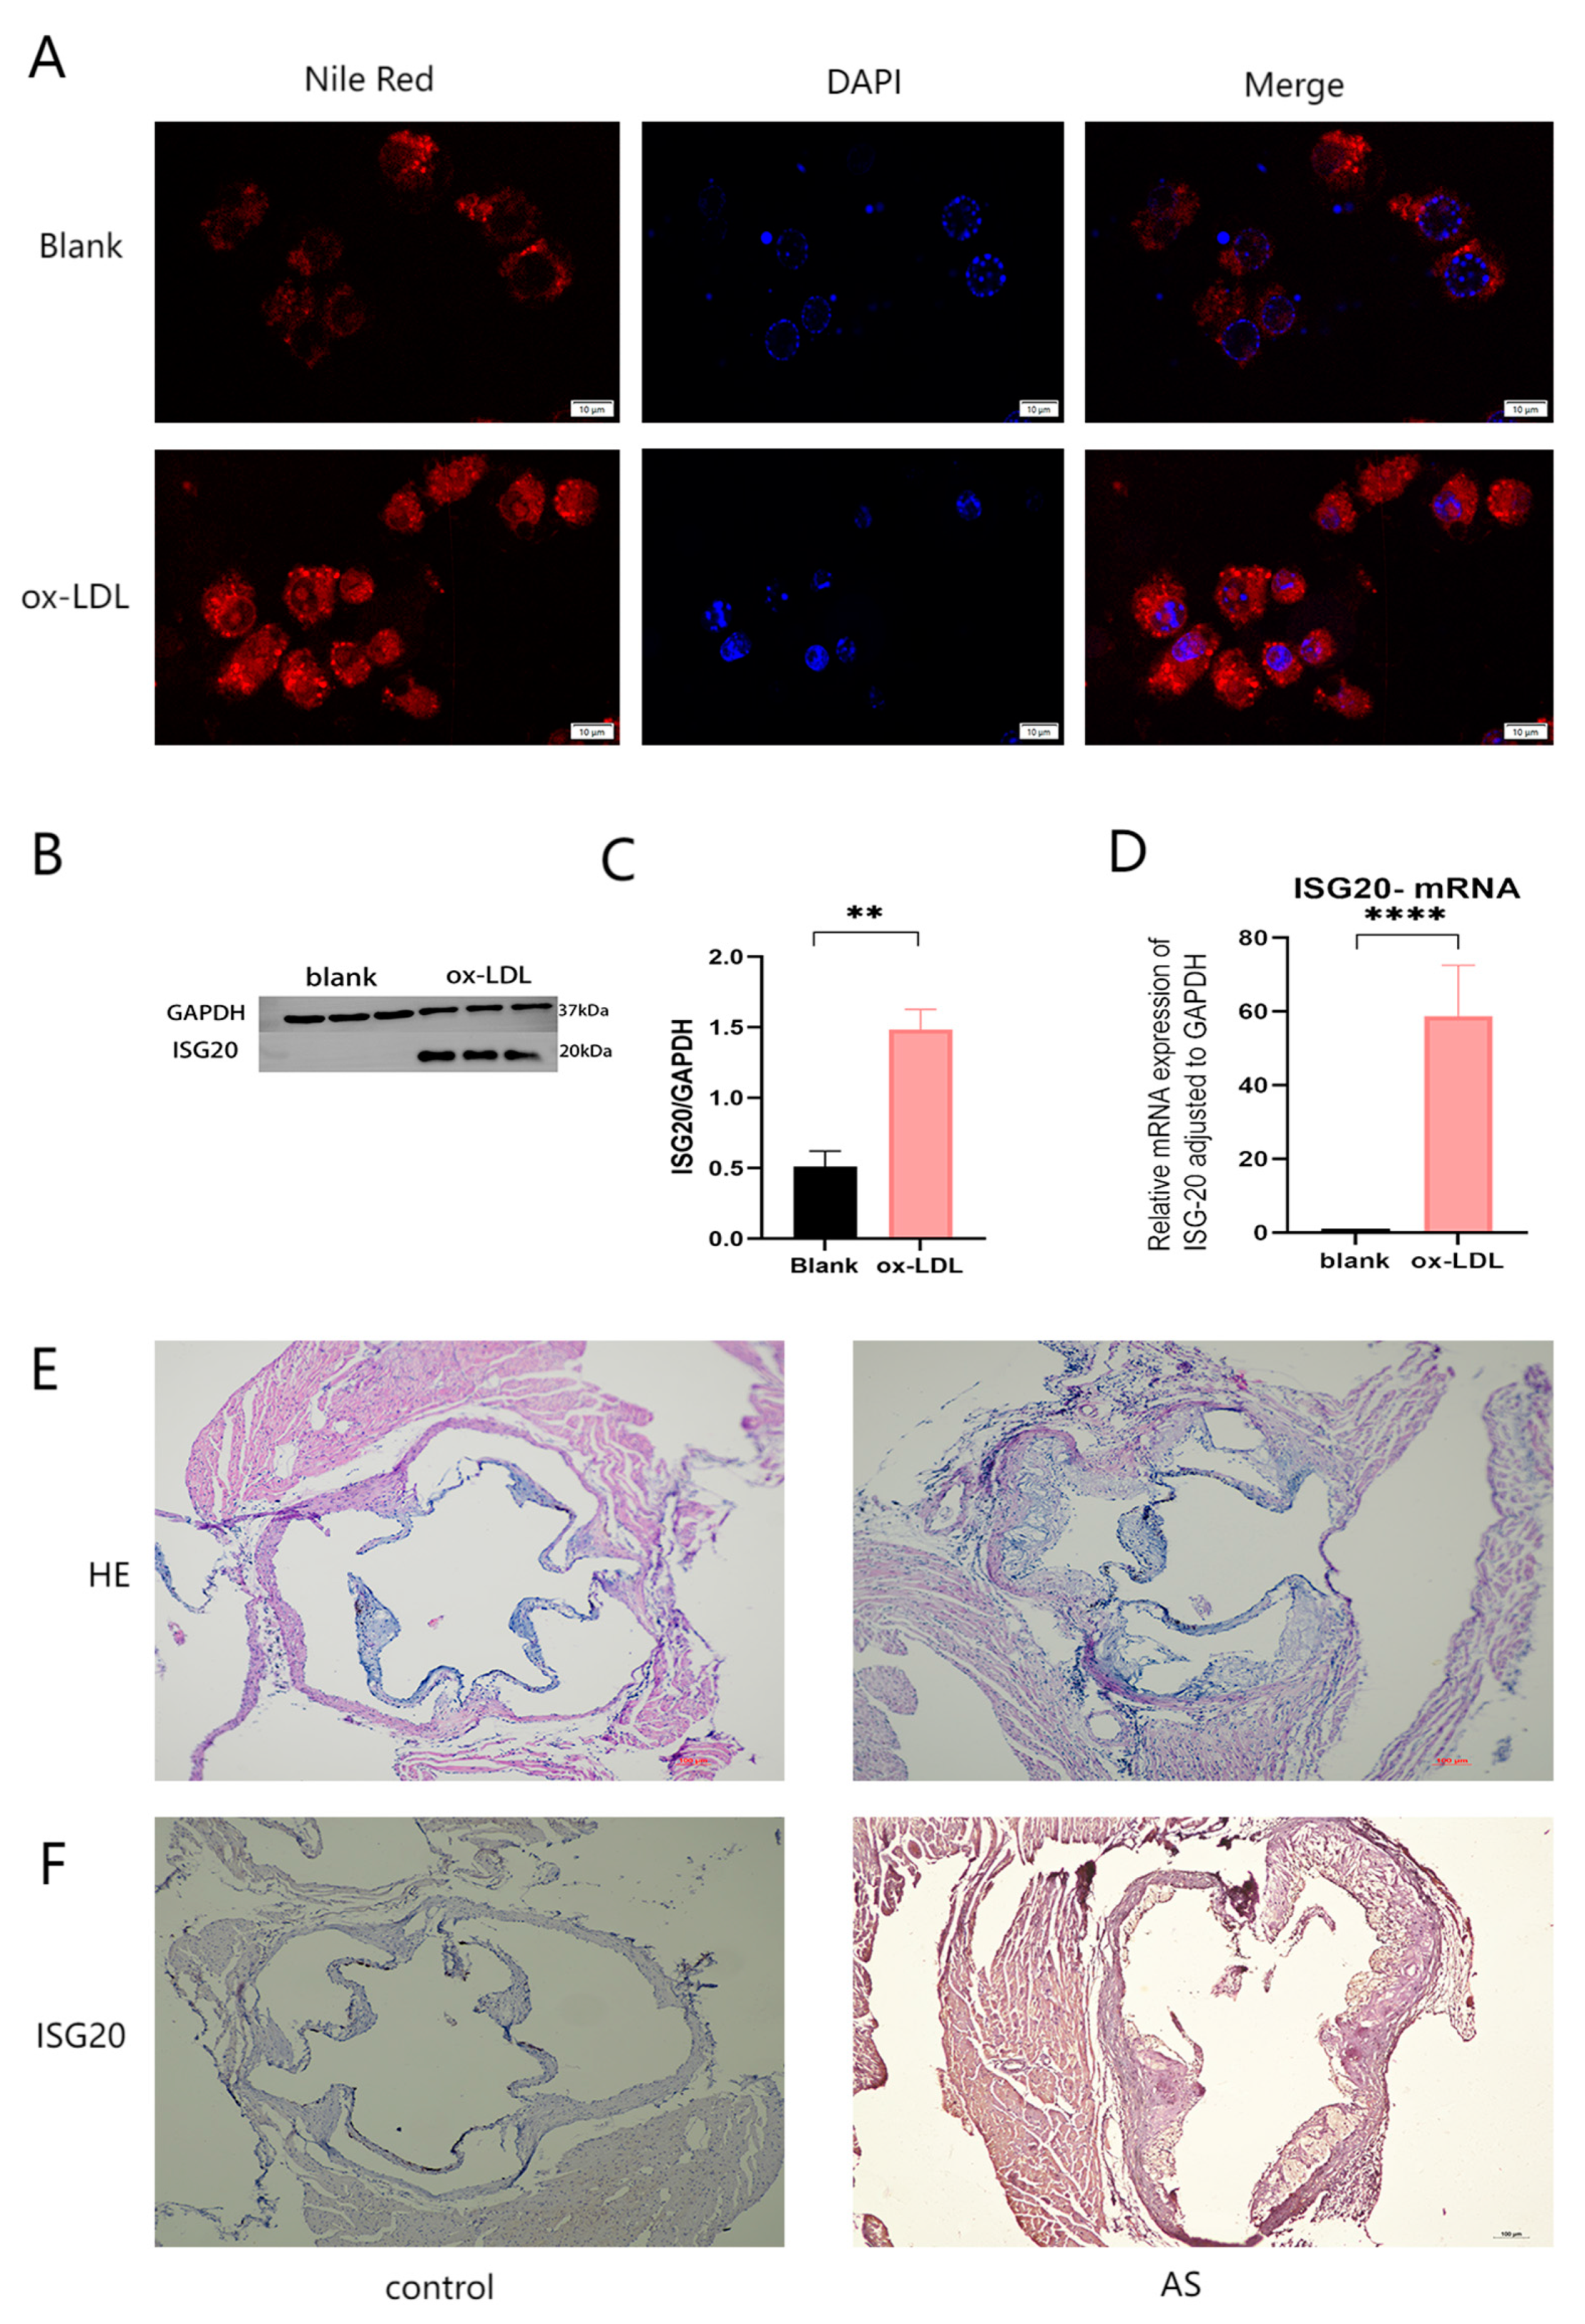
RAW264.7 macrophages stimulated with oxidized low-density lipoprotein (ox-LDL, 100 μg/mL) for 24 hours exhibited significant intracellular lipid accumulation, confirming foam cell formation (Figure 9A). Compared to untreated controls, ISG20 expression was markedly elevated at both the protein (Western blot) and mRNA (RT-qPCR) levels in ox-LDL-treated cells (Figure 9B–D).
3.7.2. ISG20 Expression in Atherosclerotic Plaques
After 8 weeks of high-fat diet (HFD) feeding, ApoE-/- mice developed larger aortic root plaques than C57BL/6J wild-type controls, as demonstrated by hematoxylin and eosin (H&E) staining (Figure 9E). Immunohistochemistry (IHC) of aortic root sections revealed significantly higher ISG20 expression in atherosclerotic plaques compared to controls, with positive signals predominantly localized to the endothelial layer and macrophage-rich regions of plaques(Figure 9F).
4. Discussion
Atherosclerosis, a chronic inflammatory vascular disease, exhibits complex etiological mechanisms. Among these, the accumulation of macrophages transforming into foam cells and their persistent retention within the vascular wall represents a critical driver of disease progression [3]. Consequently, identifying macrophage-related biomarkers holds significant potential for preventing cardiovascular diseases. In this study, we performed integrated analyses of multiple datasets from the GEO database to identify differentially expressed genes (DEGs). By combining genome-wide association study (GWAS) and expression quantitative trait loci (eQTL) data with Mendelian randomization (MR) analysis, we systematically screened atherosclerosis-associated genes, including CLEC5A, ISG20, and HOXA2. Functional enrichment and pathway analyses were further conducted to elucidate the potential mechanisms and pathways linked to these key genes. Notably, CLEC5A and ISG20 demonstrated significant causal relationships with atherosclerosis, emerging as risk genes contributing to disease pathogenesis. In contrast, HOXA2 showed no statistically significant association in our analyses. Additionally, we validated ISG20 through cellular experiments and plaque assays in APOE−/− mouse models. These validations revealed that ISG20 is highly expressed in foam-macrophages and exhibits marked upregulation within atherosclerotic plaques. Our findings provide novel insights into disease mechanisms and highlight potential therapeutic targets for atherosclerosis intervention.
Our Mendelian randomization analysis revealed a causal relationship between the gene CLEC5Aand atherosclerosis, indicating that elevated gene expression is associated with an increased risk of disease onset. Furthermore, validation cohort results demonstrated consistency with the Mendelian randomization findings. CLEC5A (C-type lectin domain family 5 member A), a member of the C-type lectin superfamily, is a type II transmembrane protein primarily expressed in myeloid cells, including macrophages, monocytes, neutrophils, and dendritic cells [9].CLEC5A binds to the adaptor protein DNAX-activating protein 12 (DAP12), leading to the activation of spleen tyrosine kinase (SYK), which subsequently triggers downstream signaling pathways. This cascade induces the massive release of cytokines and inflammatory mediators, such as interleukin-6 (IL-6), tumor necrosis factor (TNF), and interleukin-8 (IL-8), from host cells. This process is critical for innate immune responses, effectively defending against pathogen invasion [10]. As a pattern recognition receptor (PRR) for viruses and bacteria, CLEC5A recognizes diverse pathogen-associated molecular patterns (PAMPs) and damage-associated molecular patterns (DAMPs), thereby activating immune cells and initiating immune responses. In flavivirus infections (e.g., dengue and Japanese encephalitis viruses), CLEC5A serves as a key receptor that drives the production of high levels of pro-inflammatory cytokines and chemokines [11,12]. Additionally, CLEC5A plays a vital role in combating bacterial infections. Studies demonstrate that CLEC5A is a critical PRR in Listeria monocytogenes infection, promoting IL-1β production. It also recognizes other bacteria, such as Staphylococcus aureus and Klebsiella pneumoniae, contributing to host immune defense [13].CLEC5A, a C-type lectin receptor predominantly expressed on macrophages and neutrophils, induces inflammatory responses upon activation. In this study, Mendelian randomization analysis combined with machine learning revealed a significant causal relationship between the CLEC5Agene and atherosclerosis, wherein elevated CLEC5A expression is associated with increased disease risk. Furthermore, CLEC5A expression showed positive correlations with immune cells such as macrophages and activated macrophages. Previous studies in atherosclerosis models demonstrated that MDL-1 (i.e., CLEC5A) expression in macrophages within lesion areas is closely linked to inflammatory responses. Specifically, in regression models of atherosclerosis, significant downregulation of MDL-1 expression was observed in macrophages from regressive plaques of LDLR−/− mice, concomitant with reduced macrophage infiltration and decreased pro-inflammatory M1 macrophage markers [14]. These animal experiments corroborate our theoretical findings, suggesting that MDL-1 may serve as a biomarker for monitoring early atherosclerotic plaque progression.Additionally, CLEC5A is highly expressed in inflammatory M1-polarized myeloid cells but exhibits moderate expression in tumor-associated phenotypes (M2c or TAM) [15]. This indicates that the association between CLEC5A and atherosclerosis is primarily driven by its activation in macrophages within atherosclerotic lesions, particularly its elevated expression in pro-inflammatory M1 macrophages, which may contribute to disease progression and inflammation. Atherosclerosis, as a complex inflammatory disorder, involves the recruitment and proliferation of diverse immune cells. These cells interact and release inflammatory mediators, forming a vicious cycle that promotes plaque formation and destabilization.CLEC5A, a receptor expressed on immune cells, participates in diverse immune responses by activating multiple signaling pathways and promoting the release of chemokines, thereby regulating immune cell migration and proliferation [16]. These findings collectively suggest that CLEC5A plays a critical role in the progression of atherosclerosis. However, the precise molecular mechanisms underlying CLEC5A's function in atherosclerosis remain incompletely elucidated. Further studies are warranted to explore its clinical implications and therapeutic potential as a novel target.
ISG20 exhibits diverse functional roles. As a critical protein in host antiviral innate immunity, its expression is regulated by interferons. Specifically, ISG20 can be induced by type I (α/β) and type II (γ) interferons through the interferon-stimulated response element (ISRE) in its promoter region, thereby contributing to innate immune responses [17]. Our study reveals a novel link between ISG20 and ox-LDL-driven oxidative stress in atherosclerosis. Experimental data demonstrate that ox-LDL stimulation significantly upregulates ISG20 expression in macrophages, concomitant with enhanced lipid accumulation and foam cell formation (Figure 9B–D). This suggests that ISG20 may act as a mediator of oxidized lipid-induced cellular stress, potentially exacerbating macrophage dysfunction—a hallmark of atherosclerotic plaque progression.Notably, ISG20 expression positively correlates with pro-inflammatory cytokines (e.g., IL-6, TNF-α) in atherosclerotic lesions, as evidenced by immune infiltration analysis (Figure 7C). While our data do not directly establish the molecular pathways underlying this association, prior studies provide plausible mechanistic insights. For instance, ISG20 has been shown to degrade oxidized RNA species to mitigate cellular damage [18]; however, in the context of ox-LDL exposure, its elevated expression may paradoxically amplify endoplasmic reticulum (ER) stress and trigger apoptotic signaling—a key contributor to plaque instability [19].Furthermore, prior studies suggest that ISG20 may activate inflammatory cascades through its RNA-binding and exonuclease activities. For instance, ISG20 has been shown to recognize aberrant RNA species (e.g., dsRNA or oxidized RNA) and trigger downstream signaling pathways [20]. By analogy, we hypothesize that in the context of ox-LDL-induced stress, ISG20 may similarly sense oxidized nucleic acids (e.g., mitochondrial DNA or oxidized RNA) to promote NLRP3 inflammasome assembly and NF-κB activation—a mechanism potentially linking lipid peroxidation to chronic inflammation in atherosclerosis.
Despite these compelling associations, the precise mechanisms linking ISG20 to NLRP3/NF-κB activation remain speculative. Future studies should directly interrogate these pathways through targeted experiments, such as measuring NLRP3 inflammasome components (e.g., cleaved caspase-1, ASC oligomerization) in ISG20-knockdown macrophages, and assessing NF-κB nuclear translocation via immunofluorescence or phospho-p65 Western blotting. Pharmacological inhibition of these pathways (e.g., using MCC950 for NLRP3 or BAY11-7082 for NF-κB) could further validate their functional relevance to ISG20-mediated inflammation.
Current research on the direct relationship between HOXA2 and atherosclerosis remains limited. In our analysis, no significant association was detected between this gene and atherosclerosis. However, validation cohort analysis revealed a declining trend in disease risk with elevated HOXA2 expression. Notably, studies have identified altered methylation levels of specific genes (HOXA2, HOXD4, and the imprinted gene MEST) in atherosclerotic plaques compared to normal tissues, characterized by a hypomethylation state [21].The Hox gene family plays a pivotal role in embryonic development, including the formation of the hindbrain, neural crest cells, and brain tissues in adult mice and humans [22]. HOXA2 is critically involved in cell differentiation and migration, where it suppresses chondrogenic differentiation during cartilage formation and regulates cellular migration. Additionally, HOXA2 inhibits oligodendrocyte differentiation while promoting their proliferation [23]. Furthermore, members of the HOXA2 gene family have been implicated in the development of various cancers [24,25,26].Under normal physiological conditions, DNA methylation regulates gene expression and maintains genomic stability, whereas hypomethylation may lead to aberrant gene activation. This suggests that the methylation status of the HOXA2 gene may play a significant role in atherosclerosis development, although the precise mechanisms and influencing factors require further investigation. Additionally, studies on the homologous gene HOXA-AS2 reveal that the long non-coding RNA (lncRNA) HOXA-AS2 acts as a critical suppressor of endothelial inflammation and is significantly associated with carotid atherosclerosis. In human peripheral blood monocytes, HOXA-AS2 inhibits NF-κB signaling pathway activation by controlling IκBα degradation and Rela acetylation at the K310 site, thereby suppressing inflammatory responses. Notably, NF-κB reciprocally activates the transcriptional elongation of HOXA-AS2, forming a negative feedback loop. These findings suggest that HOXA-AS2 may serve as a key therapeutic target for vascular diseases linked to endothelial inflammation [27].Based on this evidence, we hypothesize that dysregulated HOXA2 expression might exert anti-inflammatory effects during atherosclerosis progression, particularly in response to vascular endothelial injury. However, the specific molecular mechanisms underlying this potential role necessitate further exploration and validation.
Our study utilized publicly available gene expression data from the Gene Expression Omnibus (GEO) database and expression quantitative trait locus (eQTL) data to establish associations between genetic variants and gene expression levels. By integrating these resources, researchers can rapidly obtain associations between exposures (gene expression) and outcomes (phenotypes). Using eQTLs as instrumental variables (IVs) directly links genetic regulation to gene expression levels, thereby enhancing the biological plausibility of causal inference [28].Mendelian randomization (MR) analysis reduces confounding factors inherent in traditional observational studies by leveraging the random allocation of genetic variants during conception [29]. Additionally, since genotypes are fixed at birth, this approach mitigates reverse causation bias where disease status might influence gene expression. By integrating tissue-specific eQTL data with disease-specific expression profiles from the GEO database, our study enables exploration of tissue-specific causal effects or disease heterogeneity. However, GEO data derived from diverse experimental platforms, sample processing protocols, and study designs may introduce batch effects or technical biases. To address this, we implemented stringent quality control measures, including batch effect correction. Furthermore, our eQTL data were predominantly based on European populations, limiting ancestral diversity. Future studies should expand to multi-ethnic cohorts to enhance generalizability.To ensure analytical robustness, we excluded pleiotropic instrumental variables (IVs), applied weak IV correction, and removed variants in linkage disequilibrium (LD). In our study, we conducted two independent MR analyses. The first MR analysis linked eQTLs to disease phenotypes to identify causal gene expression signatures. These candidate genes were then intersected with disease-associated differentially expressed genes (DEGs) from the GEO dataset, yielding key genes of interest. A subsequent MR analysis was performed on these prioritized genes, requiring consistent directional effects across five complementary MR methods (e.g., inverse-variance weighted, MR-Egger, weighted median). This dual MR framework minimizes bias from single-analysis limitations, significantly enhancing the reliability of causal inference between genes and diseases and strengthening the credibility of our theoretical model.
Although our study theoretically validates a strong causal relationship between the genes CLEC5A and ISG20 with atherosclerosis, wherein their upregulated expression promotes disease initiation and progression, and further corroborates the elevated expression of ISG20 in plaques and macrophages through cellular experiments and ApoE-/- mice models, the specific functional roles and molecular mechanisms of these genes remain unexplored. Future investigations will incorporate human clinical samples to validate their predictive value. Additionally, to elucidate the pathways involving ISG20 and its associations with inflammation or apoptosis, we plan to employ conditional knockout mouse models to verify its pathological functions, thereby advancing the exploration of ISG20 as a therapeutic target or clinical biomarker..
5. Conclusions
This study systematically identified two key regulatory genes, CLEC5A and ISG20, in atherosclerosis (AS) through integrated multi-omics data and Mendelian randomization analysis. Experimental validation demonstrated that ISG20 expression was significantly elevated in ox-LDL-stimulated macrophages and atherosclerotic plaques of ApoE-/- mice, demonstrating that ISG20 exacerbates AS progression by promoting lipid accumulation and inflammatory cell infiltration. Mechanistically, ISG20 activates the NLRP3 inflammasome and NF-κB pathway by recognizing oxidative stress-derived damage-associated molecular patterns (DAMPs), such as oxidized RNA or mitochondrial DNA, thereby driving the release of pro-inflammatory cytokines, including IL-1β and IL-18. Furthermore, CLEC5A, which functions as a myeloid cell-specific receptor, exhibited a positive correlation with M1-polarized macrophage infiltration within plaques, suggesting its regulatory role in early inflammatory responses during AS pathogenesis.
This study reveals for the first time the dual role of ISG20 in AS pathogenesis (lipid metabolism dysregulation and inflammatory amplification), providing experimental evidence to support its potential as a therapeutic target. Future studies should aim to elucidate the molecular mechanisms underlying ISG20-DAMP interactions and develop targeted inhibitors to evaluate their clinical potential. Additionally, extending eQTL analyses to diverse ancestral populations would improve the generalizability of the identified genetic associations.
6. Patents
This section is not mandatory but may be added if there are patents resulting from the work reported in this manuscript.
Supplementary Materials
The following supporting information can be downloaded at the website of this paper posted on Preprints.org, Figure S1: title; Table S1: title.
Author Contributions
Ya Zhang performed data analysis, conducted gene screening, and drafted the manuscript. Qian Tian carried out animal experiments, Western blot, and q-PCR assays. Tianhui Wang, Yongchao Yu, Lan Wang, Yuan Zhu, and Lijun Shao participated in the animal experiments. Xiangang Mo conceived and designed the study, and supervised the manuscript preparation. All authors have read and approved the final manuscript.
Funding
The research is supported by: National Science Foundation of China, Role and Mechanisms of NHE1 for SGLT2i Inhibiting NLRP3 Inflammasome Activation in Atherosclerotic Plaque Macrophages (No. 82160097);.
Institutional Review Board Statement
The samples utilized in this study were approved by the Research Ethics Review Committee of Guizhou Medical University, with the ethical approval number: 2101044.
Informed Consent Statement
Not applicable.
Data Availability Statement
The Gene Expression Omnibus (GEO) datasets used in this study were obtained from the publicly available GEO database (https://www.ncbi.nlm.nih.gov/geo/). Outcome data for Mendelian randomization (MR) analysis and gene expression quantitative trait loci (eQTL) data were sourced from the Genome-Wide Association Studies (GWAS) database (https://gwas.mrcieu.ac.uk/).
Acknowledgments
We gratefully acknowledge the technical staff at the Animal Experiment Center of Guizhou Medical University for their expertise in animal model maintenance.
Conflicts of Interest
The authors declare that the research was conducted in the absence of any commercial or financial relationships that could be construed as a potential conflict of interest.
Abbreviations
The following abbreviations are used in this manuscript:
| AS | Atherosclerosis |
| MR | Mendelian randomization |
| CLEC5A | C-type lectin domain family 5 member A |
| ISG20 | Interferon-stimulated gene 20 |
| HOXA2 | Homeobox A2 |
| ox-LDL | Oxidized low-density lipoprotein |
References
- Peige Song, PhD.Zhe Fang, MD.Hanyu Wang, BA.Yutong Cai, PhD.Kazem Rahimi, DM.Yajie Zhu, PhD et al.Global and regional prevalence, burden, and risk factors for carotid atherosclerosis: a systematic review, meta-analysis, and modelling study.Lancet Glob Health 2020;8: e721–29.
- Vallejo J, Cochain C, Zernecke A, Ley K. Heterogeneity of immune cells in human atherosclerosis revealed by scRNA-Seq. Cardiovasc Res. 2021;117(13):2537-2543. [CrossRef]
- Del Buono MG, Bonaventura A, Vecchié A, et al. Pathogenic pathways and therapeutic targets of inflammation in heart diseases: A focus on Interleukin-1. Eur J Clin Invest. 2024;54(2):e14110. [CrossRef]
- Cochain C, Vafadarnejad E, Arampatzi P, et al. Single-Cell RNA-Seq Reveals the Transcriptional Landscape and Heterogeneity of Aortic Macrophages in Murine Atherosclerosis. Circ Res. 2018;122(12):1661-1674. [CrossRef]
- O'Donoghue ML, Fazio S, Giugliano RP, et al. Lipoprotein(a), PCSK9 Inhibition, and CardiovascularRisk. Circulation. 2019;139(12):1483-1492.
- Zhang L, Xia C, Yang Y, et al. DNA methylation and histone post-translational modifications in atherosclerosis and a novel perspective for epigenetic therapy. Cell Commun Signal. 2023;21(1):344. Published 2023 Nov 29. [CrossRef]
- Zhang J, Zhao H. eQTL studies: from bulk tissues to single cells. J Genet Genomics. 2023;50(12):925-933. [CrossRef]
- Larsson SC, Butterworth AS, Burgess S. Mendelian randomization for cardiovascular diseases: principles and applications. Eur Heart J. 2023;44(47):4913-4924. [CrossRef]
- Sung PS, Chang WC, Hsieh SL. CLEC5A: A Promiscuous Pattern Recognition Receptor to Microbes and Beyond. Adv Exp Med Biol. 2020;1204:57-73.
- Joyce-Shaikh B, Bigler ME, Chao CC, et al. Myeloid DAP12-associating lectin (MDL)-1 regulates synovial inflammation and bone erosion associated with autoimmune arthritis. J Exp Med. 2010;207(3):579-589. [CrossRef]
- Chen ST, Lin YL, Huang MT, et al. CLEC5A is critical for dengue-virus-induced lethal disease. Nature. 2008;453(7195):672-676. [CrossRef]
- Chen ST, Liu RS, Wu MF, et al. CLEC5A regulates Japanese encephalitis virus-induced neuroinflammation and lethality. PLoS Pathog. 2012;8(4):e1002655. [CrossRef]
- Chen ST, Li FJ, Hsu TY, et al. CLEC5A is a critical receptor in innate immunity against Listeria infection. Nat Commun. 2017;8(1):299. Published 2017 Aug 21. [CrossRef]
- Xiong W, Wang H, Lu L, et al. The macrophage C-type lectin receptor CLEC5A (MDL-1) expression is associated with early plaque progression and promotes macrophage survival. J Transl Med. 2017;15(1):234. Published 2017 Nov 10. [CrossRef]
- Tosiek MJ, Groesser K, Pekcec A, Zwirek M, Murugesan G, Borges E. Activation of the Innate Immune Checkpoint CLEC5A on Myeloid Cells in the Absence of Danger Signals Modulates Macrophages' Function but Does Not Trigger the Adaptive T Cell Immune Response. J Immunol Res. 2022;2022:9926305. Published 2022 Feb 25. [CrossRef]
- Cheung R, Shen F, Phillips JH, et al. Activation of MDL-1 (CLEC5A) on immature myeloid cells triggers lethal shock in mice. J Clin Invest. 2011;121(11):4446-4461. [CrossRef]
- Gongora C, Degols G, Espert L, Hua TD, Mechti N. A unique ISRE, in the TATA-less human Isg20 promoter, confers IRF-1-mediated responsiveness to both interferon type I and type II. Nucleic Acids Res. 2000;28(12):2333-2341. [CrossRef]
- Jia M, Li L, Chen R, et al. Targeting RNA oxidation by ISG20-mediated degradation is a potential therapeutic strategy for acute kidney injury. Mol Ther. 2023;31(10):3034-3051. [CrossRef]
- Li P, Xie C, Zhong J, Guo Z, Guo K, Tu Q. Melatonin Attenuates ox-LDL-Induced Endothelial Dysfunction by Reducing ER Stress and Inhibiting JNK/Mff Signaling. Oxid Med Cell Longev. 2021;2021:5589612. Published 2021 Mar 4.
- Zoladek J, Deymier S, Cimarelli A, Nisole S. Not all RNAs are created equal for the antiviral RNase ISG20. Trends Microbiol. Published online February 18, 2025. [CrossRef]
- Trainor PA, Krumlauf R. Hox genes, neural crest cells and branchial arch patterning. Curr Opin Cell Biol. 2001;13(6):698-705. [CrossRef]
- Oury F, Murakami Y, Renaud JS, et al. Hoxa2- and rhombomere-dependent development of the mouse facial somatosensory map.Science.2006;313(5792):1408-1413. [CrossRef]
- Dobreva G, Chahrour M, Dautzenberg M, et al. SATB2 is a multifunctional determinant of craniofacial patterning and osteoblast differentiation. Cell. 2006;125(5):971-986. [CrossRef]
- Bach C, Buhl S, Mueller D, García-Cuéllar MP, Maethner E, Slany RK. Leukemogenic transformation by HOXA cluster genes. Blood. 2010;115(14):2910-2918. [CrossRef]
- Song YP, Xian P, Luo H, et al. Comprehensive Landscape of HOXA2, HOXA9, and HOXA10 as Potential Biomarkers for Predicting Progression and Prognosis in Prostate Cancer. J Immunol Res. 2022;2022:5740971. Published 2022 Mar 24. [CrossRef]
- Cui Y, Yan M, Zhang C, et al. Comprehensive analysis of the HOXA gene family identifies HOXA13 as a novel oncogenic gene in kidney renal clear cell carcinoma. J Cancer Res Clin Oncol. 2020;146(8):1993-2006. [CrossRef]
- Nazarenko MS, Markov AV, Lebedev IN, et al. Mol Biol (Mosk). 2013;47(3):398-404.
- Zhu X, Liu Y, Yu J, et al. LncRNA HOXA-AS2 represses endothelium inflammation by regulating the activity of NF-κB signaling. Atherosclerosis. 2019;281:38-46. [CrossRef]
- Larsson SC, Butterworth AS, Burgess S. Mendelian randomization for cardiovascular diseases: principles and applications. Eur Heart J. 2023;44(47):4913-4924.
Figure 1.
The x-axis represents sample names, and the y-axis represents differentially expressed genes (DEGs). Blue color indicates low-expression genes, while red color denotes high-expression genes.
Figure 1.
The x-axis represents sample names, and the y-axis represents differentially expressed genes (DEGs). Blue color indicates low-expression genes, while red color denotes high-expression genes.
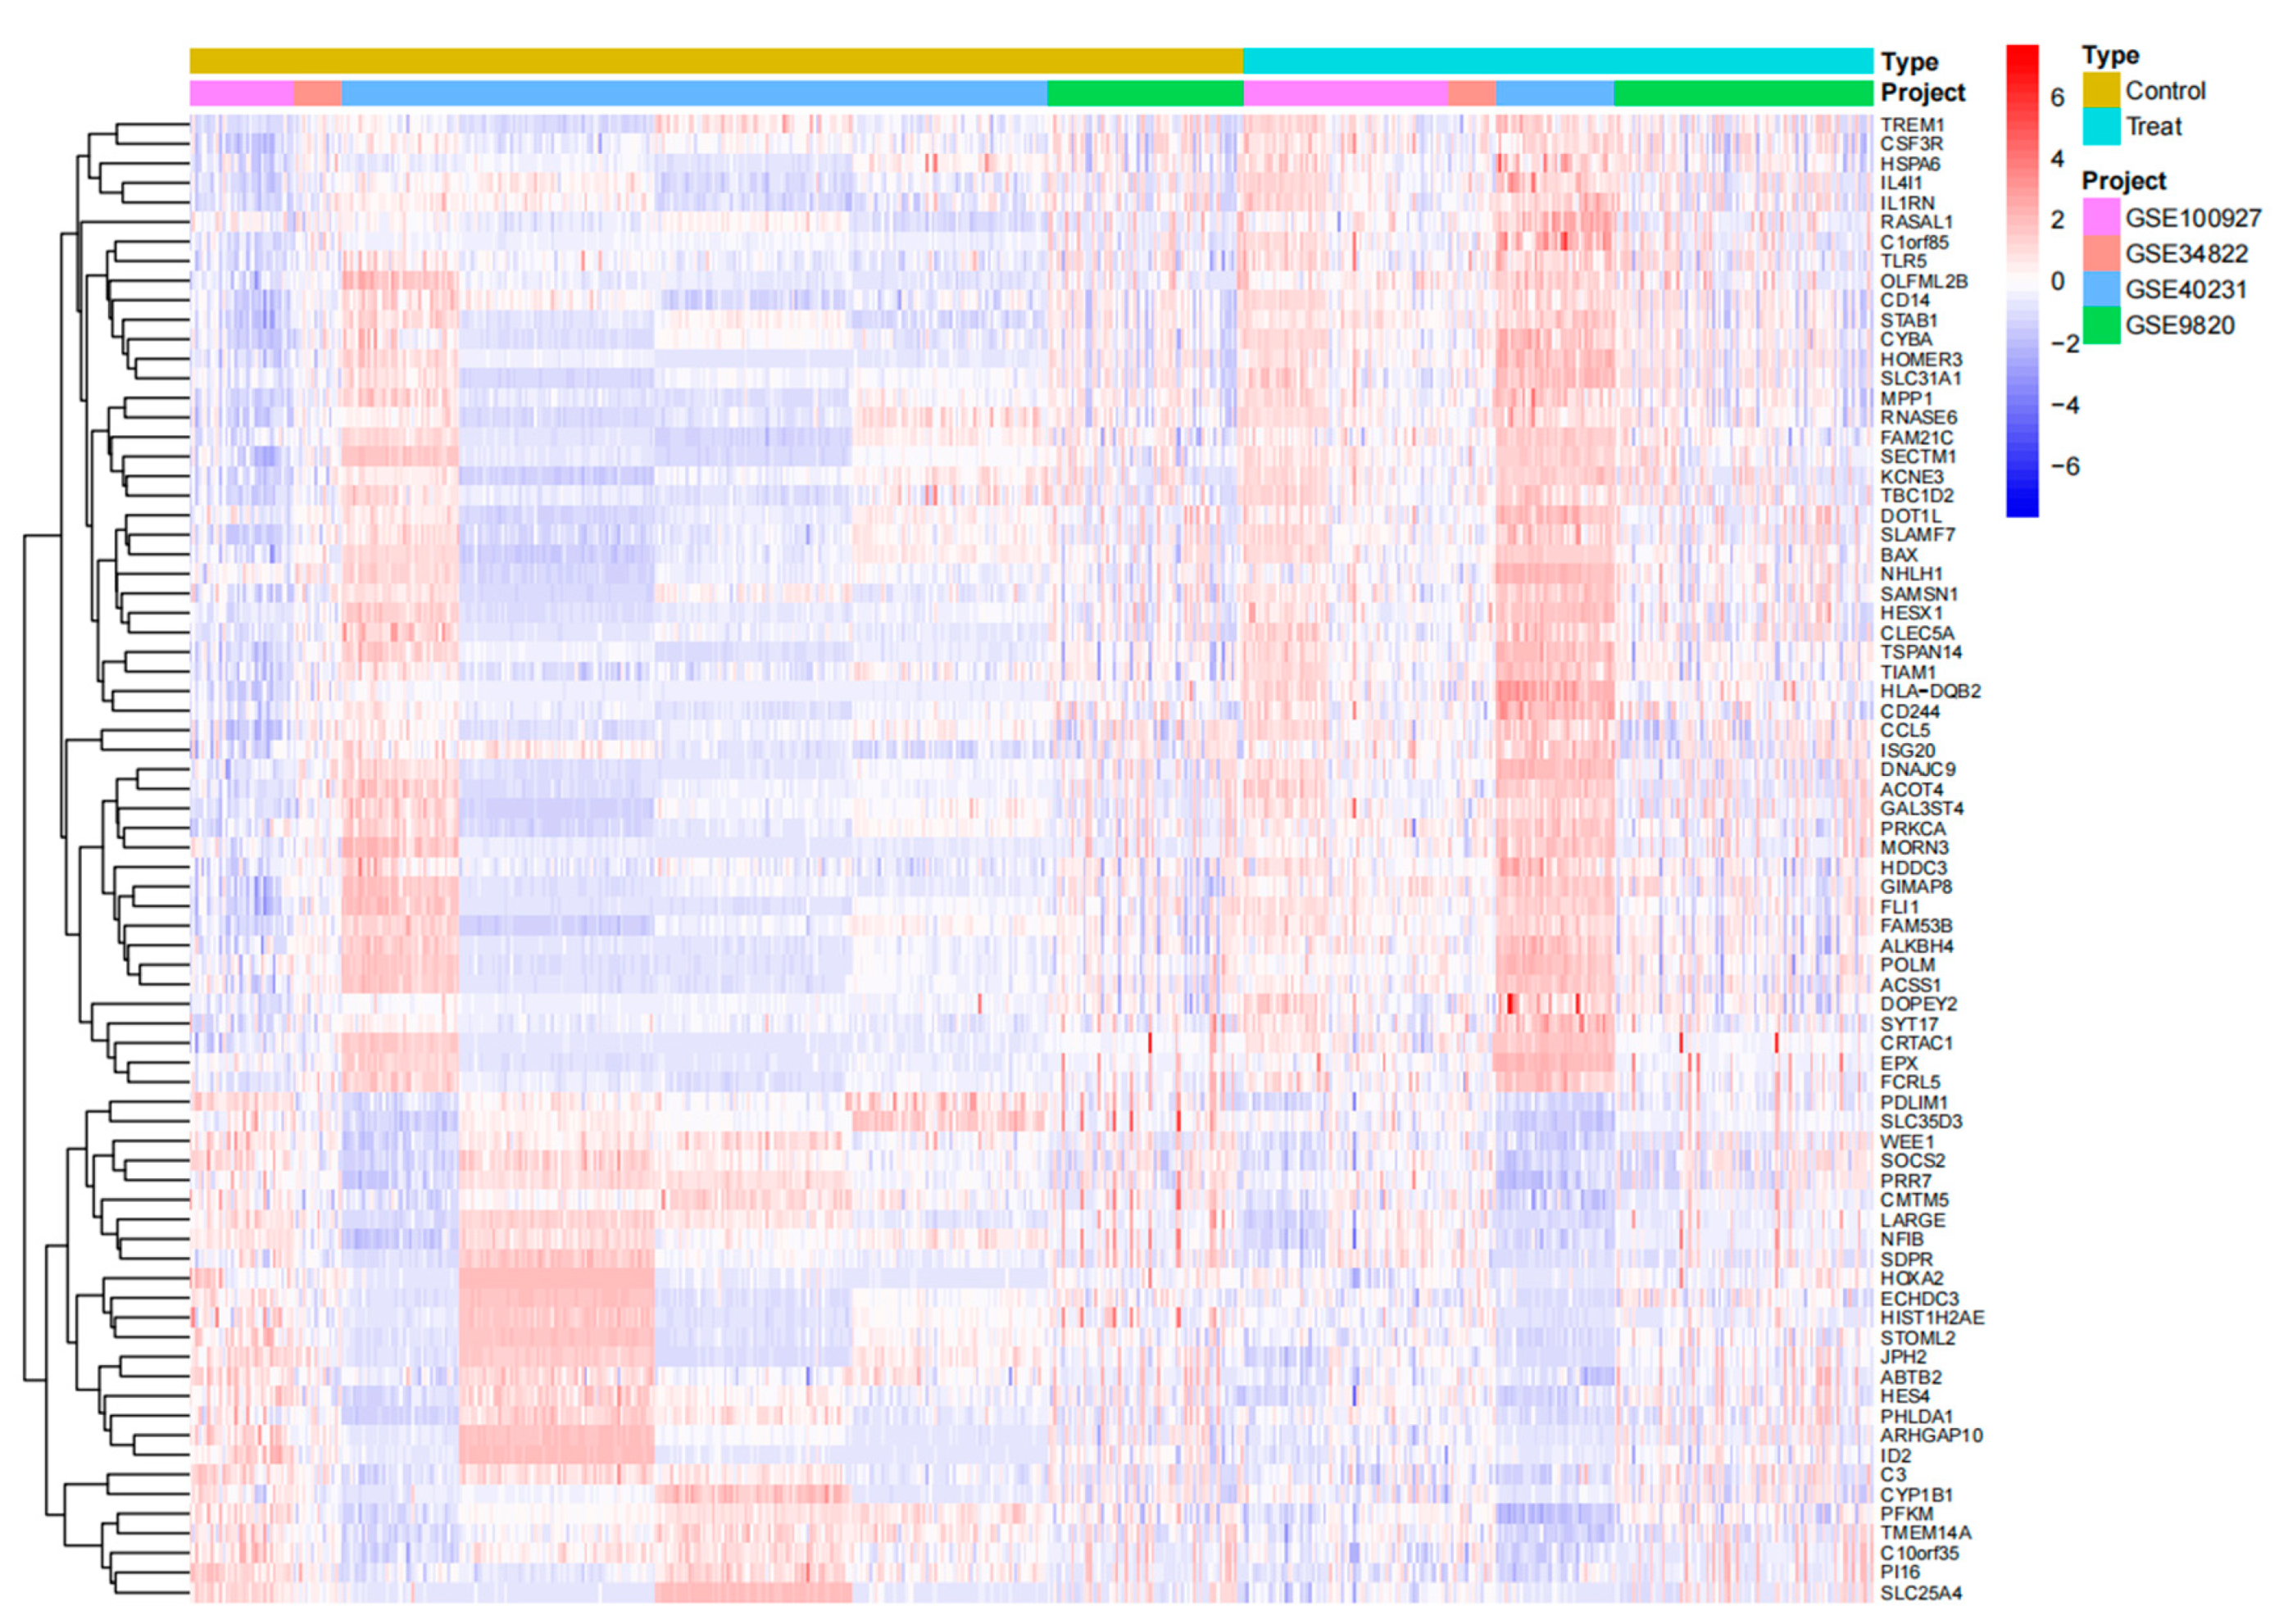
Figure 2.
Volcano plot filtered using thresholds of logfold change (logFC≥ 0.585 and adjusted P-value < 0.05, corresponding to a 1.5-fold differential expression cutoff.
Figure 2.
Volcano plot filtered using thresholds of logfold change (logFC≥ 0.585 and adjusted P-value < 0.05, corresponding to a 1.5-fold differential expression cutoff.
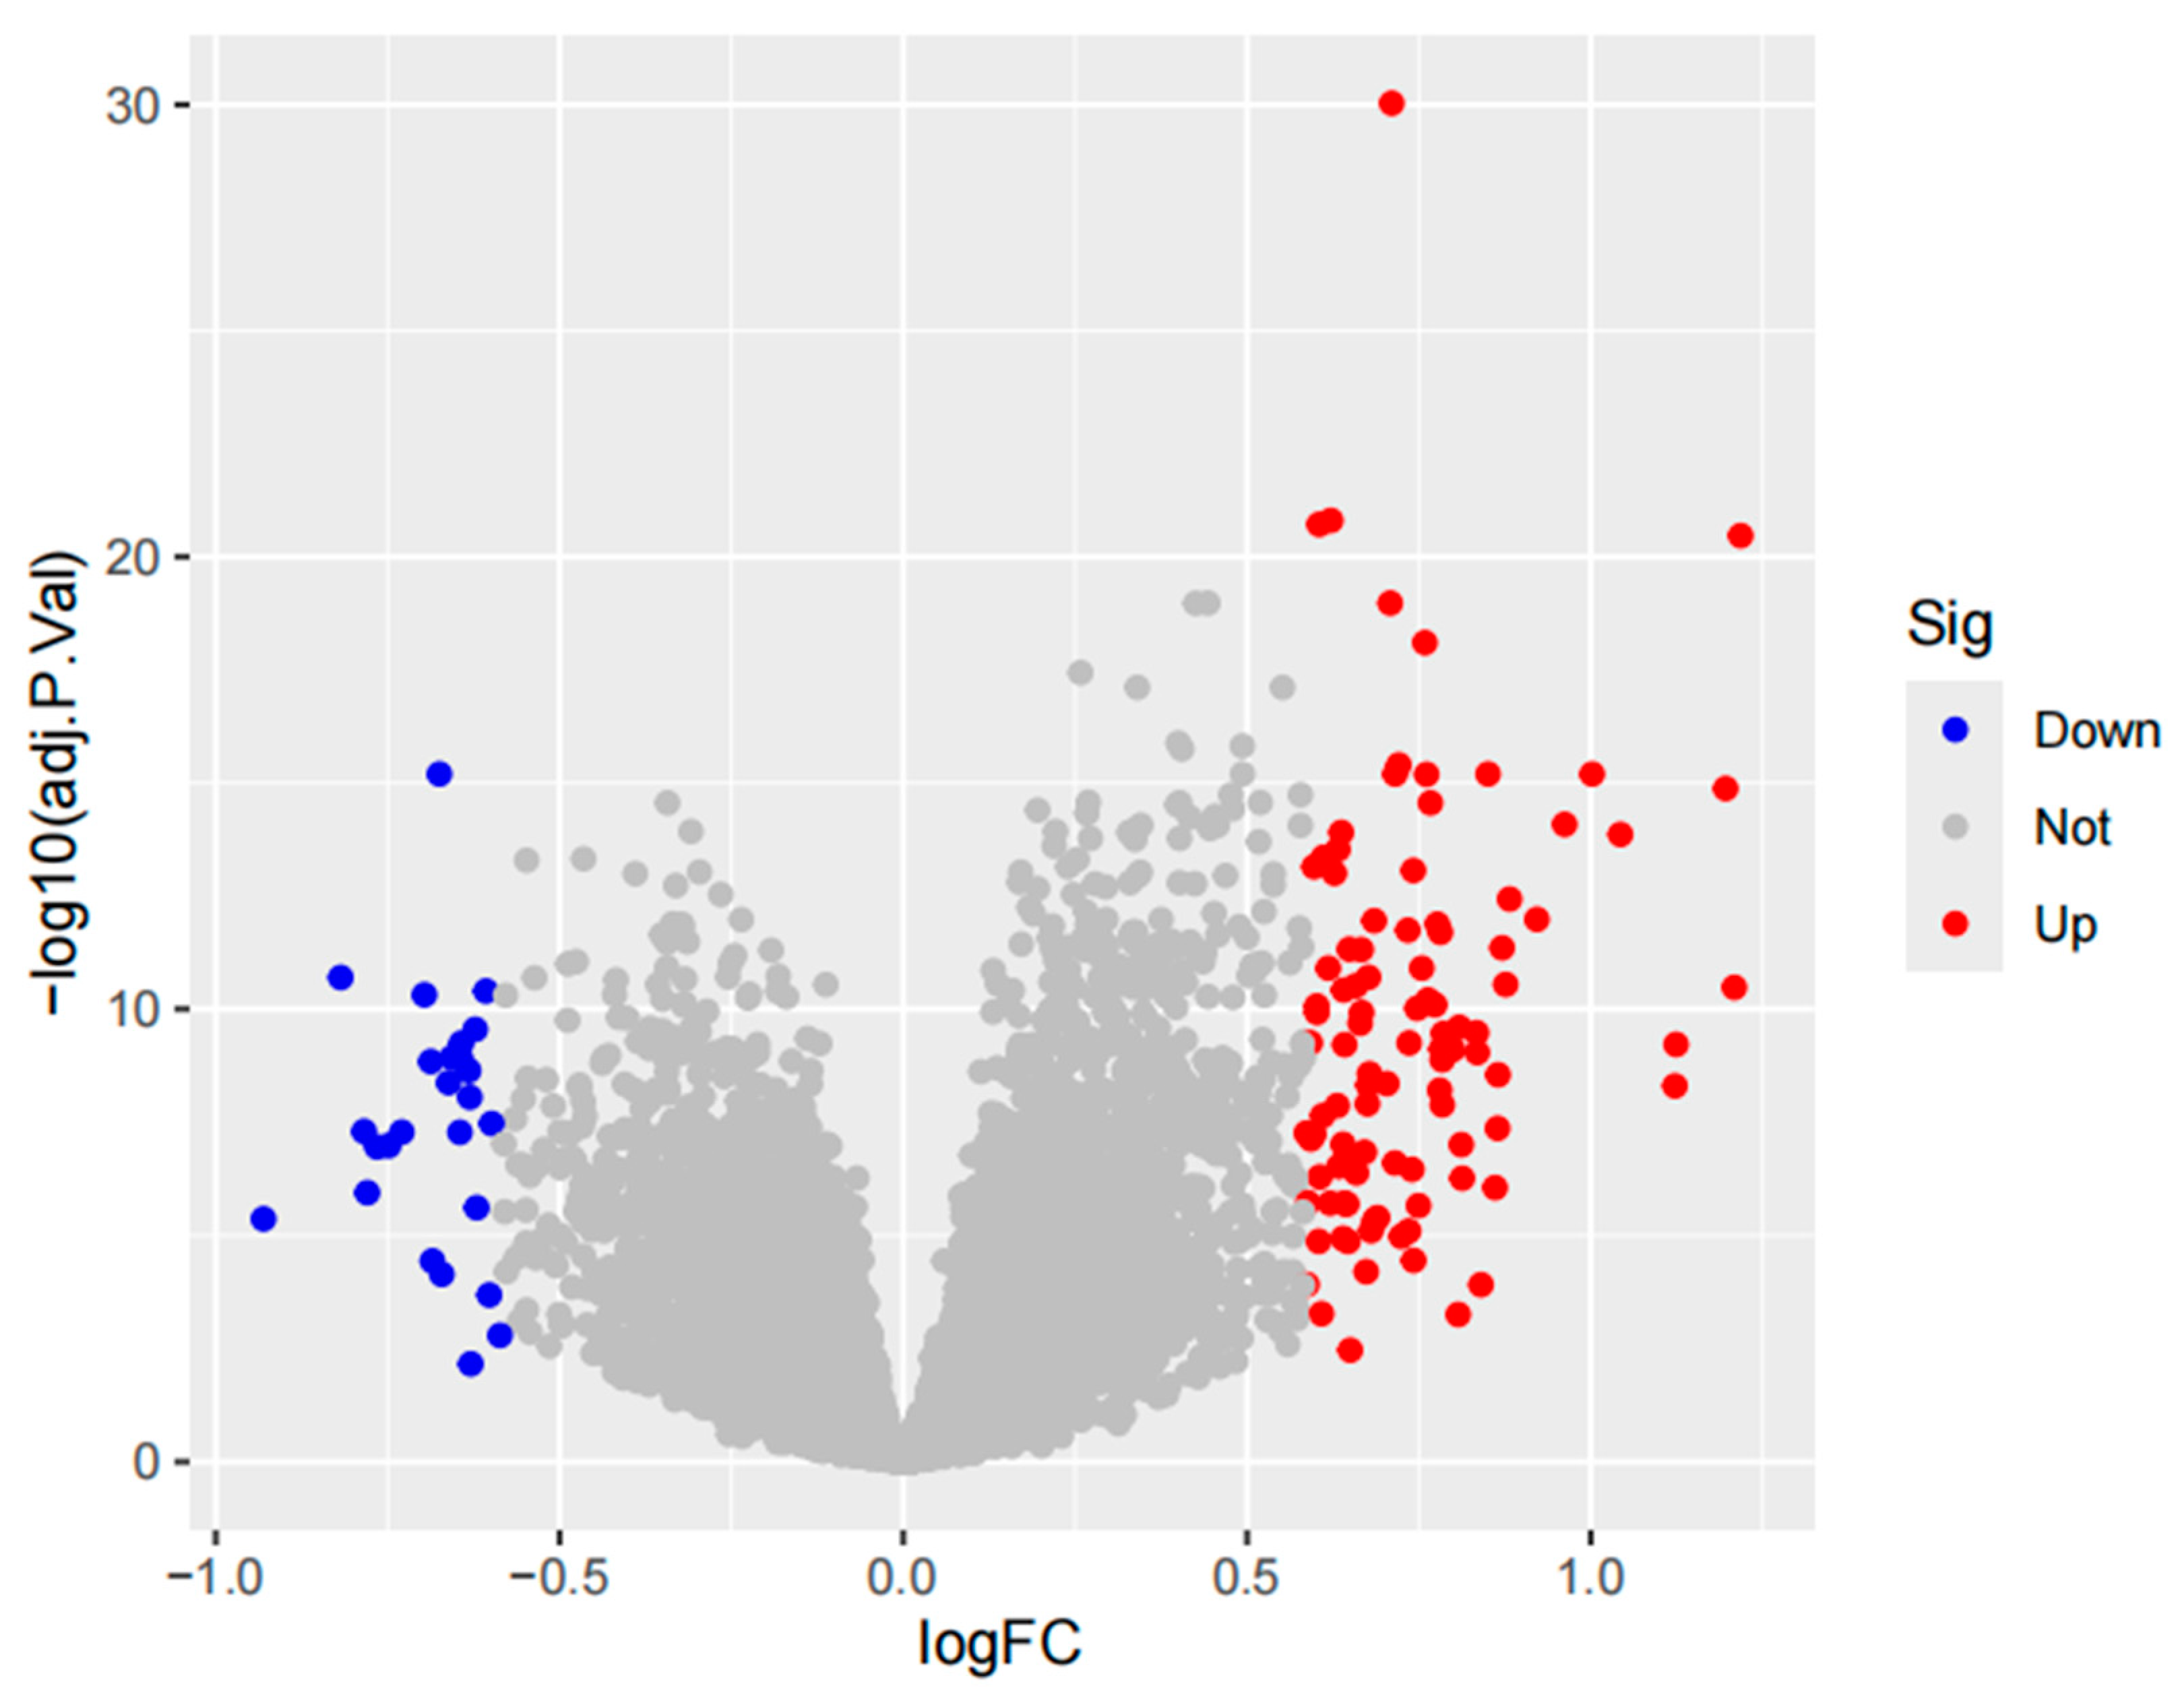
Figure 3.
The Venn diagram illustrates the intersection of upregulated and downregulated genes between MR results and differentially expressed genes (DEGs). Specifically, 2 co-expressed genes were identified from the overlap of 159 upregulated MR-derived genes and 98 disease-associated DEGs, while 1 downregulated co-expressed gene emerged from the intersection of 160 downregulated MR-derived genes and 25 disease-associated DEGs.
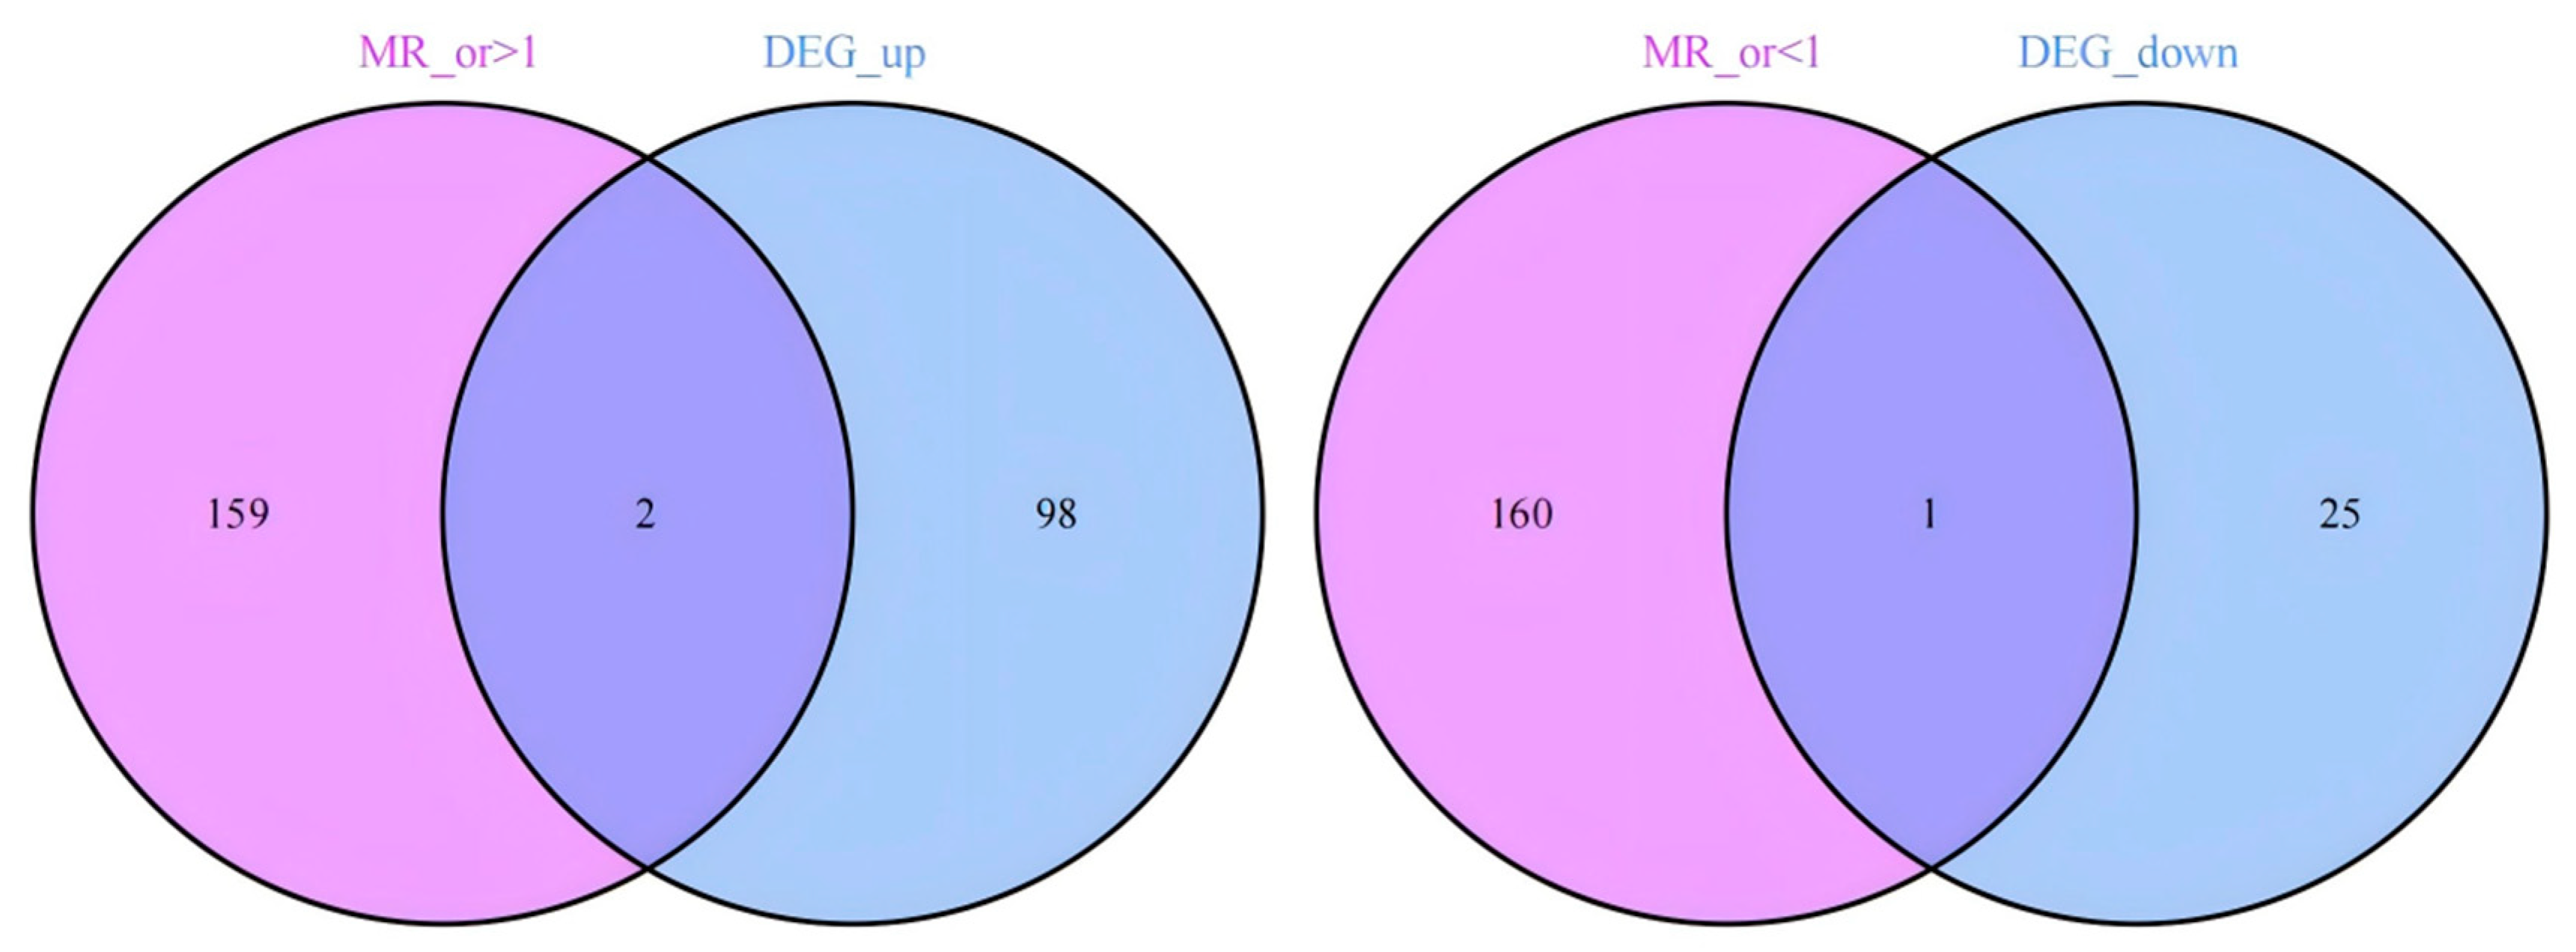
Figure 4.
Forest plots illustrating the causal associations of three key genes with atherosclerosis.
Figure 4.
Forest plots illustrating the causal associations of three key genes with atherosclerosis.
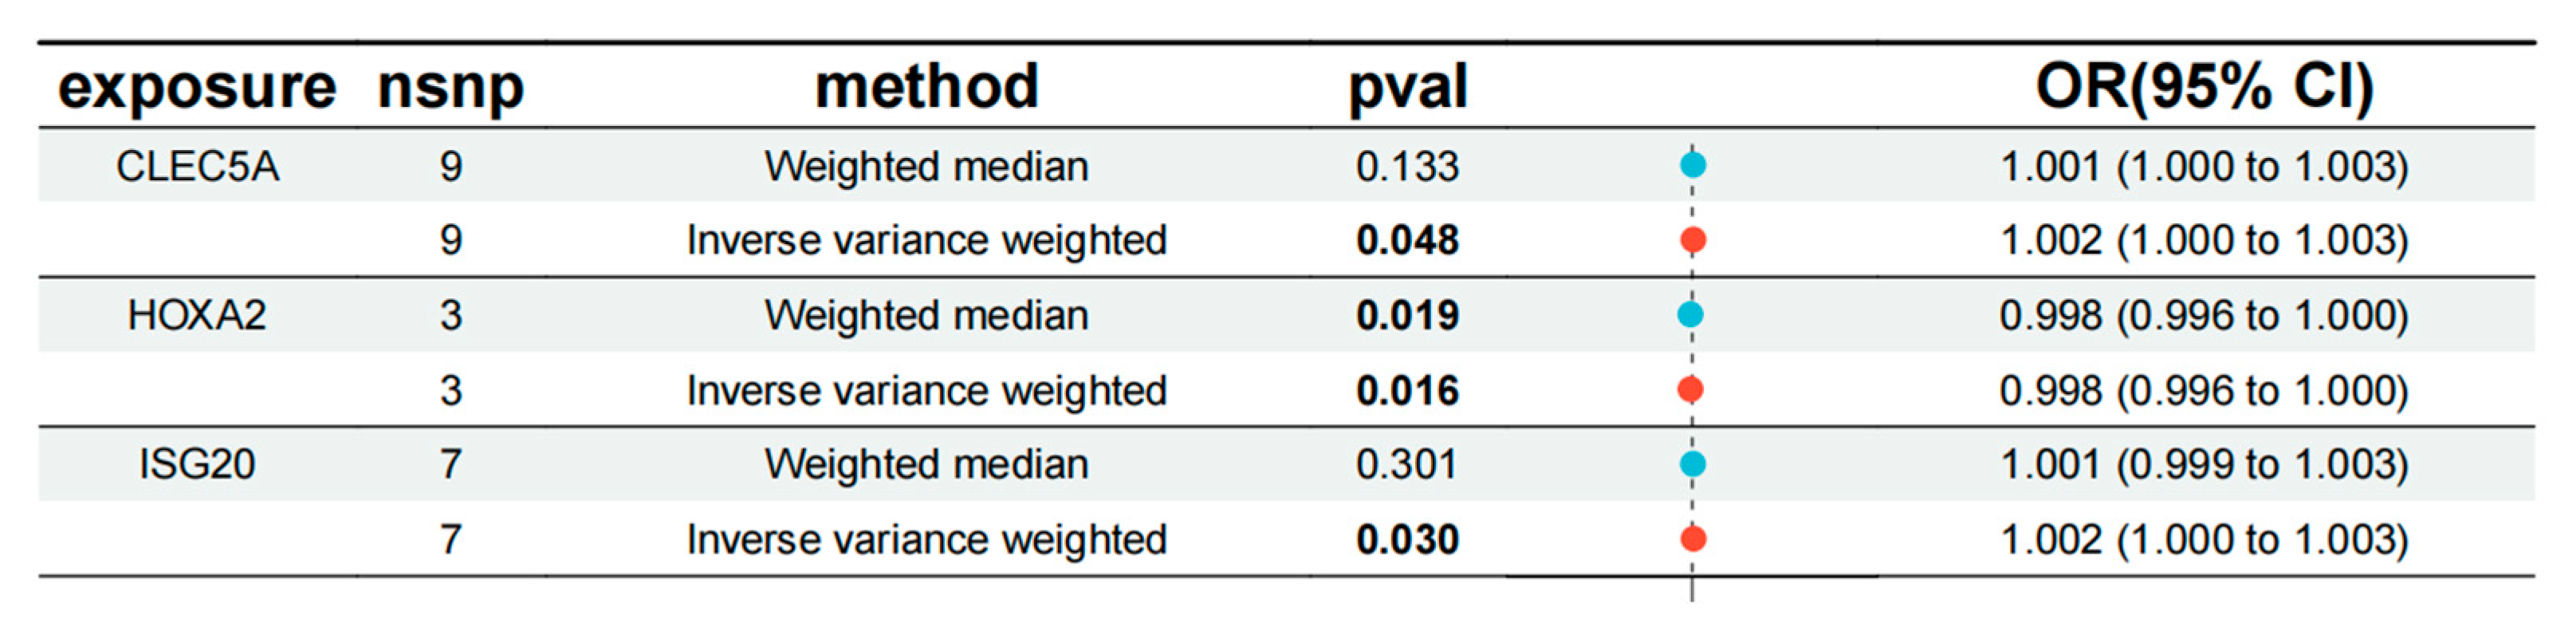
Figure 5.
Integrated visualization of three key genes through (A) scatter plots (exposure-outcome linear associations), (B) forest plots (consistency of causal effect estimates across MR methods), (C) funnel plots (symmetry of genetic instrument effects), and (D) leave-one-out sensitivity analysis (robustness of causal inferences to individual SNP exclusion).
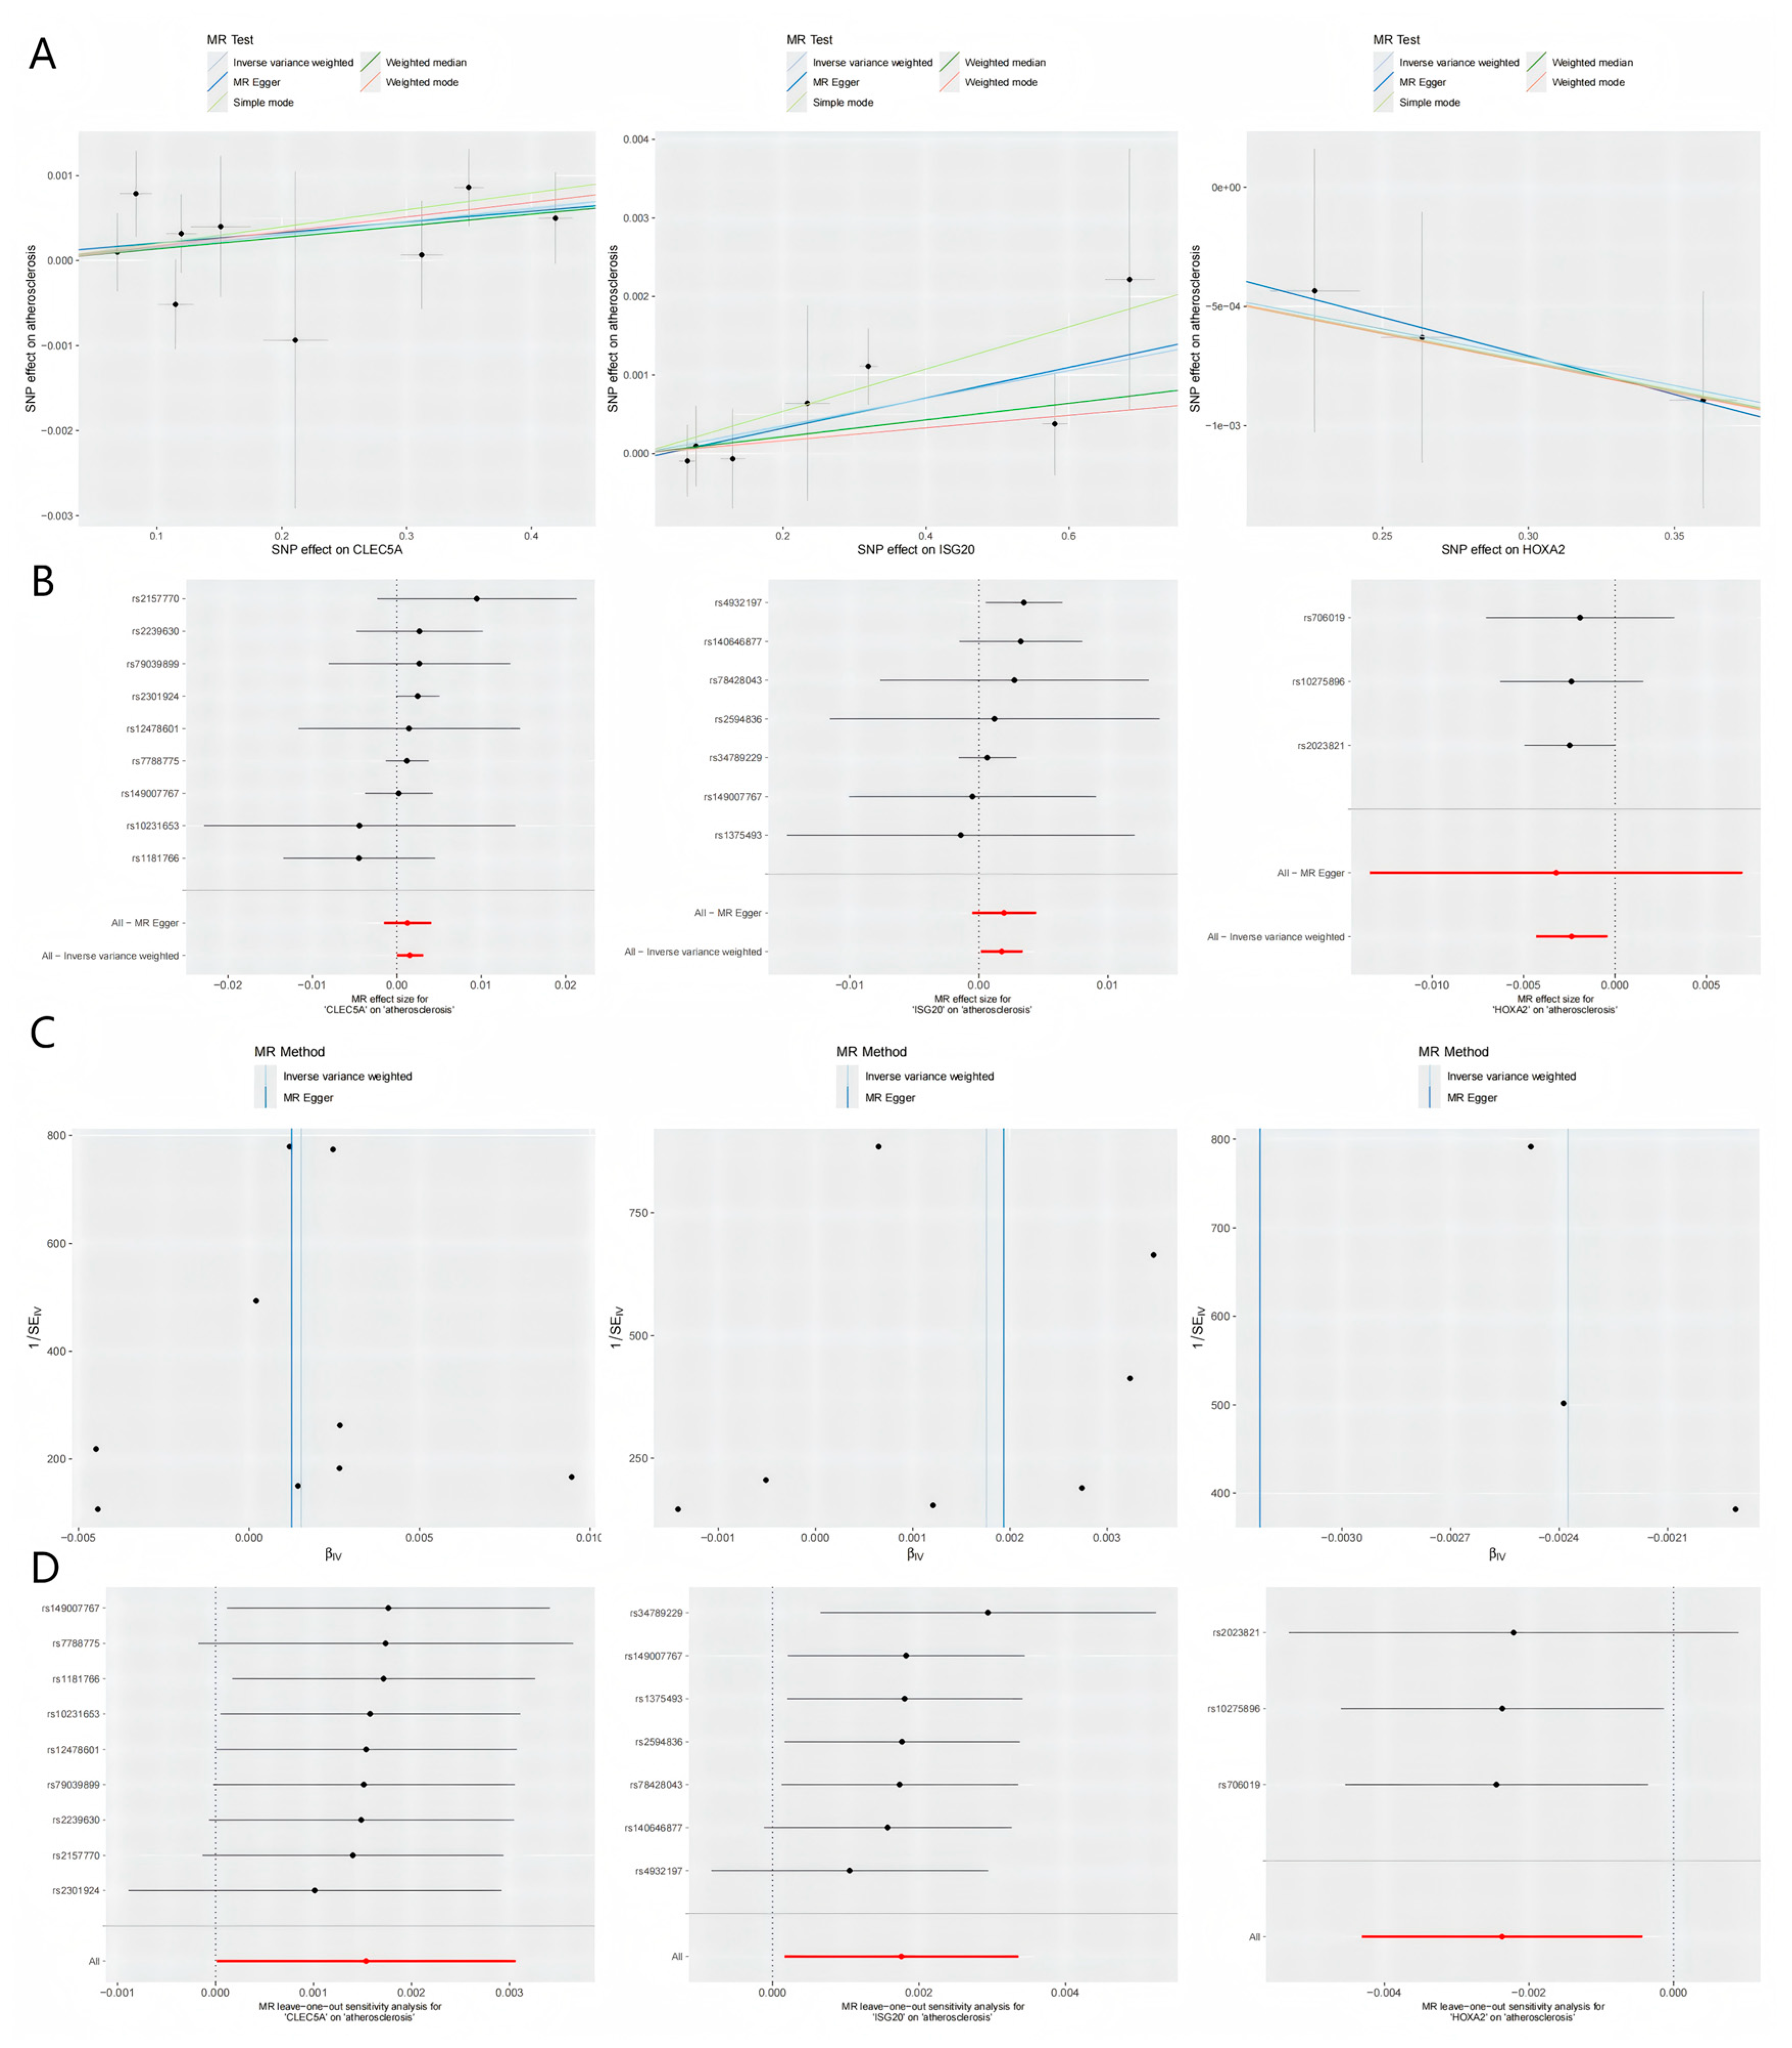
Figure 6.
Chromosomal locations of the genes CLEC5A, ISG20, and HOXA2 in the human genome.CLEC5A: Chromosome 7q34.ISG20: Chromosome 15q26.1.HOXA2: Chromosome 7p15.2.
Figure 6.
Chromosomal locations of the genes CLEC5A, ISG20, and HOXA2 in the human genome.CLEC5A: Chromosome 7q34.ISG20: Chromosome 15q26.1.HOXA2: Chromosome 7p15.2.

Figure 7.
Immune Cell Infiltration Analysis.(A) The heatmap depicting the relative proportions of 22 immune cell subtypes across all samples.(B) Comparative analysis of naïve B cells and follicular helper T cells between the experimental (atherosclerosis) and control groups, demonstrating significant reductions in these subtypes in atherosclerotic samples (P < 0.05, Student’s t-test).(C) Heatmap illustrating correlation patterns between the co-expressed genes (CLEC5A, ISG20, HOXA2) and immune cell subtypes. Positive correlations (red) and negative correlations (blue) reflect gene-immune cell interactions. Key associations include:CLEC5A: Positive with macrophages/activated dendritic cells; negative with B cells/resting NK cells.ISG20: Positive with plasma cells/M0 macrophages; negative with monocytes/activated dendritic cells.HOXA2: Positive with follicular helper T cells; negative with monocytes/resting dendritic cells.
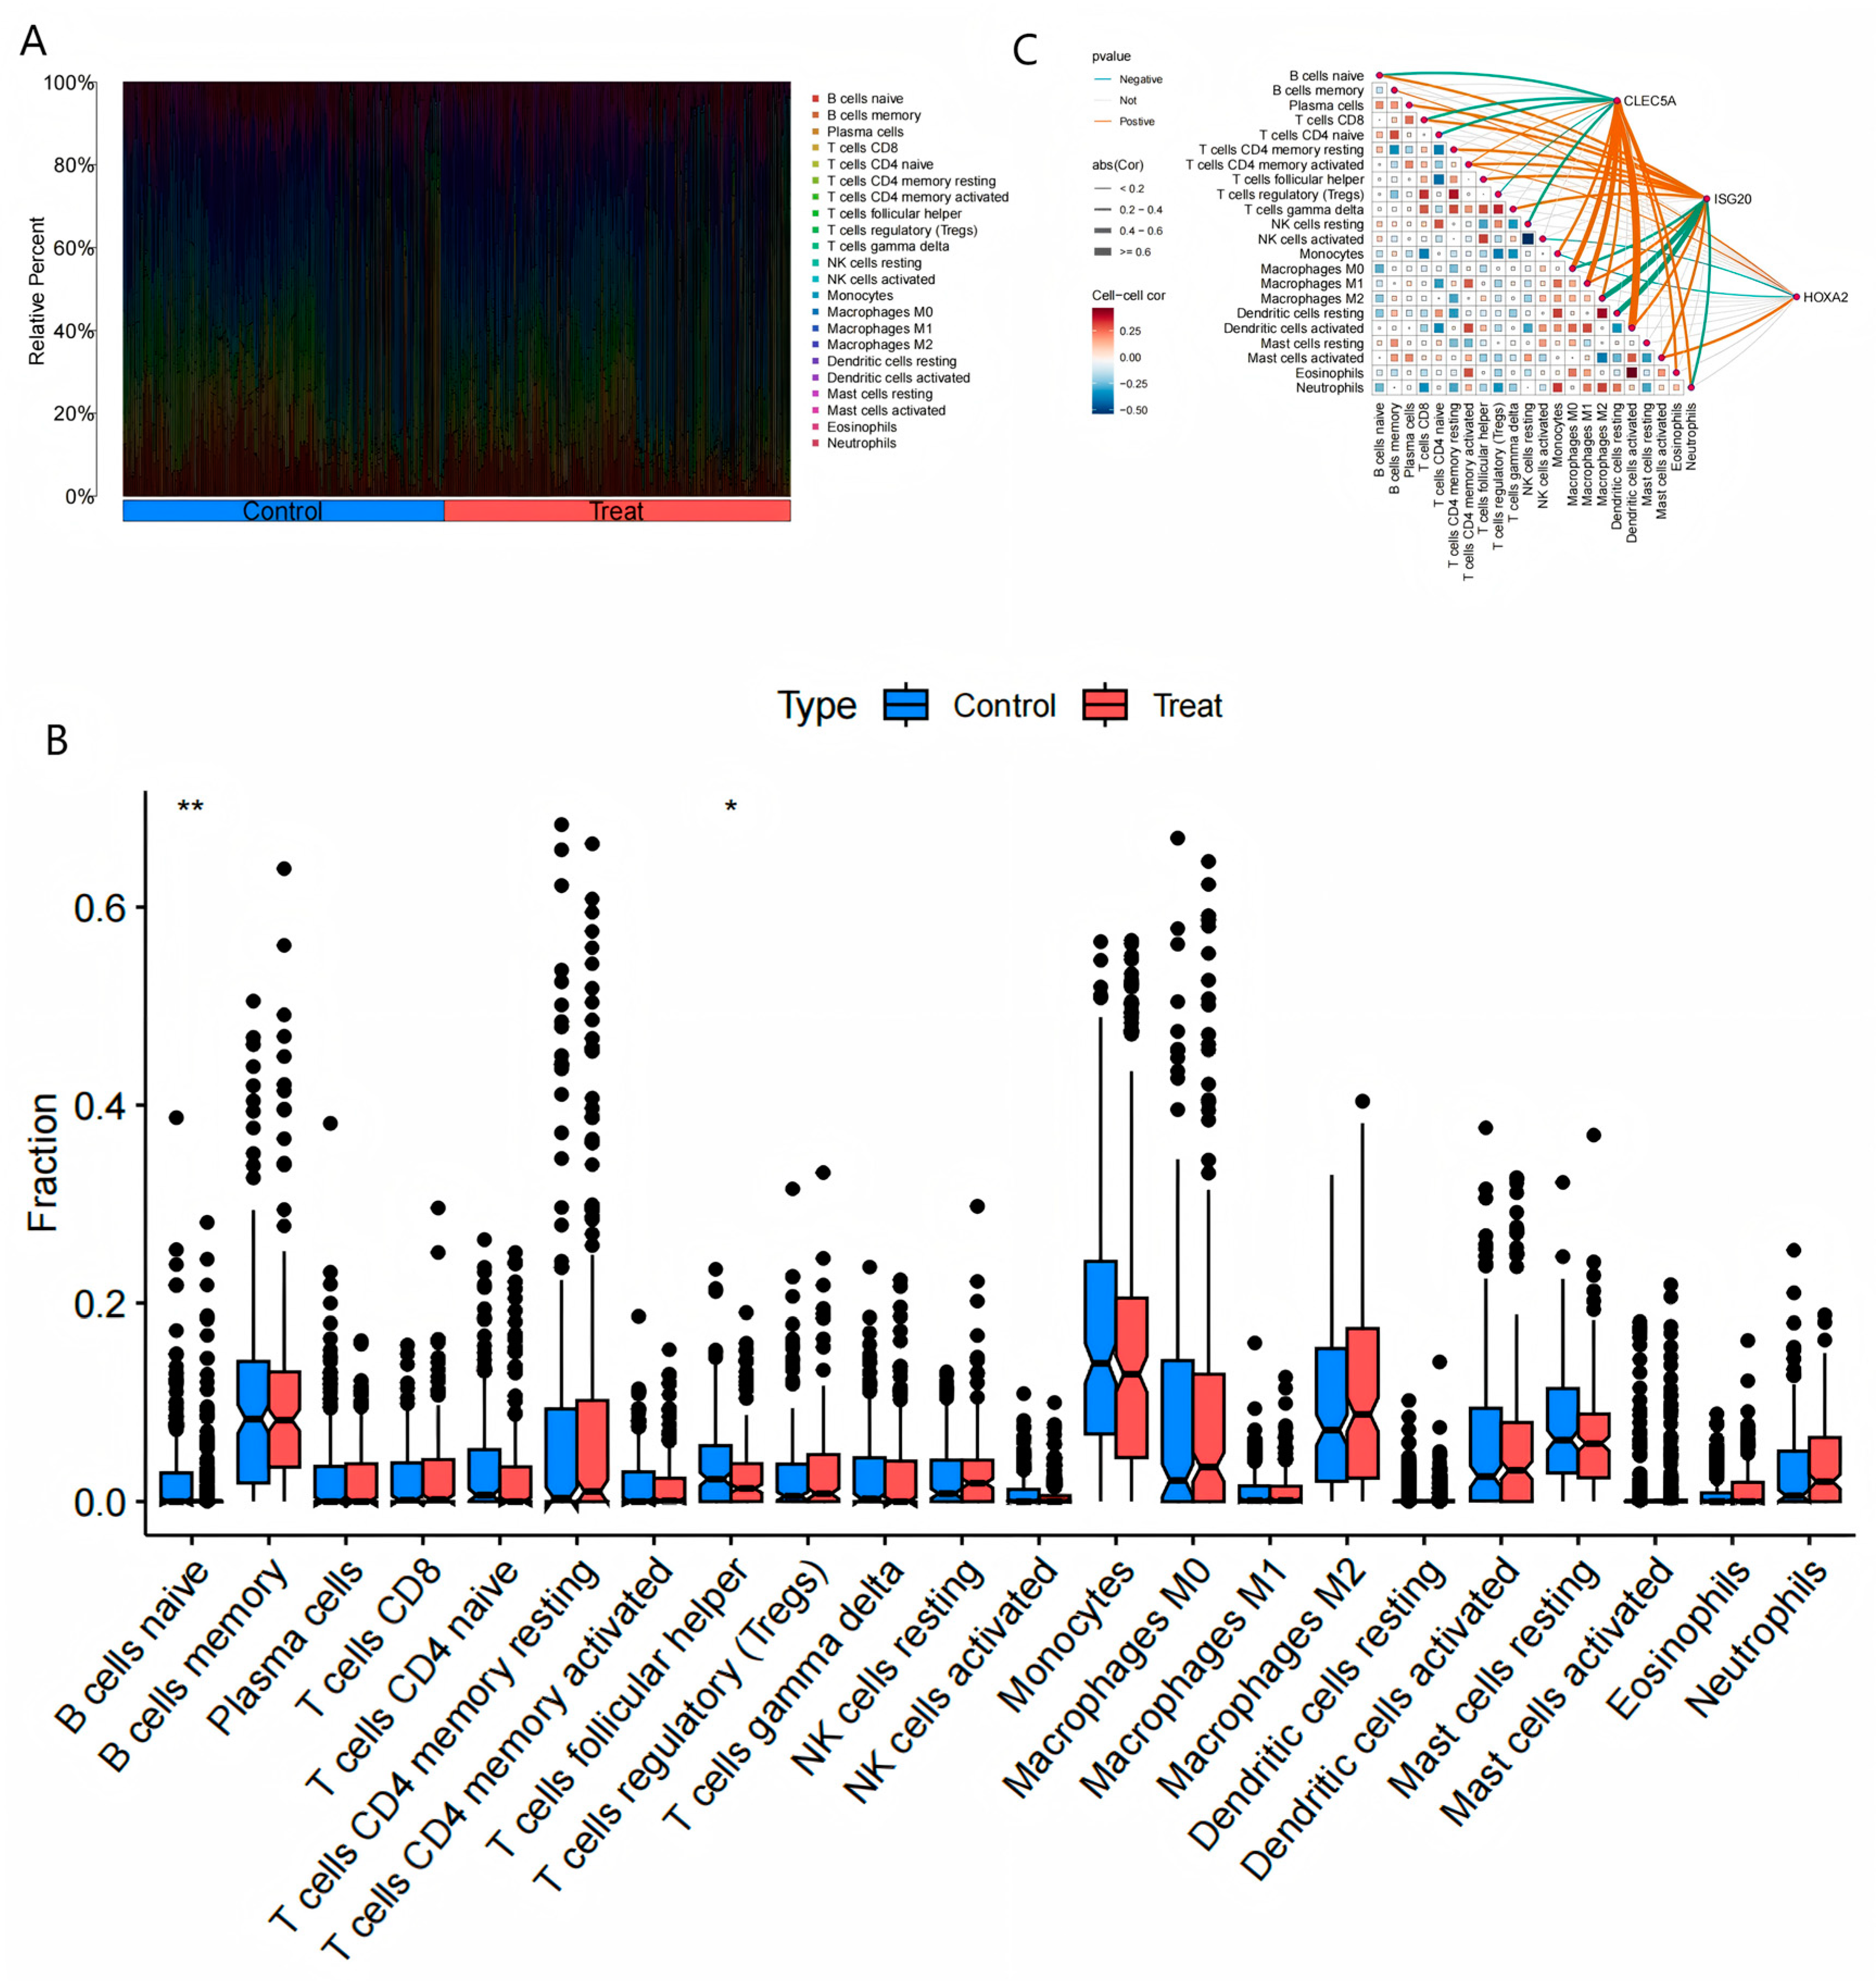
Figure 8.
Box plots illustrating the differential expression of the upregulated genes CLEC5A and ISG20, and the downregulated gene HOXA2 between the experimental (atherosclerosis) and control (healthy) groups.
Figure 8.
Box plots illustrating the differential expression of the upregulated genes CLEC5A and ISG20, and the downregulated gene HOXA2 between the experimental (atherosclerosis) and control (healthy) groups.
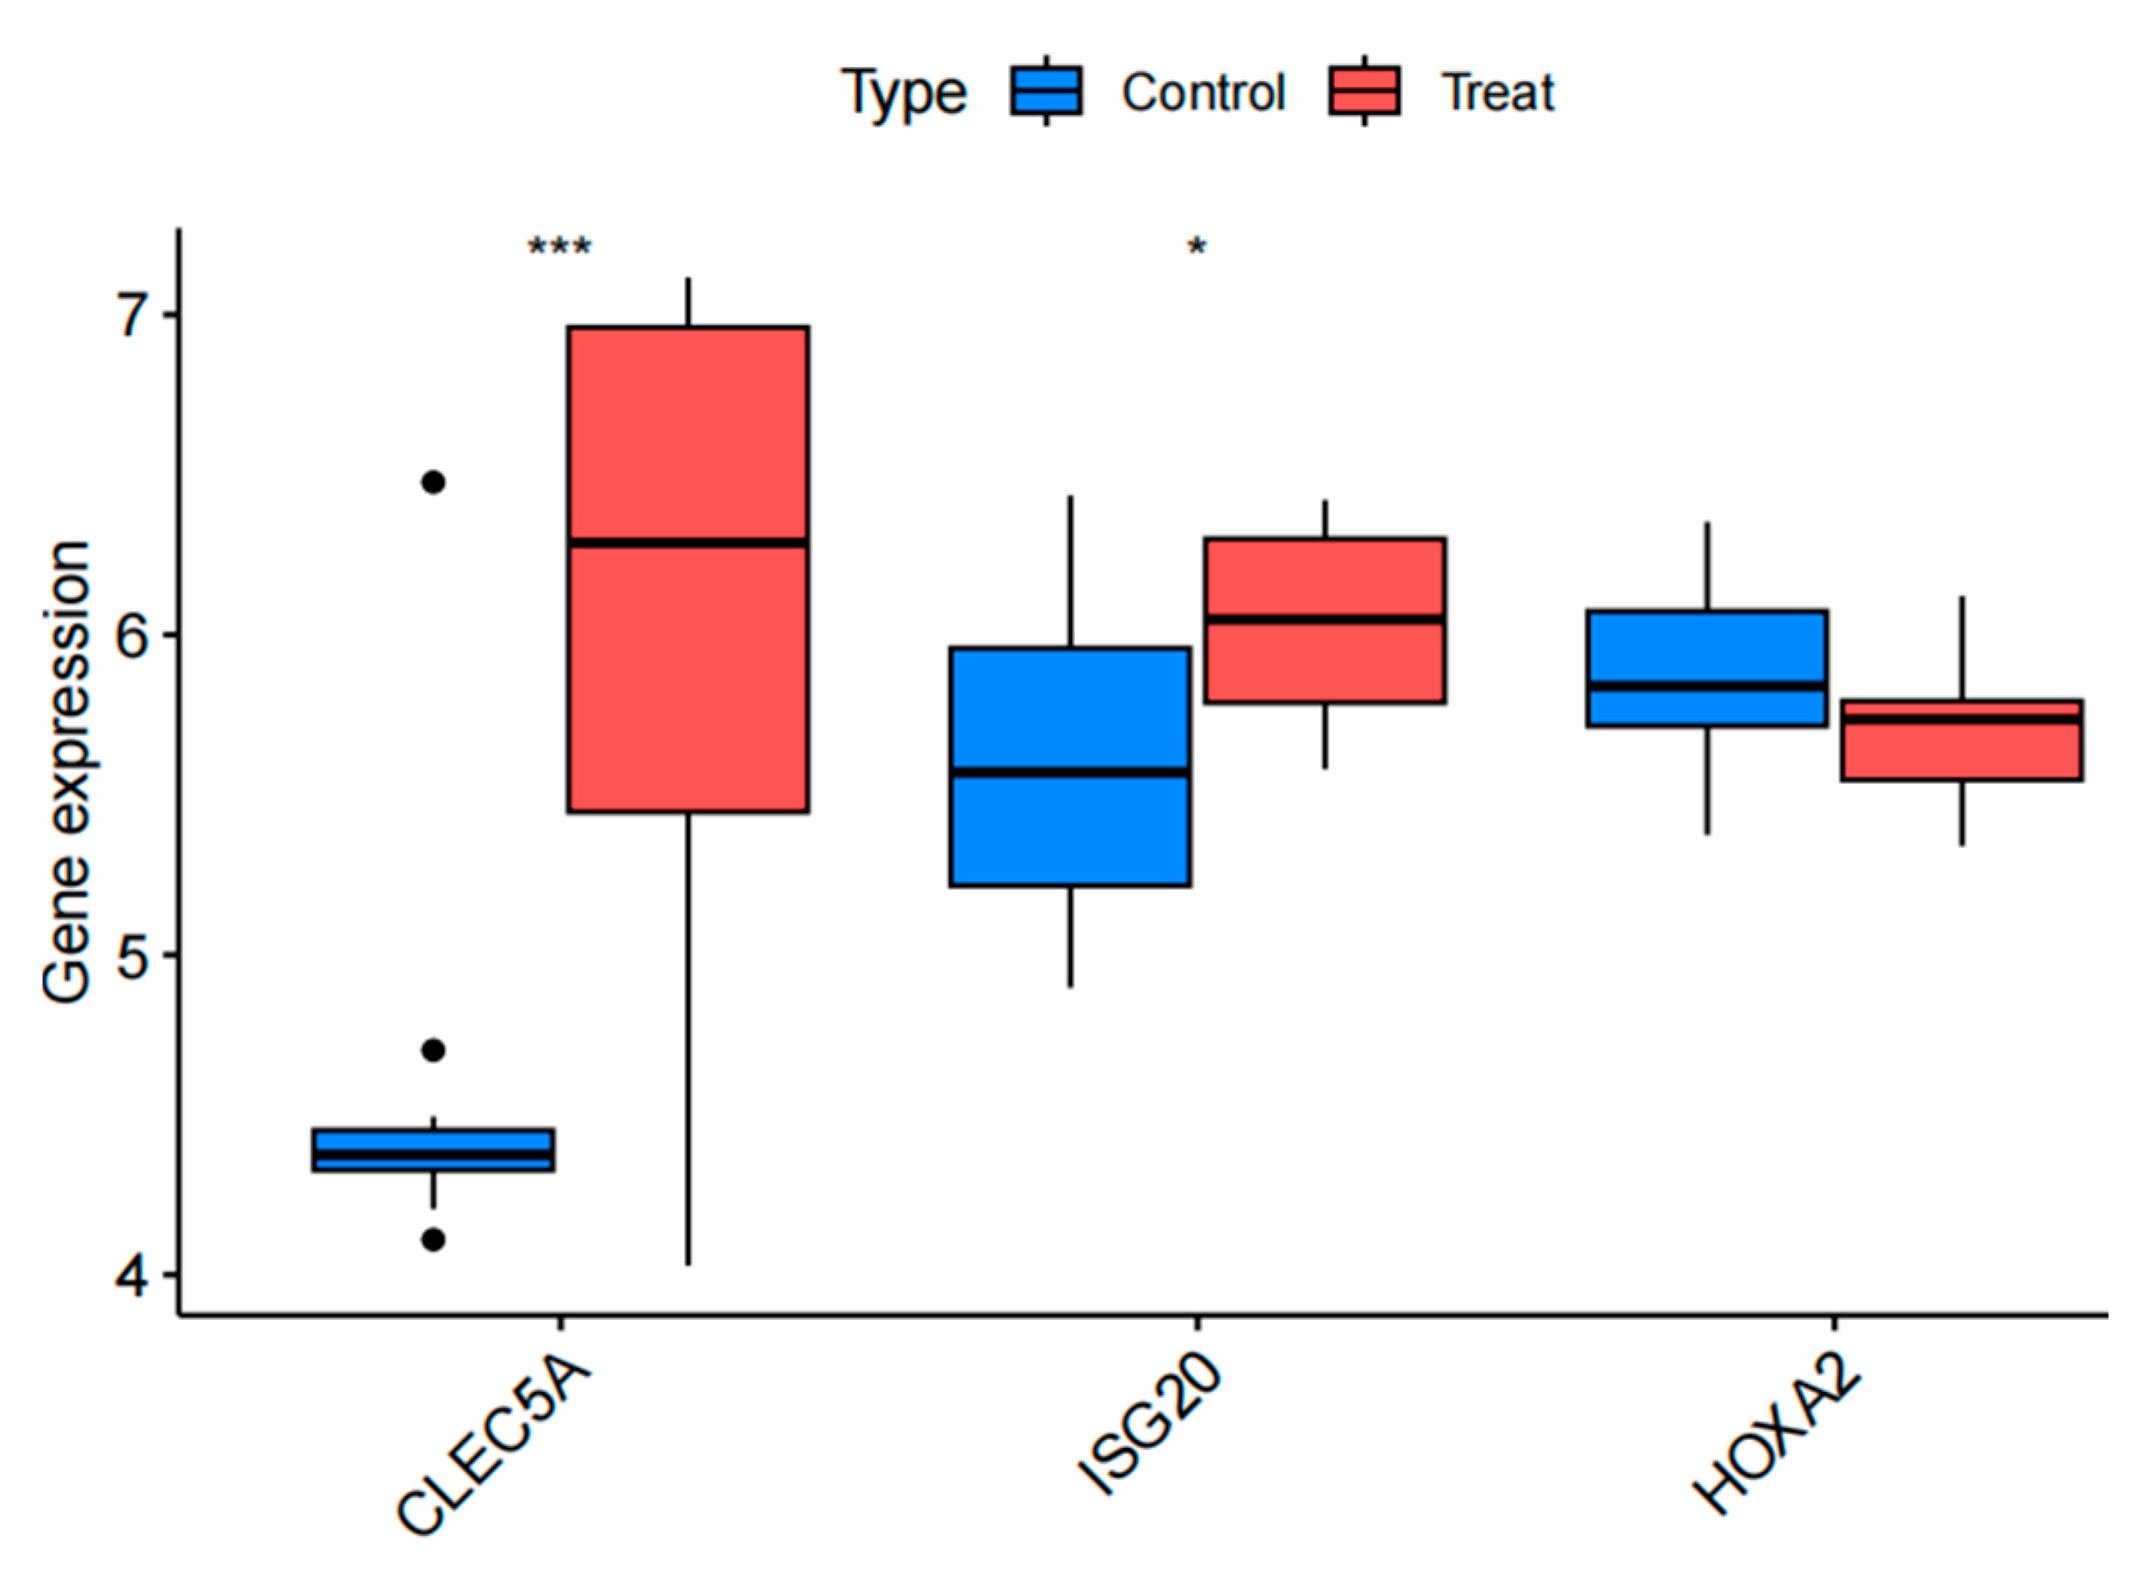
Figure 9.
Analysis of ISG20 Expression and Its Role in Atherosclerosis (AS).(A) Immunofluorescence staining showing intracellular uptake of Nile Red-labeled oxidized low-density lipoprotein (ox-LDL). Red fluorescence indicates ox-LDL uptake, blue fluorescence represents DAPI-stained nuclei, and merged images demonstrate colocalization.(B) Western blot analysis of ISG20 protein expression in cells treated with vehicle (control) or ox-LDL. GAPDH served as a loading control.(C) Quantitative analysis of ISG20 protein expression normalized to GAPDH in control versus ox-LDL-treated cells. Data are presented as mean ± SEM; P < 0.01 (Student’s t-test).(D) RT-qPCR analysis of ISG20 mRNA expression in control versus ox-LDL-treated cells, normalized to GAPDH. Data are presented as mean ± SEM; P < 0.0001.(E) Hematoxylin and eosin (H&E) staining of aortic tissue sections from control and AS groups, revealing structural alterations in the aortic wall.(F) Immunohistochemical staining of ISG20 protein in aortic sections from control and AS groups, highlighting ISG20 expression within the aortic wall. Scale bar: 50 μm.
Disclaimer/Publisher’s Note: The statements, opinions and data contained in all publications are solely those of the individual author(s) and contributor(s) and not of MDPI and/or the editor(s). MDPI and/or the editor(s) disclaim responsibility for any injury to people or property resulting from any ideas, methods, instructions or products referred to in the content. |
© 2025 by the authors. Licensee MDPI, Basel, Switzerland. This article is an open access article distributed under the terms and conditions of the Creative Commons Attribution (CC BY) license (http://creativecommons.org/licenses/by/4.0/).
Copyright: This open access article is published under a Creative Commons CC BY 4.0 license, which permit the free download, distribution, and reuse, provided that the author and preprint are cited in any reuse.


