Submitted:
01 August 2024
Posted:
02 August 2024
You are already at the latest version
Abstract
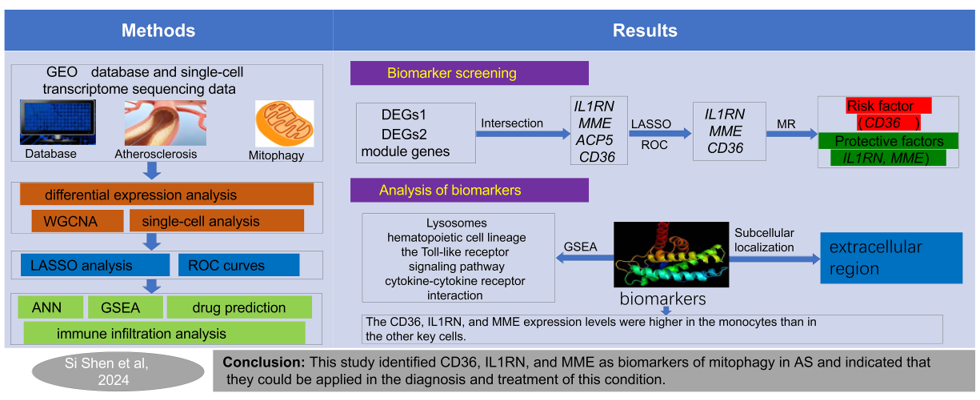
Related studies have shown that mitophagy plays a role in the progression of Atherosclerosis (AS). Utilizing GSE43292, GSE100927, and GSE159677 datasets, WGCNA and differential expression analysis identified mitophagy-related module genes and DEGs1, while single-cell analysis screened DEGs2. MR analysis revealed causal AS-linked genes in DEGs1. LASSO and expression validation identified biomarkers, evaluated via ROC curves. Further analyses included GSEA, immune infiltration, ANN, regulatory networks, and drug prediction. Four candidate genes were identified through WGCNA, differential expression analysis and MR analysis. The LASSO analysis identified CD36, IL1RN, and MME as biomarkers, while the MR analysis showed that IL1RN and MME are protective factors and CD36 is a risk factor in AS. The ROC curves disclosed that the ANN model had greater diagnostic power for AS than any other biomarker. The GSEA revealed that the biomarkers were enriched in lysosomes and hematopoietic cell lineage and were significantly positively correlated with monocytes. The regulatory network construct showed that small nucleolar RNA host gene 16 regulates MME via the micro RNAs. This study identified CD36, IL1RN, and MME as biomarkers of mitophagy in AS and indicated that they could be applied in the diagnosis and treatment of this condition.
Keywords:
atherosclerosis
; monocyte
; mendelian randomization
; mitophagy
; single-cell RNA sequencing
1. Introduction
Atherosclerosis (AS) is a chronic inflammatory disease of the blood vessels. Cell death, vascular endothelial damage, and vascular inflammatory infiltration are the key pathological mechanisms of AS [1]. Plaque rupture, thrombosis, and stenotic blood flow obstruction in vascular lumens may lead to coronary artery disease, ischemic cerebral infarction, and peripheral artery disease. Hence, AS is a major cause of high mortality and disability worldwide [2]. AS is most commonly treated with statins which reduce low-density lipoprotein (LDL) levels but not the incidence of major adverse cardiovascular events (MACEs) [3,4]. Thus, the complex mechanisms of AS onset and progression must be elucidated to develop efficacious prophylactic and therapeutic measures for it.
Mitophagy is selective mitochondrial degradation. It is induced by various factors that are deleterious to cells and clears damaged and dysfunctional mitochondria via a unique molecular mechanism [5]. Mitophagy regulates cardiovascular activity through different pathways and is implicated in the pathophysiology of various cardiovascular diseases (CVDs) such as hypertension, arteriosclerosis, myocardial ischemia-reperfusion injury, and heart failure (HF) [6,7,8]. Mitochondrial dysfunction and AS are associated mainly with oxidative stress, abnormal ATP biosynthesis, extensive cell injury, and apoptosis [9,10]. Unstable atherosclerotic plaques have a typical autophagic ultrastructure. Nevertheless, the mechanisms connecting mitophagy and AS are unknown. Therefore, it is necessary to assess the feasibility of mitophagy-related genes (MRGs) as diagnostic and therapeutic biomarkers of AS [11].
Single-cell RNA sequencing (scRNA-Seq) techniques reveal similarities and differences between and among individual cells [12]. ScRNA-Seq is now widely used in the field of CVD research as it generates detailed transcriptional profiles of the various cell types related to AS [13,14]. ScRNA-Seq detects and identifies rare and easily overlooked cell populations and helps clarify the molecular mechanisms of various diseases [13]. Therefore, the present study used single-cell datasets to investigate the cellular-level expression of AS biomarkers.
Mendelian randomization (MR) uses genetic variants as instrumental variables (IVs) to analyze the causality between exposure factors and disease outcomes [12]. As genotypes are determined at conception, they are at a low risk of confounding and reverse causality. Hence, causality between exposure factors and disease outcomes can be effectively analyzed [15]. Prior studies showed that the genetic predisposition to arteriosclerosis may be evaluated through causal reasoning [16,17,18]. Here, we applied MR analysis to (a) screen genes associated with AS causality and (b) facilitate precision research.
To the best of our knowledge, variations in the MRGs related to AS have seldom been reported. For this reason, the present work aimed to explore the cause/effect association between specific mitophagy-related genes and AS onset and progression. Bioinformatics and MR analyses were implemented to detect biomarkers associated with mitophagy in AS. Single-cell analysis identified the key cell types connected to AS and measured their AS biomarker expression levels. It is believed that the discoveries made herein will facilitate clinical AS prophylaxis and therapy.
2. Results
2.1. A total of 4,001 module genes and 102 DEGs1 were obtained in AS
The Wilcoxon signed-rank test revealed that the MRG ssGSEA score was significantly lower for the AS than the normal tissue group (Figure 1a). The clustering analysis indicated that there was no obvious outlier in the GSE43292 dataset (Figure S1). Seven was selected as the soft threshold. The gene interactions were consistent with the scale-free network distribution (Figure 1b). The black (correlation coefficient (COR) = 0.56; p < 0.05) and blue (COR = -0.51; p < 0.05) modules were the most strongly positively and negatively correlated, respectively, with the MRG ssGSEA score (Figure 1c,d) and accounted for 4,001 module genes. The differential expression analysis generated 102 DEGs1 of which 49 were upregulated and 53 were downregulated in AS (Figure 1e,f).
2.2. ScRNA-Seq analysis identified 818 DEGs2
Before QC, 1,000 genes were detected in the cells, the total expression level for all genes was < 25,000, the proportion of mitochondrial genes was < 20%, and the proportion of erythrocytic genes was ~0 (Figure S2). After QC, we obtained 51,721 cells and 22,615 genes (Figure S3). The top 2,000 highly variable genes were determined and the top 10 of these were displayed (Figure 2a). The cells were then grouped into 19 taxa based on an optimal latitude value of 20 (Figure 2b-c). The annotation revealed eight distinct cell types including B cells, endothelial cells, monocytes, neutrophils, NK cells, smooth muscle cells, T cells, and tissue stem cells. However, T cells were the majority in both the AS and normal tissue groups. Endothelial cells and monocytes accounted for the second largest proportions in the normal and AS tissue groups, respectively (Figure 2d-e). The expression levels of monocytes, NK cells, and T cells were higher in the AS tissue group than in the normal tissue group. The opposite was true for neutrophils (Figure 2f). We obtained 818 DEGs2 after the repeats were removed.
2.3. IL1RN, MME, ACP5 and CD36 detected and identified by MR analysis
Twenty-two genes had significant causal relationships with AS (Table 1). Acid phosphatase 5, tartrate resistant (ACP5), CD36, IL1RN, and MME were obtained by intersecting all 22 genes with the 818 DEGs2 and the 4,001 module genes (Figure 3a). The positive and negative slopes of the scatterplot show genes that are risk and protective factors for AS, respectively. Here, IL1RN and MME are protective factors while ACP5 and CD36 are risk factors for AS (Figure S4). The forest plot confirmed the results of the scatterplot (Figure S5). The funnel plot revealed that while ACP5 and CD36 conformed to Mendel’s second law, IL1RN and MME did not. A sensitivity analysis validated the reliability of the MR analysis (Figure S6). The Q p-values were all > 0.05 for ACP5, CD36, and IL1RN. Hence, there was no heterogeneity in the exposure factors or the outcome datasets. However, the Q p-value was < 0.05 for MME. Thus, the exposure factors and outcome datasets were heterogeneous (Table 1). As the IVW method was used, however, any potential heterogeneity would have only a minimal impact on the results. The horizontal pleiotropy test disclosed that all four candidate genes had p-values > 0.05. Thus, there were no confounders in the present study (Table 2). The LOO test indicated that there were no major bias points. Therefore, the results were reliable and stable (Figure 3b).
2.4. The ANN model had greater diagnostic power for AS than any other biomarker
The LASSO regression analysis identified CD36, IL1RN, and MME as candidate key genes (Figure 4a), and their expression was verified in both the GSE43292 and GSE100927 datasets. All three genes were significantly upregulated in the AS groups of both datasets (Figure 4b-c). For this reason, they were designated AS biomarkers. All three genes had AUC > 0.7 in both datasets. Hence, the biomarkers had adequate diagnostic efficacy (Figure 4d-e).
We then constructed an ANN network based on the three foregoing biomarkers. A hidden layer containing two neurons was detected (Figure 5a). The ROC curves indicated that the diagnostic power of the ANN model was greater than those of the biomarkers as the AUC values of the former were 0.842 and 1 in the GSE43292 and GSE100927 datasets, respectively (Figure 5b-c). The subcellular localization analysis revealed that all three genes were distributed primarily in the extracellular region and, to a lesser extent, in the cytoplasm, endoplasmic reticulum (ER), mitochondria, and nucleus (Figure 5d).
2.5. Significant strong positive correlations between the biomarkers and monocytes
The GSEA showed that CD36, IL1RN, and MME were significantly enriched in 63, 58, and 65 pathways, respectively. The top five pathways were displayed and they disclosed that CD36, IL1RN, and MME were enriched in lysosomes, hematopoietic cell lineage, the Toll-like receptor signaling pathway, and cytokine-cytokine receptor interaction (Figure 6a-c). The degrees of infiltration of the 22 immune cells are illustrated in Supplementary Figure S7. Of the ten immune cells obtained by filtration, five differed between the AS and normal tissue groups. Naive B cells, CD8 T cells, activated NK cells, and monocytes were significantly upregulated in the normal tissue group whereas M0 macrophages were significantly upregulated in the AS group (Figure 6d). The monocytes were obtained by intersecting five different immune cells while the nine immune cells were obtained by LASSO analysis (Figures S8 and S9). The ROC curve for the monocytes had AUC = 0.675. Hence, monocytes had relatively superior diagnostic efficacy for AS (Figure 6e). The correlation analysis showed significant correlations between the biomarkers and the monocytes (|R| > 0.4; p < 0.05) (Figure 6f).
2.6. SNHG16 regulated MME through hsa-miR-216a-3p, hsa-miR-3681-3p and hsa-miR-128-3p
We predicted three miRNAs, 11 lncRNAs, and 17 transcription factors (TFs) related to MME. We then established a ceRNA network comprising one mRNA, three miRNAs, and 11 lncRNAs as well as a TF-mRNA-miRNA network comprising one mRNA, three miRNAs, and 17 TFs (Figure 7a,b). We found that SNHG16 regulates MME via hsa-miR-216a-3p, hsa-miR-3681-3p, and hsa-miR-128-3p and predicted 12 drugs targeting CD36, IL1RN, and MME. ABT-510 targeted CD36; diacerein, haloperidol, and methotrexate targeted IL1RN; and candoxatril, LCZ696, pepinemab, sampatrilat, SLV-334, gallopamil, ilepatril, and sacubitril targeted MME (Figure 7c).
2.7. Cellular- and transcriptome-level verification of CD36, IL1RN, and MME expression
3. Discussion
Recent studies have shown that mitophagy may impede the progression of AS by scavenging damaged mitochondria, promoting mitochondrial regeneration, hindering ROS accumulation, mitigating vascular endothelial damage, inhibiting macrophage apoptosis, and suppressing the activation of thermoprotein domain-related protein 3 (NLRP3) inflammasome in the nucleotide oligomerization domain (NOD)-like receptor [9,10,19,20]. ScRNA-Seq generates detailed transcriptional profiles of the various cell types associated with AS. This technique has been widely used to elucidate the molecular mechanisms of various CVDs. MR analysis clarifies the causal relationships between the exposure factors and the outcomes of CVDs. Investigating the modes of action of MRGs in AS may facilitate the clinical diagnosis and treatment of this disorder. Here, scRNA-Seq, transcriptome analysis, and AS-related GEO datasets identified three mitophagy-related biomarkers in AS, namely, CD36, IL1RN, and MME.
The human CD36 gene is located on chromosome 7q11.2 and regulates long-chain fatty acid (LCFA) uptake [21]. We discovered that CD36 is a risk factor in AS, is upregulated in AS cells, is internalized by foam cells, and exacerbates AS progression [22]. CD36 inhibits macrophage migration in oxLDL tissue, activates the NLRP3 inflammasome, and induces an inflammatory response [23].
Most IL-1 family cytokines are secreted extracellularly. However, IL1RN encodes a signaling peptide that secretes cytokines via the ER and the Golgi apparatus [24]. Here, we observed that IL1RN exerted a protective effect against AS. IL1RN represses AS pathogenesis as it is upregulated when M2 macrophages are transformed into M1 macrophages [25].
The transmembrane glycoprotein membrane metalloendopeptidase (MME) degrades various substrates. It might be implicated in tumor onset and progression as its mRNA and protein levels are significantly lower in tumors than in adjacent healthy/normal tissues [26]. To the best of our knowledge, the present work is one of the first to find and report that MME is involved in the development of AS.
We observed that the lysosome, hematopoietic lineage, Toll-like receptor signaling, and cytokine-cytokine receptor interaction pathways were co-expressed by all three biomarkers. The aforementioned pathways are associated with AS [27,28,29,30].
Lysosomes participate in degradation, the innate and adaptive immune systems, and nutrient sensing [31]. They protect blood vessels against oxidative damage and improve vascular proliferation. Lysosomal dysfunction may contribute to AS pathology by modulating autophagy, inflammasomes, apoptosis, and lysosomal biosynthesis [30,32,33].
Reorganization of the morphology of the hematopoietic lineage reduces the numbers and alters the phenotypes of macrophages. The rapid and efficient clearance of apoptotic cells by macrophages is vital to the amelioration of AS. Nevertheless, macrophage dysfunction may accelerate the onset and progression of this condition [34,35].
Toll-like receptors (TLRs) are expressed on dendritic cells (DCs) and macrophages. They sense pathogenic factors, induce adaptive immunity, and regulate certain acute and chronic inflammatory diseases [36,37]. AS has been categorized as the latter. Endothelial dysfunction and certain immune cell interactions initiate TLRs. The activation of other inflammatory pathways also initiates and advances AS [38,39].
The biomarkers detected herein were closely associated with the AS immune microenvironment. Naive B cells, CD8 T cells, activated NK cells, and monocytes were upregulated in the normal tissue group whereas M0 macrophages were upregulated in the AS tissue group. Naive B cells are major components of adaptive immunity [40]. In response to IL-5 stimulation, they may enhance oxLDL uptake and the formation of foam cells secreting oxLDL-specific native immunoglobulin M (IgM) antibodies. Foam cells promote the clearance of apoptotic cells and, by extension, confer protection against AS [41]. T cells are key drivers and modifiers in AS pathogenesis [42]. CD8+ T cells regulate monocyte and macrophage accumulation early in AS progression [29,43]. CD8+ T cells regulate monocyte and macrophage accumulation early in AS progression [42]. In AS plaques, CD8+ T cells are cytotoxic, cause macrophage death, and form necrotic core [43]. NK cells are activated in high-fat environments, migrate toward AS lesions, and promote the death of diseased cells that abound in vulnerable unstable plaques. Hence, the killing function of NK cells is critical in plaque rupture and AS onset [44]. Monocytes are components of the innate immune system and are activated by low-density lipoproteins (LDL) and other stimulants. Activated monocytes release inflammatory factors and are considered proinflammatory cells [41]. During AS, monocytes differentiate into macrophages and the latter generate clusters of foam cells that become necrotic cores and contribute to the formation of AS plaques [45]. Within the latter, inflammatory cell infiltration results from the accumulation of substances secreted by macrophages. When M0 macrophages transform into M1 macrophages, proinflammatory cytokines are secreted and plaque inflammation is promoted. Inflammatory macrophages and foam cells also secrete proinflammatory cytokines and matrix metalloproteinases (MMPs) which destabilize and promote the rupture of plaque [46].
4. Materials and Methods
4.1. Data extraction
The GSE43292, GSE100927, and GSE159677 datasets were acquired from the Gene Expression Omnibus (GEO) database (https://www.ncbi.nlm.nih.gov/) and their sequencing platforms were GPL6244, GPL17077, and GPL18573, respectively. GSE43292 was a training set and included 32 AS and 32 adjacent normal carotid artery tissue samples. GSE100927 was a validation set and included 29 AS and 12 adjacent normal carotid artery tissue samples. The single-cell dataset GSE159677 included three AS and three adjacent normal carotid artery tissue samples. Furthermore, 29 mitophagy-related genes (MRGs) were selected from the Reactome Pathway Database (https://reactome.org/download-data) by searching for keywords in the Molecular Signatures Database (MsigDB) (https://www.gsea-msigdb.org/gsea/msigdb/index.jsp) [49].
4.2. Weighted Gene Co-expression Network analysis (WGCNA)
The score for the single-sample gene set enrichment analysis (ssGSEA) of the MRGs calculated for all the samples in the GSE43292 dataset served as a trait. WGCNA v. 1.71 [50] was used to construct a co-expression network that would identify the module genes most strongly correlated with the ssGSEA score. The ssGSEA enrichment score was applied to all MRGs based on all the training set genes via GSVA v. 1.46.0 [51]. The Wilcoxon signed-rank test was used to compare the differences in the MRG scores between the AS and normal tissue samples. Clustering analysis was conducted on all the samples in the GSE43292 dataset to detect and eliminate any potential outliers. A soft threshold was screened to conform the gene interactions to the scale-free distribution. A dynamic tree cut (DTC) algorithm was used to identify various modules according to the predetermined soft threshold. The screening criteria were: (a) minimum module size = 100, (b) deepsplit value = 4, and (c) mergcutheight value = 0.25. The module most strongly correlated with the ssGSEA score was selected and the genes therein were designated module genes.
4.3. Single-cell RNA-seq (scRNA-Seq) analysis
Limma v. 3.50.1 [52]was used to screen differentially expressed genes (DEGs) between the AS and normal tissue groups in the GSE43292 dataset. The foregoing genes were designated DEGs1 and the screening parameters were (a) p.adjust < 0.05 and (b) |log2 fold change (FC)| > 1. A volcano plot was generated with ggplot2 v. 3.4.1 [53]to visualize the DEGs. The top ten upregulated and top ten downregulated genes were labeled according to their |log2FC| values. A DEG heatmap was plotted with ComplexHeatmap v. 2.14.0 [54].
4.4. Differential expression analysis
The GSE159677 dataset (single-cell transcriptome sequencing data) was subjected to quality control (QC) with Seurat v. 4.1.0 [55]. The screening criteria were: (a) 200–2,500 genes/cell, (b) < 10% of all genes are mitochondrial, and (c) < 3% of all genes are erythrocytic. Highly variable genes were identified using the FindVariableFeatures function in Seurat and were based on large coefficients of variation (CV) between cells. The top 2,000 highly variable genes were selected for further analysis. A principal components analysis (PCA) was performed on them to reduce their linear dimensionality and determine the optimal latitude value for cell clustering. Unsupervised clustering analysis was conducted on the filtered cells with the FindNeighbors (https://satijalab.org/seurat/reference/findneighbors) and FindClusters (https://satijalab.org/seurat/reference/findclusters) functions in Seurat v. 4.1.0 [55]. The FindAllMarkers function (https://satijalab.org/seurat/reference/findallmarkers) was employed to identify important marker genes associated with various clusters. The cell types were named based on the expression patterns of the marker genes in each cluster. SingleR v. 1.8.0 [56] was applied to notate the clustering and identify the different cell types. The cell clustering plot was visualized by uniform manifold approximation and projection (UMAP) (https://github.com/lmcinnes/umap). Scale plots were utilized to determine the abundance of each cell type in the AS and normal tissue samples. The Kruskal-Wallis test was used to screen significant differences in the cell types between the AS and normal tissues. A differential expression analysis was performed using the FindMarkers function (https://satijalab.org/seurat/reference/findmarkers) in Seurat v. 4.1.0 to identify the differentially expressed cells between the AS and normal tissue [55] as well as the differentially expressed genes (DEGs) designated DEGs2. The screening thresholds were (a) |log2FC| > 1 and (b) adjust.p < 0.05.
4.5. MR analysis between DEGs1 and AS
The eQTL (expression quantitative trait loci) dataset for DEGs1 and the ukb-d-I9_CORATHER (coronary atherosclerosis) dataset associated with AS were obtained from the Integrative Epidemiology Unit Genome-Wide Association Study (IEU OpenGWAS) Database (https://gwas.mrcieu.ac.uk/) and applied as exposure factors and outcomes, respectively. The ukb-d-I9_CORATHER dataset included 14,334 AS samples, 346,860 control samples, and 13,586,589 single-nucleotide polymorphisms (SNPs). Exposure factors and outcomes were determined and IVs were screened with TwoSampleMR(27). The SNPs that were significantly associated with the exposure factors (p < 5 × 10⁻⁶; clump = TRUE) and unrelated to the outcomes were selected as the IVs. The linkage disequilibria (LD) of the IVs were removed by setting R2 = 0.001 and kb = 10. The Harmonise_data function (https://mrcieu.github.io/TwoSampleMR/articles/harmonise.html) in TwoSampleMR v. 0.5.6 [57] unified the effect allele and effect size while the MR function was applied to combine MR Egger, weighted median, inverse variance weighted (IVW), simple mode, and weighted mode algorithms for the MR analysis [58]. IVW was the main method used (p < 0.05). The assumptions made about the IVs for the MR analysis were that they (a) are closely related to exposure, (b) are unaffected by confounding factors associated with exposure and outcome, and (c) affect the results only through exposure and not via any other biological pathways. VennDiagram v. 1.7.1 (https://cran.r-project.org/web/packages/VennDiagram/index.html) identified the candidate genes by intersecting the genes obtained by the MR analysis, the module genes, and the DEGs. The results of the MR analysis of the candidate genes were merged via scatter, forest, and funnel plots. The reliability of the MR analysis was assessed by sensitivity analysis comprising a heterogeneity test, a horizontal pleiotropy test, and a Leave-One-Out (LOO) analysis performed by the mr_heterogeneity, mr_pleiotropy_test, and mr_leaveoneout functions, respectively, in TwoSampleMR v. 0.5.6 [57].
4.6. Biomarker identification
Candidate genes in the GSE43292 dataset were identified via the least absolute shrinkage and selection operator (LASSO) regression algorithm in glmnet v. 4.1-4 [59]. Candidate key genes with consistent expression trends in both the GSE43292 and GSE100927 datasets were designated biomarkers. Receiver operating characteristic (ROC) curves were plotted to evaluate the diagnostic power of the biomarkers in the foregoing datasets.
4.7. Artificial neural network (ANN) and subcellular localization analysis
ANNs were constructed for the GSE43292 and GSE100927 datasets to assess the overall diagnostic performance of the biomarkers. The ROC curve was plotted to evaluate the diagnostic power of each ANN model. Area under the curve (AUC) values > 0.8 for the ANN model in the GSE43292 and GSE100927 datasets indicated strong diagnostic power. FASTA files were obtained from the GSE43292 dataset to clarify the mechanisms of the biomarkers in AS. The subcellular localizations of the biomarkers were predicted with mRNALocater (http://bio-bigdata.cn/mRNALocater/) [60], and their scores across different sites were calculated.
4.8. Biomarker enrichment and immune infiltration analyses
Based on the median biomarker expression values, the GSE43292 dataset was divided into high- and low-expression groups for the differential expression analysis. The |log2FC| values were calculated and arranged in descending order. A gene set enrichment analysis (GSEA) was performed using clusterProfiler v. 4.2.2 [61]. The Kyoto Encyclopedia of Genes and Genomes (KEGG) c2.cp.keg.v7.4.symbols.gmt gene set from the MSigDB Database (https://www.gsea-msigdb.org/gsea/msigdb) was the background. The CIBERSORT algorithm (https://cibersortx.stanford.edu/) was used to calculate the infiltration of 22 immune cells in all samples from the GSE43292 dataset and explore immune infiltration in AS. The immune cells were filtered based on zero expression of 22 immune cells in 75% of all samples. A box plot was then constructed to detect significant (p < 0.05) differences in the expression levels of the remaining immune cells between the AS and normal tissue samples. Then the 22 immune cells were screened by LASSO analysis. Candidate immune cells were identified from the intersection of both parts. ROC curves were then plotted to evaluate the diagnostic power of the candidate immune cells. Spearman’s rank correlation analysis was then conducted on the GSE43292 dataset to assess the relationship between the biomarkers and the candidate immune cells.
4.9. Regulatory network construction and drug prediction for biomarkers
Competing endogenous RNAs (ceRNA) and TF-mRNA-miRNA networks were constructed to elucidate the mechanism by which the biomarkers are regulated. The targetscan (http://www.targetscan.org/vert 80) and mirdb (http://www.mirdb.org) databases in multiMiR v. 1.20.0 [62] were used to predict the upstream biomarker miRNAs. The key miRNA was identified by intersecting the predicted miRNA results. The starbase database (http://starbase.sysu.edu.cn/index.php) was employed to predict the long non-coding RNAs (lncRNAs) targeting the key miRNA. The hTFtarget database (https://ngdc.ac.cn/databasecommons/database/id/6946) was applied to predict possible biomarker transcription factors (TFs). Cytoscape v. 3.9.1 [63] was utilized to visualize the ceRNA and TF-mRNA-miRNA networks. The biomarkers were imported into the Drug-Gene Interaction Database (DGIDB) (https://dgidb.org) to find small-molecule drugs that could potentially treat AS.
4.10. Validation of biomarker expression
Biomarker expression was verified in the GSE159677 dataset. AUCell v. 1.28.1 [64]analyzed the biomarker expression scores for the differentially expressed cells. Key cells were those with the highest biomarker expression scores. A box plot was constructed to represent the biomarker expression in the key cells.
4.11. Statistical analysis
R software (version 4.2.1) was used to process and analyze the data. Correlation analysis was performed using corrplot package (version 0.92). The p value less than 0.05 was considered statistically significantR v. 4.2.1 (https://cran.r-project.org/bin/windows/base/old/4.2.1/) was used to process and analyze all data. Corrplot v. 0.92 (https://github.com/taiyun/corrplot) was used to perform a correlation analysis. P < 0.05 indicated a statistically significant difference.
5. Conclusions
The present work identified three mitophagy-related AS biomarkers that could facilitate the diagnosis and treatment of AS and improve its prognosis. Nevertheless, this study had certain limitations, and the modes of action and the clinical applications of the aforementioned biomarkers must be clarified in future research.
Supplementary Materials
The following supporting information can be downloaded at the website of this paper posted on Preprints.org. Figure S1: Clustering analysis. Figure S2: Sample distribution for the single-cell analysis before QC. Figure S3: Sample distribution for the single-cell analysis after QC. Figure S4: Scatterplot of candidate genes. FigureS5: Forest plot of candidate genes. Figure S6: Funnel plot of candidate genes. Figure S7: Relative degrees of infiltration of 22 immune cells in all samples from the GSE43292 dataset. Figure S8: LASSO regression analysis of 22 immune cells. Figure S9: Venn diagram showing the intersection of differentially expressed immune cells and those obtained by LASSO regression analysis. Table S1: MR results for 22 genes significantly causally related to AS.
Author Contributions
Conceptualization, Si Shen. and Xin Ren; methodology, Si Shen.; software, Jianyong Liu.; validation, Jianyong Liu., Si Shen. and Xin Ren.; formal analysis, Wen Zhang.; investigation, Si Shen.; resources, Xin Ren.; data curation, Si Shen.; writing—original draft preparation, Xin Ren.; writing—review and editing, Jianyong Liu.; visualization, Wen Zhang.; supervision, Si Shen.; project administration, Xin Ren.; funding acquisition, Wen Zhang. All authors have read and agreed to the published version of the manuscript.
Funding
This research was funded by the National Natural Science Foundation of China, grant number 81673955.
Institutional Review Board Statement
Not applicable.
Informed Consent Statement
Not applicable.
Data Availability Statement
The datasets generated analysed during the current study are available in theavailable online Gene Expression Omnibus (GEO, https://www.ncbi.nlm.nih.gov/geo/).
Acknowledgments
Thank you to all the experts in the laboratory for their valuable suggestions and strong support for this project.
Conflicts of Interest
The authors declare no conflicts of interest.
References
- Welsh, P.; Grassia, G.; Botha, S.; Sattar, N.; Maffia, P. Targeting Inflammation to Reduce Cardiovascular Disease Risk: A Realistic Clinical Prospect? Br. J. Pharmacol. 2017, 174, 3898–3913. [Google Scholar] [CrossRef]
- Libby, P. The Changing Landscape of Atherosclerosis. Nature 2021, 592, 524–533. [Google Scholar] [CrossRef]
- Hill, C.A.; Fernandez, D.M.; Giannarelli, C. Single Cell Analyses to Understand the Immune Continuum in Atherosclerosis. Atherosclerosis 2021, 330, 85–94. [Google Scholar] [CrossRef]
- Bäck, M.; Yurdagul, A.; Tabas, I.; Öörni, K.; Kovanen, P.T. Inflammation and Its Resolution in Atherosclerosis: Mediators and Therapeutic Opportunities. Nat. Rev. Cardiol. 2019, 16, 389–406. [Google Scholar] [CrossRef]
- Nah, J.; Miyamoto, S.; Sadoshima, J. Mitophagy as a Protective Mechanism against Myocardial Stress. Compr. Physiol. 2017, 7, 1407–1424. [Google Scholar] [CrossRef]
- Brown, D.A.; Perry, J.B.; Allen, M.E.; Sabbah, H.N.; Stauffer, B.L.; Shaikh, S.R.; Cleland, J.G.F.; Colucci, W.S.; Butler, J.; Voors, A.A.; et al. Expert Consensus Document: Mitochondrial Function as a Therapeutic Target in Heart Failure. Nat. Rev. Cardiol. 2017, 14, 238–250. [Google Scholar] [CrossRef]
- Lopez-Crisosto, C.; Pennanen, C.; Vasquez-Trincado, C.; Morales, P.E.; Bravo-Sagua, R.; Quest, A.F.G.; Chiong, M.; Lavandero, S. Sarcoplasmic Reticulum-Mitochondria Communication in Cardiovascular Pathophysiology. Nat. Rev. Cardiol. 2017, 14, 342–360. [Google Scholar] [CrossRef]
- Bonora, M.; Wieckowski, M.R.; Sinclair, D.A.; Kroemer, G.; Pinton, P.; Galluzzi, L. Targeting Mitochondria for Cardiovascular Disorders: Therapeutic Potential and Obstacles. Nat. Rev. Cardiol. 2019, 16, 33–55. [Google Scholar] [CrossRef]
- Ma, K.; Chen, G.; Li, W.; Kepp, O.; Zhu, Y.; Chen, Q. Mitophagy, Mitochondrial Homeostasis, and Cell Fate. Front. Cell Dev. Biol. 2020, 8, 467. [Google Scholar] [CrossRef]
- Xu, Y.; Shen, J.; Ran, Z. Emerging Views of Mitophagy in Immunity and Autoimmune Diseases. Autophagy 2020, 16, 3–17. [Google Scholar] [CrossRef]
- Chen, Y.; Qin, W.; Li, L.; Wu, P.; Wei, D. Mitophagy: Critical Role in Atherosclerosis Progression. DNA Cell Biol. 2022, 41, 851–860. [Google Scholar] [CrossRef] [PubMed]
- Choi, K.W.; Chen, C.-Y.; Stein, M.B.; Klimentidis, Y.C.; Wang, M.-J.; Koenen, K.C.; Smoller, J.W. ; Major Depressive Disorder Working Group of the Psychiatric Genomics Consortium Assessment of Bidirectional Relationships Between Physical Activity and Depression Among Adults: A 2-Sample Mendelian Randomization Study. JAMA Psychiatry 2019, 76, 399–408. [Google Scholar] [CrossRef] [PubMed]
- Yifan, C.; Fan, Y.; Jun, P. Visualization of Cardiovascular Development, Physiology and Disease at the Single-Cell Level: Opportunities and Future Challenges. J. Mol. Cell. Cardiol. 2020, 142, 80–92. [Google Scholar] [CrossRef]
- Deng, H.; Sun, Y.; Zeng, W.; Li, H.; Guo, M.; Yang, L.; Lu, B.; Yu, B.; Fan, G.; Gao, Q.; et al. New Classification of Macrophages in Plaques: A Revolution. Curr. Atheroscler. Rep. 2020, 22, 31. [Google Scholar] [CrossRef] [PubMed]
- Davey Smith, G.; Hemani, G. Mendelian Randomization: Genetic Anchors for Causal Inference in Epidemiological Studies. Hum. Mol. Genet. 2014, 23, R89–98. [Google Scholar] [CrossRef] [PubMed]
- Chen, J.; Chen, J.; Zhu, T.; Fu, Y.; Cheongi, I.H.; Yi, K.; Wang, H.; Li, X. Causal Relationships of Excessive Daytime Napping with Atherosclerosis and Cardiovascular Diseases: A Mendelian Randomization Study. Sleep 2023, 46, zsac257. [Google Scholar] [CrossRef] [PubMed]
- Zhang, Q.; Wu, G.; Zhang, X.; Wang, S.; Wang, Y. A Two-Sample Mendelian Randomization Study of Atherosclerosis and Dementia. iScience 2023, 26, 108325. [Google Scholar] [CrossRef]
- Zheng, J.; Wheeler, E.; Pietzner, M.; Andlauer, T.F.M.; Yau, M.S.; Hartley, A.E.; Brumpton, B.M.; Rasheed, H.; Kemp, J.P.; Frysz, M.; et al. Lowering of Circulating Sclerostin May Increase Risk of Atherosclerosis and Its Risk Factors: Evidence From a Genome-Wide Association Meta-Analysis Followed by Mendelian Randomization. Arthritis Rheumatol. Hoboken NJ 2023, 75, 1781–1792. [Google Scholar] [CrossRef] [PubMed]
- He, L.; Zhou, Q.; Huang, Z.; Xu, J.; Zhou, H.; Lv, D.; Lu, L.; Huang, S.; Tang, M.; Zhong, J.; et al. PINK1/Parkin-Mediated Mitophagy Promotes Apelin-13-Induced Vascular Smooth Muscle Cell Proliferation by AMPKα and Exacerbates Atherosclerotic Lesions. J. Cell. Physiol. 2019, 234, 8668–8682. [Google Scholar] [CrossRef] [PubMed]
- Mouton, A.J.; Li, X.; Hall, M.E.; Hall, J.E. Obesity, Hypertension, and Cardiac Dysfunction: Novel Roles of Immunometabolism in Macrophage Activation and Inflammation. Circ. Res. 2020, 126, 789–806. [Google Scholar] [CrossRef]
- Shu, H.; Peng, Y.; Hang, W.; Nie, J.; Zhou, N.; Wang, D.W. The Role of CD36 in Cardiovascular Disease. Cardiovasc. Res. 2022, 118, 115–129. [Google Scholar] [CrossRef] [PubMed]
- Chen, Y.; Zhang, J.; Cui, W.; Silverstein, R.L. CD36, a Signaling Receptor and Fatty Acid Transporter That Regulates Immune Cell Metabolism and Fate. J. Exp. Med. 2022, 219, e20211314. [Google Scholar] [CrossRef] [PubMed]
- Park, Y.M. CD36, a Scavenger Receptor Implicated in Atherosclerosis. Exp. Mol. Med. 2014, 46, e99. [Google Scholar] [CrossRef] [PubMed]
- Dinarello, C.A. Overview of the IL-1 Family in Innate Inflammation and Acquired Immunity. Immunol. Rev. 2018, 281, 8–27. [Google Scholar] [CrossRef] [PubMed]
- Tian, Z.; Yang, S. Integrating the Characteristic Genes of Macrophage Pseudotime Analysis in Single-Cell RNA-Seq to Construct a Prediction Model of Atherosclerosis. Aging 2023, 15, 6361–6379. [Google Scholar] [CrossRef] [PubMed]
- Li, M.; Wang, L.; Zhan, Y.; Zeng, T.; Zhang, X.; Guan, X.-Y.; Li, Y. Membrane Metalloendopeptidase (MME) Suppresses Metastasis of Esophageal Squamous Cell Carcinoma (ESCC) by Inhibiting FAK-RhoA Signaling Axis. Am. J. Pathol. 2019, 189, 1462–1472. [Google Scholar] [CrossRef] [PubMed]
- Meng, L.-B.; Shan, M.-J.; Qiu, Y.; Qi, R.; Yu, Z.-M.; Guo, P.; Di, C.-Y.; Gong, T. TPM2 as a Potential Predictive Biomarker for Atherosclerosis. Aging 2019, 11, 6960–6982. [Google Scholar] [CrossRef] [PubMed]
- Lou, X.; Yu, Z.; Yang, X.; Chen, J. Protective Effect of Rivaroxaban on Arteriosclerosis Obliterans in Rats through Modulation of the Toll-like Receptor 4/NF-κB Signaling Pathway. Exp. Ther. Med. 2019, 18, 1619–1626. [Google Scholar] [CrossRef] [PubMed]
- Saigusa, R.; Winkels, H.; Ley, K. T Cell Subsets and Functions in Atherosclerosis. Nat. Rev. Cardiol. 2020, 17, 387–401. [Google Scholar] [CrossRef]
- Zhang, Z.; Yue, P.; Lu, T.; Wang, Y.; Wei, Y.; Wei, X. Role of Lysosomes in Physiological Activities, Diseases, and Therapy. J. Hematol. Oncol.J Hematol Oncol 2021, 14, 79. [Google Scholar] [CrossRef]
- Trivedi, P.C.; Bartlett, J.J.; Pulinilkunnil, T. Lysosomal Biology and Function: Modern View of Cellular Debris Bin. Cells 2020, 9, 1131. [Google Scholar] [CrossRef] [PubMed]
- Lévy, P.; Kohler, M.; McNicholas, W.T.; Barbé, F.; McEvoy, R.D.; Somers, V.K.; Lavie, L.; Pépin, J.-L. Obstructive Sleep Apnoea Syndrome. Nat. Rev. Dis. Primer 2015, 1, 15015. [Google Scholar] [CrossRef] [PubMed]
- Ahmadi, A.; Argulian, E.; Leipsic, J.; Newby, D.E.; Narula, J. From Subclinical Atherosclerosis to Plaque Progression and Acute Coronary Events: JACC State-of-the-Art Review. J. Am. Coll. Cardiol. 2019, 74, 1608–1617. [Google Scholar] [CrossRef] [PubMed]
- Baragetti, A.; Bonacina, F.; Catapano, A.L.; Norata, G.D. Effect of Lipids and Lipoproteins on Hematopoietic Cell Metabolism and Commitment in Atherosclerosis. Immunometabolism 2021, 3, e210014. [Google Scholar] [CrossRef] [PubMed]
- Nahrendorf, M.; Swirski, F.K. Lifestyle Effects on Hematopoiesis and Atherosclerosis. Circ. Res. 2015, 116, 884–894. [Google Scholar] [CrossRef] [PubMed]
- Jin, M.; Fang, J.; Wang, J.-J.; Shao, X.; Xu, S.-W.; Liu, P.-Q.; Ye, W.-C.; Liu, Z.-P. Regulation of Toll-like Receptor (TLR) Signaling Pathways in Atherosclerosis: From Mechanisms to Targeted Therapeutics. Acta Pharmacol. Sin. 2023, 44, 2358–2375. [Google Scholar] [CrossRef] [PubMed]
- Tran, T.H.; Tran, T.T.P.; Truong, D.H.; Nguyen, H.T.; Pham, T.T.; Yong, C.S.; Kim, J.O. Toll-like Receptor-Targeted Particles: A Paradigm to Manipulate the Tumor Microenvironment for Cancer Immunotherapy. Acta Biomater. 2019, 94, 82–96. [Google Scholar] [CrossRef] [PubMed]
- Wang, Y.; Chen, L.; Tian, Z.; Shen, X.; Wang, X.; Wu, H.; Wang, Y.; Zou, J.; Liang, J. CRISPR-Cas9 Mediated Gene Knockout in Human Coronary Artery Endothelial Cells Reveals a pro-Inflammatory Role of TLR2. Cell Biol. Int. 2018, 42, 187–193. [Google Scholar] [CrossRef] [PubMed]
- Duan, T.; Du, Y.; Xing, C.; Wang, H.Y.; Wang, R.-F. Toll-Like Receptor Signaling and Its Role in Cell-Mediated Immunity. Front. Immunol. 2022, 13, 812774. [Google Scholar] [CrossRef]
- Weisel, N.M.; Joachim, S.M.; Smita, S.; Callahan, D.; Elsner, R.A.; Conter, L.J.; Chikina, M.; Farber, D.L.; Weisel, F.J.; Shlomchik, M.J. Surface Phenotypes of Naive and Memory B Cells in Mouse and Human Tissues. Nat. Immunol. 2022, 23, 135–145. [Google Scholar] [CrossRef]
- Jia, S.-J.; Gao, K.-Q.; Zhao, M. Epigenetic Regulation in Monocyte/Macrophage: A Key Player during Atherosclerosis. Cardiovasc. Ther. 2017, 35. [Google Scholar] [CrossRef] [PubMed]
- Schäfer, S.; Zernecke, A. CD8+ T Cells in Atherosclerosis. Cells 2020, 10, 37. [Google Scholar] [CrossRef] [PubMed]
- Depuydt, M.A.C.; Prange, K.H.M.; Slenders, L.; Örd, T.; Elbersen, D.; Boltjes, A.; de Jager, S.C.A.; Asselbergs, F.W.; de Borst, G.J.; Aavik, E.; et al. Microanatomy of the Human Atherosclerotic Plaque by Single-Cell Transcriptomics. Circ. Res. 2020, 127, 1437–1455. [Google Scholar] [CrossRef]
- Palano, M.T.; Cucchiara, M.; Gallazzi, M.; Riccio, F.; Mortara, L.; Gensini, G.F.; Spinetti, G.; Ambrosio, G.; Bruno, A. When a Friend Becomes Your Enemy: Natural Killer Cells in Atherosclerosis and Atherosclerosis-Associated Risk Factors. Front. Immunol. 2021, 12, 798155. [Google Scholar] [CrossRef]
- Profumo, E.; Maggi, E.; Arese, M.; Di Cristofano, C.; Salvati, B.; Saso, L.; Businaro, R.; Buttari, B. Neuropeptide Y Promotes Human M2 Macrophage Polarization and Enhances P62/SQSTM1-Dependent Autophagy and NRF2 Activation. Int. J. Mol. Sci. 2022, 23, 13009. [Google Scholar] [CrossRef]
- Chistiakov, D.A.; Bobryshev, Y.V.; Orekhov, A.N. Changes in Transcriptome of Macrophages in Atherosclerosis. J. Cell. Mol. Med. 2015, 19, 1163–1173. [Google Scholar] [CrossRef]
- Weiß, E.; Berger, H.M.; Brandl, W.T.; Strutz, J.; Hirschmugl, B.; Simovic, V.; Tam-Ammersdorfer, C.; Cvitic, S.; Hiden, U. Maternal Overweight Downregulates MME (Neprilysin) in Feto-Placental Endothelial Cells and in Cord Blood. Int. J. Mol. Sci. 2020, 21, 834. [Google Scholar] [CrossRef] [PubMed]
- Ding, J.; Li, C.; Shu, K.; Chen, W.; Cai, C.; Zhang, X.; Zhang, W. Membrane Metalloendopeptidase (MME) Is Positively Correlated with Systemic Lupus Erythematosus and May Inhibit the Occurrence of Breast Cancer. PloS One 2023, 18, e0289960. [Google Scholar] [CrossRef]
- Yang, Y.-Y.; Gao, Z.-X.; Mao, Z.-H.; Liu, D.-W.; Liu, Z.-S.; Wu, P. Identification of ULK1 as a Novel Mitophagy-Related Gene in Diabetic Nephropathy. Front. Endocrinol. 2022, 13, 1079465. [Google Scholar] [CrossRef]
- Langfelder, P.; Horvath, S. WGCNA: An R Package for Weighted Correlation Network Analysis. BMC Bioinformatics 2008, 9, 559. [Google Scholar] [CrossRef]
- Hänzelmann, S.; Castelo, R.; Guinney, J. GSVA: Gene Set Variation Analysis for Microarray and RNA-Seq Data. BMC Bioinformatics 2013, 14, 7. [Google Scholar] [CrossRef] [PubMed]
- Ritchie, M.E.; Phipson, B.; Wu, D.; Hu, Y.; Law, C.W.; Shi, W.; Smyth, G.K. Limma Powers Differential Expression Analyses for RNA-Sequencing and Microarray Studies. Nucleic Acids Res. 2015, 43, e47. [Google Scholar] [CrossRef] [PubMed]
- Gustavsson, E.K.; Zhang, D.; Reynolds, R.H.; Garcia-Ruiz, S.; Ryten, M. Ggtranscript: An R Package for the Visualization and Interpretation of Transcript Isoforms Using Ggplot2. Bioinforma. Oxf. Engl. 2022, 38, 3844–3846. [Google Scholar] [CrossRef] [PubMed]
- Gu, Z.; Eils, R.; Schlesner, M. Complex Heatmaps Reveal Patterns and Correlations in Multidimensional Genomic Data. Bioinforma. Oxf. Engl. 2016, 32, 2847–2849. [Google Scholar] [CrossRef] [PubMed]
- Hao, Y.; Hao, S.; Andersen-Nissen, E.; Mauck, W.M.; Zheng, S.; Butler, A.; Lee, M.J.; Wilk, A.J.; Darby, C.; Zager, M.; et al. Integrated Analysis of Multimodal Single-Cell Data. Cell 2021, 184, 3573–3587. [Google Scholar] [CrossRef]
- Aran, D.; Looney, A.P.; Liu, L.; Wu, E.; Fong, V.; Hsu, A.; Chak, S.; Naikawadi, R.P.; Wolters, P.J.; Abate, A.R.; et al. Reference-Based Analysis of Lung Single-Cell Sequencing Reveals a Transitional Profibrotic Macrophage. Nat. Immunol. 2019, 20, 163–172. [Google Scholar] [CrossRef] [PubMed]
- Hemani, G.; Zheng, J.; Elsworth, B.; Wade, K.H.; Haberland, V.; Baird, D.; Laurin, C.; Burgess, S.; Bowden, J.; Langdon, R.; et al. The MR-Base Platform Supports Systematic Causal Inference across the Human Phenome. eLife 2018, 7, e34408. [Google Scholar] [CrossRef] [PubMed]
- Xu, J.; Zhang, S.; Tian, Y.; Si, H.; Zeng, Y.; Wu, Y.; Liu, Y.; Li, M.; Sun, K.; Wu, L.; et al. Genetic Causal Association between Iron Status and Osteoarthritis: A Two-Sample Mendelian Randomization. Nutrients 2022, 14, 3683. [Google Scholar] [CrossRef] [PubMed]
- Li, R.-J.; Ma, L.; Kim, H.; Kim, I.; Hanes, L.; Altepeter, T.; Lee, J.; Liu, J.; Zhu, H.; Wang, Y. Model-Informed Approach Supporting Approval of Adalimumab (HUMIRA) in Pediatric Patients with Ulcerative Colitis from a Regulatory Perspective. AAPS J. 2022, 24, 79. [Google Scholar] [CrossRef]
- Tang, Q.; Nie, F.; Kang, J.; Chen, W. mRNALocater: Enhance the Prediction Accuracy of Eukaryotic mRNA Subcellular Localization by Using Model Fusion Strategy. Mol. Ther. J. Am. Soc. Gene Ther. 2021, 29, 2617–2623. [Google Scholar] [CrossRef]
- Yu, G.; Wang, L.-G.; Han, Y.; He, Q.-Y. clusterProfiler: An R Package for Comparing Biological Themes among Gene Clusters. Omics J. Integr. Biol. 2012, 16, 284–287. [Google Scholar] [CrossRef] [PubMed]
- Ru, Y.; Kechris, K.J.; Tabakoff, B.; Hoffman, P.; Radcliffe, R.A.; Bowler, R.; Mahaffey, S.; Rossi, S.; Calin, G.A.; Bemis, L.; et al. The multiMiR R Package and Database: Integration of microRNA-Target Interactions along with Their Disease and Drug Associations. Nucleic Acids Res. 2014, 42, e133. [Google Scholar] [CrossRef] [PubMed]
- Shannon, P.; Markiel, A.; Ozier, O.; Baliga, N.S.; Wang, J.T.; Ramage, D.; Amin, N.; Schwikowski, B.; Ideker, T. Cytoscape: A Software Environment for Integrated Models of Biomolecular Interaction Networks. Genome Res. 2003, 13, 2498–2504. [Google Scholar] [CrossRef]
- Aibar, S.; González-Blas, C.B.; Moerman, T.; Huynh-Thu, V.A.; Imrichova, H.; Hulselmans, G.; Rambow, F.; Marine, J.-C.; Geurts, P.; Aerts, J.; et al. SCENIC: Single-Cell Regulatory Network Inference and Clustering. Nat. Methods 2017, 14, 1083–1086. [Google Scholar] [CrossRef] [PubMed]
Figure 1.
Module gene and DEGs1 identification. (a) Comparison of MRG scores between the AS and normal tissue groups. *p < 0.05, **p < 0.01, ***p < 0.001, ****p < 0.001; ns: non-significance. (b) Soft threshold selection. (c) Cluster dendrogram. (d) Heatmap of the correlation between the model and the MRG ssGSEA score. (e) Volcano plot of the DEGs1 between the AS and normal tissue groups in the GSE43292 dataset. (f) Heatmap of DEGs1 expression between the AS and normal tissue groups in the GSE43292 dataset.
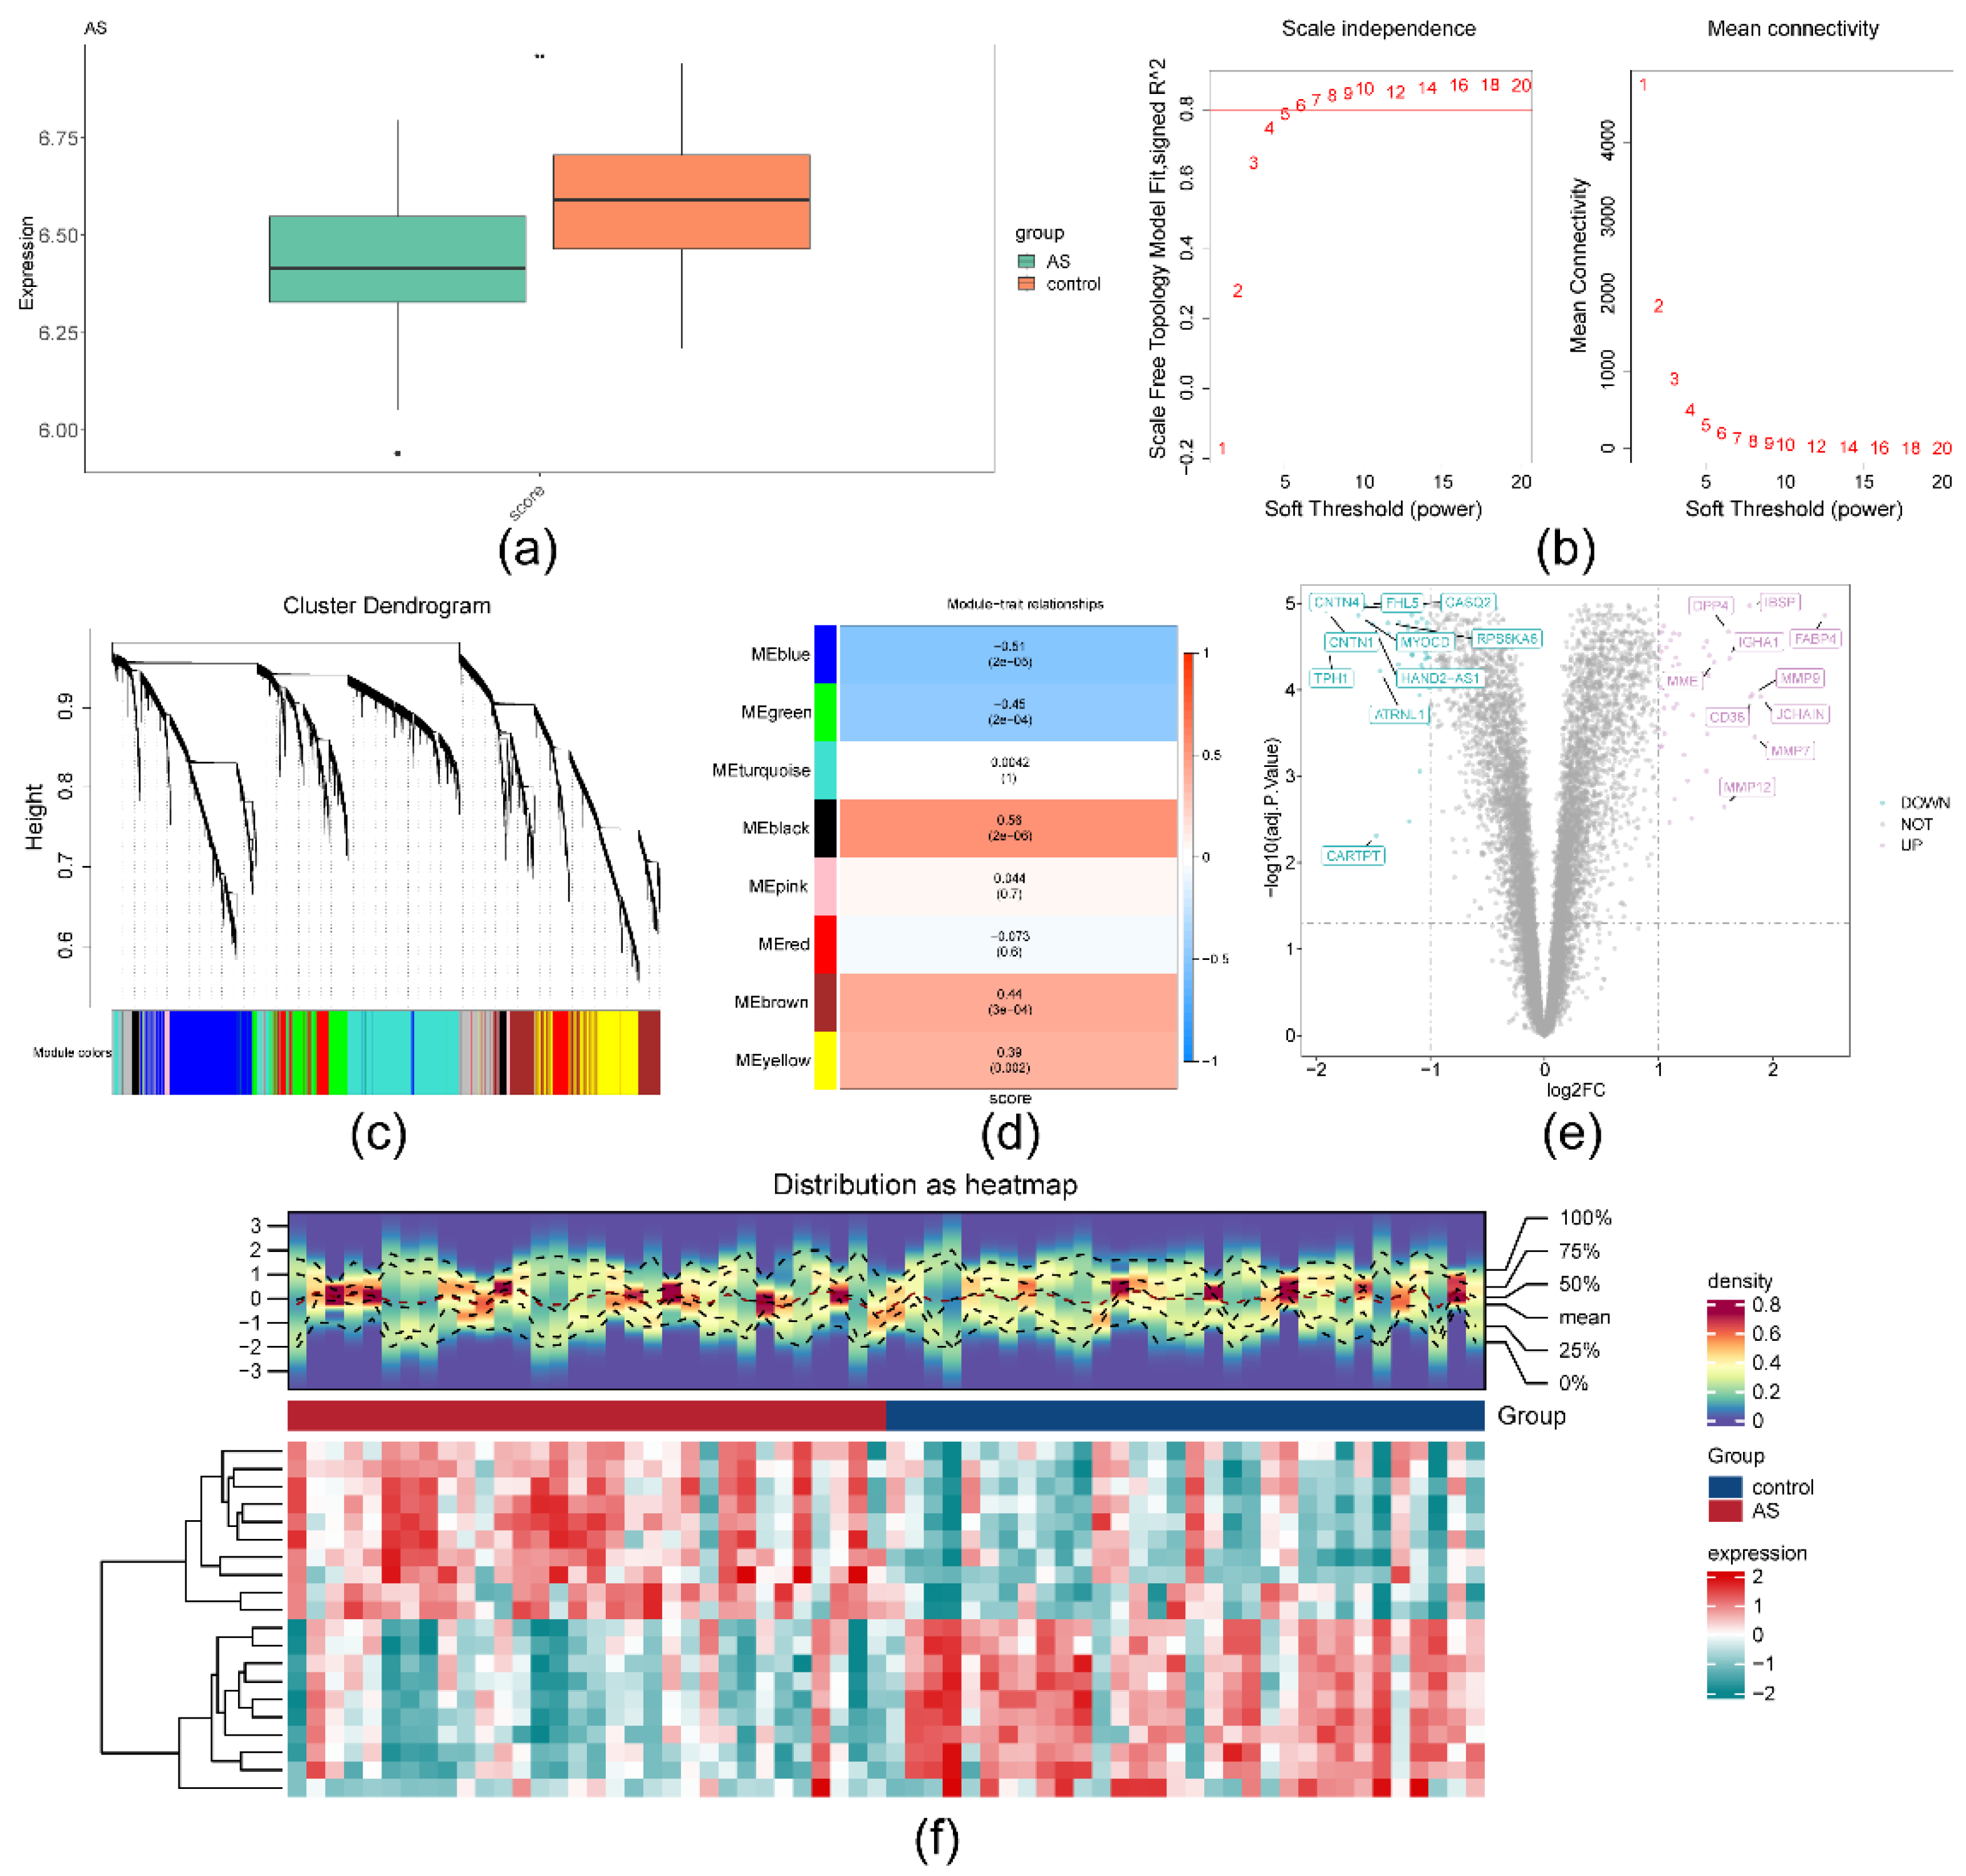
Figure 2.
Recognition of DEGs2 in GSE159677. (a) 2,000 highly variable genes. (b) Linear dimension reduction distribution inflection point diagram of each dimension. (c) Cluster diagram of cells. (d) 19 cell clusters annotated into eight cell types. (e) Abundance map for each cell type. (f) Comparison of cell types in the AS and normal tissue groups. *p < 0.05, **p < 0.01, ***p < 0.001, ****p < 0.001; ns: non-significance.
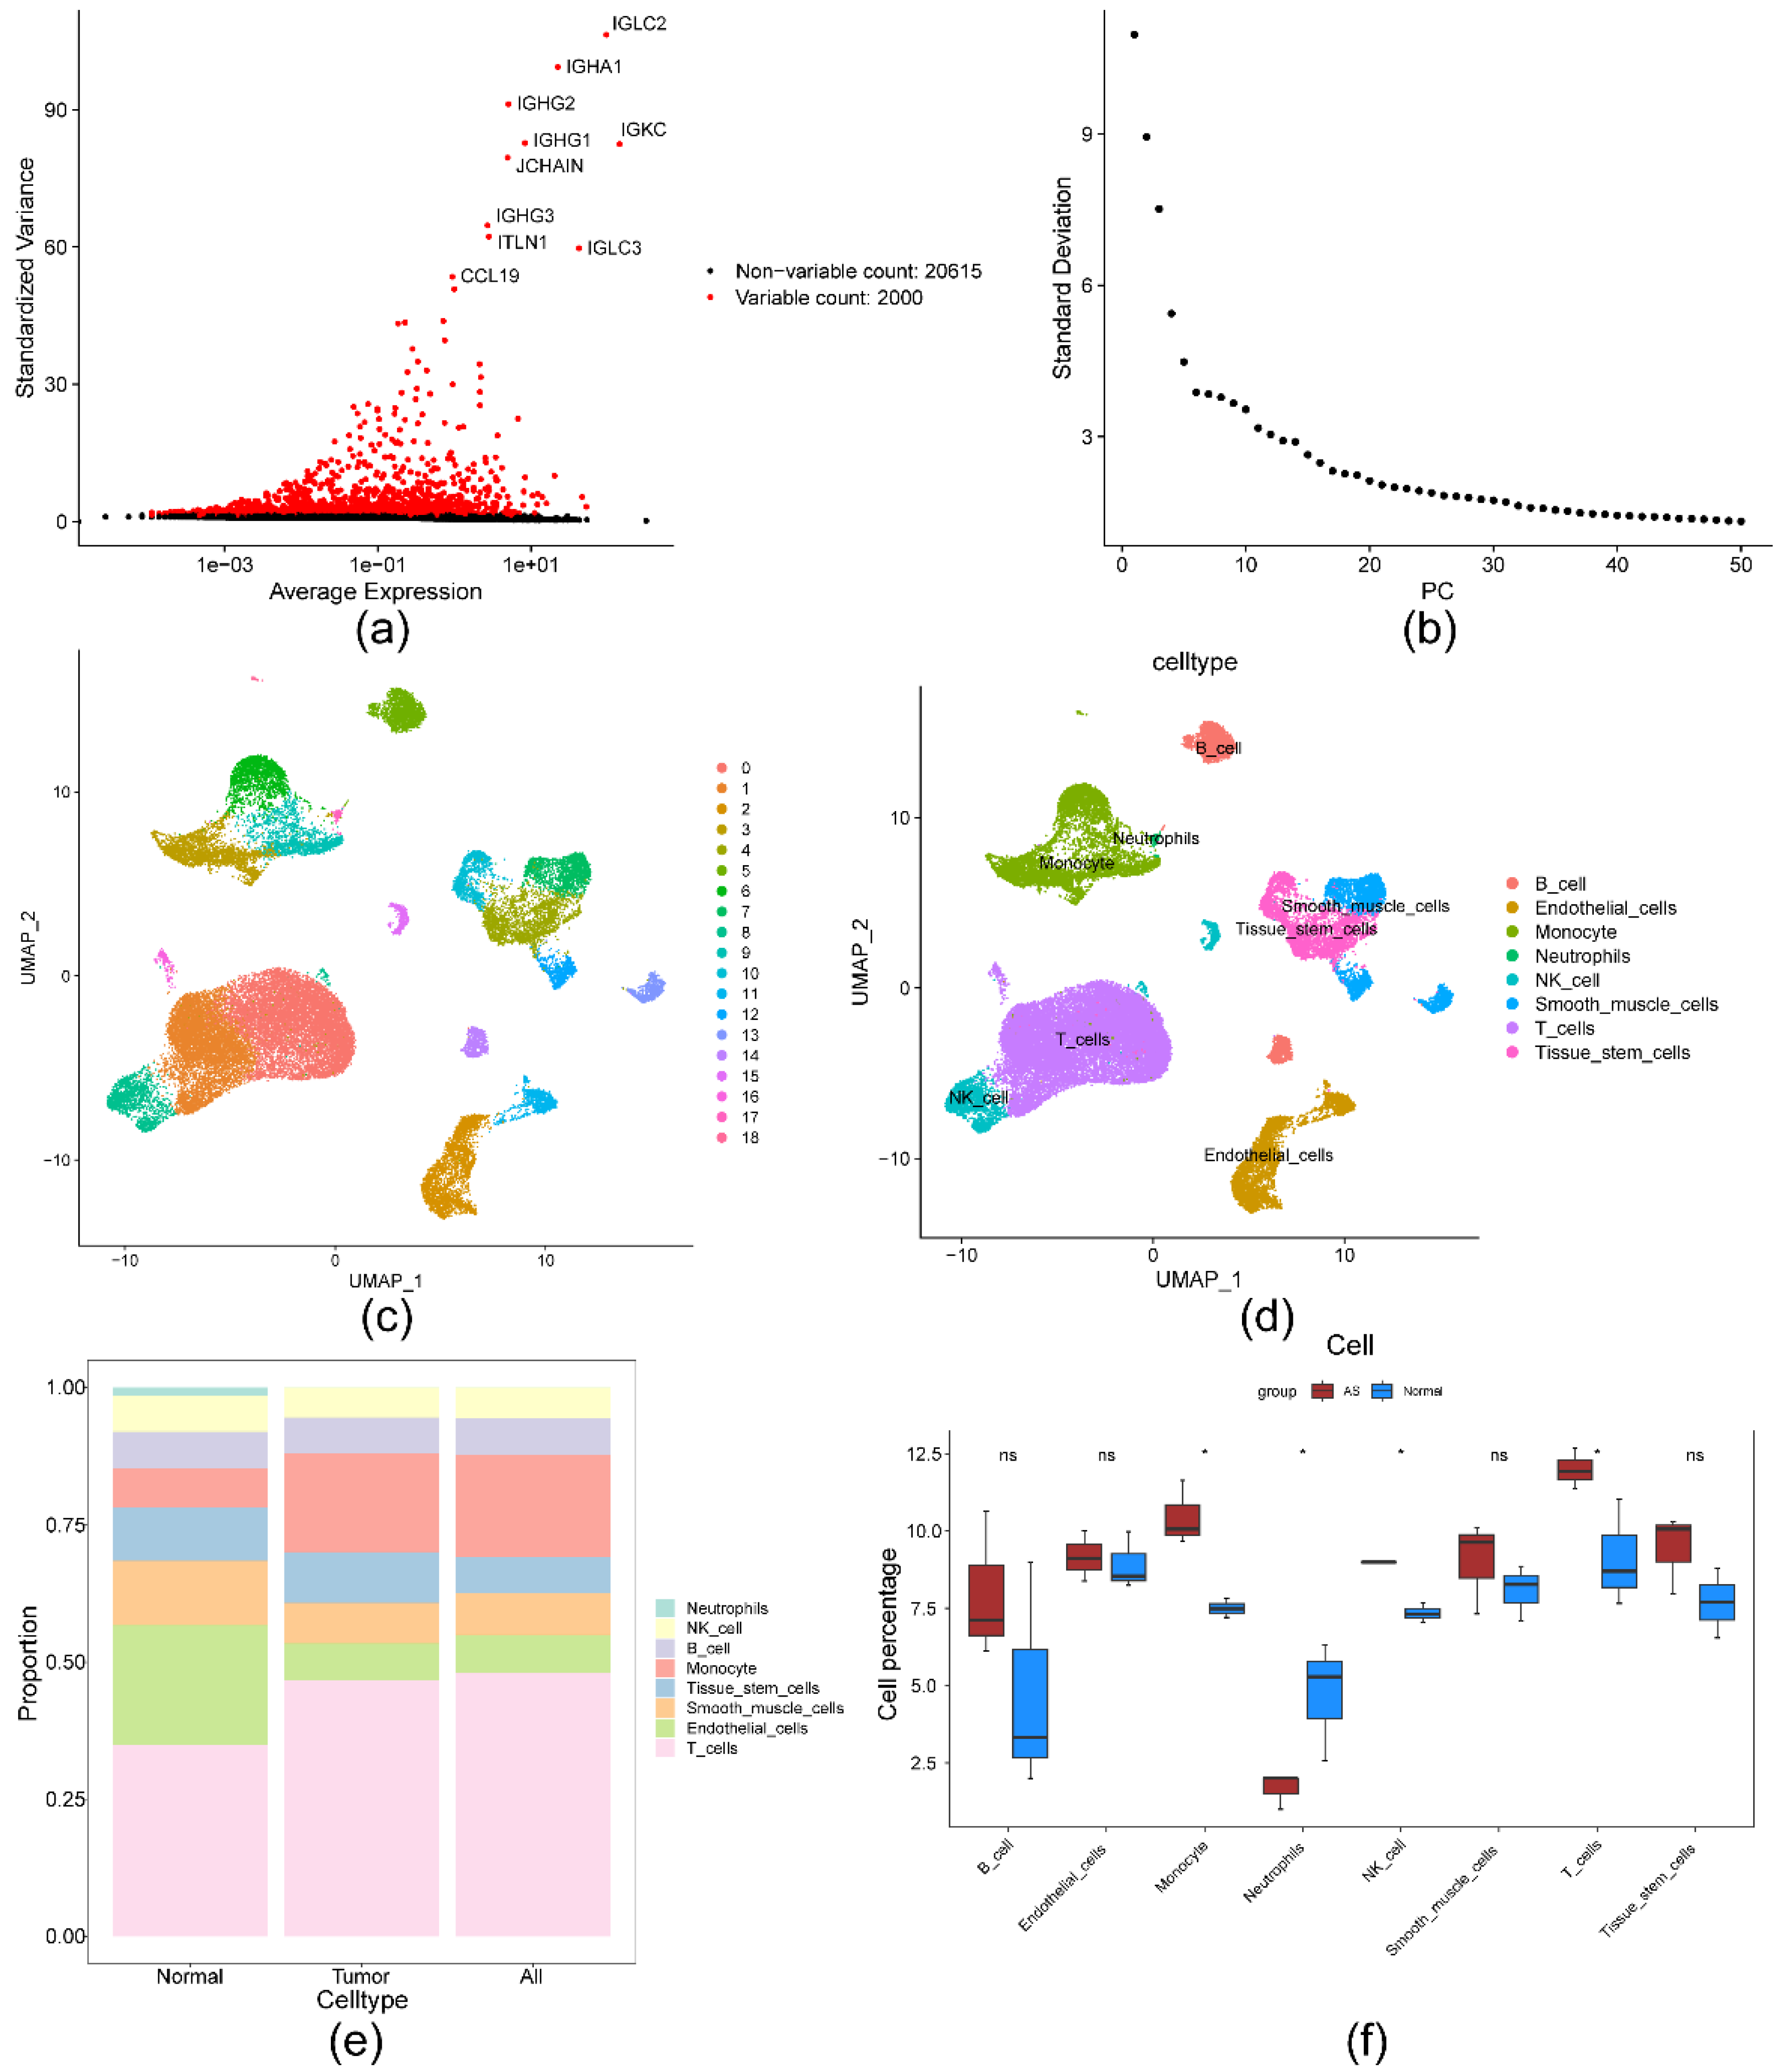
Figure 3.
Candidate gene acquistion. (a) Venn diagram identifying 22 genes by overlapping the DEGs2 and module genes. (b) Forest plot for the LOO test.
Figure 3.
Candidate gene acquistion. (a) Venn diagram identifying 22 genes by overlapping the DEGs2 and module genes. (b) Forest plot for the LOO test.
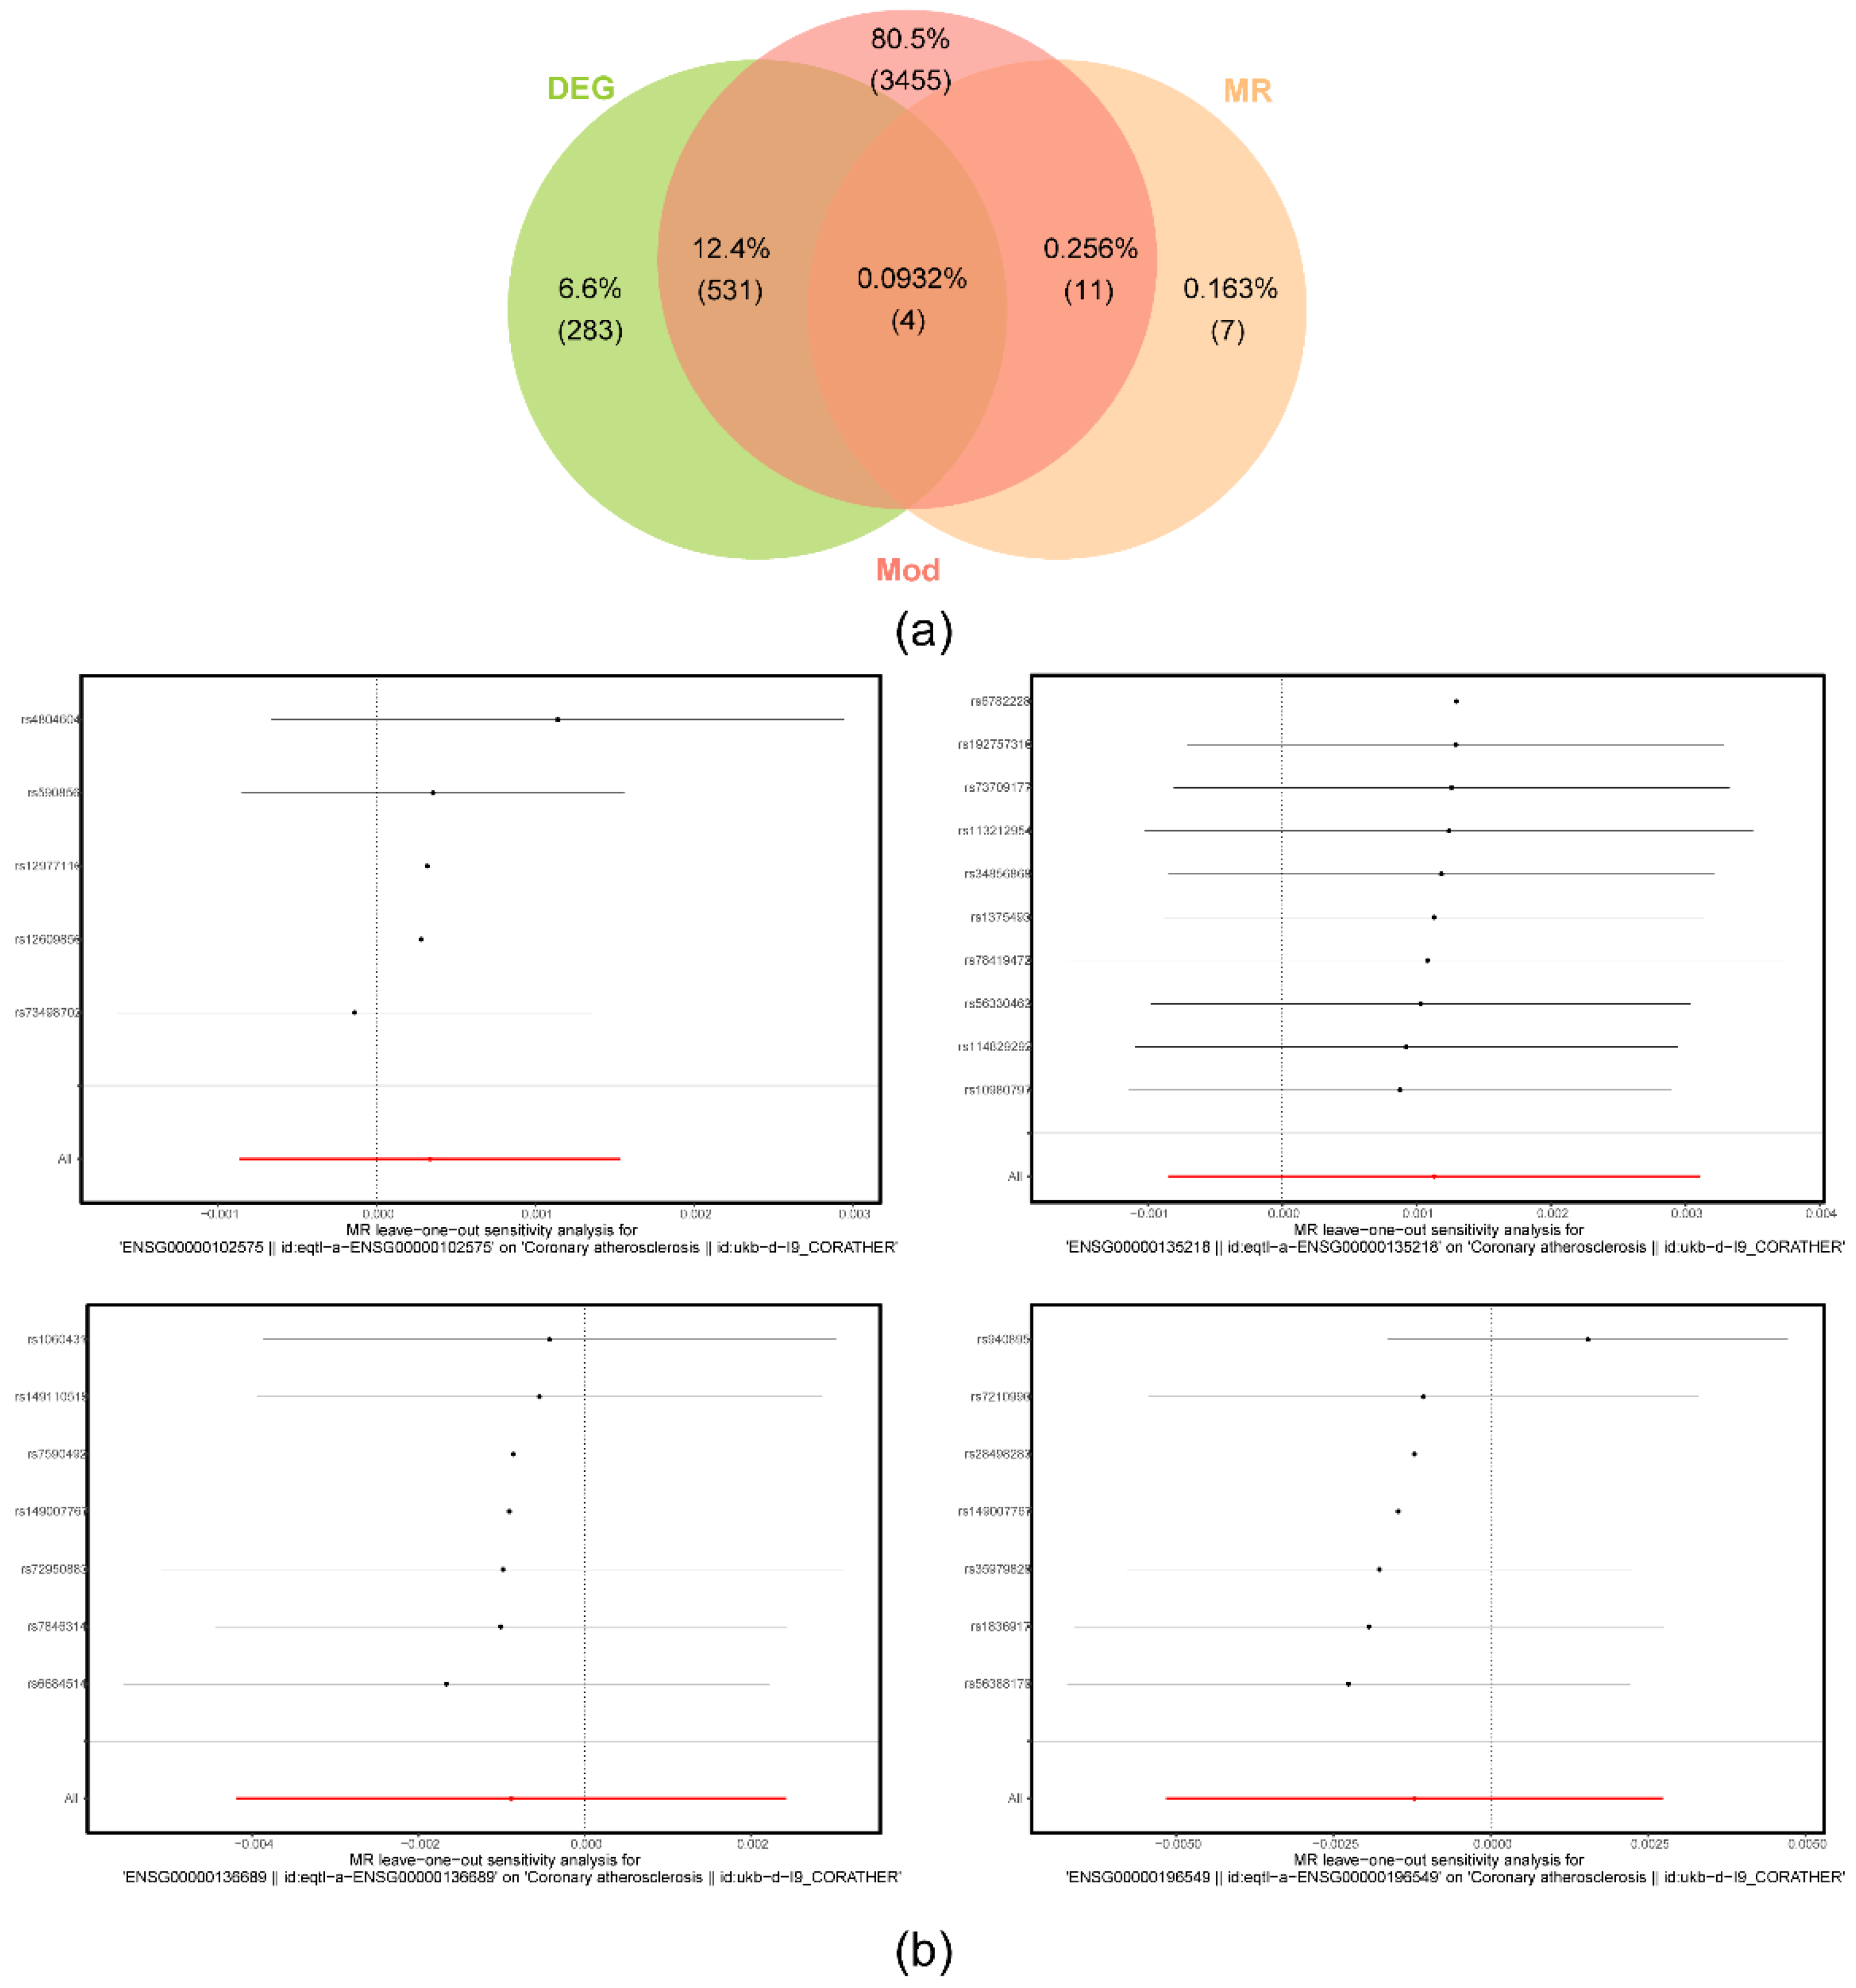
Figure 4.
Biomarker identification. (a) LASSO regression analysis of candidate key genes. (b-c) Expression levels of candidate key genes in the GSE43292 (b) and GSE100927 (c) datasets. *p < 0.05, **p < 0.01, ***p < 0.001, ****p < 0.001; ns: non-significance. (d-e) ROC curves for the biomarkers in the GSE43292 (d) and GSE100927 (e) datasets.
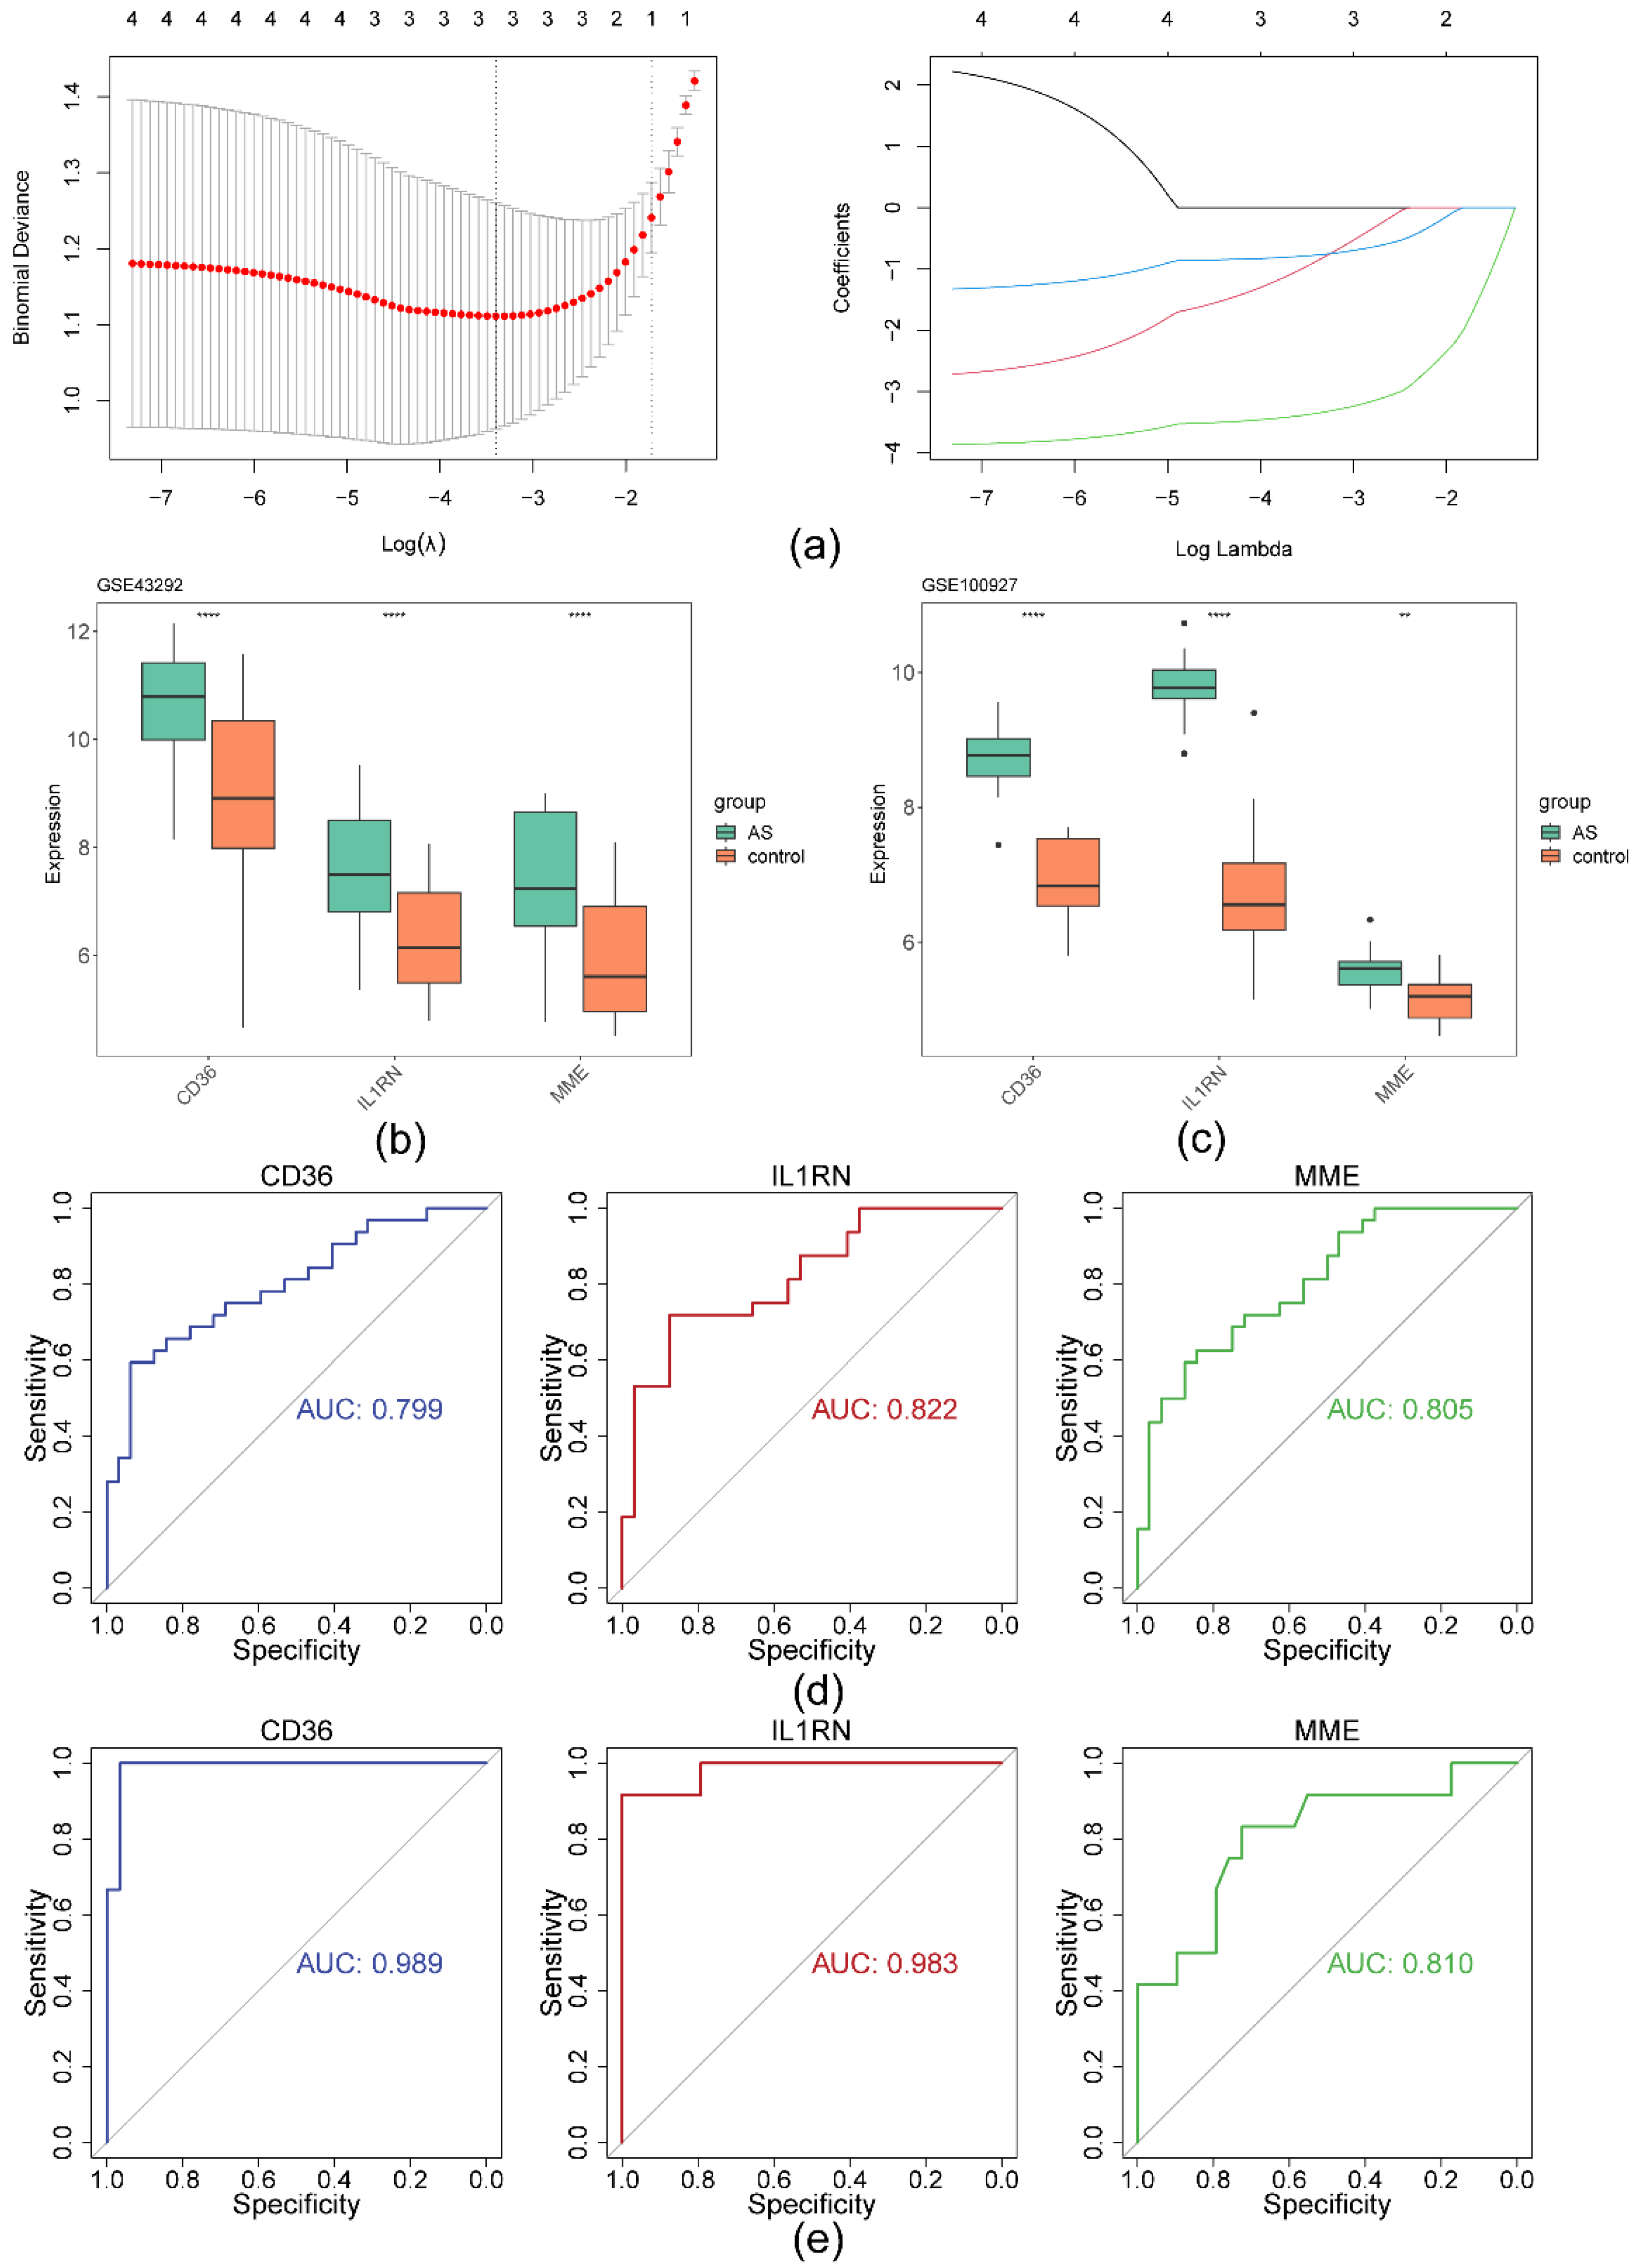
Figure 5.
ANN model construction and subcellular localization analysis of biomarkers. (a) ANN model construction. (b-c) ROC curves for the ANN module in the GSE43292 (b) and GSE100927 (c) datasets. (d) Subcellular localization stacking map of the biomarkers.
Figure 5.
ANN model construction and subcellular localization analysis of biomarkers. (a) ANN model construction. (b-c) ROC curves for the ANN module in the GSE43292 (b) and GSE100927 (c) datasets. (d) Subcellular localization stacking map of the biomarkers.
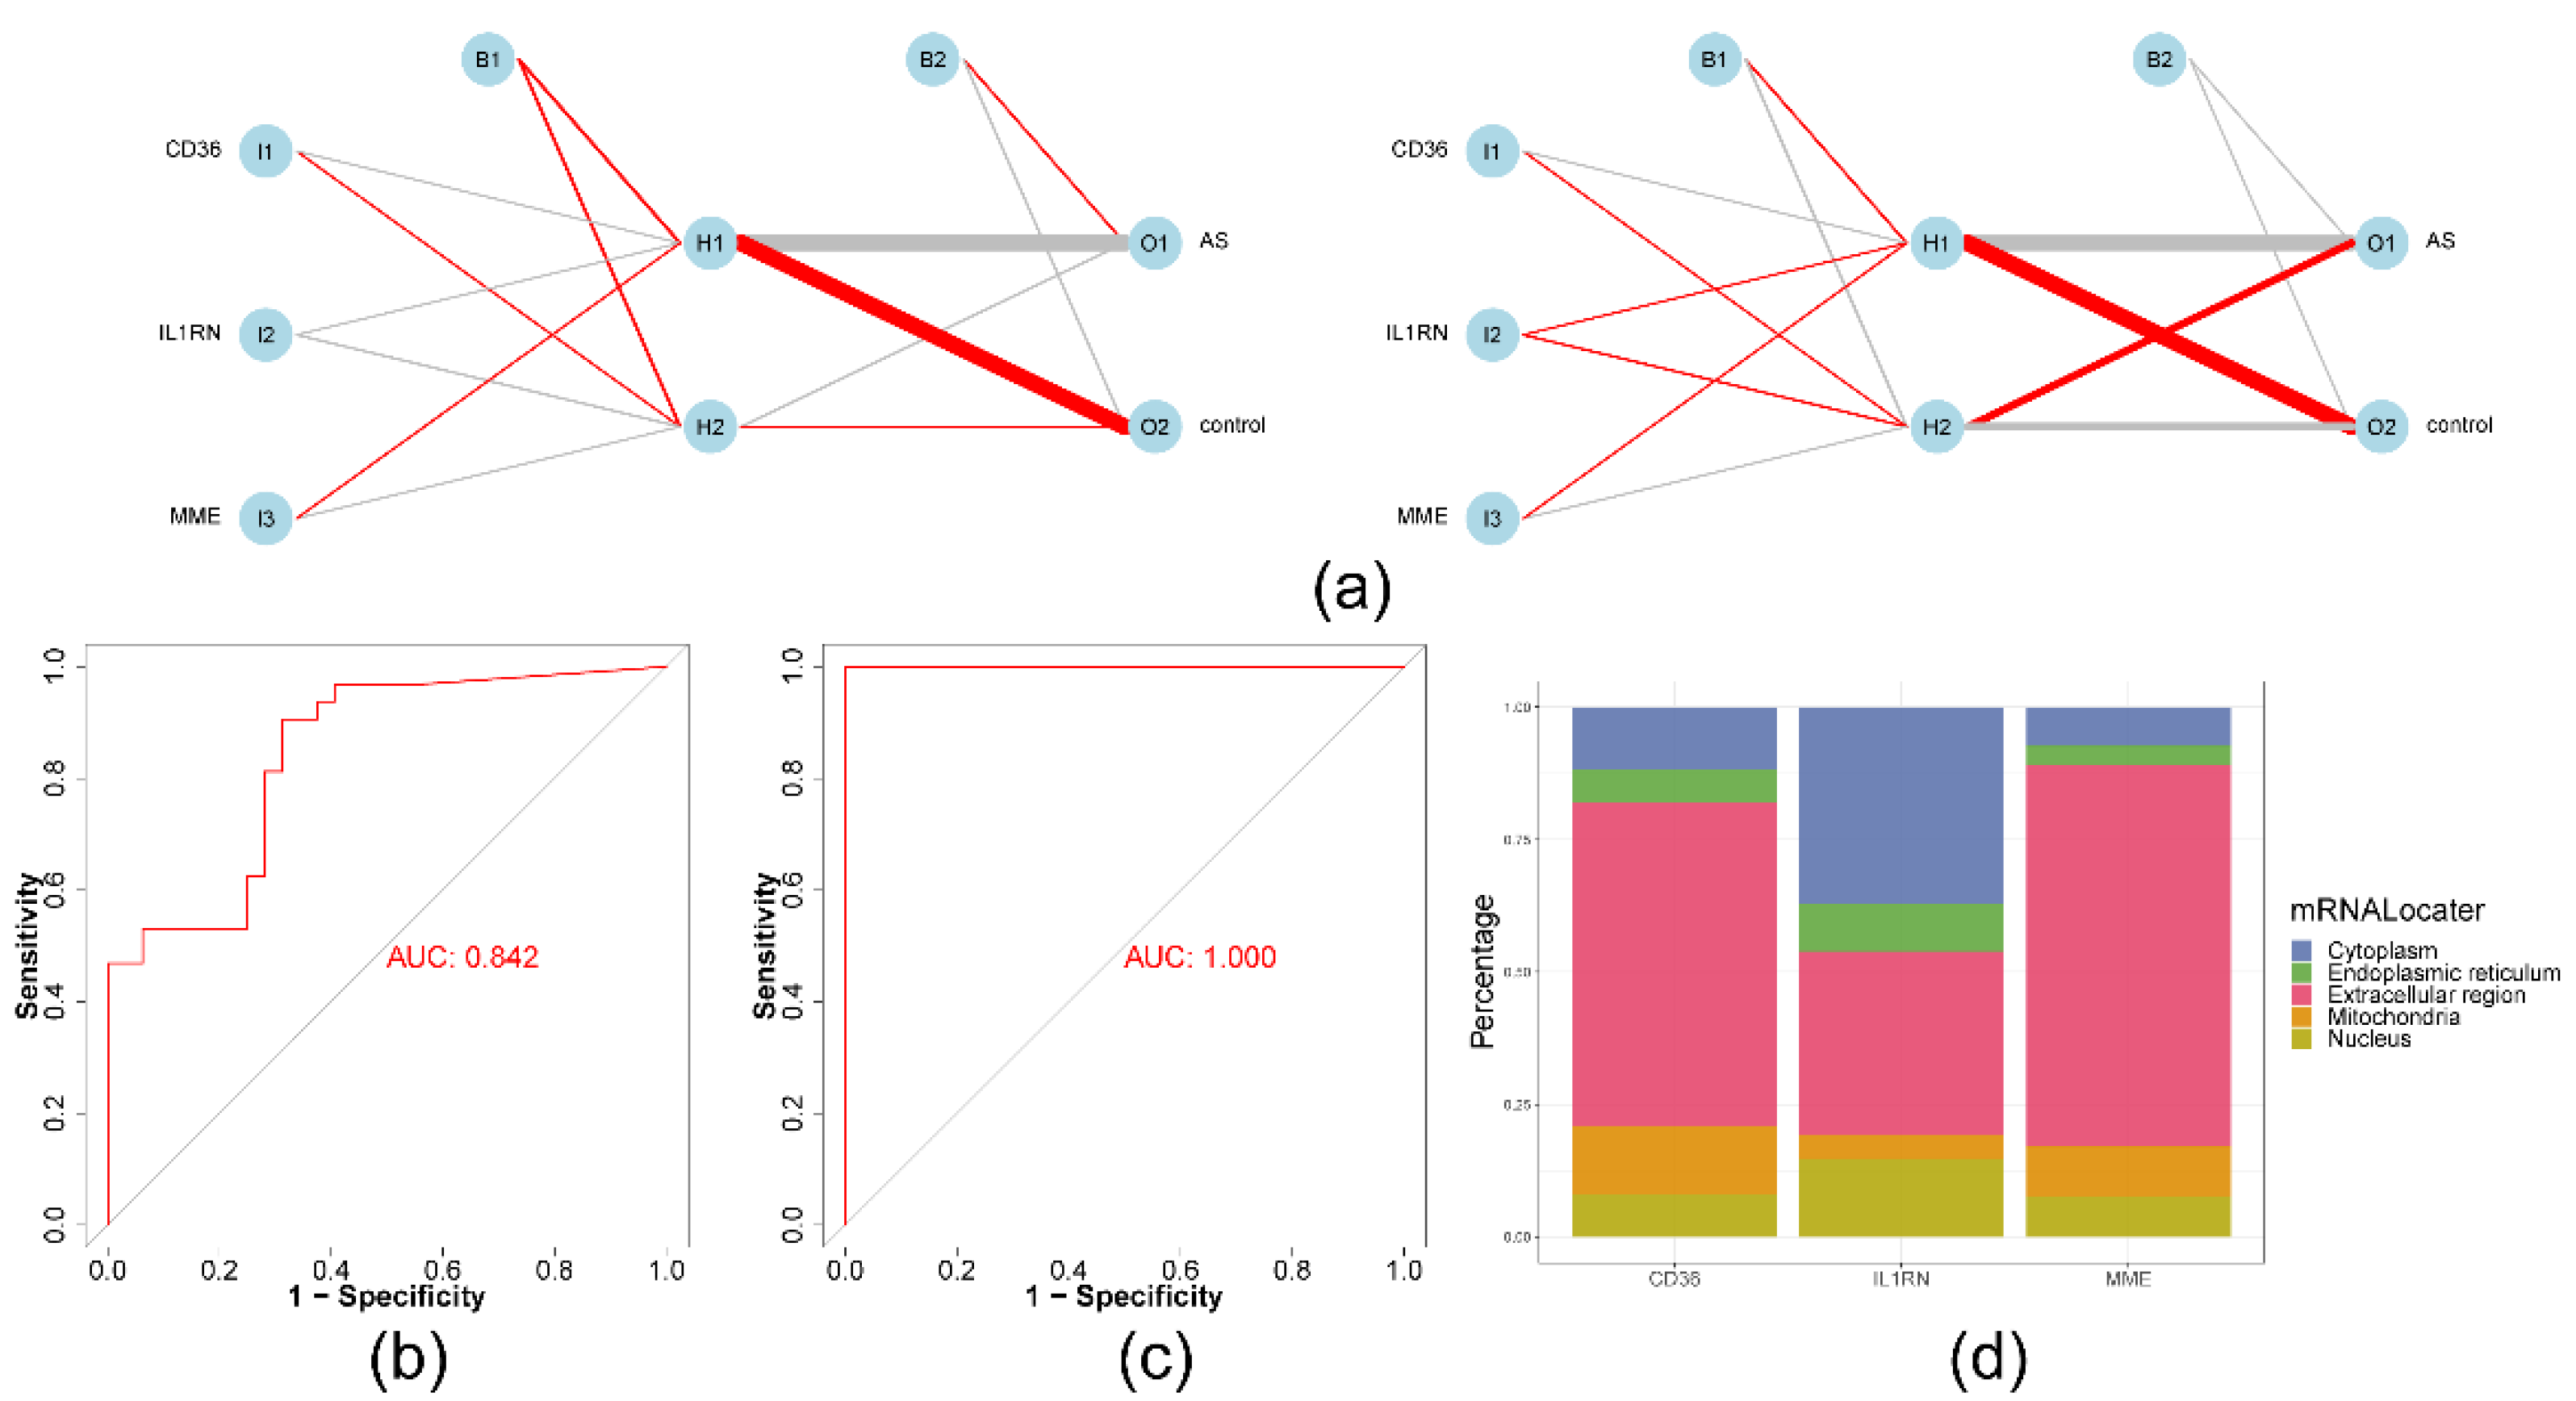
Figure 6.
GSEA and immune infiltration analysis of biomarkers. (a-c) Enrichment results for CD36 (a), IL1RN (b), and MME (c). (d) Relative degrees of infiltration of 10 immune cells in the AS and normal tissue groups. *p < 0.05, **p < 0.01, ***p < 0.001, ****p < 0.001; ns: non-significance. (e) ROC curves for candidate immune cells. (f) Correlation scatterplot of biomarkers and candidate immune cells.
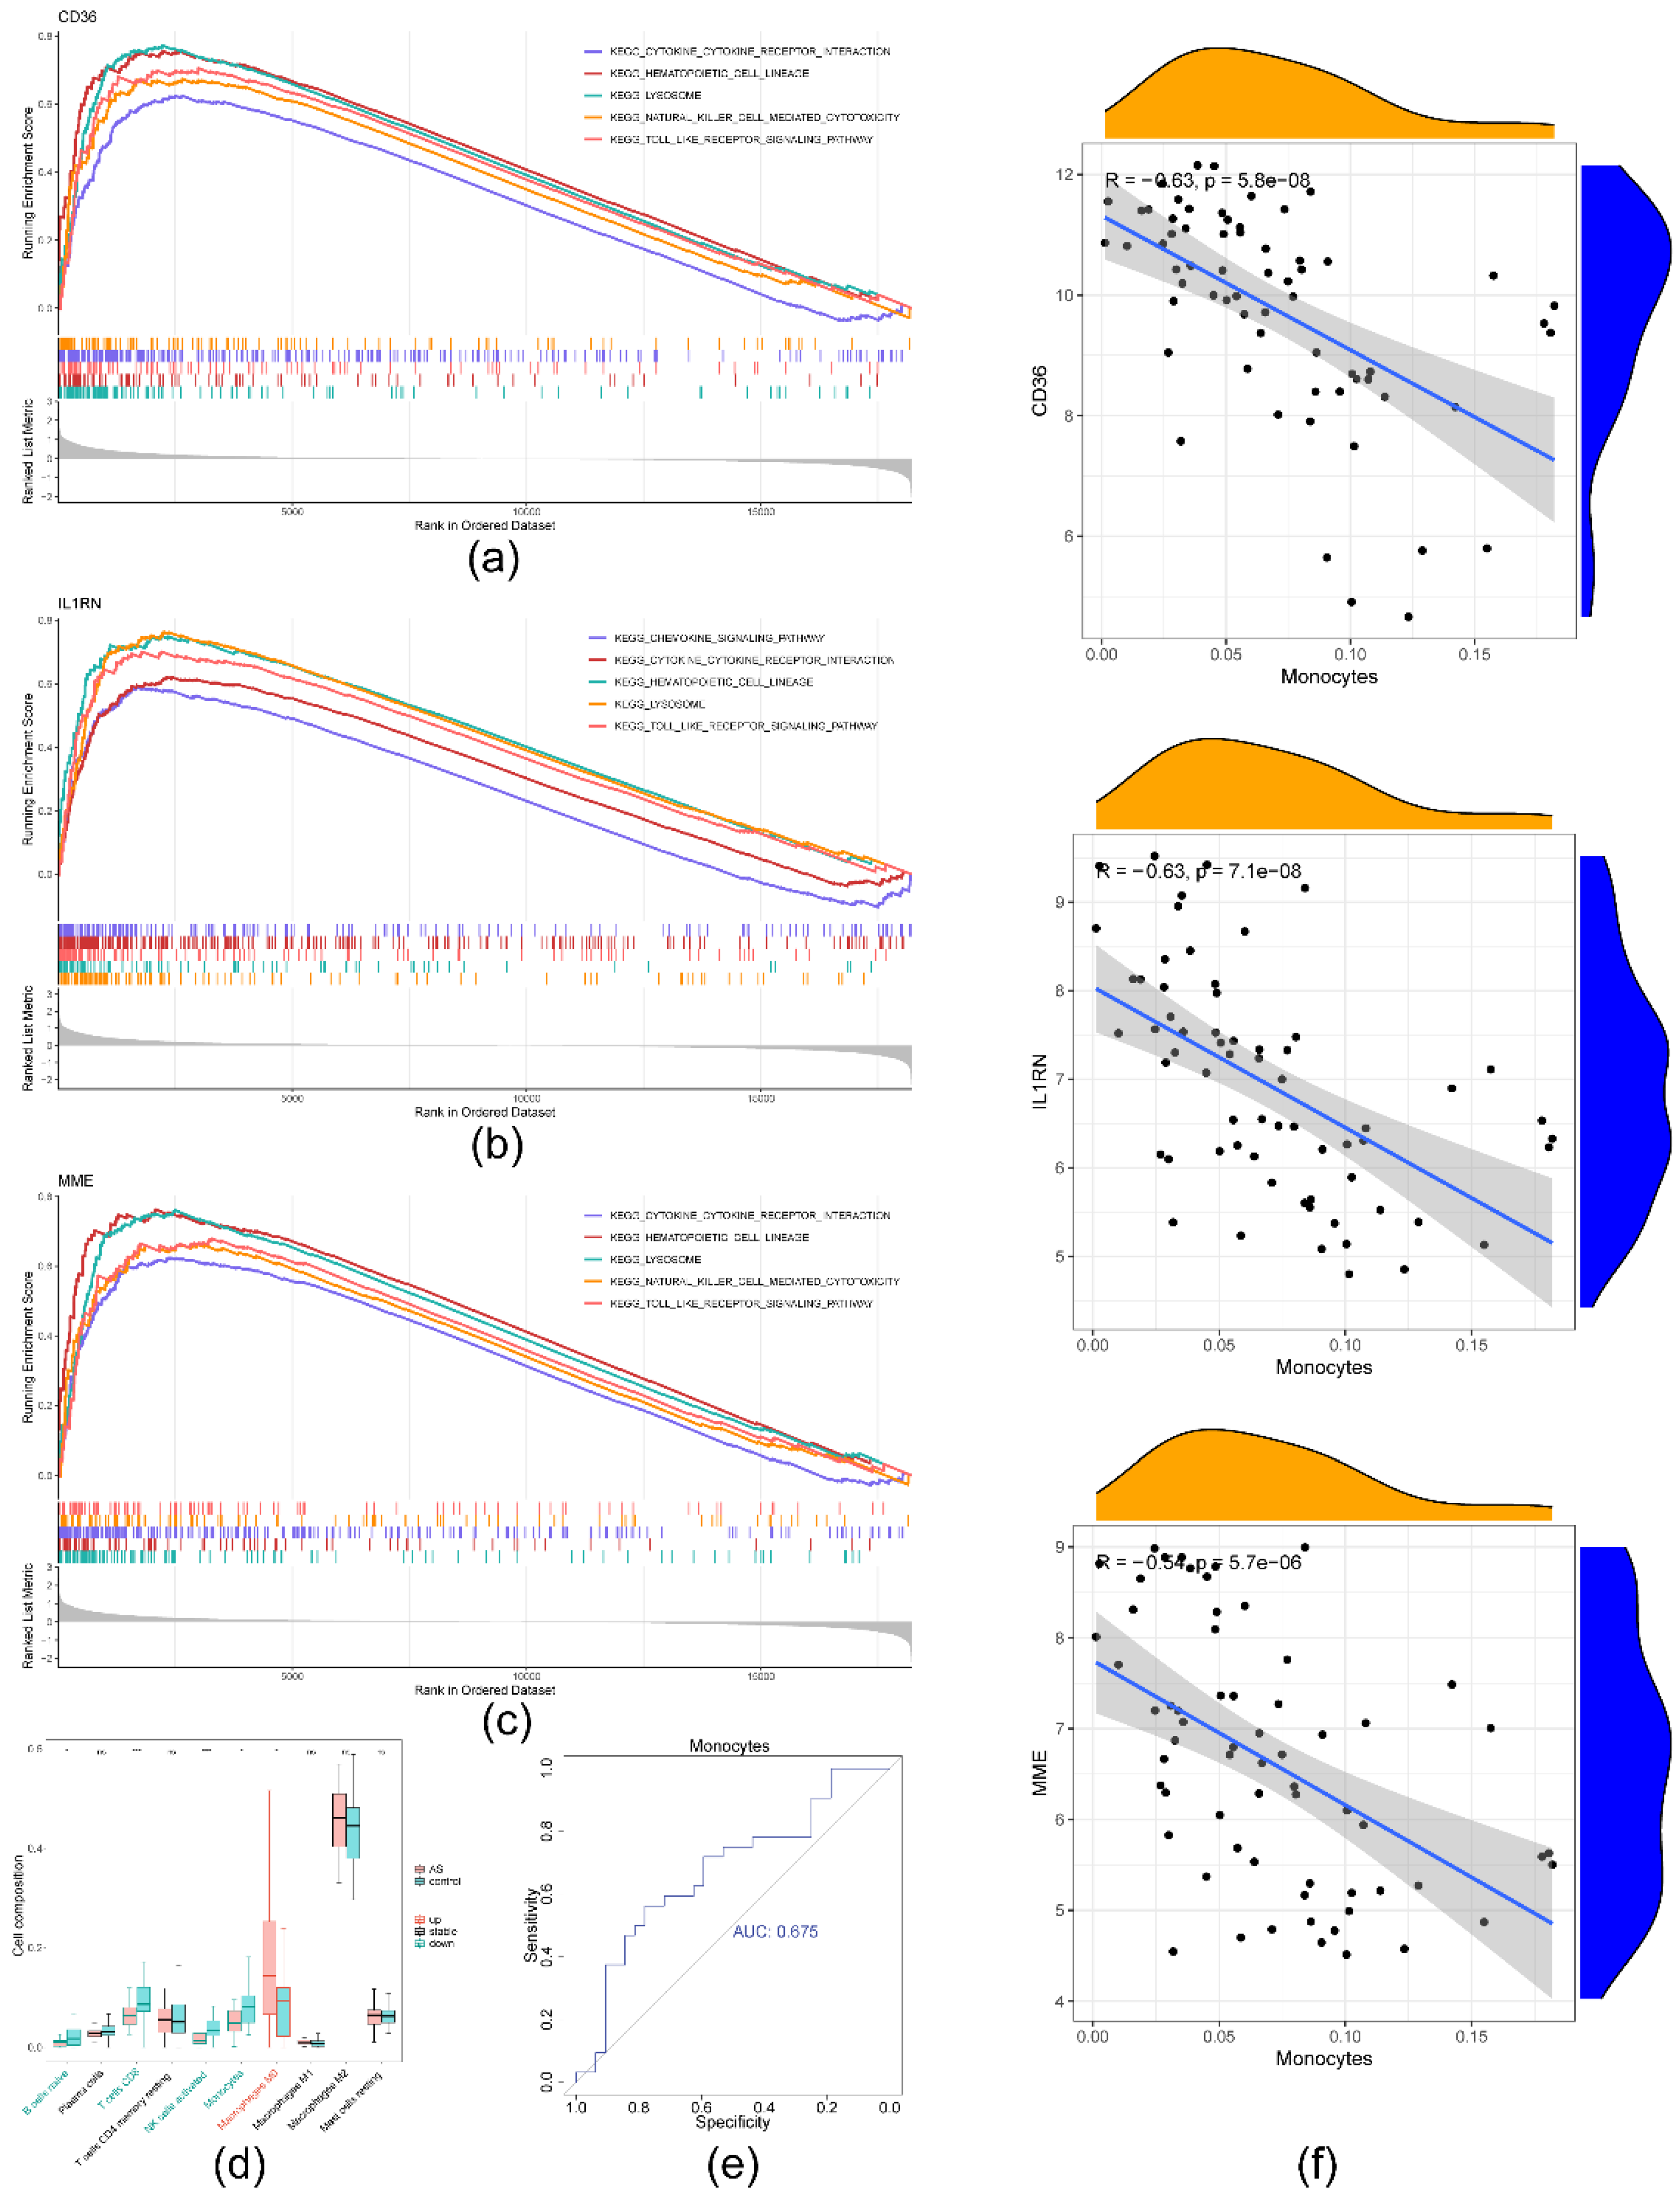
Figure 7.
Regulatory networks and drug prediction. (a) LncRNA-miRNA-mRNA regulatory network. (b) TF-mRNA-miRNA regulatory network. (c) Biomarker-drug prediction network.
Figure 7.
Regulatory networks and drug prediction. (a) LncRNA-miRNA-mRNA regulatory network. (b) TF-mRNA-miRNA regulatory network. (c) Biomarker-drug prediction network.
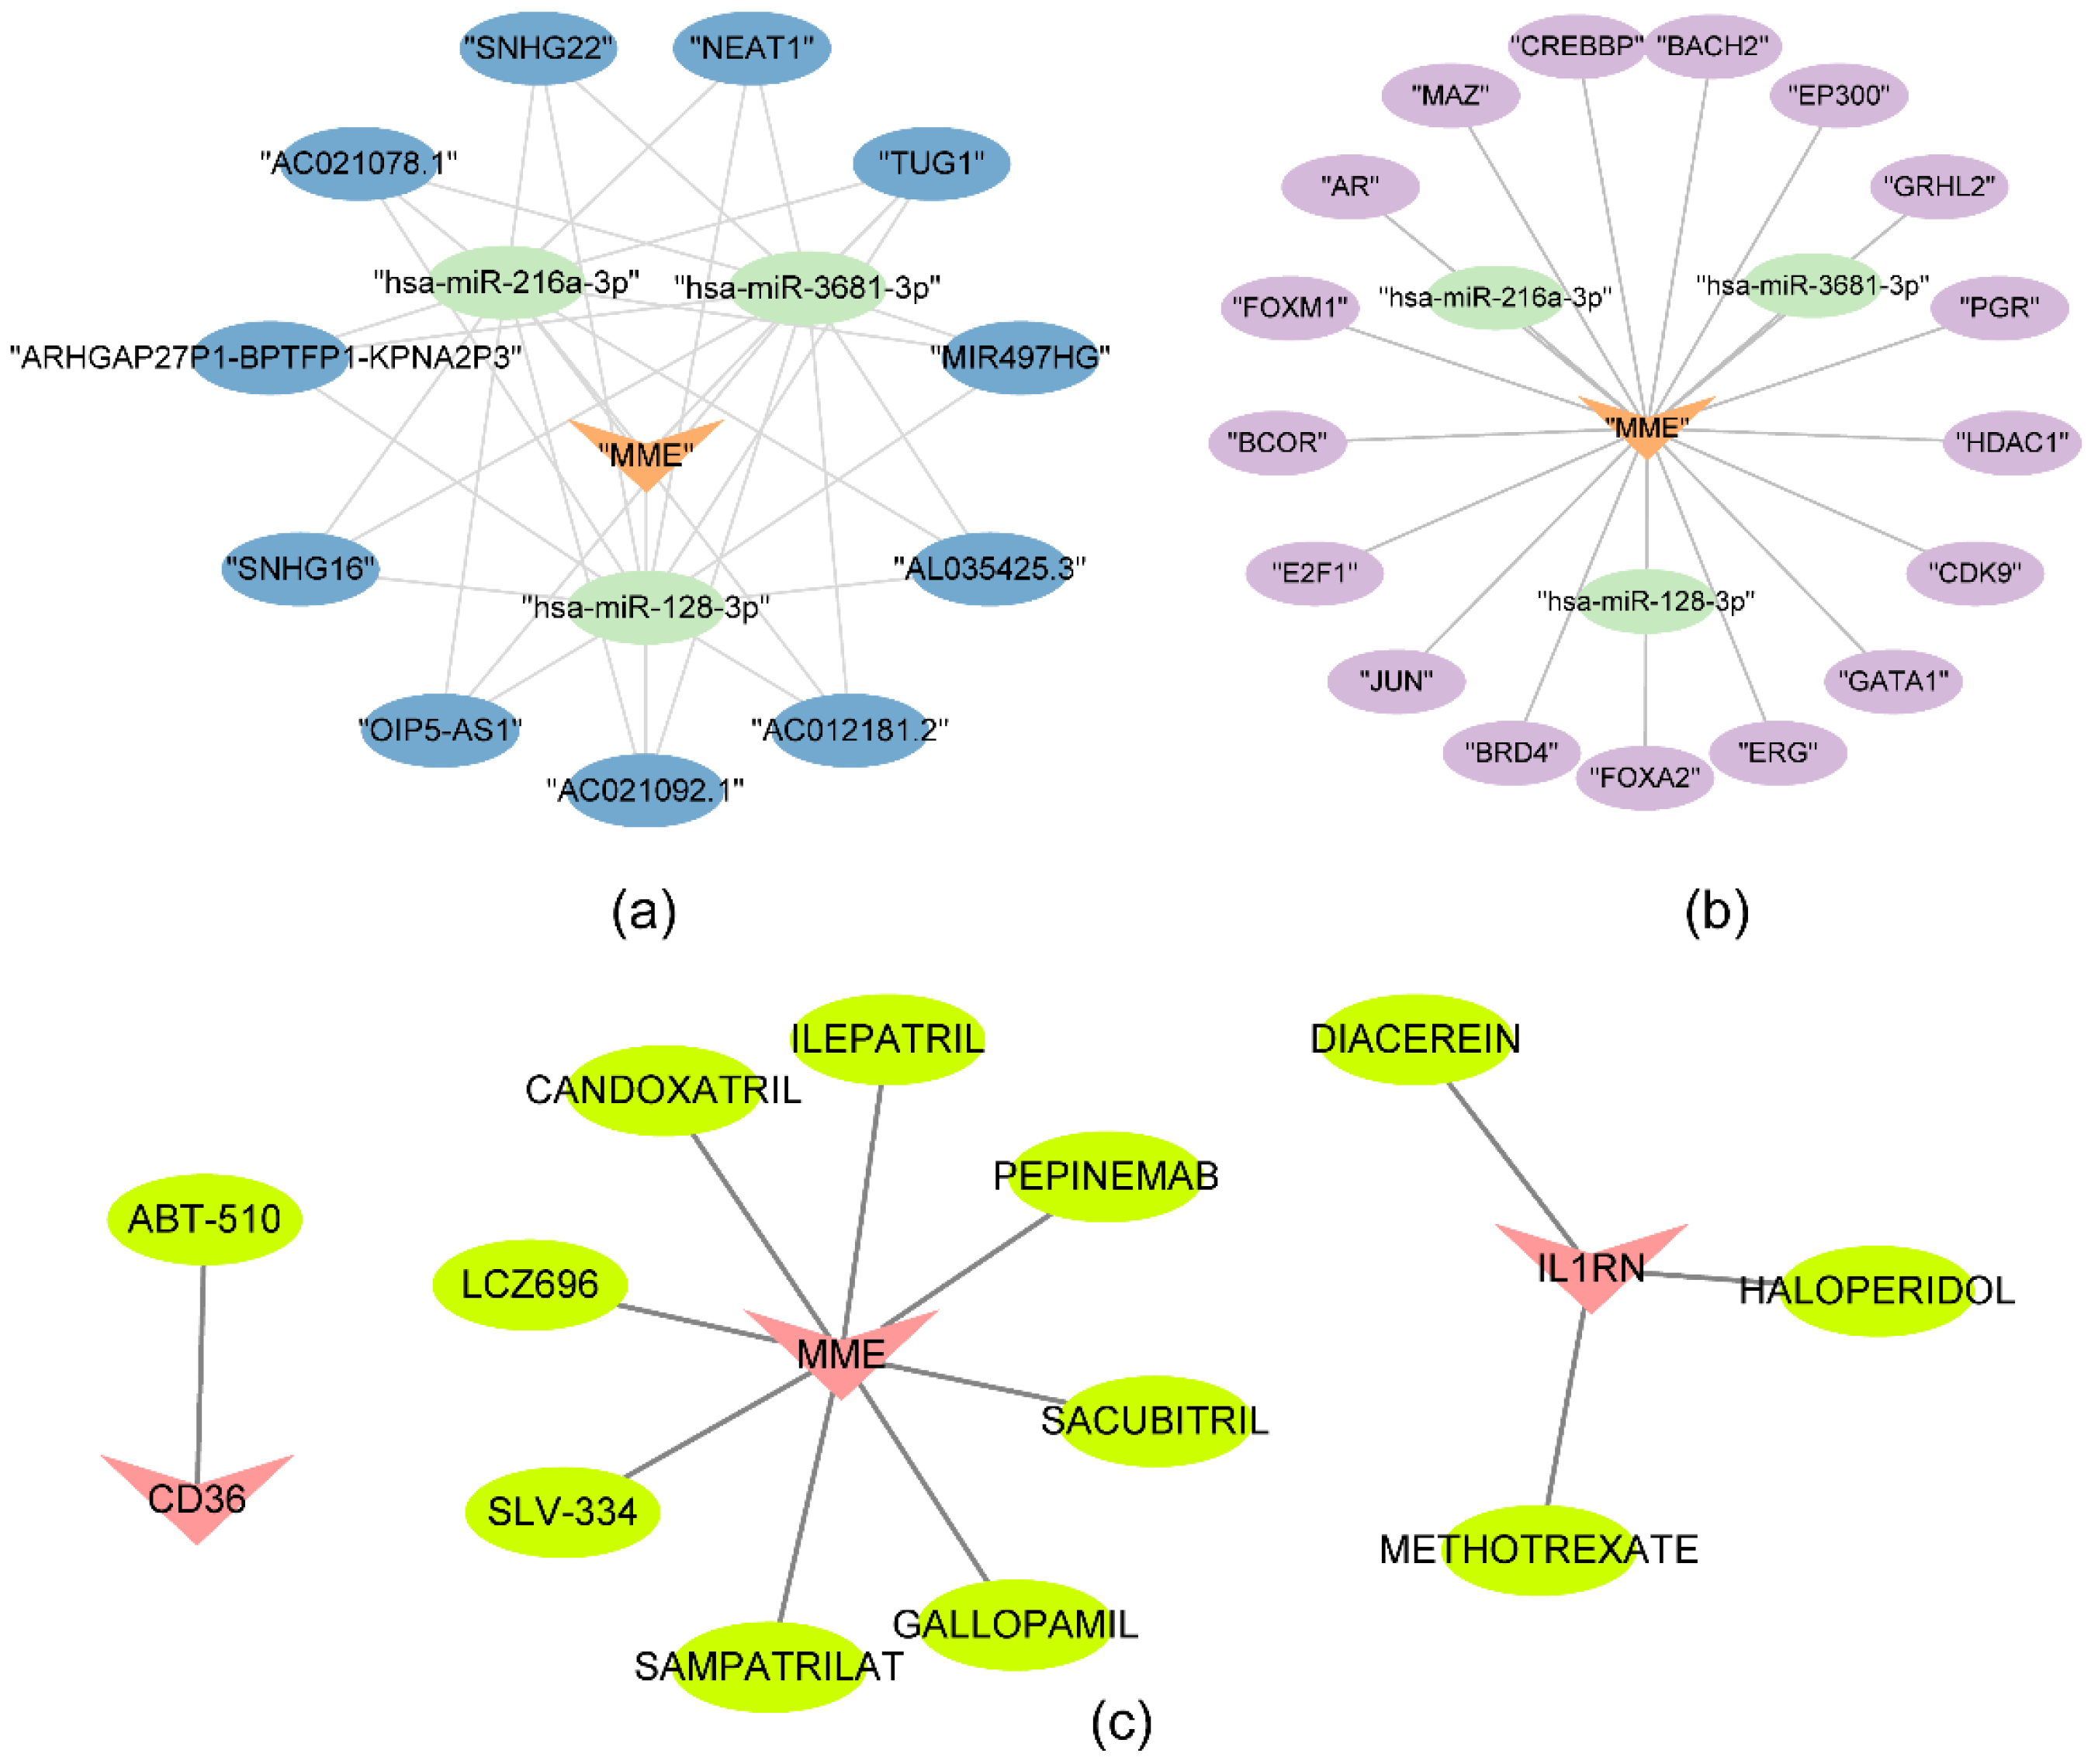
Figure 8.
Biomarker expression assessment. (a) Relative biomarker expression scores in different key cell types. *p < 0.05, **p < 0.01, ***p < 0.001, ****p < 0.001; ns: non-significance. (b) Assessment of biomarker expression in key cells.
Figure 8.
Biomarker expression assessment. (a) Relative biomarker expression scores in different key cell types. *p < 0.05, **p < 0.01, ***p < 0.001, ****p < 0.001; ns: non-significance. (b) Assessment of biomarker expression in key cells.
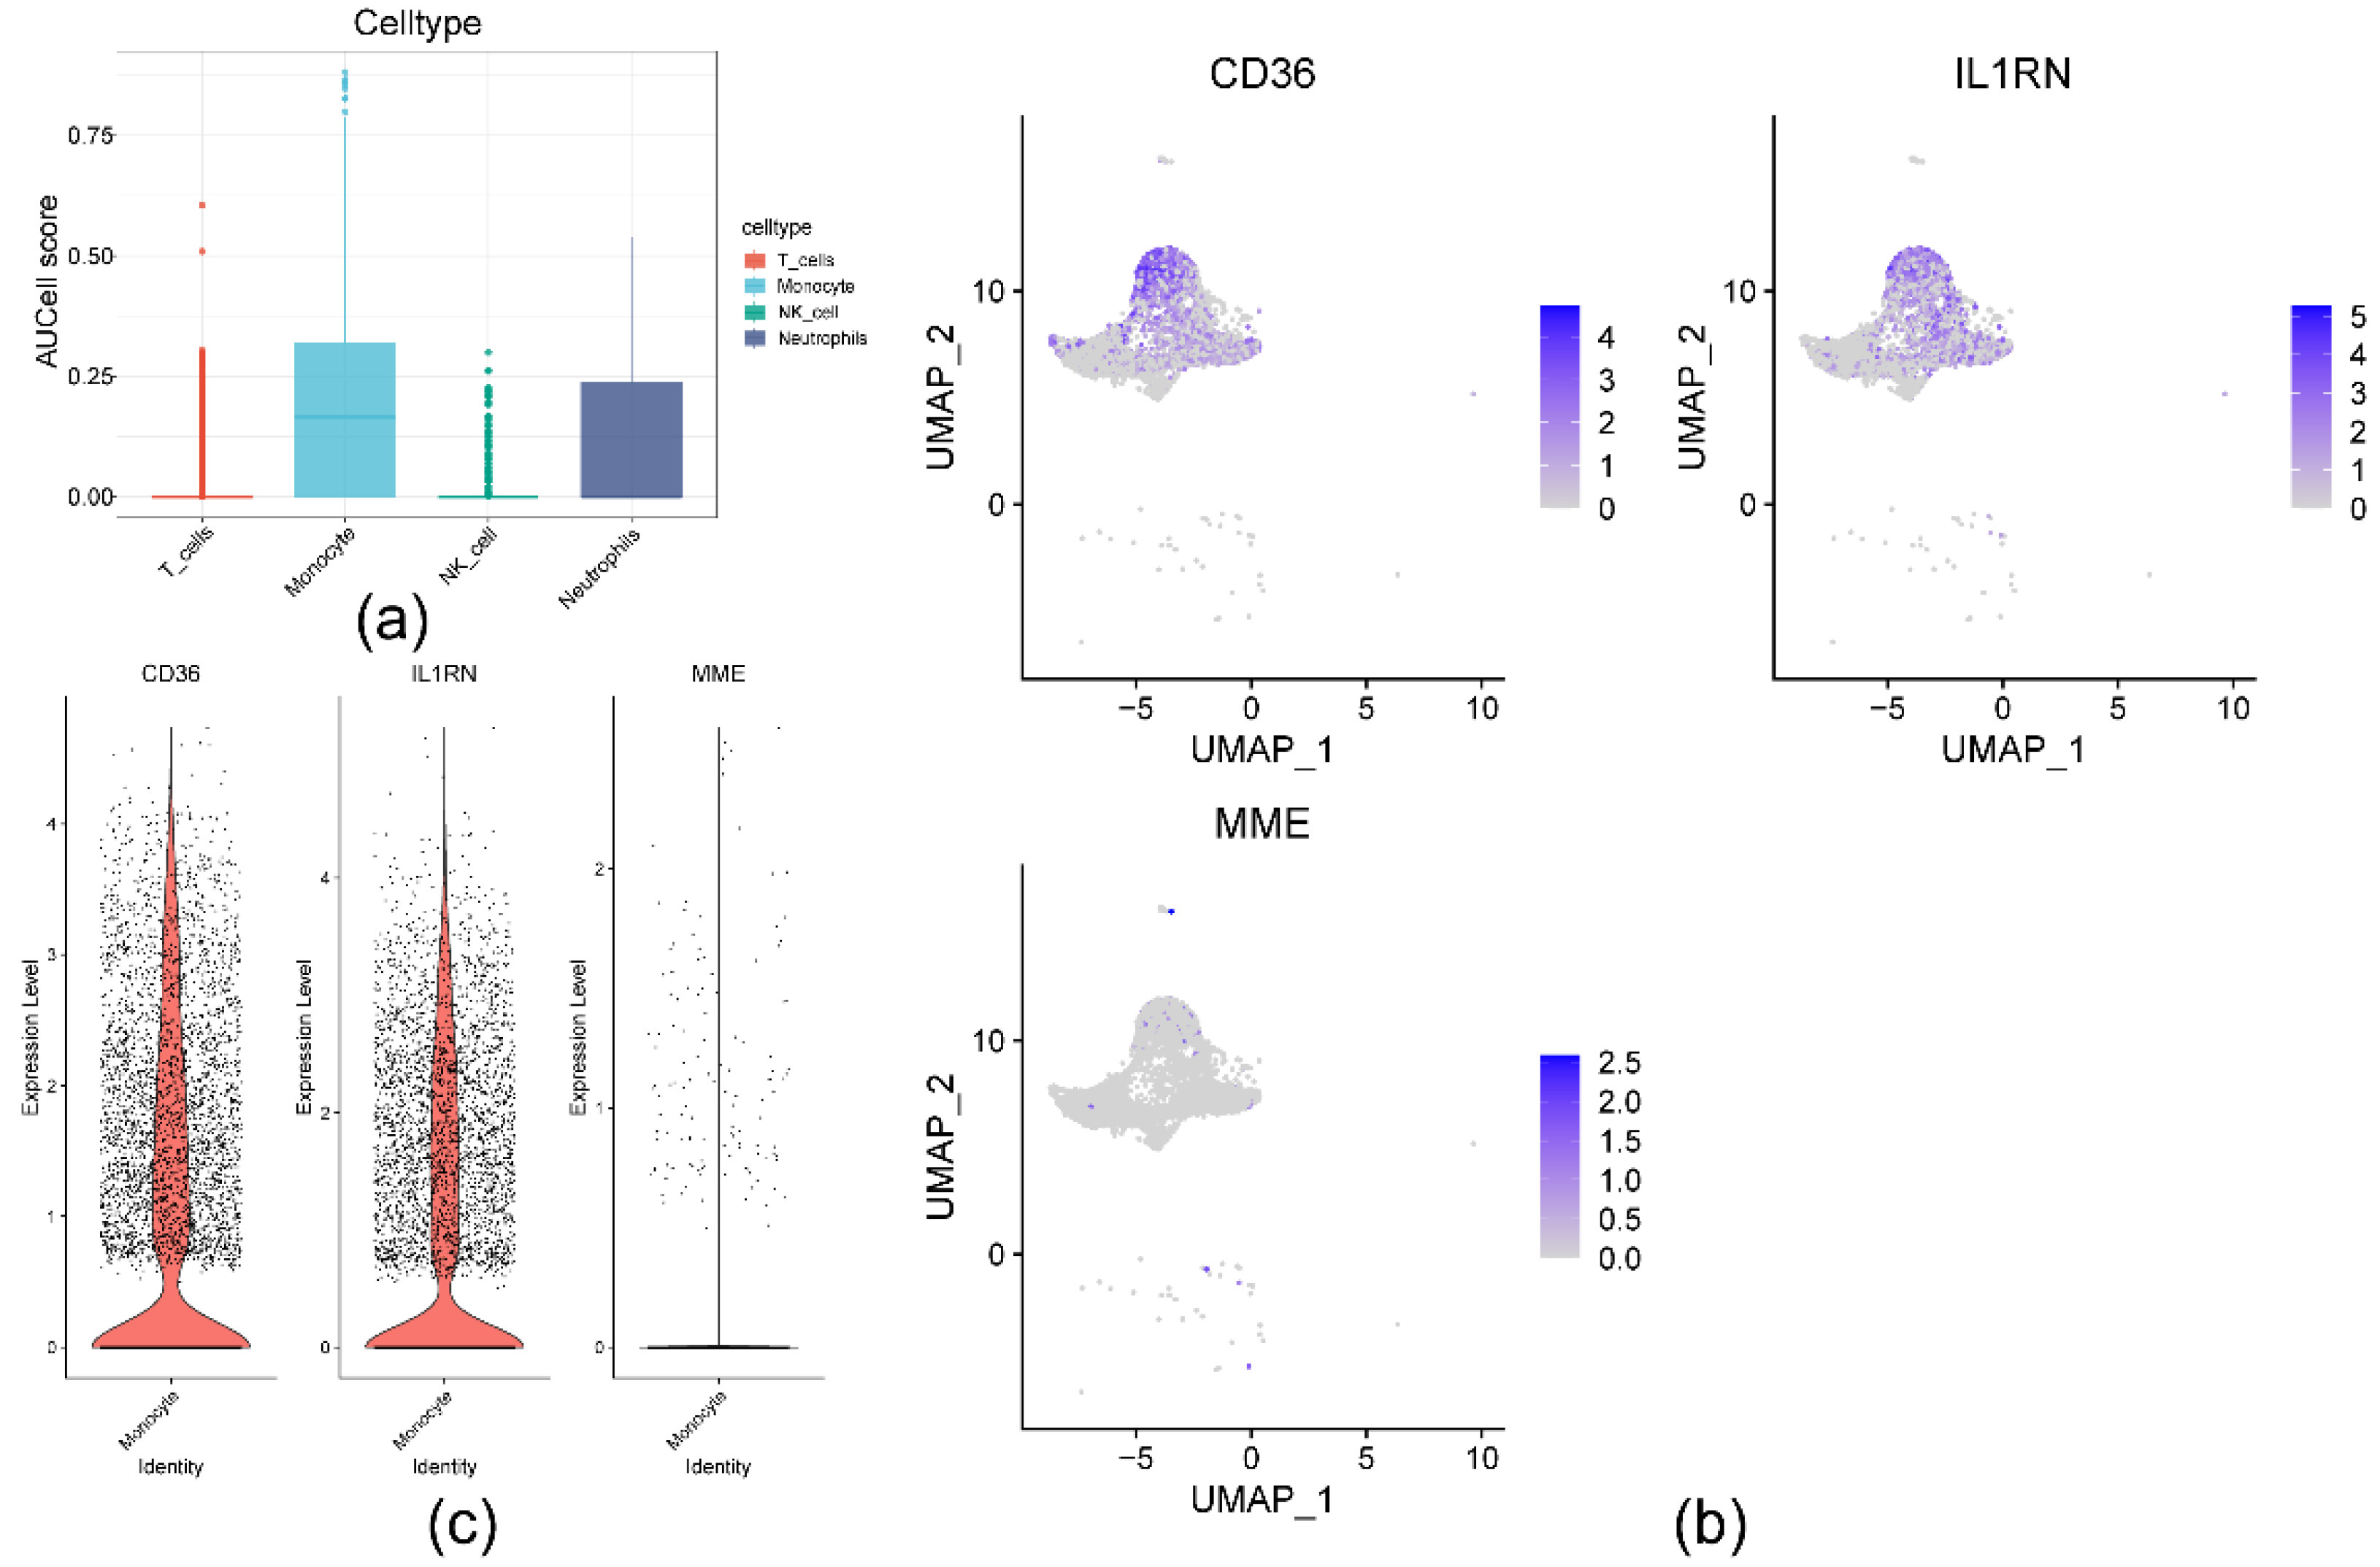

Table 1.
Results of the heterogeneity test of the MR analysis.
| ENSEMBL | x | id.outcome | outcome | exposure | method | Q | Q_df | Q_pval | method2 |
|---|---|---|---|---|---|---|---|---|---|
| eqtl-a-ENSG00000102575 | ACP5 | ukb-d-I9_CORATHER | Coronary atherosclerosis || id:ukb-d-I9_CORATHER | ENSG00000102575 || id:eqtl-a-ENSG00000102575 | Inverse variance weighted | 1.621829961 | 4 | 0.805 | IVW(fix) |
| eqtl-a-ENSG00000135218 | CD36 | ukb-d-I9_CORATHER | Coronary atherosclerosis || id:ukb-d-I9_CORATHER | ENSG00000135218 || id:eqtl-a-ENSG00000135218 | Inverse variance weighted | 5.673808854 | 9 | 0.772 | IVW(fix) |
| eqtl-a-ENSG00000136689 | IL1RN | ukb-d-I9_CORATHER | Coronary atherosclerosis || id:ukb-d-I9_CORATHER | ENSG00000136689 || id:eqtl-a-ENSG00000136689 | Inverse variance weighted | 2.016603369 | 6 | 0.918 | IVW(fix) |
| eqtl-a-ENSG00000196549 | MME | ukb-d-I9_CORATHER | Coronary atherosclerosis || id:ukb-d-I9_CORATHER | ENSG00000196549 || id:eqtl-a-ENSG00000196549 | Inverse variance weighted | 12.76861245 | 6 | 0.047 | IVW |
IVW: Inverse Variance Weighted.
Table 2.
Results of the horizontal pleiotropic test of the MR analysis.
| ENSEMBL | x | id.outcome | outcome | exposure | egger_intercept | Se | pval | judge |
|---|---|---|---|---|---|---|---|---|
| eqtl-a-ENSG00000102575 | ACP5 | ukb-d-I9_CORATHER | Coronary atherosclerosis || id:ukb-d-I9_CORATHER | ENSG00000102575 || id:eqtl-a-ENSG00000102575 | 4.39E-05 | 0.000351124 | 0.908487986 | NO |
| eqtl-a-ENSG00000135218 | CD36 | ukb-d-I9_CORATHER | Coronary atherosclerosis || id:ukb-d-I9_CORATHER | ENSG00000135218 || id:eqtl-a-ENSG00000135218 | 9.70E-05 | 0.000289626 | 0.746417041 | NO |
| eqtl-a-ENSG00000136689 | IL1RN | ukb-d-I9_CORATHER | Coronary atherosclerosis || id:ukb-d-I9_CORATHER | ENSG00000136689 || id:eqtl-a-ENSG00000136689 | 2.87E-05 | 0.000615668 | 0.964587868 | NO |
| eqtl-a-ENSG00000196549 | MME | ukb-d-I9_CORATHER | Coronary atherosclerosis || id:ukb-d-I9_CORATHER | ENSG00000196549 || id:eqtl-a-ENSG00000196549 | 0.000101792 | 0.000991142 | 0.922191498 | NO |
Disclaimer/Publisher’s Note: The statements, opinions and data contained in all publications are solely those of the individual author(s) and contributor(s) and not of MDPI and/or the editor(s). MDPI and/or the editor(s) disclaim responsibility for any injury to people or property resulting from any ideas, methods, instructions or products referred to in the content. |
© 2024 by the authors. Licensee MDPI, Basel, Switzerland. This article is an open access article distributed under the terms and conditions of the Creative Commons Attribution (CC BY) license (https://creativecommons.org/licenses/by/4.0/).
Copyright: This open access article is published under a Creative Commons CC BY 4.0 license, which permit the free download, distribution, and reuse, provided that the author and preprint are cited in any reuse.


