Submitted:
08 May 2025
Posted:
09 May 2025
Read the latest preprint version here
Abstract
Heart rate (HRV) is widely considered an important marker of the ANS effects on the heart, and as such, a crucial diagnostic tool in cardiology. There are a number of HRV-descriptors used in medical and research practice, usually without a clear-cut overview about their mutual relationship, which might hamper a proper selection among them, in a particular study. The problem is further complicated by the often-ignored fact that practically all HRV parameters are HR-dependent. Hence, our aim was to perform a comparative statistical analysis of ECG-recordings from a public database, with a focus on the HR-dependence of typical time-, frequency-domain, and nonlinear HRV parameters. We revealed their fundamental connections, that were substantiated by basic mathematical considerations, and were experimentally demonstrated via the analysis of 24-hours ECG-recordings of more than 200 healthy individuals. Wee confirmed the HR-dependence of typical time-domain parameters as RMSSD and SDNN, frequency-domain parameters as the VLF, LF and HF components, and nonlinear indices as sample entropy and DFA exponent. In addition to shedding light on their relationship, we identified a so-far neglected spectral band, VHF, as an important indicator of the SNS activity. We expect our results to be utilized in HRV analysis in both medical and research practice.
Keywords:
RMSSD
; Bland-Altman plot
; Parseval-theorem
; HRV spectral band
; Autonomic nervous system
; Entropy- and DFA-analysis
; Age-dependence
; Correlated noise
; uncorrelated noise
1. Introduction
Heart rate variability (HRV) measures the variation in interbeat intervals from one heartbeat to the next, reflecting changes in the heart rate (HR) over time. Heart rhythm is primarily governed by the synchronized firing of pacemaker cells in the sinoatrial node of the heart muscle, which initiates the cardiac cycle, and the activity of the pacemaker cells is regulated by autonomic efferent neurons and circulating hormones. The complex actions of the underlying interdependent regulatory systems give rise to the variability of the length of the cardiac cycle over different time scales, supporting the optimal performance of the heart under homeostasis. Therefore, HRV is widely considered an important marker of the autonomic nervous system (ANS)[1].
In addition to sympathetic and parasympathetic nervous system (SNS and PNS) activities, respiration and the baroreceptor reflex are considered to influence HRV on time scales ranging from seconds to minutes. In contrast, other ultradian and circadian rhythms driven by factors like metabolism, physical activity, body temperature and sleep-wake cycles govern HRV over hours to the daily cycle.
At the individual level, HRV can be influenced by several non-modifiable factors, such as age, gender and genetics, as well as modifiable factors, including physiological and pathological elements (e.g., posture, respiration, hormonal influences, inflammation, infections, neurological or mental disorders, cardiovascular conditions), lifestyle factors (e.g., alcohol, tobacco, drug use, exercise, meditation) and environmental factors (e.g., physical stress and temperature), and neuropsychological factors [2,3,4,5].
HRV is widely used in the investigation of the heart, and is considered an essential diagnostic tool in cardiology. Higher HRV is often associated with better fitness and heart adaptability, while reduced HRV is commonly linked to various pathological conditions, including congestive heart failure, diabetic neuropathy, mental disorders and cancer [6,7].
Researchers and clinicians use time-domain, frequency-domain, and non-linear indices to measure HRV, by typically analysing time-resolved electrocardiography (ECG) or pulsometry signals [8,9,10]. Time-domain indices are derived from the time series of RR-intervals, and capture the variability in HRV over the monitoring period. The mean RR (or NN) interval or, equivalently, the average HR, are the simplest time-domain indicators. Other time-domain measures, such as the standard deviation of normal-to-normal RR intervals (SDNN), represent the overall variability (both short- and long-term), while the root mean square of successive differences (RMSSD) is more suited to quantify short-term variability [8].
Frequency-domain analysis involves calculating the absolute or relative power, within high-frequency (HF), low-frequency (LF), and sometimes very-low-frequency (VLF) bands. For HRV in normal subjects, typical frequency band ranges in short-term recordings are 0-0.04 Hz (VLF), 0.04-0.15 Hz (LF), and 0.15-0.4 Hz (HF). Frequency-domain HRV measures include peak frequencies (the frequency corresponding to maximum power within each band), as well as the absolute and relative powers for each band, sometimes the normalized powers for LF and HF, the LF/HF power ratio, and the total spectral power [9,10].
Nonlinear indices assess the complexity and unpredictability of the interbeat intervals. Due to the heart's complex regulation system, HRV cannot be fully described using linear methods alone, prompting the use of nonlinear techniques such as the Poincaré plot, sample entropy (SampEn), and detrended fluctuation analysis (DFA). The Poincaré plot visualizes the correlation between consecutive RR intervals by plotting RRj+1 against RRj, and the shape of the plot is quantified using an ellipse fitted to the data. The ellipse's width (SD1) and length (SD2) are considered to represent short-term and overall HR variability, respectively [11].
Sample entropy SampEn measures the complexity of HRV, with a computation depending on two parameters: the embedding dimension (m) and the tolerance (r). Default values are m = 2 and r = 0.2xSDNN. Detrended fluctuation analysis (DFA) evaluates correlations in HRV data across different time scales. Short-term (α1) and long-term (α2) fluctuations are measured by the slopes of a log-log plot of correlation coefficient versus segment length, with α1 derived from segments of 4-16 beats and α2 from 16-64 beats [8,9].
HRV analysis is nowadays routinely applied in clinical cardiology and stress-relaxation studies [12,13,14,15]. When choosing HRV measures from the time-domain, frequency-domain, and non-linear methods to track clinical progress or performance, the choice often depends on the investigator's intuition and preference. This choice is further complicated by the well-known but often ignored fact that changes in HR do affect HRV. E.g., a decrease in HR leads to an increase of typical HRV indices, while an increase in HR generally decreases HRV parameters such as SDNN and RMSSD [16,17,18,19]. As physical activity and posture impact both HR and HRV [3,4,5,20,21], protocols developed by the joint European and American task forces [22] recommend stationary RR time-series measurement during HRV monitoring, though this complicates experiments requiring movement. Nearly all parameters that describe instantaneous HRV (i.e., excluding time-averaged measures) are influenced by HR, such as the time-domain, frequency-domain, or nonlinear measures [23,24,25,26,27], and this dependence is generally pivotal, namely, it usually masks the effects of all the other factors on HRV. For instance, if the relationship between the common HRV parameter, RMSSD and the HR is not appropriately considered, then the variability parameter will primarily reflect changes in the heart rhythm, and it will not provide independent physiological information [27].
During the past two decades, some prominent research groups have, indeed, recognized that HRV cannot be used as an accurate diagnostic marker without taking into account its HR-dependence, and therefore serious attempts have been made to describe the general features of the HR-dependence of various HRV parameters (see, amongst others, the publications of and the debates between the Billmann and the Boyett groups [16,16,18,19,23,24,25,28]. However, lacking the exact function that describes the relationship between HRV and HR, there has been no practical way to define a single, ”heart-rate-corrected” HRV parameter that could properly account for the HR-dependence. Some papers even argued that the existence of such a well-defined HRV(HR) function might mean that HRV does not contain extra information to what HR does [24]. Lately, it has been shown that while a well-defined RMSSD(HR) function indeed exists, and shows a remarkable invariability on the level of an individual from the hours’ to the monthly scale (hence it is called the “Master Curve”, MC) [27], momentary deviations from it on the seconds’ to the minutes scale do occur, and reflect changes in the sympatho-vagal balance, due, e.g. to stress or relaxation [29]. Longitudinal analyses also revealed changes of the MC on the decade scale, as well [27], which may be associated with the age-dependent degradation of the cardiac regulatory mechanism. As for the HR-dependence of the spectral and nonlinear HRV parameters, we should highlight the contribution of Platisa and coworkers, who, based on the results of some 20 volunteers, presented nice, low-noise curves describing changes in the VLF, LF and HF components, as well as in the sample entropy and alpha1 and 2 parameters of the DFA analysis, as a function of RR intervals, in a row of publications [26,30,31,32,33]. They also established apparent pairwise connections between these parameters, described with quasi-linear or quasi-quadratic functions, in this representation. More recently, Tsaneva and coworkers also presented notable analyses of HRV data by time-and frequency-domain, as well as nonlinear descriptors [10,34,35,36,37].
All the above works, along with many others, are fundamental contributions towards a deeper understanding of the complex mechanism via which the ANS influences the fluctuations of the HR time series, however, a more complete exploration of this stochastic process is at need.
Correspondingly, the current study aims to address this gap by performing a comparative statistical analysis of ECG recordings from a public database, containing 24-hour-long ECG recordings of 200 healthy individuals, with a focus on the HR-dependence of typical time-domain, frequency-domain, and nonlinear HRV parameters, which reflect the same stochastic process from different viewpoints. in addition, the large number of recordings and the wide age distribution of the volunteers allowed us to make age-cohort studies, as well. In support, the age dependence of the HRV parameters illuminates the physiological grounds of the complex regulatory mechanism of the ANS on cardiac function, since aging is associated with structural and functional alterations in the brainstem and hypothalamus, regions integral to autonomic regulation [38,39],.
In this study, we represent the various HRV parameters as a function of HR, because the curves in this representation are the easiest to interpret in terms of PNS and SNS effects (see, e.g., Figure S2 and S3) on the ultradian time scale of minutes to hours. Age-dependence, on the other hand, reflects long-term changes in the cardiac control of ANS, typically on the scale of decades to years. Investigation of such a combination of dependencies on a large database is a novel approach to the best of our knowledge. Therefore, we propose that our results, clarifying the formal connections between the most typical HRV parameters via analyzing their HR- and age-dependence, will facilitate a more insightful interpretation of HRV data in cardiovascular research and medical practice.
2. Materials and Methods
ECG data were obtained from a public database of the Telemetric- and Holter-ECG Warehouse (“THEW”) at the University of Rochester Medical Center, New York, United States [40]. The 24-h Holter recording data of 202 healthy volunteers (Database Normal, EHOL-03-0202-003, age ranging from 9 to 82 years) were analysed. The time series were filtered for outliers by a MATLAB routine “isoutlier”, with moving median 30 points (MathWorks, 2020).
In this study, we examined time-domain HRV parameters RMSSD and SDNN directly calculated from the time series of RR intervals extracted from the ECG recordings, the frequency-domain parameters LF, HF and very-high-frequency (VHF) power obtained from Fast Fourier Transform (FFT)-spectra of the RR and dRR time series, while among the nonlinear measures the DFA exponent α1 (with m = 2 and r = 0.2xSDNN), and the Poincaré plot were derived from RR time series, according to their definitions (Table 1), using a MATLAB code written by one of us (A.B.). Note that, since here we examined only healthy subjects’ recordings, where the percentage of extrasystoles is negligible, we approximated the NN time series with the corresponding RR time series, filtered for outliers (Figure S1).
For the DFA analysis, the time series was divided into non-overlapping segments of lengths ranging from 10 to 100 data points, in 10 steps. These fixed segment sizes (10, 20, ..., 100) were used to evaluate the fluctuation function across different time scales. The RR interval time series was interpolated at 4 Hz to achieve uniform sampling. All analyses — including frequency-domain measures (FFT-based spectral analysis), nonlinear metrics (e.g., entropy calculation, detrended fluctuation analysis), and time-domain parameters (e.g., RMSSD, SDNN) — were performed on successive overlapping segments. Each segment contained 512 data points, corresponding to a time window of 128 seconds. Consecutive segments were shifted by 50 data points (12.5 seconds), resulting in a considerable overlap between successive windows, which allowed for high temporal resolution in the dynamic analysis.
HRV-related Poincaré plots are graphical representations of the relevant RR time series [11]. The Descartian coordinates of the i-th point are Ri and Ri+1, respectively, where Ri is the i-th RR interval (Figure 1a). The Poincaré plots can then be transformed to the so-called Bland-Altman representation ((Ri + Ri+1)/2, Ri+1 − Ri). Note that the Bland-Altman plot is a difference plot, usually used to compare two different series of measurements of the same thing or process, in order to reveal, eg., possible systematic differences, due to inaccuracies of the different measuring instruments [43]. Here, we used it in an unusual way, inasmuch as we applied it to the same time series, but one of the counterpart is ”shifted” by one data point. and this way, we arrive at a transformation of the Poincaré scatter plot, where the points are now distributed quuasi-symmetrically around the abscissa (Figure 1b and c). From this, after a conversion from the RR- to the HR-scale (Figure 1c), and fitting Gaussians to the dRR distribution at each HR, a high-accuracy RMSSD(HR) plot can be determined, which is called the “Master Curve” (MC) (Figure 1d) [27].
The evaluation methods were applied to each valuable ECG recording, and the relationships between the time-, frequency-domain and nonlinear parameters are shown via HR data of a typical healthy individual (age:21, male), doubled with age-cohort-averaged data of healthy people.
3. Results and Discussion
3.1. RMSSD and the Poincaré plot
Revealing the connection between these time-domain and nonlinear measures requires several-hours-, preferably 24-hours-long recordings. Figure 2a shows a Bland-Altmann-type representation of the conventional Poincaré plot of a typical individual from the THEW data base, where from the MC, representing the HR-dependence of RMSSD, was calculated, as described above (Figure 2b). RMSSD as calculated directly from the RR time series data by a conventional sectional evaluation of the HR time series with a rolling time window (width = 128s, step size = 12.5s) is shown together with the MC in Figure 2c. When selecting the optimal width of the time window, one has to consider the problem stemming from the time dependence of HR. If the analysis is restricted to short time intervals (where HR does not change significantly), it results in a higher uncertainty in HRV, as compared to the MC method (Figure 2c). Although, longer averages reduce the level of fluctuations in the sequential time-window analysis, as well, but they inevitably accompany with information loss on the HR scale. Hence, whenever it can be applied, the MC method is preferred to use for the determination of the RMSSD(HR) dependence. As it was established in Buzás et al [27], the MC is rather stable for an individual on the daily to monthly scales, so it can be used as a good reference for the cardiac state of a person. On the cohort level, it was pointed out, however, that aging and myocardial infarction do influence MC, so a change of MC is considered to reflect remodelling of the heart. In Figure 2d, we show the age-cohort-averaged Master Curves according to a new age classification (the start and end ages of the cohorts are also indicated on the plot), showing a gradual decline of the HRV level, as age progresses [27]. It has also been shown that MC can be decently interpreted by a two-component stochastic model, where the two noise components were tentatively attributed to sympathetic and parasympathetic influence, PNS effects being more dominant at low heart rates (HR< ca.100), while SNS effects above (Figure S3) [27]. Recent publications suggest that MC represents the mean sympatho-vagal balance as a function of HR, and short-term (i.e., minute-scale) deviations from it are indicative of actual fluctuations of the SNS and/or PNS effects [27,29]. A new HRV-indicator based on the actual RMSSD normalized to the Master Curve was successfully used to characterize stress responses and relaxation [29].
3.2. Fourier-components versus RMSSD and SDNN
Fourier-transform of the RR or dRR time series is used for the spectral description of HRV, usually using the FFT algorithm. FFT analysis of the RR(t) data usually show characteristic features in the “very-low-frequency” (0.0033Hz<ω<0.04 Hz), the “low-frequency (0.04Hz<ω<0.15Hz) and in the “high-frequency” (0.15Hz<ω<0.4 Hz) regime, denoted by VLF, LF and HF, respectively. In the FFT spectra of dRR data, however, the VLF components are overdamped, hence, usually only the LF and HF features are considered. The VHF regime (>0.4 Hz) is rarely mentioned and poorly discussed [44].
Unless the so-called ULF band (ω<0.0033Hz) is investigated, FFT is usually performed on HRV(t) (i.e., RR or dRR time series) data within a few-minutes-wide time window (of a width usually between 2 and 5 minutes), which is shifted along the time scale. The RR or dRR time series should be interpolated by equidistant sampling beforehand, and then an average HR value can also be assigned to each interval. Because of the strict mathematical relationship between frequency- and time-domain parameters, if the former show a HR-dependence, the latter should also do so.
Figure 3a shows the averaged FFT map of all the healthy people’s dRR data from the THEW database, as a function of HR. While the conventional LF and HF bands present explicit spectral features at “normal” heart rates (HR up to ca. 120 bpm), a more diffuse but non-negligible feature also emerges in the VHF region at higher heart rates (above ca. 100 bpm, Figure 3a and b). Without entering a deeper discussion about the origin of this neglected broad band, one should establish that it appears in the range of high HRs, where SNS effects dominate, and as such, it is expected to be an important status indicator in neurology, cardiology, aging or sports applications.
Our findings provide an interesting support to the above statement: The 24-hours-long ECG recordings of the THEW database, registered on healthy people of ages between 9 and 82 years, were classified into 5 age cohorts, and the cohort-averaged FFT spectral maps were compared (Figure 4).
It is apparent that as age increases, a large part of the VHF “cloud” is shifted towards lower HR values, and gradually merges into the HF band. Further targeted physiological studies are needed to explore the full diagnostic value of this new spectral feature, but it is clear that this effect points at the increased weight of SNS effects, as age progresses. Our new findings are also in line with independent physiological evidences for the increase of the SNS activity by age in humans, which has been observed in both basal (resting) conditions and in response to stress or physiological challenges. In support, Monahan et al. (2003) demonstrated that aging is associated with increased sympathetic nervous system activity and reduced parasympathetic modulation, which may contribute to the development of age-related hypertension [39]. Esler et al. (2008) observed elevated plasma norepinephrine levels and increased sympathetic nerve firing rates as aging is progressed [45].
Due to the strict connection between the HRV(ω) and HRV(t) data (where ω is the angular frequency, and t is time), a quantitative statement can be established for the HR-dependence of such time-domain HRV parameters as RMSSD or SDNN and that of the Fourier-components of the FFT power spectra. Namely, the following equations hold:
The name of the underlying mathematical relationship is Parseval’s theorem, which expresses the unitarity of the Fourier transform, loosely stating that the “energy” of the signal should be equal by summing power-per-sample across time or spectral power across frequency [46]. To translate it for our case: the HRV amplitude associated for a certain HR should be the same whether it is calculated from the time-domain parameters or the corresponding frequency-domain ones. From this, it follows that RMSSD(HR) and SDNN(HR) can be regained from the superposition of the LF(HR), HF(HR) and VHF(HR) functions. . Using the data of the selected typical individual, Figure 5 shows that it is indeed the case, with good approximation.
3.3. Fourier-components versus nonlinear measures (DFA and SampEn)
DFA analysis and SampEn report rather on the structure of HRV fluctuations than on the size of them. DFA analysis evaluates the degree of correlation between each RR interval and the preceding and following RR intervals across various time scales. The algorithm first divides the integrated time series of 10 intervals into bins of length N. In each bin, a least-squares line is fitted to capture the local trend. The integrated time series is then detrended by subtracting the local trend in each bin. The root-mean-square fluctuation of the integrated and detrended time series is subsequently calculated for all bin lengths, ranging from N = 10 to N = 100 RR intervals. The α coefficient, which quantifies the relationship between fluctuations and bin length on a log-log plot, determines the extent of long-range correlations. An α1 value of 1.00 indicates perfect correlations across all time scales, while an α value of 0.50 signifies complete lack of correlation with previous and subsequent intervals [8,47].
Figure 6d shows the α1 (HR) plot of the selected individual, whose RR data were used in the former HRV analyses in this paper. In spite of the relatively large standard deviation, the overall trend is clearly visible: While at the lowest HR values (HR ≈ 60-65 bpm), the DFA coefficient, α1 is close to 0.5, there is a rising tendency up to HR ≈ 120-130 bpm, α1 reaching a maximum value of shortly over 1, above which HR range, it starts to decline to lower values, again. The statistical meaning of this is that while HRV statistics at low HR values is close to that of an uncorrelated white noise, around its zenith it approaches α1≈1, representing a strongly correlated pink (1/f) noise, and at even higher HR values, it returns toward a less correlated fluctuation statistics. Entropy, reporting the degree of disorder, reflects a corresponding anti-correlation with the DFA exponent. The uncorrelated white-noise-like state corresponds to the highest value, and then, after reaching a minimum showing a stronger level of correlation at HR ≈ 130 bpm, it starts to rise again as HR grows (Figure 6a). The corresponding frequency spectra are in line with the above: at HR ≈ 65 bpm, the noise spectrum shows a relatively flat feature (slope ≈ 0), at other HR values it shows a steeper negative slope, reaching its extremum (slope ≈ -2) around 130 bpm, representing an 1/f2–like, correlated noise.
An age-cohort analysis shows the above relations between the DFA-exponent and SampEn even more clearly (Figure 7). The cohort-averaged plots show a nice anti-symmetry, revealing that the decline of α1 at high HRs is real, whose pandant is seen as a rise of SampEn in the same range. Our findings are in concert with the earlier results of Platisa et al., who depicted the DFA-exponent and SampEn as a function of the RR-interval lengths, and found extrema around the same RR value in both cases [30]. They also hypothesized that the abscissa of this “turning point”, Htp (i.e., the minimum place for SampEn and the corresponding maximum place of α1) might reflect the intrinsic heart rate, Hi (i.e., the HR measurable at full autonomic blockade) [30,33]. This would mean that Hi could be determined non-invasively, without pharmacologically blocking the effects of PNS and SNS on the cardiac cycle. Our age-cohort-averaged data, indeed, show a similar tendency of declination for Htp, as it has earlier been determined for Hi [48], implying a possible close connection between Htp and Hi. Note that a decrease of HRi to lower values by age is also in concert with an increasing sympathetic dominance. Recent studies of Singh et al., using other nonlinear HRV measures, such as Approximate Entropy (ApEn) and Recurrence Quantification Analysis (RQA) analysed two age cohorts (”young” and ”elderly” subjects), also came to a similar conclusion [49], suggesting that ApEn and RQA could more sensitively measure age-dependent effects than linear parameters can do.
It is also worth emphasizing that similarly to the decrease of Htp and Hi values, the centre of the VHF “cloud” also decreases as age progresses. This is a nontrivial correlation in the sense that, unlike the weight of the spectral components, the nonlinear HRV parameters do not directly measure the specific peaks considered a manifestation of ANS-related effects, but rather reflect the background noise structure, probably governed by coupled oscillations and fluctuations of other regulatory processes. Hence, they must carry some independent information, as well, to those HRV time- or frequency-domain parameters that measure the amplitude (power) of fluctuations.
4. Conclusions
Based on the intrinsic HR- and age-dependence of typical time- and frequency-domain HRV parameters and nonlinear HRV indices, we carried out a comparative study to reveal their fundamental connection, which is substantiated by basic mathematical considerations, and was experimentally demonstrated via the analysis of 24-hours ECG recordings of more than 200 healthy individuals.
We confirmed that the HR-dependence of one of the most frequently used time-domain parameters, RMSSD can be derived from Poincaré plots, as well, and that this “Master-Curve” representation seems to be superior to the conventional method. MC reflects both PNS and SNS effects, and represents the medium-term sympatho-vagal balance (from the hour- to the monthly scale). Momentary deviations from it (on the second to the minute scale) are indicative of the actual changes in, e.g., mood or stress [29], while long-term changes (on the yearly to the decade-scale) can be attributed to irreversible decline of the complex regulatory mechanism governing the dynamics of cardiac function (see also [27]).
In addition to this, we showed that the RMSSD(HR) and SDNN(HR) plots can also be reproduced from the Fourier-spectral components of the original RR time series, which is a natural manifestation of the Parseval theorem. As an illustrative tool for the visualization of the HRV spectra, we used a novel Fourier-map representation. By comparing the HR-dependence of the Fourier-map and the Master Curve, we found a new cloud-like structure of the HRV frequency spectrum. It is bunched mainly in the VHF band, and must be an important indicator of the effects of sympathetic nervous system on the heart rhythm. By an age-cohort evaluation, it was found that this “VHF band” is gradually shifted to lower HR regimes, as age progresses, and as such, it may be an important indicator of the age-related remodeling of the heart. We expect it to be utilized in the diagnostics of various cardiovascular diseases in the near future [45].
An anti-correlation between the DFA exponent (α) and sample entropy is apparent both on the individual and the cohort levels, which could be interpreted by frequency-spectral features of the HRV, as well. One can establish that these nonlinear indices report on the stochastic structure of HR fluctuations, contrary to the other time- or frequency-domain HRV measures that reflect direct PNS and SNS effects on the power of the HRV signal, hence, they carry independent information about the complex regulatory mechanism of the cardiac cycle. Nevertheless, the age-dependence of the extremum-places of these nonlinear measures seem to show correlation with the frequency-shift of the diffuse structure of the HRV spectrum, which can probably be assigned to increasing SNS dominance, as age progresses.
On the whole, we believe that our new findings regarding the phenomenology of HRV will shed more light on the context of various HRV measures, and will contribute to a deeper interpretation of the effects of external and internal factors associated to normal physiological or pathological phenomena.
Supplementary Materials
The following supporting information can be downloaded at the website of this paper posted on Preprints.org.
Author Contributions
Conceptualization, A.D. and A.B.; methodology, A.B, A.D. and B.S.; software, A.B.; validation, A.D., A.B. and B.S.; formal analysis, A.B and A.D..; investigation, A.B, B.S and A.D.; resources, A.D. and A.B.; data curation, A.B.; writing—original draft preparation, A.D.; writing—review and editing, A.D, A.B. and B.S..; visualization, A.B.; supervision, A.D, A.B. and B.S.; All authors have read and agreed to the published version of the manuscript.
Funding
This research received no external funding.
Data Availability Statement
The original data presented in the study are openly available in the Telemetric and Holter ECG Warehouse (THEW) at doi:10.1016/j.jelectrocard.2010.07.015, Ref. 28.
Conflicts of Interest
The authors declare no conflicts of interest.
Abbreviations
The following abbreviations are used in this manuscript:
| ANS | Autonomic nervous system |
| DFA | Detrended fluctuation analysis |
| ECG | Electrocardiography |
| FFT | Fast Fourier Transform |
| HF | High-frequency |
| HR | Heart rate |
| HRV | Heart rate variability |
| LF | Low-frequency |
| MC | Master Curve |
| NN | Normal-to-normal RR intervals (NN and RR are used here synonymously) |
| PNS | Parasympathetic nervous system |
| RMSSD | Root mean square of successive differences |
| RR; dRR | Length of the RR interval, Length-difference of successive RR intervals |
| SampEn | Sample entropy |
| SDNN | Standard deviation of normal-to-normal RR intervals |
| SNS | Sympathetic nervous system |
| THEW | Telemetric- and Holter-ECG Warehouse |
| VHF | Very-high-frequency |
| VLF | Very-low-frequency |
References
- Billman, G.E. Heart Rate Variability ? A Historical Perspective. Front. Physio. 2011, 2. [Google Scholar] [CrossRef]
- Tiwari, R.; Kumar, R.; Malik, S.; Raj, T.; Kumar, P. Analysis of Heart Rate Variability and Implication of Different Factors on Heart Rate Variability. CCR 2021, 17, e160721189770. [Google Scholar] [CrossRef]
- Fatisson, J.; Oswald, V.; Lalonde, F. Influence Diagram of Physiological and Environmental Factors Affecting Heart Rate Variability: An Extended Literature Overview. Heart International 2016, 11, heartint.500023. [Google Scholar] [CrossRef] [PubMed]
- Sammito, S.; Böckelmann, I. Factors Influencing Heart Rate Variability. ICFJ 2016, 6. [Google Scholar] [CrossRef]
- Valentini, M.; Parati, G. Variables Influencing Heart Rate. Progress in Cardiovascular Diseases 2009, 52, 11–19. [Google Scholar] [CrossRef]
- Schiweck, C.; Piette, D.; Berckmans, D.; Claes, S.; Vrieze, E. Heart Rate and High Frequency Heart Rate Variability during Stress as Biomarker for Clinical Depression. A Systematic Review. Psychol. Med. 2019, 49, 200–211. [Google Scholar] [CrossRef]
- Kloter, E.; Barrueto, K.; Klein, S.D.; Scholkmann, F.; Wolf, U. Heart Rate Variability as a Prognostic Factor for Cancer Survival – A Systematic Review. Front. Physiol. 2018, 9, 623. [Google Scholar] [CrossRef]
- Tarvainen, M.P.; Niskanen, J.-P.; Lipponen, J.A.; Ranta-aho, P.O.; Karjalainen, P.A. Kubios HRV – Heart Rate Variability Analysis Software. Computer Methods and Programs in Biomedicine 2014, 113, 210–220. [Google Scholar] [CrossRef] [PubMed]
- Shaffer, F.; Ginsberg, J.P. An Overview of Heart Rate Variability Metrics and Norms. Front. Public Health 2017, 5, 258. [Google Scholar] [CrossRef]
- Georgieva-Tsaneva, G.N. Time and Frequency Analysis of Heart Rate Variability Data in Heart Failure Patients. IJACSA 2019, 10. [Google Scholar] [CrossRef]
- Kamen, P.W.; Tonkin, A.M. Application of the Poincaré Plot to Heart Rate Variability: A New Measure of Functional Status in Heart Failure. Australian and New Zealand Journal of Medicine 1995, 25, 18–26. [Google Scholar] [CrossRef]
- Brinkmann, A.E.; Press, S.A.; Helmert, E.; Hautzinger, M.; Khazan, I.; Vagedes, J. Comparing Effectiveness of HRV-Biofeedback and Mindfulness for Workplace Stress Reduction: A Randomized Controlled Trial. Appl Psychophysiol Biofeedback 2020, 45, 307–322. [Google Scholar] [CrossRef] [PubMed]
- Kim, H.-G.; Cheon, E.-J.; Bai, D.-S.; Lee, Y.H.; Koo, B.-H. Stress and Heart Rate Variability: A Meta-Analysis and Review of the Literature. Psychiatry Investig 2018, 15, 235–245. [Google Scholar] [CrossRef]
- Lin, I.-M.; Wang, S.-Y.; Fan, S.-Y.; Peper, E.; Chen, S.-P.; Huang, C.-Y. A Single Session of Heart Rate Variability Biofeedback Produced Greater Increases in Heart Rate Variability Than Autogenic Training. Appl Psychophysiol Biofeedback 2020, 45, 343–350. [Google Scholar] [CrossRef] [PubMed]
- Rijken, N.H.; Soer, R.; De Maar, E.; Prins, H.; Teeuw, W.B.; Peuscher, J.; Oosterveld, F.G.J. Increasing Performance of Professional Soccer Players and Elite Track and Field Athletes with Peak Performance Training and Biofeedback: A Pilot Study. Appl Psychophysiol Biofeedback 2016, 41, 421–430. [Google Scholar] [CrossRef] [PubMed]
- Billman, G.E. The Effect of Heart Rate on the Heart Rate Variability Response to Autonomic Interventions. Front. Physiol. 2013, 4. [Google Scholar] [CrossRef]
- Billman, G.E. The LF/HF Ratio Does Not Accurately Measure Cardiac Sympatho-Vagal Balance. Front Physiol 2013, 4, 26. [Google Scholar] [CrossRef]
- Sacha, J.; Barabach, S.; Statkiewicz-Barabach, G.; Sacha, K.; Müller, A.; Piskorski, J.; Barthel, P.; Schmidt, G. How to Strengthen or Weaken the HRV Dependence on Heart Rate — Description of the Method and Its Perspectives. International Journal of Cardiology 2013, 168, 1660–1663. [Google Scholar] [CrossRef]
- Monfredi, O.; Lyashkov, A.E.; Johnsen, A.-B.; Inada, S.; Schneider, H.; Wang, R.; Nirmalan, M.; Wisloff, U.; Maltsev, V.A.; Lakatta, E.G.; et al. Biophysical Characterization of the Underappreciated and Important Relationship Between Heart Rate Variability and Heart Rate. Hypertension 2014, 64, 1334–1343. [Google Scholar] [CrossRef]
- Sonkodi, B. LF Power of HRV Could Be the Piezo2 Activity Level in Baroreceptors with Some Piezo1 Residual Activity Contribution. IJMS 2023, 24, 7038. [Google Scholar] [CrossRef]
- Búzás, A.; Makai, A.; Groma, G.I.; Dancsházy, Z.; Szendi, I.; Kish, L.B.; Santa-Maria, A.R.; Dér, A. Hierarchical Organization of Human Physical Activity. Sci Rep 2024, 14, 5981. [Google Scholar] [CrossRef] [PubMed]
- Heart Rate Variability: Standards of Measurement, Physiological Interpretation and Clinical Use. Task Force of the European Society of Cardiology and the North American Society of Pacing and Electrophysiology. Circulation 1996, 93, 1043–1065. [Google Scholar]
- Tsuji, H.; Venditti, F.J.; Manders, E.S.; Evans, J.C.; Larson, M.G.; Feldman, C.L.; Levy, D. Determinants of Heart Rate Variability. J Am Coll Cardiol 1996, 28, 1539–1546. [Google Scholar] [CrossRef]
- Boyett, M.; Wang, Y.; D’Souza, A. CrossTalk Opposing View: Heart Rate Variability as a Measure of Cardiac Autonomic Responsiveness Is Fundamentally Flawed. The Journal of Physiology 2019, 597, 2599–2601. [Google Scholar] [CrossRef]
- Van Roon, A.M.; Snieder, H.; Lefrandt, J.D.; De Geus, E.J.C.; Riese, H. Parsimonious Correction of Heart Rate Variability for Its Dependency on Heart Rate. Hypertension 2016, 68. [Google Scholar] [CrossRef] [PubMed]
- Platisa, M.M.; Gal, V. Dependence of Heart Rate Variability on Heart Period in Disease and Aging. Physiol. Meas. 2006, 27, 989–998. [Google Scholar] [CrossRef] [PubMed]
- Buzas, A.; Horvath, T.; Der, A. A Novel Approach in Heart-Rate-Variability Analysis Based on Modified Poincaré Plots. IEEE Access 2022, 10, 36606–36615. [Google Scholar] [CrossRef]
- Gąsior, J.S.; Sacha, J.; Jeleń, P.J.; Pawłowski, M.; Werner, B.; Dąbrowski, M.J. Interaction Between Heart Rate Variability and Heart Rate in Pediatric Population. Front Physiol 2015, 6, 385. [Google Scholar] [CrossRef]
- Rudics, E.; Buzás, A.; Pálfi, A.; Szabó, Z.; Nagy, Á.; Hompoth, E.A.; Dombi, J.; Bilicki, V.; Szendi, I.; Dér, A. Quantifying Stress and Relaxation: A New Measure of Heart Rate Variability as a Reliable Biomarker. Biomedicines 2025, 13, 81. [Google Scholar] [CrossRef]
- Platisa, M.M.; Gal, V. Reflection of Heart Rate Regulation on Linear and Nonlinear Heart Rate Variability Measures. Physiol. Meas. 2006, 27, 145–154. [Google Scholar] [CrossRef]
- Platisa, M.M.; Gal, V. Correlation Properties of Heartbeat Dynamics. Eur Biophys J 2008, 37, 1247–1252. [Google Scholar] [CrossRef]
- Platisa, M.M.; Nestorovic, Z.; Damjanovic, S.; Gal, V. Linear and Non-linear Heart Rate Variability Measures in Chronic and Acute Phase of Anorexia Nervosa. Clin Physio Funct Imaging 2006, 26, 54–60. [Google Scholar] [CrossRef] [PubMed]
- Platisa, M.M.; Mazic, S.; Nestorovic, Z.; Gal, V. Complexity of Heartbeat Interval Series in Young Healthy Trained and Untrained Men. Physiol. Meas. 2008, 29, 439–450. [Google Scholar] [CrossRef]
- Georgieva-Tsaneva, G.N. INVESTIGATION OF HEART RATE VARIABILITY BY STATISTICAL METHODS AND DETRENDED FLUCTUATION ANALYSIS. CBUP 2019, 7. [Google Scholar] [CrossRef]
- Georgieva-Tsaneva, G.; Gospodinova, E.; Cheshmedzhiev, K. Examination of Cardiac Activity with ECG Monitoring Using Heart Rate Variability Methods. Diagnostics 2024, 14, 926. [Google Scholar] [CrossRef]
- Gospodinov, M.; Gospodinova, E.; Georgieva-Tsaneva, G. Mathematical Methods of ECG Data Analysis. In Healthcare Data Analytics and Management; Elsevier, 2019; pp. 177–209 ISBN 978-0-12-815368-0.
- Gospodinova, E.; Lebamovski, P.; Georgieva-Tsaneva, G.; Negreva, M. Evaluation of the Methods for Nonlinear Analysis of Heart Rate Variability. Fractal Fract 2023, 7, 388. [Google Scholar] [CrossRef]
- Gribbin, B.; Pickering, T.G.; Sleight, P.; Peto, R. Effect of Age and High Blood Pressure on Barorefiex Sensitivity in Man. Circulation Research 1971, 29, 424–431. [Google Scholar] [CrossRef] [PubMed]
- Monahan, K.D. Effect of Aging on Baroreflex Function in Humans. American Journal of Physiology-Regulatory, Integrative and Comparative Physiology 2007, 293, R3–R12. [Google Scholar] [CrossRef]
- Couderc, J.-P. A Unique Digital Electrocardiographic Repository for the Development of Quantitative Electrocardiography and Cardiac Safety: The Telemetric and Holter ECG Warehouse (THEW). Journal of Electrocardiology 2010, 43, 595–600. [Google Scholar] [CrossRef]
- Richman, J.S.; Moorman, J.R. Physiological Time-Series Analysis Using Approximate Entropy and Sample Entropy. American Journal of Physiology-Heart and Circulatory Physiology 2000, 278, H2039–H2049. [Google Scholar] [CrossRef]
- Magris, Martin Detrended Fluctuation Analysis (DFA).
- Altman, D.G.; Bland, J.M. Measurement in Medicine: The Analysis of Method Comparison Studies. The Statistician 1983, 32, 307. [Google Scholar] [CrossRef]
- Estévez-Báez, M.; Machado, C.; Montes-Brown, J.; Jas-García, J.; Leisman, G.; Schiavi, A.; Machado-García, A.; Carricarte-Naranjo, C.; Carmeli, E. Very High Frequency Oscillations of Heart Rate Variability in Healthy Humans and in Patients with Cardiovascular Autonomic Neuropathy. In Progress in Medical Research; Pokorski, M., Ed.; Advances in Experimental Medicine and Biology; Springer International Publishing: Cham, 2018; ISBN 978-3-319-89664-9. [Google Scholar]
- Esler, M.D.; Thompson, J.M.; Kaye, D.M.; Turner, A.G.; Jennings, G.L.; Cox, H.S.; Lambert, G.W.; Seals, D.R. Effects of Aging on the Responsiveness of the Human Cardiac Sympathetic Nerves to Stressors. Circulation 1995, 91, 351–358. [Google Scholar] [CrossRef] [PubMed]
- Kaplan, W. Advanced Calculus; 4. ed., 5. reprint. with corr.; Addison-Wesley: Reading, Mass, 1994; ISBN 978-0-201-57888-1. [Google Scholar]
- Castiglioni, P.; Lazzeroni, D.; Coruzzi, P.; Faini, A. Multifractal-Multiscale Analysis of Cardiovascular Signals: A DFA-Based Characterization of Blood Pressure and Heart-Rate Complexity by Gender. Complexity 2018, 2018, 4801924. [Google Scholar] [CrossRef]
- Jose, A.D.; Collison, D. The Normal Range and Determinants of the Intrinsic Heart Rate in Man. Cardiovascular Research 1970, 4, 160–167. [Google Scholar] [CrossRef] [PubMed]
- Singh, V.; Gupta, A.; Sohal, J.S.; Singh, A. A Unified Non-Linear Approach Based on Recurrence Quantification Analysis and Approximate Entropy: Application to the Classification of Heart Rate Variability of Age-Stratified Subjects. Med Biol Eng Comput 2019, 57, 741–755. [Google Scholar] [CrossRef]
Figure 1.
(a) Poincaré plot of a typical RR time series. (b) The same in Bland–Altman-like representation. (c) ∆RR (≡dRR) as a function of heart rate (HR), as calculated from the data in (b). The color code shows the frequency of the data. (d) The RMSSD versus HR curve (MC), determined from data in (c), as the RMS of the distribution of ΔRR values at each HR. The red lines stand for illustration of the way of calculation at an ad hoc HR value. (Reproduced from Buzás et al. [27].)
Figure 2.
Master Curve plots of a typical individual. a) Bland-Altman plot of of RR data, as a function of HR. b) Master Curve (ln(RMSSD versus HR), c) ln(RMSSD calculated by the conventional method (blue dots) and MC (black line), d) Age-cohort-averaged Master Curves, showing an overall decrease of HRV level as age progresses. The different cohorts are distinguished by colors, while their start and end ages in years are indicated aside the symbols.
Figure 3.
a) Colour-coded averaged Fourier-map of the dRR data of all the 202 healthy individuals. (The data are normalized at each HR.) The white horizontal lines indicate the boarder-frequencies dividing the different bands (VLF, LF, HF and VHF). b) Frequency spectra taken at different HRs: 50bpm (red), 100bpm (blue) and 150bpm (yellow).
Figure 4.
Age-cohort averaged dRR Fourier-maps, showing the shift part of the VHF “cloud” to lower HRs.
Figure 4.
Age-cohort averaged dRR Fourier-maps, showing the shift part of the VHF “cloud” to lower HRs.
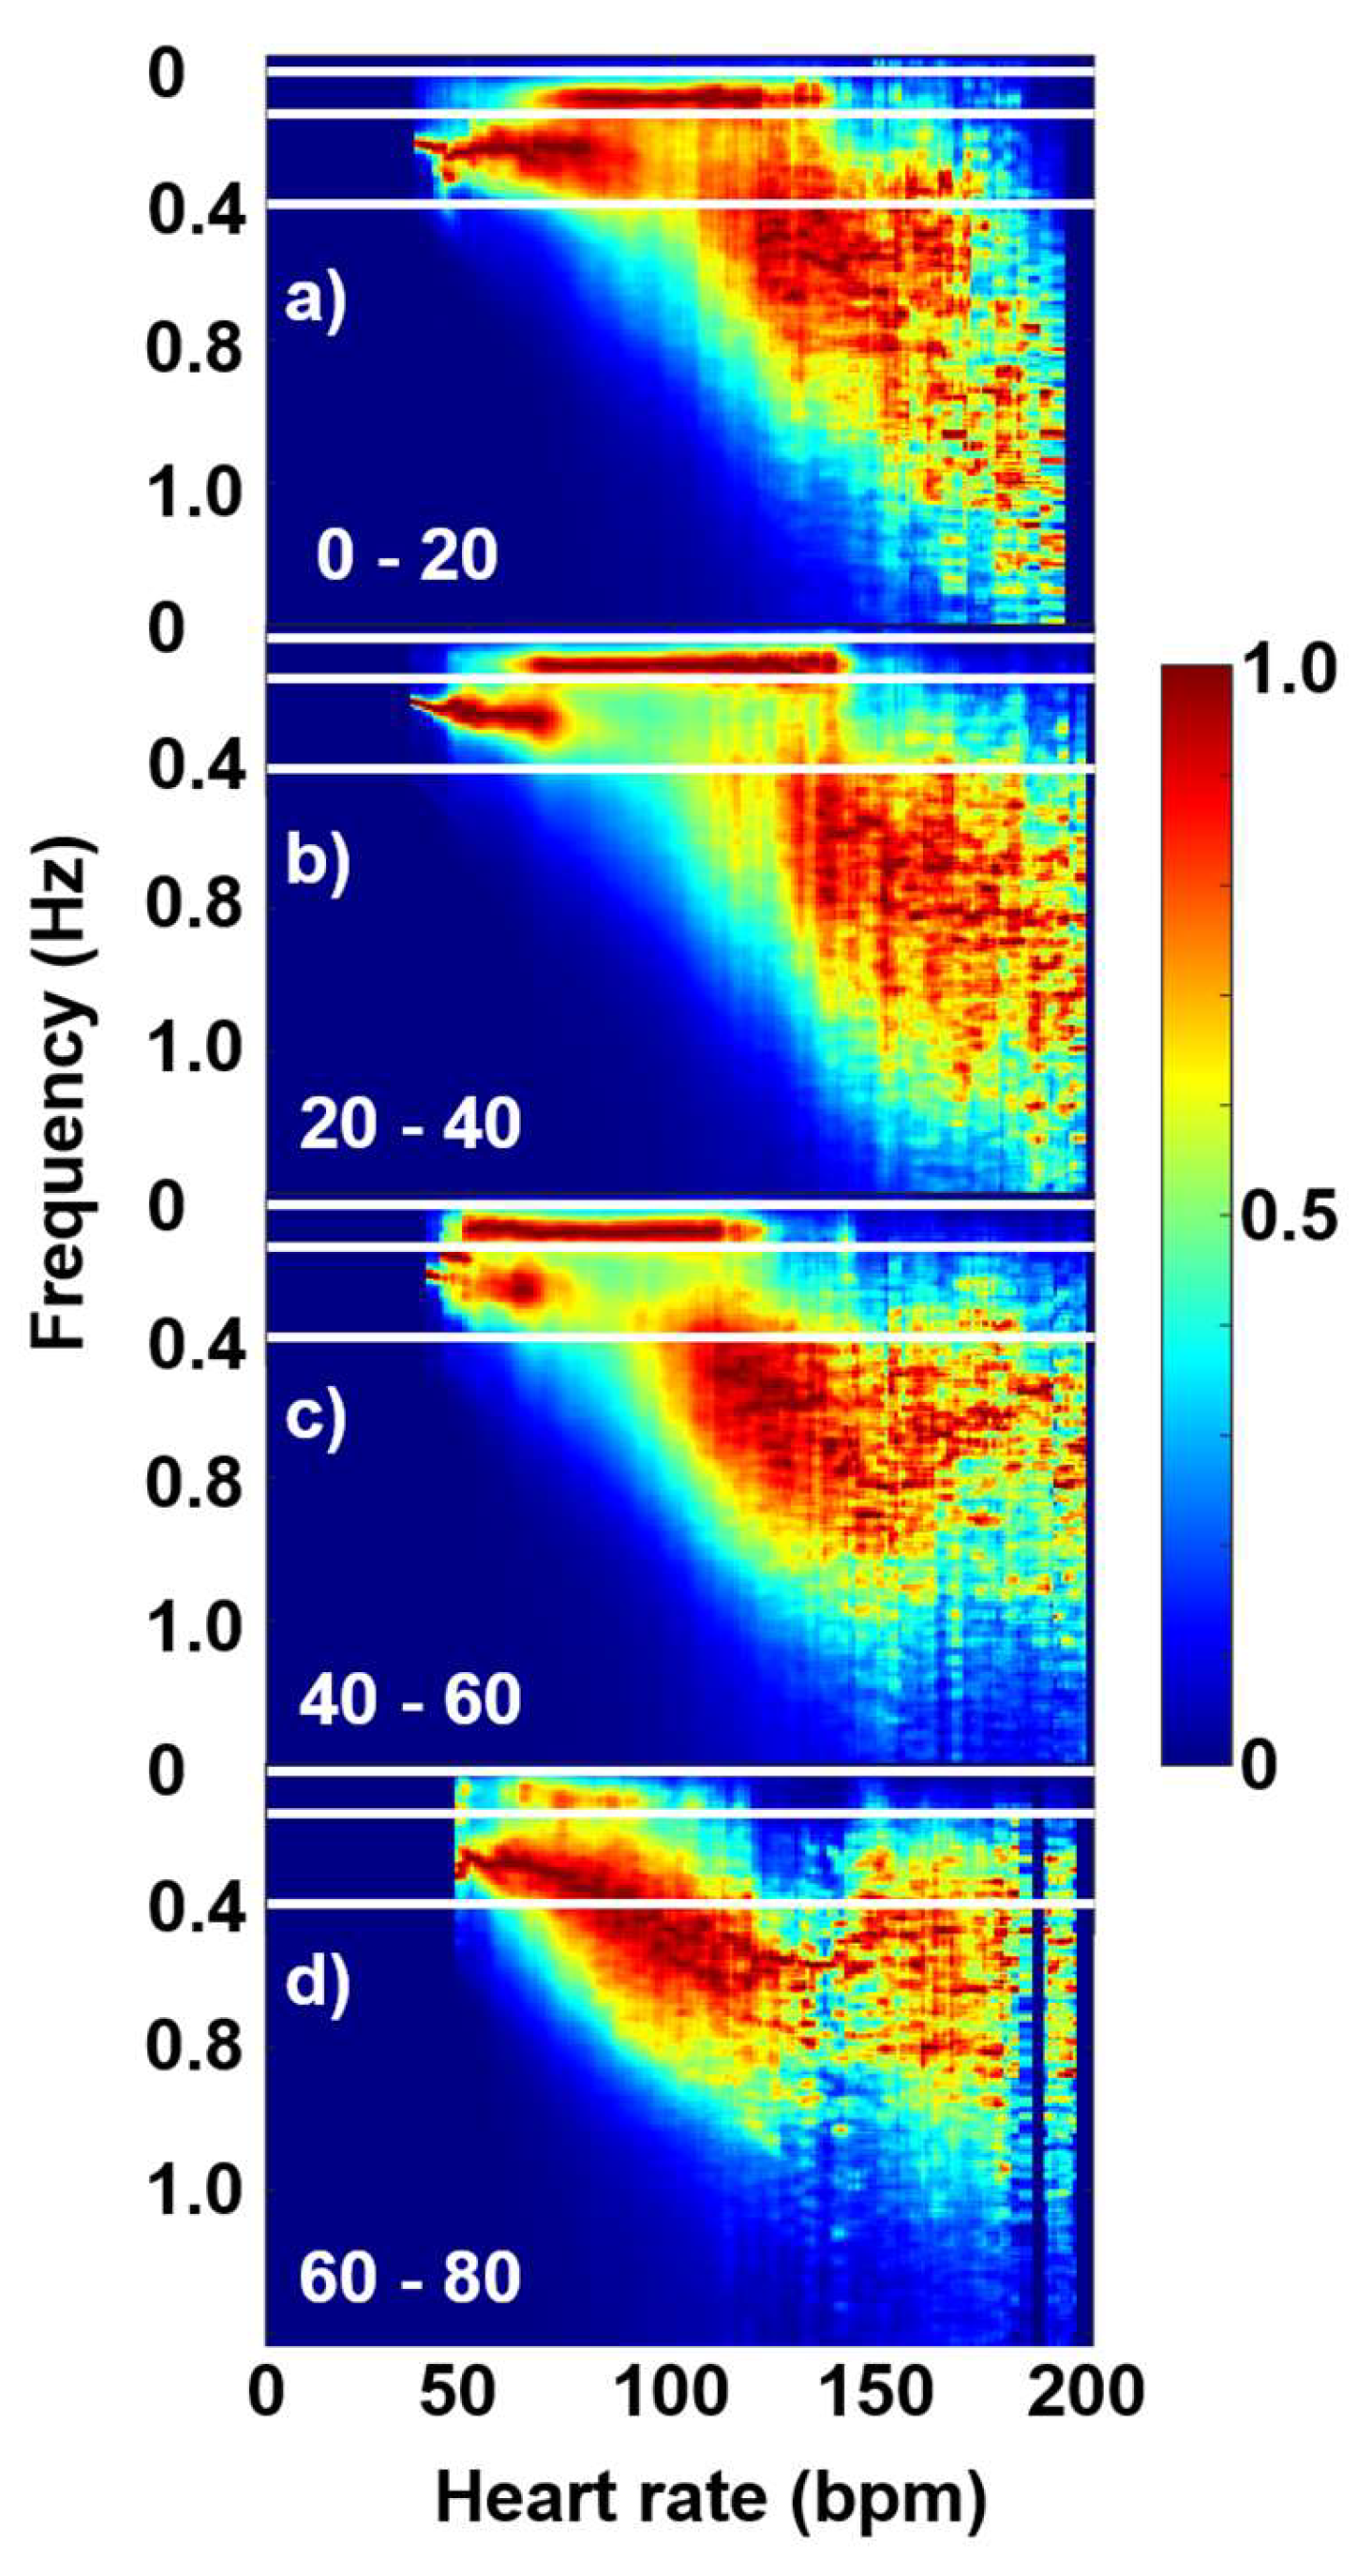
Figure 5.
a) dRR Fourier-map, and b) RR Fourier map of the selected, typical individual. c) Power-spectrum coefficients of the different dRR Fourier-spectral components (VLF (magenta), LF (red), HF (blue) and VHF (green), and their superposition (black), with the almost perfectly overlapping MC (dashed black), as a function of HR. d) Power-spectrum coefficients of the different RR Fourier-spectral components (VLF (magenta), LF (red), HF (blue) and VHF (green), and their superposition (black), with the overlapping scatter plot of the SDNN(HR) values obtained from the conventional (shifting time-window) evaluation (cyan points), as a function of HR.
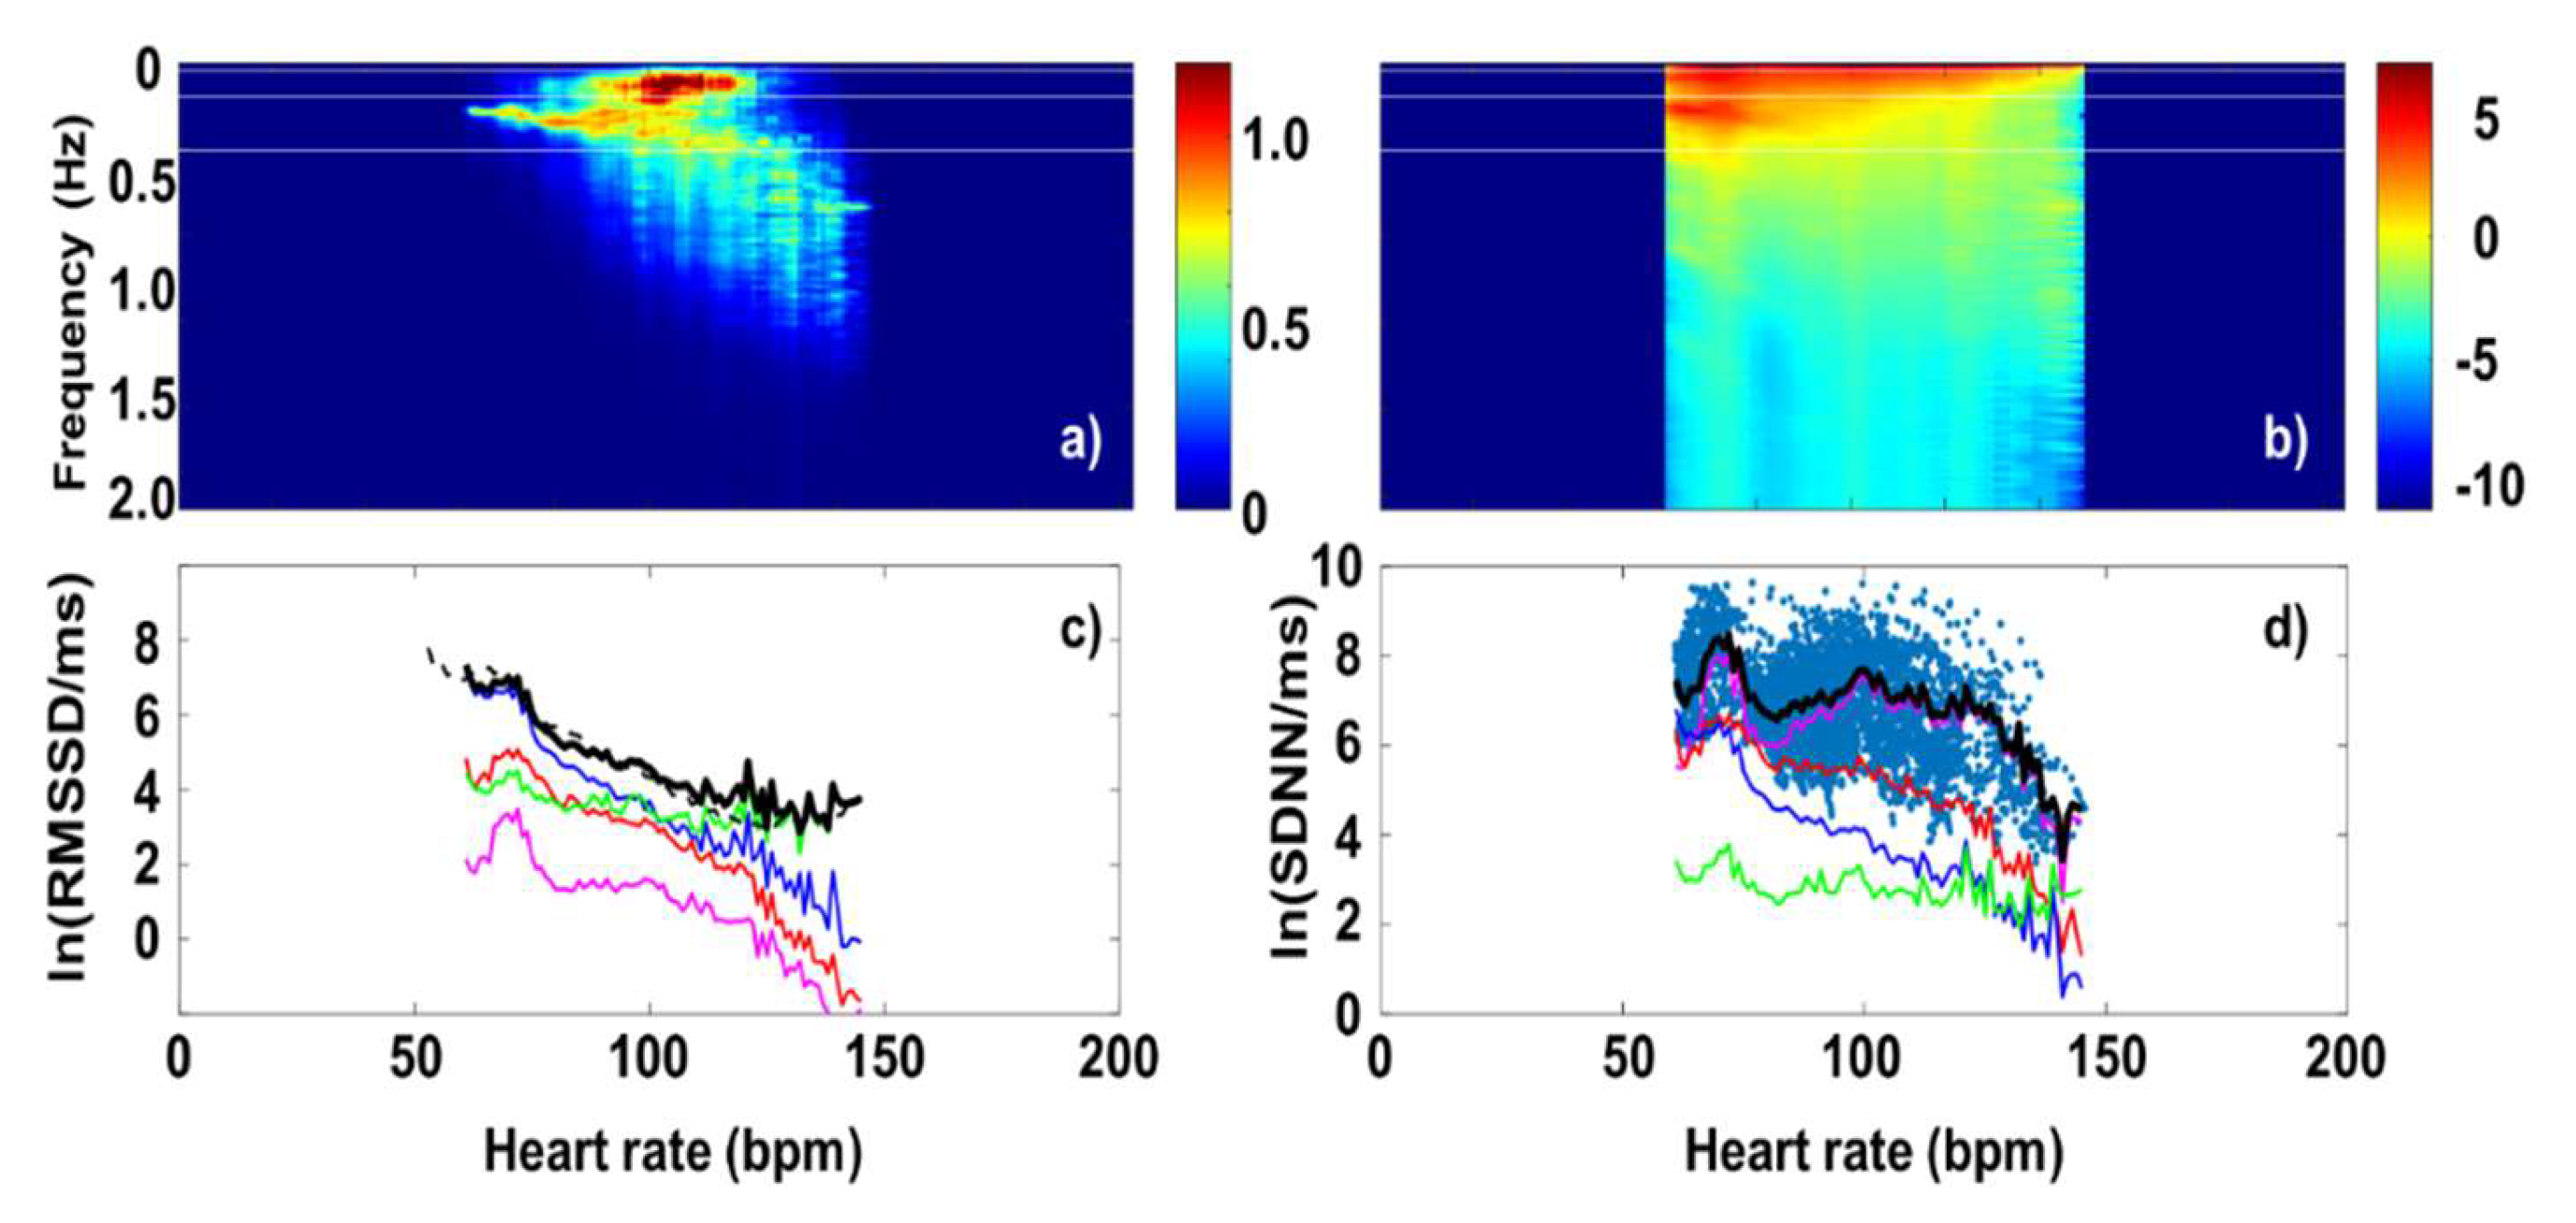
Figure 6.
a) SampEn values calculated from RR data in a 120s-wide sliding window analysis, b) DFA exponents (α1) from a sliding-window analysis. c), d) and e) Frequency spectra associated to 65bpm, 85bpm, 110bpm and 130bpm, respectively.
Figure 6.
a) SampEn values calculated from RR data in a 120s-wide sliding window analysis, b) DFA exponents (α1) from a sliding-window analysis. c), d) and e) Frequency spectra associated to 65bpm, 85bpm, 110bpm and 130bpm, respectively.
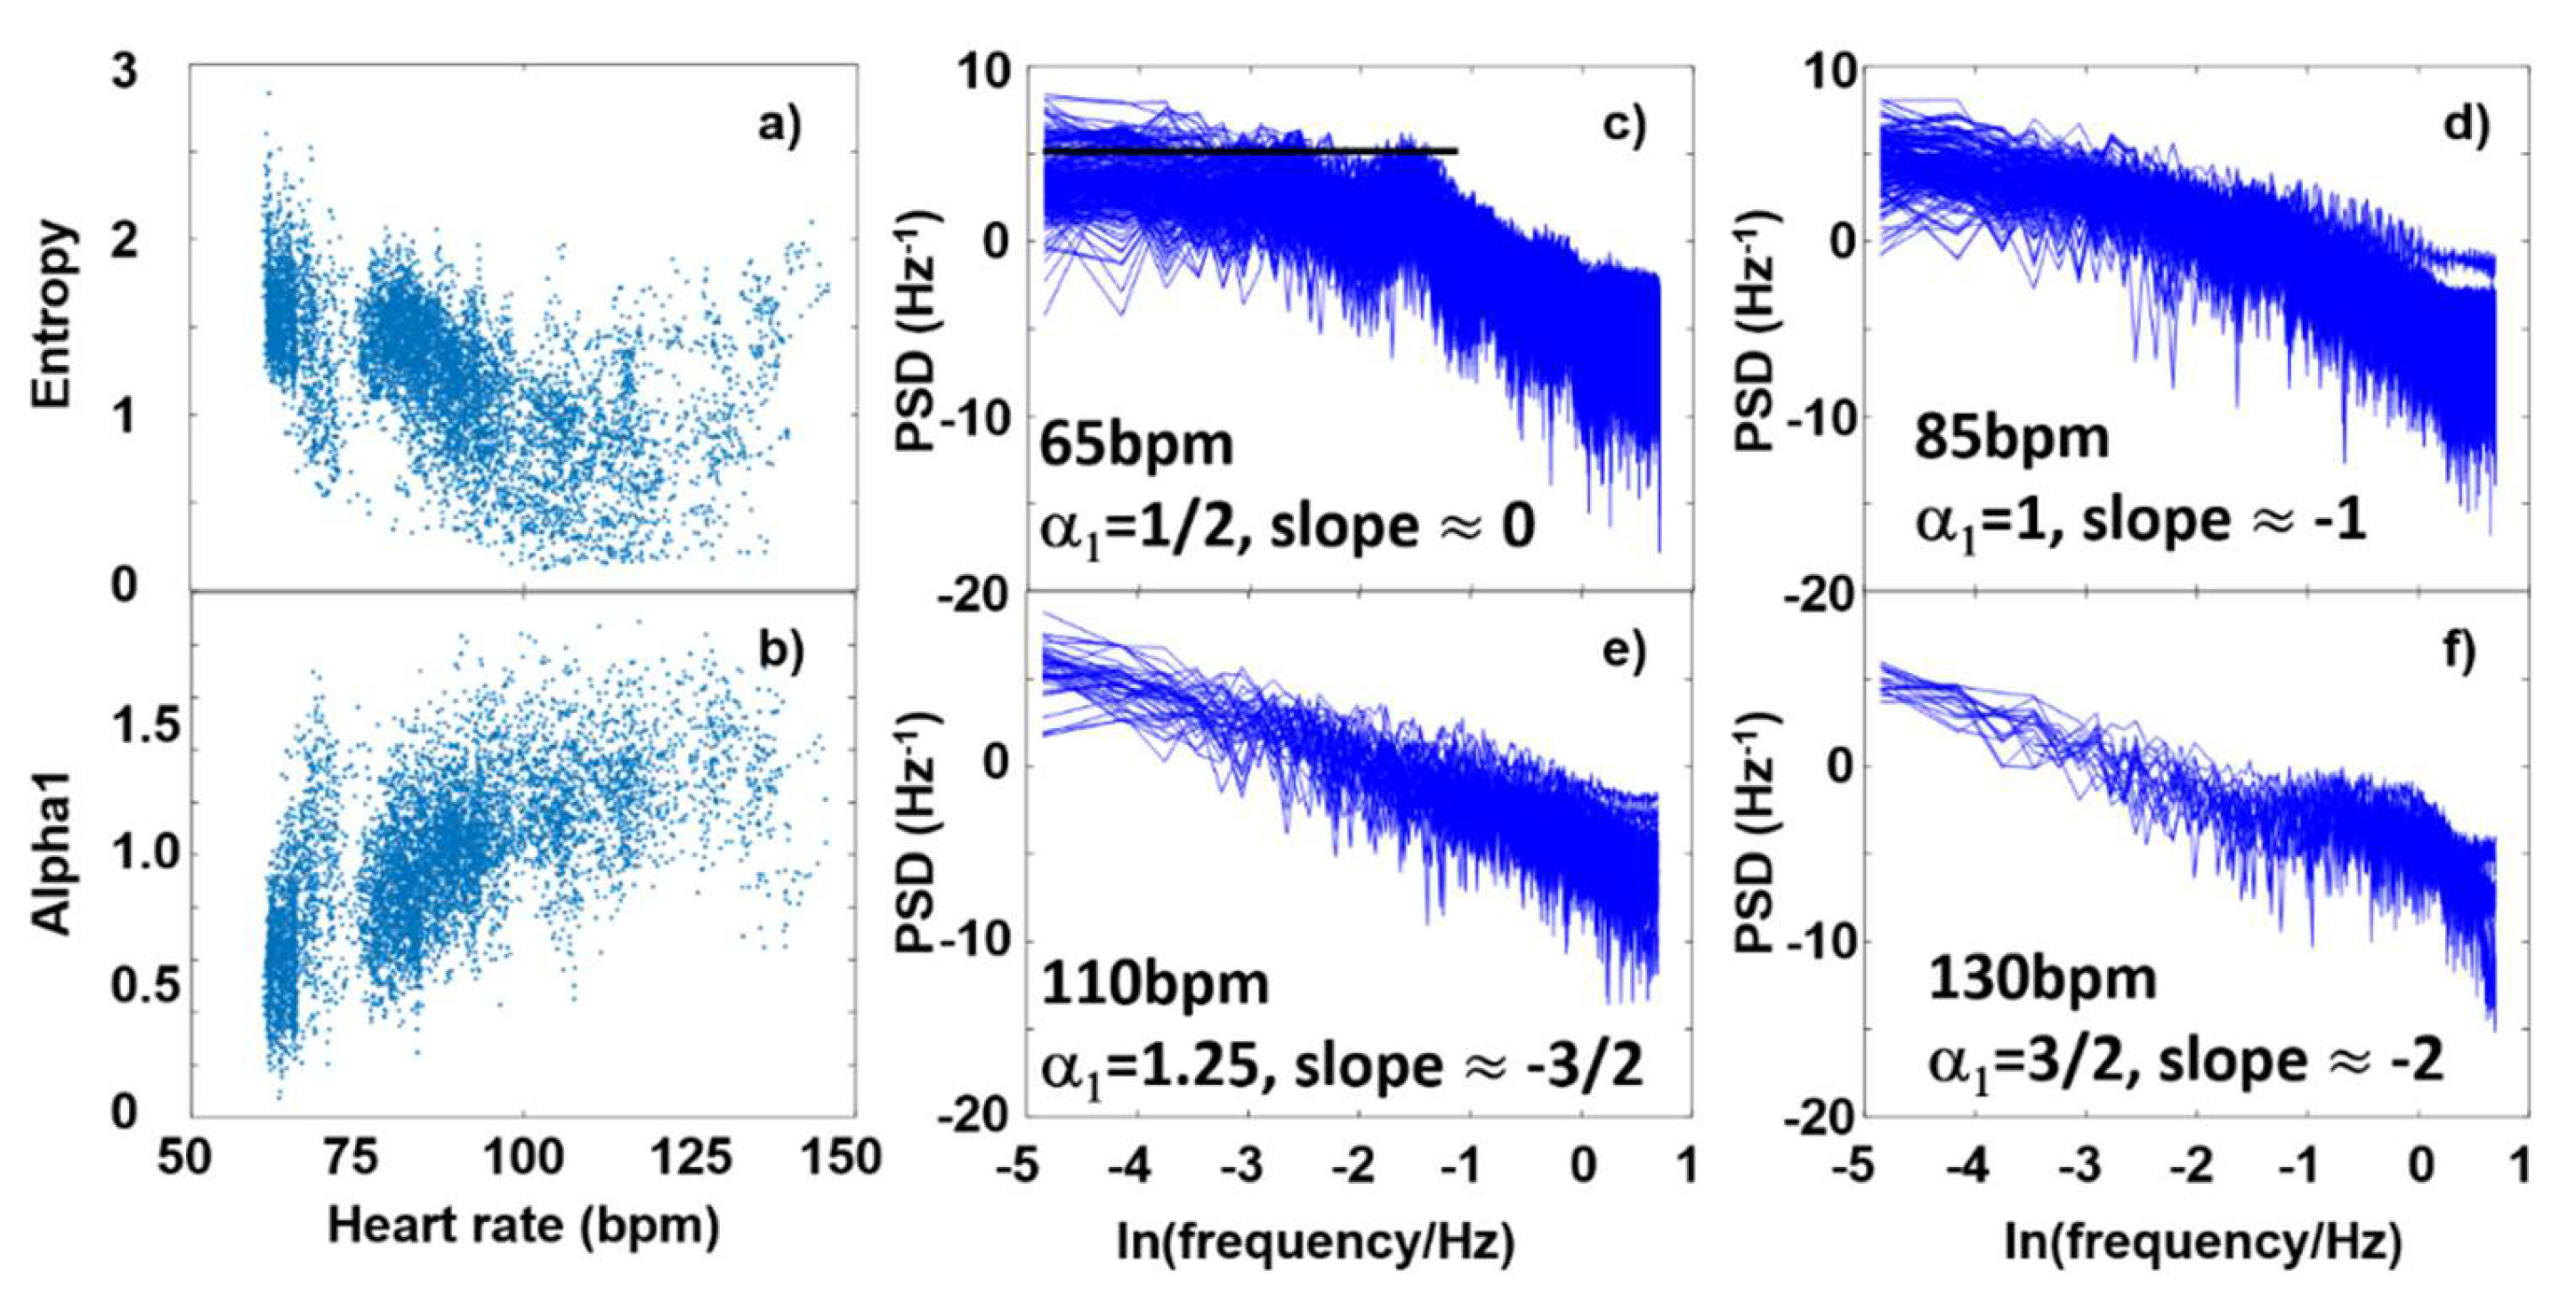
Figure 7.
a) Age-cohort-averaged entropy values and b) DFA exponents, as a function of HR.
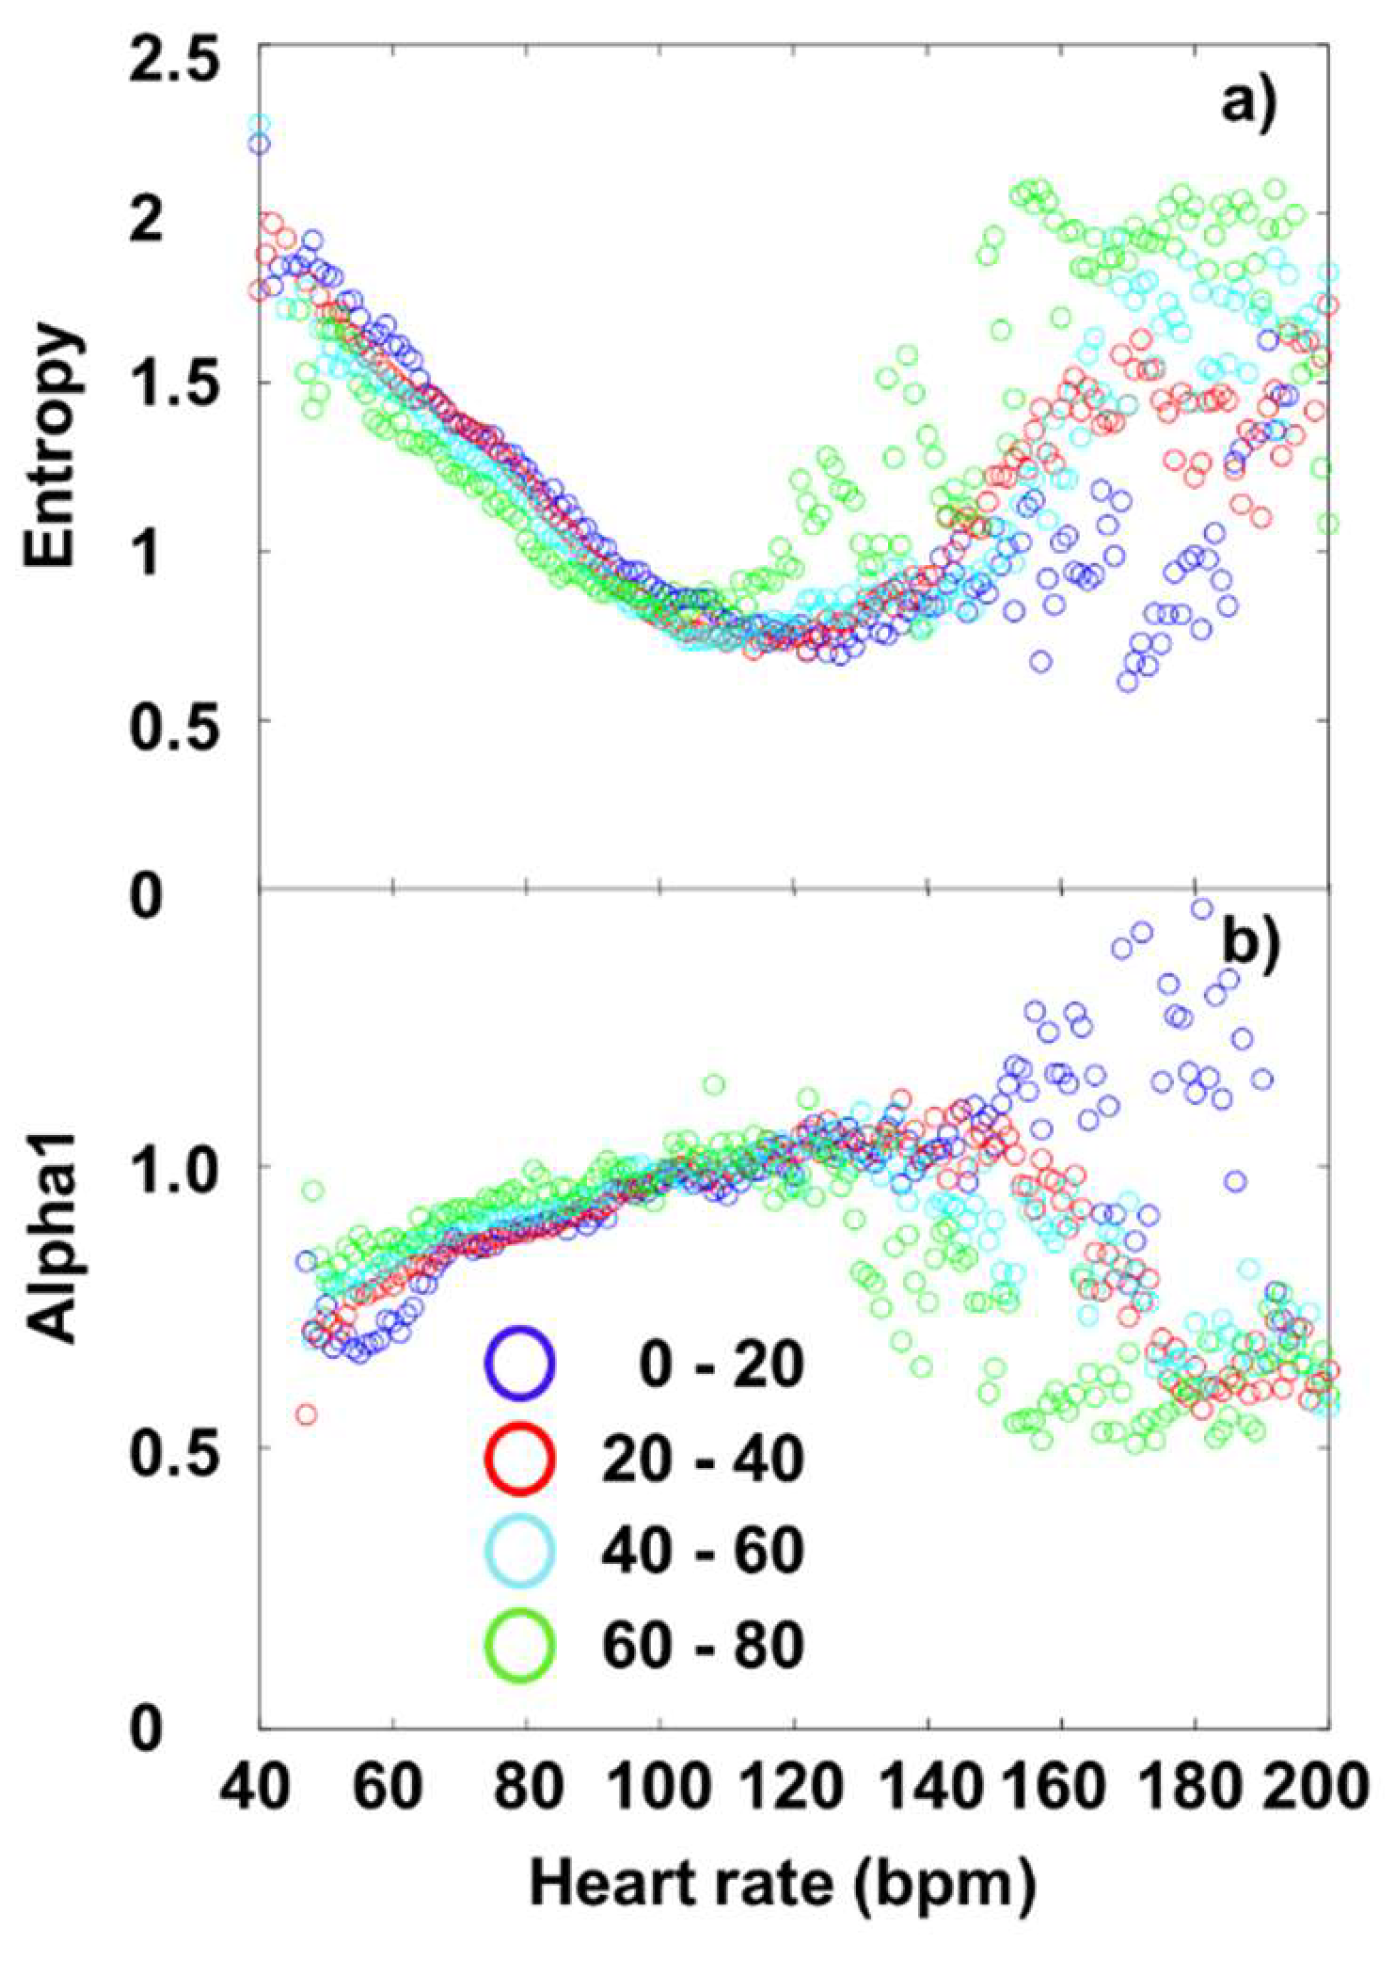

Table 1.
List of the main parameters used in this study.
| Parameter | Definition | Mathematical formula |
| RMSSD | Measures short-term HRV based on the square root of the mean of the N−1 squared differences between adjacent RR intervals. Reflects parasympathetic activity. | |
| SDNN | Standard deviation of all RR intervals. Reflects overall HRV (both sympathetic and parasympathetic). | |
| VLF (Very Low Frequency) | Power in the very low frequency range (0.0033-0.04 Hz). Linked to thermoregulation, hormones, and other slow-acting regulatory mechanisms. |
F Fourier transform of RR time series |
| LF (Low Frequency) | Power in the low frequency range (0.04–0.15 Hz). Reflects both sympathetic and parasympathetic activity. | |
| HF (High Frequency) | Power in the high frequency range (0.15–0.40 Hz). Mainly reflects parasympathetic (vagal) activity, associated with respiration. | |
| VHF (Very High Frequency) | Power in the very high frequency range (>0.4 Hz). May reflect noise or specific physiological phenomena. | |
| Entropy (SampEn, ApEn) | Measures the complexity or unpredictability of RR interval time series. Higher entropy = more complex signal. [41] | SampEn(m, r, N) = ln(A/B) N number of vector pairs in our case |
| DFA (Detrended Fluctuation Analysis) | Detects fractal scaling properties in HRV, capturing long-range correlations. Useful in non-stationary data. [42] | is scaling exponent(s=10, 20, …, 100) |
Disclaimer/Publisher’s Note: The statements, opinions and data contained in all publications are solely those of the individual author(s) and contributor(s) and not of MDPI and/or the editor(s). MDPI and/or the editor(s) disclaim responsibility for any injury to people or property resulting from any ideas, methods, instructions or products referred to in the content. |
© 2025 by the authors. Licensee MDPI, Basel, Switzerland. This article is an open access article distributed under the terms and conditions of the Creative Commons Attribution (CC BY) license (http://creativecommons.org/licenses/by/4.0/).
Copyright: This open access article is published under a Creative Commons CC BY 4.0 license, which permit the free download, distribution, and reuse, provided that the author and preprint are cited in any reuse.


