Submitted:
08 May 2025
Posted:
08 May 2025
You are already at the latest version
Abstract
Advanced ovarian cancer cell clusters, aggregates and spheroids are the primary source of cancer cells responsible for the metastatic spread that characterises advanced ovarian cancer. It is widely believed that the initial step in this metastatic process is the ability of ovarian cancer cells to adhere to the peritoneal surface, which is composed of a thin layer of mesothelial cells overlaying the basement membrane. Understanding the cellular events underlying this adhesion process could provide a means to prevent the widespread dissemination of ovarian cancer cells. This study aimed to investigate the role of the EGFR/HER-2/c-MET axis in the adhesion of ovarian cancer cell clusters and aggregates. Our results suggest that the adhesion of OVCAR-5 and SKOV-3 cell clusters/aggregates to ECM is growth factor-dependent and can be inhibited by the dual EGFR/HER inhibitor canertinib and the c-MET inhibitor PHA-665752. The combination of these inhibitors impaired cell adhesion, likely through disruption of the interaction between EGFR/HER-2/cMET and β4 integrins. These findings highlight the pivotal role of β4 integrins in the adhesion process of ovarian cancer cells and suggest that targeting this interaction may represent a potential therapeutic strategy to limit metastasis in advanced ovarian cancer.
Keywords:
ovarian cancer
; EGFR
; HER-2
; canertinib
; PHA665752
; β4 integrin
; cell adhesion
1. Introduction
Progression of metastatic ovarian cancer mainly occurs within the peritoneal cavity, where malignant cells can exfoliate from the surface of the growing tumour at a primary site with the movement of peritoneal fluid [1,2]. Malignant ovarian cancer cells often form small clusters and aggregates that facilitate metastatic growth. These cell clusters pose significant clinical challenges because they are less likely to respond to treatment. As a result, they can survive, giving rise to drug-resistant clones that thrive within the peritoneal cavity. These clones become the primary source of metastatic growth, as they adhere to the surface of the peritoneal walls. The first step in the successful establishment of secondary tumours is the adhesion of ovarian cancer cell clusters and aggregates to the peritoneal membrane, which consists of a single layer of mesothelial cells covering internal organs [3,4]. This initial interaction between cancer cells and the mesothelial lining is critical and believed to be essential for the successful implantation of cancer cells.
Several mechanisms have been proposed to describe the adherence of ovarian cancer cells to the extracellular matrix (ECM) of the mesothelial cell lining. These mechanisms include cancer cell-mediated CD44 binding to a hyaluronan on the surface of mesothelial cells, cancer cell-mediated apoptotic-cell death of the mesothelial cells via the TNF-alpha mediated pathway, and the retraction of the mesothelial cell lining by components in the ascitic fluid [5,6,7]. All of these mechanisms would cause ECM to become exposure beneath the mesothelial cell lining, leading to the cancer cells’ initial binding to collagens [8,9]. Ovarian cancer cells express many integrin subunits that specially bind to laminins, and to collagens I and IV; the primary ECM is present underneath the mesothelial lining [10,11,12,13]. Integrins are the plasma membrane proteins with extracellular and intracellular domains and are heterodimeric structures composed of alpha and beta subunits with the beta subunits regulating the functions of integrins [14,15]. Upon ECM binding, the beta subunits can convert mechanical contacts into cellular signalling information via the activation of numerous signalling proteins responsible for tumour progression [16]. Among the integrin subunits, the β4 subunit is known to be involved in the tumorigenic steps of cancers [17,18]. However, the role of the β4 subunit in the early adhesion of ovarian cancer cell clusters remains relatively unknown. The β4 subunit is a well-known protein that partners with integrins and receptor tyrosine kinases, such as EGFR, HER-2, and c-Met [19,20]. Collectively, inhibiting the synergistic interaction between integrins and receptor tyrosine kinases could provide a novel approach to preventing the initial adhesion of cancer cells to the peritoneal wall, potentially reducing the progression of advanced ovarian cancer.
Ovarian cancer cells and tissue express varying levels of EGFR, HER-2, and c-MET, and the overexpression of these receptors has been associated with poor patient prognosis [21,22,23,24,25]. Although inhibitors targeting these receptors, either as monotherapies, or in combination, have been evaluated in both preclinical and clinical settings, the outcomes have been inconsistent [21,26,27]. It is important to note that targeting these pathways in the late stages of ovarian cancer, where extensive tumour dissemination has already occurred, may not be scientifically rational or clinically effective [28]. However, intervening at earlier stages, specifically by blocking the adhesion of disseminated ovarian cancer cells to the peritoneal cavity, could represent a more effective strategy to control tumour progression.
Thus, we hypothesise that the adhesion of ovarian cancer cell clusters to the ECM is dependent on the co-activation of EGFR, HER-2, and c-MET in conjunction with the β4 subunit. Therefore, the use of specific inhibitors to block these receptor tyrosine kinases could disrupt ovarian cancer cells via the β4 subunit adhesion-dependent to the ECM.
2. Results
2.1. Effects of EGF and HGF on Cell Adhesion to ECM
The adhesion of OVCAR-5 clusters and SKOV-3 aggregates was growth factor concentration-dependent. In OVCAR-5 clusters, only a super-physiological concentration at 20 ng/mL EGF significantly increased (p<0.05) cell adhesion (Figure 1A) but not at a physiological concentration of 0.2 ng/mL. On the other hand, in SKOV-3 cell aggregates, the physiological concentration of 0.2 ng/mL EGF significantly increased cell adhesion (p<0.05) which was more pronounced at 20 ng/mL (p<0.0001). The trend of cell adhesion affected by HGF, a c-MET ligand, was also observed in both cell lines. Again, the super-physiological level of HGF significantly increased cell adhesion in both cell lines (Figure 1C, p<0.01 and 1D, p< 0.0001). However, only SKOV-3 cells (Figure 1D, p<0.01) were also affected by the physiological concentration of HGF.
2.2. Effects of Canertinib and PHA665752 on Cell Numbers and Metabolism Before Adhesion
Prior to performing the cell adhesion experiment, we determined the effect of either a single treatment of the inhibitors or a combination on cell numbers and cell metabolism in the presence of mixed growth factors (GF) of OVCAR-5 clusters and SKOV-3 aggregates. After four hr incubating with various concentrations of canertinib and its combination with 1 µM PHA665752, cell numbers in OVCAR-5 clusters did not change (Supplement 1 A&B), and cellular metabolism did not alter (Supplement 1 C&D). Similar results were also observed in aggregates of the SKOV-3 cell line (Supplement 1 E, F, G & H). There was also a small but significant reduction of cell numbers in the drug combination-treated SKOV-3 cell aggregates (Supplement 1E, p<0.05). Various concentrations of PHA665752 were also tested and combined with 3 µM canertinib (Supplement 2). There was no significant reduction of cell numbers and metabolism in OVCAR-5 clusters and SKOV-3 aggregates. Only the combination of canertinib and PHA665752 marginally affected the reduction of the SKOV-3 cell number (Supplement 2E, p<0.01). These data were essential because they validated the cell number of OVCAR-5 and SKOV-3 cells, which was not affected by the drugs before the beginning of the adhesion process. Therefore, any effects of the inhibitors on the number of cells adhering in subsequent assays are due to them affecting the adhesion mechanisms and not through them reducing cell numbers.
2.3. Effects of Canertinib Alone with the Mixed GF on Cell Adhesion to ECM
Next, the effect of the presence of canertinib alone on cell adhesion in both OVCAR-5 clusters and SKOV-3 aggregates in the presence of GF was evaluated. A reduction of cell adhesion in OVCAR-5 (Figure 2A, C) and SKOV-3 (Figure 2B, D) was concentration-dependent. At the physiological concentration of 0.2 ng/mL GF, the adhesion of OVCAR-5 clusters (Figure 2A) was markedly reduced by canertinib at 2 (p<0.01), 3 (p<0.0001) and 4µM (p<0.0001). In SKOV-3 cell aggregates (Figure 2B) adhesion was only affected at concentrations of 3 (p<0.001) and 4 µM (p<0.0001) respectively. At the super-physiological concentration of 20 ng/mL GF, all concentrations of canertinib, 1 (p<0.001), 2 (p<0.0001), 3 (p<0.0001) and 4 µM (p<0.0001) effectively reduced cell adhesion of OVCAR-5 clusters (Figure 2C). In SKOV-3 cell aggregates, all concentrations of canertinib, except 1 µM, significantly reduced cell adhesion (Figure 2D). These results suggest that EGFR and HER-2 mediates cell adhesion to collagen in the ECM in ovarian cancer cell clusters and aggregates.
2.4. Effects of PHA665752 Alone on Cell Adhesion to ECM
At a physiological concentration of GF as demonstrated in Figure 3A, clusters of OVCAR-5 cells adhesion were reduced by PHA665752 at 1 (p<0.001) and 2 µM (p<0.0001). However,) cell adhesion of SKOV-3 cell aggregates was only reduced at the higher concentration (Figure 3B) (p<0.01. More prominence of reduction of the cell adhesion was observed when cells were present in super-physiological concentrations of GF. All concentrations of PHA665752 effectively reduced cell adhesion in both OVCAR-5 (Figure 3C) and SKOV-3 lines (Figure 3D). These findings are consistent with cell clusters and aggregates adhere via mechanisms that are mediated via c-MET.
2.5. Effects of Combined Canertinib and PHA665752 on Cell Adhesion to ECM
The combination of canertinib and PHA665752 might potentially reduce cell adhesion more than a single drug alone, and that may provide a viable platform for combinatorial therapy in advanced ovarian cancer. At a physiological concentration of GF, clusters of OVCAR-5 cells, the combination of 3µM canertinib with 1µM PHA665752 reduced cell adhesion more than the 4µM canertinib treatment alone (Figure 4A). In aggregates of SKOV-3 cells, the combination significantly (p<0.001) reduced cell adhesion compared to 2µM PHA665752 alone (Figure 4B). A similar reduction of cell adhesion in a super-physiological concentration of GF was observed in both OVCAR-5 and SKOV-3 (Figure 4C and 4D). These data highlight the possible importance of a drug combination targeting EGFR/HER-2 and c-MET that can compromise cancer cell adhesion that underlies early metastatic events in advanced ovarian cancer.
2.6. Effects of Integrin Antagonistic Peptide RGDS with a Combination of Canertinib and PHA665752 on Cell Adhesion
The process of cell adhesion begins when integrin proteins make physical contact with the ECM. This initial interaction is crucial as it determines whether the cell will adhere to the appropriate component(s) of the ECM at a specific site, thus supporting cell survival and progression. Therefore, it is important to investigate whether disrupting the integrin-binding capacity to collagen in the ECM reduces cell adhesion in our experimental setting. To address this, we assessed the impact of adding exogenous RGDS peptides - critical amino acid sequences recognised by the various β subunit of integrins, aside from the β4 subunit. We also hypothesised that combining these exogenous peptides with two inhibitors would further reduce cell adhesion through the RGDS sequences, mediated by β integrin subunits.
As shown in Figure 5, both concentrations (20µM and 40µM of exogenous RGDS (20DS and 40DS)) alone significantly reduced cell adhesion in both clusters of OVCAR-5 (Figure 5A and B, p<0.0001) and aggregates of SKOV-3 (Figure 5C and D, p<0.0001). On the other hand, the control (DMSO), 20µM and 40µM (20Ace and 40Ace) acetate buffer, and exogenous 20µM and 40µM (20ES and 40ES) RGES peptide had no significant effect on cell adhesion. Interestingly, the combination of canertinib and PHA665752 (combo) alone reduced cell adhesion more significantly than the exogenous RGDS peptide. However, the combination of the RGDS peptide with the drugs did not significantly reduce the cell adhesion compared to a single treatment in both cell lines. These results suggest that the β integrin subunit-RGDS bound ligand may not be essential in the adhesion process of OVCAR-5 clusters and SKOV-3 aggregates.
2.7. Effects of a Combination of Canertinib and PHA665752 on the β4 Integrin Subunit
The above results suggest that the non-RGDS mediated β integrin subunit could be participating in cell adhesion and is affected by the inhibition of EGFR/HER-2 and c-MET. Therefore, we focused on the β4 integrin subunit that could interact with ECM via laminin-5 and be involved in tumour cell progression, anchorage-survival processes and metastasis [29]. As shown in Figure 6, immunofluorescence of the β4 integrin subunit locates to the basal domains of the OVCAR-5 clusters. The β4 integrin in SKOV-3 cells in large aggregates is prominent at the rim of the aggregates. The aggregation of the β4 integrin was also visible throughout the inner regions of canertinib and PHA665752 treated cell lines.
2.8. Effects of the Drug Combination on EGFR, HER-2, c-MET and β4 Integrin
We previously reported that inhibitors of EGFR, HER-2 and c-MET significantly compromised growth [27,30]. In this study, we showed that after the cells were pre-treated with the inhibitors for four hr prior to performing the adhesion assay, there were various changes in the expression of proteins. In the OVCAR-5 cell line, there was a significant reduction of pEGFR, pMET, and c-MET levels in 0.2 ng/mL GF plus inhibitor treated cells (Figure 7A, C, D). In 20 ng/mL GF-treated cells, pEGFR, pMET and c-MET were also reduced significantly (Figure 7F, H, I) after inhibitor treatment. However, the level of β4 (Figure 7E, J) integrins was not significantly reduced in all treatment conditions.
In the SKOV-3 cell line stimulated with 0.2 and 20 ng/mL GF, there was a significant reduction of pEGFR (Figure 8A&H), EGFR (Figure 8B&I), pHER-2 (Figure 8C&J), HER-2 (Figure 8D&K), pMET (Figure 8E&L) and c-Met Figure 8F&M). However, the level of β4 integrin was not significantly reduced as detected with immunoblotting (Figure 8G&N).
2.9. Effects of the Drug Combination on Co-Localisation EGFR, HER-2 and β4 Integrin Subunit
The above results showed that the total level of EGFR and HER-2 and phosphorylation is significantly reduced with either single or combination treatment with inhibitors, resulting in a loss of cell adhesion. However, the level of the β4 integrin subunit remained unchanged. It was plausible that the inhibition of EGFR and HER-2 could compromise the physical interaction with the β4 integrin subunit, while the protein level of the integrin was not affected by the inhibitors, suggesting physical interaction of the β4 integrin subunit with EGFR and HER-2 might be essential for cellular adhesion process. We, therefore, investigated the co-localisation of the β4 integrin subunit with EGFR and HER-2 proteins to test this hypothesis.
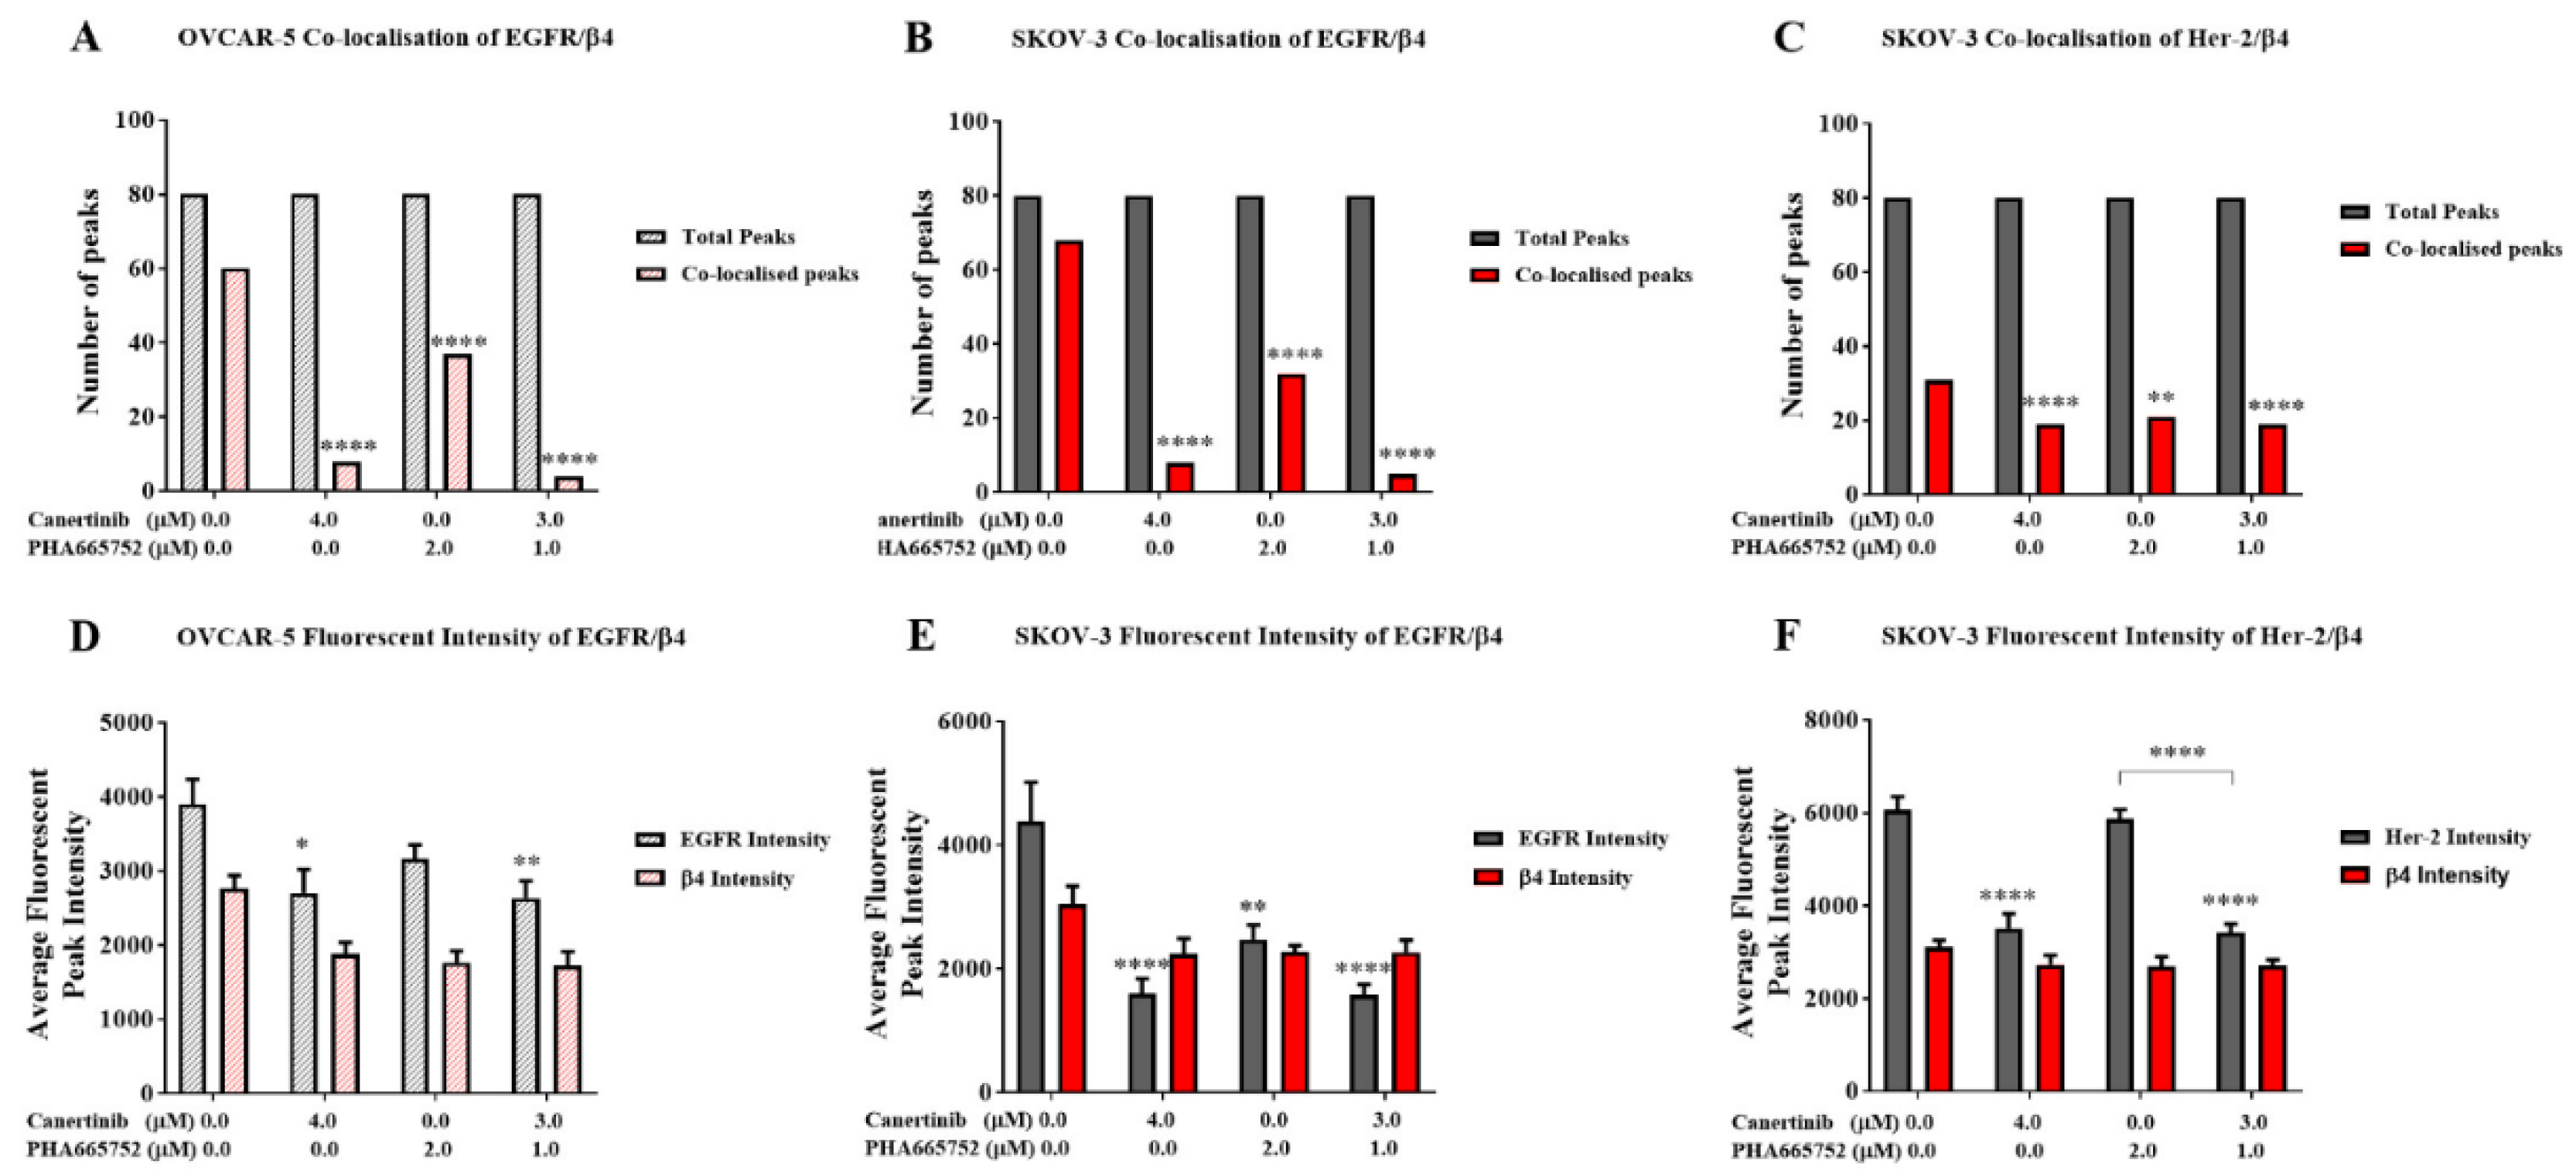
We analysed immunofluorescent cells with co-staining of EGFR and HER-2 with the β4 integrin subunit, documented fluorescent signal intensity, and counted protein co-localisation. Supplemental Figure 3 shows prominent immunofluorescent staining of EGFR and the β4 integrin in clusters of the OVCAR-5 cell line. Supplemental Figure 4 and 5 demonstrate the co-localisation of immunostaining EGFR, HER-2, with the β4 integrin subunit of aggregates of the SKOV-3 cells. There was a significant reduction in EGFR and β4 integrin subunit co-localisation in clusters of OVCAR-5 (Figure 9A, p<0.0001) with both single and combination inhibitor treatments. Similarly, single and combination treatments significantly reduced the co-localisation of EGFR with β4 integrin (Figure 9B, p<0.0001) and HER-2 with β4 integrin (Figure 9C, p<0.0001) in SKOV-3 cell aggregates. In addition, the intensity profiles of immunofluorescence of EGFR in canertinib alone and in combination in OVCAR-5 (Figure 9D) and single treatment canertinib and PHA665752 in combination with SKOV-3 (Figure 9E) was significantly reduced. The immunofluorescence of HER-2 was significantly reduced in SKOV-3 (Figure 9F) with canertinib alone and in combination treatment. The intensity profile of the β4 integrin subunit in OVCAR-5 and SKOV-3 did not significantly reduce in treatment relative to the control as it also confirmed in the immunoblotting of the integrin in Figure 8)
3. Discussion
Advanced ovarian cancer often spreads via the peritoneum, leading to the establishment of multiple secondary tumour nodules of varying sizes. Although the advanced stage is treatable with surgery and chemotherapy, recurrence is common, and tumours often become resistant to treatment. Identifying the early stages of cell adhesion to the peritoneal membrane’s surface is crucial to minimising the potential for tumour implantation within the peritoneal cavity and the regrowth of tumour cells [31,32]. The initial contact between ovarian cancer cells, whether as single cells, small clusters, or compact spheroids, and the peritoneal membrane is crucial for successful implantation. This can occur in several ways. Cancer cells may disrupt the interaction between mesothelial cell layers and the underlying basement membrane proteins, exposing these proteins and allowing cancer cells to adhere [33,34]. Additionally, in advanced stages, the unique microenvironment created by the ascitic fluid can compromise the integrity of the mesothelial cell monolayer, making the basement membrane proteins more accessible to cancer cells [10,35].
The interaction between these proteins and cancer cells is crucial for the homing and growth of cancer cells within the peritoneal cavity. This occurs when integrins on ovarian cancer cells bind to specific motifs on the ECM. The mutual binding of these interactions triggers a cascade of events that orchestrate protein complexes at the focal adhesion sites, recruiting specific proteins that allow cancer cells to survive and spread, provided the conditions are favourable. Integrins, particularly the β4 integrin subunit, is essential for the survival and migration of cancer cells [36]. The co-activation of β4 subunits is facilitated by various growth factor receptors, including EGFR, HER-2, and c-MET, although this co-dependence is also cell-line specific [16,17,37].
This study investigated the effect of growth factors (EGF and HGF) on the adhesion of ovarian cancer cell lines to the ECM, comprising collagen I, collagen IV and laminins (GelTrex™). The growth factors EGF and HGF are present in ascitic fluid from advanced ovarian cancer patients, which typically contains a complex mixture of growth factors, small molecules, and lipids [38,39,40]. It also includes ECM produced by both normal and ovarian cancer cells [41,42]. The concentrations of growth factors, including EGF and HGF, vary among patients’ ascites [38,43]. Thus, the mitogenic properties of these growth factors on cell adhesion are the central focus of this study.
The effects of the EGFR/HER-2 inhibitor canertinib and the c-MET inhibitor PHA665752 on cell adhesion were evaluated. In EGFR- and c-MET-positive ovarian cancer cells such as OVCAR-5, adhesion to the extracellular matrix (ECM) was more pronounced at supra-physiological concentrations of the growth factors (20 ng/mL) compared to physiological levels. Similarly, in SKOV-3 cells, which express EGFR, HER-2, and c-MET, cell adhesion was enhanced at both physiological and supra-physiological concentrations. In both cell lines, canertinib inhibited growth factor-induced adhesion in a concentration-dependent manner. Likewise, PHA665752 reduced cell adhesion in a dose-dependent fashion. These findings suggest that EGFR, HER-2, and c-MET contribute to ECM-mediated adhesion in ovarian cancer cells. Notably, combined treatment with canertinib and PHA665752 led to a greater reduction in cell adhesion than with either inhibitor alone, indicating that the cooperative activity of EGFR, HER-2, and c-MET may be important for adhesion. The inhibitors were applied four hours prior to cell adhesion assays in ovarian cancer cell clusters, ensuring that the observed effects were not influenced by changes in cell proliferation.
Several previous studies have investigated the effects of growth factors and inhibitors on cell monolayers, particularly focusing on the invasion and migration behaviour of ovarian cancer cells [44,45,46]. However, a study by Parashar et al. demonstrated that co-activation of EGFR and HER-2 in OVCAR-4 and OVCAR-5 cell clusters is critical for cell survival and spheroid formation. This activation occurs in cells with lower expression of specific integrin subunits, including integrin β1, αV, and α5, compared to their adherent counterparts [47].
The central question in our study is how do growth factors such as EGF and HGF, along with their respective inhibitors, regulate the adhesion of ovarian cancer cell clusters, given that EGFR, HER-2, and c-MET do not directly interact with the extracellular matrix (ECM). We hypothesise that ovarian cancer cell clusters utilise integrin proteins on the cell surface to mediate adhesion, potentially through co-interactions with EGFR, HER-2, and c-MET. Previous studies have demonstrated the expression of various integrin subunits in cell monolayers and ovarian cancer tissues [14,34,48]. However, only a limited number of studies have investigated the presence and functional role of integrins in the adhesion processes of ovarian cancer cell clusters or spheroids [49]. Moreover, the binding of ovarian cancer cells to the ECM appears to be substrate-dependent, suggesting that specific integrin use may be uniquely tailored to the adhesive requirements of ovarian cancer cells [50].
One intriguing aspect of our findings is that when RGDS amino acids (Figure 5), which mimic a binding site of β1 integrin, were used, they significantly reduced cell adhesion of OVCAR-5 and SKOV-3. However, the combination of both drugs with or without RGDS was more potent than RGDS alone. These results suggest that, although the direct interaction between cells and the ECM via RGDS-integrin-mediated processes reduces adhesion, the indirect interaction of integrins via non-RGDS binding is also crucial for cell adhesion. We suspect that β4 integrin might play a key role in this adhesion process, as the β4 integrin subunit does not bind to the RGDS amino acid sequences [51]. Additionally, we postulate that inhibitors of EGFR, HER-2, and c-MET may disrupt the protein–protein interactions between these receptor tyrosine kinases and the β4 integrin subunit. Notably, the total levels of the β4 integrin subunit remained unchanged, as shown by immunostaining (Figs. 7, 8, and 9), suggesting that the observed effects are not due to changes in protein expression, but may involve alternative regulatory mechanisms. However, phosphorylation of EGFR, HER-2, and c-MET in OVCAR-5 and SKOV-3 cells (Figs. 7 and 8) was reduced following treatment with the inhibitors, highlighting a potential co-dependent relationship between integrin β4 and the phosphorylation status of these receptor tyrosine kinases. We further postulate that the interaction between the β4 integrin and these receptor tyrosine kinases occurs at the physical level to facilitate the early stages of cell adhesion. Intriguingly, we observed that drug treatment disrupted the co-localisation of β4 integrin with the receptor tyrosine kinases (Figs. 9A–C), underscoring the importance of protein–protein interactions between these molecules in maintaining cellular adhesion dynamics. It has been suggested that the cytoplasmic domain of the β4 integrin plays a critical role in interacting with the cytoplasmic domains of EGFR, HER-2, and c-MET. This raises the possibility that the tyrosine kinase inhibitors canertinib and PHA665752, which bind to the ATP-binding sites within the cytoplasmic domains of these receptors, may disrupt their protein–protein interactions with β4 integrin. Such disruption could represent a potential mechanism by which these inhibitors reduce cell adhesion to the ECM [52,53].
Numerous previous studies have demonstrated an association between β4 integrin and EGFR, HER-2, and c-MET; however, evidence supporting their interaction specifically in ovarian cancer models remains limited. Furthermore, the signalling pathways including PI-3K/AKT, FAK and MAPK/ERK activated by the binding of integrin β4 to these receptor tyrosine kinases have been well-characterized in monolayer cultures of various cancer types [16,54,55,56]. Our study did not investigate downstream signalling cascades, as we focused specifically on the early adhesion of ovarian cancer cells through the physical interactions of EGFR, HER-2, and c-MET with the β4 integrin. Further research should explore the impact of combining antibodies that specifically target the extracellular domain of the β4 integrin subunit, either alone or in combination with these tyrosine kinase inhibitors. Such studies could reveal synergistic inhibitory effects that may have clinical relevance. These novel drug combinations may be particularly beneficial for a subset of ovarian cancer patients whose tumours are positive for EGFR, HER-2, c-MET, and β4 integrin.
This study has some limitations. First, incorporating molecular techniques to delete the extracellular domain of β4 integrin would strengthen our hypothesis regarding the requirement of β4 integrin interaction for cell adhesion via EGFR/HER-2/c-MET axis. Second, applying Förster Resonance Energy Transfer (FRET) could provide direct evidence at the cellular level to support the interaction between β4 integrin and these tyrosine kinase receptors.
4. Materials and Methods
4.1. Cell Lines and Cell Culture
The human ovarian adenocarcinoma cell lines OVCAR-5 and SKOV-3 were obtained from Dr Judith McKenzie, Haematology Research Group, University of Otago, Christchurch, New Zealand. OVCAR-5 and SKOV-3 cells were maintained in DMEM media (GIBCO”, Life Technologies, New Zealand) supplemented with 10% foetal bovine serum (FBS) (GIBCO”, Life Technologies, New Zealand), Pen/Strep (GIBCO”, Life Technologies, New Zealand) at a working concentration of 100 units/mL penicillin, 100 units/mL streptomycin, 2 mM glutaMAX™ (GIBCO”, Life Technologies, New Zealand) and 1 µg/mL Fungizone (Life Technologies, New Zealand). The final concentration of glucose in the media was 5.5 mM. The respective supplemented media is hereafter referred to as working media. Cells were maintained at 37°C in a humidified 5% CO2 atmosphere.
Each cell line, SKOV-3 and OVCAR-5, was authenticated using STR testing by CellBank (Children’s Medical Research Institute, New South Wales, Australia).
4.2. Generating 3D Cell Clusters
A 12 mg/mL poly-hydroxyethyl methacrylate (poly- HEMA) solution was prepared by mixing 1.2 g of poly-HEMA with 100 mL of 95% ethanol. The solution was heated to 72°C with continued stirring until fully dissolved. To generating the 3D cell clusters and aggregates, each cell culture plate was pre-coated with 300 µL of 12 mg/mL of (poly-HEMA) (Sigma, Auckland, New Zealand). The poly-HEMA was warmed at 70 ºC before application. The coated plates were allowed to dry overnight on an orbital shaker at 37°C and then were stored at room temperature until use. Before using the poly-HEMA coated plate, the plate was washed once with 1xPBS.
Confluent cells were incubated for 20 min with 1x trypsin-EDTA (Thermo Fisher, Auckland, New Zealand) to detach them from the culture flask. Once the cells were separated, they were collected and centrifuged at 400 g for 5 min, and the supernatant was discarded, and cell pellets were re-suspended in the working media. A cell count was performed using a haemocytometer to calculate the volume of cell suspension needed to obtain 1x10⁵ cells/mL in each well of poly-HEMA coated 24 well plates.
4.3. Adhesion Assays of Ovarian Cancer Cell Clusters
Epidermal growth factor (EGF) and hepatocyte growth factor (HGF) were purchased from Thermo Fisher (Auckland, New Zealand). Cells were cultured as 3D cell clusters/aggregates for six days in a working medium before further incubation for 24 h in a serum-free medium (SFM). Cells were then treated with SFM supplemented with 0.2 or 20 ng/mL growth factors and canertinib, PHA665752, RGDS, RGES alone or combined with these inhibitors for four hours before performing the cell adhesion assay. Cells with conditioned media were then transferred onto a freshly pre-coated collagen-gel matrix (a mixture of 2 mg/mL collagen I and 25% (v/v) GelTrex™, Thermo Fisher, New Zealand) cell culture wells and the cells were incubated for an additional four hours in a CO2 incubator at 37ᵒC. After that, cellular metabolism was determined by the Alamar Blue dye assay. In addition, the numbers of adherent and non-adherent cells were counted by a haemocytometer.
4.4. Determination of Protein Expression Using a Western Blotting
After treatment, cells were then washed with ice-cold 1x PBS, and lysed using either radio-immunoprecipitation assay lysis buffer, RIPA (made up with 50mM Tris-HCl pH 7.4, 100mM NaCl, 5mM EDTA, 1% (v/v) NP-40, 0.1% (w/v) SDS, 10% (v/v) glycerol, 1 tablet protease inhibitor), or 0.1% SDS ( 0.1% SDS dissolved in 1x PBS ), or modified 0.1% SDS buffer (0.1% SDS, 1XPBS, 10% Glycerol, 5mM EDTA, cocktail of phosphatase and protease inhibitors). Cells were mixed and left on ice for 30 min. Cellular components were fractionated by centrifugation at 6700 g for 10 min. The supernatant was transferred into new Eppendorf tubes before determining the protein concentration of each sample using a Micro-BCATM Protein Assay Kit (Pierce, Thermo Fisher Scientific, Rockford, IL, USA). Following the determination of the protein concentrations, the total protein lysates of 10 µg were denatured by boiling with 0.2% v/v of Laemmli 5x sample buffer (0.2% (v/v) bromophenol blue, 25% (v/v) glycerol, and 14.4 mM 2-mercaptoethanol in Tris-HCl pH 6.8), for 10 min. All samples were left on ice for 30 min before being loaded into sodium dodecyl sulphate polyacrylamide gel electrophoresis (SDS-PAGE) gels that were 1 mm thick. SDS-PAGE gels consist of 5% stacking gel and 10% separating gel were used to separate protein components. The SDS-PAGE was run for 2.5 h at 120 Volts. Once protein bands were separated, proteins were electro-blotted onto Poly Vinyl PVDF membrane (Immun-Blot®PVDF Bio-Rad, New Zealand) for 15-30 minutes using a BIO-RAD Trans-Blot® TurboTM Transfer system (Bio-Rad, New Zealand. The PVDF membranes were incubated with methanol for 5 minutes before washing with MilliQ water and soaking with the transfer sponges in freshly made transfer buffer (0.19% Tris, 0.9% glycine dissolved in MilliQ water) at least 15 minutes before the transfer. Primary antibodies were purchased from Santa Cruz Biotechnology (Dallas, Texas, USA). The antibodies that were used were anti- EGFR (SC-03), pEGFR (SC-101668), HER-2 (SC-284), pHER-2 (SC-12352-R), c-MET (SC-10), p-MET (SC-101736), GAPDH (SC-25778) and β4 integrin (SC-9090) respectively.
Membranes were then blocked with the specified blocking solutions, 5% skim milk or 1-4% BSA, dissolved in Tris-buffered Tween saline (TBS-T). Blocking was carried out for one h before incubation with the primary antibody solutions overnight at 4°C with gentle shaking. Primary antibodies were diluted at a range of 1:500, 1:1000 or 1:2000 with 50% (v/v) of TBS-T and the appropriate blocking buffer. Next, the membranes were washed with TBS-T four times for 10 min each wash before adding the secondary antibody and incubating at room temperature for 90 min on an orbital shaker followed by washing with TBS-T four times for 10 min each wash. Secondary antibodies (anti-mouse HRP and anti-Rabbit HRP, Santa Cruz Biotechnology, USA) were diluted 1:5000 or 1:10000 with 50% (v/v) TBS-T and the specified blocker. Membranes were developed using a Clarity™ Western ECL Blotting Substrates detection kit (Bio-Rad, New Zealand). Protein bands were visualised and densitometry analysis was performed using Alliance 4.7, Unitec software (Cambridge, UK). Densitometry readings were based on median bands from raw data images and normalised against the band intensity of GAPDH as a reference protein.
4.5. Detection of Cellular Proteins Using Immunofluorescence
OVCAR-5 and SKOV-3 cells were cultured to generate cell clusters and aggregates for six days. Cell clusters and aggregates were collected and fixed with 50% (v/v) acetone/methanol solution ice-cold. OVCAR-5 cell clusters were washed twice with ice-cold PBS, pH 7.4 and re-suspended in 200 µl cold PBS. The clusters were then transferred on poly-lysine coated microscope slides, left to dry at 37°C for 20 min before proceeding with the main procedure. Before frozen sectioning, SKOV-3 aggregates were washed with PBS pH 7.4 and stained with 1% aniline blue dye solution (Sigma-Aldrich LTD, New Zealand) for 15 min. The aniline blue dye binds to proteins on cell aggregates and makes aggregates more visible when a frozen section is cut. Cells were washed two times with ice-cold 1x PBS before they were embedded in a liquid CryO-Z-T solution, OCT (Ted Pella Inc., USA). The liquid OCT blocks were frozen at -80°C for at least 24 h. Seven µm thick slices were cut from the block of frozen OCT using a CM186UV Cryostat (Lieca BIOSYSTEM, Deutschland) and were placed on an appropriately labelled Superfrost plus slides (Menzel-Glaser, Germany). Two cut sections were collected per slide. There were six slides per sample in total, and the slides were stored at -20°C until analysis. Both cell lines were blocked with 4% BSA in 1x PBS for one h at room temperature before incubation overnight with a 1:200 dilution of primary antibody at 4°C. Next day, the slides were washed twice with constant stirring in a large washing jar with 100 mL ice cold PBS (pH 7.4) for 10 min each time and further incubated with a 1:500 dilution of secondary antibody goat anti-rabbit IgG conjugated with FITC for 60 minutes in a 37°C incubator.
The secondary antibody solution was removed and 500 µL of 10 µg/mL of (4`, 6-diamido-2-phenylindole (DAPI, Thermo fisher NZ), a fluorescent dye that binds to DNA, was added to the cells and left for 20 min in the dark. The slides were then washed twice with constant stirring in a large washing jar for 10 min each time with 100 mL ice cold 0.1% Tween-20 in PBS pH 7.4. Then cells were mounted with ice cold anti-fading solution (2 mg/mL p-phenylenediamine in 80% glycerol, pH 7.8). Fluorescent images were captured using an epifluorescence microscope with a 40x/1.3 N.A. oil/DIC objective lens (AxioVision 4.5. Apotome software, Carl Zeiss, Oberkochen, Germany).
Author Contributions
W.H. conducted experiments, K.C. wrote the manuscript, A.G. & P.S. conceptualise experiments and proof-reading the manuscript.
Data Availability Statement
All datasets are presented in main figures and supplementary of this manuscript.
Acknowledgments
We like to thank government of Iraq for supporting Wafaa Hassan’s PhD scholarship.
Conflicts of Interest
The authors declare no conflicts of interest.
References
- Ahmed, N.; Stenvers, K.L. Getting to know ovarian cancer ascites: opportunities for targeted therapy-based translational research. Front Oncol. 2013, 3, 256. [Google Scholar] [CrossRef]
- Chitcholtan, K.; Harker, D.; Simcock, B.; Sykes, P. Sensitivity of EGFR/HER-2 Positive Cells Isolated from Ascitic Fluid of Advanced Ovarian Cancer Patients to EGFR/HER-2 Inhibitors. Appl Sci 2020, 2020. 10, 2343. [Google Scholar] [CrossRef]
- Ayantunde, A.A.; Parsons, S.L. Pattern and prognostic factors in patients with malignant ascites: a retrospective study. Annals of Oncology. 2007, 18, 945–949. [Google Scholar] [CrossRef]
- Latifi, A.; Luwor, R.B.; Bilandzic, M.; Nazaretian, S.; Stenvers, K.; Pyman, J.; et al. Isolation and Characterization of Tumor Cells from the Ascites of Ovarian Cancer Patients: Molecular Phenotype of Chemoresistant Ovarian Tumors. PLoS One. 2012, 7, e46858. [Google Scholar]
- Sun, X.; Dong, W.; Yu, B.; Luo, H.; Yu, J. Detection of type IV collagenase activity in malignant ascites. World J Gastroenterol. 2003, 9, 2592–2595. [Google Scholar] [CrossRef]
- Ritch, S.J.; Telleria, C.M. The Transcoelomic Ecosystem and Epithelial Ovarian Cancer Dissemination. Front Endocrinol. 2022, 13, 886533. [Google Scholar] [CrossRef]
- Mikuła-Pietrasika, J.; Uruskia, P.; Szubertb, S.; Szpurekb, D.; Sajdakb, S.; Tykarskia, A.; et al. Malignant ascites determine the transmesothelial invasion of ovarian cancer cells. International Journal of Biochemistry and Cell Biology. 2017, 92, 6–13. [Google Scholar] [CrossRef]
- Worzfeld, T.; Strandmann, E.P.; Huber, M.; Adhikary, T.; Wagner, U.; Reinartz, S.; et al. The Unique Molecular and Cellular Microenvironment of Ovarian Cancer. Front Oncol. 2017, 7, 24. [Google Scholar] [CrossRef]
- Kenny, H.A.; Krausz, T.; Yamada, S.D.; Lengyel, E. Use of a novel 3D culture model to elucidate the role of mesothelial cells,fibroblasts and extra-cellular matrices on adhesion and invasion of ovarian cancer cells to the omentum. Int J Cancer. 2007, 121, 1463–1472. [Google Scholar] [CrossRef]
- Ween, M.P.; Oehler, M.K.; Ricciardelli, C. Role of Versican, Hyaluronan and CD44 in Ovarian Cancer Metastasis. Int J Mol Sci. 2011, 12, 1009–1029. [Google Scholar] [CrossRef]
- BOTTINIS C, MIOTTI S, FIORUCCPI S, FACHERISS P, MENARD S, COLNAGHI MI. POLARIZATION OF THE alpha6 beta 4 INTEGRIN IN OVARIAN CARCINOMAS. Int J Cancer. 1993, 54, 261–267.
- Skubitz, A.P.N.; Bast, R.C.; Wayner, E.A.; Letourneau, P.C.; S, WM. Expression of a6 and f34 Integrins in Serous Ovarian Carcinoma Correlates with Expression of the Basement Membrane Protein Laminin. Am J Pathol. 1996, 148, 1445–1461. [Google Scholar] [PubMed]
- Ahmed, N.; Riley, C.; Rice, G.; Quinn, M.A. Role of integrin receptors for fibronectin, collagen and laminin in the regulation of ovarian carcinoma functions in response to a matrix microenvironment. Clinical & Experimental Metastasis. 2005, 22, 391–402. [Google Scholar]
- Sawada, K.; Ohyagi-Hara, C.; Kimura, T.; Morishige, K. Integrin Inhibitors as a Therapeutic Agent for Ovarian Cancer. J oncol. 2012, 2012, 915140. [Google Scholar] [CrossRef]
- Barczyk, M.; Carracedo, S.; Gullberg, D. Integrins. Cell Tissue Res. 2010, 339, 269–280. [Google Scholar] [CrossRef]
- Merdek, K.D.; Yang, X.; Taglienti, C.A.; Shaw, L.M.; Mercurio, A.M. Intrinsic Signaling Functions of the beta 4 Integrin Intracellular Domain. J Biol Chem. 2007, 282, 30322–30330. [Google Scholar] [CrossRef]
- Bertotti, A.; Comoglio, P.M.; Trusolino, L. B4 Integrin Is a Transforming Molecule that Unleashes Met Tyrosine Kinase Tumorigenesis. Cancer Res. 2005, 65, 10674–10679. [Google Scholar] [CrossRef]
- Bon, G.; Folgiero, V.; Bossi, G.; Felicioni, L.; Marchetti, A.; Sacchi, A.; et al. Loss of B4 Integrin Subunit Reduces the Tumorigenicity of MCF7Mammary Cells and Causes Apoptosis upon Hormone Deprivation. Clin Cancer Res. 2006, 12, 3280–3287. [Google Scholar] [CrossRef]
- Giancotti, F.G. Targeting integrin b4 for cancer and anti-angiogenic therapy. TRENDS in Pharmacological Sciences. 2007, 28, 506–511. [Google Scholar] [CrossRef]
- Bertotti, A.; Comoglio, P.M.; Trusolino, L. β4 integrin activates a Shp2–Src signaling pathway that sustains HGF-induced anchorage-independent growth. J Cell Biol. 2006, 175, 993–1003. [Google Scholar] [CrossRef]
- Campos, S.; Hamid, O.; Seiden, M.V.; Oza, A.; Plante, M.; Potkul, R.K.; et al. Multicenter, Randomized Phase II Trial of Oral CI-1033 for Previously Treated Advanced Ovarian Cancer. J Clin Oncol. 2005, 23, 5597–5604. [Google Scholar] [CrossRef] [PubMed]
- Vergote, I.B.; Jimeno, A.; Joly, F.; Katsaros, D.; Coens, C.; Despierre, E.; et al. Randomized Phase III Study of Erlotinib Versus Observation in Patients With No Evidence of Disease Progression After First-Line Platin-Based Chemotherapy for Ovarian Carcinoma: A European Organisation for Research and Treatment of Cancer-Gynaecological Cancer Group, and Gynecologic Cancer Intergroup Study. J Clin Oncol. 2013, 32, 320–326. [Google Scholar] [PubMed]
- Siwak, D.R.; Carey, M.; Hennessy, B.T.; Nguyen, C.T.; McGahrenMurray, M.J.; Nolden, L.; et al. Targeting the Epidermal Growth Factor Receptor in Epithelial Ovarian Cancer: Current Knowledge and Future Challenges. J oncol. 2010, 2010, 568938. [Google Scholar] [CrossRef]
- Amler, L.C.; Wang, Y.; Hampton, G. HER2 as a Therapeutic Target in Ovarian Cancer, Ovarian Cancer - Clinical and Therapeutic Perspectives. 2012.
- Davies, S.; Holmes, A.; Lomo, L.; Steinkamp, M.; Kang, H.; Muller, C.Y.; et al. High incidence of ErbB3, ErbB4 and MET expression In ovarian cancer. Int J Gynecol Pathol. 2014, 33, 402–410. [Google Scholar] [CrossRef]
- Bu, R.; Uddin, S.; Bavi, P.; Hussain, A.R.; Al-Dayel, F.; Ghourab, S.; et al. HGF/c-Met pathway has a prominent role in mediating antiapoptotic signals through AKT in epithelial ovarian carcinoma. Laboratory Investigation. 2011, 91, 124–137. [Google Scholar] [CrossRef]
- Hassan, W.; Chitcholtan, K.; Sykes, P.H.; Garrill, A. A Combination of Two Receptor Tyrosine Kinase Inhibitors, Canertinib and PHA665752 Compromises Ovarian Cancer Cell Growth in 3D Cell Models. Oncol Ther. 2016, 4, 257. [Google Scholar] [CrossRef]
- Dunn, E.; Chitcholtan, K.; Sykes, P.; Garrill, A. The Anti-Proliferative Effect of PI3K/mTOR and ERK Inhibition in Monolayer and Three-Dimensional Ovarian Cancer Cell Models. Cancers. 2022, 14, 395. [Google Scholar] [CrossRef]
- Weaver, V.M.; Lelievre, S.; Lakins, J.N.; Chrenek, M.A.; Jones, J.C.R.; Giancotti, F.; et al. b4 integrin-dependent formation of polarized three-dimentional architecture confers resistance to apoptosis in normal and malignant mammary epithelium. Cancer Cell. 2002, 2, 205–216. [Google Scholar] [CrossRef]
- Hassan, W.; Chitcholtan, K.; Sykes, P.H.; Garrill, A. Ascitic fluid from advanced ovarian cancer patients compromises the activity of receptor tyrosine kinase inhibitors in 3D cell clusters of ovarian cancer cells. Cancer Letters. 2018, 420, 168–181. [Google Scholar] [CrossRef]
- Moghaddam, S.M.; Amini, A.; Morris, D.L.; Pourgholami, M.H. Significance of vascular endothelial growth factor in growth and peritoneal dissemination of ovarian cancer. Cancer Metastasis Rev. 2012, 31, 143–162. [Google Scholar] [CrossRef]
- Chitcholtan, K.; Singh, M.; Tino, A.; Garrill, A.; Sykes, P. Effects of Resveratrol on In Vivo Ovarian Cancer Cells Implanted on the Chorioallantoic Membrane (CAM) of a Chicken Embryo Model. Int J Mol Sci. 2024, 25, 4374. [Google Scholar] [CrossRef] [PubMed]
- Kwon, Y.; Cukierman, E.; Godwin, A.K. Differential Expressions of Adhesive Molecules and Proteases Define Mechanisms of Ovarian Tumor Cell Matrix Penetration/Invasion. PLoS ONE. 2011, 6, e18872. [Google Scholar] [CrossRef]
- Barbolina, M.V.; Adley, B.P.; Kelly, D.L.; Shepard, J.; Fought, A.J.; Scholtens, D.; et al. Downregulation of connective tissue growth factor by three-dimensional matrix enhances ovarian carcinoma cell invasion. Int J Cancer. 2009, 125, 816–825. [Google Scholar] [CrossRef]
- Kipps, E.; Tan, D.S.P.; Kaye, S.B. Meeting the challenge of ascites in ovarian cancer: new avenues for therapy and research. NATURE REVIEWS. 2013, 13, 273–282. [Google Scholar] [CrossRef]
- Stewart, R.L.; O’Connor, K.L. Clinical significance of the integrin α6β4 in human malignancies. Laboratory Investigation. 2015, 95, 976–986. [Google Scholar] [CrossRef]
- Ross, R.S. Molecular and mechanical synergy: cross-talk between integrins and growth factor receptors. Cardiovascular Research. 2004, 63, 381–390. [Google Scholar] [CrossRef]
- Matte, I.; Lane, D.; Laplante, C.; Rancourt, C.; Piché, A. Profiling of cytokines in human epithelial ovarian cancer ascites. Am J Cancer Res. 2012, 2, 566–580. [Google Scholar]
- Kim, S.; Kim, B.; Song, Y.S. Ascites modulates cancer cell behavior, contributing to tumor heterogeneity in ovarian cancer. Cancer Sci. 2016, 107, 1173–1178. [Google Scholar] [CrossRef]
- Chudecka-Głaz, A.M.; Cymbaluk-Płoska, A.A.; Menkiszak, J.L.; Pius-Sadowska, E.; Machaliński, B.B.; Sompolska-Rzechuła, A.; et al. Assessment of selected cytokines, proteins, and growth factors in the peritoneal fluid of patients with ovarian cancer and benign gynecological conditions. OncoTargets and Therapy. 2015, 8, 471–485. [Google Scholar] [CrossRef]
- Santala, M.; Risteli, J.; Risteli, L.; Puistola, U.; Kacinski, B.M.; Stanley, E.R.; et al. Synthesis and breakdown of fibrillar collagens: concomitant phenomena in ovarian cancer. Brit J Can. 1998, 77, 1825–1831. [Google Scholar] [CrossRef]
- Li, M.; Wang, J.; Wang, C.; Xia, L.; Xu, J.; Xie, X.; et al. Microenvironment remodeled by tumor and stromal cells elevates fibroblast-derived COL1A1 and facilitates ovarian cancer metastasis. Exp Cell Res. 2020, 394, 112153. [Google Scholar] [CrossRef] [PubMed]
- Trachana, S.; Pilalis, E.; Gavalas, N.G.; Tzannis, K.; Papadodima, O.; Liontos, M.; et al. The Development of an Angiogenic Protein “Signature” in Ovarian Cancer Ascites as a Tool for Biologic and Prognostic Profiling. PLoS ONE. 2016, 11, e0156403. [Google Scholar] [CrossRef] [PubMed]
- Bourgeois, D.L.; Kabarowski, K.A.; Porubsky, V.L.; Kreeger, P.K. High-grade serous ovarian cancer cell lines exhibit heterogeneous responses to growth factor stimulation. Cancer Cell Int. 2015, 15, 112. [Google Scholar] [CrossRef]
- Zhou, H.Y.; Pon, Y.L.; Wong, A.S.T. Synergistic Effects of Epidermal Growth Factor and Hepatocyte Growth Factor on Human Ovarian Cancer Cell Invasion and Migration: Role of Extracellular Signal-Regulated Kinase 1/2 and p38 Mitogen-Activated Protein Kinase. Endocrinology. 2007, 148, 5195–5208. [Google Scholar] [CrossRef]
- Alper, Ö.; Bergmann-Leitner, E.S.; Bennett, T.A.; Hacker, N.F.; Stromberg, K.; Stetler-Stevenson, W.G. Epidermal Growth Factor Receptor Signaling and the Invasive Phenotype of Ovarian Carcinoma Cells. J NatlCancer Inst. 2001, 93, 1375–1384. [Google Scholar] [CrossRef]
- Parashar, D.; Nair, B.; Geethadevi, A.; George, J.; Nair, A.; Tsaih, S.; et al. Peritoneal Spread of Ovarian Cancer harbors Therapeutic Vulnerabilities Regulated by FOXM1 and EGFR/ERBB2 Signaling. Cancer Res. 2020, 80, 5554–5568. [Google Scholar] [CrossRef]
- Villegas-Pinedaa, J.C.; Garibay-Cerdenaresa, O.L.; Hernández-Ramíreza, V.I.; Gallardo-Rincónb, D.; de Leónb, D.C.; Pérez-Montiel-Gómezb, M.D.; et al. Integrins and haptoglobin: Molecules overexpressed in ovarian cancer. Pathology- Research and Practice. 2015, 211, 973–981. [Google Scholar] [CrossRef]
- Casey, R.C.; Burleson, K.M.; Skubitz, K.M.; Pambuccian, S.E.; Oegema, T.R.; Ruff, L.E.; et al. b1-integrins regulate the formation and adhesion of ovarian carcinoma multicellular spheroids. Am J Pathol. 2001, 159, 2071–2080. [Google Scholar] [CrossRef]
- Shield, K.; Riley, C.; Quinn, M.A.; Rice, G.E.; Ackland, M.L.; Ahmed, N. α2β1 integrin affects metastatic potential of ovarian carcinoma spheroids by supporting disaggregation and proteolysis. Journal of Carcinogenesis. 2007, 6, 11. [Google Scholar] [CrossRef]
- Litjens, S.H.M.; de Pereda, J.M.; Sonnenberg, A. Current insights into the formation and breakdown of hemidesmosomes. TRENDS in Cell Biology. 2006, 16, 376–383. [Google Scholar] [CrossRef]
- Spector, N.; Xia, W.; El-Hariry, I. ; Y Y, Bacus S. HER2 therapy Small molecule HER-2 tyrosine kinase inhibitors. Breast Cancer Res. 2007, 9, 205. [Google Scholar]
- Seshacharyulu, P.; Ponnusamy, M.P.; Haridas, D.; Jain, M.; Ganti, A.; Batra, S.K. Targeting the EGFR signaling pathway in cancer therapy. Expert Opin Ther Targets. 2012, 16, 15–31. [Google Scholar] [CrossRef] [PubMed]
- Song, Q.H.; Gong, H.; Trinkaus-Randall, V. Role of epidermal growth factor and epidermal growth factor receptor on hemidesmosome complex formation and integrin subunit b4. Cell Tissue Res. 2003, 312, 203–220. [Google Scholar] [CrossRef]
- Mercurio, A.M.; Rabinovitz, I. Toward a mechanistic understanding of tumor invasion-lessons from the a6b4 integrin. CANCER CELL. 2001, 11, 129–141. [Google Scholar]
- Gambaletta, D.; Marchetti, A.; Benedetti, L.; Mercurio, A.M.; Sacchi, A.; Falcioni, R. Cooperative Signaling between a6b4 Integrin and ErbB-2 Receptor Is Required to Promote Phosphatidylinositol 3-Kinase-dependent Invasion. J Biol Chem. 2000, 275, 10604–10610. [Google Scholar] [CrossRef]
Figure 1.
Effects of EGF and HGF on the adhesion of the OVCAR-5 (A, C) and SKOV-3 (B, D) ovarian cancer cell lines. Numbers represent the number of adherent OVCAR-5 clusters and SKOV-3 aggregates treated with 0.2 and 20 ng/mL of EGF or HGF respectively. Data are expressed as means ± S.E.M. (n=3). Statistically significant differences in cell numbers are indicated as p<0.05 (*), p<0.01 (**), p<0.001 (***), and p<0.0001 (****) compared to the control or other concentrations.
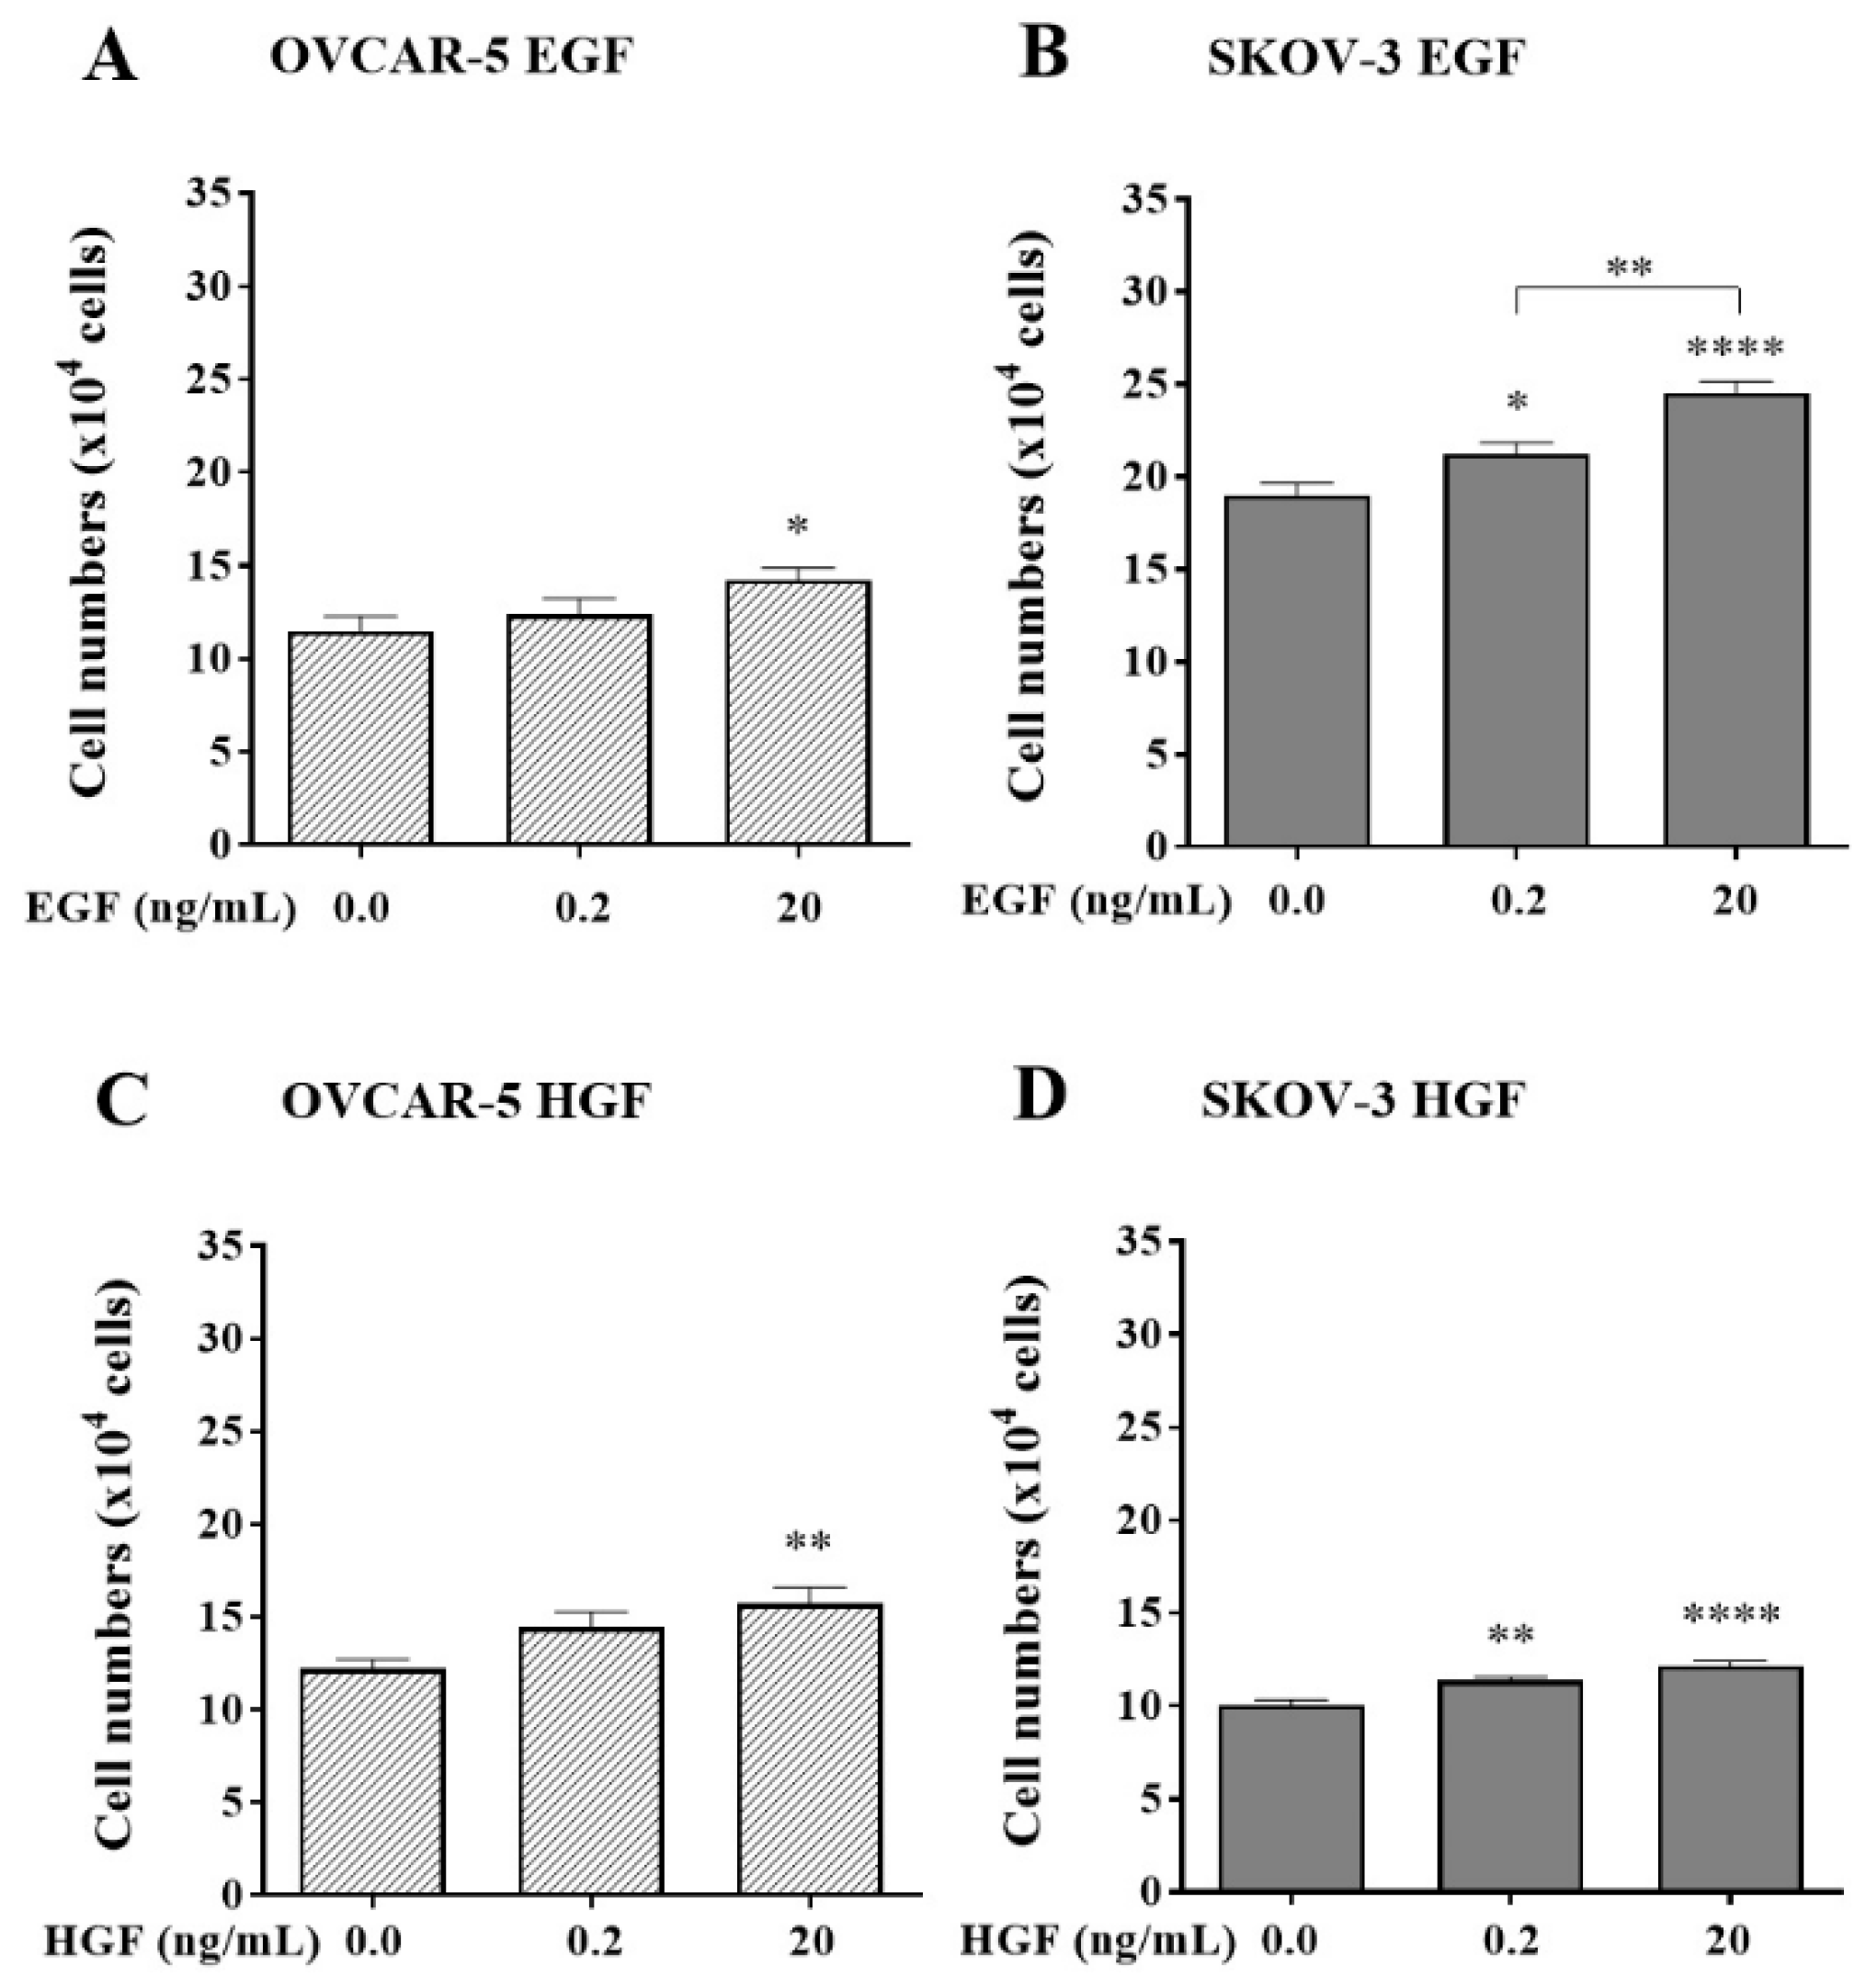
Figure 2.
The effect of canertinib on cell adhesion of OVCAR-5 clusters (A, C) and SKOV- 3 aggregates (B, D) in the presence of growth factors (GF). Cells were treated with canertinib in the presence of 0.2 or 20 ng/mL EGF+HGF (GF) for four hr before a further four hr exposure during the adhesion assay. Adherent cells were counted. Data are expressed as means ± S.E.M. (n=3). Statistically significant differences in cell number are indicated as p<0.05 (*), p<0.01 (**), p<0.001 (***), and p<0.0001 (****) compared to the control or other concentrations.
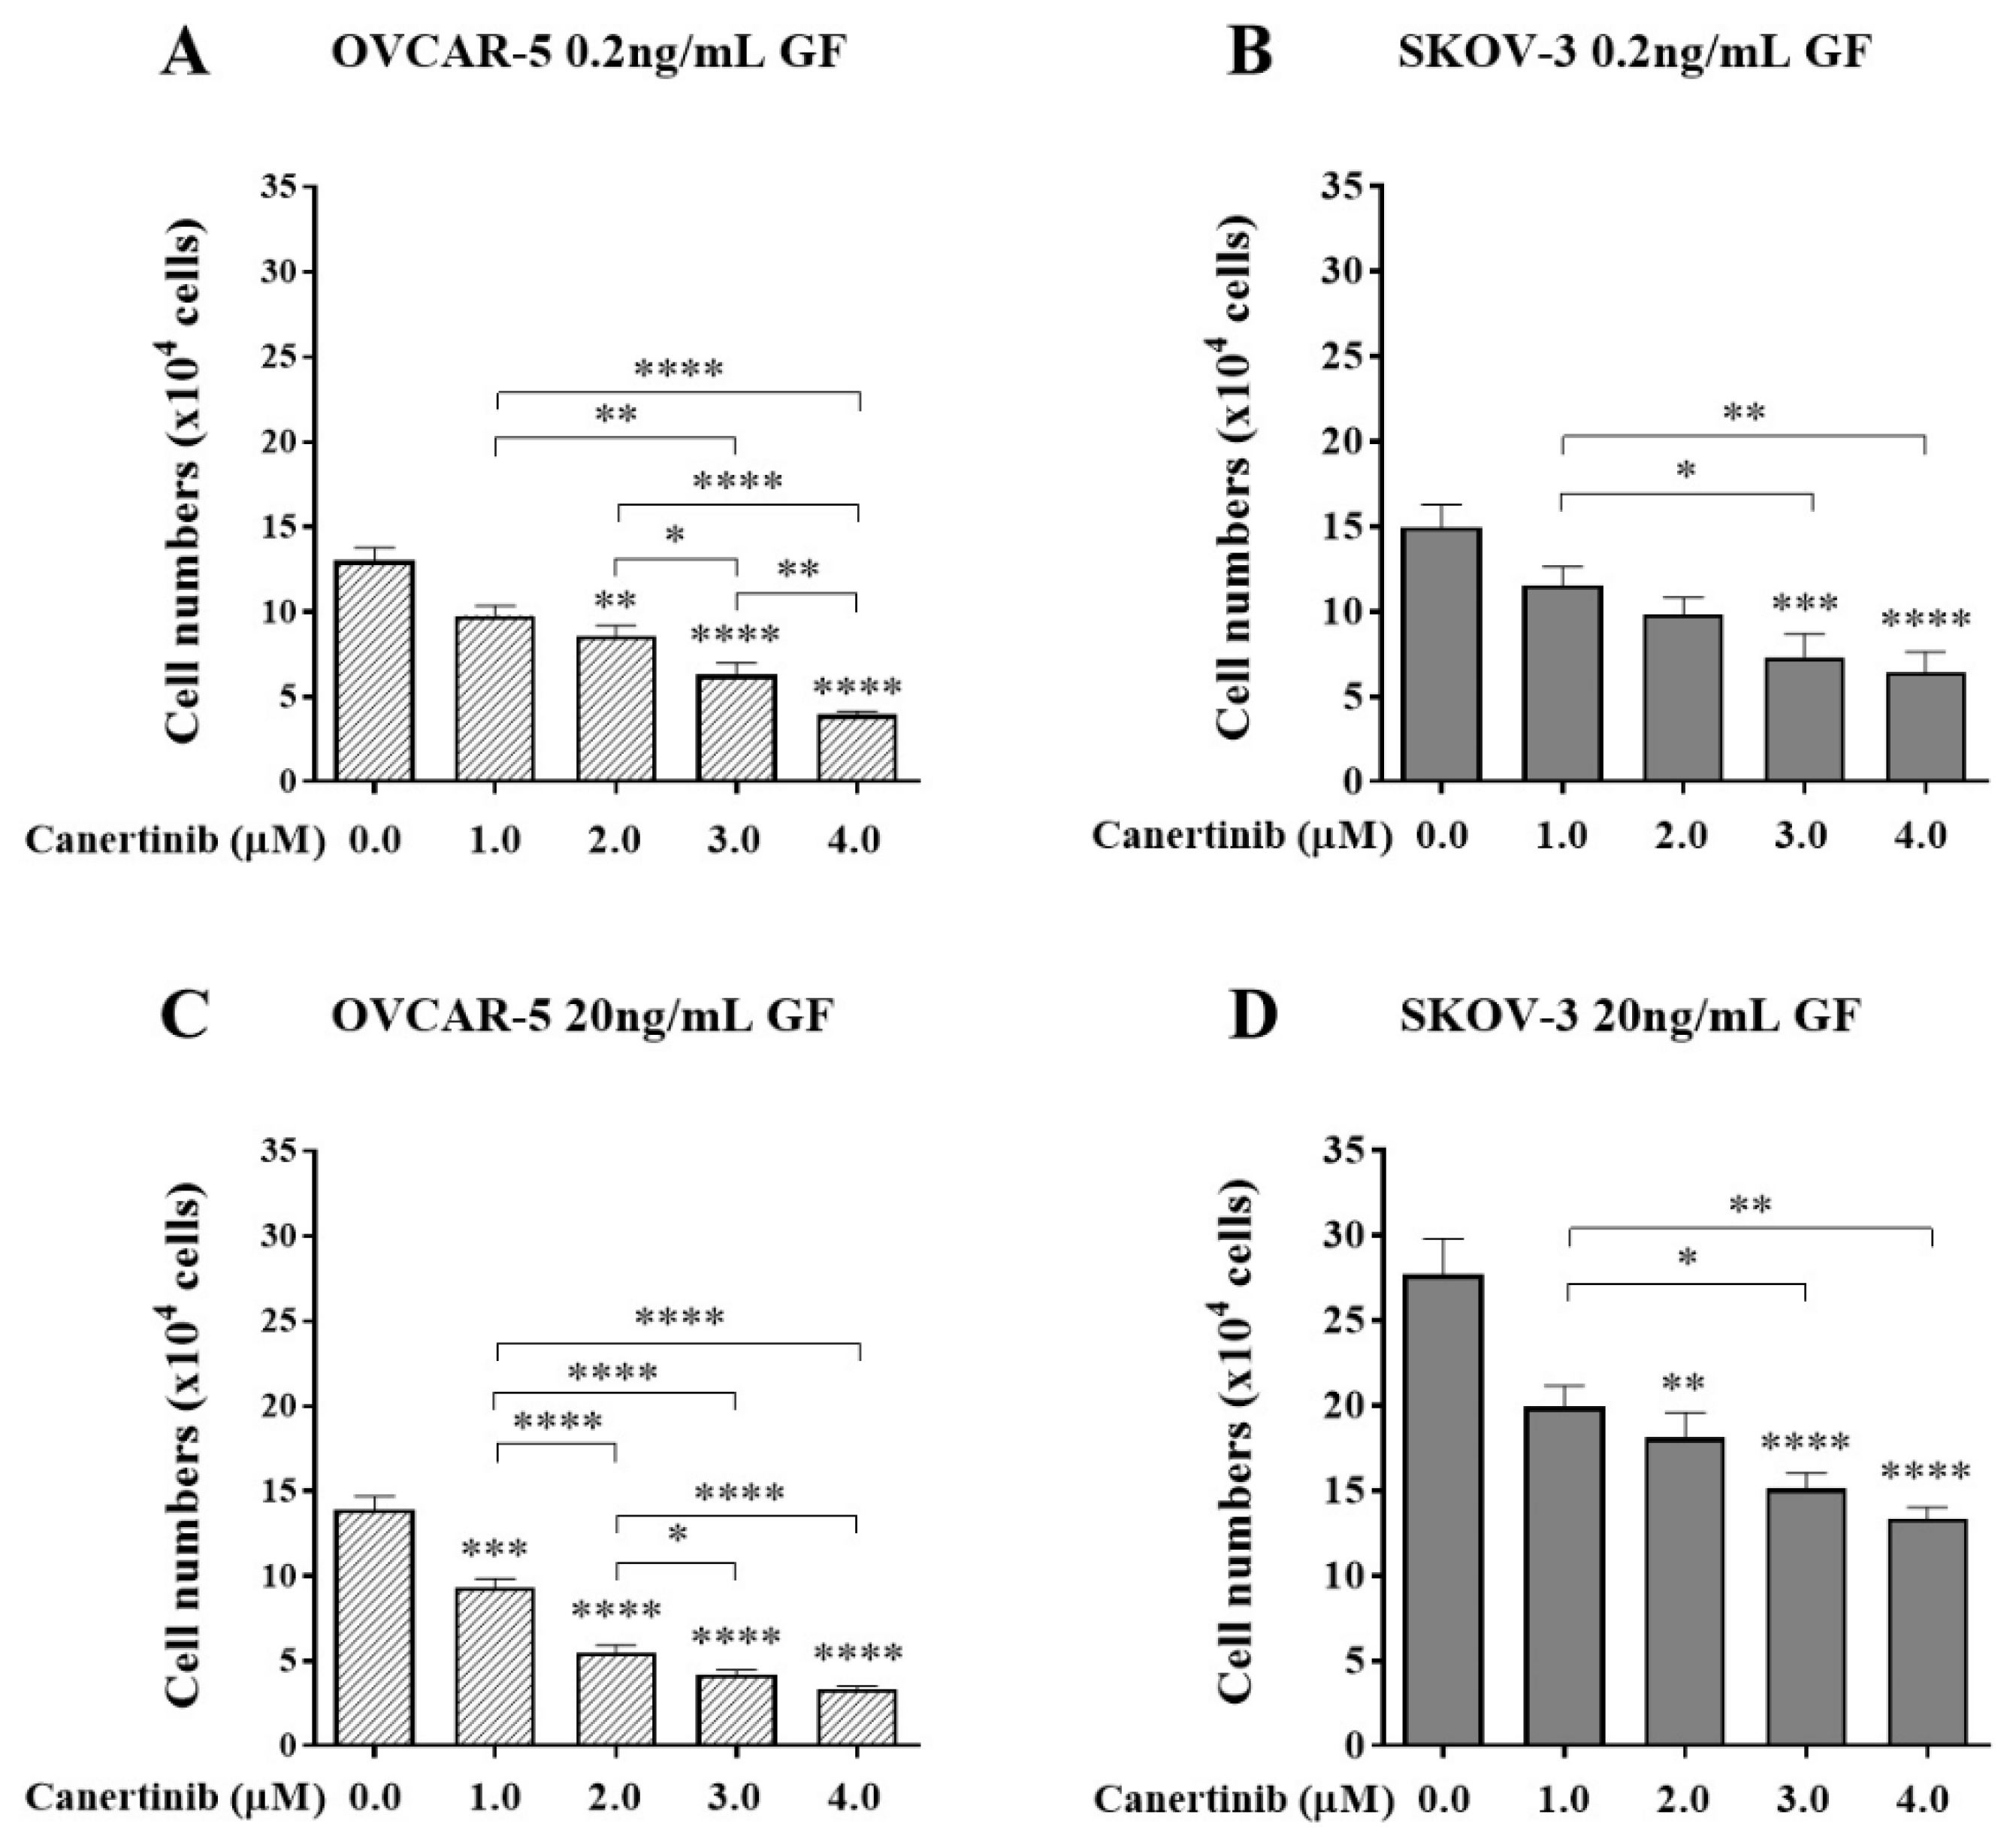
Figure 3.
The effect of PHA665752 on cell adhesion of OVCAR-5 clusters (A, C) and SKOV-3 aggregates (B, D) in the presence of growth factors (GF). Cells were treated with PHA665752 in the presence of 0.2 or 20 ng/mL EGF+HGF (GF) for four hr before a further four hr exposure during the adhesion assay. Adherent cells were counted. Data are expressed as means ± S.E.M. (n=3). Statistically significant differences in cell number are indicated as p<0.05 (*), p<0.01 (**), p<0.001 (***), and p<0.0001 (****) compared to the control or other concentrations.
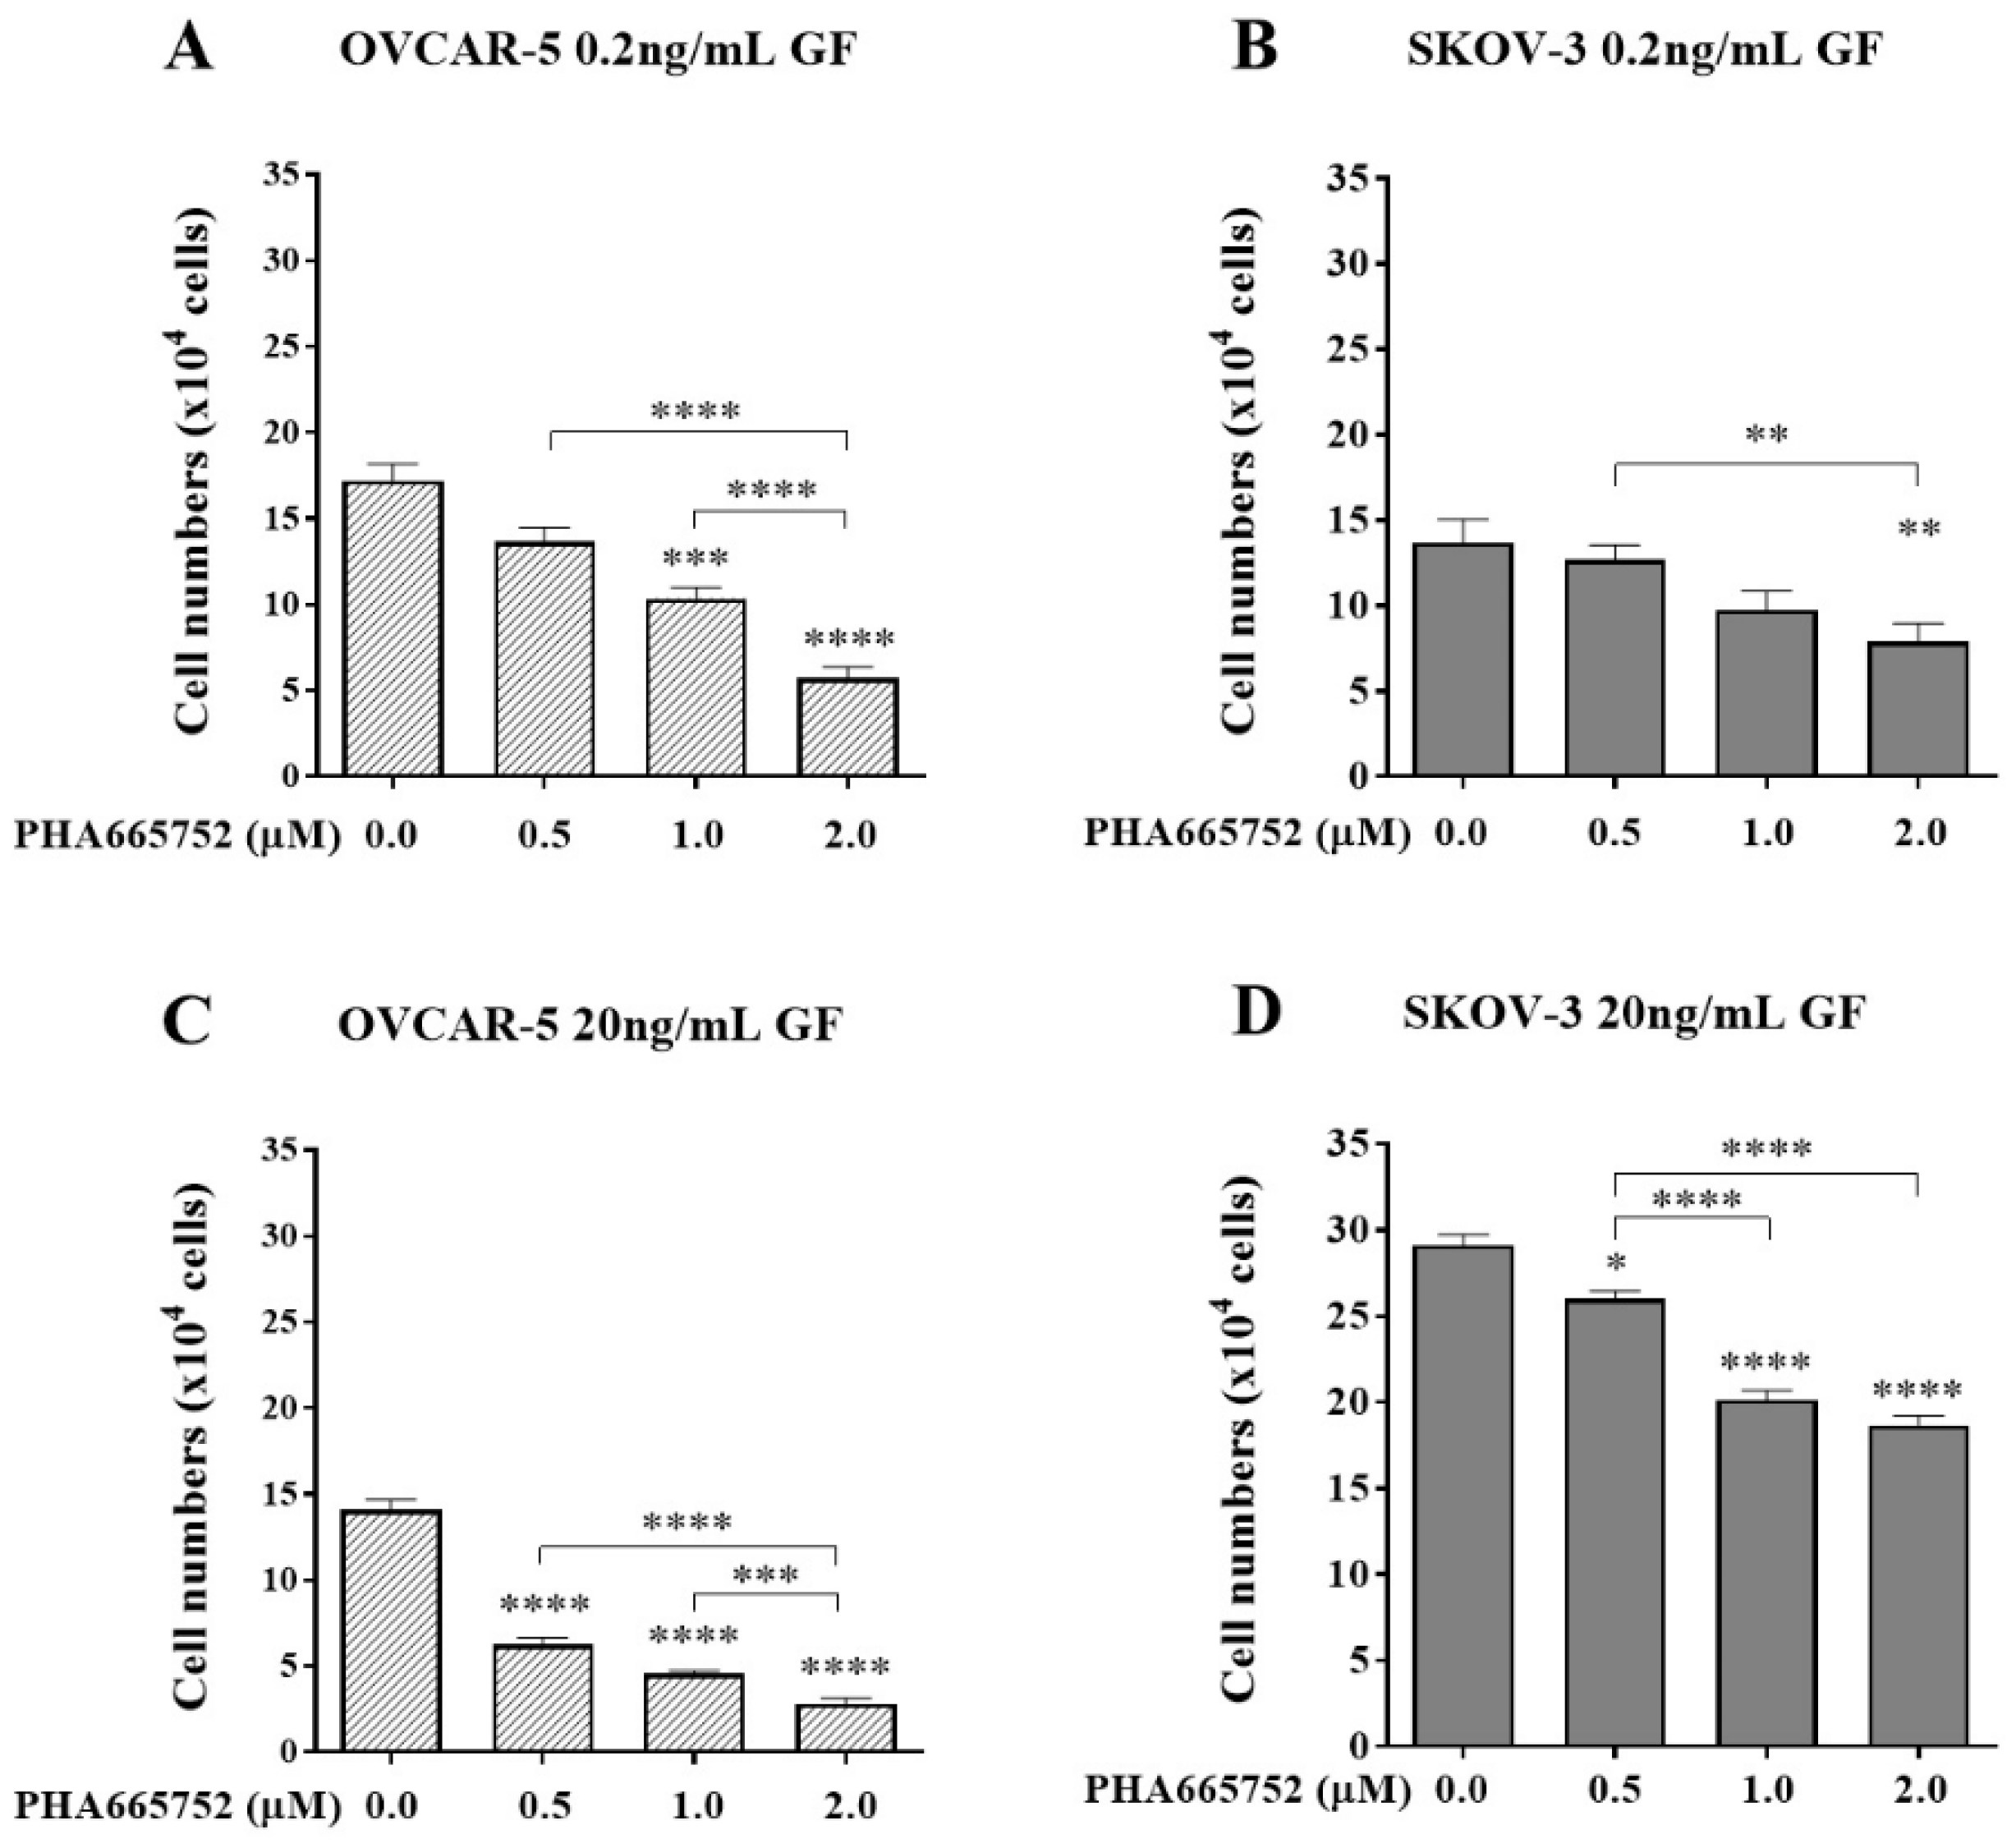
Figure 4.
The effect of a combination of canertinib and PHA665752 on the adherence of OVCAR-5 clusters and SKOV-3 aggregates. Cells were treated with canertinib alone or a combination of canertinib and PHA665752 in the presence of 0.2 or 20 ng/mL GF for four hr before a further 4 hr exposure during the adhesion assay. Adherent cells were counted. Data are expressed as means ± S.E.M. (n=3). Statistically significant differences in cell number are indicated as p<0.05 (*), p<0.01 (**), p<0.001 (***), and p<0.0001 (****) compared to the control or other concentrations.
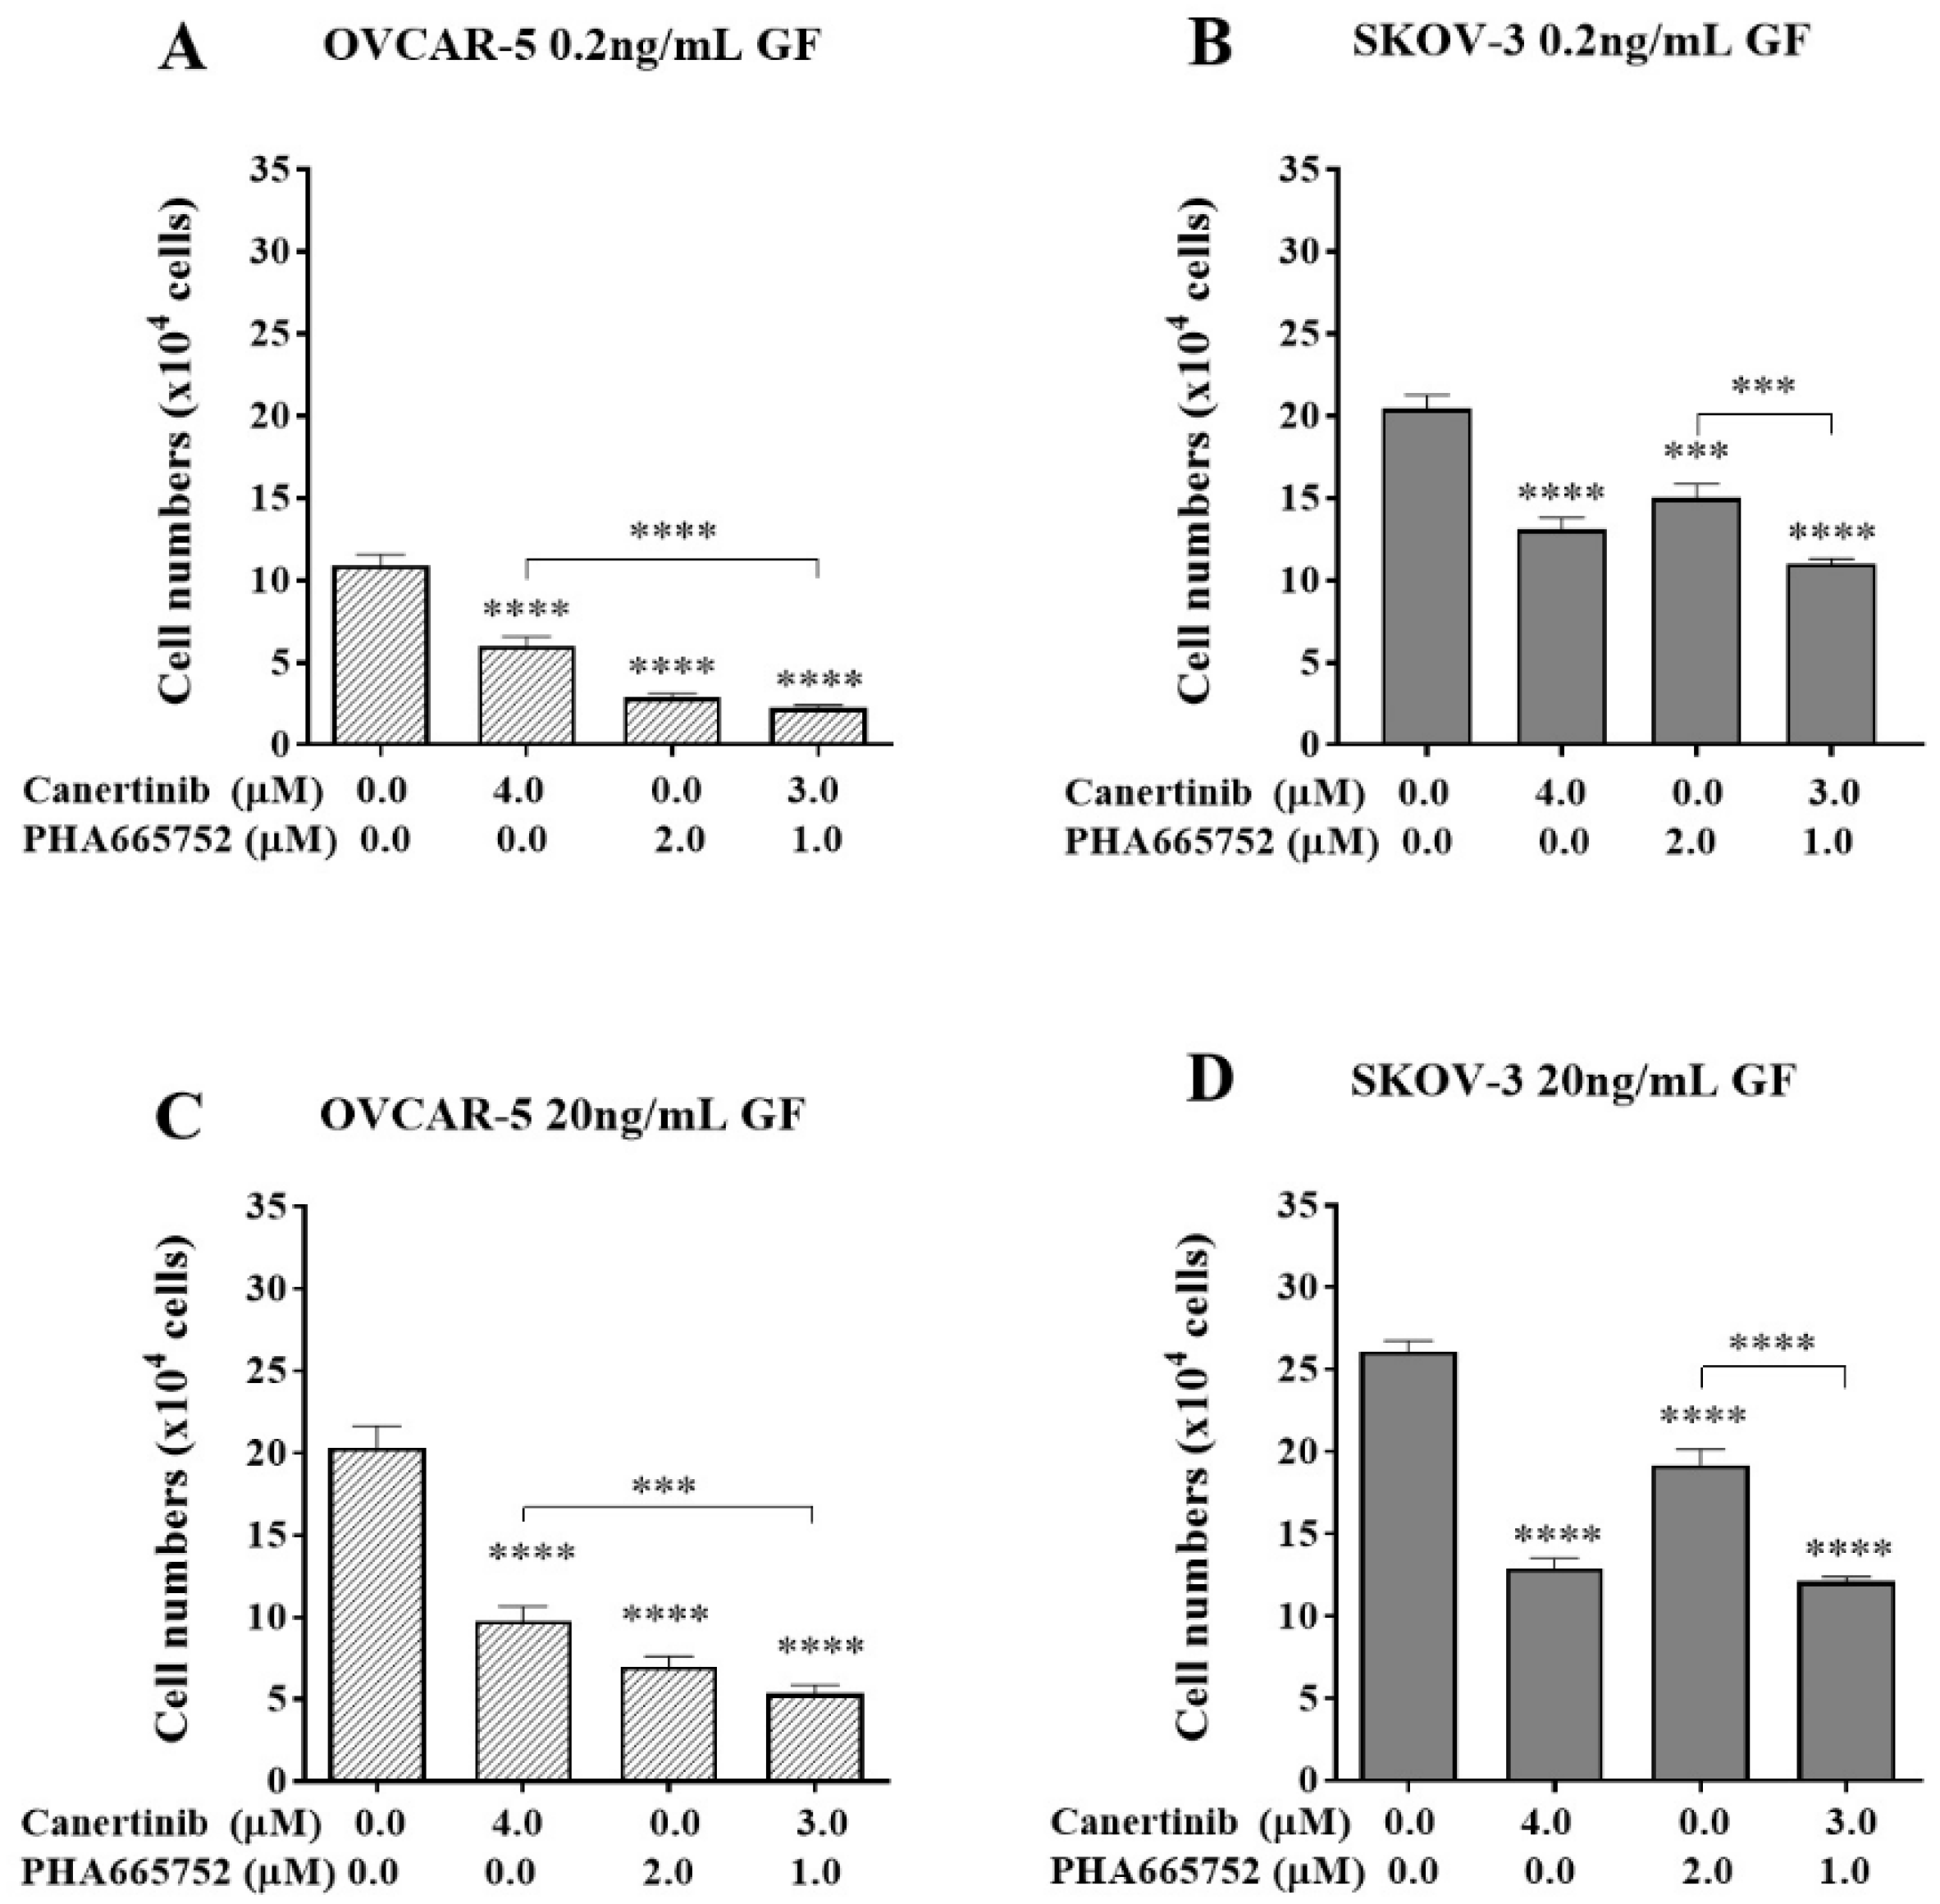
Figure 5.
The effect of an exogenous RGDS peptide on cell adhesion in the presence of canertinib and PHA665752. OVCAR-5 (A, B) and SKOV-3 (C, D) clusters were treated with 0.2 ng/mL (A, C) and 20 ng/mL (B, D) of GF in the presence of inhibitors including 20 or 40µM of acetate (Ace), RGES (ES), RGDS (DS), and a mixture of 3µM canertinib+1µM PHA665752 (combo). Data are expressed as means ± S.E.M. (n=3). Statistically significant differences in cell number are indicated as p<0.05 (*), p<0.01 (**), p<0.001 (***), and p<0.0001 (****) compared to the control or other concentrations.
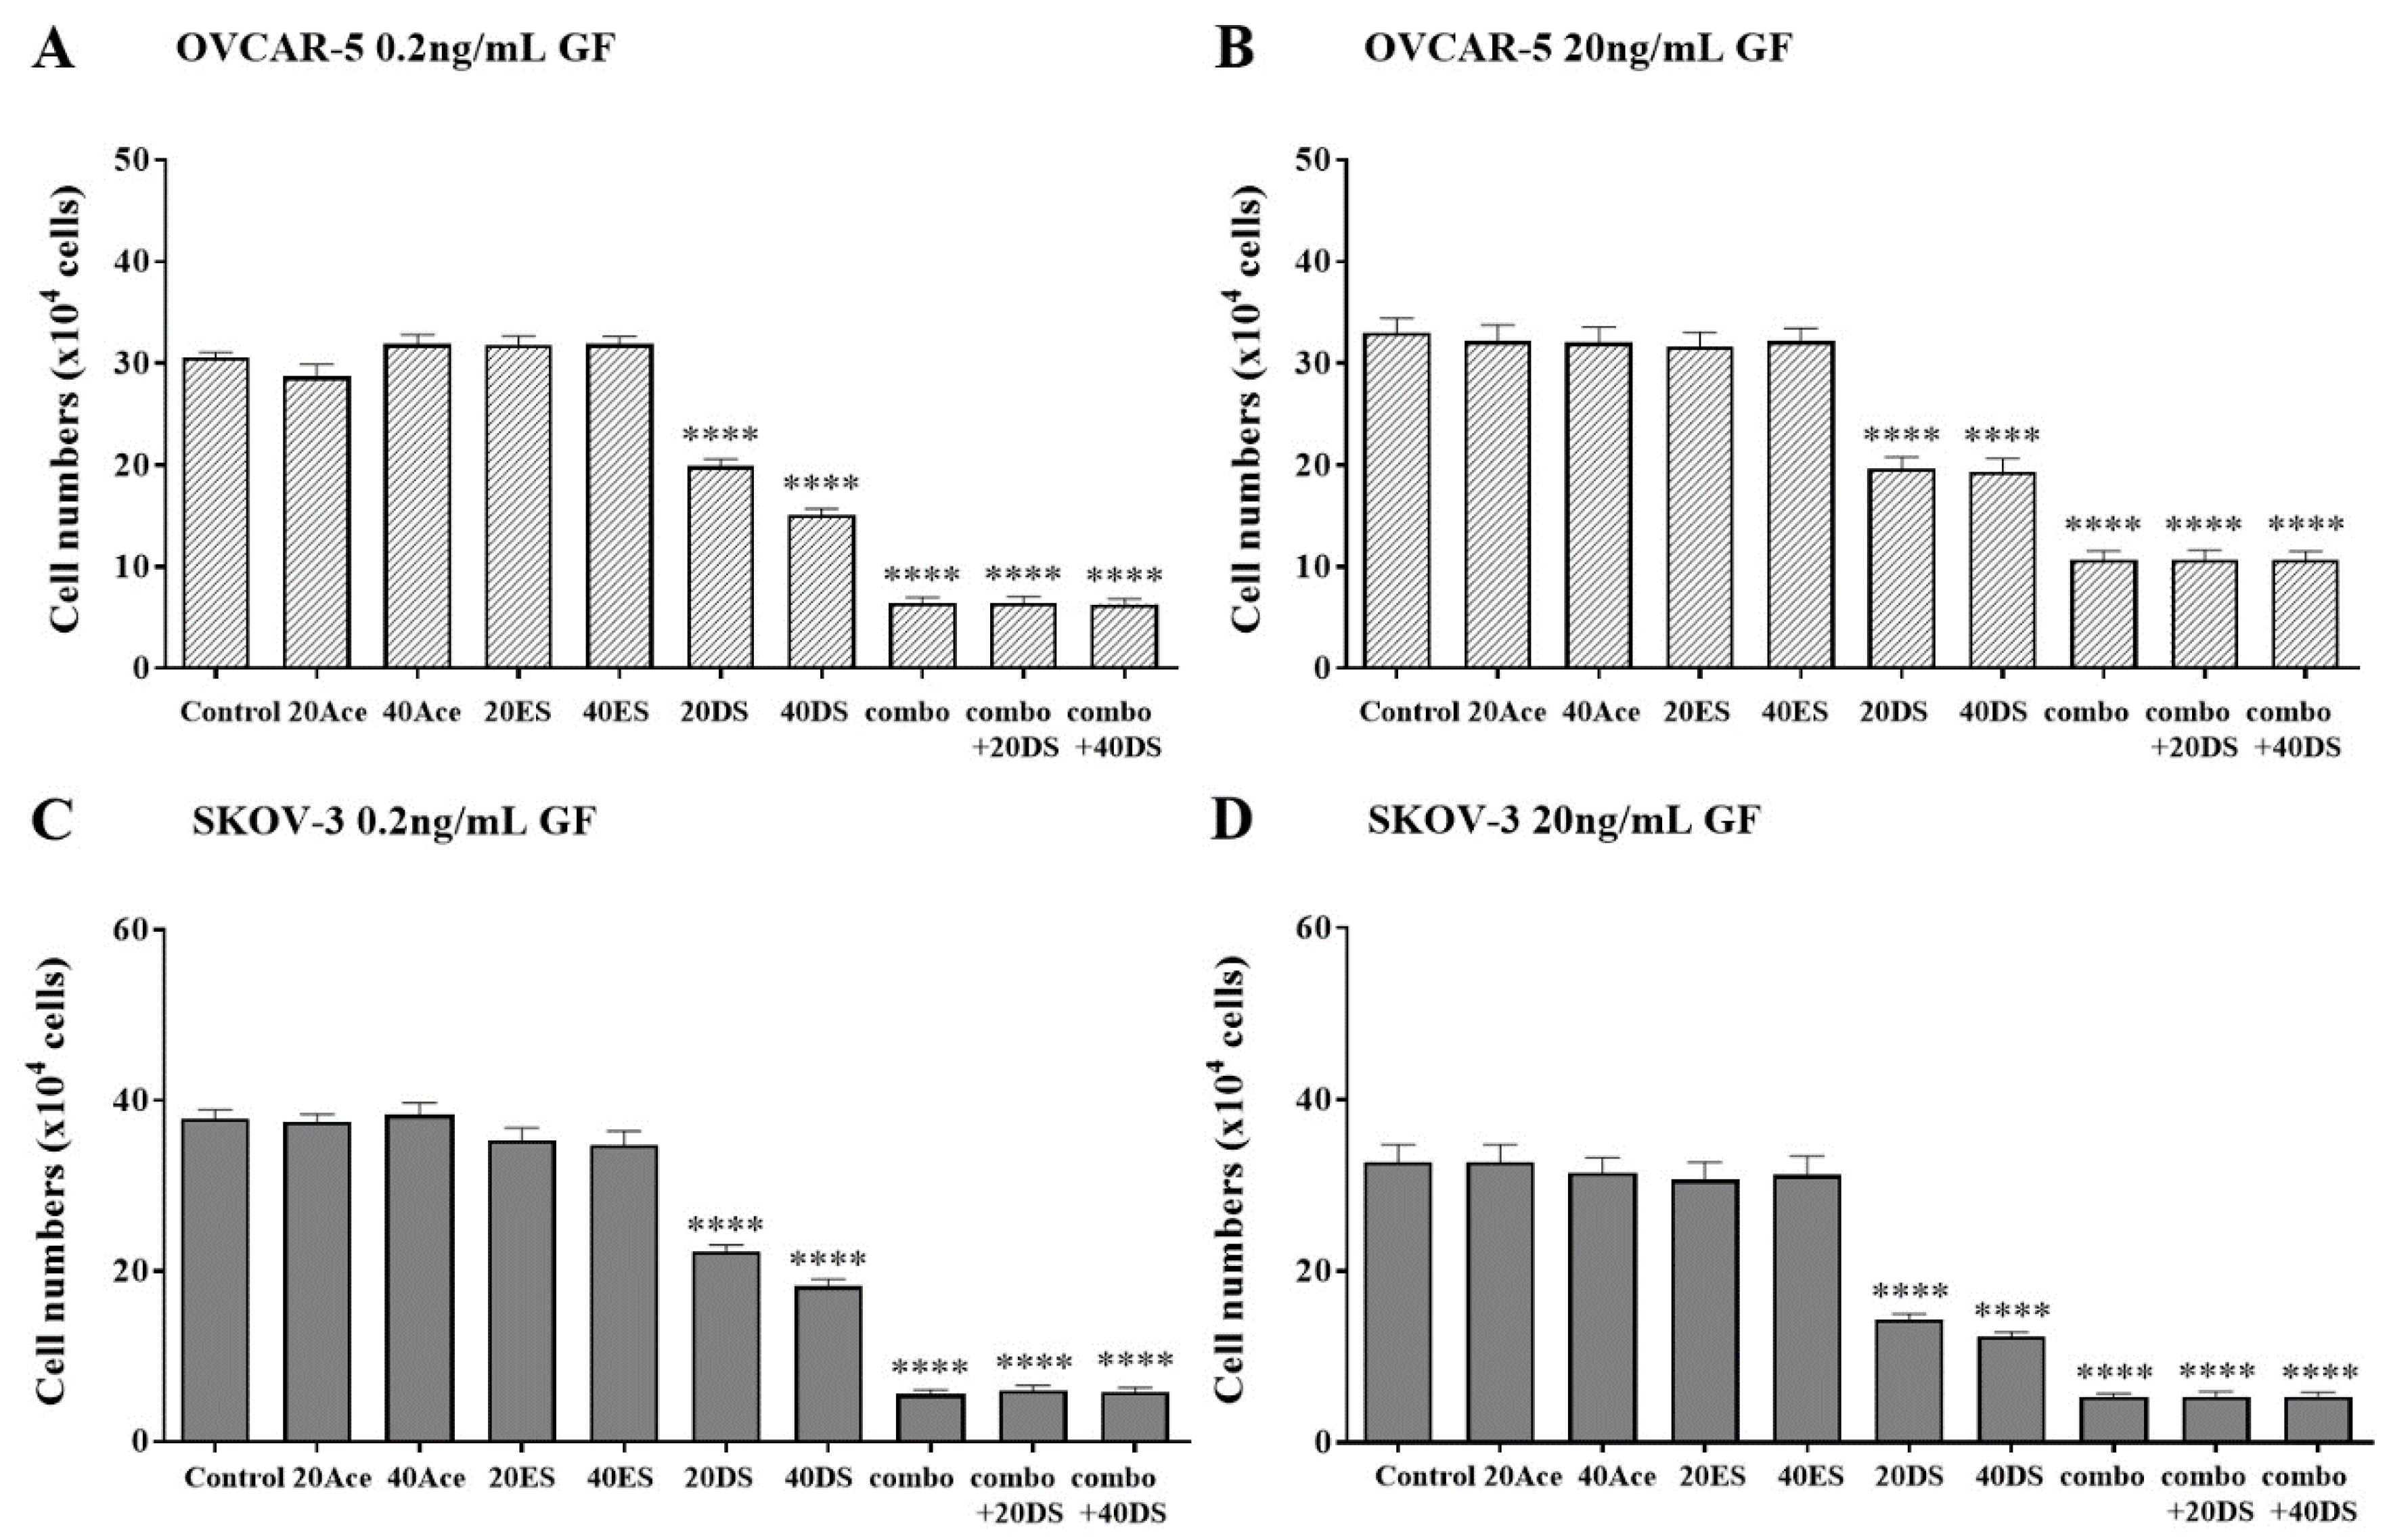
Figure 6.
Immunofluorescent images of the β4 integrin (red) and DNA (blue) of OVCAR-5 clusters and SKOV-3 aggregates after cells were treated by 3µM canertinib, 1µM PHA665752 and their combination. Cells were treated with inhibitors for four hr before conducting immunofluorescence.
Figure 6.
Immunofluorescent images of the β4 integrin (red) and DNA (blue) of OVCAR-5 clusters and SKOV-3 aggregates after cells were treated by 3µM canertinib, 1µM PHA665752 and their combination. Cells were treated with inhibitors for four hr before conducting immunofluorescence.
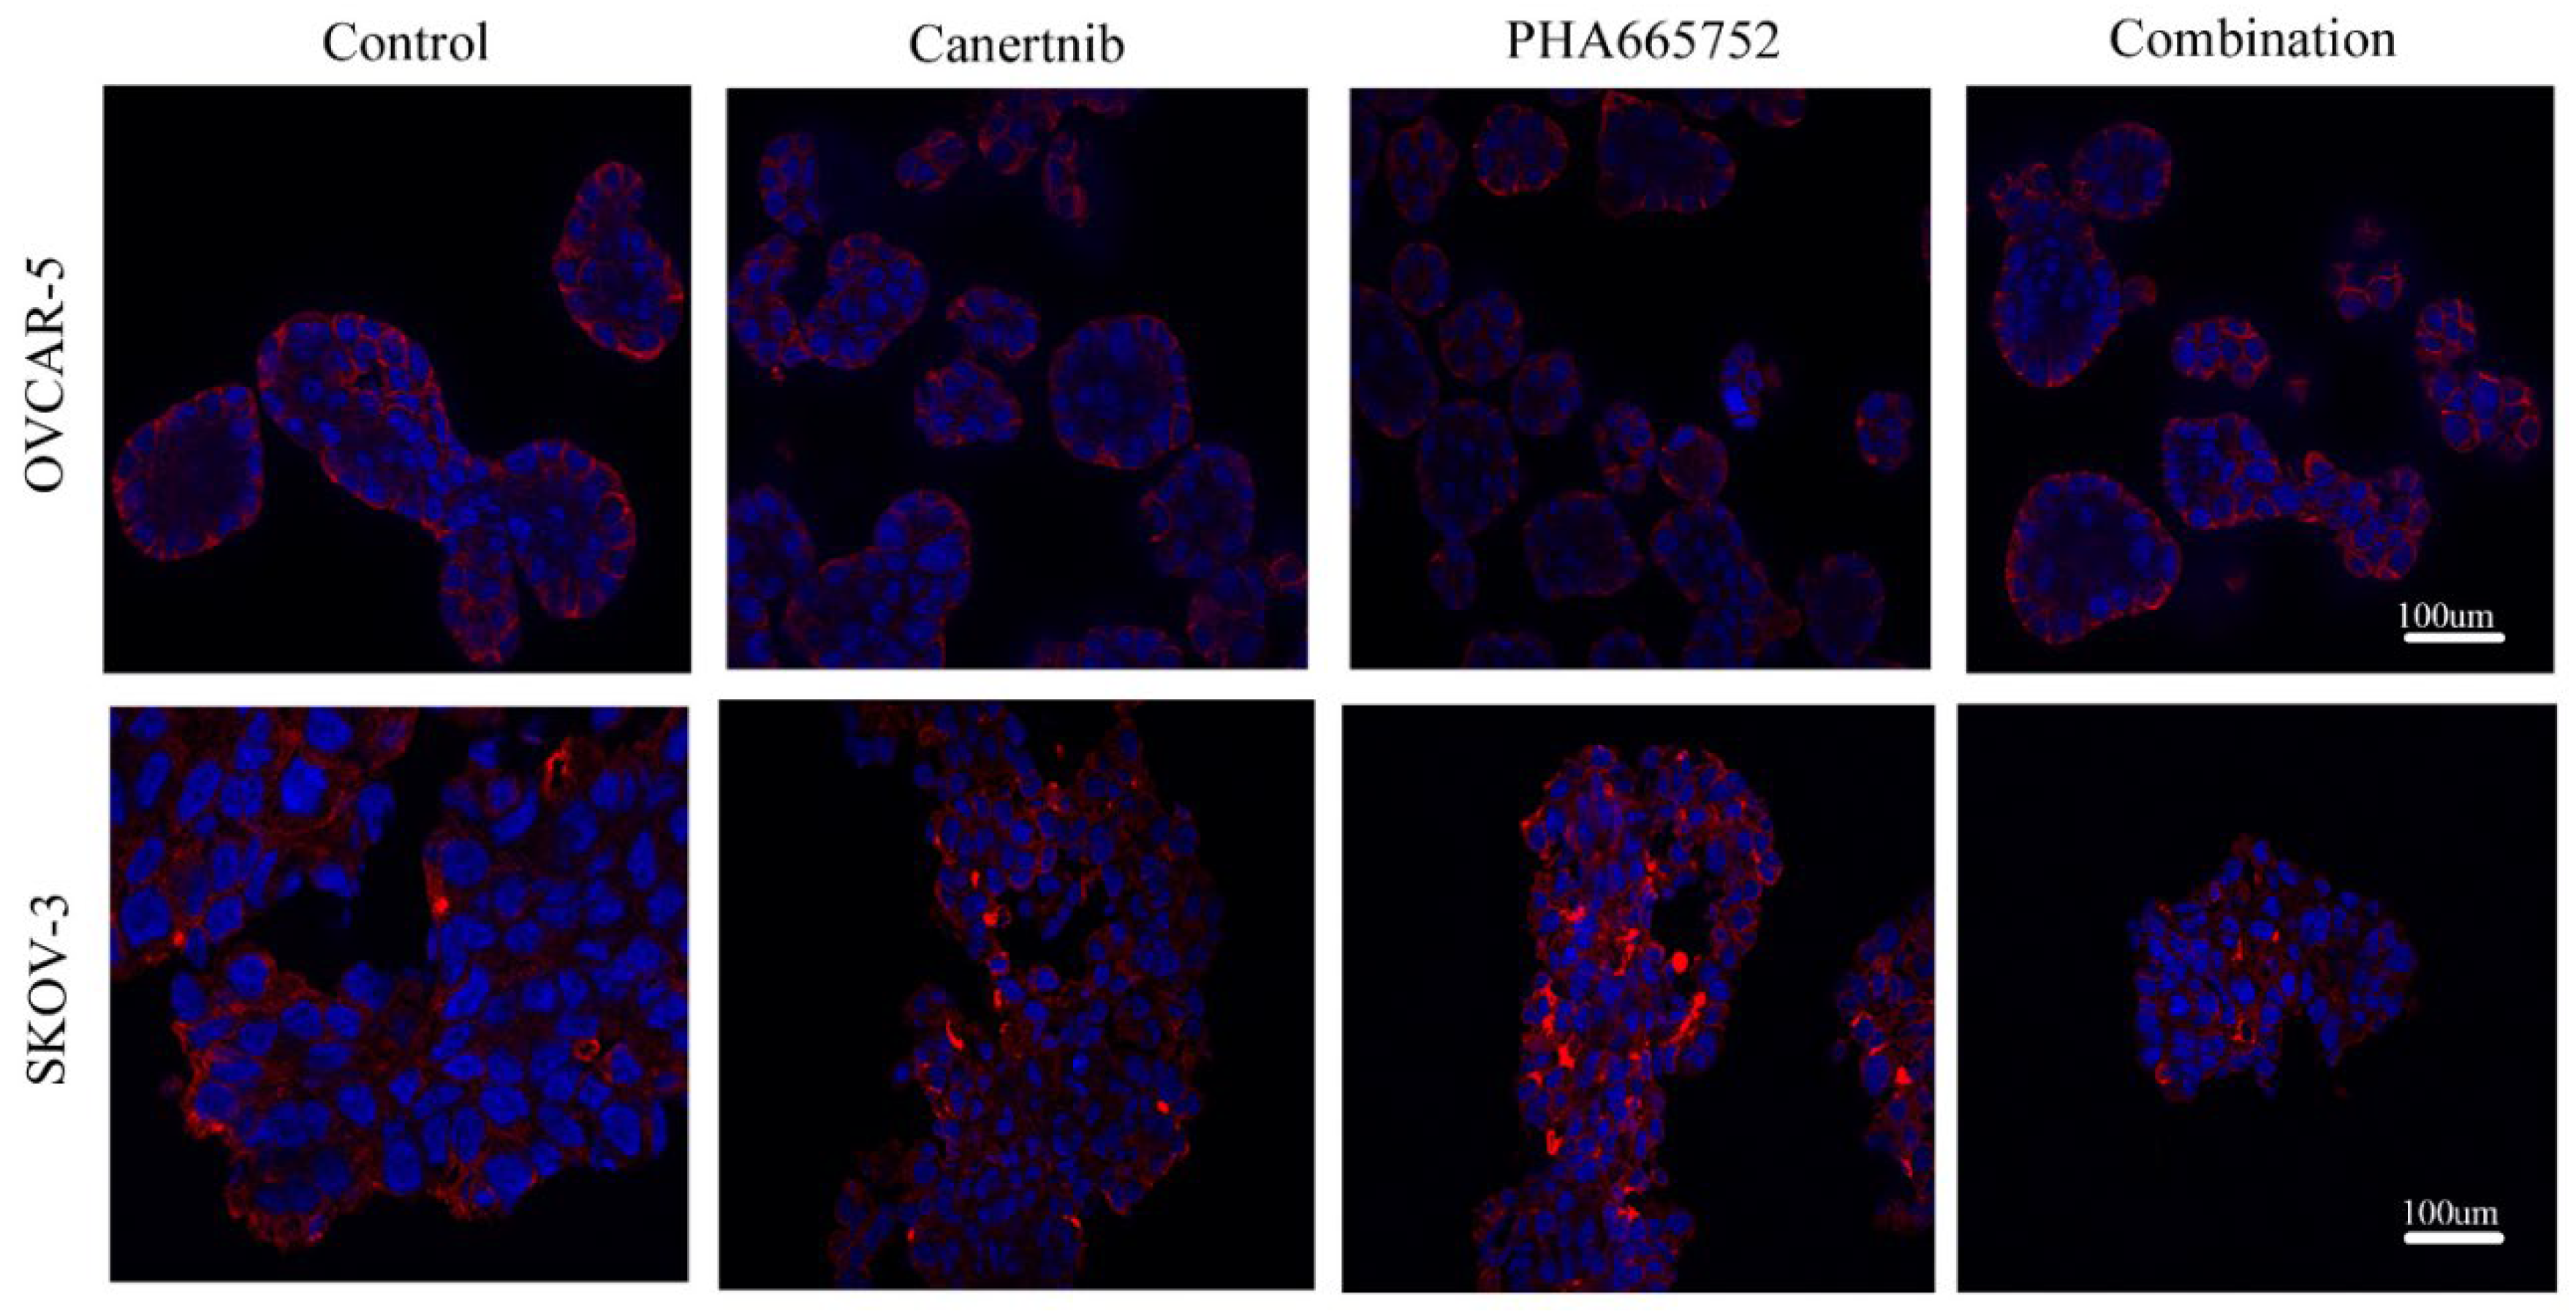
Figure 7.
Western blotting and densitometry indices of selective proteins from OVCAR-5 cell clusters after treatment with canertinib and PHA665752 alone and in combination in the presence of 0.2 (A, B, C, D, E) and 20 (F, G, H, I, J) ng/mL GF. The levels of p-EGFR (A, F), EGFR (B, G), p-MET (C, H), MET (D, I) and β4 integrin subunit (E, J) are representative of densitometry indices as mean ± SEM (n=9). Statistically significant differences are indicated as p<0.05 (*), p<0.01(**), p<0.001(***), and p<0.0001(****) compared to the control or the other concentrations. GAPDH was used as a house keeping protein.
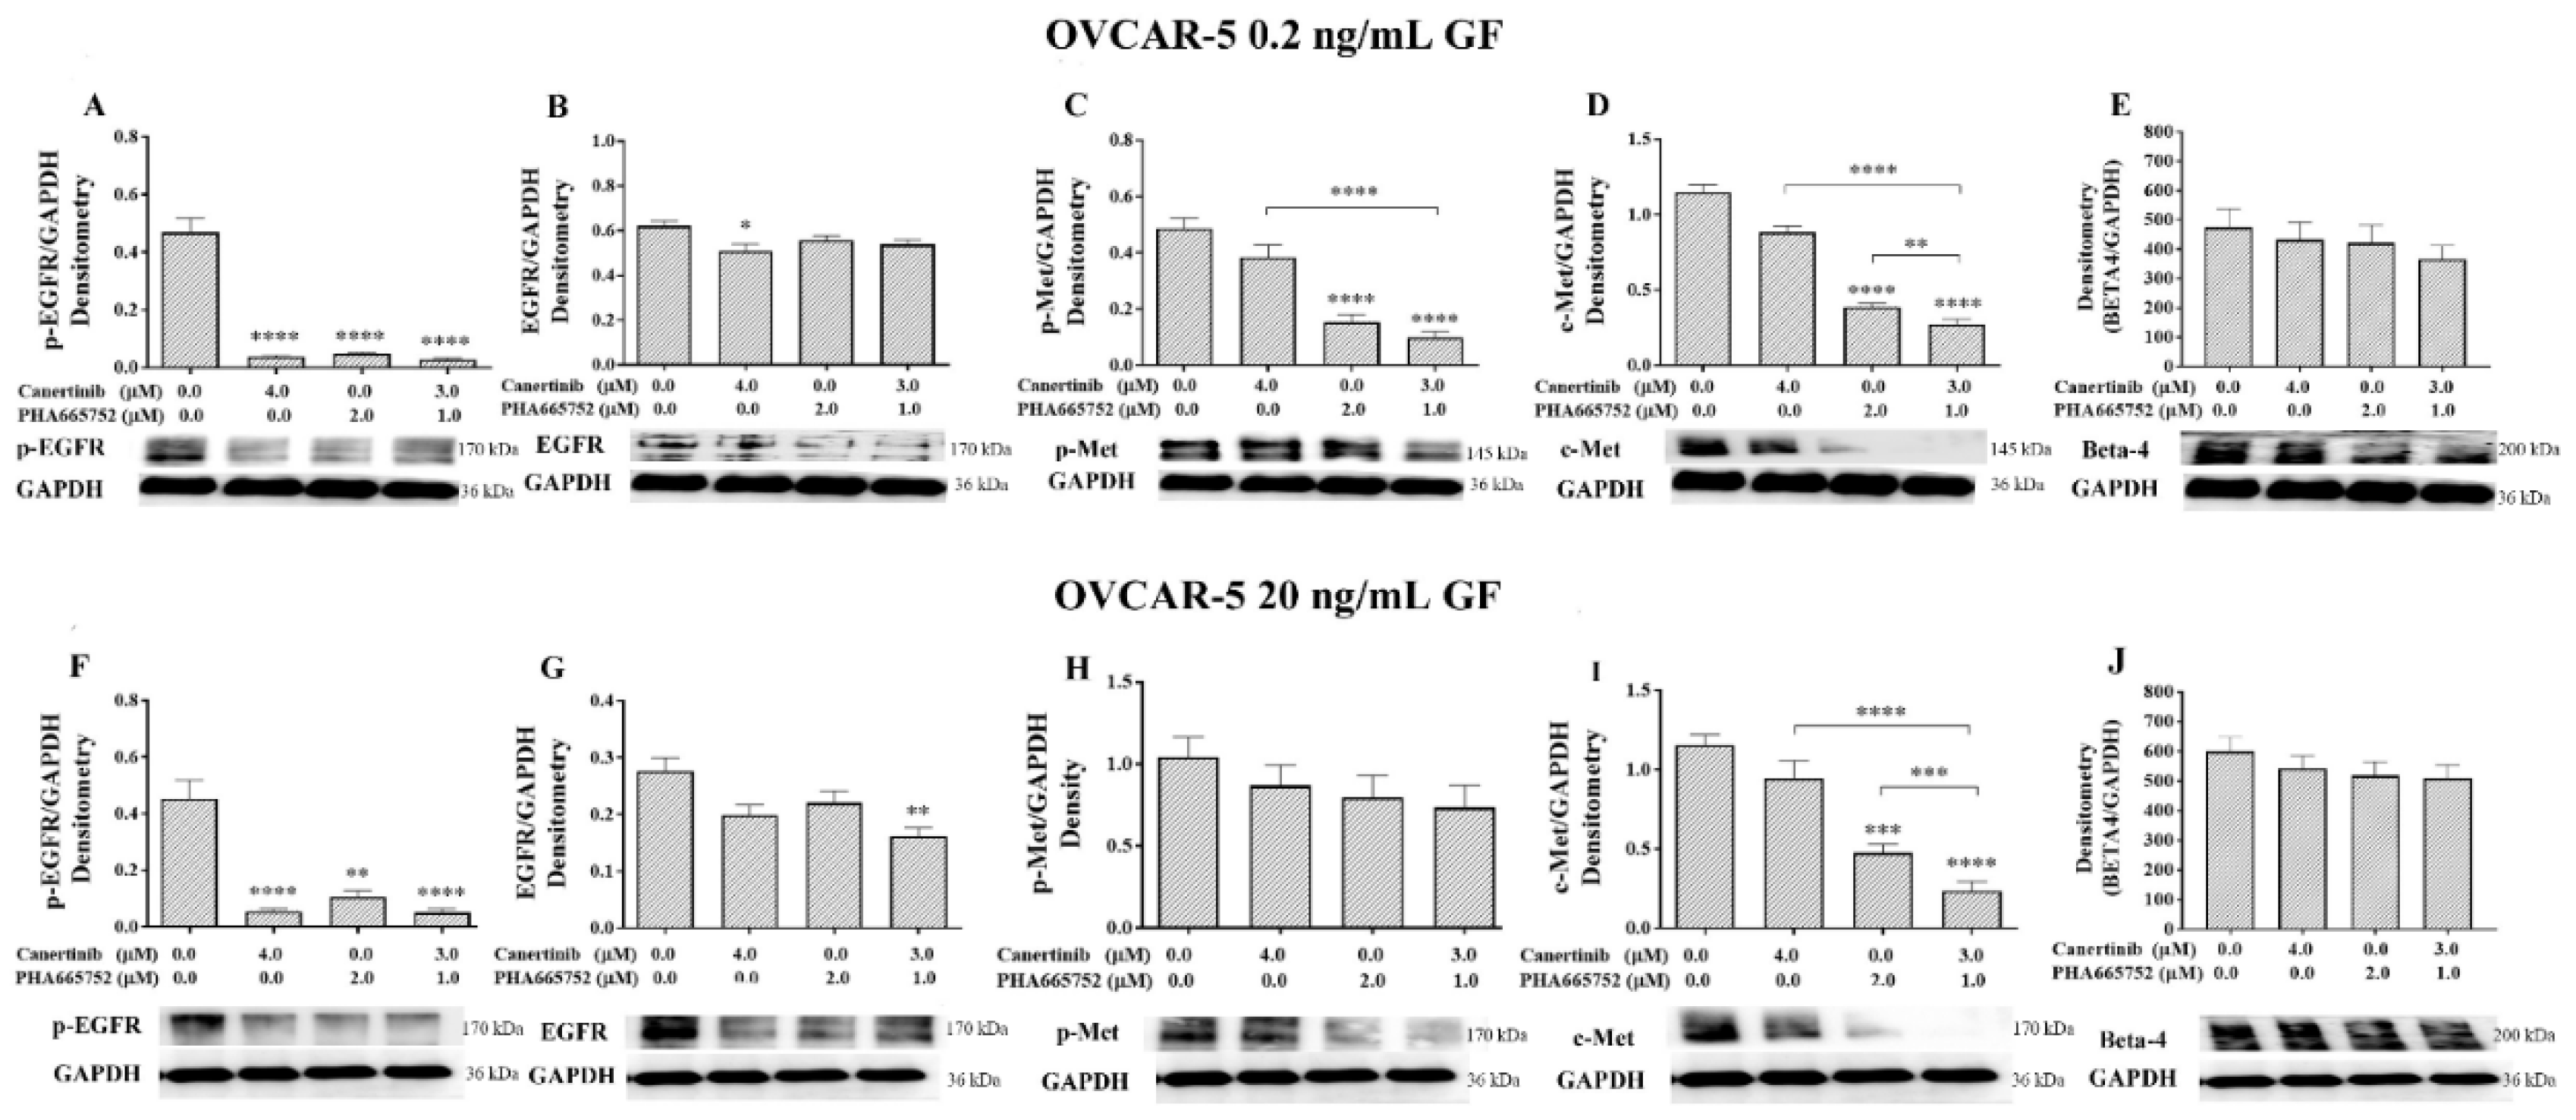
Figure 8.
Western blotting and densitometry indices of selective proteins of SKOV-3 cell clusters after treatment with canertinib and PHA665752 alone and in combination in the presence of 0.2 (A, B, C, D, E, F, G) and 20 (H, I, J, K, L, M, N) ng/mL GF. The levels of p-EGFR (A, H), EGFR (B, I), p-HER-2 (C, J), HER-2 (D, K), p-MET (E, L), MET (F, M) and β4 integrin subunit (G, N) are representative of densitometry indices as mean ± SEM (n=9). Statistically significant differences are indicated as p<0.05 (*), p<0.01(**), p<0.001(***), and p<0.0001(****) compared to the control or the other concentrations. GAPDH is used as a house keeping protein.
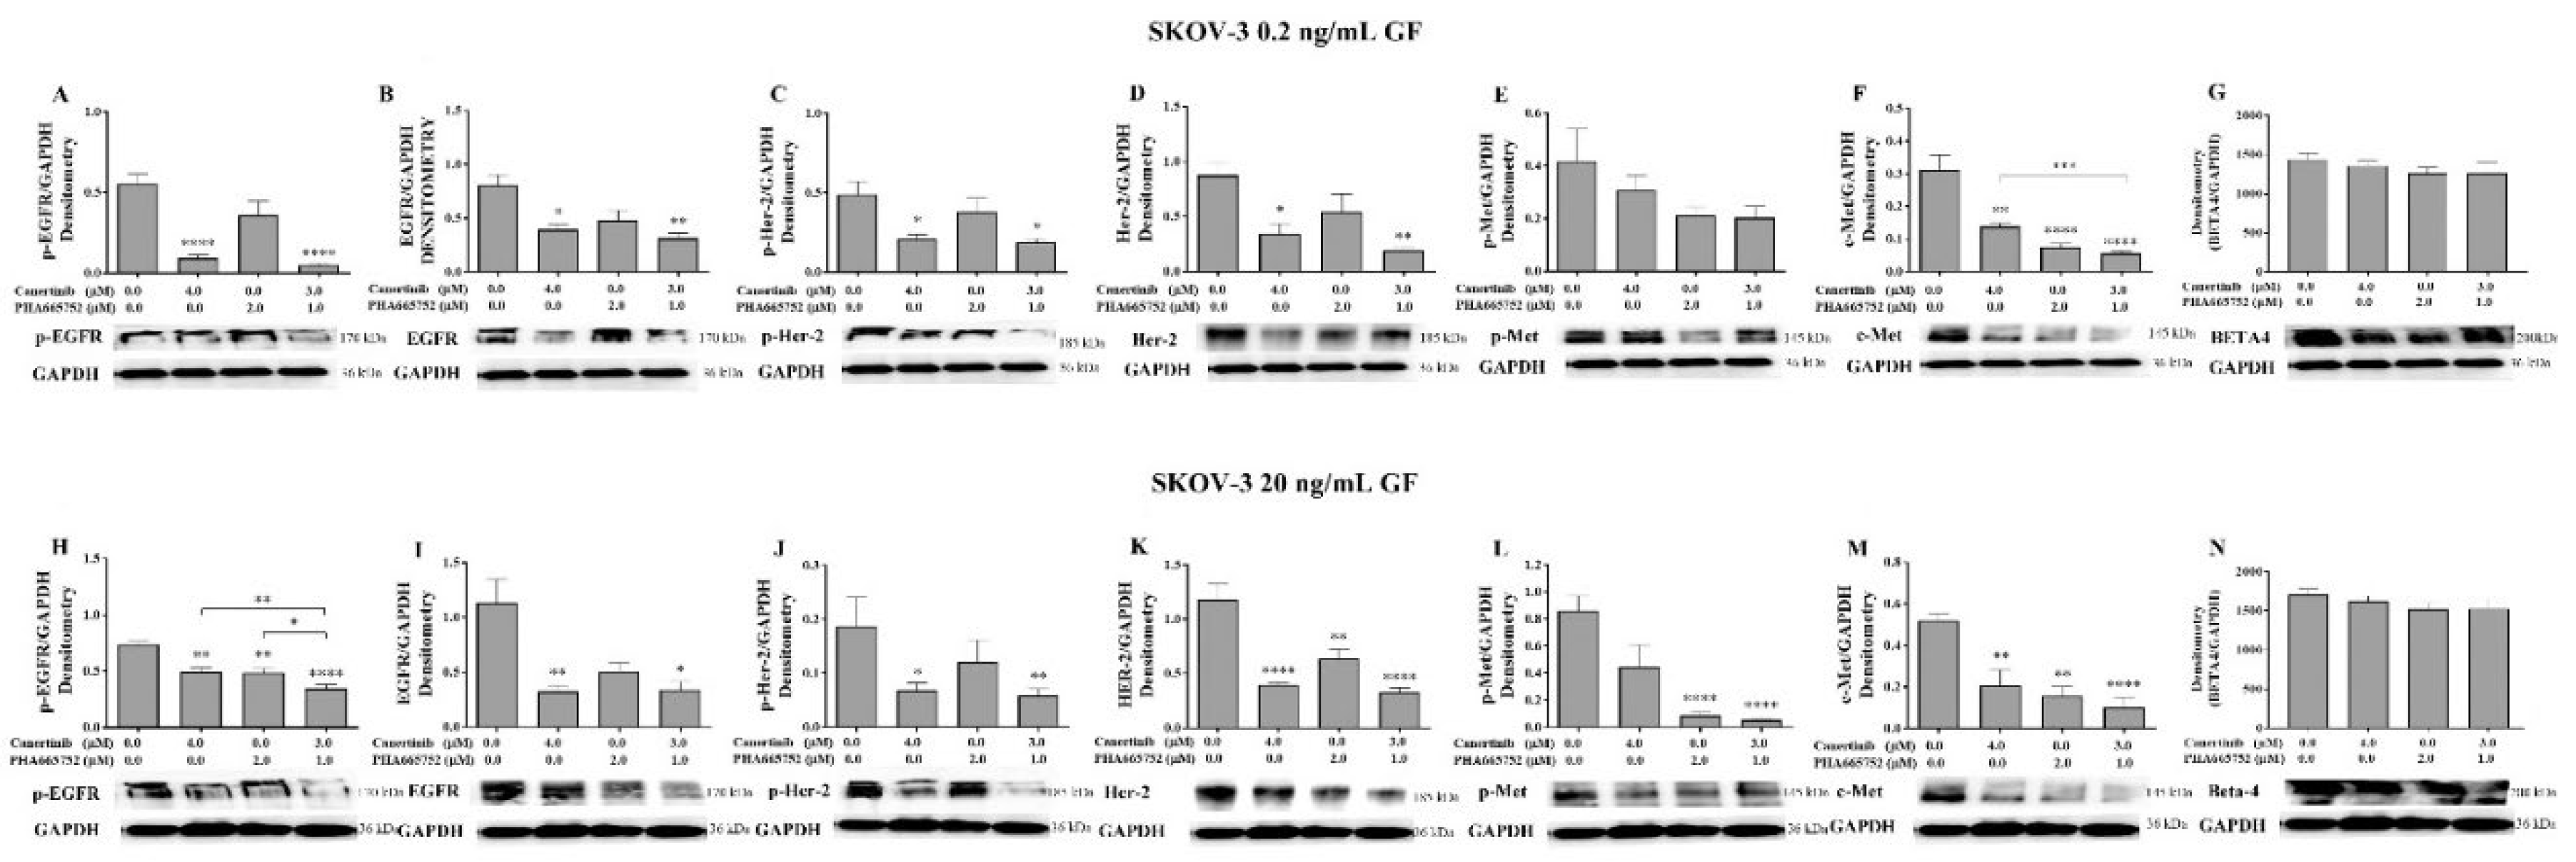
Figure 9.
Co-localisation and total fluorescent intensity of EGFR, HER-2 and β4 in OVCAR-5 and SKOV-3 cells after treatment with canertinib and PHA665752 alone and in combination in 20ng/mL GF. The co-localisation of EGFR/β4 in OVCAR-5 (A) and its total fluorescent intensity (D), co-localisation of EGFR/β4 in SKOV3 (B) and its total fluorescent intensity (E), co-localisation of HER-2/β4 in SKOV-3 (C), and its total fluorescent intensity (F). The total fluorescent intensity (peaks) of 80 (n=3) were randomly counted and pool to generate graphs (A, B, C). Statistically significant differences are indicated as p<0.05 (*), p<0.01(**), p<0.001(***), and p<0.0001(****) compared to the control or the other concentrations.
Disclaimer/Publisher’s Note: The statements, opinions and data contained in all publications are solely those of the individual author(s) and contributor(s) and not of MDPI and/or the editor(s). MDPI and/or the editor(s) disclaim responsibility for any injury to people or property resulting from any ideas, methods, instructions or products referred to in the content. |
© 2025 by the authors. Licensee MDPI, Basel, Switzerland. This article is an open access article distributed under the terms and conditions of the Creative Commons Attribution (CC BY) license (http://creativecommons.org/licenses/by/4.0/).
Copyright: This open access article is published under a Creative Commons CC BY 4.0 license, which permit the free download, distribution, and reuse, provided that the author and preprint are cited in any reuse.


