Submitted:
07 May 2025
Posted:
08 May 2025
You are already at the latest version
Abstract
In this research, an innovative design is set up for regular provision of precision agriculture services, within the framework of fertilization consultancy. The central node of the chain is a geographic information system (GIS), while a 5x5m point grid is the information carrier. Decision-making is supported by machine learning algorithms developed with training of the collected big data. Potential data sources include soil samples, satellite data, yield maps, and agronomic information; while the produced maps are directed to a commercial farm management information system (FMIS) for visualization and storage and -in parallel- to variable-rate technologies (VRT) for the applications. In a large degree, the process chain is automated with Python programming language. The service has been tested exhaustively under true field conditions before is has entered the market.
Keywords:
precision agriculture
; FMIS
; VRT
1. Introduction
Lately, precision agriculture gains significant ground over traditional farming practices. The global precision farming market size was estimated at USD 11.67 billion in 2024 and is anticipated to grow at a compound annual growth rate of 13.1% from 2025 to 2030. Especially with regard to the services segment, it is anticipated to have a compound annual growth rate of 15.7%; the software segment will grow over 15.5% during the same period [Grand View Research, 2024].
Precision agriculture (or precision farming) aims at providing spatial information enabling growers to make more precise management decisions [PrecisionAG, 2024]. For example, if nutrient variability within field parcels, along with variation in the physical properties of the soil, are properly detected, this will allow variable treatment applications, optimizing nutrient supply to the crops and maximizing yields. Field parcel segmentation takes place by matching zones within the field having particular requirements with different management treatments (Whelan & Taylor). In a simplified manner, Precision Agriculture is defined as the management practice that satisfies the needs of crops through differential applications in terms of location, time and processes [Karydas 2025].
Despite the optimistic perspective, however, there is still a serious delay in the adoption of precision agriculture services by the farmers throughout the world. Partially because much of the research on PA adoption evaluates technologies independently without considering how producers often pool complementary tools to create overarching PA systems. Failure to examine PA collectively provides an incomplete picture regarding the benefits of PA adoption [DeLay et al., 2022]. For example, Schimmelpfennig and Ebel (2016) have indicated that adopting VRT alone does not generate variable cost savings, but does if bundled with yield monitoring and soil mapping.
The ability of integrating complementary technologies, to improve productivity and input efficiency, however, is eliminated for potential adopters if not supported by dedicated service providers. The farmers alone do not have the necessary scientific and technical skills -and moreover, time availability- to carry out the above highly demanding data collection and analytical procedures. The Common Agricultural Policy of the European Union has indicated since long time now, the necessity for an ‘Advisory Service’ role in the agricultural chain [Labarthe and Beck, 2022].
Recently, two works have empowered the potential for an integrated process chain for precision agriculture service provision:
- Iatrou et al. (2021) introduced machine learning systems (MLS) in the prediction modelling for nitrogen topdressing fertilization in rice cultivation using big data collected from a variety of data sources.
- Karydas et al. (2023a) achieved to embed well-established crop-oriented precision fertilization modules in a pre-existing farm management information system (FMIS).
A process chain is a sequence of processes that wait in the background for an event; some of these processes trigger a separate event that can start other processes in turn [SAP 2025].
The main aim of this research was to set up a process chain, for regular provision of fertilization consultation services to farmers, within a precision agriculture framework for a variety of crops.
In order to meet the requirements for integrated complementary technologies and methods, the service was designed with a view to meet two principles:
Generality; meaning to be used under different farming conditions, data availability, technological restrictions, and agronomic limitations.
Flexibility; meaning to has the potential for changes, improvements, adaptation to new requirements and needs.
2. Study Area and Data Set
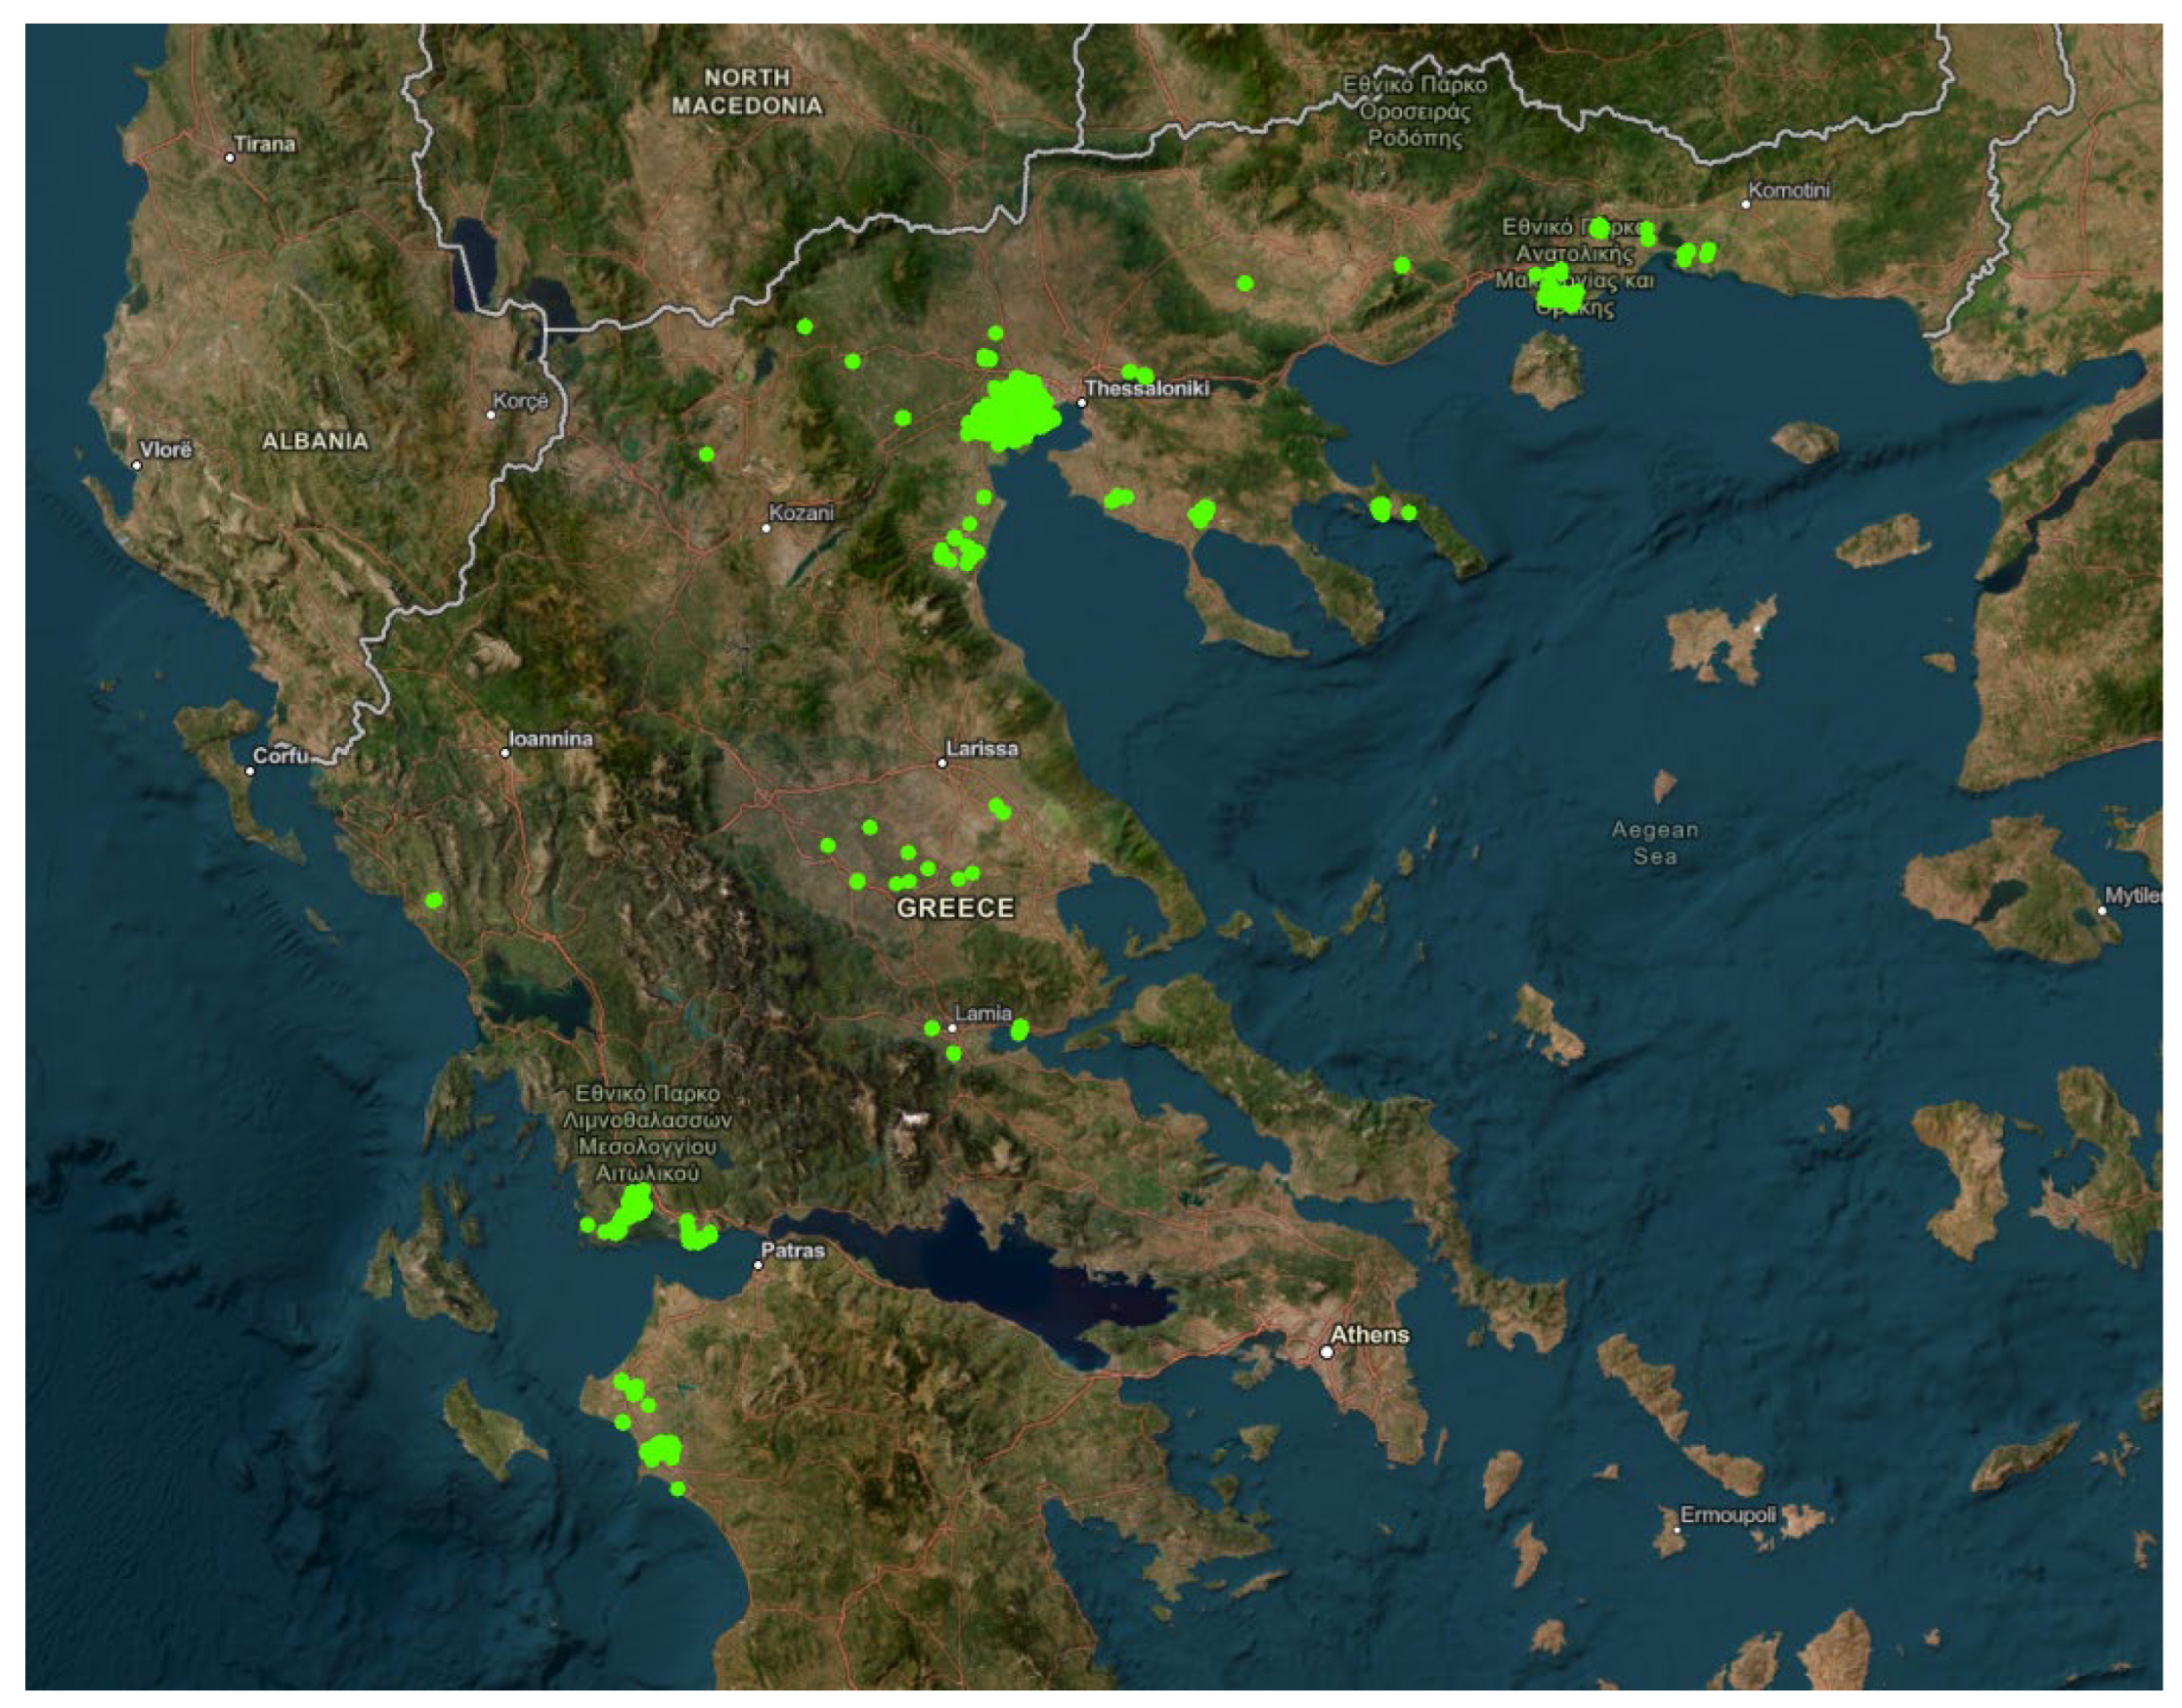
A total number of 1094 fields cultivated with nine different crops and covering an overall extent of 2.667 hectares throughout the mainland of Greece was collected gradually over a period of eight years (2016-2024) (Figure 1).
Most of the fields were rice paddies; rice is one of the most demanding and mechanized crops in the country. Other arable crops included cotton, maize, wheat, and tomatoes. The tree plantations included olives, cherries, and kiwis. Noticeable extents of vines for either wine or edible grapes were also included.
Figure 1.
Locations of the fields used for the setup of the precision agriculture service.
The data available for the development of the service process consisted of the following types:
- Agronomic data, including field boundaries, cultivars, seeding dates and planting years; provided by the farmers.
- Soil data, containing the full range of physical and chemical properties measured in samples with laboratory analysis.
- Satellite imagery, including optical and radar types, or spectral indices extracted from the optical data.
- Meteorological data, focusing on total monthly rainfall and mean monthly temperature from meteorological stations, and weather anomalies predicted from relevant models.
- Yield data, either collected from monitors mounted on harvesters (as in the case of rice cultivation), or with post-harvesting measurements of samples of the collected fruits, or estimated from images; yield is measured in kilogram or tones per hectare.
3. Methods
3.1. Overall
The central node of the service is a geographic information system (GIS). The ability of GIS to analyze and visualize agricultural environments and workflows has proved to be very beneficial to those involved in the farming industry. Balancing the inputs and outputs on a farm is fundamental to its success and profitability [Sood et al., 2015].
More specifically, the overall process chain consists of the following data or process hubs (Figure 2):
- A geographic information system (GIS), in the central role of data arrangement, ingestion, and process; it imports information from multiple sources, while it exports information to a farm management information system (FMIS) and to the variable-rate technologies (VRT) for the applications.
- A hub for soil and plant tissue data collection, comprising two nodes: the field survey teams for sample collection and the laboratory, where the samples are treated and analyzed.
- A hub for satellite image data collection, identical to a cloud platform, for downloading original or thematic values from earth observation imagers to preset point grid datasets.
- A hub for meteorological data collection, resulted from climatic models using satellite data enhanced with field data.
- A hub for yield data collection; it comprises the collection machinery, the data transfer, and the treatment within a GIS environment for data ingestion and analysis.
- A machine learning system (MLS) for big data analysis, comprising software, programming languages, and open-access mathematical libraries, especially for developing and enhancing prediction models for crop fertilization.
- A farm management information system (FMIS), as the farmers’ interface; used to collect, store and organize original farmers data (including LPIS data), provide agronomic data to the GIS, and visualize output map data.
- The available VRT systems, operated by the farmers. Each of these machines is the final receiver of the application maps.
Figure 2.
The overall technological arrangement of the service, with its data and process components; the satellite data icon corresponds both to image and meteorological data; the arrow from FMIS towards GIS corresponds to farmers’ agronomic data.
Figure 2.
The overall technological arrangement of the service, with its data and process components; the satellite data icon corresponds both to image and meteorological data; the arrow from FMIS towards GIS corresponds to farmers’ agronomic data.

Three distinct sub-processes can be recognized in the overall process setup; specifically:
- A Consultancy sub-process, dedicated to produce the fertilizer application maps, by running the prediction models per crop and growth stage (e.g., broadcasting, topdressing, etc.). This process associates GIS, MLS, and all the input data hubs (soil, satellite, yield, agronomic, etc.) into a data ingestion and analysis entity (denoted hereafter as ’shell’).
- A Communication sub-process, dedicated to store and visualize the map data, through an appropriate cloud-based platform, for the farmers. This process is realized between the GIS and the distinct extra modules developed and embedded on the FMIS system, in order to support the service .
- An Application sub-process, dedicated to transfer the application maps to the implementation machinery (e.g. VRT), through the appropriate data structure formats. This service is associated with the required equipment and potential solutions provided by the farmer’s side.
- The Consultancy process can be considered as an internal process, in terms of taking place within the data ingestion and analysis framework (denoted as ’shell’); whereas the Communication and Application processes as external ones, provided that they are associated with access and use of the outputs by the users. The overall process is described with a clear, integrated, and easy-to-follow service protocol.
3.2. The Geographic Information System (GIS)
The central node of the service process chain is a geographic information system (GIS), which by default incorporates people (specialists, analysts, citizens, etc.); people are still necessary -and will be for many years more. A GIS is necessary for the activities described below:
- Data collection, transformation, and analysis of all data types and origin (historic data, remote sensing, field surveys, machinery, sensors, cloud, etc).
- Soil sampling design and preliminary zone delineation, according to detected variability in remote sensing or yield data.
- Ingestion of data from different sources, including reprojection, geometry repair, merging, unit conversions, filtering, cleansing, and calibration.
- Adaptation to farmer requirements and limitations, such as extraction of particular spectral indices, alternatives if not available machinery, etc.
- Scaling up and integration of data from different farmers, for conducting studies on soil sustainability or yield performance and profitability in an entire area.
A 5x5m point grid was created with the command ‘Create Fishnet’, as the information carrier of the service; thus, the spatial resolution of the service is set to 5 meters. The service resolution can change easily by creating a new grid at any other resolution. However, a 5-meter cell size for all data layers was found necessary and efficient for precision agriculture applications for the majority of farming practices; except obviously the applications functioning strictly at the plant scale, e.g., spraying on a plant or leaf scale.
The CSV file format was opted for data analysis with machine learning systems and exchange using the farmer interface. The possibility of unlimited volume data in a CSV file is a critical advantage for big data analysis, as is also data visualization and storage in farm management platforms.
For the establishment and hosting of the geodatabase, as well as the support of the methodological tasks, ArcGIS Pro was selected as the main GIS tool. ArcGIS is a package particularly friendly, especially with regard to raster data management.
However, several tasks were found either easier or even necessary to carry out in QGIS, which is an open and free of charge full GIS software. QGIS is proven to manipulate KML format better, which is required by the service standards. In addition to that, QGIS was found necessary in cases where a specific command was not licensed by the commercial software available.
3.3. Soil and Plant Tissue Data
According to the underlying methodology of the service, soil is mapped from samples extracted in situ with an appropriate for every case sampling scheme. Usually, at the first attempts to map a field, the stratified sampling scheme is adopted; the field is divided into zones according to object-based classified satellite images, acquired from previous seasons. In the later stages of field monitoring and servicing, regular grid sampling was adopted, in order to complement -and thus intensify- the original sampling network.
The soil extraction surveys were conducted or monitored by the service team itself, as soil information is considered to be highly critical for fertilization consultancy at all growth stages. Similarly, the soil samples were transferred and analyzed only in well-trusted laboratories.
A total number 2333 soil samples were extracted and eighteen properties were measured in almost every soil sample, from which surface maps were then created for each of the properties.
Similarly, plant laboratory analyses were conducted occasionally and experimentally to complement the soil data, as they provide critical information on nutrient uptake; i.e., information which cannot be extracted from soil samples alone. However, a serious drawback of plant tissue analysis is the delay in getting the results, thus rendering these results quite outdated.
3.4. Earth Observation Imagery
Earth observation imagery, either satellite or air-born, was used for a twofold purpose:
- Delineation of preliminary zones for soil sampling design with object-based classification.
- Regular plant growth monitoring with the extraction of appropriate spectral indices; this method replaced plant tissue analysis.
For the former purpose, imagery may be of any origin provided a resolution better than 20 meters. This resolution is determined by the fact that agricultural machinery for fertilization functions usually on about 20 meters or more.
For the latter purpose, the freely and regularly available Sentinel-2 imagery provides an ideal data source.
For downloading satellite image data, the Google Earth Engine (GEE) was selected as an appropriate cloud-based system.
Two scripts have been written by our developing team, one for optical and one for SAR data, either original or processed; these scripts are required to be fed with two vector files (the so called ‘legacy assets’) for every application:
- A point shapefile, which represents the 5x5m grid, containing only a key-field, namely ’id’; and
- A polygon shapefile for the grid-containing region
- The above files must be entered in the scripts for allocating where exactly the data values will be assigned:
var region = ee.FeatureCollection(’...’)
var points = ee.FeatureCollection(’...’)
In parallel, the period of interest is set, in terms of starting and ending dates of the satellite data recordings, accordingly in the same scripts:
var startDate = ’YYYY-MM-DD’
var endDate = ’YYYY-MM-DD’
3.5. Meteorological Data
For the meteorological records, the Hellenic National Meteorological Service, was selected as an appropriate source, from which the required recorded climatic data are downloaded:
Seasonal forecast anomalies can be found and downloaded from the COPERNICUS hub:
The options in the COPERNICUS system will be the following [ERA5-Land, 2025], respectively:
- ECMWF
- 51
- 2m temperature anomaly
- Ensemble: Mean
- [Month]
- 1,2,3,4
- [boundaries in degrees]
- NetCDF (experimental)
The data are exported in NetCDF format and are inserted to the geodatabase accordingly, by applying the function in ArcGIS: Make NetCDF Raster layer and the following options:
- Extract point values from raster
- Variable: t2a
- Band dimension: time
3.6. Yield Data
Yield data provide valuable information for estimating the amount of nutrients removed by the harvested crop, estimating profitability, delineating preliminary management zones for the next year, and analyzing the effect of specific fertilization treatments [Fulton et al. 2019].
Yield data may be collected either with yield monitors, sampled with in situ collection, or estimated from earth observation imagery. Yield monitors are found usually in extended crops; however, in other crops, such as tree plantations, vines, or vegetables are not widespread yet .
In all cases, the yield data sub-process consists of three distinct steps:
- Data collection, including recording in the field, transferring to the in-house process hub, insertion to the process system, and file structuring (e.g., recognition of attributes, unit conversions, etc.).
- Data ingestion, including reprojection and geometry repair (when sourced from yield monitors), merging (when from different sources), homogenization (matching common properties, common unit assignment, etc.), filtering (e.g., excluding values affected from unknown factors), cleansing (excluding abnormal values), and calibration (matching with reliable in-situ measurements).
- Data analysis, including descriptive statistics, correlation analysis (to other data types), and spatial auto-correlation (for spatial pattern recognition and possible zone delineation).
3.7. Machine Learning Systems
The analytical core of the service consists of different models, developed to support consultancy in crop fertilization. These models, from hereafter, ’F-models’, have been developed using machine learning systems (MLS) with big data, collected from true farms (i.e., non-experimental) gradually over the years.
Machine learning is a branch of artificial intelligence (AI), focused on building applications that learn from data and experience, thus improving their accuracy in decision-making capability over time. Machine learning algorithms are trained to find patterns and features in massive amounts of data to make decisions and predictions based on new data [Chlingaryan et al. 2018].
Given the very fine functional resolution of the service (i.e., 25 square meters), the input datasets comprised from very early, millions of records. Considering that in a 1-hectare cultivated extent, 400 surface units are contained, a total number of about 40 parameters attributing for F-models training, results in 16*103 records/hectare. Thus, for a series of 4 years and a total surface of about 300 hectares every year on average, the processed records reach about 20 million.
3.8. Farm Management Information System
Here, a commercial FMIS platform, namely ifarma, was selected as an appropriate computer environment for the exchange and communication of data with the farmers. Farm Management Information Systems (FMIS) are tools based on Information Communication Technology (ICT) for the decision support of farmers with regard to their farm operations [Fountas et al. 2015a].
The main service of the ifarma is Farm Entities management. The software is able to handle multiple farms where all assets such as crops, fields, tasks, and inputs belong to. The data model of ifarma integrates all information relevant to farm: fields and land parcels, crops, farming activities on fields and inputs and resources used to plan and execute theses activities. The data model organizes the information in a hierarchical manner, where farm is at the top level [Paraforos et al., 2017].
The current service has been embedded into ifarma FMIS as discrete modules, operating autonomously. At the same time, the user has the possibility to take advantage of the overall facilities provided by ifarma [Karydas et al., 2023a].
3.9. Variable-Rate Technologies
Four different types of Variable-Rate Technologies were used by eight farmers for the application of the fertilization maps over the years. The rest of the applications were manual.
Variable rate technology (VRT) is one of the pillars of precision agriculture, through which farmers vary the application rates of inputs to maximize crop output and minimize resource waste. When rates are provided by a preliminary generated prescription map -likewise in this research-, the method is called map-based [Fountas et al. 2015b].
Each of the VRT systems, however, employed in this research has shown several particularities with regard to importing the original application maps created with the service’s GIS environment; thus, their transformation to the appropriate standards required by the system was not always easy -in some cases, scripting was necessary. The particularities may concern the name or the arrangement of the attributes, the name and arrangement of the files and the containing folders, as well as the projection and coordinate system.
In most cases, the vendors of the machinery were not in position to support the above procedures in order to carry out smooth applications; rather the inverse. Thus, interoperability issues were the most serious technological obstacles in VRT applications.
4. Results and Discussion
4.1. Service History
The service started being developed in 2016 originally for rice cultivation, in a field complex of about 97 hectares owned by a single farmer. That first year, within-field heterogeneity was detected using RapidEye satellite imagery from the previous year (2015) acquired on three dates during the growing season, while some drone images supported further delineation [Karydas et al. 2020a]. Then, a soil survey was conducted, following the spatial patterns of the detected heterogeneity.
The fertilization recipes of 2016 were prepared from soil analysis results, using a commercial software. However, the application zones were simplified into rectangles, approximating the preliminary zone delineation, with the mean zone size at 1.38 hectares. The applications were made manually, as there were no VRT systems available by the farmer at the time.
This first intervention was dedicated to recognize and correct long-term soil management problems, such as toxic concentrations of Phosphorus in some zones, or resilient patches of weed infestations. This phase can be characterized as experimental.
The second year (2017) the farmer proceeded with the full mechanization of the cultivation, by introducing VRT machinery for precision applications and a yield monitor for the harvesting. The cultivated extent increased to 111 hectares and the zones became a little more complicated. The mean zone size was now 1.33 hectares. The collection of leaf samples in the two first years, supported selection of appropriate spectral indices for monitoring rice cultivation with satellite imagery. This phase can be characterized as preparatory.
In 2018, the service was trusted by many rice growers in four distinct rice growing plains in Greece, namely Axios river plain, Nestos river plain, Acheloos river plain, and Evinos river plain. A total of 1119 hectares were then served by the fertilization recipes prepared for every single field. The recipes were provided to the farmers as KML files on the Google Earth application, together with similar files for field boundaries and soil samples. The mean zone size dropped now to 0.95 hectares assisted by the fact that Sentinel-2 imagery was introduced systematically in zone delineation [Iatrou et al., 2018].
This phase opened up the commercialization of the service. However, most of the farmers followed manual applications of the recipes, as they did not have VRT machines available at the time. For the same reason, many of these farmers interrupted the use of the service in the following years. An important asset of the expansion, however, was the massive collection of soil data from Axios river plain -the most productive rice-growing area in Europe-, thus scaling up precision agriculture understandings with regard to soil fertility [Aschonitis et al., 2019].
In the period 2019-2020, precision applications were expanded to other arable crops, such as cotton and maize, and permanent crops, such as olives, cherries, and vines. The zone delineation method remained polygon-based, still following the original site-specific soil sampling design [Karydas at al., 2020b].
In 2021, the zone delineation method changed from polygon-based to a grid-based one; a 30-m point grid was selected now as information carrier. This resolution was in accordance to an average application width of the agricultural machinery, such as VRT fertilizers and yield monitors. At the stage of application map creation, the points are classified according to the fertilizer values, are converted to unit polygons, and then dissolved according to their classes to form new polygons for the VRT terminals.
The sift from polygons to points allowed the significant increase in data volume, which in turn allowed the introduction of machine learning systems (MLS) in the prediction modelling for the estimation of the optimum fertilizer amounts, especially for nitrogen topdressing fertilization. New tools were then necessary for big data collection and manipulation, such as cloud-based platforms, programming languages, and machine learning libraries [Iatrou et al., 2021].
In 2022, a significant step towards bridging our service with farm management, with the introduction of a farm management system into play. In practice, our service was developed as different modules on a farm management information system (FMIS), thus offering a cloud-based solution for storing, listing, and visualizing a series of data and information in tabular or mapping form [Karydas et al., 2023a].
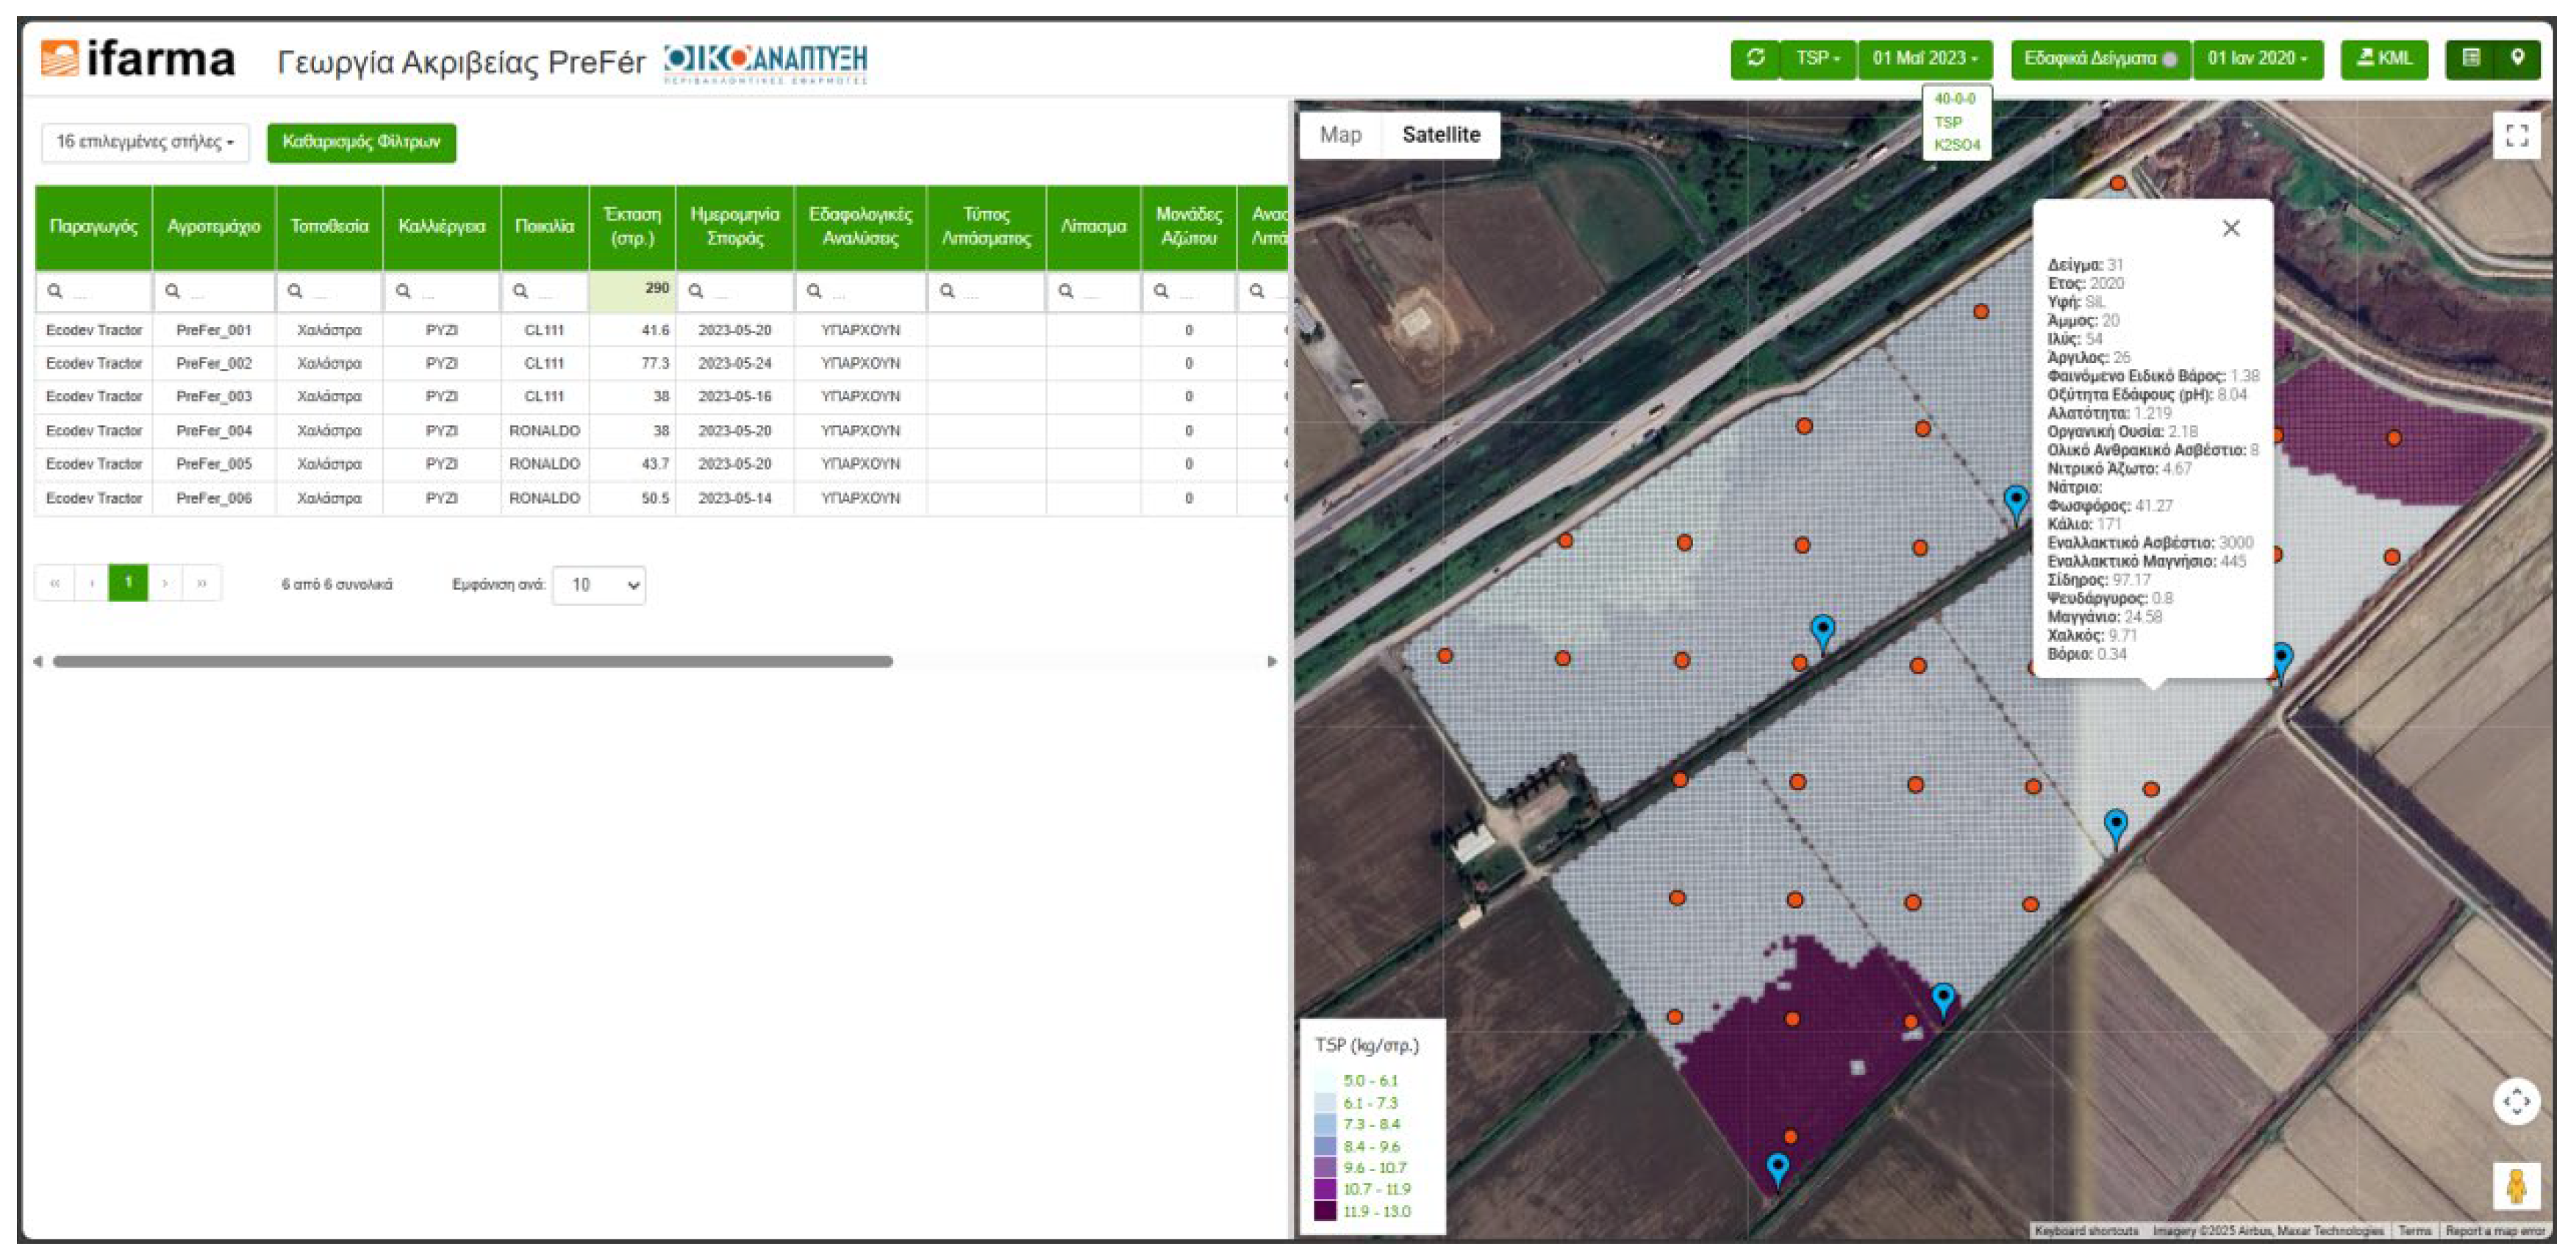
The latter evolution allowed the visualization of imagery data in layers (thus, simulating a GIS mapping environment), which further dictated enhancement of the mapping resolution. As a result, a new point grid of 5 meters was selected now as the information carrier of the service (Figure 3).
Figure 3.
The mapping environment of PreFer service embedded in the ifarma application (a fertilizer application map with the soil samples overlaid, in the example).
Figure 3.
The mapping environment of PreFer service embedded in the ifarma application (a fertilizer application map with the soil samples overlaid, in the example).
Since then, no other fundamental changes have taken place in the structure and interface of the service provision, except the annual improvement of the fertilization prediction models with new data every year [Iatrou et al., 2022]. Also, there is a continuous care for enhancing the interface, according to feedback by the farmers and other interested parties.
In the period 2023-24, the service has now evolved into three distinct modules, namely ‘PreFer’, ‘Opora’, and ‘Premno’, for arable crops, tree plantations, and vines, respectively. Finally, an extra module fitting with all the other three modules has been added, for mapping profitability of the applications, namely ‘ProFit’. This module allows for the creation of maps similar to the yield maps, which though indicate in monetary units the profit extracted from every pixel of the cultivated surfaces [Karydas et al., 2023b].
An summary on the evolution of the service is given in Table 1.
4.2. Service Protocol
The standardization of the service process chain dictated the compilation of a clear and strict protocol, which comprises distinct descriptors for each of the various sub-processes and concepts.
In an information retrieval system, a descriptor is a word or a characteristic feature used to identify an item (as a subject or document) [Cambridge University Press & Assessment, 2025]. An Information Retrieval System (IRS) is designed to help users search, retrieve, and rank relevant data from large datasets; these systems are widely used in enterprise solutions, among others [ML Journey, 2025].
A number of 24 protocol descriptors comprises the entire protocol; specifically:
- Nine (9) descriptors related to GIS processes, specifically: symbols, formats, parcel layers, grid layers, soil layers, nutrient layers, fertilizer layers, VRT-maps, yield maps.
- Seven (7) descriptors related to F-models processes, specifically: general instructions, script for broadcasting fertilization in rice, script for topdressing fertilization in rice, script for cotton fertilization, script for maize fertilization, database (CSV) fields, script for Google Earth Engine.
- Eight (8) descriptors related to the ifarma FMIS, specifically: agronomic attributes, crops library, fertilizers library, soil layers, nutrient needs layers, satellite monitoring layers, fertilizer applications layers, yield maps layers].
The above descriptor can be split into two main categories: the primary descriptors, which concern requirements, methodology, and symbology; and the secondary descriptors, which cover data collection and ingestion rules, data types and formats, and software tools and commands. The service protocol is written in English and was setup in tabular form within a spreadsheet environment.
4.2.1. Requirements
The requirements descriptor provides an ensemble of potential data sources and suggested software tools, to establish or update the geodatabase and carry out the methodological tasks (Table 2).
It provides also the rules and step-by-step actions for data collection and ingestion, and the appropriate data types, commands, and formats to guarantee functionality and interoperability.

Table 2.
The ensemble of technologies used by the service, split into three categories.
| Category | Resources |
|---|---|
| Software | |
| Geographic Information Systems (GIS) | ArcGIS [commercial] QGIS [open] |
| Spreadsheet | Excel |
| Satellite data platform | Google Earth Engine (GGE) |
| Programming languages | Python JavaScript R |
| FMIS platform | Ifarma [commercial] |
| VRT-terminals | Trimble Ag [for map reference transformations] |
| Cloud data | |
| Earth Observation data | COPERNICUS Land Service SAR (Sentinel-1) Optical (Sentinel-2) |
| Meteorological data | MODIS ERA 5–land IMERG |
| Field data | |
| Soil samples | Soil surveys [Ecodevelopment S.A./Field Team] Soil analysis [ELGO-DIMITRA/SWRI Soil Labs] |
| Yield maps | Yield monitors [Any] |
Data collection concerns soil properties, crop yield, imagery, weather, and agronomic information (field boundaries, cultivars, seeding dates, farming practices, economics, etc); examples are: the process steps for the digitization of the field boundaries and their transfer between the software tools; the process of soil sampling design up to the creation of the soil property surfaces from the collected samples.
4.2.2. Methodology
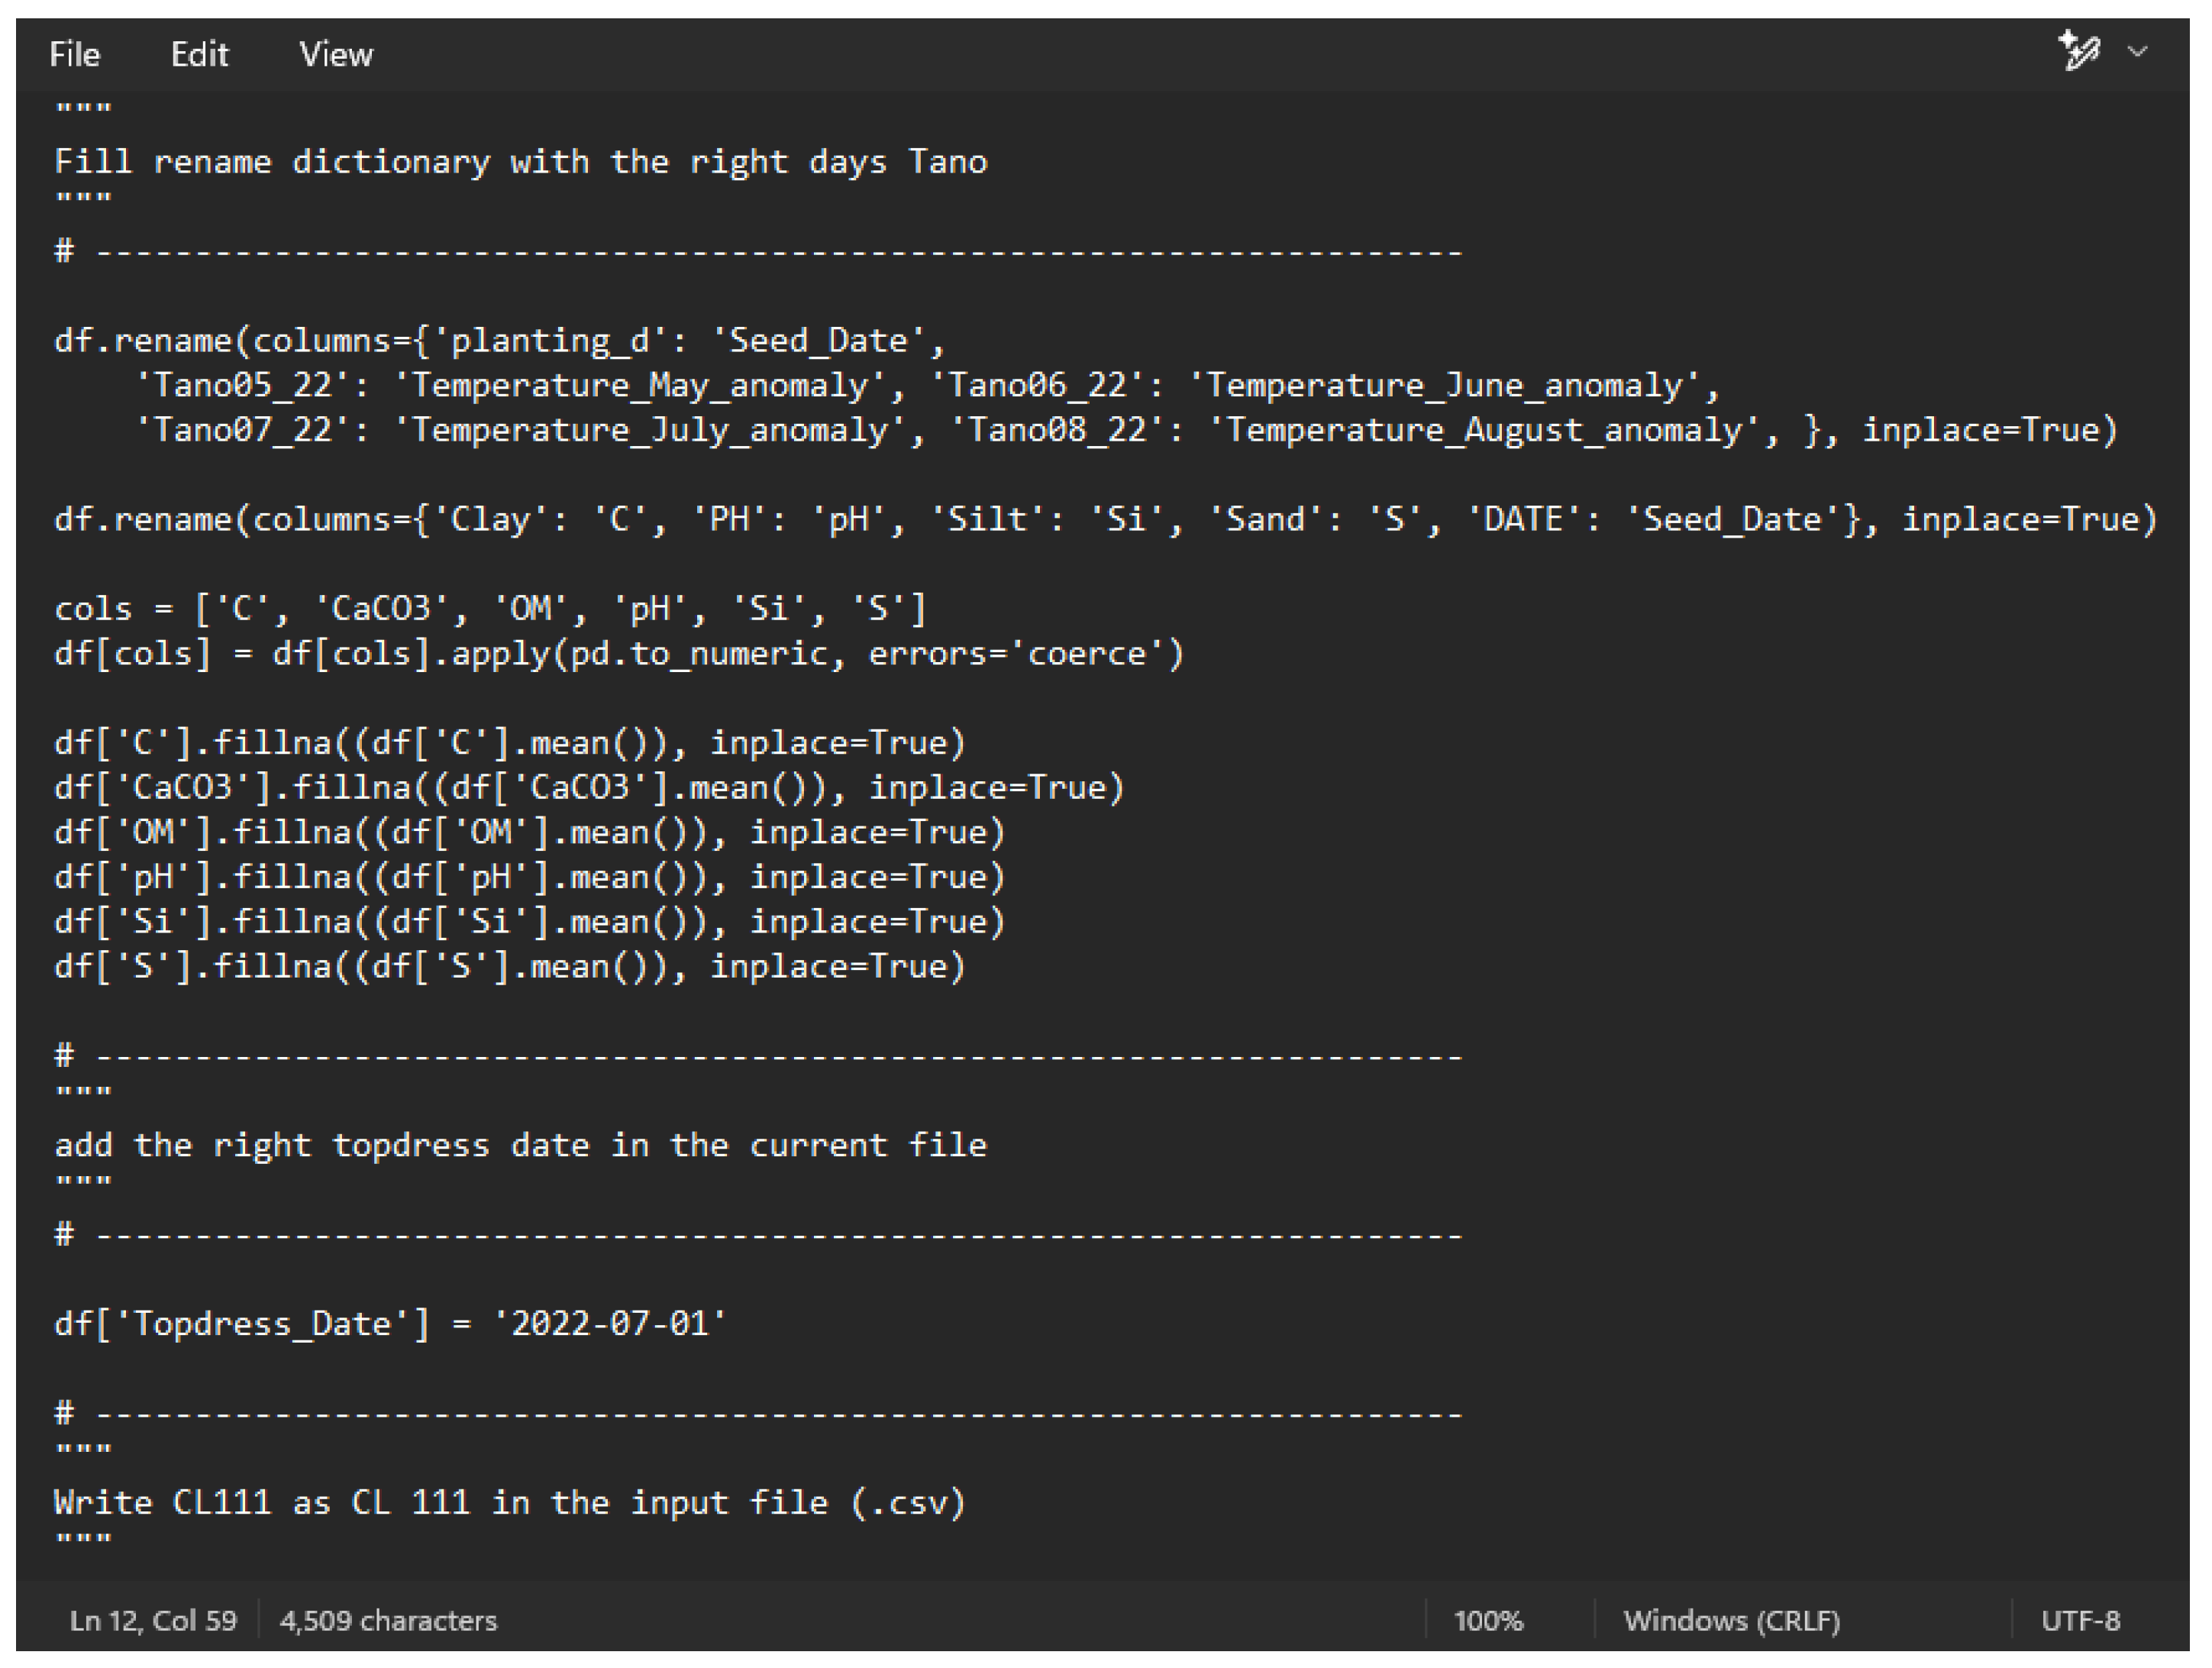
The main methodology descriptors provide guidance with regard to the analytical steps necessary to run the different F-models for crops’ fertilization with machine learning systems (MLS). Following, the F-model scripts are considered as identical descriptors of the process; the topdressing N-fertilizer estimator script is provided as an example in Figure 3.
Figure 3.
An abstract of the topdressing N-fertilizer estimator script written in Python programming language.
Figure 3.
An abstract of the topdressing N-fertilizer estimator script written in Python programming language.
The main descriptor of the MLS protocol concerns the agreement on the names and formats of all the properties taking place in the machine learning analysis, so as to guarantee matching GIS with MLS and avoid resetting and confusion.
Similarly, the FMIS protocol describes the exact fields that comprise the attributes of the parcels as they are setup in ifarma platform, as well as their name and format. In addition to that, there is some standardization of the nomenclature of the fields of the grid maps uploaded to the platform.
Finally, the VRT protocol is a descriptor of transforming the application maps into the appropriate arrangement and format required by the specific distributors used by the farmers. In this process, some stand-alone conversion programs are necessary.
4.2.3. Symbology
The symbology descriptor provides the agreed terms, symbols, and attributes used in all GIS layers of the service (Table 3). The first alphanumeric part of the layer name indicates the crop or crops, followed by the cultivation year (e.g., ‘R25’); whereas, the second part (that after an underscore) indicates the property mapped (e.g., ‘_p’ for parcels).
The crop names are denoted by one capital first letter for arable crops and two capital letters for permanent crops, derived from the Greek name of the crop with Latin characters; e.g., ‘S’ for wheat from the Greek ‘Sitos’, or ‘EL’ for olives from the Greek ‘Elia’.
In a complete example, the layer named ‘B21_f1’ denotes the first fertilization map (i.e., the broadcasting spread map) for cotton crop (‘B’ from ‘Vamvaki’) for the year 2021 (‘21’). Among exceptions are the spectral index layers processed from imagery, which are denoted by the index name followed by the date of the image acquisition (e.g., LNC_20240712).
Table 3.
Symbols and data types of all possible layers, set up within the GIS of the service.
| Nr. | Property | Data Type | Symbol | Indicative examples |
|---|---|---|---|---|
| 1 | Parcels | Polygon | p | R24_p |
| 2 | Grid[5x5m] | Point | g | CM1_g |
| 3 | Soil samples | Point | e | ALL20_e |
| 4 | Soil surfaces | Raster[5m] | S | ALL20_S |
| 5 | Soil surfaces | Point[grid] | s | ALL22_s |
| 6 | Nutrient needs | Point[grid] | n | AK23_n |
| 7 | Fertilizer applications | Point[grid] | fk : k=1,2,... | B21_f1 |
| 9 | Yield | Raster[5m] | Y | R23_Y |
| 10 | Yield | Point | y | R24_y |
| 11 | Plant growth | Image[10-20m] | [specral index] | LNC_YYYYMMDD |
4.2.4. Automations
The standardization of all the processes together with the development of a strict and detailed protocol has assisted in the conversion of many important sub-processes of the service into automated algorithms.
First is the downloading of image data from the Google Earth Engine platform with scripting. The user has only to import the point grid of 5x5 meters and then define the area of interest and the time period in which the data are requested. The script contains the definitions of specific spectral indices derived from Sentinel-2 imagery; possible new indices have to be added in the script. The same script contains similar algorithms for downloading appropriate SAR modes from Sentinel-1 imagery.
Second is the running of the F-models with python scripting. The scripts call open-source MLS libraries from the cloud, which then resolve the predefined prediction problems of optimum fertilizers for every grid point recorded in a linked CSV file. The output maps are reviewed by the expert team for verification.
Third is the uploading of the 5x5m meters grid maps to the ifarma FMIS platform. These maps are exported in one step from the service GIS as CSV files and then are uploaded in one step to the platform.
Currently, additional process automation routines are introduced, focusing on internal GIS functionalities and data exchange between the different process hubs.
4.3. Service Perspectives
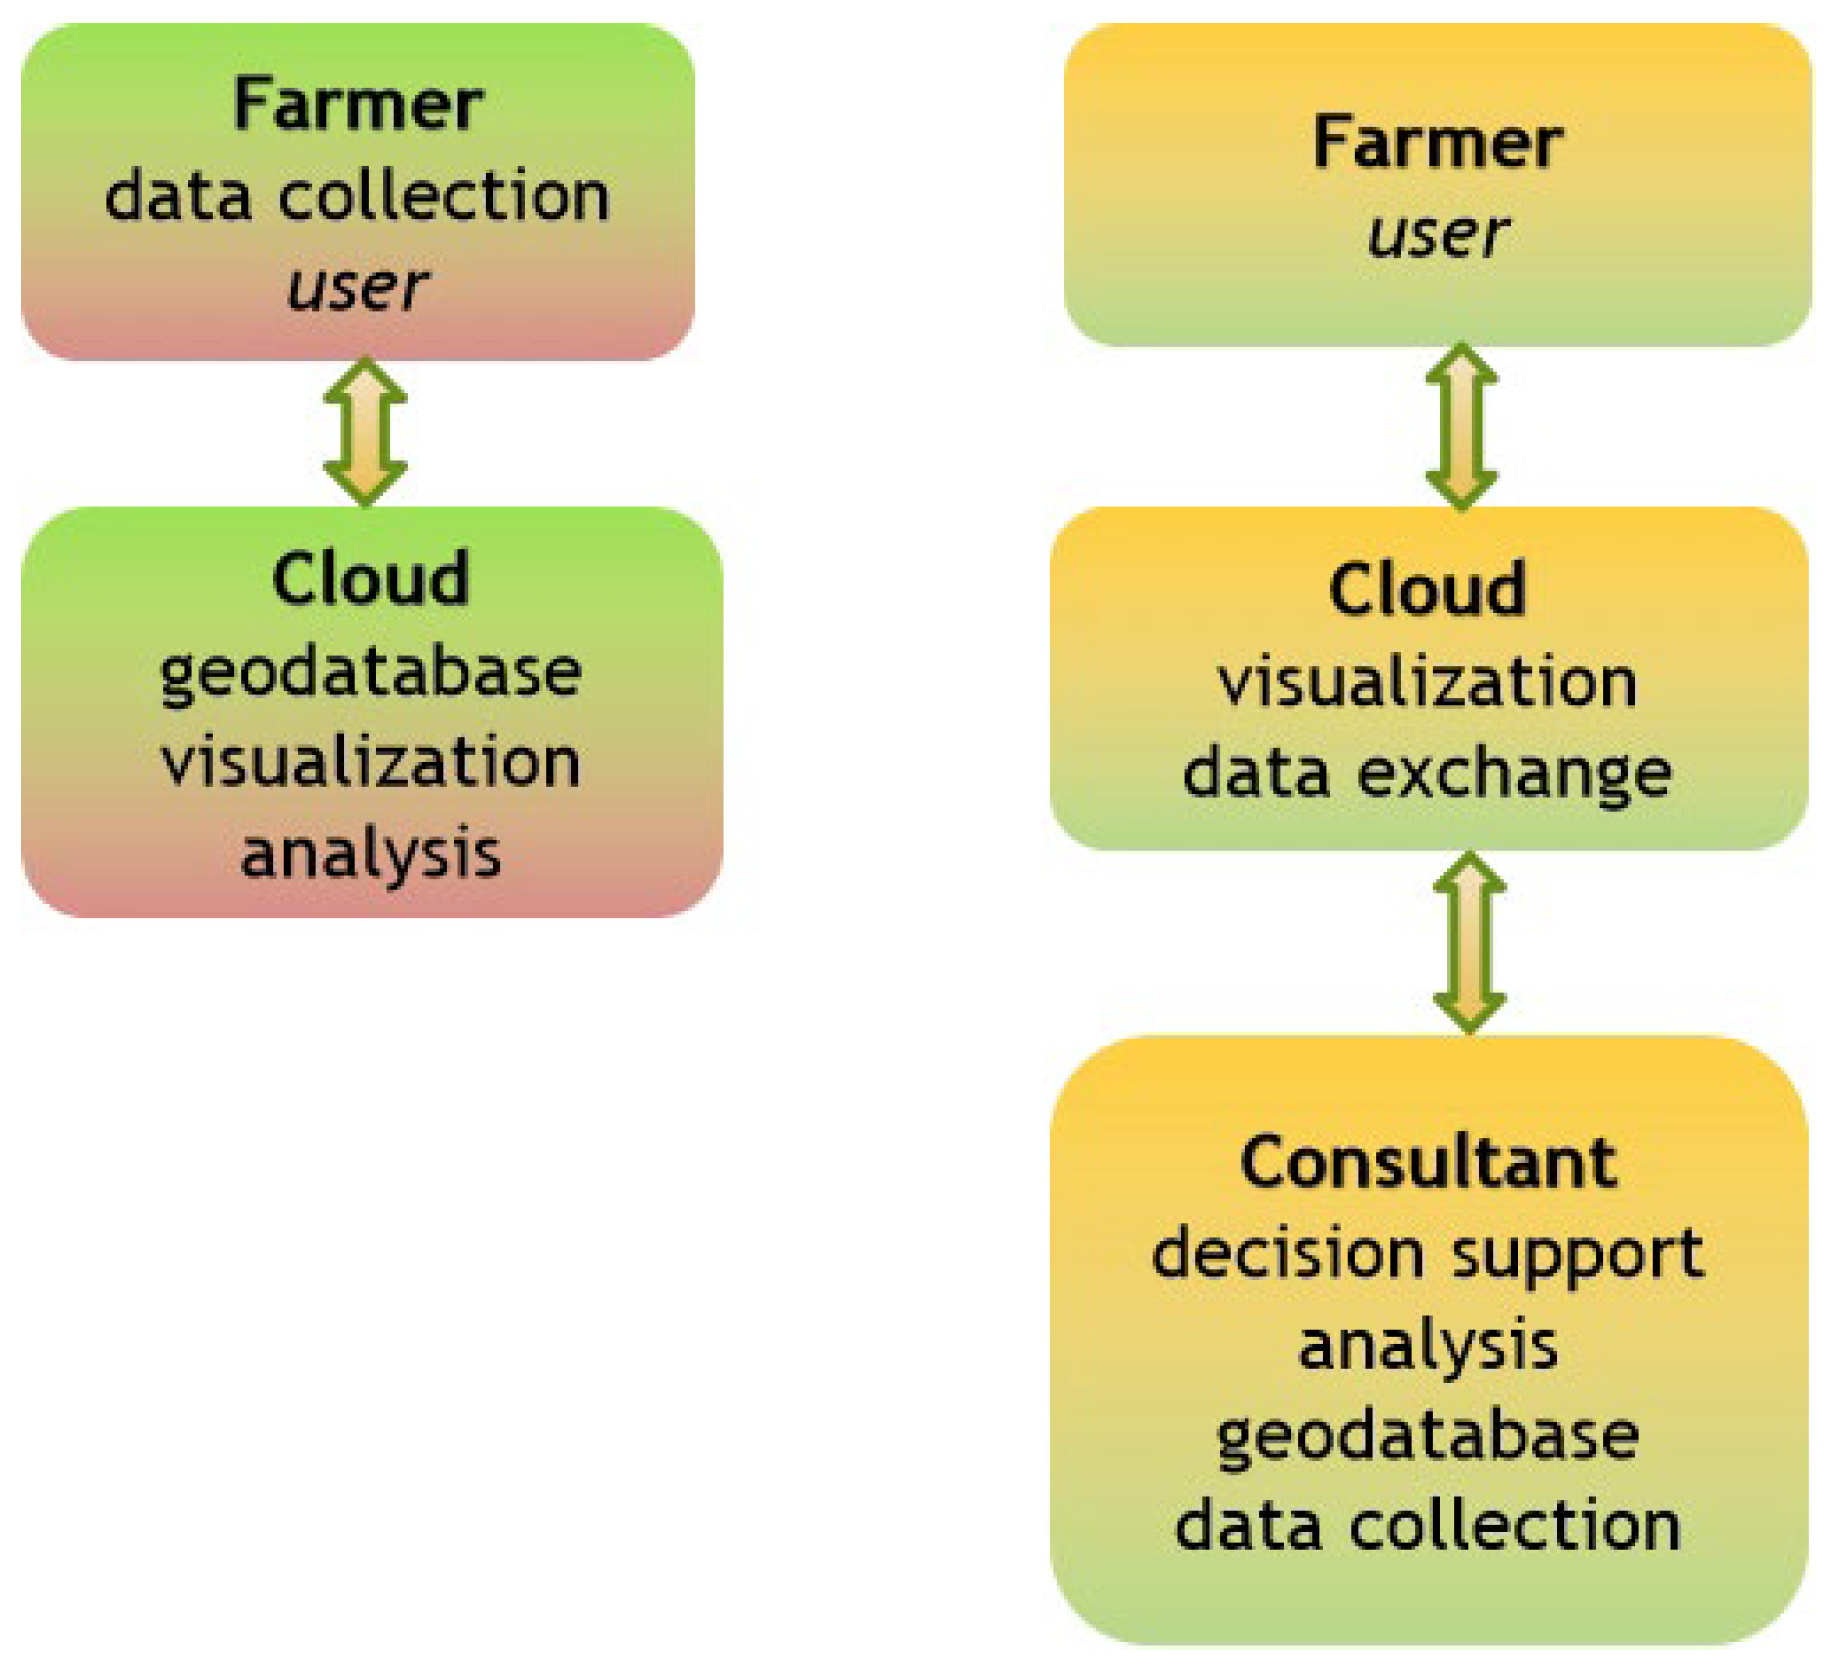
The service’s architecture contributes to the upgrade of a consultancy role in the service, something that in most of the other services’ schemes available, is missing, or is merged with the role of the farmer as a user and with the role of the cloud as a platform.
In the current service, instead, the entire process of decision support is organized together with data collection, geodatabase construction, and analysis within a GIS-server (and not on the cloud); whereas, the role of the cloud is eliminated in data exchange between the consultants and the farmer and in data visualization as well (e.g. mapping tasks) (Figure 4).
The specific architecture empowers flexibility in service management and generalization, while it allows lighter involvement by the farmer as a service user.
Figure 4.
The architecture of the service, based on the distinction between consultancy and user roles; left-side: common architecture, right-side: current service architecture.
Figure 4.
The architecture of the service, based on the distinction between consultancy and user roles; left-side: common architecture, right-side: current service architecture.
The service has bee offered in fully commercial terms by Ecodevelopment S.A. since 2018 to a number of individual growers, teams of growers, or enterprises. ‘PreFer’ is the brand-name of the service for annual crops, ‘Opora’ for tree plantations, and ‘Premno’ for vines and other shrubs. Next to these horizontal modules, ‘ProFit’ complements as a vertical application fitting the crop-oriented modules, for the profitability mapping task. All the modules are embedded in the ‘ifarma’ FMIS application.
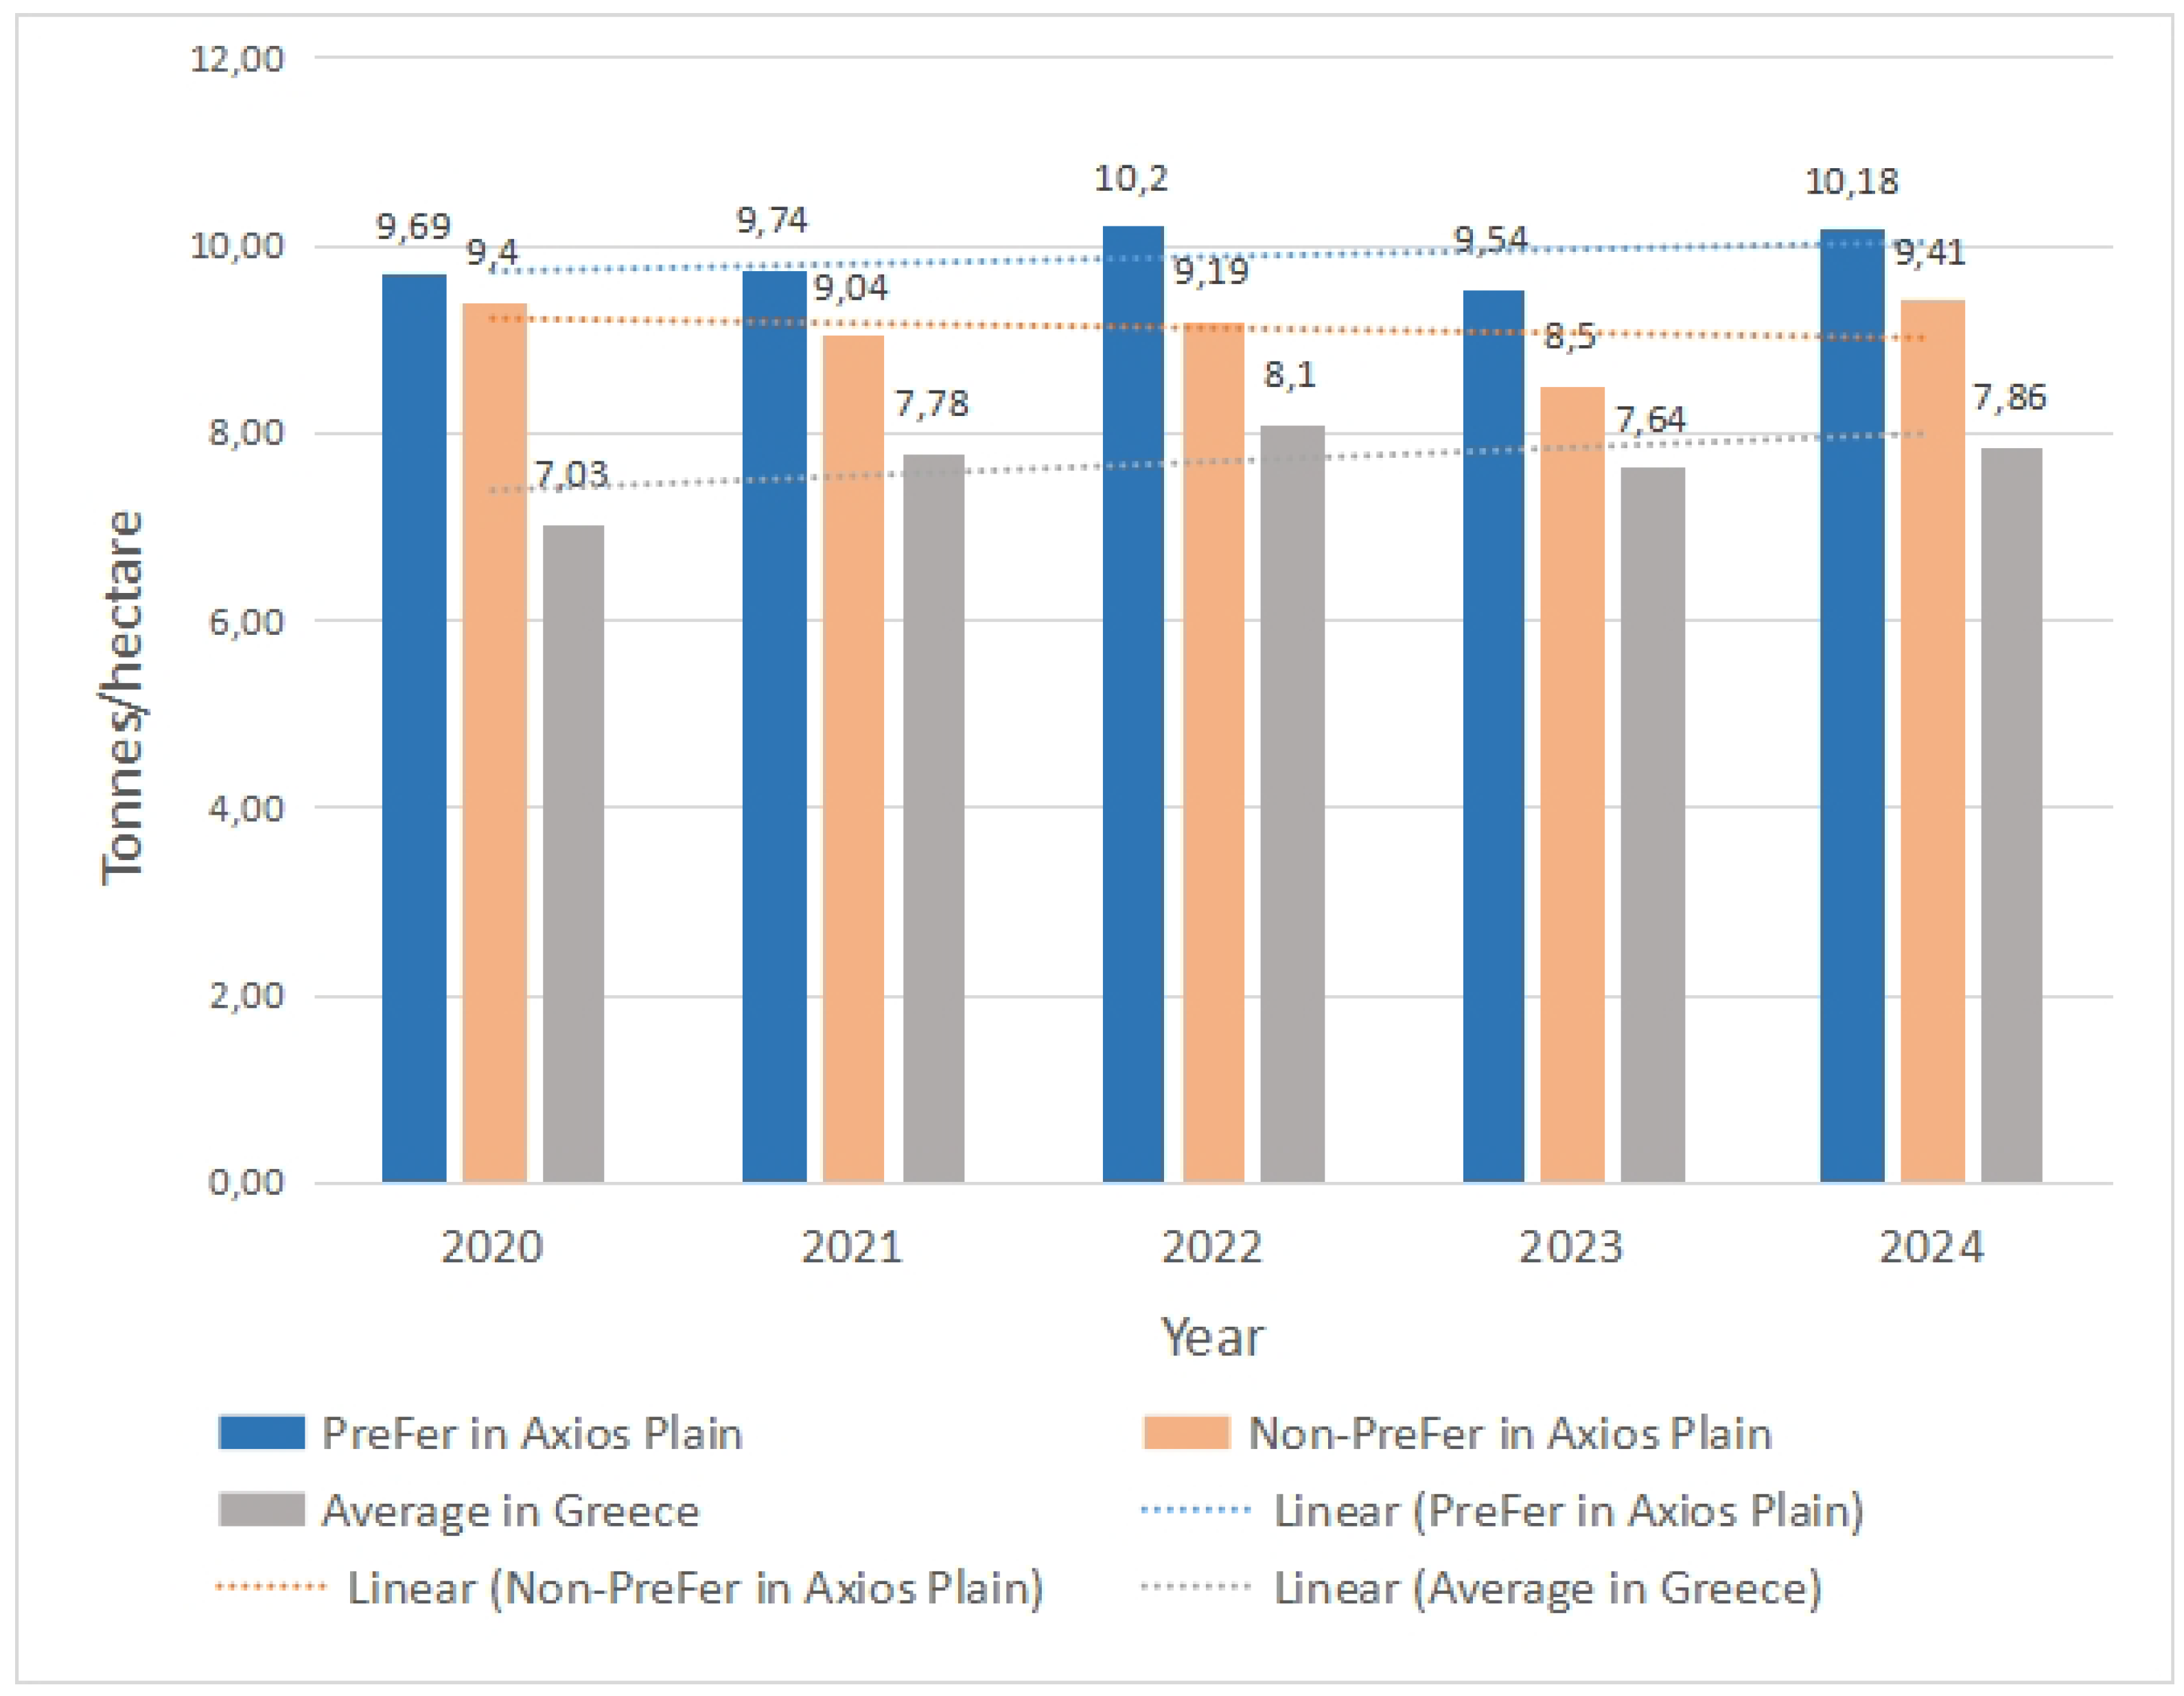
Over the last five years (2020-2024), rice producers following PreFer in Axios river plain, Greece, have been consistently achieving higher yields (by +8.4% on average) compared to other producers in the same area (Figure 5). These absolutely quantitative and undisputed figures are derived from four yield monitors mounted on harvesters, covering approximately 10,000 acres of rice annually in the Axios river plain.
In addition to that, the PreFer followers have witnessed lower needs in fertilizers up to 20% during the same period. Considering that about 60% of the yield value is spent for cultivation cost, the above data correspond to more than 20% increase, in profitability terms.
Figure 5.
Comparison of yields achieved by rice producers in Greece in the last five years (2020-2025).
Figure 5.
Comparison of yields achieved by rice producers in Greece in the last five years (2020-2025).
5. Conclusions
In this research, a new precision agriculture service was designed and developed, following specific methodological, technological, and operational principles. The service has been based on background research and pilot activities begun in 2016 and since then, has been tested successfully under true operational conditions.
The service was evolved over time, in parallel with data collection, method complexity, interface upgrade, and application efficiency. Noticeably, the feedback of the farmers has been an essential asset for the success of the service.
The description, the analysis and the operational experience prove that the principles of the service have been fully met; specifically:
Generality was met, as the service can be used for any type of crops, any area, any conditions and limitations. This is achieved due to the use of GIS as the methodological and technological central node of the service, which allows the full potential of data ingestion, geospatial functionality, and data interoperability.
Flexibility was met, as the service evolved -and can be evolving- due to the use of an open-source farm management information system as the operational platform and interface, allowing adaptable architectural solutions.
Acknowledgments
Cordial thanks to all the farmers who have permitted the use of their data for this study, especially Mr. Konstantinos Kravvas and Mr. Panagiotis Goutas for their trust. Special thanks to our team member Mr. Nikolaos Lazos, Agronomist, for his exceptional work in soil surveys as a Head of the field team. Particular thanks to the team of Agrostis S.A., for their fruitful collaboration and essential contribution to the formation of the services’ platform.
References
- Allen, R.G.; Walter, I.A.; Elliott, R.; Howell, T.; Itenfisu, D.; Jensen, M. The ASCE Standardized Reference Evapotranspiration Equation; Final Report (ASCE-EWRI); Environmental and Water Resources Institute (EWRI)/American Society of Civil Engineers (ASCE): Reston, VA, USA, 2005.
- Aschonitis, V.G.; Papamichail, D.; Demertzi, K.; Colombani, N.; Mastrocicco, M.; Ghirardini, A.; Castaldelli, G.; Fano, E.-A. High-resolution global grids of revised Priestley-Taylor and Hargreaves-Samani coefficients for assessing ASCE-standardized reference crop evapotranspiration and solar radiation. Earth Syst. Sci. Data 2017, 9, 615–638. [CrossRef]
- Aschonitis, V.G., Karydas, C.G., Iatrou, Μ., Mourelatos, S., Metaxa, I., Tziachris, P., Iatrou, G. (2019). An Integrated Approach to Assessing the Soil Quality and Nutritional Status of Large and Long-Term Cultivated Rice Agro-Ecosystems. Agriculture 9(80). [CrossRef]
- Burrough, P.A. and McDonnell, R.A. (1998). Principles of Geographical Information Systems. Oxford University Press, Oxford.
- Cambridge University Press & Assessment, 2025: https://dictionary.cambridge.org/us/dictionary/english/descriptor.
- Chlingaryan, A.; Sukkarieh, S.; Whelan, B. Machine Learning Approaches for Crop Yield Prediction and Nitrogen Status Estimation in Precision Agriculture: A Review. Comput. Electron. Agric. 2018, 151, 61–69.
- DeLay, N.D., Thompson, N.M. and Mintert, J.R. (2022), Precision agriculture technology adoption and technical efficiency. J Agric Econ, 73: 195-219. [CrossRef]
- ERA5-Land: https://cds.climate.copernicus.eu/datasets/reanalysis-era5-land?tab=overview.
- Fick, S.E.; Hijmans, R.J. WorldClim 2: New 1-km spatial resolution climate surfaces for global land areas. Int. J. Climatol. 2017, 37, 4302–4315. [CrossRef]
- Fountas, S., Carli, G., Sørensen, C.G., Tsiropoulos, Z., Cavalaris, C., Vatsanidou, A., Liakos, B., Canavari, M., Wiebensohn, J., Tisserye, B. Farm management information systems: Current situation and future perspectives. Computers and Electronics in Agriculture, Volume 115, 2015. [CrossRef]
- Fountas, S., Sorensen, C.G., Tsiropoulos, Z., Cavalaris, C., Liakos, V., Gemtos, T. Farm machinery management information system, Comput. Electron. Agric. 110 (2015) 131–138. [CrossRef]
- Fulton,J.;Hawkins, E.; Taylor, R.; Franzen, A. “Yield Monitoring and Mapping” in “Precision Agriculture Basics”. American Society of Agronomy, Inc., Crop Science Society of America, Inc., Soil Science Society of America, Inc, 2019, ISBN: 978-0-89118-366-2 (print), ISBN: 978-0-89118-367-9 (online). [CrossRef]
- Grand View Research, 2024; Report: https://www.grandviewresearch.com/industry-analysis/precision-farming-market.
- Johannsen, C.J.; Carter, P.G. SITE-SPECIFIC SOIL MANAGEMENT, Editor(s): Daniel Hillel, Encyclopedia of Soils in the Environment, Elsevier, 2005, Pages 497-503, ISBN 9780123485304. [CrossRef]
- Hijmans, R.J.; Cameron, S.E.; Parra, J.L.; Jones, P.G.; Jarvis, A. Very high resolution interpolated climate surfaces for global land areas. Int. J. Climatol. 2005, 25, 1965–1978. [CrossRef]
- Iatrou, M.; Karydas, C.; Iatrou, G.; Zartaloudis, Z.; Kravvas, K.; Mourelatos, S. (2018). Optimization of fertilization recommendation in Greek rice fields using precision agriculture. Agric. Econ. Rev. 2018, 19, 64–75.
- Iatrou, M.; Karydas, C.; Iatrou, G.; Pitsiorlas, I.; Aschonitis, V.; Raptis, I.; Mpetas, S.; Kravvas, K.; Mourelatos, S. Topdressing Nitrogen Demand Prediction in Rice Crop Using Machine Learning Systems. Agriculture 2021, 11, 312. [CrossRef]
- Iatrou, M.; Karydas, C.; Tseni, X.; Mourelatos, S. Representation Learning with a Variational Autoencoder for Predicting Nitrogen Requirement in Rice. Remote Sens. 2022, 14, 5978. [CrossRef]
- Karydas, C.; Iatrou, M.; Iatrou, G.; Mourelatos, S. (2020). Management Zone Delineation for Site-Specific Fertilization in Rice Crop Using Multi-Temporal RapidEye Imagery. Remote Sensing 2020, 12, 2604. [CrossRef]
- Karydas, C.; Iatrou, M.; Kouretas, D.; Patouna, A.; Iatrou, G.; Lazos, N.; Gewehr, S.; Tseni, X.; Tekos, F.; Zartaloudis, Z.; Mainos, E.; Mourelatos, S. (2020). Prediction of Antioxidant Activity of Cherry Fruits from UAS Multispectral Imagery Using Machine Learning. Antioxidants 2020, 9, 156. [CrossRef]
- Karydas, C., Chatziantoniou, M., Stamkopoulos, K., Iatrou, M., Vassiliadis, V., Mourelatos, S. (2023). Embedding a new precision agriculture service into a farm management information system - points of innovation. Smart Agricultural Technology, 4, 100175.
- Karydas, C.; Chatziantoniou, M.; Tremma, O.; Milios, A.; Stamkopoulos, K.; Vassiliadis, V.; Mourelatos, S. (2023) Profitability Assessment of Precision Agriculture Applications—A Step Forward in Farm Management. Applied Sciences, 13, 9640. [CrossRef]
- Karydas, C., 2025: Precision Agriculture definition.
- Labarthe, P. and Beck, M. (2022). CAP and Advisory Services: From Farm Advisory Systems to Innovation Support. EuroChoices, 21: 5-14. [CrossRef]
- ML Journey [website], 2025: https://mljourney.com/information-retrieval-system-examples/.
- Paraforos, D.S., Vassiliadis, V., Kortenbruck, D., Stamkopoulos, K., Ziogas, V., Sapounas, A.A., Griepentrog, H.W., (2017). Multi-level automation of farm management information systems, Comput. Electron. Agric. 14, 504–514. [CrossRef]
- PrecisionAG. ISPA Forms Official Definition of ‘Precision Agriculture’. 2019. Available online:https://www.precisionag.com/market-watch/ispa-forms-official-definition-of-precision-agriculture/ (accessed on 26 March 2021).
- SAP, website: https://www.bing.com/search?q=process+chain&FORM=AWRE.
- Sishodia, R.P.; Ray, R.L.; Singh, S.K. Applications of Remote Sensing in Precision Agriculture: A Review. Remote Sens. 2020, 12, 3136. [CrossRef]
- Sood, K., Singh, S., Rana, R., Rana, A., Kalia, V., Kaushal, A. (2015). Application of GIS in precision agriculture. 10.13140/RG.2.1.2221.3368.
- Whelan, B. & Taylor, J. Precision Agriculture for Grain Production Systems. Field Crops Res. 2013, 155, 133.S.
Table 1.
A summary on the evolution of the service.
| Service | Data | Zone delineation | Consultancy | Applications | Response |
|---|---|---|---|---|---|
| Phase, level | Sources, volume | Methods, scale | Methods | Scheme, engineering | Crops, extents |
|
|
|
|
|
|
|
|
|
|
|
|
|
|
|
|
|
|
|
|
|
|
|
|
|
|
|
|
|
|
|
|
|
|
|
|
Disclaimer/Publisher’s Note: The statements, opinions and data contained in all publications are solely those of the individual author(s) and contributor(s) and not of MDPI and/or the editor(s). MDPI and/or the editor(s) disclaim responsibility for any injury to people or property resulting from any ideas, methods, instructions or products referred to in the content. |
© 2025 by the authors. Licensee MDPI, Basel, Switzerland. This article is an open access article distributed under the terms and conditions of the Creative Commons Attribution (CC BY) license (http://creativecommons.org/licenses/by/4.0/).
Copyright: This open access article is published under a Creative Commons CC BY 4.0 license, which permit the free download, distribution, and reuse, provided that the author and preprint are cited in any reuse.


