
Submitted:
07 May 2025
Posted:
08 May 2025
You are already at the latest version
Abstract
The seismicity levels in Oklahoma and southern Kansas have increased dramatically over the last 15 years. Past studies have identified the massive disposal of wastewater co-produced during oil and gas extraction as the driving force behind some earthquake clusters, with a small number of events directly linked to hydraulic fracturing (HF) stimulations. The present investigation is the first one to examine the role both of these activities played throughout the two states, under the same framework. Our findings confirm that wastewater disposal is the main causal factor, while also identifying several previously undocumented clusters of seismicity that were triggered by HF. We were able to identify areas where both causal factors spatially overlap, despite likely acting at different depth intervals. Overall, oil and gas operations are probabilistically linked at high confidence levels with more than 7000 felt earthquakes (M≥2.5), including 46 events with M≥4.0 and 4 events with M≥5. Our analysis employed newly compiled regional earthquake catalogs and established physics-based principles. It first hindcasts the seismicity rates after 2017 on a spatial grid using either actual or randomized HF and wastewater data as input, and then compares them against the null hypothesis of solely tectonic loading. In the end, each block is assigned a p-value, indicating the statistical confidence of its causal link with either HF stimulations or wastewater disposal.
Keywords:
induced seismicity
; causal factors
; hydraulic fracturing
; wastewater disposal
; felt earthquakes
1. Introduction
Within Oklahoma and Kansas, the disposal of massive amounts of wastewater, co-produced during oil and gas production, started in the 1940s and began to scale significantly in the 1990s, and increased dramatically with the advent of hydraulic fracturing (HF) operations in the mid-2000s (Hough and Page, 2015). Between the year 2000 and 2021, 39.7 billion bbls (6.3 billion m3) of wastewater were disposed in the region. To put things into perspective, this is roughly equivalent to the total current volume of the Salton Sea lake. Wastewater disposal wells (SWD) inject into laterally extensive aquifers, which are at different shallow depths, with some (e.g. Arbuckle) directly overlying the Precambrian basement. Notably, little to no wellhead pressure is needed during injection (gravity-feed disposal) (Weingarten et al., 2015; Langenbruch et al., 2018), while the median disposal depth varies spatially but is around 1200m. The HF activities occur at shallow low-permeability formations (e.g. Woodford Shale) and at much higher wellhead pressures. The median HF depth is around 2200m, but some stimulations exceed 4000 m in depth. The most significant HF activities are taking in the SCOOP/STACK plays, the Arkoma Basin and the Anadarko Platform. Kansas has hosted very limited HF operations.
Historically, the seismicity rates in Oklahoma (OK) and Kansas (KN) were very low, at about two to four earthquakes above moment magnitude (Mw) 3 per year (Grigoratos et al., 2020a; Rubinstein et al., 2018). However, around 2009 these rates started to increase, then accelerated rapidly around the year 2014, and peaked at the end of 2015 at unprecedented levels, orders of magnitude above the historical levels (Figure 1a). Within OK, the largest event was a Mw 5.8 in Pawnee (Pollitz et al., 2017), with four events larger than M 5 in total (one in 2011 and three in 2016). The estimated statewide earthquake losses have exceeded US$ 85 million, mostly due to non-structural damages (Grigoratos et al., 2021). The frequency of felt seismicity caused unrest to the public as the regional infrastructure has been designed with little to no consideration of seismic demands. At the beginning, the epicenters were mostly concentrated in the center of OK, but then migrated further north and northwest. Since 2016, the seismicity rates have been steadily decreasing and are now much closer to the historical values. The majority of earthquake hypocenters is below the top of basement (Schoenball & Ellsworth, 2017; Choy et al., 2016), with a distinct overlap between the deepest disposal wells and the shallowest earthquakes (Cochran et al., 2020).
Scientific studies attributed this seismicity surge in OK to SWD (Keranen and Weingarten, 2018; McClure et al., 2017; Grigoratos et al., 2020b), including the four largest M5+ events (e.g. Goebel et al., 2017; Chen et al 2017). Most of these studies calibrated adhoc geomechanical models to past seismicity and injection data to argue that a triggering mechanism is plausible. Only McClure et al. (2017) and Grigoratos et al. (2020b) applied robust hypothesis testing protocols to support the alleged association. The SWD rates have been gradually increasing since at least the year 2000, with accelerated growth between 2011 and 2015 (Figure 1a). Since then, they have been steadily decreasing over time. Notably, even though disposal continuously increased between 2000 and 2015, the earthquake rates did not increase until about 2009 and then accelerated in about 2014. Thus, there is an apparent time lag of months to years between increases in the disposal rates and the onset of seismicity (Norbeck and Rubinstein, 2018; Keranen and Weingarten, 2018). That said, we should note that a similar time lag was not observed in the response of the seismicity after the disposal rates started their downward trend.
SWD is considered the primary but not the only source of elevated seismicity levels within OK. Holland (2013) and Skoumal et al. (2018) highlighted that some earthquake clusters within the state have been induced by HF, especially within the SCOOP/STACK zone. Ries et al. (2020) identified several geological and operational factors that increase the apparent probability of HF-induced seismicity within Oklahoma. Notably, in certain areas of the state, the SWD and HF operations overlap both in space and time (Figure 1b).
By 2013 the seismicity had migrated further north into southern KN, with the peak in rates later in 2015, coinciding with the peak in OK. Kansas had also experienced very little seismicity until that time, with only 15 events above M 3 since 1973 (Rubinstein et al., 2018). The largest recent earthquake in KN was the Mw 4.9 Milan event in 2014 close to the southern border (Choy et al., 2016). Wastewater disposal within the Arbuckle formation has been the suspected causal factor for southern KN (Rubinstein et al., 2018; Ansari & Bidgoli, 2020). However, this conclusion has been reached deterministically, demonstrating that such a causal link is physically possible. The uniqueness and statistical significance of this association remains unquantified. Figure 1b and Figure A1 demonstrate that the link in space between SWD and earthquake occurrence is not straightforward. In some regions, the seismicity is collocated with SWD wells, but in other regions there is no spatial correlation. There are vast areas within KN where massive SWD volumes have caused no detectable seismicity.
In this study, we apply an established probabilistic framework (McClure et al., 2017; Grigoratos et al., 2020ab; 2022) to examine the extent to which SWD and HF have contributed to the unprecedented seismicity levels observed in OK and southern KN over the last 15 years. The present investigation is the first one to examine the role both of these activities played throughout the two states, under the same framework. Our approach first hindcasts the seismicity rates after a given time on a spatial grid using either SWD or HF injection data as input, and then compares those rates against the null hypothesis of solely tectonic loading. In the end, each block is assigned a p-value, indicating the statistical confidence of its causal link with each oil and gas activity. Our analysis employed both declustered and non-declustered compilations of regional earthquake catalogs and established physics-based principles. This robust protocol has been previously successfully applied in Oklahoma (Grigoratos et al., 2020b) and West Texas (Grigoratos et al., 2022).
2. Data
First, we compiled a new unified earthquake catalog for the Central and Eastern United States with magnitudes above 1 over the time period of January 2000 to February 2023, merging multiple different sources (Table A1). Duplicate events among catalogs were removed following certain hierarchy rules, when more than one location or magnitude solution was available (Grigoratos et al., 2023). These rules, alongside the margins used during the duplicate-search are listed in Grigoratos and Wiemer (2023). Then, the unified catalog was split into various subcatalogs to account for spatio-temporal variations in the magnitude of completeness (Mc). The OK & KN area had its own subcatalog, containing 82 events above M 4 and 3298 above M 3. Most of our analyses focused on the bulk of the seismicity, below latitude 37.5. There, we estimate a magnitude of completeness (Mc) around 3 after 2006 in OK, around 2.5 after 2012 in OK, around 2.5 after mid-2014 in southern Kansas, and closer to 2 after 2016 for both. These estimates are based on the slope of the magnitude-frequency-distributions and the history of the networks (see Appendix A). The methods we used in this study are not sensitive to the Mc or to the b-value (Grigoratos et al., 2022). For this reason, a more quantitative approach for the estimation of Mc was not needed. A lack of need for accurate b-values is also why we did not homogenize the magnitudes into Mw, and we rather allowed all the various magnitude scales to co-exist. In very broad terms, most magnitudes below 3.5 are local magnitudes, while most magnitudes above 3.5 are moment magnitudes
Sources of wastewater disposal data were the B3 database (for OK), the Oklahoma Corporation Commission (OCC; for OK), the KGS (for KN), the Environmental Protection Agency (EPA; for a few counties in OK), Kyle Murray (Grigoratos et al., 2020a; for OK) and the studies by Weingarten et al. (2015; for all states), Barbour et al. (2017; for Pawnee county in OK) and Norbeck and Rubinsten (2018; for OK and KN). At the time of our analysis, the B3 wastewater disposal data are assumed complete till 2021. The OCC data were assumed complete for 2021, with only daily data for the Arbuckle wells being available for 2022 and early 2023. The KGS disposal were available only through 2021. The EPA data (relevant only for a few counties mostly within OK) were assumed largely incomplete after 2016 (given our sources).
Our SWD analyses required monthly injection rates, the coordinates of the well and is some basins the target-formation. The (true vertical) depth was also collected, although not used explicitly, because all our analyses were in 2D. We could not use the public pressure data because they are largely incomplete and not reliable (Murray, 2015). Only wastewater disposal wells were included in our calculations; Enhanced Oil Recovery (EOR) wells were not taken into account, given that EOR operations aim to stabilize, rather than increase, the pore pressure. Given the spatial extent of our investigation zone, we did not limit our analysis to the Arbuckle aquifer, but rather included all the disposal wells in the region, regardless of their target formation. Experience from the Delaware basin in West Texas has shown that SWD in shallow formations can also cause felt seismicity (Grigoratos et al., 2022). In the future, if precise focal depths become widely available, the analyses can be repeated with depth-specific filters applied to the seismicity and the injection data.
Little to no wellhead pressure is needed for SWD, even for high-rate wells (Weingarten et al., 2015). This indicates that the large-scale, bulk permeability of the Arbuckle Group is likely towards the high end of the reported range (Langenbruch et al., 2018), which is around 0.1 to 2 m2/s (Grigoratos et al., 2020a). The permeability certainly varies across locations, and might increase over time due to secondary porosity from fractures (seismicity).
Sources of HF stimulation data were the FracFocus Chemical Disclosure Registry (for both states) and the OCC FracNotices (for OK). Reporting to FracFocus started in 2011 and became mandatory after January 2012. The OCC requires a Hydraulic Fracture Notice Form (FracNotice) to be filed 48 hours prior to any hydraulic fracturing operations within OK. FracNotices were first required to an OCC district office in 2012. Electronic filing became available starting in July of 2016 and was required after December of 2016. In the FracNotices the operators provide the well surface and bottom-hole location, anticipated number of stages, average fluid volume per stage, scheduled start and end dates of operation, and initiation date of well flowback. In summary, for OK, we used HF data through December 2022 (leveraging the FracNotices), while for KN through September 2022 (~5 month reporting lags are common within FracFocus).
Our post-processing of the HF and wastewater disposal data followed the work by Grigoratos et al. (2020a; 2022) and is described in Appendix A. The median duration of a HF stimulation was 4 days (Figure A2a), and the median daily volume of a HF well was 16890 bbls (Figure A2b). Between 2014 and 2022, the total injected HF volume was 4.5 billion bbls (715 million m3) and the total number of stimulation-days was 15700 (Figure 2). The gridded spatial distribution of cumulative HF and SWD volumes and the earthquake epicenters are mapped in Figure 3a and Figure A3 respectively.
3. Methods
3.1. Declustering
The earthquake recurrence models we use in this study can only model mainshocks. Thus, we removed foreshocks and aftershocks using the declustering algorithm of Aden-Antoniow et al. (2022), which utilizes the nearest-neighbor clustering algorithm of Zaliapin et al. (2008). This algorithm is robust for small samples and stable with Mc, yet sensitive to the d- and w-parameters that are defined by the user (we opted for 1.5 and 0.5 respectively, based on sensitivity tests). We post-processed the clusters to always keep the largest event in each one as the mainshock (instead of the earliest one).
3.2. Hypotheses Testing for Causal Factors of Induced Seismicity
Following Grigoratos et al. (2020b) and Grigoratos et al. (2022), we hindcasted the observed seismicity with a set of competing statistical models to derive likelihood ratios that are then converted to p-values via reshuffling tests (McClure et al. 2007). First, injection and seismicity data are aggregated into spatial blocks of 5 to 10km at fixed time intervals, on a monthly basis for SWD and on a daily basis for HF. Only blocks with nonzero volume for the corresponding operation and with at least 3 earthquakes above Mc are considered “active”. Two block-specific hypotheses are constructed: (i) a null hypothesis model that assumes no relationship between injection and seismicity (total likelihood L0), and (ii) an alternative model that does assume a relationship between injection and seismicity (total likelihood L1). The ratio of L1 to L0 is defined as R. Although R values greater than 1.0 (i.e., L1 > L0) indicate that the alternative hypothesis is more likely than the null hypothesis, this criterion is not sufficient to statistically reject the null hypothesis. To do the latter, we need a reference statistical distribution for the ratio R in which the null hypothesis is true (Rnull). This reference distribution enables the comparison of the two hypotheses in a rigorous way, even if they differ in model-complexity. Rnull was empirically generated by reshuffling the injection data (with subsequent recalculation of L1 and L0). The reshuffling procedure is described in detail in Grigoratos et al. (2020b) and Grigoratos et al. (2022). Rnull essentially reflects how likely it is for the earthquake recurrence model to find purely coincidental correlation between the observed seismicity and random injection data. By comparing the generated Rnull values in each block with the single R value obtained from the real injection and seismicity time-series (Robs), we can statistically determine how confident we are that the improved correlation of the alternative hypothesis is not coincidental. The metric used to quantify this confidence level is the statistical p-value, defined as , where is the number of synthetic (reshuffled) datasets with Rnull greater than the Robs value from the real data, and is the total number of synthetic datasets (in our case 200). A p-value of 0.05, for example, translates to a confidence level C of 95% that the null hypothesis can be rejected (given that C = 1 – p). For the conditions and assumptions under which these confidence levels can be interpreted as probabilities of causality, the readers are referred to McClure et al. (2017).
The lower the p-value, the better the correlation between the seismicity and the oil and gas activity in question. Very low p-values, that is, below 0.05, signal that the examined human activity is a key triggering factor of the seismicity in that block (Grigoratos et al., 2022). P-values between 0.05 and 0.10 might flag blocks where a subset of the clusters is induced. Blocks with low p-values in two different maps are likely affected by both types of human activity, with more sophisticated statistical analysis needed to properly quantify the exact ratio. Higher p-values above 0.20, and especially above 0.50, indicate that very little to no seismicity there was triggered by the analyzed type of human activity.
Here, we examined 2 causal factors related to energy production, namely HF stimulations and SWD. We ran the p-value analysis two times, assuming a single alternative causal factor at a time, each compared against the null hypothesis that assumes all earthquakes are of tectonic origin. Implementation details regarding spatial oversampling are provided in Grigoratos et al. (2022) and Grigoratos and Wiemer (2023).
Very low p-values, that is, below 0.05, signal that the examined human activity is a key triggering factor of the seismicity in that block. P-values between 0.05 and 0.10 might flag blocks where a subset of the clusters is induced. Blocks with low p-values from SWD and HF are likely affected by both activities, with more sophisticated statistical analysis needed to properly quantify the exact ratio for each. P-values between 0.10 and 0.20 are somewhat inconclusive, while p-values above 0.20, and especially above 0.50, indicate that very little to no seismicity there was triggered by the analyzed activity.
3.3. Generalized Seismogenic Index Model
To hindcast the spatio-temporal changes in the seismicity rates we need a physics-based earthquake recurrence model that takes into account the external driving forces, i.e. the oil and gas activities. Since most of the stress changes are caused either directly or indirectly by the injected volumes, the earthquake recurrence model should use as input the injection rates of HF or SWD. We employed the framework of Grigoratos et al. (2020a; 2022), who expanded the Seismogenic Index model (Shapiro et al., 2010) to large-scale HF operations and wastewater disposal activities. They took into account the background tectonic rate and the stressing-rate dependency of the time lag between injection and seismicity rate changes (Norbeck & Rubinstein, 2018). The original Seismogenic Index model is itself a modified version of the G-R relationship and predicts that the number of induced earthquakes is proportional to the pore pressure change, which can be approximated by the injected volume. It was first successfully used to hindcast induced seismicity related to hydraulic stimulations (Shapiro 2015; Dinske and Shapiro, 2016; Kwiatek et al., 2024). The governing equations behind our earthquake recurrence model, as well as details on how the time-lags were modeled are available in Appendix A.
Following Grigoratos et al. (2020a), we acknowledged that SWD in one block will affect the pore pressure and stress field in a neighboring block. HF volumes are injected into much tighter formations and thus this effect is extremely localized relative to the size of our blocks. The latter is 5 km for HF and 10 km for SWD (Grigoratos et al., 2022). Thus, we distributed the SWD volumes of each well in space and time following the Theis (1935) equation for transient, radial flow in nonleaky vertically confined aquifers of infinite areal extent (equation S4). The only parameter needed to compute the distribution factors is the large-scale diffusivity, . We performed our computations for three different values of D, equal to 0.3, 1.0 and 2.0 m2/s (Figure 3b) and commented on the sensitivity of the results. More implementation details are provided in Grigoratos et al. (2020a) and in Appendix A.
3.4. Hydraulic Fracturing Radar
Following Grigoratos et al. (2022), we used the Hydraulic Fracturing Radar (HFR) as an an initial screening tool for HF within each region of interest. This metric is employed only as a sanity check to confirm or question results stemming from the p-value analyses. To create HFR, first we plotted a 5km base-grid with the percentage of (declustered) earthquakes above Mc that occurred during a HF stimulation and within 5km from it (. This distance threshold is meant to cover the epicentral uncertainty of the earthquakes and the horizonal extension of the HF wells (toe-to-heel extension). Given the uncertainty in the end-dates of the HF stimulations coming from the IHS database, we allowed for a 3-day buffer after the assigned end-date for the temporal window. Then, we adjusted to account for the maximum total duration of stimulations within a block over the investigated study period. The reason for that adjustment is the observed asymmetry in the intensity of HF activities across blocks.
4. Results
Figure 4 shows the results of the declustering, for the time period between 2000 and 2022, for a magnitude cut off of M 2.5. In reality, we expect the Mc to be closer to 3 in early years, and reach 2.5 only after 2012 or so. The algorithm removed 34% of the events as foreshocks/aftershocks. The corresponding value for the Delaware basin (M ≥ 1.5) and the Midland basin (M ≥ 1.5) was much lower, at 14% and 19% respectively (Grigoratos and Wiemer, 2023). This could be due to the fact that a relatively larger percentage of seismicity in OK and southern KN occurs within the crystalline basement.
4.1. SWD
Regarding SWD, we chose to start the calibration in 2012 because the Mc decreased significantly in 2011 throughout OK (Appendix A). Figure 5and Figure A4 shows the statistical p-values for SWD (pSWD) in the region for M ≥ 2.5 and with the large-scale diffusivity value D set to 2 m2/s. In particular, 46% of “active” blocks have pSWD ≤ 0.05, and 55% of “active” blocks have pSWD ≤ 0.10. Furthermore, 61% of earthquakes occurred within a block with pSWD ≤ 0.05 and 71% within a block with pSWD ≤ 0.10. Recall that a p-value of 0.05 translates to a 95% confidence interval for association. The two key calibrated parameters are shown in Figure A5. The results are insensitive to declustering (Figure A6) and only slightly sensitive to the selected D value (Figure A7, Figure A8). This demonstrates the stability of our statistical framework, which is based on physics-based principles.
Our observations are in agreement with previous studies that have identified SWD as the main driver of seismicity in central and north western OK and in southern KN. By not flagging SWD as a causal factor in the SCOOP/STACK play and in the Arkoma basin, we are also in agreement with Skoumal et al. (2018) who argued that HF is the main driver there. Notably, all Mw 4.9+ ruptures (Prague, Cushing, Fairview, Pawnee; Milan) occurred in blocks with pSWD ≤ 0.05. Thus, we were able for the first time to confidently link all major ruptures to SWD, using a single model-formulation and parametrization, without having to employ complex poroelastic effects or earthquake-to-earthquake nucleations. The latter two mechanisms were required in previous sequence-specific deterministic studies (e.g. Goebel et al., 2017; Barbour et al., 2017; Chen et al., 2017). The generic nature of our framework makes it uniquely suitable for investigations that include multiple human activities at various distances and timeframes.
We should highlight that there are many zones in central and northern Kansas that hosted high-volume SWD operations (Figure 3) without significant levels of seismicity or low pSWD values (Figure A4). In fact, we did not find any compelling evidence of induced seismicity in central and northern Kansas (Figure A4; Figure A6). Even though detected seismicity in the 1980s near the northern state-border occurred close to oil field operations, Evans and Steeples (1987) made a strong case for a natural tectonic origin. Furthermore, we believe that the evidence that another northern sequence between 1986 and 1992 is linked to SWD are inconclusive (Armbruster et al, 1989).
Hough and Page (2015; 2016) argued in favor of the El Reno 1952 Mw 5.7 event in central ok being linked to SWD. Our results do not support this claim, since the epicenter (Lat: 35.53; Lon: -97.85) is far from blocks with low pSWD values (Figure 5, Figure A8). If fact all but one of the SWD-linked historical earthquakes outlined in Hough and Page (2015) occurred outside the perimeter of our SWD zone, as defined by our pSWD maps.
We also investigated, on a block-by-block basis, the relationships between total diffused or injected disposal volume, pSWD, maximum magnitude and seismicity rate (Figure A15). We limited out investigation to blocks with pSWD below 0.05. The maximum magnitude was negatively correlated with pSWD indicating that larger magnitudes tend to occur in blocks where SWD is the key triggering force. A very interesting finding was that the seismicity rate (above Mc) and the maximum magnitude were positively corelated only with the diffused disposal volume, and not with the injected (non-diffused) ones. This highlights how important it is to distribute the SWD volumes in both space and time following pore-pressure diffusion principles.
4.2. HF
In this section we will analyze the potential link between the observed seismicity and HF. The largest volumes are in the southern and western part of OK (Figure 2 and Figure A3). There we also find the highest HFR values (Figure 6), in agreement with Skoumal et al. (2018). Most, if not all, of the seismicity within the SCOOP/STACK plays, the Arkoma Basin and the Anadarko Platform appears highly correlated with HF operations (Figure 6). According to our window-based associations, 7% of declustered earthquakes are linked to only 3% of the HF stimulations. We should note that 83% of HF stimulations that eventually induced seismicity (according to HFR), started doing so during the stimulation period, while 71% of “active” blocks have a fitted time-lag (equation A3; Figure A9a) of 3 days or less. Thus, we caution against using larger time-lags in well-to-earthquake association filters. Lastly, the median ΣHF value was -2.6 (Figure A9b).
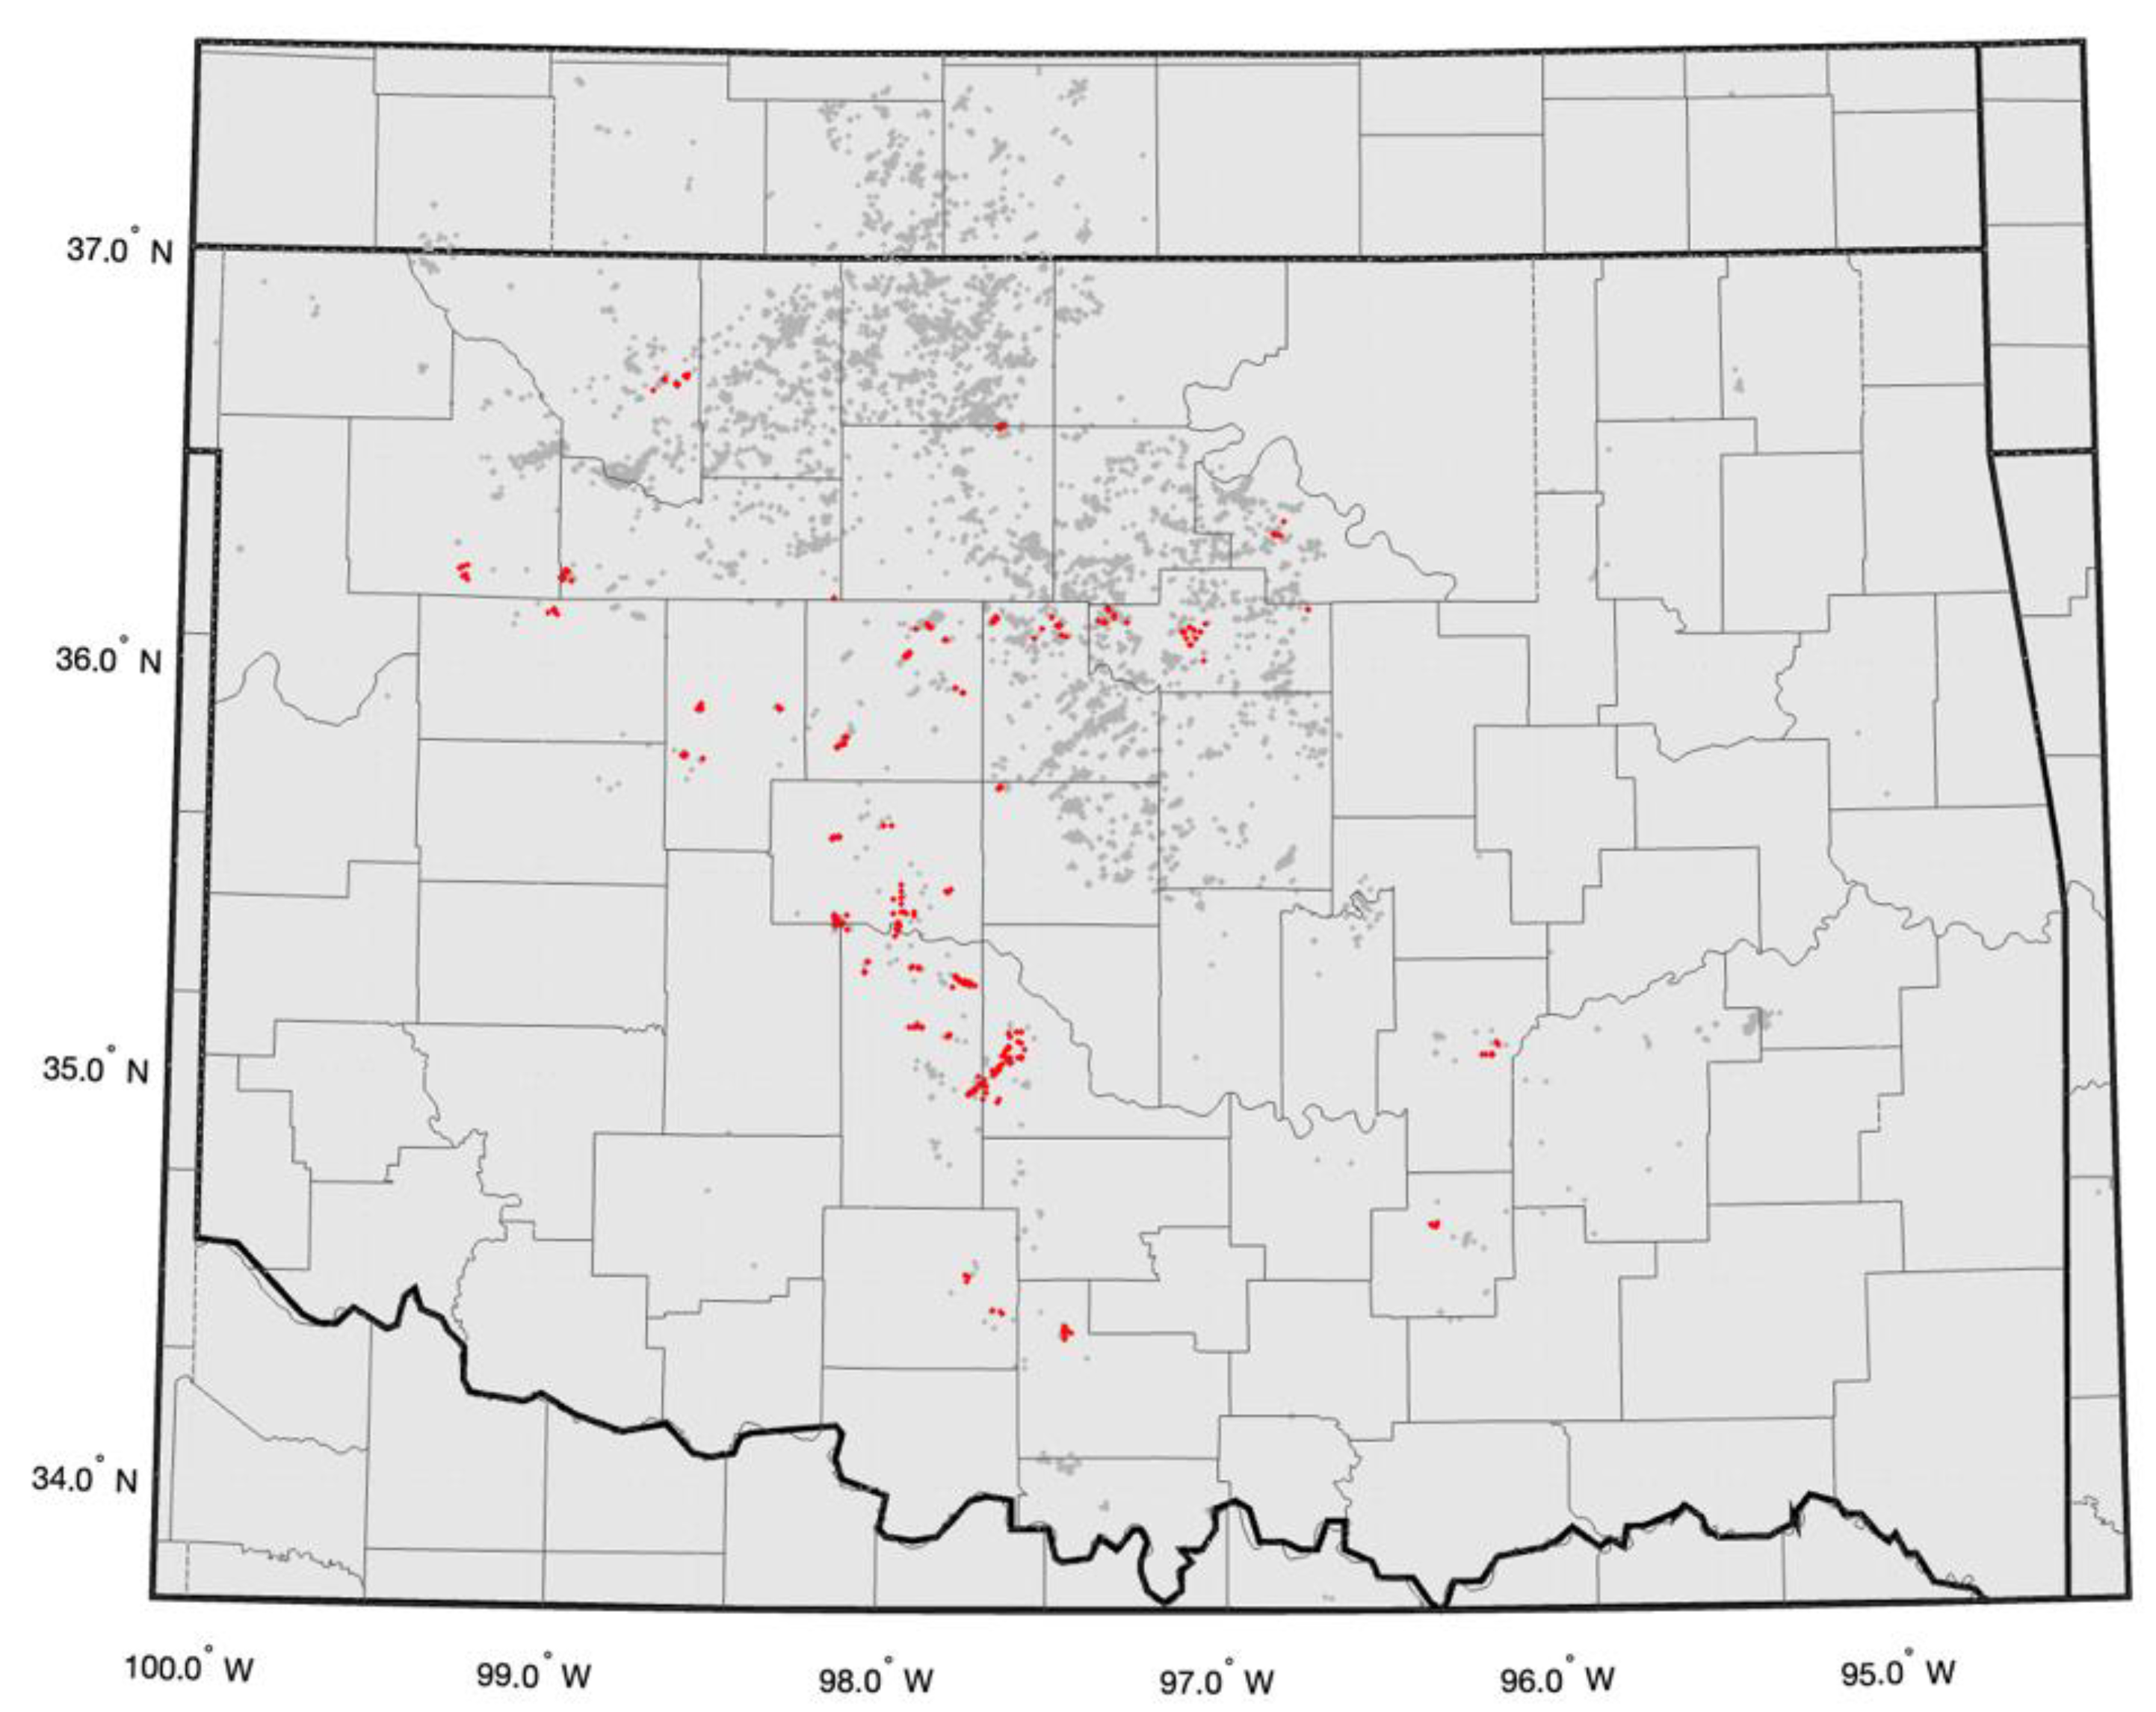
Figure 7 shows the statistical p-values for HF (pHF) in the region, for the period between 2014 and 2022. In particular, 22% of “active” blocks have pHF ≤ 0.05, and 36% of “active” blocks have pHF ≤ 0.10. Furthermore, 8% of declustered earthquakes (above Mc) occurred within a block with pHF ≤ 0.05. When we combine the HFR windows with pHF, 3% of declustered earthquakes above M 2.5 are both flagged by HFR and occurred within a block with pHF ≤ 0.05 (Figure 8). These earthquakes are almost certainly induced by HF. Rare exceptions to this rule may be events that also have a low pSWD value, hosted in blocks with relatively stable seismicity rates through time (Figure A14).
The pHF values are stable over time and were able to detect zones where HF is a causal factor early on (Figure A10). They are also almost identical when we use the constant time-lag function (Figure A11) instead of the time-dependent one (equation A3).
Crucially, the vast majority of blocks with low HFR values also have low pSWD values, indirectly validating the consensus that the seismicity in central OK and sKN is mostly triggered by SWD. That said, there are several blocks in OK with HFR between 0.10 and 0.25 and a few with HFR above 0.25 within zones linked to SWD (Figure 5 and Figure 6). Those blocks also have low pHF values in Figure 7, since HFR and pHF values are highly correlated (Figure A12), as expected. Therefore, there are areas within central and northern OK where the seismicity is likely occurring at different depths, with shallow earthquakes triggered by HF and deeper ones (within the basement) triggered by SWD. This is a novel finding of this study. The poor hindcasting performance of the earthquake recurrence model for HF (Figure A13) within blocks with pHF ≤ 0.05 indicates that in blocks where both causal factors are in play, the majority of the seismicity is linked to SWD.
As far as the HF wells are concerned, only 1% of stimulations are both linked to seismicity and occurred within a block with pHF ≤ 0.05. On the other hand, 92% of stimulations are not linked to seismicity and occurred within a block with pHF ≥ 0.05.
We also investigated, on a block-by-block basis, whether either the maximum magnitude was correlated with the p-value or with the total volume (provided that pHF ≤ 0.05) (Figure A15). The maximum magnitude was weakly correlated with pHF (Figure A15a), indicating that larger magnitudes tend to be linked to SWD, and not HF. Surprisingly, the maximum magnitude was not positively correlated with the total HF volume per block, implying that geologic conditions are more important than the injected volume as far as the size of the ruptures is concerned.
5. Conclusions
The seismicity levels in Oklahoma and southern Kansas have increased dramatically over the 15 years. Several past studies have identified the disposal of wastewater co-produced during oil and gas extraction as the driving force behind this surge, with a small percentage being attributed directly to hydraulic fracturing (HF) stimulations. While the present investigation validates that SWD is the main causal factor, it identifies several previously undocumented clusters of seismicity within Oklahoma that appear triggered by HF stimulations. We did not find evidence of induced seismicity in central and northern Kansas, nor close to epicenters of old historical earthquakes within Oklahoma.
When we expand our findings from both examined human activities (Figure 5 and Figure 7) to the entire catalog between 2009 and 2022, oil and gas operations are probabilistically linked at the 95% confidence level with 65% of the felt (M≥2.5) earthquakes (7731 events), including 46 events above magnitude 4 and all 4 events above magnitude 5. Our results are essentially grid-independent and are not particularly sensitive to the declustering of the earthquake catalog, to the magnitude of completeness, to the investigation period, and to the large-scale hydraulic diffusivity of the aquifers.
Notably, the seismicity is often unevenly correlated with the two oil and gas activities, with vast areas that have undergone intense operations having hosted no detectable seismicity. Thus, geomechanical factors dominate over operational ones, both for HF and SWD. This was the first time a study examined the role both of these activities played throughout the two states, under the same physical and statistical framework.
Acknowledgments
This material is based upon work supported by the U.S. Geological Survey under Grant No. G22AP00243 (FY2022) of the call G22AS00006. The views and conclusions contained in this document are those of the authors and should not be interpreted as representing the opinions or policies of the U.S. Geological Survey. Mention of trade names or commercial products does not constitute their endorsement by the U.S. Geological Survey.We thank Justin Rubinstein for providing information about the seismic networks operating in southern Kansas, and Florent Aden-Antoniow for addressing inquiries related to his declustering code.
Data and resources:
Supplemental material regarding the input data and results are available as csv files from https://zenodo.org/ under the DOI: 10.0076/FY2022EHPg. They include earthquake catalogs (declustered and non-declustered), gridded monthly SWD data, and resulting gridded p-values. Each file-category is accompanied by its readme so that the end user has the appropriate documentation to understand how the data is structured. Sources of wastewater disposal data were the B3 database (https://www.b3insight.com/; last accessed December 11 2022), the Oklahoma Corporation Commission [OCC; https://oklahoma.gov/occ/divisions/oil-gas/oil-gas-data.html (last accessed March 2 2023); http://imaging.occeweb.com/imaging/UIC1012_1075.aspx (last accessed May 2019)], the KGS (https://www.kgs.ku.edu/Magellan/Qualified/class2_db.html; last accessed May 23 2023), the Environmental Protection Agency (EPA; last update March 2018), Kyle Murray (OGS; last update May 2019) and the studies by Weingarten et al. (2015), Barbour et al. (2017) and Norbeck and Rubinsten (2018). Sources of HF data were the FracFocus Chemical Disclosure Registry (last accessed February 19 2023), the IHS Markit databases (last accessed March 29 2023), and only for Oklahoma the OCC FracNotices (https://www.oklahoma.gov/content/dam/ok/en/occ/documents/og/isd_automated/All_Notices.csv; last accessed February 19 2023). The following earthquake catalogs are available online: ANSS ComCat https://earthquake.usgs.gov/earthquakes/search/ (last accessed February 20 2023), OGS https://ogsweb.ou.edu/eq_catalog/ (last accessed February 19 2023), KGS (https://www.kgs.ku.edu/Geophysics/Earthquakes/data.html; last accessed February 19 2023). Publications that were used as sources of earthquake catalogs are listed in Table A1. The code used for the declustering is based on scripts that can be found at https://zenodo.org/record/5838353. The python code for the duplicate-removal process can be found at https://github.com/klunk386/CatalogueTool-Lite/tree/master/OQCatk. All the figures except for Figure 2, were made using the Matlab software package (http://www.mathworks.com, last accessed March 2023). The analyses presented in this paper greatly benefited from the high-performance computing resources available at SED.
Declaration of competing interests:
The authors declare that they have no known competing financial interests or personal relationships that could have appeared to influence the work reported in this paper.
References
- Aden-Antoniów, F., Frank, W. B., & Seydoux, L. (2022). An Adaptable Random Forest Model for the Declustering of Earthquake Catalogs. Journal of Geophysical Research: Solid Earth, 127(2). [CrossRef]
- Armbruster, J., D. Steeples, and L. Seeber (1989). The 1989 earthquake sequences near Palco, Kansas: A possible example of induced seismicity, Seismol. Res. Lett. 60, no. 4, 141.
- Ansari, E., and T. S. Bidgoli (2020). Reply to comment by Peterie et al. on “accelerated fill-up of the arbuckle group aquifer and links to US midcontinent seismicity”, J. Geophys. Res. 125, no. 12. [CrossRef]
- Ansari, E., T. S. Bidgoli, and A. Hollenbach (2019). Accelerated fill-up of the Arbuckle Group aquifer and links to US midcontinent seis- micity, J. Geophys. Res. 124, no. 3, 2670–2683.
- Barbour, A. J., J. H. Norbeck, and J. L. Rubinstein (2017). The effects of varying injection rates in Osage County, Oklahoma, on the 2016 Mw 5.8 Pawnee earthquake, Seismol. Res. Lett. 88, no. 4, 1040–1053.
- Chen, X., Nakata, N., Pennington, C., Haffener, J., Chang, J. C., He, X., Zhan, Z., Ni, S., & Walter, J. I. (2017). The Pawnee earthquake as a result of the interplay among injection, faults and foreshocks. Scientific Reports, 7(1). [CrossRef]
- Choy, G. L., Rubinstein, J. L., Yeck, W. L., McNamara, D. E., Mueller, C. S., & Boyd, O. S. (2016). A Rare Moderate-Sized (Mw 4.9) Earthquake in Kansas: Rupture Process of the Milan, Kansas, Earthquake of 12 November 2014 and Its Relationship to Fluid Injection. Seismological Research Letters, 87(6), 1433–1441. [CrossRef]
- Cochran, E. S., A. Wickham-Piotrowski, K. B. Kemna, R. M. Harrington, S. L. Dougherty, and A. F. Peña Castro (2020). Minimal Clustering of Injection-Induced Earthquakes Observed with a Large-n Seismic Array, Bull. Seismol. Soc. Am. [CrossRef]
- ComCat. U.S. Geological Survey, Earthquake Hazards Program, 2017, Advanced National Seismic System (ANSS) Comprehensive Catalog of Earthquake Events and Products: Various. [CrossRef]
- Dinske, C., and Shapiro, S. (2016). Performance test of the Seismogenic index model for forecasting magnitude distributions of fluid-injection-induced seismicity, SEG Technical Program Expanded Abstracts 2016. [CrossRef]
- Evans, D., and D. Steeples (1987). Microearthquakes near the sleepy hollow oil field, southwestern Nebraska, Bull. Seismol. Soc. Am. 77, no. 1, 132–140.
- Goebel, T. H. W., Weingarten, M., Chen, X., Haffener, J., & Brodsky, E. E. (2017). The 2016 Mw 5.1 Fairview, Oklahoma earthquakes: Evidence for long-range poroelastic triggering at >40 km from fluid disposal wells. Earth and Planetary Science Letters, 472, 50–61. [CrossRef]
- Grigoratos, I., Rathje, E., Bazzurro, P., & Savvaidis, A. (2020a). Earthquakes Induced by Wastewater Injection, Part I: Model Development and Hindcasting. Bulletin of the Seismological Society of America, 110(5), 2466–2482. [CrossRef]
- Grigoratos, I., Rathje, E., Bazzurro, P., & Savvaidis, A. (2020b). Earthquakes Induced by Wastewater Injection, Part II: Statistical Evaluation of Causal Factors and Seismicity Rate Forecasting. Bulletin of the Seismological Society of America, 110(5), 2483–2497. [CrossRef]
- Grigoratos, I., Bazzurro, P., Rathje, E., & Savvaidis, A. (2021). Time-dependent seismic hazard and risk due to wastewater injection in Oklahoma. Earthquake Spectra, 37(3), 2084–2106. [CrossRef]
- Grigoratos, I., Savvaidis, A., & Rathje, E. (2022). Distinguishing the Causal Factors of Induced Seismicity in the Delaware Basin: Hydraulic Fracturing or Wastewater Disposal? Seismological Research Letters, 93(5), 2640–2658. [CrossRef]
- Grigoratos I., Poggi, V., Danciu, L., Monteiro, R. (2023). Homogenizing instrumental earthquake catalogs – a case study around the Dead Sea Transform Fault Zone. Seismica. [CrossRef]
- Grigoratos and Wiemer (2023). Probabilistic identification of seismicity triggered by oil and gas activities and its effects on seismic hazard. Final Technical Report for the USGS Earthquake Hazards Program Grant #G22AP00243.
- Gutenberg, B., and Richter, C.F. (1956). Earthquake magnitude, intensity, energy, and acceleration: (Second paper), Bull. Seismol. Soc. Am. 46(2), 105-145.
- Holland, A. A. (2013). Earthquakes Triggered by Hydraulic Fracturing in South-Central Oklahoma. Bulletin of the Seismological Society of America, 103(3), 1784–1792. [CrossRef]
- Hough, S. E., & Page, M. (2015). A Century of Induced Earthquakes in Oklahoma? Bulletin of the Seismological Society of America, 105(6), 2863–2870. [CrossRef]
- Hough, S. E., & Page, M. (2016). The Petroleum Geologist and the Insurance Policy. Seismological Research Letters, 87(1), 171–176. [CrossRef]
- Keranen, K. M., & Weingarten, M. (2018). Induced Seismicity. Annual Reviews. [CrossRef]
- Kwiatek, G., Grigoratos, I., & Wiemer, S. (2024). Variability of Seismicity Rates and Maximum Magnitude for Adjacent Hydraulic Stimulations.
- Langenbruch, C., M. Weingarten, and M. D. Zoback (2018). Physicsbased forecasting of man-made earthquake hazards in Oklahoma and Kansas, Nat. Comm. 9, no. 1, 3946.
- McClure, M., R. Gibson, K. K. Chiu, and R. Ranganath (2017). Identifying potentially induced seismicity and assessing statistical significance in Oklahoma and California, J. Geophys. Res. 122, no. 3, 2153–2172.
- Murray, K. (2015). Class II saltwater disposal for 2009–2014 at the annual-, state-, and county-scales by geologic zones of completion, Oklahoma, Open-File Report: OF5-2015, Oklahoma Geological Survey. [CrossRef]
- Norbeck, J.H., and Rubinstein, J.L. (2018). Hydromechanical earthquake nucleation model forecasts onset, peak, and falling rates of induced seismicity in Oklahoma and Kansas, Geophys Res Lett. 45(7), 2963-2975.
- Petersen, M. D., Mueller, C. S., Haller, K. M., Moschetti, M., Harmsen, S. C., Field, E. H.,... & Boyd, O. S. (2012). 2014 Update of the United States National Seismic Hazard Maps.
- Pollitz, F. F., Wicks, C., Schoenball, M., Ellsworth, W., & Murray, M. (2017). Geodetic Slip Model of the 3 September 2016 Mw 5.8 Pawnee, Oklahoma, Earthquake: Evidence for Fault-Zone Collapse. Seismological Research Letters, 88(4), 983–993. [CrossRef]
- Ries, R., Brudzinski, M. R., Skoumal, R. J., & Currie, B. S. (2020). Factors Influencing the Probability of Hydraulic Fracturing-Induced Seismicity in Oklahoma. Bulletin of the Seismological Society of America. [CrossRef]
- Roth, M. P., A. Verdecchia, R. M. Harrington, and Y. Liu (2020). High-resolution imaging of hydraulic-fracturing-induced earth- quake clusters in the Dawson-Septimus area, Northeast British Columbia, Canada, Seismol. Res. Lett. 91, no. 5, 2744–2756.
- Rubinstein, J. L., Ellsworth, W. L., McGarr, A., & Benz, H. M. (2014). The 2001-Present Induced Earthquake Sequence in the Raton Basin of Northern New Mexico and Southern Colorado. Bulletin of the Seismological Society of America, 104(5), 2162–2181. [CrossRef]
- Rubinstein, J. L., Ellsworth, W. L., & Dougherty, S. L. (2018). The 2013–2016 Induced Earthquakes in Harper and Sumner Counties, Southern Kansas. Bulletin of the Seismological Society of America, 108(2), 674–689. [CrossRef]
- Schoenball, M., and Ellsworth, W.L. (2017). A systematic assessment of the spatiotemporal evolution of fault activation through induced seismicity in Oklahoma and southern Kansas, J. Geophys. Res. Solid Earth. 122(12).
- Shapiro, S.A. (2015). Fluid-induced seismicity, Cambridge University Press. [CrossRef]
- Shapiro, S.A., Dinske, C., Langenbruch, C., and Wenzel, F. (2010). Seismogenic index and magnitude probability of earthquakes induced during reservoir fluid stimulations, Lead. Edge. 29(3), 304-309.
- Skoumal, R. J., R. Ries, M. R. Brudzinski, A. J. Barbour, and B. S. Currie (2018). Earthquakes induced by hydraulic fracturing are pervasive in Oklahoma, J. Geophys. Res. 123, no. 12, 10,918–10,935.
- Taylor, J., Çelebi, M., Greer, A., Jampole, E., Masroor, A., Melton, S., Norton, D., Paul, N., Wilson, E., & Xiao, Y. (2017). Damages after the M5 Cushing earthquake (Nov 7 2016) in Oklahoma (p. 25) [EERI]. EERI.
- Theis, C.V. (1935). The relation between the lowering of the piezometric surface and the rate and duration of discharge of a well using ground-water storage, Eos Trans. AGU, 16(2), 519-524.
- Weingarten, M., Ge, S., Godt, J.W., Bekins, B.A., and Rubinstein, J.L. (2015). High-rate injection is associated with the increase in US mid-continent seismicity, Science, 348(6241), 1336-1340.
- Yeck, W. L., G. P. Hayes, D. E. McNamara, J. L. Rubinstein, W. D. Barnhart, P. S. Earle, and H. M. Benz (2017). Oklahoma experiences largest earthquake during ongoing regional wastewater injection hazard mitigation efforts, Geophys. Res. Lett. 44, no. 2, 711–717.
- Zaliapin, I., Gabrielov, A., Keilis-Borok, V., & Wong, H. (2008). Clustering Analysis of Seismicity and Aftershock Identification. Physical Review Letters, 101(1). [CrossRef]
Figure 1.
(a) Time history of monthly HF & SWD volumes and declustered seismicity rates above M 2.5, within the area of Figure 1a. The HF data are incomplete before 2012, the seismicity data are incomplete below M 3 before 2012 and the SWD data are incomplete for 2022. (b) Map showing declustered seismicity (M ≥ 2.5; black dots), wells (blue: SWD; yellow: HF) and county/state borders. Data between 2006 and September 2022. The SWD database in Pawnee county is incomplete. See Figure A1 for a map of just the epicenters.

Figure 2.
Map showing declustered seismicity (M ≥ 2.5; black dots) and gridded (5km x 5km) total stimulation-days. Data between 2014 and 2022. The black diamonds indicate the four events above Mw 5. Country/state borders are also mapped.
Figure 2.
Map showing declustered seismicity (M ≥ 2.5; black dots) and gridded (5km x 5km) total stimulation-days. Data between 2014 and 2022. The black diamonds indicate the four events above Mw 5. Country/state borders are also mapped.
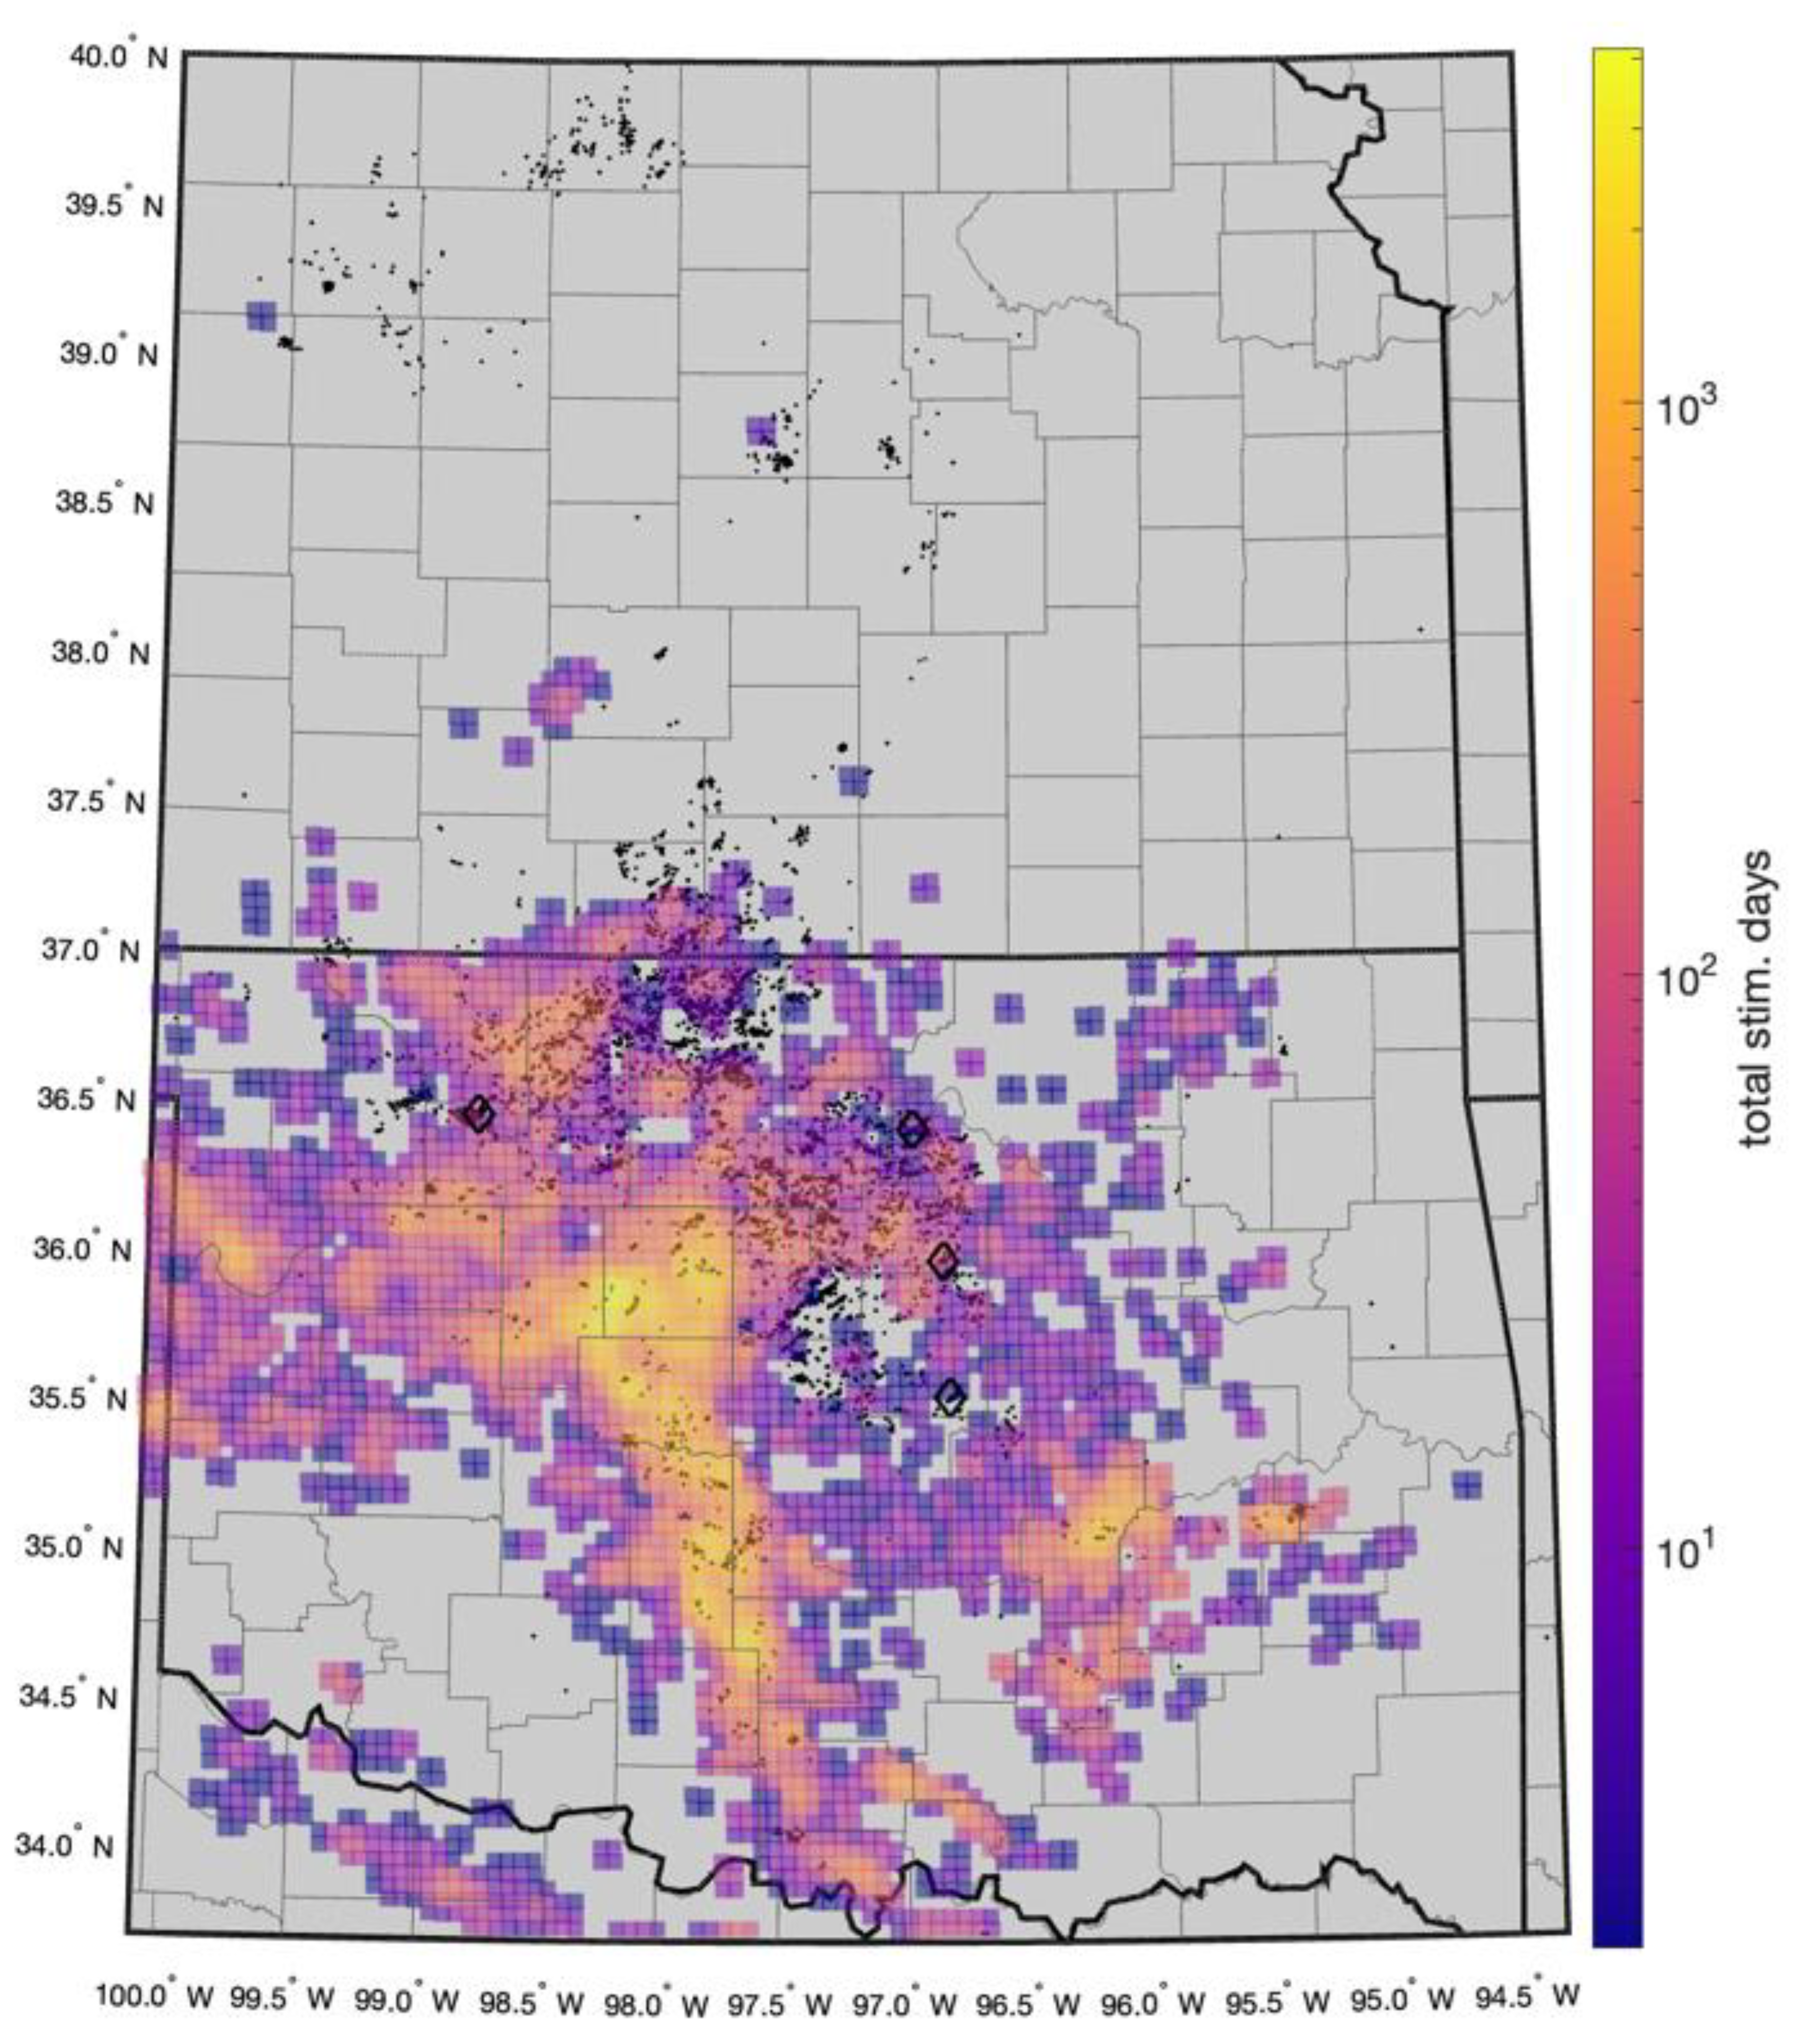
Figure 3.
Maps showing declustered seismicity (M ≥ 2.5; black dots), county/state borders, gridded cumulative injected (a), or distributed, with D = 2 m2/s, (b) SWD volumes. Data between 2000 and 2021. The black diamonds indicate the four events above Mw 5. The seismicity data are incomplete below M 3 before 2012 in OK and before mid-2014 in sKN.

Figure 4.
Declustering results for OK and KN, earthquakes with M ≥ 2.5, between 2000 and 2022. (left) the nearest-neighbor rescaled distance Rij and time Tij distribution. The color indicates if the events have been classified as background events or aftershocks. (right) the two stacked nearest-neighbor distance ηij distributions. The dashed black lines correspond to the fit of a Weibull function to both distributions while the black line shows the resulting sum and fit to the overall ηij distribution.
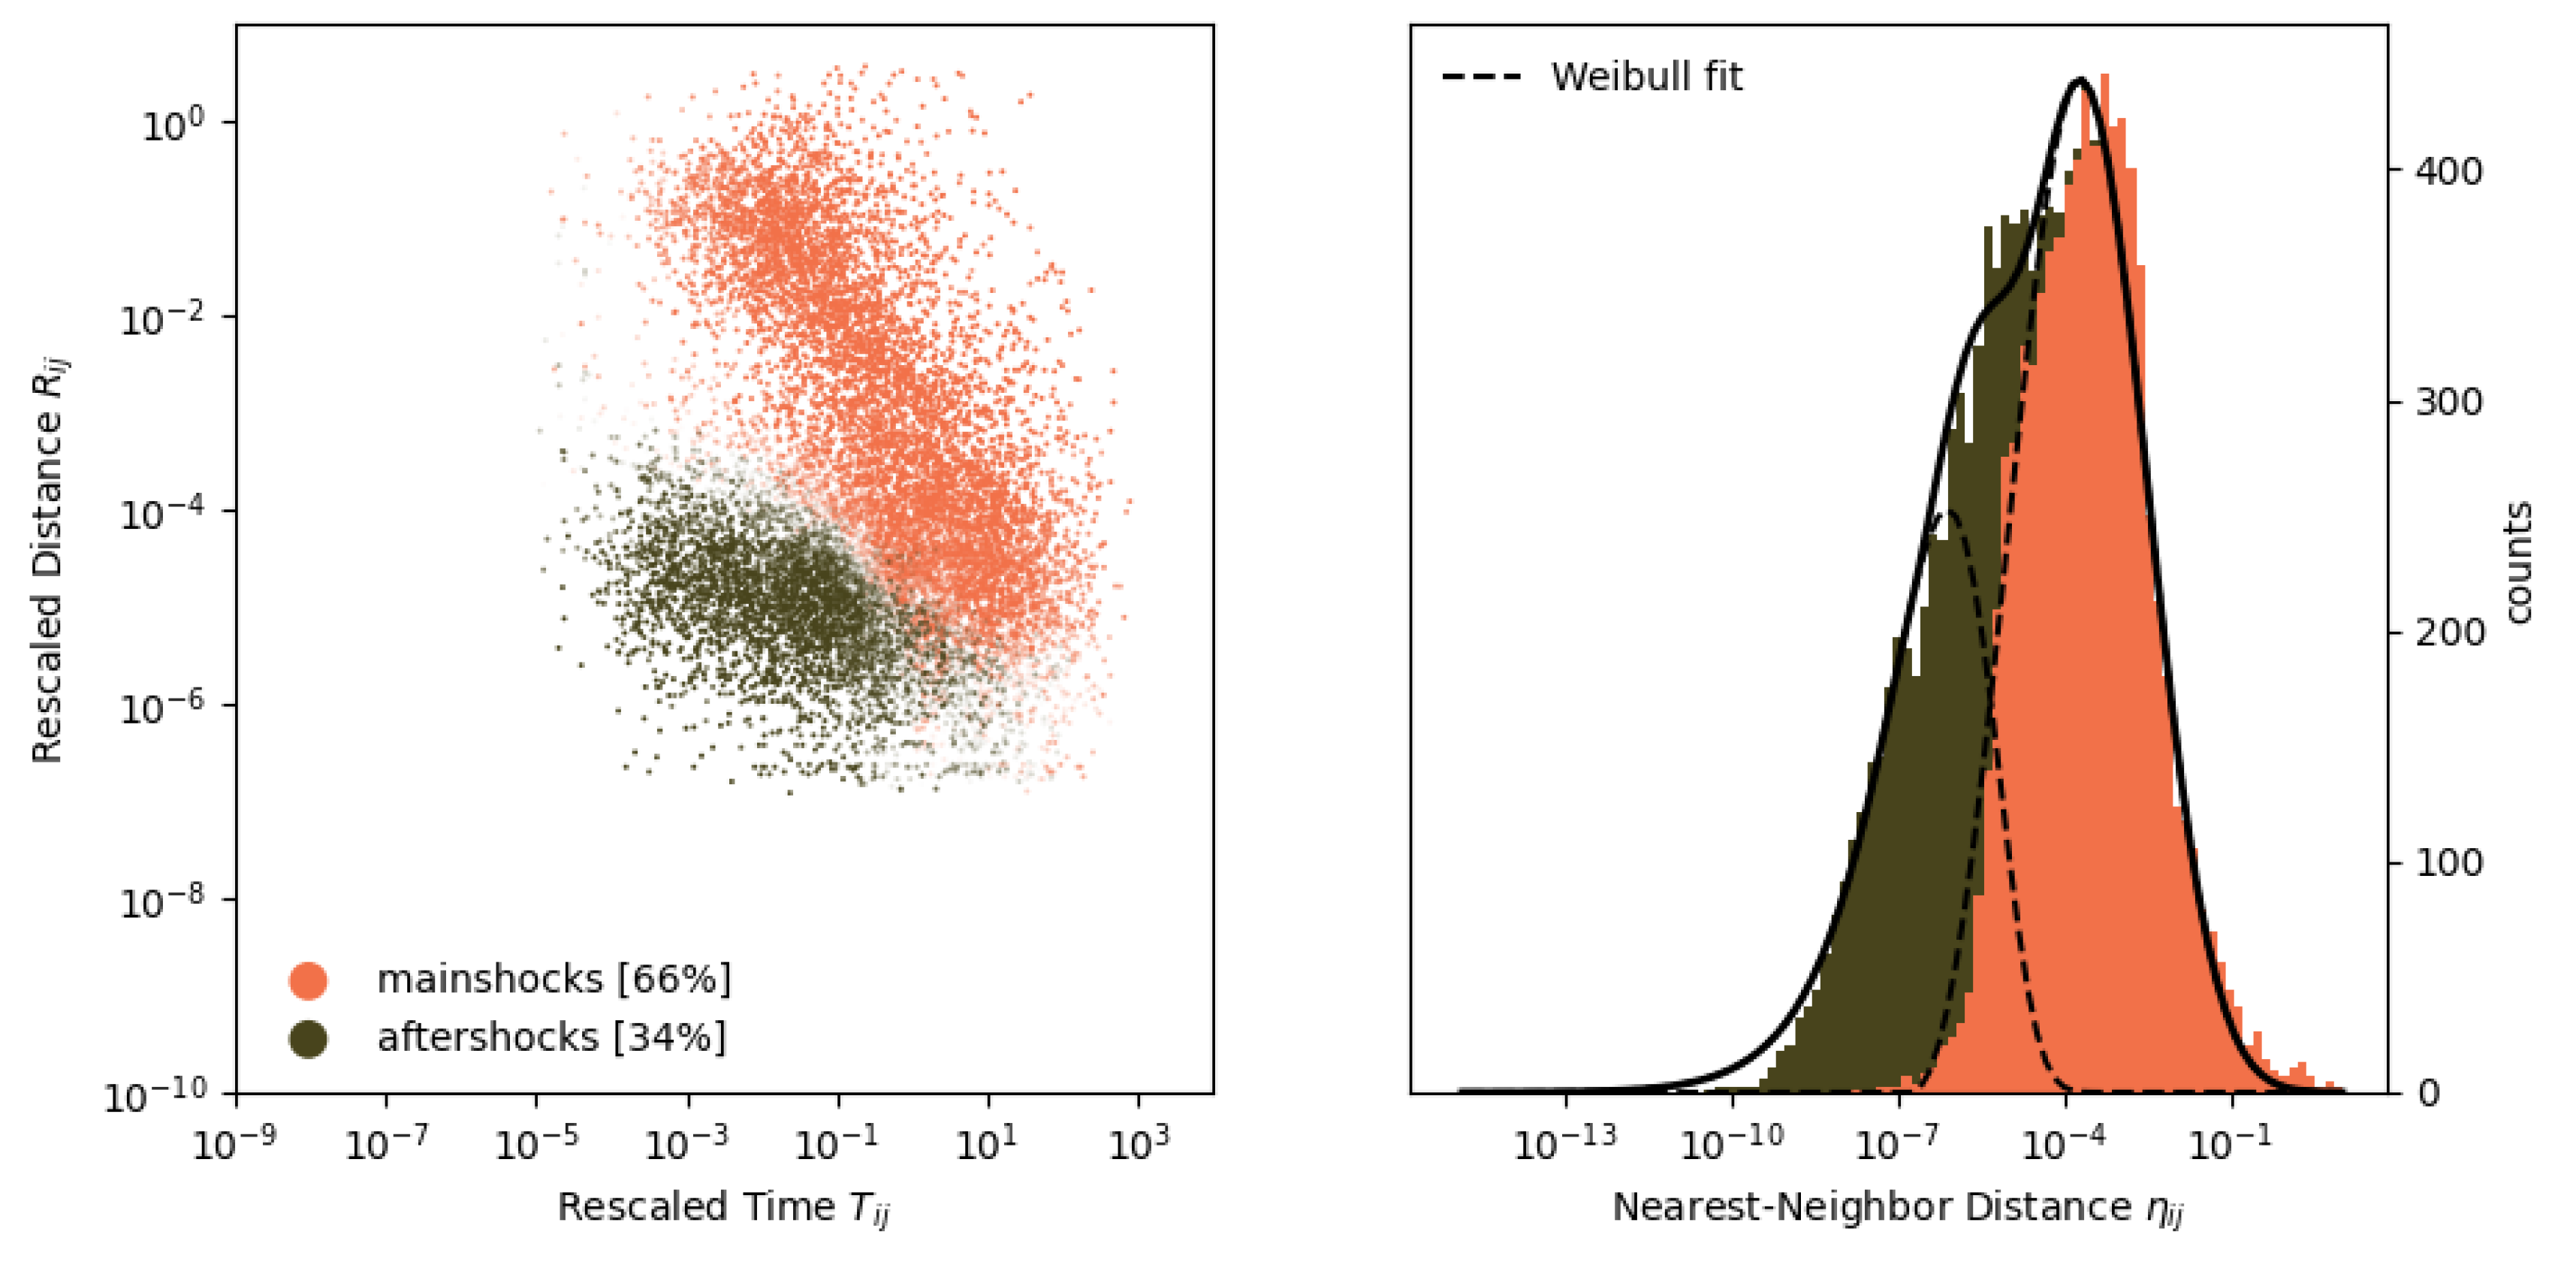
Figure 5.
Statistical p-values for SWD between 2012 and 2021, for D equal to 2 m2/s, with declustered earthquakes above M 2.5 overlapped. Only “active” blocks are color-coded. The black diamonds indicate the four events above Mw 5. County/state borders are also mapped. Black rectangles are taken from Skoumal et al. (2018) and represent areas with seismicity linked to hydraulic fracturing (HF). The grey polygon represents the SCOOP/STACK plays. See Figure A4 and Figure A5 for an extended version of this map including northern Kansas and for the non-declustered catalog, respectively. See Figure A6 and Figure A7 for D = 1 m2/s or 0.3 m2/s.
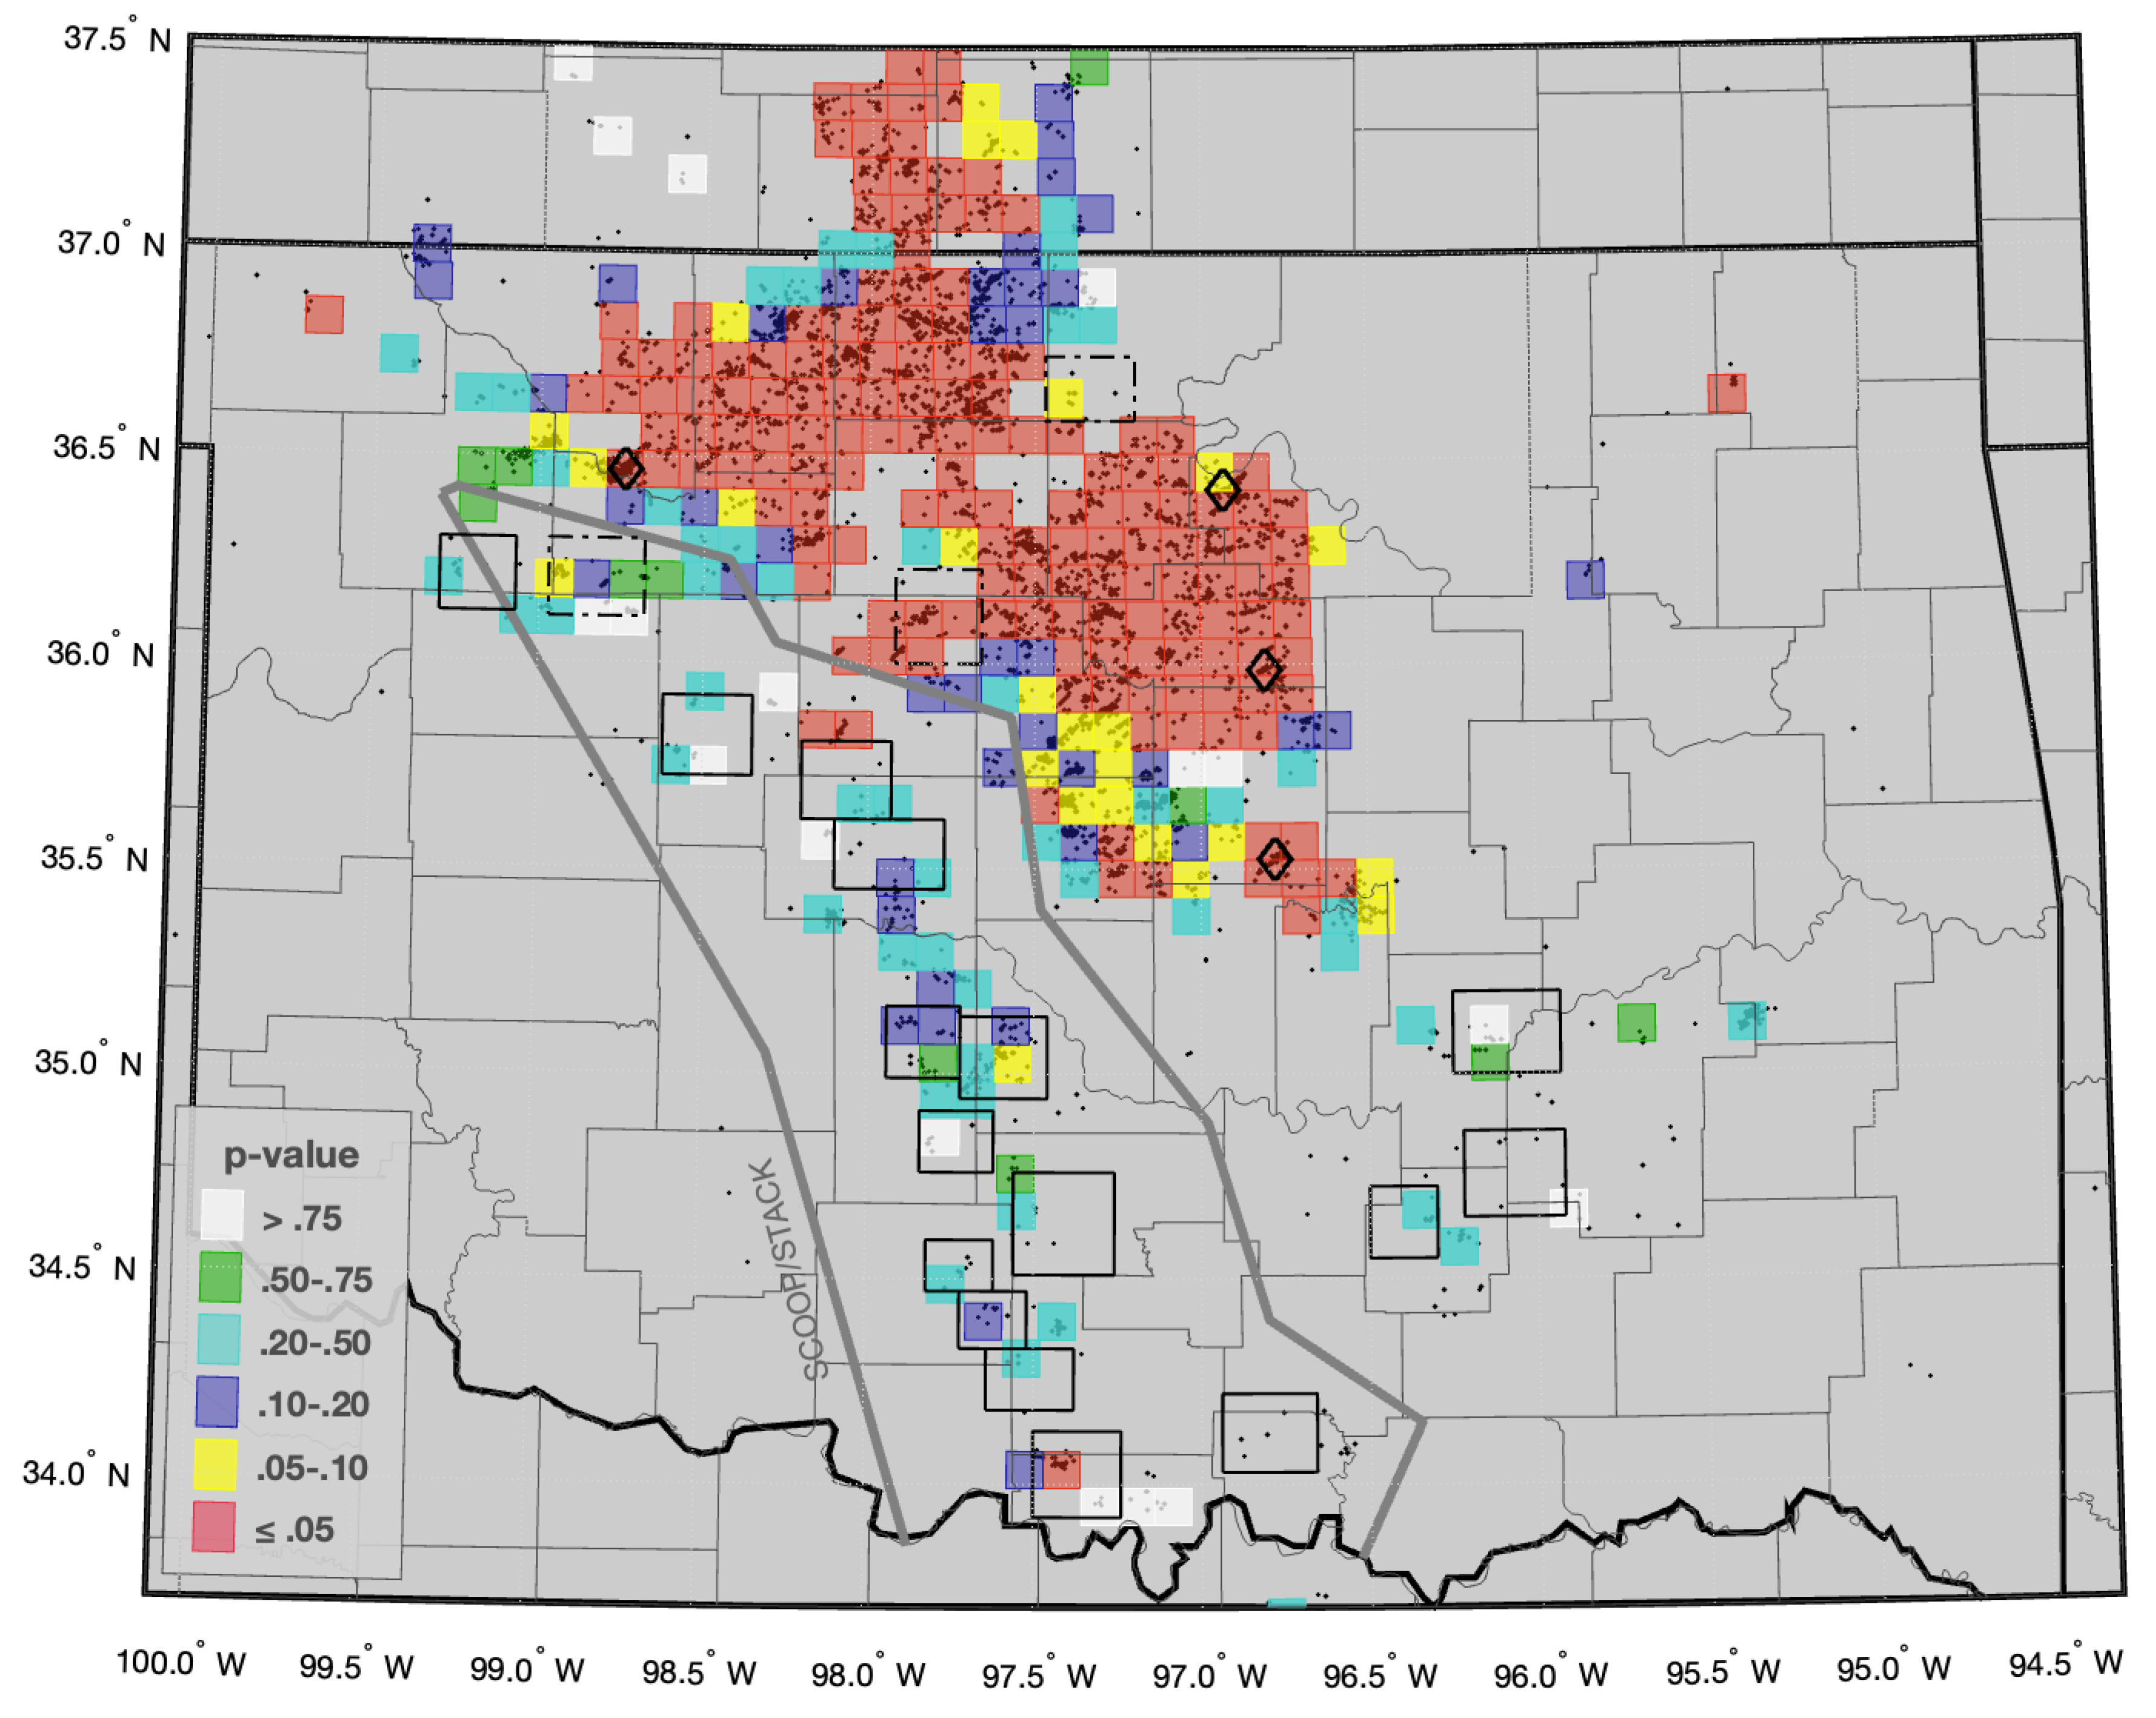
Figure 6.
HFR values mapped on a 5 km grid, with all declustered earthquakes between 2014 and 2022 above M 2.5 overlapped. Only blocks with at least three events are color-coded. The black diamonds indicate the four events above Mw 5. Country/state borders are also mapped. All not shown blocks within northern Kansas had HFR values equal to 0.
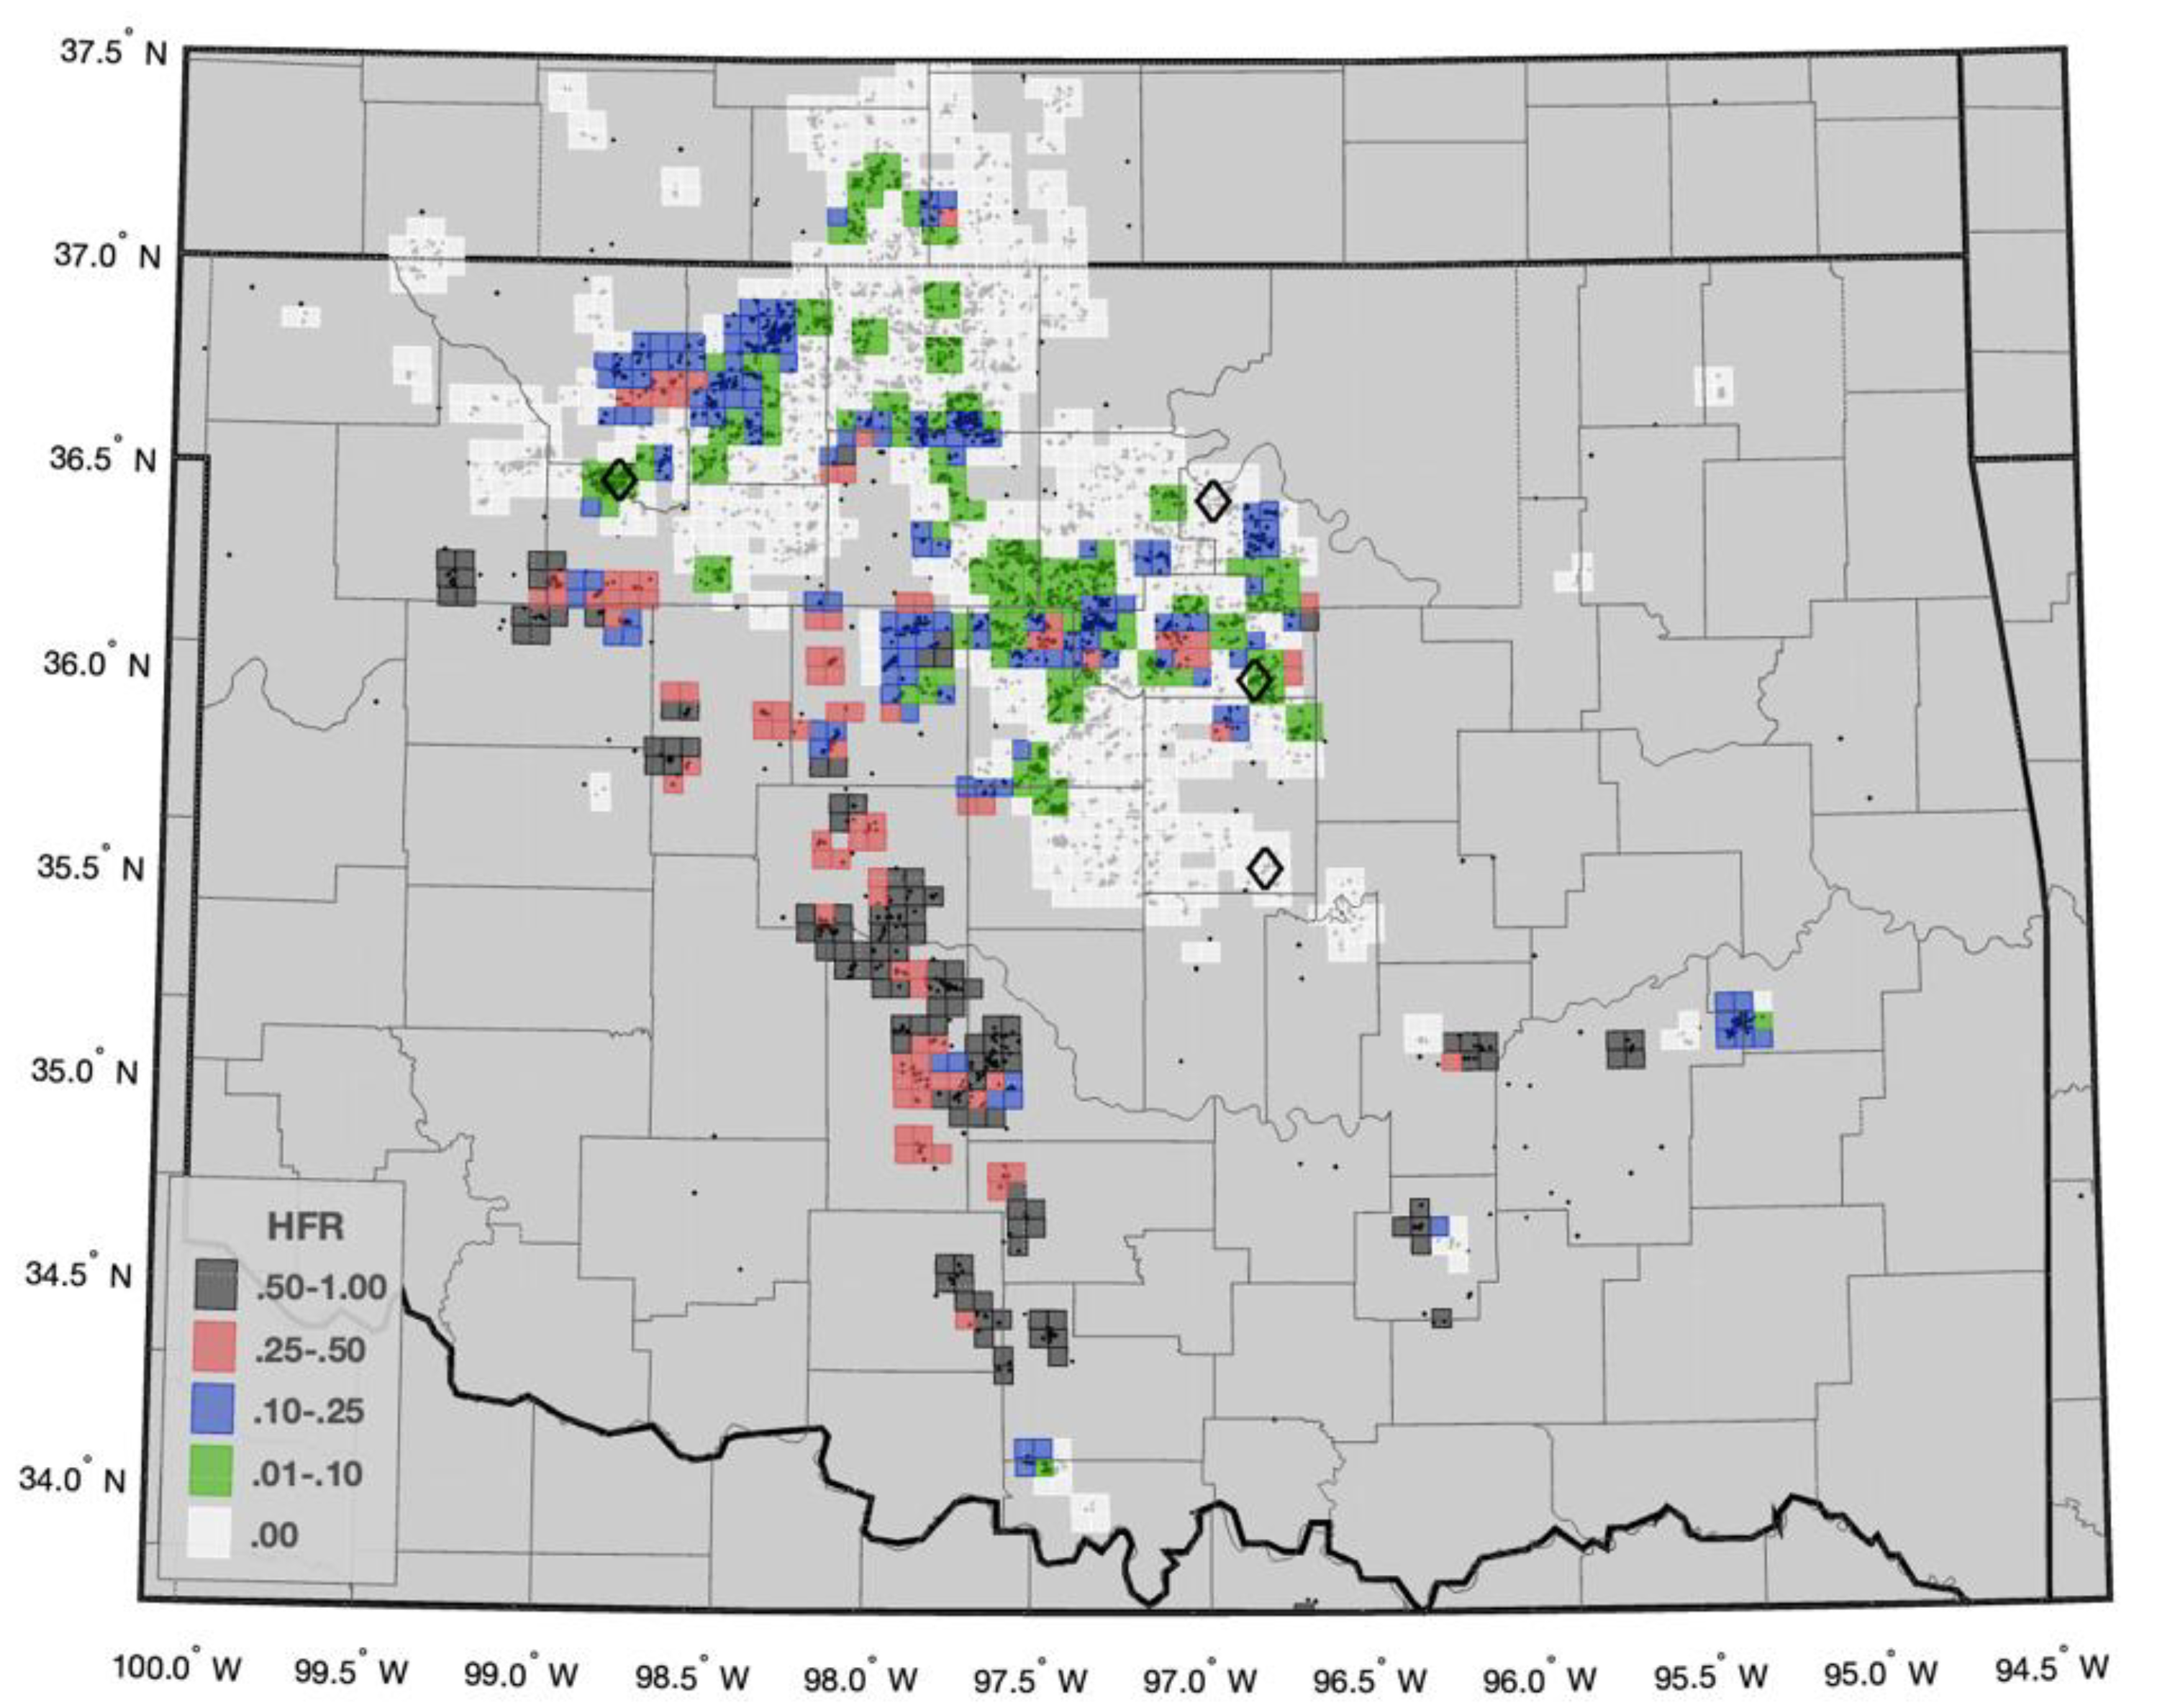
Figure 7.
Statistical p-values for HF between 2014 and 2022, with all declustered earthquakes above M 2.5 overlapped. Only “active” blocks are color-coded. The black diamonds indicate the four events above Mw 5. County/state borders are also mapped. Black rectangles are taken from Skoumal et al. (2018) and represent areas with seismicity linked to hydraulic fracturing (HF). The grey polygon represents the SCOOP/STACK plays. See Figure A11 for another version of this map using the constant time-lag.
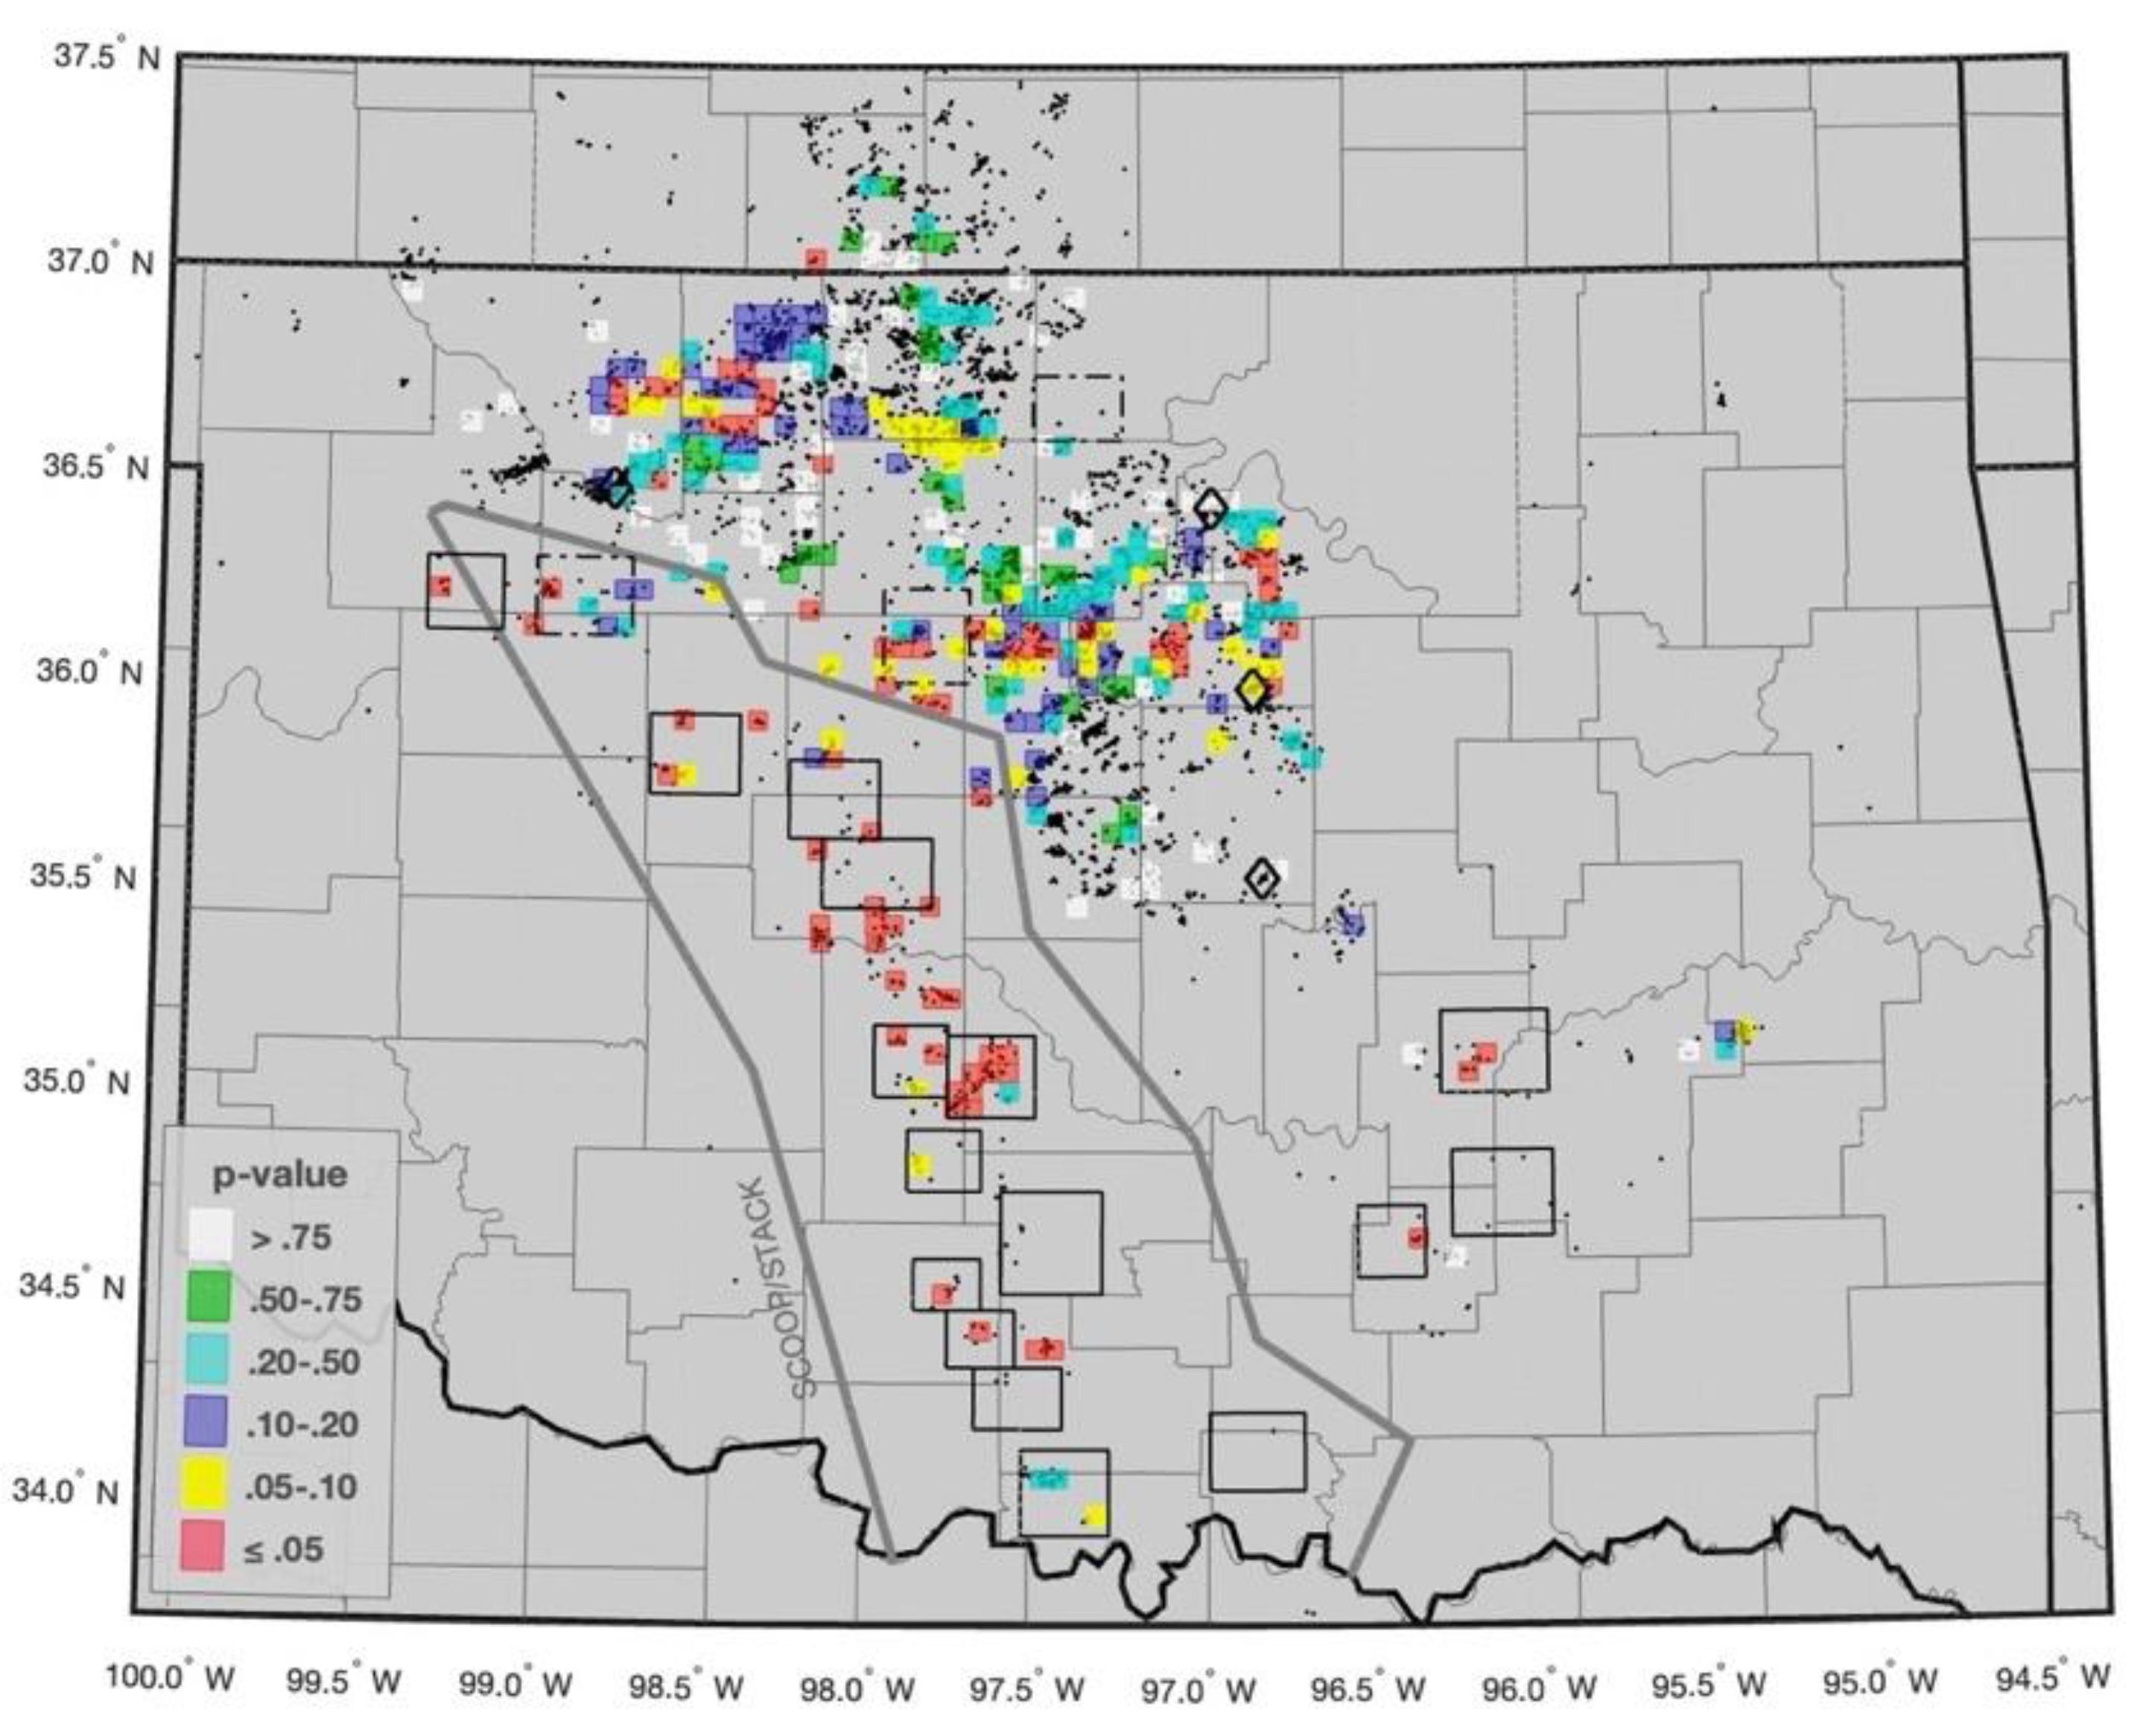
Figure 8.
Map of OK and sKN, showing all declustered earthquakes between 2014 and 2022 above M 2.5 (grey dots) and in red the subset of events that were in blocks with pHF ≤ 0.05 and fall within the HFR windows. Country/state borders are also mapped.
Figure 8.
Map of OK and sKN, showing all declustered earthquakes between 2014 and 2022 above M 2.5 (grey dots) and in red the subset of events that were in blocks with pHF ≤ 0.05 and fall within the HFR windows. Country/state borders are also mapped.
Disclaimer/Publisher’s Note: The statements, opinions and data contained in all publications are solely those of the individual author(s) and contributor(s) and not of MDPI and/or the editor(s). MDPI and/or the editor(s) disclaim responsibility for any injury to people or property resulting from any ideas, methods, instructions or products referred to in the content. |
© 2025 by the authors. Licensee MDPI, Basel, Switzerland. This article is an open access article distributed under the terms and conditions of the Creative Commons Attribution (CC BY) license (http://creativecommons.org/licenses/by/4.0/).
Copyright: This open access article is published under a Creative Commons CC BY 4.0 license, which permit the free download, distribution, and reuse, provided that the author and preprint are cited in any reuse.


