
Submitted:
06 May 2025
Posted:
09 May 2025
You are already at the latest version
Abstract
Ischemia reperfusion injury (IRI) is the primary cause of early complications in kidney transplantation and contributes to impaired graft function. Mitochondrial DNA (mtDNA), which is implicated in IRI-induced organ damage, has shown promise as a biomarker for assessing and predicting organ function, though studies have focused primarily on deceased donor transplantation. This post-hoc analysis of the VAPOR-1 study aimed to explore the presence, dynamics, and prognostic value of urinary mtDNA in a cohort of 57 living donor kidney transplantation (LDKT) recipients. Surprisingly, higher mtDNA gene levels in the first urine after transplantation were associated with higher estimated glomerular filtration rate (eGFR) at 12 as well as with an increase in eGFR between month 1 and month 24 after transplantation. These findings suggest that, contrary to prior assumptions of mtDNA as a damage marker, early urinary mtDNA levels may reflect graft function rather than injury. This study underscores the potential of urinary mtDNA as a prognostic tool for renal allograft function and advocates for a re-evaluation of the way early posttransplantation renal damage markers are interpreted in LDKT.
Keywords:
ischemia reperfusion injury
; living kidney donation
; mitochondrial DNA
; biomarker discovery
; eGFR trajectory
1. Introduction
Ischemia reperfusion injury (IRI) confers major damage in kidney transplantation and increases the risk of delayed graft function (DGF) and primary non function (PNF) [1,2,3]. Furthermore, IRI sensitizes the allograft to acute rejection and interstitial fibrosis and tubular atrophy (IFTA), thereby impairing graft and patient outcomes [4,5]. During IRI, mitochondria-derived reactive oxygen species (ROS) react with cellular components, causing mitochondrial membrane leakage and the release of mitochondrial damage-associated molecular patterns (DAMPs) like mitochondrial DNA (mtDNA) to the extracellular space [6,7,8,9]. MtDNA activates the innate immune system via the Toll-like receptor 9 (TLR-9), the NLRP3 inflammasomes, and the cyclic GMP–AMP synthase (cGAS), culminating in NFκB activation and downstream pro-inflammatory cascades leading to renal damage [7,10,11].
Accurate assessment of IRI-induced damage is challenging. In clinical practice, urine production and creatinine clearance are used as surrogate markers, however, when urine production is too low to assess clearance, additional invasive and time-intensive diagnostics are required to identify the cause. Cystatin C is often suggested as alternative indicators, but as a functional biomarker like creatinine, it can only detect damage after the injury is inflicted [12,13,14,15,16,17]. Several injury biomarkers, including kidney injury molecule-1 (KIM-1), N-acetyl-β-D-glucosaminidase (NAG), and neutrophil gelatinase-associated Lipocalin (NGAL) have been proposed to predict graft function in the early stages after transplantation, as they are related to damage and/or repair mechanisms [18,19] Although their urinary excretion rises post-transplant, studies show inconsistent predictive value for graft outcomes [20,21,22,23]. Therefore, there is a need to explore novel biomarkers for the evaluation of current and future graft function.
Plasma and urinary mtDNA are under investigation as biomarkers for detecting kidney damage after transplantation. Recent literature links donor plasma mtDNA to allograft function and rejection in recipients, and we have previously shown that recipient plasma mtDNA in the first week post-transplant predicts kidney function at one month [24,25,26]. MtDNA can accumulate in urine from either circulating plasma mtDNA through glomerular filtration or by being directly released into the urine from damaged or dying tubular cells [1,2,3,4,5,8,11,27,28]. This makes urinary mtDNA a candidate biomarker to predict transplant outcomes, particularly when urine production is sparse. Recent studies have demonstrated that urinary mtDNA levels in graft recipients - following both living and deceased donor transplantation - are associated with ischemia times, as well as the incidence of delayed graft function and rejection [10,11]. However, the long-term predictive value of urinary mtDNA in LDKT is unexplored. In this study, we analyzed the presence of urinary mtDNA in a living donor kidney transplantation (LDKT) cohort to explore a potential relationship with allograft outcomes. To our knowledge this is the first study to assess recipient urinary mtDNA at multiple time points within the first week after LDKT. Here, we report the temporal profile of urinary mtDNA and its association with graft function over two years, focusing on three mitochondrial genes: NADH ubiquinone oxidoreductase subunit 1 (ND1), NADH ubiquinone oxidoreductase subunit 6 (ND6), and Displacement-loop (D-loop).
2. Materials and Methods
2.1. Study Population
This study was a post-hoc analysis of the VAPOR-1 (Volatile Anesthetic Protection of Renal Transplants-1) trial, a prospective randomized controlled trial comparing the effect of two anesthetic agents (propofol vs. sevoflurane) on graft outcome in LDKT. The VAPOR-1 trial was conducted at the University Medical Center of Groningen between September 2010 and October 2014. The Institutional Review Board approved the study protocol (METc 2009/334), which was conducted in adherence to the Declaration of Helsinki and registered with ClinicalTrials.gov: NCT01248871. Details of the study have previously been published [29]. Inclusion criteria were age ≥ 18 years, donation of the left kidney, and written informed consent. Exclusion criteria were ABO-incompatible transplantation, altruistic donors, and a body mass index (BMI) ≤17 or ≥ 35 kg/m2. In total, 60 donor–recipient couples were initially included and randomly assigned to one of the following groups: PROP, propofol for the donor and recipient; SEVO, sevoflurane for the donor and recipient; and PROSE, propofol for the donor and sevoflurane for the recipient.
2.2. Outcome
The primary objective of this study was to assess the dynamics of mtDNA release into urine at multiple time points after transplantation. MtDNA levels were quantified using the quantification cycle (Cq) of three genes: ND1, ND6, and D-loop. ND1 and ND6 were selected because they encode respiratory chain proteins located on different strands of the mitochondrial genome (ND1 on the heavy strand, ND6 on the light strand). The D-loop was included as a representative non-coding region. While the clinical significance of differences between these subunits remains uncertain, our gene selection aimed to capture both structural and functional aspects of mitochondrial DNA relevant to injury and recovery.
Secondary outcomes were the associations of the levels of urinary mtDNA with graft function after transplantation, which was defined by several outcomes. Due to budgetary restrictions, a selection of mtDNA in the first urine and 2 hours after transplantation was made for associations with secondary outcomes because these timepoints have not been reported in the existing literature. Kidney function, defined as estimated glomerular filtration rate (eGFR) as calculated by the CKD-EPI formula, measured at 1, 12, and 24 months after transplantation was a secondary outcome. The difference in eGFR between 1 and 24 months after transplantation (ΔeGFR), was used to discriminate progression of kidney function over time and could be either positive or negative. In order to prevent excessive testing, it was decided not to analyse eGFR at 3 and 6 months after transplantation. Other outcomes were the occurrence of DGF (defined as the need for dialysis in the first week after transplantation), acute rejection, graft loss, and patient mortality.
2.3. Timepoints
Timepoints for urine sampling were the first produced urine upon reperfusion, urine 2 hours post-operative and on days 1, 2, and 6 after transplantation. Urine samples were collected from a splint in the ureter of the graft, exteriorized as a suprapubic catheter.
2.4. Nuclear and Mitochondrial DNA Analysis
Isolation of mtDNA and nuclear DNA (nDNA) from urine supernatant was performed with a Maxwell® RSC cfDNA Plasma Kit (Promega, Madison, WI, USA), according to the manufacturer’s protocol. Quantitative polymerase chain reaction (qPCR) was performed to determine the presence of nuclear and mitochondrial DNA. Primers were designed using Clone Manager 9 software (Sigma Aldrich, Darmstadt, Germany) (Table 1). The isolated mtDNA was quantified and validated with CFX384- Real-Time system (Bio-Rad, Hercules, CA, USA) targeting the mitochondrial genes ND1, ND6 and D-loop. Melting curve analysis was performed to confirm the specificity of the qPCR products. All reactions were carried out in duplicate, and the averaged Cq values were used for analysis. To account for urine concentration, mtDNA levels were normalized with urinary creatinine levels (measured at the clinical laboratory of the UMCG). Because Cq values are inversely related to the level of mtDNA, lower Cq values indicate higher levels of mtDNA.
2.5. mtDNA Copy Number Analysis
MtDNA copy number was performed according to a protocol (method B; steps 16a and 17a) published by Quiros et al. (2017)[30]. Specifically, the number of mtDNA copies was calculated using a two-step formula based on the difference in Cq values between nuclear DNA (nDNA) and mtDNA, correcting for the multiple copies of mtDNA per nDNA:
- ΔCq = Cq (nDNA gene) – Cq (mtDNA gene)
- Copies of mtDNA = 2 × 2^ΔCq
This approach leverages quantitative PCR measurements of the respective copy numbers of mtDNA and nDNA and as such operates by treating urine as a tissue proxy, where nDNA serves as a stable marker of cell death. By comparing mtDNA to nDNA levels (ΔCq), this method helps to distinguish between isolated mtDNA release – which may result from filtration or secretion – and actual cell loss, which releases both nDNA and mtDNA. This distinction helps determine whether urinary mtDNA originates from renal tubular cells due to injury, or primarily reflects the kidney’s filtration and clearance of circulating DAMPs.
2.6. Statistical Analysis
Statistical analyses were performed using SPSS version 28 and GraphPad Prism version 9.0.1. Normality of distributions was assessed using the Shapiro-Wilk test and visualized with QQ plots. Data are presented as mean ± standard deviation (SD) for normally distributed variables, median (interquartile range, IQR) for non-normally distributed variables, and proportions (n) with corresponding percentages for categorical variables. Outliers were retained to reflect potentially significant patient cases. Urinary mtDNA dynamics over time were analyzed using repeated-measures one-way ANOVA with Geisser-Greenhouse correction and the two-stage linear step-up procedure of Benjamini, Krieger, and Yekutieli (FDR = 0.05). Mitochondrial DNA copy number was analyzed using two-way ANOVA (REML) with the same FDR correction. The relationship between mtDNA and transplant outcomes was assessed using univariable linear regression. Since higher Cq values indicate lower mtDNA concentrations, B- and β-values in regression models are negative when mtDNA is positively associated with the outcome. Patient subgroups were created by calculating the mean of eGFR at 12 and 24 months after transplantation for each patient, and quartiles were used for stratification.
3. Results
3.1. Baseline Characteristics
After inclusion, three donor-recipient couples were excluded from the primary analysis due to violation of the surgical or immunosuppressive protocol, leaving 57 donor-recipient couples, their baseline characteristics are summarized in Table 2.
3.2. Dynamics and Stratification of mtDNA Genes in Recipients After Transplantation
The dynamics of the mtDNA genes are presented in Figure 1A–C. There was a significant decrease in the level of mtDNA between the first urine and two hours (ND1 individual p=0.0259, q=0.0408, ND6 individual p=0.0268, q=0.0422, D-loop individual p=0.0088, q=0.0093). This was followed by a significant increase of mtDNA between 2 hours post-operation and day 1 after transplantation (ND1 individual p<0.0001, q<0.0001, ND6 individual p<0.0001, q<0.0001, D-loop individual p<0.0001, q<0.0001), after which no significant differences were observed between day 1 and day 2 (ND1 individual p=0.2643, q=0.2776, ND6 individual p=0.2511, q=0.2637, D-loop individual p=0.4315, q=0.3020) and between day 2 and day 6 post transplantation (ND1 individual p=0.5639, q=0.4440, ND6 individual p=0.6144, q=0.4838, D-loop individual p=0.7475, q=0.3924).
To explore whether these dynamics relate to graft function, patients were grouped into quartiles based on their mean eGFR at 12 and 24 months. Figure 1D–F illustrate the mtDNA trajectories per quartile, providing a visual representation of differences in mtDNA levels over time across varying levels of long-term renal function. The average eGFR outcomes were 18.0 – 37.6 ml/min/1.73m² for the fourth quartile, 37.61 – 50.15 ml/min/1.73m² for the third quartile, 50.16 – 57.50 ml/min/1.73m² for the second quartile and 57.51 – 103 ml/min/1.73m² for the first quartile.
As a next step, we formally evaluated the relationship between urinary mtDNA and graft function outcomes using univariable regression models. These analyses are presented in the following section and detailed in Table 3.
3.3. The Additional Value of mtDNA Genes to Models for Renal Outcome
Univariable analysis of ND1, ND6 and D-loop showed several potential relations with eGFR after transplantation. A higher level of ND1 in the first urine after transplantation was significantly associated with higher eGFR at 12 months (p=0.008, q=0.030, B=-1.303) and an increase in eGFR between month 1 and 24 months after transplantation (p=0.009, q=0.030, B=-1.372), but not with eGFR at 1 month (p=0.742, q=0.515, B=0.183) or 24 months after transplantation (p=0.036, q=0.052, B=-1.311). A higher level of ND1 2 hours post-operative was significantly associated with an increase in eGFR between month 1 and 24 months after transplantation (p=0.007, q=0.030, B=-1.188), but not with eGFR at 1 month (p=0.479, q=0.391, B=0.335), 12 months (p=0.250, q=0.219, B=-0.512) and 24 months after transplantation (p=0.064, q=0.067, B=-1.029)(Table 3).
Furthermore, a higher level of ND6 in the first urine after transplantation were significantly associated with higher eGFR at 12 months (p=0.016, q=0.030, B=-1.050) and an increase in eGFR between month 1 and 24 months after transplantation (p=0.015, q=0.030, B=-1.141), but not with eGFR at 1 month (p=0.752, q=0.515, B=0.154) or 24 months after transplantation (p=0.046, q=0.060, B=-1.098). A higher level of ND6 2 hours post-operative was significantly associated with an increase in eGFR between month 1 and 24 months after transplantation (p=0.014, q=0.030, B=-1.066), but not with eGFR at 1 month (p=0.585, q=0.439, B=0.250), 12 months (p=0.227, q=0.210, B=-0.520) and 24 months after transplantation (p=0.064, q=0.067, B=-0.997).
Finally, a higher level of D-loop in the first urine after transplantation were significantly associated with higher eGFR at 12 months (p=0.011, q=0.030, B=-1.259) and an increase in eGFR between month 1 and 24 months after transplantation (p=0.017, q=0.030, B=-1.231), but not with eGFR at 1 month (p=0.952, q=0.625, B=0.032) or 24 months after transplantation (p=0.036, q=0.052, B=-1.326). A higher level of D-loop 2 hours post-operative was significantly associated with an increase in eGFR between month 1 and 24 months after transplantation (p=0.005, q=0.030, B=-1.168), but not with eGFR at 1 month (p=0.496, q=0.391, B=0.309), 12 months (p=0.217, q=0.210, B=-0.528) and 24 months after transplantation (p=0.054, q=0.065, B=-1.025).
To determine whether urinary creatinine alone was associated with graft outcomes, univariable regression analyses were performed. These showed no consistent associations between urinary creatinine and eGFR at any timepoint (Appendix Table A1).
3.4. mtDNA Copy Number Analysis
Copy number analysis is shown in Figure 2A–C. To assess potential differences in long-term graft function, patients were stratified by mean eGFR at 12 and 24 months, selecting the nine recipients with the best and worst function. The patients within the worst outcome groups also all experienced an acute rejection period (see Table 2), whereas patients within the best function group did not. No significant differences in mitochondrial DNA copy number were found between treatment outcome groups based on average eGFR (Figure 2A: ND1 p = 0.4426, Figure 2B: ND6 p = 0.1982, Figure 2C: D-loop p = 0.1677) or over time (ND1 p = 0.1363, ND6 p = 0.5199, D-loop p = 0.4211).
4. Discussion
This study aimed to investigate the temporal profile of urinary mtDNA and whether urinary mtDNA levels in the early post-transplant period can predict long-term graft function in living donor kidney transplantation (LDKT). Our findings demonstrate that higher levels of ND1, ND6, and D-loop in the first urine are significantly associated with improved renal function at 12 as well as an improvement in renal function from 1 to 24 months. While these improvements were small and clinically insignificant in the current setting, the correlation remains highly relevant. Importantly, the current data primarily serve to establish the existence of a consistent relationship between early mtDNA levels and graft function. Whether this relationship is positive, negative, or clinically impactful may vary per context, but the presence of a reproducible association supports mtDNA as a meaningful biological readout. This underscores the biomarker’s potential relevance in settings with more pronounced ischemia-reperfusion injury (IRI) – such as donation after circulatory death (DCD) and donation after brain death (DBD) kidney transplantation, or cardiothoracic surgery – where these associations may shift in direction but become clinically significant [1,31]. Therefore – despite the modest effect size – this study further consolidates the validity of cell-free urinary mtDNA as a biomarker for graft function in kidney transplantation; aligning with prior research in trauma, sepsis, and acute kidney injury, where increased mtDNA levels have consistently correlated with negative clinical outcomes such as organ failure and recovery [28,32,33,34,35,36,37]. Interestingly, however, our findings reveal an inverse relationship compared to most previous reports, which linked elevated mtDNA to tissue injury and worse outcomes [10,24,38,39]. In contrast, in our LDKT cohort, higher urinary mtDNA levels were associated with improved graft function, suggesting a context-dependent interpretation. Importantly, we confirmed that urinary creatinine levels alone were not consistently associated with long-term graft function (Appendix Table A1), reinforcing that the observed mtDNA associations are not simply a result of variation in urine concentration.
Given the kidney’s high metabolic demands, it is one of the most mitochondria-rich organs, making it particularly vulnerable to IRI [40,41]. Next to the increased release of mtDNA, IRI leads to mtDNA damage, exacerbating and manifesting sustained mitochondrial dysfunction leading to chronic low-grade release of mitochondrial DAMPs [1,31,42,43,44,45,46]. Furthermore, mitochondrial dysfunction shifts energy production from ATP generation toward excessive reactive oxygen species (ROS) production, resulting in oxidative stress, bioenergetic deficits, and impaired organ function [47,48,49]. This context is essential for understanding the complex relationship between mtDNA levels, mitochondrial integrity and renal function after transplantation. This mechanism of sustained mitochondrial dysfunction and DAMP release also plays a central role in other forms of renal injury, such as acute kidney injury (AKI). It makes intuitive sense that a graft capable of promptly clearing circulating mtDNA may contract less damage and function better. For example, mtDNA is implicated in the etiology of acute kidney injury (AKI) [28,32,50]. In sepsis-AKI, urinary mtDNA is elevated and positively associated with serum creatinine levels [33]. The same applies to AKI following cardiac surgery [34]. MtDNA acts a damage-associated molecular pattern (DAMP), released upon mitochondrial membrane leakage or cell death [51,52,53]. (Severe) AKI leads to acute tubular necrosis, through several forms of (regulated) cell death that contribute to tubular demise, including highly immunogenic types such as necroptosis, pyroptosis, and ferroptosis [53,54,55]. As cell death is the main mechanism of DAMP release, the extent of tubular injury correlates with mtDNA release. These necrotic pathways trigger innate immune activation via TLR-9, NLRP3, and cGAS, leading to NF-κB-driven inflammation [56,57,58]. This inflammatory cascade primes the adaptive immune system, contributing to chronic allograft rejection [10,24,59,60,61]. Previous studies associate high mtDNA levels with worse outcomes, particularly in deceased donor kidney transplantation, where prolonged ischemia amplifies mitochondrial damage [10,24]. In contrast, our findings in LDKT suggest that early urinary mtDNA release may reflect efficient functional clearance rather than ongoing injury. This discrepancy supports the idea that mtDNA dynamics in LDKT are shaped more by the kidney’s ability to clear systemic DAMPs than reflecting mitochondrial injury alone, emphasizing the need to evaluate biomarkers within their specific clinical context [45].
A cell’s mitochondrial mass can be approximated by the mitochondrial copy number, which is calculated by a weighted ratio of nuclear to mitochondrial DNA. In kidney disease, lower levels of mtDNA are associated with disease progression and decreased function [35,36,37,38,62,63]. Therefore, one possible explanation would be that the best functioning kidneys had more mitochondria, i.e., a higher mitochondrial copy number, and proportionally excreted more mtDNA into the urine. However, when treating urine as a tissue and calculating the mitochondrial copy number based on the presence of mtDNA and nuclear DNA, mitochondrial copy number was equal throughout all groups (Figure 2). This finding suggests that urinary mtDNA levels are not simply a reflection of mitochondrial abundance within renal cells. If increased urinary mtDNA originated primarily from the kidney itself, we would expect differences in mitochondrial copy number across groups. Instead, the fact that mitochondrial copy number remains stable indicates that urinary mtDNA levels are more likely governed by systemic factors, such as the kidney’s filtration and clearance capacity [64].
One possible interpretation is that mtDNA, when released into the circulation as a damage-associated molecular pattern (DAMP), must be efficiently cleared to prevent excessive inflammatory signaling. The kidney seems to play a crucial role in this process by filtering and excreting circulating mtDNA fragments [64,65]. In this context, higher urinary mtDNA levels may not reflect increased mitochondrial injury, but rather a well-functioning graft capable of effectively clearing free mtDNA from the circulation. Consequently, elevated mtDNA in urine may serve as a marker of optimal filtration capacity and excellent graft function, rather than an indicator of cellular damage within the kidney itself [24,35,37].
The setting of LDKT may explain why our findings differ from previous studies. These kidneys are derived from healthy donors with short cold ischemic times and immediate graft function in the majority of patients. In this case, it seems likely that surgical trauma causes the release of DAMPs, among which mtDNA, from the surgical site [39,65,66]. The mtDNA fragments presented in the systemic circulation are then filtered through the glomeruli and actively secreted into the urine, resulting in elevated mtDNA levels in the first urine upon reperfusion. The better the kidney functions, the faster the mtDNA appears in the urine. This is an important finding and underlines the importance of studying biomarkers in different contexts [10,26].
Supporting this, we recently demonstrated in the same cohort that kidney injury molecule-1 (KIM-1), traditionally a kidney damage marker, was related to long-term kidney function following the same pattern as cell-free mtDNA - in which higher levels are associated with better graft function [20]. This highlights the need to interpret biomarkers within specific contexts to avoid misjudging graft function. Collectively, our data suggest that biomarkers in LDKT show distinctively different behavior than in post-mortem transplantation yet confirm the usability of cell-free mtDNA as a prospective biomarker.
5. Future Perspectives and Limitations
While our sample size of 57 LDKT recipients was relatively small, it provided a homogeneous cohort with high organ quality and predictable outcomes. This limited our ability to assess complications such as delayed graft function (n = 3), graft loss (n = 2), and patient mortality (n = 1). Larger studies, particularly in deceased donor kidney transplantation, are needed to evaluate the broader applicability of our findings. Additionally, budget constraints restricted the number of urine collection timepoints, which may have limited our ability to capture the full dynamics of mtDNA release.
A major strength of this study is the use of split urine samples, ensuring all urine analyzed originated from the transplanted kidney. The ongoing VAPOR-2 study, as a direct follow-up to VAPOR-1, will expand upon these findings with a larger and more diverse cohort, allowing further insights into mtDNA dynamics and its prognostic value across different transplantation settings.
6. Conclusions
This study suggests that in LDKT, a higher urinary level of mtDNA in the first urine correlates with higher renal function at 12 and increases in eGFR between month 1 and 24 after transplantation. These higher urinary mtDNA levels reflect kidney filtration ability to clear system mtDNA rather than mtDNA release from the kidney´s tubular cells. This counterintuitive relation between damage markers and renal function calls for a paradigm shift in interpreting renal damage markers in IRI-induced AKI particularly in living donor kidney transplantation, as previous studies in kidney transplantation, have typically assessed mtDNA levels weeks after transplantation, whereas our study is among the first to examine these levels within the initial minutes to days. This difference in timing may be a key factor influencing biomarker interpretation.
Author Contributions
LPG: Conceptualization, Investigation, Methodology, Formal analysis, Data curation, Visualization, Writing – original draft, Writing – review & editing. GJJ: Investigation, Formal analysis, Data curation, Writing – original draft, Writing – review & editing. NAS: Data interpretation, Writing – review & editing. FLC: Methodology. MMRFS: Conceptualization, Investigation, Writing – review & editing. HGDL: Conceptualization, Investigation, Writing – review & editing. RHH: Supervision, Writing – review & editing. GJNM: Conceptualization, Investigation, Supervision, Writing – review & editing.
Funding
VAPOR-1 was funded by the University Medical Centre Groningen, Groningen, The Netherlands (internal effectivity grant no. 684000). This work was supported by GUIDE and University Medical Centre Groningen (MD/PhD grant to L.P.G. and MD/PhD grant to N.A.S.).
Institutional Review Board Statement
This study was a post-hoc analysis of the VAPOR-1 (Volatile Anesthetic Protection of Renal Transplants-1) trial, a prospective randomized controlled trial comparing the effect of two anesthetic agents (propofol vs. sevoflurane) on graft outcome in LDKT. The VAPOR-1 trial was conducted at the University Medical Center of Groningen between September 2010 and October 2014. The Institutional Review Board approved the study protocol (METc 2009/334), which was conducted in adherence to the Declaration of Helsinki and registered with ClinicalTrials.gov: NCT01248871. Details of the study have previously been published [29].
Informed Consent Statement
Informed consent was obtained from all subjects involved in the study.
Data Availability Statement
The data that support the findings of this study are available from the corresponding author upon reasonable request.
Acknowledgements
Special thanks to Simon (S.E. Wink) for his help designing the graphical abstract.
Conflicts of Interest
The authors declare no conflicts of interest.
Declaration of Generative AI use: During the preparation of this work the authors used OpenAI's GPT4 (Version 4o) in order to improve grammar and spelling. After using this tool, the authors reviewed and edited the content as needed and take full responsibility for the content of the publication.
Abbreviations
The following abbreviations are used in this manuscript:
| AKI | acute kidney injury |
| ATP | adenosine triphosphate |
| β2M | beta-2 microglobulin |
| BMI | body mass index |
| cGAS | cyclic GMP–AMP synthase |
| cGAMP | cyclic GMP-AMP |
| CI | confidence interval |
| CIT | cold ischemia time |
| CKD | chronic kidney disease |
| Cq | quantification cycle |
| D | day |
| DAMP | damage-associated molecular pattern |
| DGF | delayed graft function |
| D-loop | displacement-loop |
| eGFR | estimated glomerular filtration rate |
| ETC | electron transport chain |
| HLA | human leukocytes antigens |
| H-strand | heavy strand |
| IFTA | interstitial fibrosis and tubular atrophy |
| IQR | interquartile range |
| IRI | ischemia reperfusion injury |
| kg | kilogram |
| KIM-1 | kidney injury molecule-1 |
| LDKT | living donor kidney transplantation |
| L-strand | light strand |
| m2 | square meter |
| mGFR | measured glomerular filtration rate |
| min | minute |
| ml | milliliter |
| mtDNA | mitochondrial DNA |
| n | number |
| NAG | n-acetyl-β-D-glucosaminidase |
| nDNA | nuclear DNA |
| ND1 | NADH ubiquinone oxidoreductase subunit 1 |
| ND6 | NADH ubiquinone oxidoreductase subunit 6 |
| NGAL | neutrophil gelatinase-associated Lipocalin |
| NFκB | nuclear factor kappa-light-chain-enhancer of activated B cells |
| PNF | primary non-function |
| post-OP | post-operative |
| PPIs | proton pump inhibitors |
| PRA | panel specific antibodies |
| PRR | pattern recognition receptor |
| qPCR | quantitative polymerase chain reaction |
| REML | restricted maximum likelihood |
| ROS | reactive oxygen species |
| SD | standard deviation |
| STING | stimulator interferon genes |
| TLR | toll-like receptor |
| VAPOR-1 | Volatile Anesthetic Protection of Renal Transplants-1 |
| WIT1 | first warm ischemia time |
| WIT2 | second warm ischemia time |
| y | years |
Appendix A
Appendix A.1 Urinary Creatinine Does Not Explain mtDNA Associations
To correct for urine concentration, mtDNA levels were normalized to urinary creatinine, as described in the methods. To confirm that the observed associations were not driven by urinary creatinine itself, we performed univariable regression analyses with creatinine levels from the same timepoints.
As shown in Table A1, creatinine alone did not consistently predict graft function at 1, 12, or 24 months, nor did it correlate with changes in eGFR between month 1 and 24. These results demonstrate that the associations observed with mtDNA are not attributable to urine creatinine alone.

Table A1.
Univariable regression analysis of urine creatinine levels.
| 1-Month eGFR | |||
|---|---|---|---|
| Variable | p-value | q-value | Estimate(95% CI) |
| Creatinine 1st urine | 0.971 | 0.981 | -0.032 (-1.793 - 1.728) |
| Creatinine 2 hours | 0.784 | 0.905 | -0.181 (-1.498 - 1.136) |
| 12-Month eGFR | |||
| Variable | p-value | q-value | Estimate(95% CI) |
| Creatinine 1st urine | 0.032 | 0.083 | 1.764 (0.154 - 3.374) |
| Creatinine 2 hours | 0.395 | 0.532 | 0.535 (-0.716 - 1.787) |
| 24-Month eGFR | |||
| Variable | p-value | q-value | Estimate(95% CI) |
| Creatinine 1st urine | 0.067 | 0.108 | 1.894 (-0.140 - 3.928) |
| Creatinine 2 hours | 0.007 | 0.057 | 2.337 (0.656 - 4.019) |
| ΔeGFR 1-24 months | |||
| Variable | p-value | q-value | Estimate(95% CI) |
| Creatinine 1st urine | 0.041 | 0.083 | 1.740 (0.076 - 3.405) |
| Creatinine 2 hours | 0.026 | 0.083 | 1.628 (0.200 - 3.056) |
Data are presented as p-, q-values and estimates (β with confidence interval [CI]). Data shown for p-values < 0.250. Abbreviations: eGFR – estimated glomerular filtration rate; ND1 – NADH ubiquinone oxidoreductase subunit 1; ND6 – NADH ubiquinone oxidoreductase subunit 6; D-loop – displacement-loop. Note: Cq values are inversely related to the amount of mtDNA. Analyses were performed using univariable linear regression. False discovery rate (FDR) correction was applied using the Benjamini–Krieger–Yekutieli procedure. *Statistical significance was defined as q < 0.05.
References
- Salvadori, M.; Rosso, G.; Bertoni, E. Update on ischemia-reperfusion injury in kidney transplantation: Pathogenesis and treatment. World J Transplant. 2015, 5, 52–67. [Google Scholar] [CrossRef] [PubMed]
- Ponticelli, C. Ischaemia-reperfusion injury: a major protagonist in kidney transplantation. Nephrol Dial Transplant. 2014, 29, 1134–1140. [Google Scholar] [CrossRef] [PubMed]
- Jahn, N.; Sack, U.; Stehr, S.; Vöelker, M.T.; Laudi, S.; Seehofer, D.; et al. The role of innate immune cells in the prediction of early renal allograft injury following kidney transplantation. J Clin Med. 2022, 11. [Google Scholar] [CrossRef]
- Yarlagadda, S.G.; Coca, S.G.; Formica, R.N.; Poggio, E.D.; Parikh, C.R. Association between delayed graft function and allograft and patient survival: a systematic review and meta-analysis. Nephrol Dial Transplant. 2009, 24, 1039–1047. [Google Scholar] [CrossRef]
- Nieuwenhuijs-Moeke, G.J.; Pischke, S.E.; Berger, S.P. ; Sanders JSF, Pol, R.A.; Struys MMRF, et al. Ischemia and reperfusion injury in kidney transplantation: relevant mechanisms in injury and repair. J Clin Med. 2020, 9. [CrossRef]
- Krysko, D.V.; Agostinis, P.; Krysko, O.; Garg, A.D.; Bachert, C.; Lambrecht, B.N.; et al. Emerging role of damage-associated molecular patterns derived from mitochondria in inflammation. Trends Immunol. 2011, 32, 157–164. [Google Scholar] [CrossRef]
- Riley, J.S.; Tait, S.W. Mitochondrial DNA in inflammation and immunity. EMBO Rep. 2020, 21: e49799. [CrossRef]
- Zhang, Q.; Raoof, M.; Chen, Y.; Sumi, Y.; Sursal, T.; Junger, W.; et al. Circulating mitochondrial DAMPs cause inflammatory responses to injury. Nature. 2010, 464, 104–107. [Google Scholar] [CrossRef]
- Zanini, G.; Selleri, V.; Lopez Domenech, S.; Malerba, M.; Nasi, M.; Mattioli, A.V.; et al. Mitochondrial DNA as inflammatory DAMP: a warning of an aging immune system? Biochem Soc Trans. 2023, 51, 735–745. [Google Scholar] [CrossRef]
- Kim, K.; Moon, H.; Lee, Y.H. ; Seo J-W, Kim, Y. G.; Moon J-Y, et al. Clinical relevance of cell-free mitochondrial DNA during the early postoperative period in kidney transplant recipients. Sci Rep. 2019, 9, 18607. [Google Scholar] [CrossRef]
- Jansen MPB, Pulskens WPC, Uil, M. ; Claessen, N.; Nieuwenhuizen, G.; Standaar, D.; et al. Urinary mitochondrial DNA associates with delayed graft function following renal transplantation. Nephrol Dial Transplant. 2020, 35, 1320–1327. [CrossRef]
- Haines, R.W.; Fowler, A.J.; Liang, K.; Pearse, R.M.; Larsson, A.O.; Puthucheary, Z.; et al. Comparison of Cystatin C and Creatinine in the Assessment of Measured Kidney Function during Critical Illness. Clin J Am Soc Nephrol. 2023, 18, 997–1005. [Google Scholar] [CrossRef]
- Pan, P.; Binjie, H.; Min, L.; Lipei, F.; Yanli, N.; Junwen, Z.; et al. A meta-analysis on diagnostic value of serum cystatin C and creatinine for the evaluation of glomerular filtration function in renal transplant patients. Afr Health Sci. 2014, 14, 1025–1035. [Google Scholar] [CrossRef] [PubMed]
- Waikar, S.S.; Betensky, R.A.; Bonventre, J.V. Creatinine as the gold standard for kidney injury biomarker studies? Nephrol Dial Transplant. 2009, 24, 3263–3265. [Google Scholar] [CrossRef] [PubMed]
- Waikar, S.S.; Betensky, R.A.; Emerson, S.C.; Bonventre, J.V. Imperfect gold standards for kidney injury biomarker evaluation. J Am Soc Nephrol. 2012, 23, 13–21. [Google Scholar] [CrossRef] [PubMed]
- Harman, G.; Akbari, A.; Hiremath, S.; White, C.A.; Ramsay, T.; Kokolo, M.B.; et al. Accuracy of cystatin C-based estimates of glomerular filtration rate in kidney transplant recipients: a systematic review. Nephrol Dial Transplant. 2013, 28, 741–757. [Google Scholar] [CrossRef]
- Ricci, Z.; Cruz, D.; Ronco, C. The RIFLE criteria and mortality in acute kidney injury: A systematic review. Kidney Int. 2008, 73, 538–546. [Google Scholar] [CrossRef]
- Malyszko, J.; Lukaszyk, E.; Glowinska, I.; Durlik, M. Biomarkers of delayed graft function as a form of acute kidney injury in kidney transplantation. Sci Rep. 2015, 5, 11684. [Google Scholar] [CrossRef]
- Halawa, A. The early diagnosis of acute renal graft dysfunction: a challenge we face. The role of novel biomarkers. Ann Transplant. 2011, 16, 90–98. [Google Scholar]
- Huisman GJJ, Spraakman, N.A.; Koomen, J.V.; Talsma, A.M.; Pol, R.A.; Berger, S.P.; et al. Urinary Biomarkers in a Living Donor Kidney Transplantation Cohort-Predictive Value on Graft Function. Int J Mol Sci. 2023, 24. [CrossRef]
- Vanmassenhove, J.; Vanholder, R.; Nagler, E.; Van Biesen, W. Urinary and serum biomarkers for the diagnosis of acute kidney injury: an in-depth review of the literature. Nephrol Dial Transplant. 2013, 28, 254–273. [Google Scholar] [CrossRef]
- Beker, B.M.; Corleto, M.G.; Fieiras, C.; Musso, C.G. Novel acute kidney injury biomarkers: their characteristics, utility and concerns. Int Urol Nephrol. 2018, 50, 705–713. [Google Scholar] [CrossRef]
- Obermüller, N.; Geiger, H.; Weipert, C.; Urbschat, A. Current developments in early diagnosis of acute kidney injury. Int Urol Nephrol. 2014, 46, 1–7. [Google Scholar] [CrossRef]
- Han, F.; Wan, S.; Sun, Q.; Chen, N.; Li, H.; Zheng, L.; et al. Donor Plasma Mitochondrial DNA Is Correlated with Posttransplant Renal Allograft Function. Transplantation. 2019, 103, 2347–2358. [Google Scholar] [CrossRef] [PubMed]
- Han, F.; Sun, Q.; Huang, Z.; Li, H.; Ma, M.; Liao, T.; et al. Donor plasma mitochondrial DNA is associated with antibody-mediated rejection in renal allograft recipients. Aging (Albany NY). 2021, 13, 8440–8453. [Google Scholar] [CrossRef] [PubMed]
- Kroneisl, M.; Spraakman, N.A.; Koomen, J.V.; Hijazi, Z.; Hoogstra-Berends, F.H. ; Leuvenink HGD, et al. Peri-Operative Kinetics of Plasma Mitochondrial DNA Levels during Living Donor Kidney Transplantation. Int J Mol Sci. 2023, 24. [CrossRef]
- Jansen MPB, Pulskens, W. P.; Butter, L.M.; Florquin, S.; Juffermans, N.P.; Roelofs JJTH, et al. Mitochondrial DNA is released in urine of SIRS patients with acute kidney injury and correlates with severity of renal dysfunction. Shock. 2018, 49, 301–310. [CrossRef]
- Liu, J.; Jia, Z.; Gong, W. Circulating mitochondrial DNA stimulates innate immune signaling pathways to mediate acute kidney injury. Front Immunol. 2021, 12, 680648. [Google Scholar] [CrossRef]
- Nieuwenhuijs-Moeke, G.J.; Nieuwenhuijs, V.B. ; Seelen MAJ, Berger, S. P.; van den Heuvel, M.C.; Burgerhof JGM, et al. Propofol-based anaesthesia versus sevoflurane-based anaesthesia for living donor kidney transplantation: results of the VAPOR-1 randomized controlled trial. Br J Anaesth. 2017, 118, 720–732. [Google Scholar] [CrossRef]
- Quiros, P.M.; Goyal, A.; Jha, P.; Auwerx, J. Analysis of mtDNA/nDNA Ratio in Mice. Curr Protoc Mouse Biol. 2017, 7, 47–54. [Google Scholar] [CrossRef]
- Kuznetsov, A.V.; Javadov, S.; Margreiter, R.; Grimm, M.; Hagenbuchner, J.; Ausserlechner, M.J. The Role of Mitochondria in the Mechanisms of Cardiac Ischemia-Reperfusion Injury. Antioxidants (Basel). 2019, 8. [Google Scholar] [CrossRef]
- Hu, Q.; Ren, J.; Wu, J.; Li, G.; Wu, X.; Liu, S.; et al. Urinary mitochondrial DNA levels identify acute kidney injury in surgical critical illness patients. Shock. 2017, 48, 11–17. [Google Scholar] [CrossRef]
- Hu, Q.; Ren, J.; Ren, H.; Wu, J.; Wu, X.; Liu, S.; et al. Urinary Mitochondrial DNA Identifies Renal Dysfunction and Mitochondrial Damage in Sepsis-Induced Acute Kidney Injury. Oxid Med Cell Longev. 2018, 2018, 8074936. [Google Scholar] [CrossRef]
- Ho PW-L, Pang W-F, Luk CC-W, Ng JK-C, Chow K-M, Kwan BC-H, et al. Urinary mitochondrial DNA level as a biomarker of acute kidney injury severity. Kidney Dis (Basel). 2017, 3, 78–83. [CrossRef]
- Cao, H.; Wu, J.; Luo, J.; Chen, X.; Yang, J.; Fang, L. Urinary mitochondrial DNA: A potential early biomarker of diabetic nephropathy. Diabetes Metab Res Rev. 2019, 35: e3131. [CrossRef]
- Wei, P.Z. ; Kwan BC-H, Chow, K. M.; Cheng PM-S, Luk CC-W, Li PK-T, et al. Urinary mitochondrial DNA level is an indicator of intra-renal mitochondrial depletion and renal scarring in diabetic nephropathy. Nephrol Dial Transplant. 2018, 33, 784–788. [Google Scholar] [CrossRef]
- Yu, B.C. ; Cho N-J, Park, S.; Kim, H.; Gil H-W, Lee, E.Y.; et al. Minor Glomerular Abnormalities are Associated with Deterioration of Long-Term Kidney Function and Mitochondrial Injury. J Clin Med. 2019, 9. [CrossRef]
- Wei, P.Z. ; Kwan BC-H, Chow, K. M.; Cheng PM-S, Luk CC-W, Lai K-B, et al. Urinary mitochondrial DNA level in non-diabetic chronic kidney diseases. Clin Chim Acta. 2018, 484, 36–39. [Google Scholar] [CrossRef]
- Ye, J.; Hu, X.; Wang, Z.; Li, R.; Gan, L.; Zhang, M.; et al. The role of mtDAMPs in the trauma-induced systemic inflammatory response syndrome. Front Immunol. 2023, 14, 1164187. [Google Scholar] [CrossRef]
- Bhargava, P.; Schnellmann, R.G. Mitochondrial energetics in the kidney. Nat Rev Nephrol. 2017, 13, 629–646. [Google Scholar] [CrossRef]
- Bullen, A.; Liu, Z.Z.; Hepokoski, M.; Li, Y.; Singh, P. Renal oxygenation and hemodynamics in kidney injury. Nephron. 2017, 137, 260–263. [Google Scholar] [CrossRef]
- Nørgård, M.Ø.; Svenningsen, P. Acute kidney injury by ischemia/reperfusion and extracellular vesicles. Int J Mol Sci. 2023, 24. [Google Scholar] [CrossRef]
- Trujillo-Rangel, W.Á.; García-Valdés, L.; Méndez-Del Villar, M.; Castañeda-Arellano, R.; Totsuka-Sutto, S.E.; García-Benavides, L. Therapeutic Targets for Regulating Oxidative Damage Induced by Ischemia-Reperfusion Injury: A Study from a Pharmacological Perspective. Oxid Med Cell Longev. 2022, 2022, 8624318. [Google Scholar] [CrossRef]
- Nadalutti, C.A.; Ayala-Peña, S.; Santos, J.H. Mitochondrial DNA damage as driver of cellular outcomes. Am J Physiol, Cell Physiol. 2022, 322: C136–C150. [CrossRef]
- Feng, J.; Chen, Z.; Liang, W.; Wei, Z.; Ding, G. Roles of mitochondrial DNA damage in kidney diseases: A new biomarker. Int J Mol Sci. 2022, 23. [Google Scholar] [CrossRef]
- Lin M-M, Liu, N. ; Qin Z-H, Wang, Y. Mitochondrial-derived damage-associated molecular patterns amplify neuroinflammation in neurodegenerative diseases. Acta Pharmacol Sin. 2022, 43, 2439–2447. [CrossRef]
- Lira Chavez, F.M.; Gartzke, L.P.; van Beuningen, F.E.; Wink, S.E.; Henning, R.H.; Krenning, G.; et al. Restoring the infected powerhouse: Mitochondrial quality control in sepsis. Redox Biol. 2023, 68, 102968. [Google Scholar] [CrossRef]
- Brealey, D.; Brand, M.; Hargreaves, I.; Heales, S.; Land, J.; Smolenski, R.; et al. Association between mitochondrial dysfunction and severity and outcome of septic shock. Lancet. 2002, 360, 219–223. [Google Scholar] [CrossRef] [PubMed]
- Huang, W.; Wang, X.; Zhang, H.; Wang, G.; Xie, F.; Liu, D. Serum Mitochondrial Quality Control Related Biomarker Levels are Associated with Organ Dysfunction in Septic Patients. Shock. 2021, 56, 412–418. [Google Scholar] [CrossRef] [PubMed]
- Jin, L.; Yu, B.; Armando, I.; Han, F. Mitochondrial DNA-Mediated Inflammation in Acute Kidney Injury and Chronic Kidney Disease. Oxid Med Cell Longev. 2021, 2021, 9985603. [Google Scholar] [CrossRef] [PubMed]
- Sanz, A.B.; Sanchez-Niño, M.D.; Ramos, A.M.; Ortiz, A. Regulated cell death pathways in kidney disease. Nat Rev Nephrol. 2023, 19, 281–299. [Google Scholar] [CrossRef]
- Tummers, B.; Green, D.R. The evolution of regulated cell death pathways in animals and their evasion by pathogens. Physiol Rev. 2022, 102, 411–454. [Google Scholar] [CrossRef]
- Linkermann, A.; Chen, G.; Dong, G.; Kunzendorf, U.; Krautwald, S.; Dong, Z. Regulated cell death in AKI. J Am Soc Nephrol. 2014, 25, 2689–2701. [Google Scholar] [CrossRef]
- Guerrero-Mauvecin, J.; Villar-Gómez, N.; Rayego-Mateos, S.; Ramos, A.M.; Ruiz-Ortega, M.; Ortiz, A.; et al. Regulated necrosis role in inflammation and repair in acute kidney injury. Front Immunol. 2023, 14, 1324996. [Google Scholar] [CrossRef]
- Guo, R.; Duan, J.; Pan, S.; Cheng, F.; Qiao, Y.; Feng, Q.; et al. The Road from AKI to CKD: Molecular Mechanisms and Therapeutic Targets of Ferroptosis. Cell Death Dis. 2023, 14, 426. [Google Scholar] [CrossRef]
- Li, D.; Wu, M. Pattern recognition receptors in health and diseases. Signal Transduct Target Ther. 2021, 6, 291. [Google Scholar] [CrossRef]
- Chen, L.; Deng, H.; Cui, H.; Fang, J.; Zuo, Z.; Deng, J.; et al. Inflammatory responses and inflammation-associated diseases in organs. Oncotarget. 2018, 9, 7204–7218. [Google Scholar] [CrossRef]
- Marchi, S.; Guilbaud, E. ; Tait SWG, Yamazaki, T. ; Galluzzi, L. Mitochondrial control of inflammation. Nat Rev Immunol. 2023, 23, 159–173. [Google Scholar] [CrossRef]
- Yu, H.; Lin, L.; Zhang, Z.; Zhang, H.; Hu, H. Targeting NF-κB pathway for the therapy of diseases: mechanism and clinical study. Signal Transduct Target Ther. 2020, 5, 209. [Google Scholar] [CrossRef] [PubMed]
- Liu, T.; Zhang, L.; Joo, D. ; Sun S-C. NF-κB signaling in inflammation. Signal Transduct Target Ther. 2017, 2, 17023. [Google Scholar] [CrossRef]
- Sasaki, Y.; Iwai, K. Roles of the NF-κB Pathway in B-Lymphocyte Biology. Curr Top Microbiol Immunol. 2016, 393, 177–209. [Google Scholar] [CrossRef]
- He, W.J.; Li, C.; Huang, Z.; Geng, S.; Rao, V.S.; Kelly, T.N.; et al. Association of Mitochondrial DNA Copy Number with Risk of Progression of Kidney Disease. Clin J Am Soc Nephrol. 2022, 17, 966–975. [Google Scholar] [CrossRef]
- Chang C-C, Chiu P-F, Wu C-L, Kuo C-L, Huang C-S, Liu C-S, et al. Urinary cell-free mitochondrial and nuclear deoxyribonucleic acid correlates with the prognosis of chronic kidney diseases. BMC Nephrol. 2019, 20, 391. [CrossRef]
- Irazabal, M.V.; Chade, A.R.; Eirin, A. Renal mitochondrial injury in the pathogenesis of CKD: mtDNA and mitomiRs. Clin Sci. 2022, 136, 345–360. [Google Scholar] [CrossRef]
- Thurairajah, K.; Briggs, G.D.; Balogh, Z.J. The source of cell-free mitochondrial DNA in trauma and potential therapeutic strategies. Eur J Trauma Emerg Surg. 2018, 44, 325–334. [Google Scholar] [CrossRef]
- Torp M-K, Stensløkken K-O, Vaage, J. When our best friend becomes our worst enemy: the mitochondrion in trauma, surgery, and critical illness. J Intensive Care Med. 2024, 8850666241237715. [CrossRef]
Figure 1.
Temporal dynamics of urinary mtDNA and stratification of long-term graft function. (A, B, C) Individual values of mtDNA genes ND1 (A), ND6 (B), and D-loop (C) across five time points after transplantation. (D, E, F) The same mtDNA genes stratified by quartiles of average eGFR at 12 and 24 months after transplantation, providing a visual overview of mtDNA dynamics in relation to renal function. Quartiles ranged from lowest (Q4, 18.0–37.6 ml/min/1.73m²) to highest (Q1, 57.51–103 ml/min/1.73m²). Abbreviations: Cq, quantification cycle; ND1, NADH ubiquinone oxidoreductase subunit 1; ND6, NADH ubiquinone oxidoreductase subunit 6; D-loop, displacement-loop; post-OP, post-operative; 2h, 2 hours; 1d, 1 day; 2d, 2 days; 6d, 6 days after transplantation. Data are shown as individual values with mean and SD over time (n=57); statistical analysis was performed using repeated-measures one-way ANOVA (REML) with Geisser-Greenhouse correction and the two-step step-up method of Benjamini, Krieger, and Yekutieli. Note: Cq values are inversely related to the amount of mtDNA; lower Cq values indicate higher mtDNA levels. *p < 0.05.
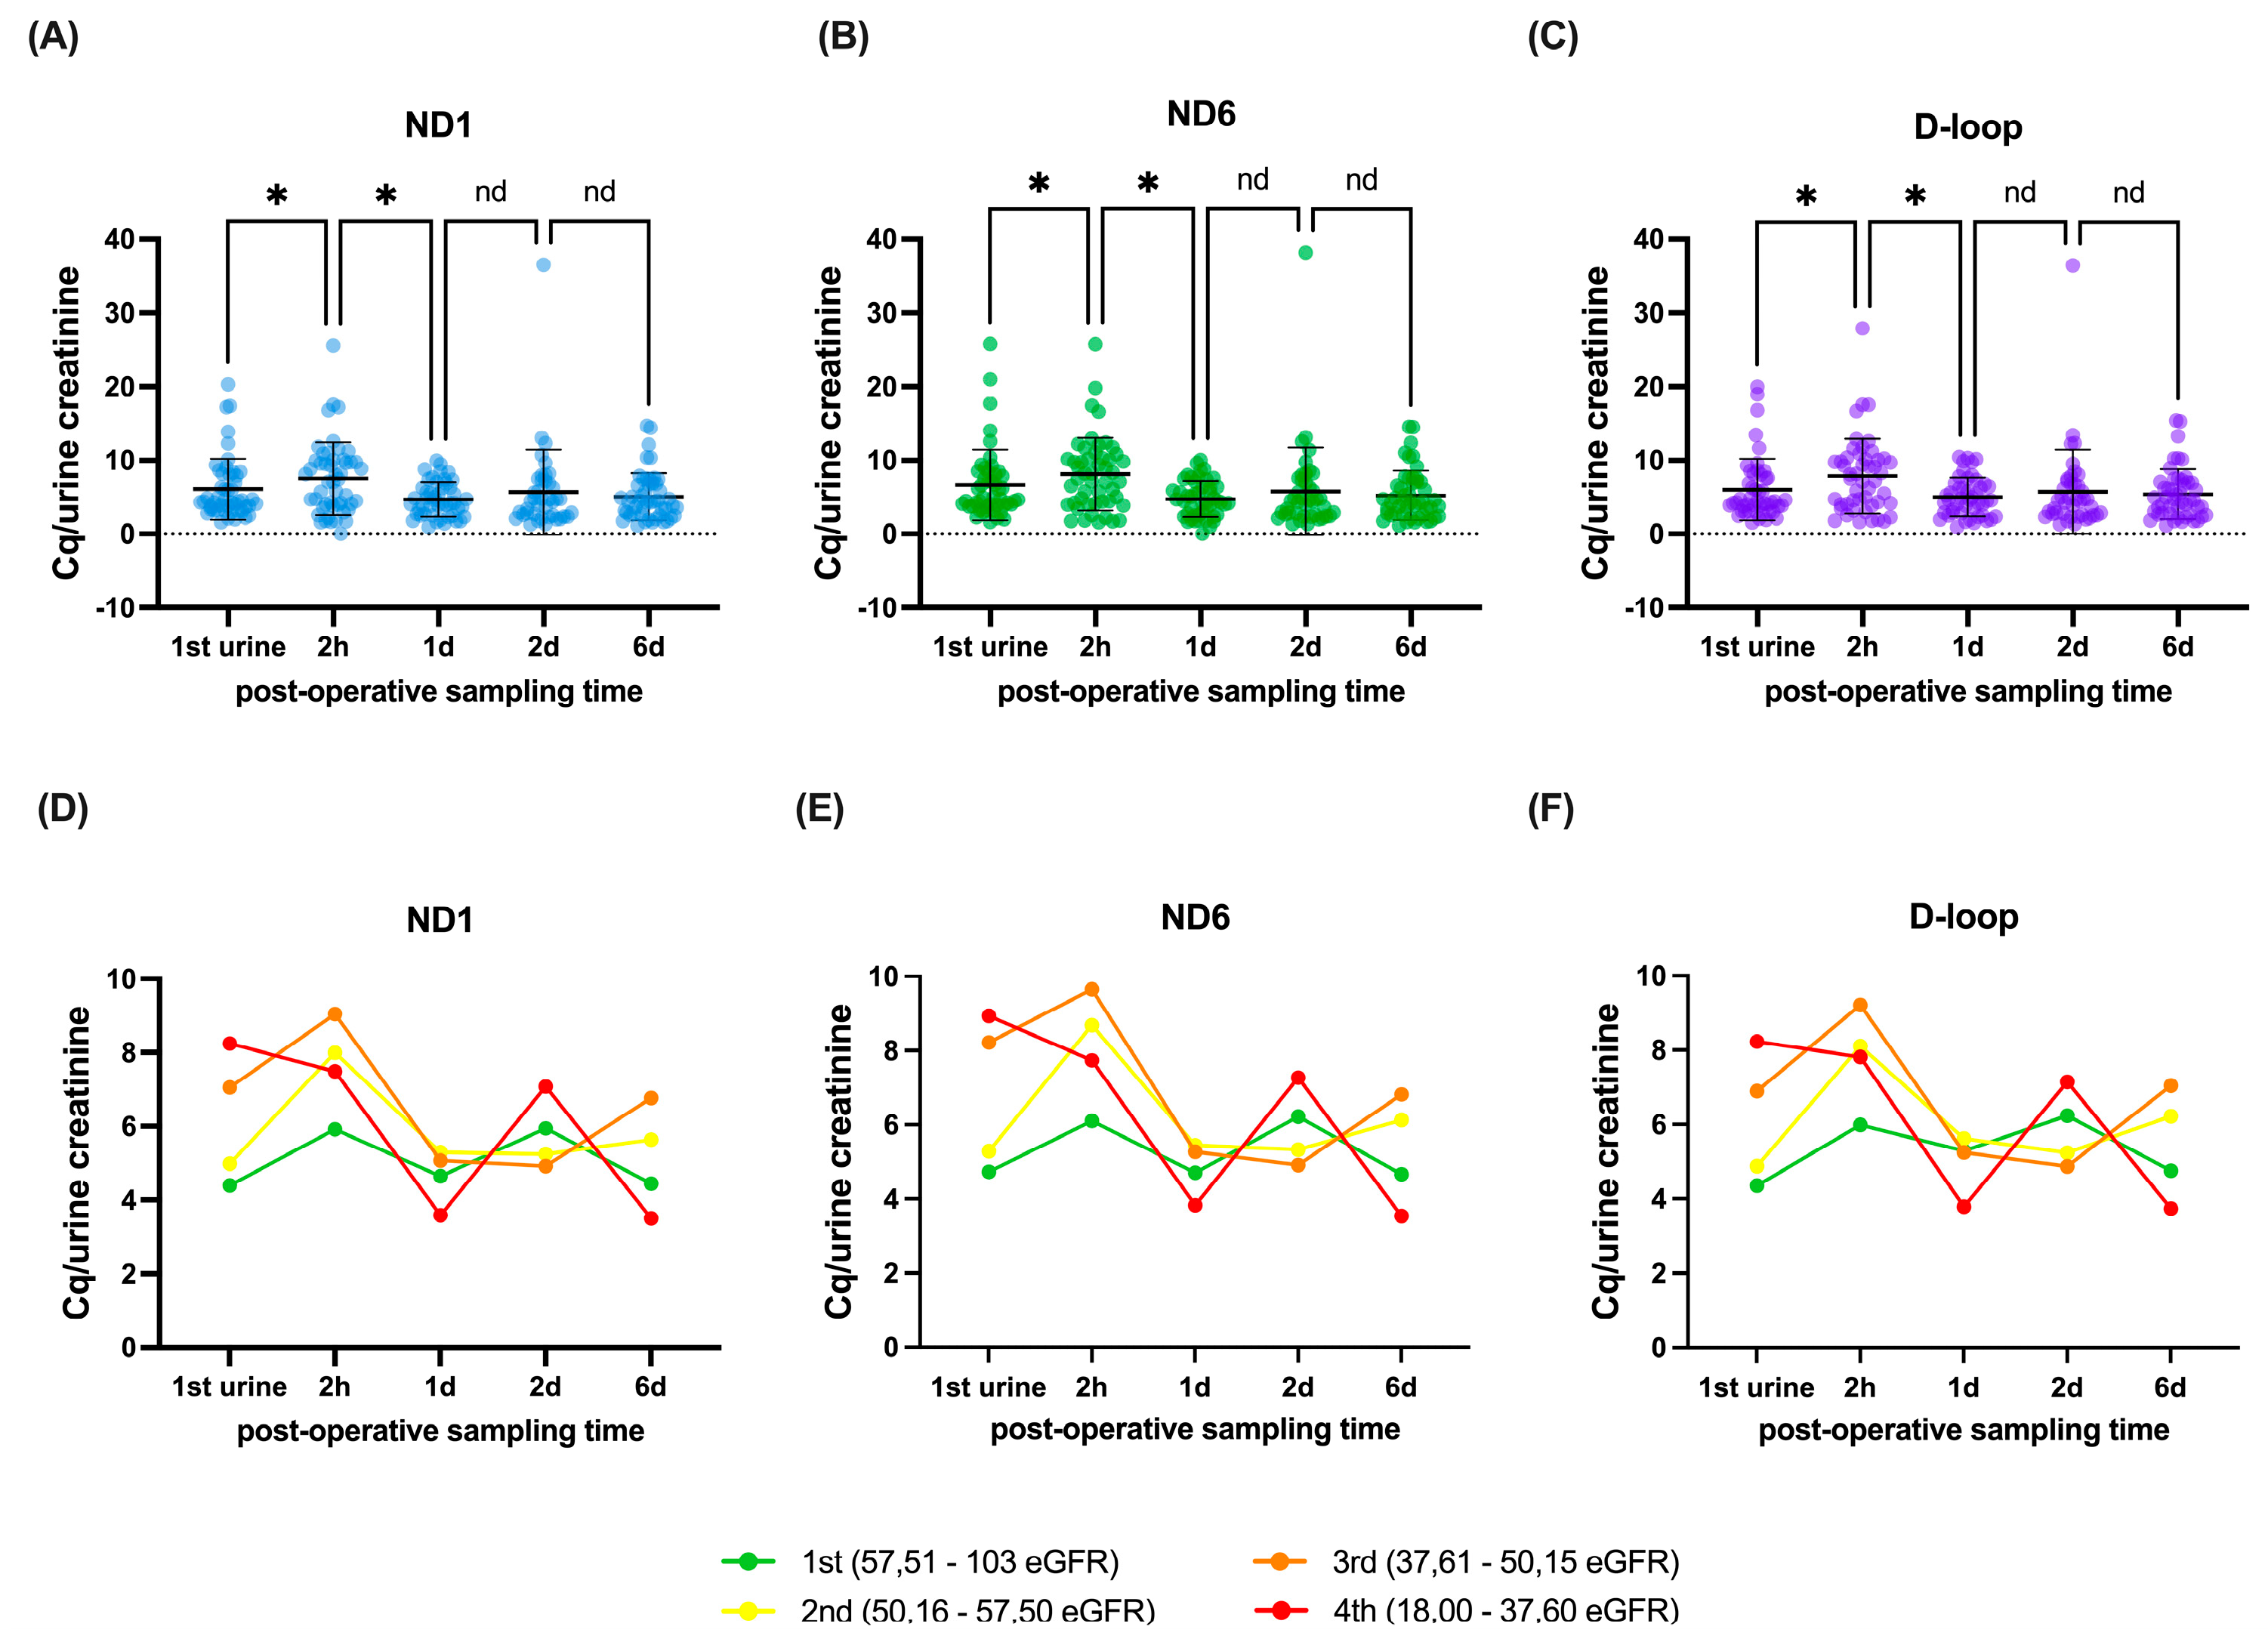
Figure 2.
Urinary mtDNA copy number in relation to graft function. (A–C) Mitochondrial DNA (mtDNA) copy number for ND1 (A), ND6 (B), and D-loop (C), calculated from matched urinary mtDNA and nuclear DNA levels. Patients were stratified based on average eGFR at 12 and 24 months after transplantation, selecting the nine recipients with the highest and lowest graft function (n = 18). No significant differences were observed between groups over time or by treatment. Data are shown as individual values with mean and SD. Statistical analysis was performed using two-way ANOVA (REML) with the two-stage linear step-up procedure of Benjamini, Krieger, and Yekutieli. Abbreviations: mtDNA, mitochondrial DNA; ND1, NADH ubiquinone oxidoreductase subunit 1; ND6, NADH ubiquinone oxidoreductase subunit 6; D-loop, displacement-loop; Cq, quantification cycle.
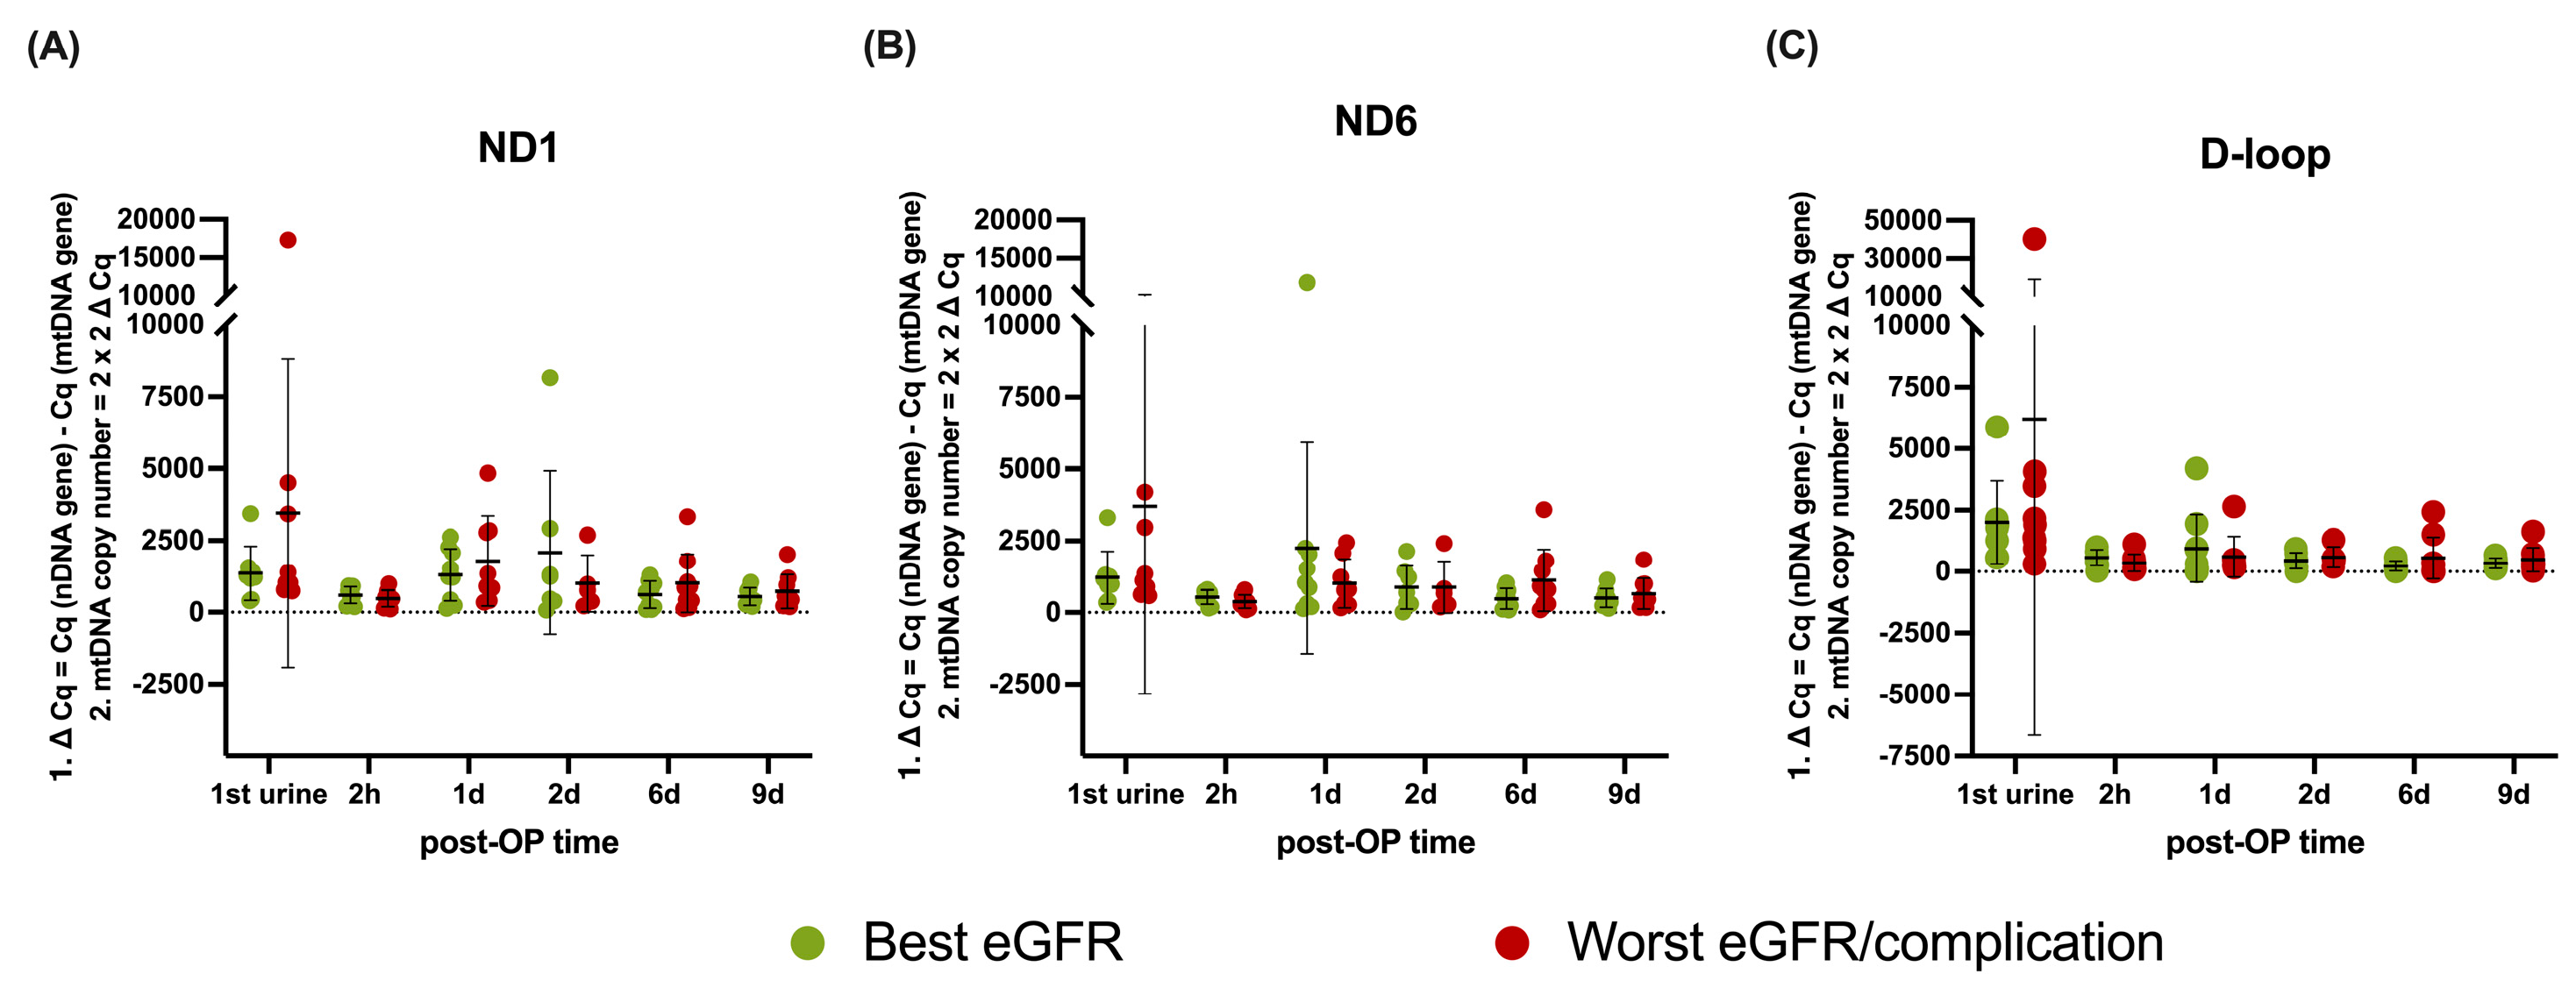
Table 1.
Primers and sequences.
| Primer | Sequence |
|---|---|
| ND1, ETC complex 1 | Forward: TGGCTCCTTTAACCTCTCCA Reverse: GGTTCGGTTGGTCTCTGCTA |
| ND6, ETC complex 1 | Forward: TGATTGTTAGCGGTGTGGTC Reverse: CCTCAATAGCCATCGCTGTA |
| D-loop, regulative region | Forward: AACCTACCCACCCTTAACAG Reverse: CACTCTTGTGCGGGATATTG |
| β2M, nuclear housekeeping gene | Forward: CTGGTAGCTCTAAACAATGTATTCA Reverse: CATGTACTCAAATGTCTAAAATGGT |
1 Abbreviations: ND1: NADH ubiquinone oxidoreductase subunit 1; ND6: NADH ubiquinone oxidoreductase subunit 6; D-loop: displacement-loop; β2M: Beta-2 microglobulin; ETC: electron transport chain.
Table 2.
Baseline characteristics.
| Donor | n=57 |
|---|---|
| Age [y] | 52.3 (± 11.0) |
| Male [n(%)] | 26 (45.6%) |
| BMI [kg/m2] | 27 (± 3.2) |
| Active smokers [n(%)] | 16 (28.1%) |
| Cardiovascular comorbidity [n(%)] Medication use [n(%)] Antihypertensive therapy Statins PPIs |
17 (29.8%) 15 (26.3%) 7 (12.3%) 9 (15.8%) |
| Pre-donation mGFR [ml/min] | 116 (97-134) |
| Recipient | n=57 |
| Age [y] | 51.2 (45.0-58.5) |
| Male [n(%)] | 27 (47.4%) |
| BMI [kg/m2] | 25.4 (22.5-28.3) |
| Cardiovascular comorbidity [n(%)] Medication use [n(%)] Antihypertensive therapy Phosphate binders Statins |
39(68.4%) 52 (91.2%) 32 (56.1%) 28 (49.1%) |
| Unrelated donor [n(%)] | 29 (50.9%) |
| Pre-emptive transplantation [n(%)] | 28 (49.1%) |
| Re-transplantation [n(%)] | 7 (12.3%) |
| ≥3 HLA mismatches [n(%)] | 35 (61.4%) |
| Positive PRA [n(%)] | 7 (12.3%) |
| Ischemia times [min] WIT 1 CIT WIT 2 |
4 (3-4) 175.5 (156.0-187.0) 43.0 (± 7.3) |
| Kidney and patient outcomes | n=57 |
| DGF [n(%)] | 3 (5.4%) |
| eGFR 1 month post transplantation [ml/min/1.73m2] | 50.8 (± 14.9) |
| eGFR 3 months post transplantation [ml/min/1.73m2] | 49.6 (38.8-58.2) |
| eGFR 6 months post transplantation [ml/min/1.73m2] | 50.4 (38.8-61.1) |
| eGFR 12 months post transplantation [ml/min/1.73m2] | 50.2 (± 14.2) |
| eGFR 24 months post transplantation [ml/min/1.73m2] | 51.4 (±17.6) |
| Acute rejection 2 years [n(%)] | 9 (16.1%) |
| Graft loss [n(%)] | 2 (3.5%) |
| Mortality [n(%)] | 1 (1.8%) |
Data given as mean (± SD), median (IQR) or n (%). Abbreviations: SD: standard deviation; IQR: interquartile range; n: number in group; BMI: body mass index; PPIs: proton pump inhibitors; HLA: human leukocytes antigens; PRA: panel specific antibodies ≥15%; WIT1: first warm ischemia time; CIT: cold ischemia time; WIT2: second warm ischemia time, DGF: delayed graft function, mGFR: measured glomerular filtration rate, eGFR: estimated glomerular filtration rate; y: year; kg: kilogram; m2: square meter; ml: millilitre; min: minute. Note: Cq values are inversely related to the amount of mtDNA.
Table 3.
Univariable regressions of the mtDNA genes.
| 1-Month eGFR | |||
|---|---|---|---|
| Variable | p-value | q-value | Estimate(95% CI) |
| ND1 1st urine | 0.742 | 0.515 | 0.183 (-0.929 - 1.294) |
| ND1 2 hours | 0.479 | 0.391 | 0.335 (-0.609 - 1.278) |
| ND6 1st urine | 0.752 | 0.515 | 0.154 (-0.823 - 1.132) |
| ND6 2 hours | 0.585 | 0.439 | 0.250 (-0.666 - 1.167) |
| D-loop 1st urine | 0.952 | 0.625 | 0.032 (-1.046 - 1.110) |
| D-loop 2 hours | 0.496 | 0.391 | 0.309 (-0.598 - 1.216) |
| 12-Month eGFR | |||
| Variable | p-value | q-value | Estimate (95% CI) |
| ND1 1st urine | 0.008 | 0.030* | -1.303 (-2.257 - -0.350) |
| ND1 2 hours | 0.250 | 0.219 | -0.512 (-1.398 - 0.373) |
| ND6 1st urine | 0.016 | 0.030* | -1.050 (-1.895 - -0.204) |
| ND6 2 hours | 0.227 | 0.210 | -0.520 (-1.374 - 0.334) |
| D-loop 1st urine | 0.011 | 0.030* | -1.259 (-2.213 - -0.306) |
| D-loop 2 hours | 0.217 | 0.210 | -0.528 (-1.377 - 0.321) |
| 24-Month eGFR | |||
| Variable | p-value | q-value | Estimate(95% CI) |
| ND1 1st urine | 0.036 | 0.052 | -1.311 (-2.533 - -0.089) |
| ND1 2 hours | 0.064 | 0.067 | -1.029 (-2.120 - 0.062) |
| ND6 1st urine | 0.046 | 0.060 | -1.098 (-2.176 - -0.020) |
| ND6 2 hours | 0.064 | 0.067 | -0.997 (-2.056 - 0.062) |
| D-loop 1st urine | 0.036 | 0.052 | -1.326 (-2.563 - -0.089) |
| D-loop 2 hours | 0.054 | 0.065 | -1.025 (-2.069 - 0.019) |
| ΔGFR 1-24 months | |||
| Variable | p-value | q-value | Estimate(95% CI) |
| ND1 1st urine | 0.009 | 0.030* | -1.372 (-2.388 - -0.356) |
| ND1 2 hours | 0.007 | 0.030* | -1.188 (-2.031 - -0.345) |
| ND6 1st urine | 0.015 | 0.030* | -1.141 (-2.049 - -0.234) |
| ND6 2 hours | 0.014 | 0.030* | -1.066 (-1.910 - -0.222) |
| D-loop 1st urine | 0.017 | 0.030* | -1.231 (-2.228 - -0.233) |
| D-loop 2 hours | 0.005 | 0.030* | -1.168 (-1.974 - -0.362) |
Data are presented as p- and q-values and estimates (β with confidence interval [CI]). Data shown for p-values < 0.250. Abbreviations: eGFR – estimated glomerular filtration rate; ND1 – NADH ubiquinone oxidoreductase subunit 1; ND6 – NADH ubiquinone oxidoreductase subunit 6; D-loop – displacement-loop. Note: Cq values are inversely related to the amount of mtDNA; lower Cq values indicate higher mtDNA levels. Analyses were performed using univariable linear regression. False discovery rate (FDR) correction was applied using the Benjamini–Krieger–Yekutieli procedure. *Statistical significance was defined as q < 0.05.
Disclaimer/Publisher’s Note: The statements, opinions and data contained in all publications are solely those of the individual author(s) and contributor(s) and not of MDPI and/or the editor(s). MDPI and/or the editor(s) disclaim responsibility for any injury to people or property resulting from any ideas, methods, instructions or products referred to in the content. |
© 2025 by the authors. Licensee MDPI, Basel, Switzerland. This article is an open access article distributed under the terms and conditions of the Creative Commons Attribution (CC BY) license (http://creativecommons.org/licenses/by/4.0/).
Copyright: This open access article is published under a Creative Commons CC BY 4.0 license, which permit the free download, distribution, and reuse, provided that the author and preprint are cited in any reuse.


