Submitted:
07 May 2025
Posted:
07 May 2025
You are already at the latest version
Preprints on COVID-19 and SARS-CoV-2
Abstract
The scientific technique of urban residential units with natural ventilation is a critical aspect of sustainable architecture and urban planning for enhancing indoor air quality and reducing airborne disease transmission in a built urban environment. This technique involves an urbanized Natural-Ventilation effectiveness Factor (uNVeF) combined with the regression analysis of all corresponding parameters of wind direction with its velocity, achievable air change rate per hour, openable window combination, and height of urban residential unit. Through 25 scenarios of the case study, it demonstrates and evaluates the effectiveness of natural ventilation in an urban residential unit with 13.9 m² located on the thirty-fifth floor in the Hong Kong public residential building. The results confirmed the statutory compliance with the local statutory requirement of a minimum natural ventilation rate(Practice Note for Authorized Persons, Registered Structural Engineers and Registered Geotechnical Engineers). A maximum 60.1 air change rate per hour (ACH) was measured when 75% of the opened windows, which corresponds to a uNVeF of 0.953. Notably, the fully opened windows scenario resulted in a lower natural ventilation rate due to undetermined external factors. Lower floor level can still achieve 1.5 ACH with modification of several window opening scenarios at the lowest floor. It indicated that occupants should pay attention to adjusting the window opening strategies. The achievable natural ventilation can reduce the COVID-19 infection risk by 96.1% at 35/F and 93.4% at 1/F (lowest floor) compared to the 1.5ACH baseline condition. The higher the natural ventilation rate correspond to lower the COVID-19 infection risk. These findings highlighted the uNVeF technique can optimize window opening area and the effectiveness of natural ventilation in addressing health concerns.
Keywords:
urbanized Natural-Ventilation effectiveness Factor (uNVeF)
; urban residential unit
; window opening degree/area
; COVID-19 infection risk
1. Introduction
The scientific technique of urban public residential buildings with natural ventilation is a critical aspect of sustainable architecture and urban planning. Natural ventilation is recognized to benefit human health, improve indoor air quality, and reduce the risk of airborne disease transmission for each occupancy. The design and planning of new public residential buildings has taken major consideration of local climate conditions, building orientation, height of building, and openable window architecture in the utilization of natural ventilation. This paper explores an investigation of innovative scientific approaches to enhance energy efficiency, indoor air quality, and sustainable design within urban environments in Hong Kong, contributing to the broader field of Urban Science. With the aid of the assessment, the natural ventilation rate for an urban residential unit is ensured to achieve a minimum 1.5 ACH to comply with local government requirements.
The case study is in a public housing estate in northern New Territories, built in 2021. The development attained a Final Platinum Rating in Beam Plus New Buildings Certification. Various sustainable features, such as building orientation and wind corridors were implemented to facilitate and enhance the natural ventilation effect. This research aims to find out the compliance of actual natural ventilation rate with the statutory requirements, measure actual ACH achieved by natural ventilation under different window opening scenarios, quantify the reduction in airborne infection risk with the optimal natural ventilation configuration compared to 1.5ACH baseline condition, and determine the extent of window opening that can effectively reduce infection risk.
Sustainable built environment investigation is crucial for worldwide, and Hong Kong Professional Green Building Council and regional governments. This paper explores an investigation of innovative approaches to enhance energy efficiency, indoor air quality, and sustainable design within urban environments in Hong Kong, contributing to the broader field of Urban Science. Natural ventilation is recognized to benefit human health, improve indoor air quality, and reduce the risk of airborne disease transmission. The design and planning of new public housing estates has taken major consideration in the utilization of natural ventilation. Therefore, this research is to verify and analyze the actual natural ventilation effectiveness of public rental houses in Hong Kong through an experimental approach.
Background of Case Study
The public housing estate covers approximately 13.65 hectares. It consists of 7 buildings with 40 stories high. The buildings are situated in a small-town area surrounded by low-density local villages and relatively urban residential unit terrain, as illustrated in Figure 1. Natural wind can penetrate through window openings into individual urban residential units without obstruction.
The selected urban residential unit has a floor area of 13.9 m2 with a headroom of 2.55m (Figure 2). It is located at 35/F, which is about 101.5m above the ground floor level. As shown in Figure 3, it is a studio urban residential unit with one living area, one washroom, and one kitchen. Similar to typical public residential housing designs, the windows are located on two sides of the building façade facing north-east and south-east. The window types involved are side hung and top hung design as illustrated in Figure 4. In this study, the focus is on studying the natural ventilation effect of the side-hung type window. Thus, the total overall operable window area is 1.77m2 and the operable window to wall ratio is 0.15.
2. Literature Review
Natural ventilation is an energy-efficient and environmentally friendly strategy. Tan et al. (2017) stated that adequate natural ventilation is critical for maintaining an acceptable indoor environment. The benefits of natural ventilation include energy saving, improving thermal comfort, reductions in disease transmission, removing indoor pollutants, maintaining good indoor air quality, increasing work productivity and reducing greenhouse gas emissions.
According to Building Department’s Lighting and Ventilation Requirements (APP-130), the regulation of minimum ACH for habitable room and kitchen in domestic buildings is both 1.5ACH by natural means. This standard ensured that the newly constructed public housing estate should comply with this ventilation requirement in Hong Kong.
Chen et al. (2018) reviewed that natural ventilation is challenging in practical design due to the climate, ambient air quality, airflow, wind direction, floor plan, building orientation, urban density, outdoor environmental conditions should need to be considered and the most critical element is the window opening configuration.
Tianqi Liu & W. L. Lee (2020) have conducted walk-through surveys and site measurements to identify the optimum window opening degree on natural ventilation performance of residential buildings in Hong Kong. The optimal range for the window opening degree is between 60% and 90%. Also, their methodology provided an equation for calculating the effective window opening area applicable to this case study. The equation has taken consideration of the length and width of the window and the window opening degree.
Air change per hour (ACH) is commonly used to quantify the effectiveness of indoor natural ventilation. Various works for studying natural ventilation focused on calculating the ACH have been demonstrated over the past year. Zhou et al. (2020) summarized different empirical models to calculate the air flow rate driven by wind-driven natural ventilation and commented that these models are popular and have been proven effective in a certain extent.
Choi & Song (2020) studied three indoor ventilation rate measurement methods. They are inlet air velocity-based, pressure difference-based, and reference wind velocity-based. The inlet air velocity-based measurement of the ventilation rate is shown as convenient and simple for experimental use. This paper uses the inlet air velocity method to study the achievable ACH and analyze the indoor natural ventilation effectiveness of openable window arrangements in Hong Kong public house.
The wind speed at 35/F of the building is usually higher than the lower floor due the pressure difference between warm air and cold air. To verify the compliance of natural ventilation at lower floor level, Gough et al. (2021) suggested using Hellman Exponential Law Equation to determine the wind velocity at the desired height. The equation correlates two wind velocities and their measurement altitudes with an exponential function of the friction coefficient. This coefficient varies by location, function of land and different landscape type.
The COVID-19 pandemic has highlighted the importance of adequate ventilation in reducing the risk of airborne disease transmission, and natural ventilation plays a vital role in mitigating this risk. In public housing estates where infected occupants may host guests, increasing the ventilation rate can significantly lower the risk of cross-infection. Escombe et al. (2007) and Dai et al. (2023) revealed that the Wells-Riley model is used to predict the probability of infection in indoor spaces and can further estimate the reduction in infection risk achieved through improved ventilation.
Guo et al. (2021) reported that the Wells–Riley equation is based on the concept of a ‘quantum of infection’. The probability for a susceptible person being infected by a quantum within a space is expressed as the exponential relationship between the parameters of number of infectors, quanta generation rate, pulmonary ventilation rate, exposure time and air ventilation rate.
The parameter of pulmonary ventilation rate and quanta generation rate should be collected in order to complete the Wells-Riley equation. The pulmonary ventilation rate is calculated from tidal volume, average weight and breathing rate. Xia et al. (2020) reported the tidal volume of Chinese patient suffering COVID-19, ICRP (1994) provided comprehensive figures regarding the average weight of humans based on different ages, genders and ethnic groups. Liu, S et al. (2020) reported the breathing rate of the COVID-19 patient in China. Also, Buonanno et al. (2020) and Shen et al. (2021) provided backward calculation values of quanta generation rate for COVID-19.
Existing literatures have explored the method to study the influence of window opening degree on natural ventilation performance in high rise residential buildings in Hong Kong and there are also many literatures investigated the probability of COVID-19 infection risk by using Wells-Riley model. However, there is no investigation to identify the correlation between the window opening degree, natural ventilation rate and COVID-19 infection risk. To address the research gap, this study provides method to field measure the natural ventilation rate and estimate COVID-19 infection risk across different window opening scenarios.
3. Methodology
In conjunction with addressing the research gap, the framework of the study is illustrated in Figure 5. The methodology of analysis collected field measurement data, incorporating the uNVeF technique, to analyze the effectiveness of natural ventilation and estimate COVID-19 infection risk across 25 scenarios of window opening scenarios. All equations to be used are described in the following sections 3.1 to 3.4.
3.1. Intake Air Velocity Method
Site measurements were conducted on 18 and 19 March 2025. The outdoor temperature is in average 20oC. The nearby Hong Kong Observatory weather station is located at Ta Kwu Ling which is 2.9 km away from the building. According to the data from this weather station, the prevailing winds are in general from east to south-east in all year at the speed of 6-8m/s.
A series of window opening scenarios were developed to measure the ventilation rates. Air velocity was measured at 500mm away from the air inlets of each window to minimize turbulent effect. 4 side hung type windows were under investigated. 2 measurement points were taken for each side hung type window under varying effective window opening areas. This data was used to calculate the ACH. The optimal natural ventilation configuration which having the highest ACH was identified.
Table 1 outlines 25 window opening scenarios to measure inlet air velocity and indoor air quality in the selected urban residential unit. In each scenario, the combination involved the window opening degree of 0%, 50%, 75% or 100% for 3 windows located in living room and 1 window located in kitchen. Table 2 lists the measuring instruments used to measure inlet air velocity, room temperature, relative humidity, CO2 concentration and PM2.5 concentration.
Using the effective window opening area equation (Equation 1) suggested by Tianqi Liu & W. L. Lee (2020), the natural ventilation rate can be determined for each scenario for comparison.
L is the length of window (m),
H is the height of window (m), and
is the window opening angle in degree
3.2. Adjustment of Inlet Air Velocity for Different Floor Level
Due to the difficulty of accessing private urban residential units for on-site measurement, the Hellman Exponential Law Equation (Equation 2) was employed to estimate the inlet air velocity at lower floor level.
is the wind velocity at desired height (m/s),
is the reference velocity (m/s),
Z1 is the reference height (m),
Z2 is the desired height (m), and
is the friction coefficient
After determining the value of friction coefficient by regression analysis, the wind velocity and inlet air velocity for urban residential units at the different floor height can be estimated.
3.3. Wells-Riley Model
The Wells-Riley model (Equation 3) was utilized to estimate the probability of airborne infection risk in scenario where a guest visits an occupant known to be infected with an airborne disease. This approach assesses the effectiveness of natural ventilation under optimal natural ventilation condition in reducing public health risks associated with airborne disease.
P is the probability of infection,
I is the number of infectors,
q is the quanta generation rate (quanta/h),
p is the pulmonary ventilation rate for a person (m3/h),
t is the exposure time interval (h), and
Q is the room ventilation rate (m3/h).
Using this equation, the probability of infection can be estimated based on the actual room ventilation rate.
4. Data Collection and Analysis
The measurement results for average wind speed, room temperature, CO2 concentration, PM2.5 concentration, relative humidity, calculated ACH and effective window opening area in different scenarios are tabulated in Table 3.
4.1. Correlation of Window Opening Degree with ACH
As the window size and window opening degree vary in different scenarios, the overall window opening degree for a series of windows is defined by a dimensionless uNVeF for comparison which is the ratio of the actual window opening area to the total window opening area when fully opened ranging from 0 to 1.
By using Equation (4), the calculated uNVeF in different scenarios are tabulated in Table 4. There is a direct relationship between uNVeF and ACH.
The curve in Figure 6 identifies the significance level of the influence of uNVeF on ACH. The regression model is using a 2nd order polynomial equation. The R2 = 0.8469 shows a high correlation between uNVeF and ACH.
At lower uNVeFs, a small increase in window opening degree from the fully closed state can greatly improve ACH as indicated by the steepest slope of the curve. Also, ACH was strongly influence by uNVeF in this region.
At higher uNVeFs, the correlation level is moderately significant and there is slightly decrease in ACH at the highest uNVeF suggested that more external factors such as turbulent flow may affect the natural ventilation rate.
The optimum window opening scenario appeared when uNVeF is 0.953 (All windows at living room and kitchen opened at 75%) which gives a result of 91 ACH.
4.2. Adjustment on Inlet Air Velocity
To computing the result using Equation (2), the friction coefficient factor specific for this case study should be first determined.
Based on the data from nearby weather station as shown in Table 5, the anemometer elevation is 13m (Z1) at Ta Kwu Ling weather station and the wind speed measured is 9km/hr at 1000 on 19 March 2025.
To verify the compliance of natural ventilation at lower floor level and derive the friction coefficient of , the wind velocity at public corridor facing the same direction with the selected urban residential unit at different floor level were measured and tabulated in Table 6. It shows that the wind velocity decreases linearly with the building floor level decreases.
The outside wind velocity at different floor levels were inputted in the of the Equation (2). The scatter graph in Figure 7 visualizes the relationship of wind velocity factor against floor level factor . Power function was used for the regression analysis. The result R2 = 0.9232 shows a strong correlation between wind velocity and floor level . Therefore, the inlet wind velocity adjustment equation is derived as:
= 0.757 (5)
The friction coefficient is determined to be = 0.2907.
The inlet air velocity for each window facing the same direction as the selected urban residential unit at any floor level can be estimated separately by using Equation (5).
For the best ventilation scenario at 1/F (lowest floor) in the same building, the inlet air velocity is estimated as follow:

Table 7.
Summary of adjusted inlet air velocity for the best ventilation scenario.
| Best Ventilation Scenario | ||
|---|---|---|
| Window 1 | 0.285 m/s | 0.096 m/s |
| Window 2 | 0.155 m/s | 0.052 m/s |
| Window 3 | 0.383 m/s | 0.129 m/s |
| Window 4 | 0.708 m/s | 0.239 m/s |
For the worst ventilation scenario at 1/F (lowest floor) in the same building, the inlet air velocity is estimated as follow:
Table 8.
Summary of adjusted inlet air velocity for the worst ventilation scenario.
| Worst Ventilation Scenario | ||
|---|---|---|
| Window 1 | 0 m/s | 0 m/s |
| Window 2 | 0 m/s | 0 m/s |
| Window 3 | 0.108 m/s | 0.036 m/s |
| Window 4 | 0 m/s | 0 m/s |
The result of ACH can be calculated by Equation (6). The ACH is being obtained from the summation of air flow rate of window 1 to 4.
By repeating the calculation steps for another scenario, the calculation result was tabulated in Table 9. It found that all scenarios at 1/F (lowest floor) can achieve minimum 1.5ACH requirement.
The result of best and worst ventilation scenarios is summarized in Table 10. It shows that the natural ventilation rate achieved at higher floor level is significantly larger than lower floor level.
4.3. Estimation on COVID-19 Infection Risk
The Wells-Riley model is applied to estimate the COVID-19 infection risks in a selected urban residential unit. The parameter values from Table 11 were inputted into Equation (3) to calculate the probability of COVID-19 infection risk.
For the quanta generation rate, Buonanno et al. (2020) and Shen et al. (2021) reviewed a COVID-19 outbreak event at Guangzhou restaurant and suggested the quanta generation rate can be backward calculated using Wells-Riley model when the ventilation settings of the studies outbreak are known. Based on this approach, the quanta generation rate of COVID-19 virus particles while the infector is seated and speaking is taken as 61 quanta/h.
For the pulmonary ventilation rate, Xia et al. (2020) reported the tidal volume of Chinese patient suffering COVID-19 is 8ml/kg. Also, ICRP (1994) indicated the average weight of 59kg for Chinese male adults. And Liu, S et al. (2020) provided the breathing rate of the COVID-19 patient in China is 30 breath per min. Therefore, the pulmonary ventilation rate is calculated to be 0.8496 m3/h.
Using Equation (3), the probability of COVID-19 infection risk when a healthy person visiting an COVID-19 infector for 1 hour was assessed. When the infector is seated and specking in a urban residential unit with 1.5ACH natural ventilation rate, the probability of COVID-19 infection risk for a healthy visitor without wearing a mask is 62.2%. The infection risk % under different scenario at 35/F and 1/F (lowest floor) are tabulated in Table 12 and Table 13.
When the uNVeF at 0.953, the maximum natural ventilation of 91 ACH and 30.7 ACH was found. The COVID-19 infection risk results are 1.6% on 35/F and 4.6% on 1/F (lowest floor). Compared to the baseline 1.5ACH natural ventilation rate, which is 62.2%, the infection probability can be significantly reduced by 97.4% and 92.5% respectively.
The scatter chart in Figure 8 was plotted to illustrate the relationship between uNVeF and COVID-19 infection risk in the urban residential unit at high floor level and low floor level of the building. An exponential equation was applied for the regression analysis. The result R2 = 0.7815 (35/F) and 0.8012 (1/F (lowest floor)) show a high correlation between window opening degree and infection risk.
The higher the natural ventilation rate correspond to lower COVID-19 infection risk. The infection risks are within 20% for both cases with the uNVeF higher than 0.7. At a lower uNVeF, the infection risks at low floor level exhibit significantly higher infection risk than the case at high floor level in the building.
5. Discussion and Conclusion
5.1. Discussion
The inlet air velocity method validated by Choi & Song (2020) provided practical and reliable approach to measure actual ACH achieved by natural ventilation under different window opening scenarios. This study measured inlet air velocity, room temperature, relative humidity, CO2 concentration and PM2.5 concentration that enable data analysis on natural ventilation performance in the selected urban residential unit of the Hong Kong public housing estate. The results showed that the natural ventilation rate is fully complied with the Building Department ‘s statutory requirement. The compliance confirmed the effectiveness of natural ventilation for the building.
Due to wind pressure difference between upper floor level and lower floor level of the building and difficulty to access every private property for air velocity measurement, the Hellman Exponential Law (Equation 2) was employed to estimate the natural ventilation rate at lower floor level with aid of the wind velocity data from other floor level facing the same facade. The estimation results revealed that ACH requirement was fully complied at lower floor level, but some scenarios showed marginal compliance to the requirement. This finding highlighted the challenge to achieve adequate natural ventilation rate at lower floor level when there is reduced wind velocity and emphasized the need of window opening strategies to ensure effective natural ventilation across all floors in urban high-rise buildings.
The highest ACH obtained when all windows in the living room and kitchen were opened at 75% and the corresponding uNVeF is 0.953. The result aligned with the findings by Tianqi Liu & W. L. Lee (2020) that identified optimal ACH achieved when window opening degree at 60% to 90%. This optimal window opening configuration was identified and provided knowledge and a low-cost solution to residents for enhancing natural ventilation effectiveness.
Most notable result was found from the scatter graph in Figure 6. When all windows were fully opened, a slight decrease of ACH observed. This result suggested the natural ventilation for 100% opened window scenario is not effective than 75% window opening configuration. The slightly decrease in ACH may be attributed by the influence of other external factors such as turbulent airflow as suggested by Chen et al. (2018). Those external factors cannot be determined in this research. Occupants at lower floor level should pay attention on the extent of window opening degree to maximize natural ventilation rate and lower COVID-19 infection risk.
Using the Wells-Riley model, there was significant reduction in COVID-19 infection risk of 97.4% at upper floor level and 92.5% at lower floor level compared to the 1.5ACH baseline condition. These findings supported Escombe et al. (2007) and Dai et al. (2023) who emphasized natural ventilation can effectively mitigate airborne disease transmission. This result contributed to future urban planning to combat dangerous airborne diseases transmission and the case study provided the evidence that existing urban public housing building design can effectively reduce future health crisis by optimizing natural ventilation approach.
The methodology offered frameworks to identify optimal window opening configuration and quantify the COVID-19 infection risk reduction. The outcomes provided valuable insight for volunteers and caregivers who are going to take care COVID-19 patient in self-quarantine at home. It offered guidance for assessing the infection risk and educating them to optimize window opening for natural ventilation in order to minimize disease transmission.
5.2. Further Study Works
The current field measurements were conducted in spring season that cannot reflect seasonal changes in temperature, wind velocity and wind direction that influence the natural ventilation performance. Therefore, future studies should record the inlet air velocity in one year basis to mitigate the influence of seasonal factor. More on-site measurement of the inlet air velocity at lower floor level can improve the accuracy of each parameter in Hellman Exponential Law Equation. The abovesaid results apply to the same orientation residential housing unit. Other orientation units of the building shall need to further analyzed for their applicability. Expanding uNVeF to incorporate detailed microclimate data (temperature, humidity, solar radiation) would enhance its predictive accuracy and applicability across diverse urban contexts. This could involve computational fluid dynamics (CFD) modeling to simulate airflow patterns around buildings.
The COVID-19 infection risk calculated using Wells-Riley model relies on the input values of quanta generation rate and pulmonary ventilation rate which is applicable to Chinese male adult with medium weight. The other gender and age of human subjects needs to further investigate this risk with the variables for them.
5.3. Conclusions
The urbanized Natural-Ventilation effectiveness Factor (uNVeF) technique, as demonstrated in this Hong Kong case study, offers a compelling strategy for optimizing natural ventilation in urban residential unit. It combines the uNVeF with the regression analysis of wind direction & its velocity, air change rate per hour, openable window combination, and height of urban residential building development. Through 25 scenarios of case study at the urban residential unit at 37/F, their effectiveness of natural ventilation has been computed to significantly surpass the minimum statutory requirements of 1.5 ACH. A maximum 91ACH can be achieved when the window area in the living room and kitchen is opened at 75% that corresponding to a uNVeF of 0.953 (see Table 12). Notably, the natural ventilation rate measured at all windows that are fully opened is less than 75% window opening configuration, as shown in Figure 5. The result revealed a lower natural ventilation rate at the lower floor of 1/F in several window opening scenarios due to reduced wind velocity, which can achieve a minimum 1.5ACH requirement (Details are shown in Table 9).
The reduction in COVID-19 infection risk, quantified using the Wells-Riley model, 96.1% at 35/F and 93.4% at 1/F compared to the baseline 1.5ACH condition, underscores the critical role of natural ventilation in mitigating airborne disease transmission. This has significant implications for public health, particularly in densely populated urban environments. The study's emphasis on window opening degree and area provides actionable guidelines for developers and occupants, enabling them to proactively manage ventilation during both the design and operational phases of residential buildings.
By integrating these urban science perspectives, the uNVeF technique can be further refined and applied to create more resilient, healthy, and equitable urban environments. The study's focus on practical guidelines for window operation also highlights the importance of educating residents and caregivers about the benefits of natural ventilation and empowering them to actively manage their indoor environment.
Acknowledgments
I would like to express my gratitude to the Laboratory Staff of Technological and Higher Education Institute of Hong Kong for thier support in the borrowing and use of all necessary measurement tools through this research work.
References
- Building Department, Hong Kong (2003) - Lighting and Ventilation Requirements (APP-130).
- Buonanno, G.; Morawska, L.; Stabile, L. (2020). Quantitative assessment of the risk of airborne transmission of SARS-CoV-2 infection: Prospective and retrospective applications. Environment International, 145, 106112–106112. [CrossRef] [PubMed]
- Chen, Y.; Norford, L. K.; Samuelson, H. W.; Malkawi, A. (2018). Optimal control of HVAC and window systems for natural ventilation through reinforcement learning. Energy and Buildings, 169, 195–205. [CrossRef]
- Choi, Y.; Song, D. (2020). How to quantify natural ventilation rate of single-sided ventilation with trickle ventilator? Building and Environment, 181, 107119. [CrossRef]
- Dai, H.; Zhao, B. Association between the infection probability of COVID-19 and ventilation rates: An update for SARS-CoV-2 variants. Build. Simul. 16, 3–12, (2023). [CrossRef] [PubMed]
- Escombe, A. R.; Oeser, C. C.; Gilman, R. H.; Navincopa, M.; Ticona, E.; Pan, W.; Martínez, C.; Chacaltana, J.; Rodríguez, R.; Moore, D. A. J.; Friedland, J. S.; Evans, C. A. (2007). Natural ventilation for the prevention of airborne contagion. PLoS Medicine, 4(2), e68. [CrossRef] [PubMed]
- Missing reference.
- Gough, H.; Sato, T.; Halios, C.; Grimmond, C. S. B.; Luo, Z.; Barlow, J. F.; Robertson, A.; Hoxey, R.; Quinn, A. (2018). Effects of variability of local winds on cross ventilation for a simplified building within a full-scale asymmetric array: Overview of the Silsoe field campaign. Journal of Wind Engineering and Industrial Aerodynamics 175, 408–418. [CrossRef]
- Guo, Y.; Qian, H.; Sun, Z.; Cao, J.; Liu, F.; Luo, X.; Ling, R.; Weschler, L. B.; Mo, J.; Zhang, Y. (2021). Assessing and controlling infection risk with wells-riley model and spatial flow impact factor (SFIF). Sustainable Cities and Society, 67, 102719–102719. [CrossRef] [PubMed]
- ICRP. (1994). Human Respiratory Tract Model for Radiological Protection, a Report of Task Group of the International Commission on Radiological Protection. ICRP Publication, Vol. 66, New York: Elsevier. 190, Table B.8.
- Liu, S.; Luo, H.; Wang, Y.; Cuevas, L. E.; Wang, D.; Ju, S.; Yang, Y. (2020). Clinical characteristics and risk factors of patients with severe COVID-19 in Jiangsu province, China: a retrospective multicentre cohort study. BMC Infectious Diseases, 20(1), 1–9. [CrossRef]
- Liu, T.; Lee, W. L. (2020). Evaluating the influence of transom window designs on natural ventilation in high-rise residential buildings in Hong Kong. Sustainable Cities and Society, 62, 102406. [CrossRef]
- Shen, J.; Kong, M.; Dong, B.; Birnkrant, M. J.; Zhang, J. (2021). Airborne transmission of SARS-CoV-2 in indoor environments:A comprehensive review. Science and Technology for the Built Environment, 27(10), 1331–1367. [CrossRef]
- Tan, Z.; Deng, X. (2017). Assessment of natural ventilation potential for residential buildings across different climate zones in Australia. Atmosphere, 8(9), 177. [CrossRef]
- Tianqi Liu; W. L. Lee. (2020) Influence of window opening degree on natural ventilation performance of residential buildings in Hong Kong. Science and Technology for the Built Environment, 26:1, 28–41. [CrossRef]
- Xia, J.; Feng, Y.; Li, M.; Yu, X.; Zhang, Y.; Duan, J.; Zhan, Q. (2020). Increased physiological dead space in mechanically ventilated COVID-19 patients recovering from severe acute respiratory distress syndrome: A case report. BMC Infectious Diseases, 20(1), 637–637. [CrossRef] [PubMed]
- Zhou, J.; Hua, Y.; Xiao, Y.; Ye, C.; Yang, W. (2021). Analysis of ventilation efficiency and effective ventilation flow rate for wind-driven single-sided ventilation buildings. Aerosol and Air Quality Research, 21(5), 1–21. [CrossRef]
Figure 1.
Aerial view of the selected public housing estate (Picture from the internet, https://greenbuilding.hkgbc.org.hk/projects/view/1376).
Figure 1.
Aerial view of the selected public housing estate (Picture from the internet, https://greenbuilding.hkgbc.org.hk/projects/view/1376).
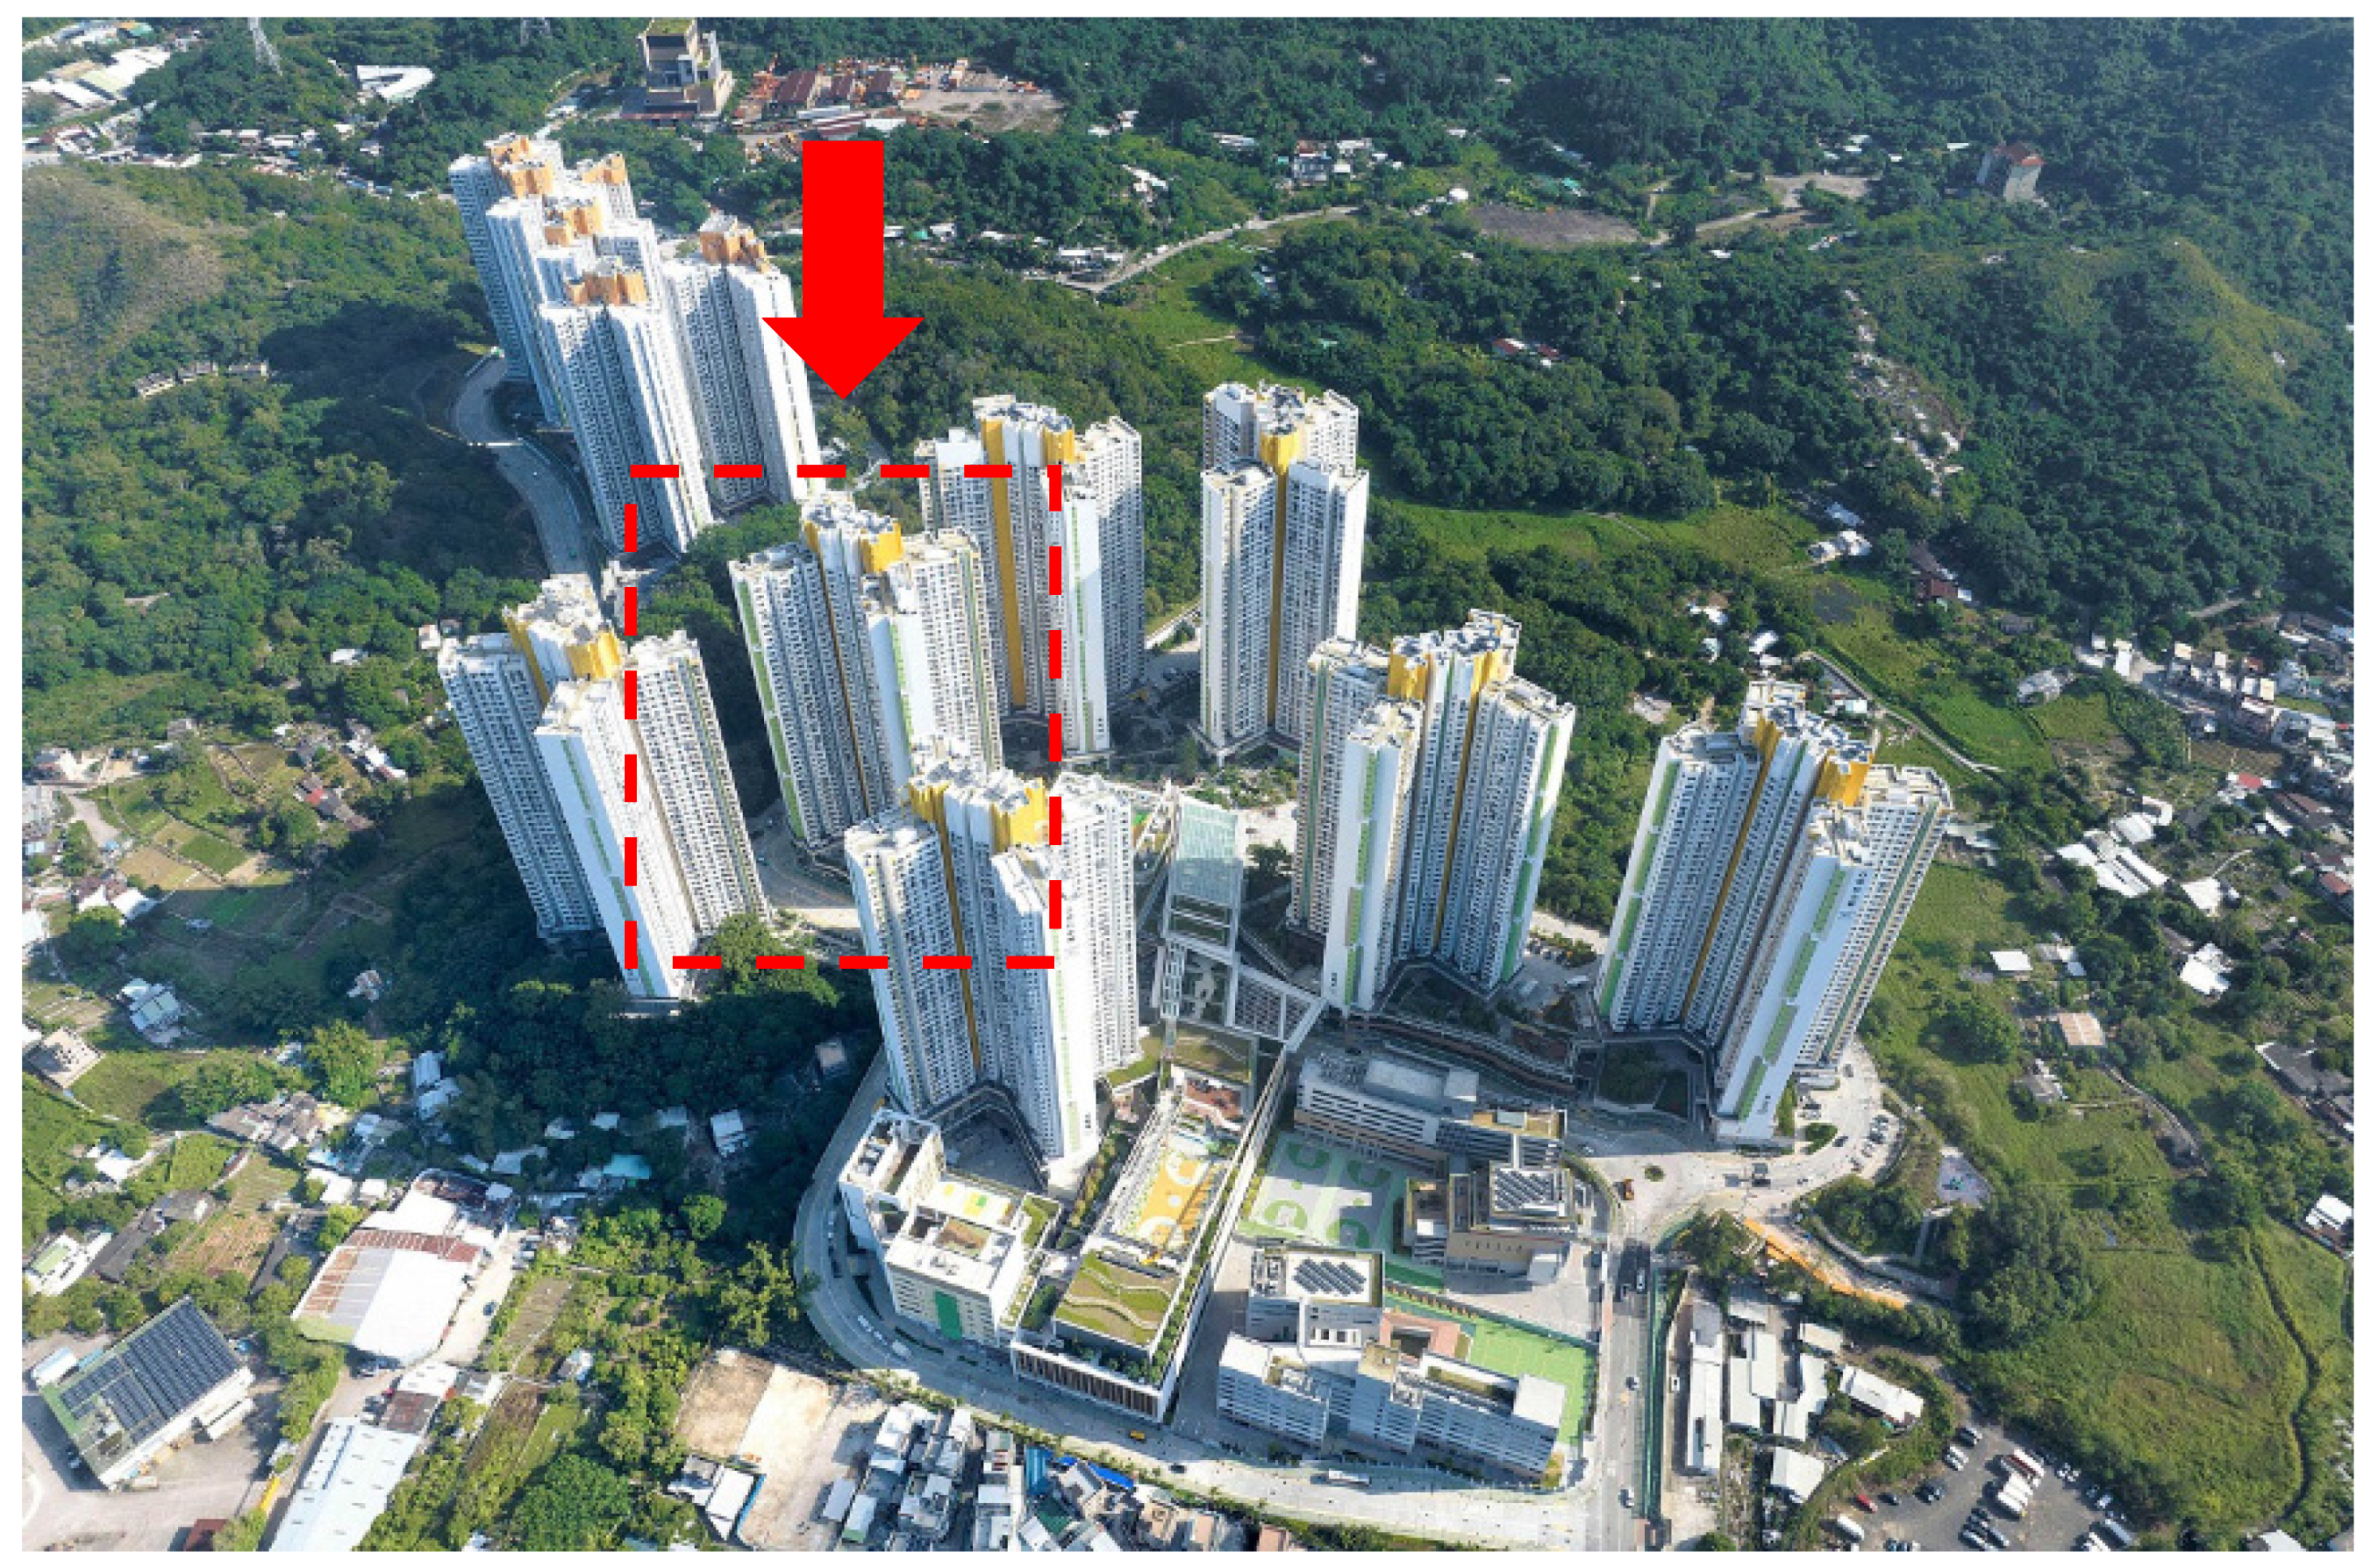
Figure 2.
Location of the selected urban residential unit. Picture extracted from the internet, https://www.hkmapservice.gov.hk/OneStopSystem/map-search?product=OSSCatB&series=iB1000).
Figure 2.
Location of the selected urban residential unit. Picture extracted from the internet, https://www.hkmapservice.gov.hk/OneStopSystem/map-search?product=OSSCatB&series=iB1000).
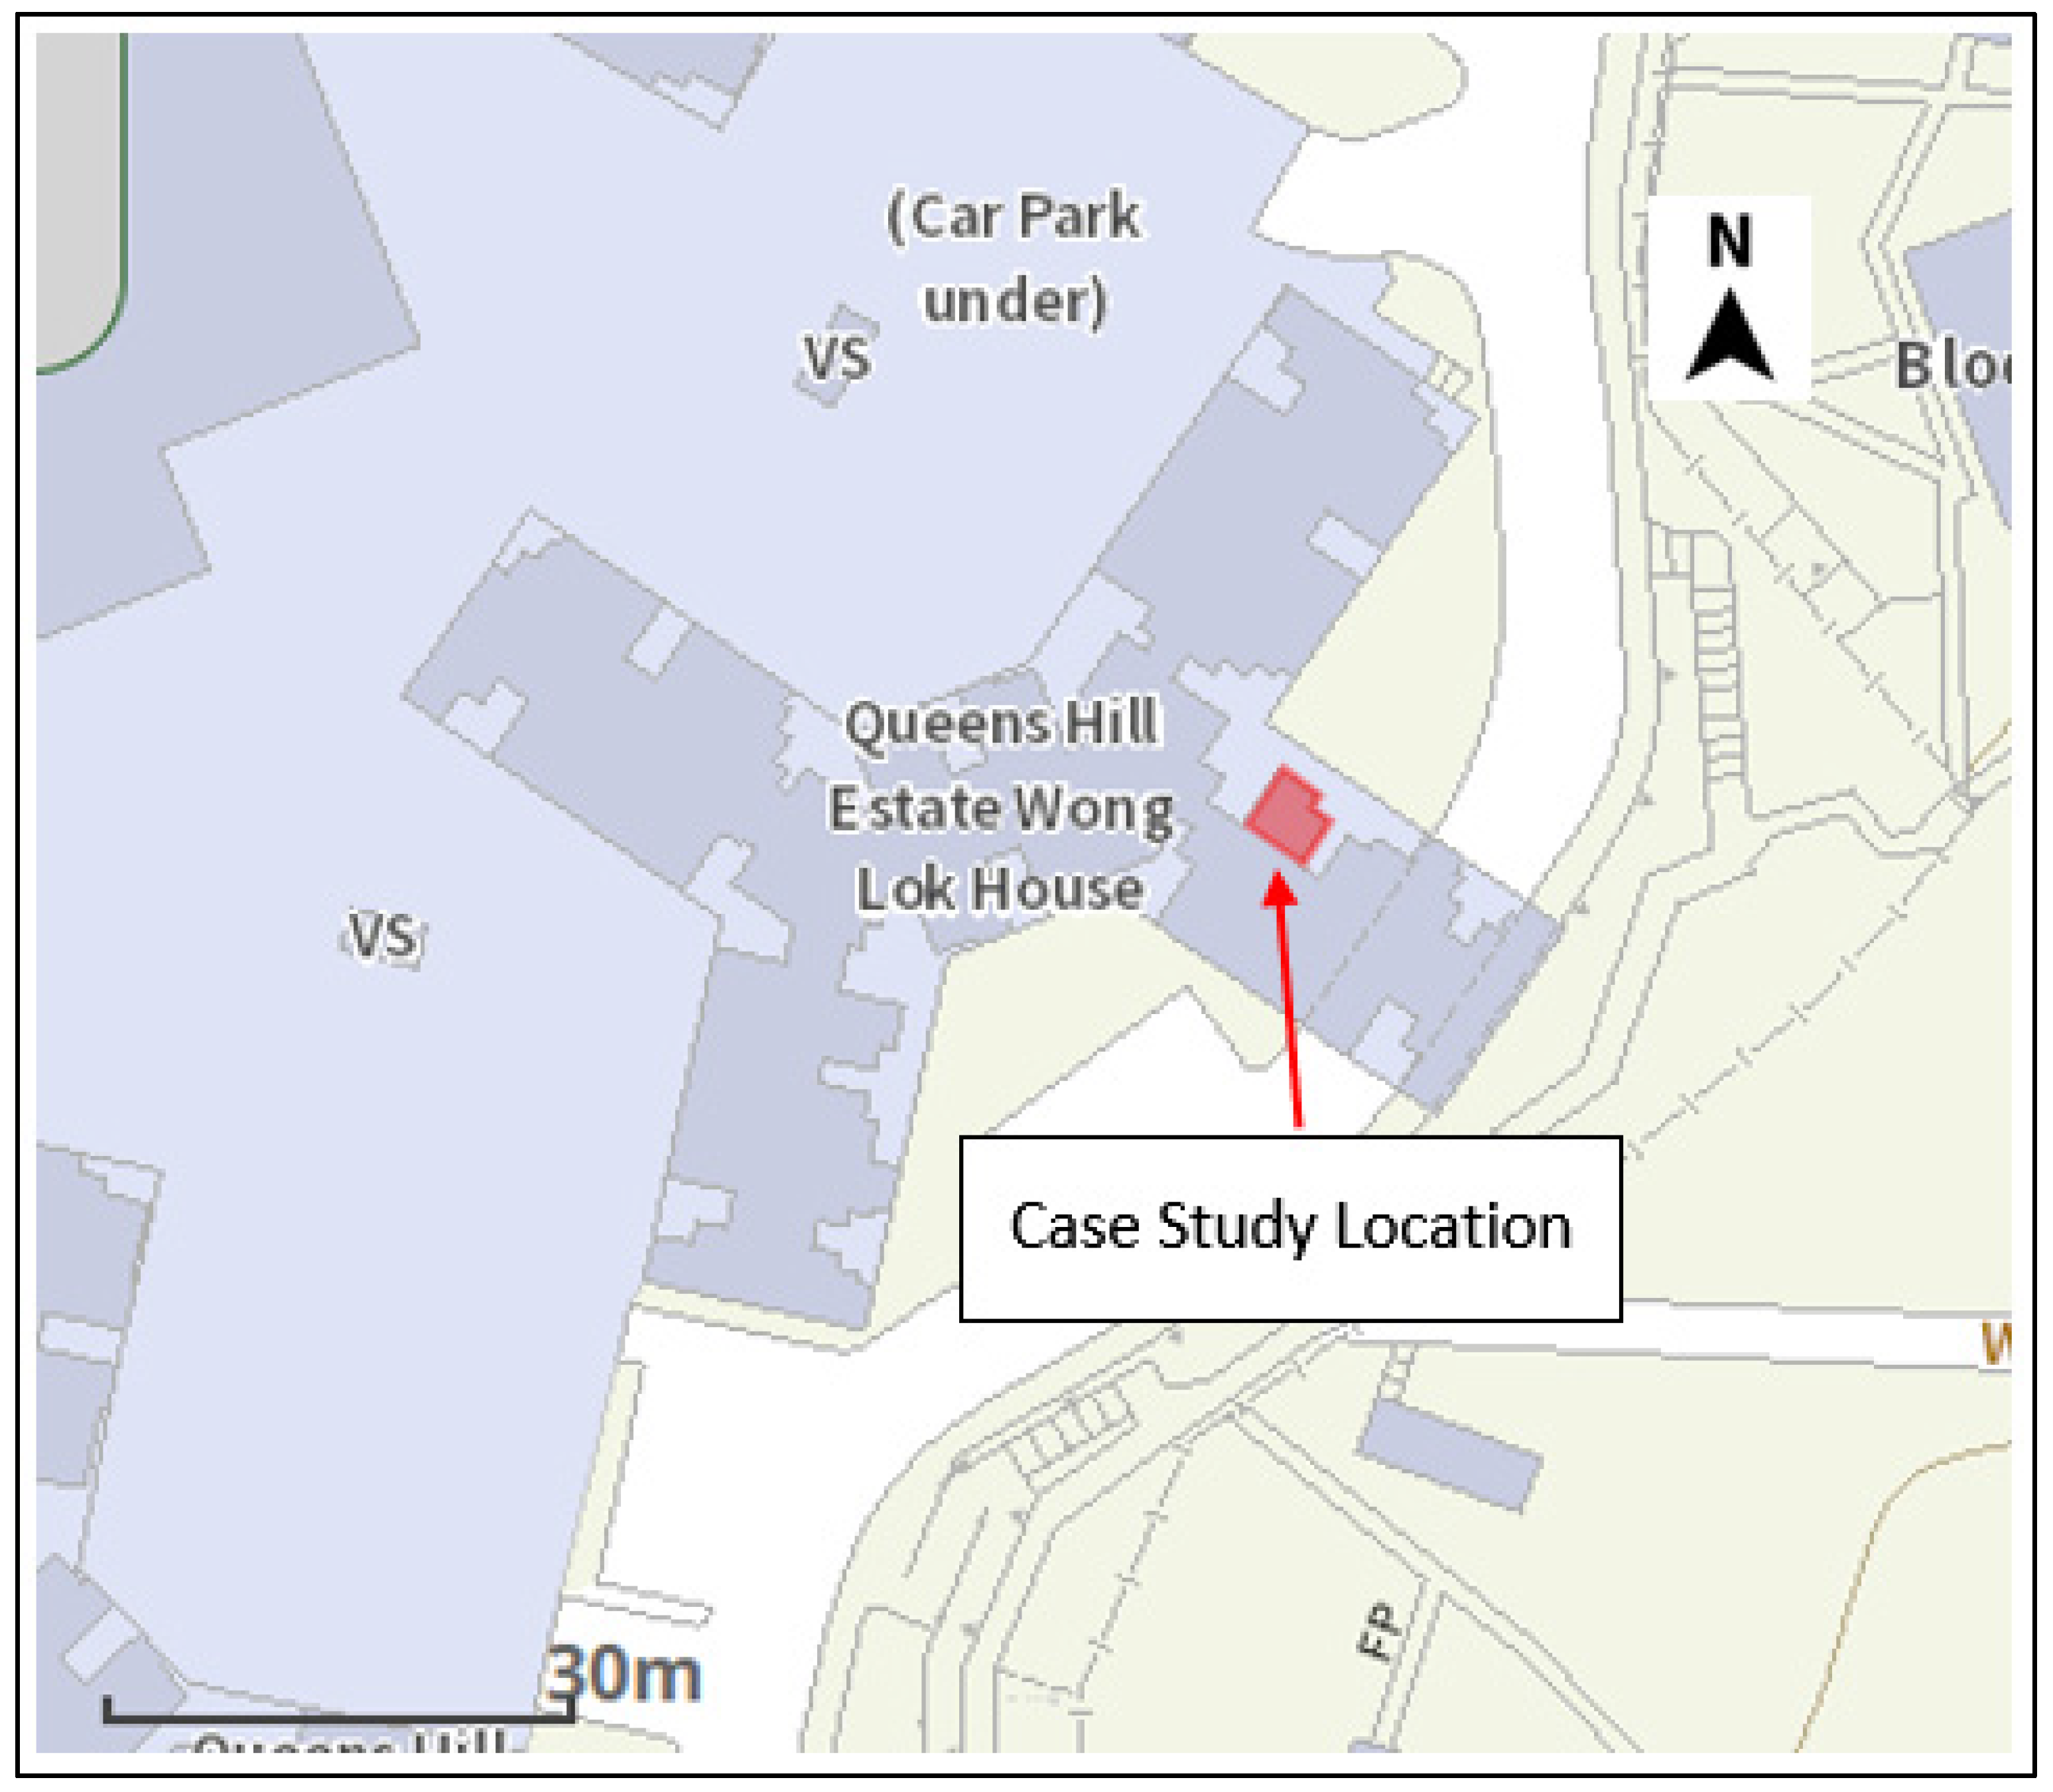
Figure 3.
Dimensions of the selected urban residential unit.
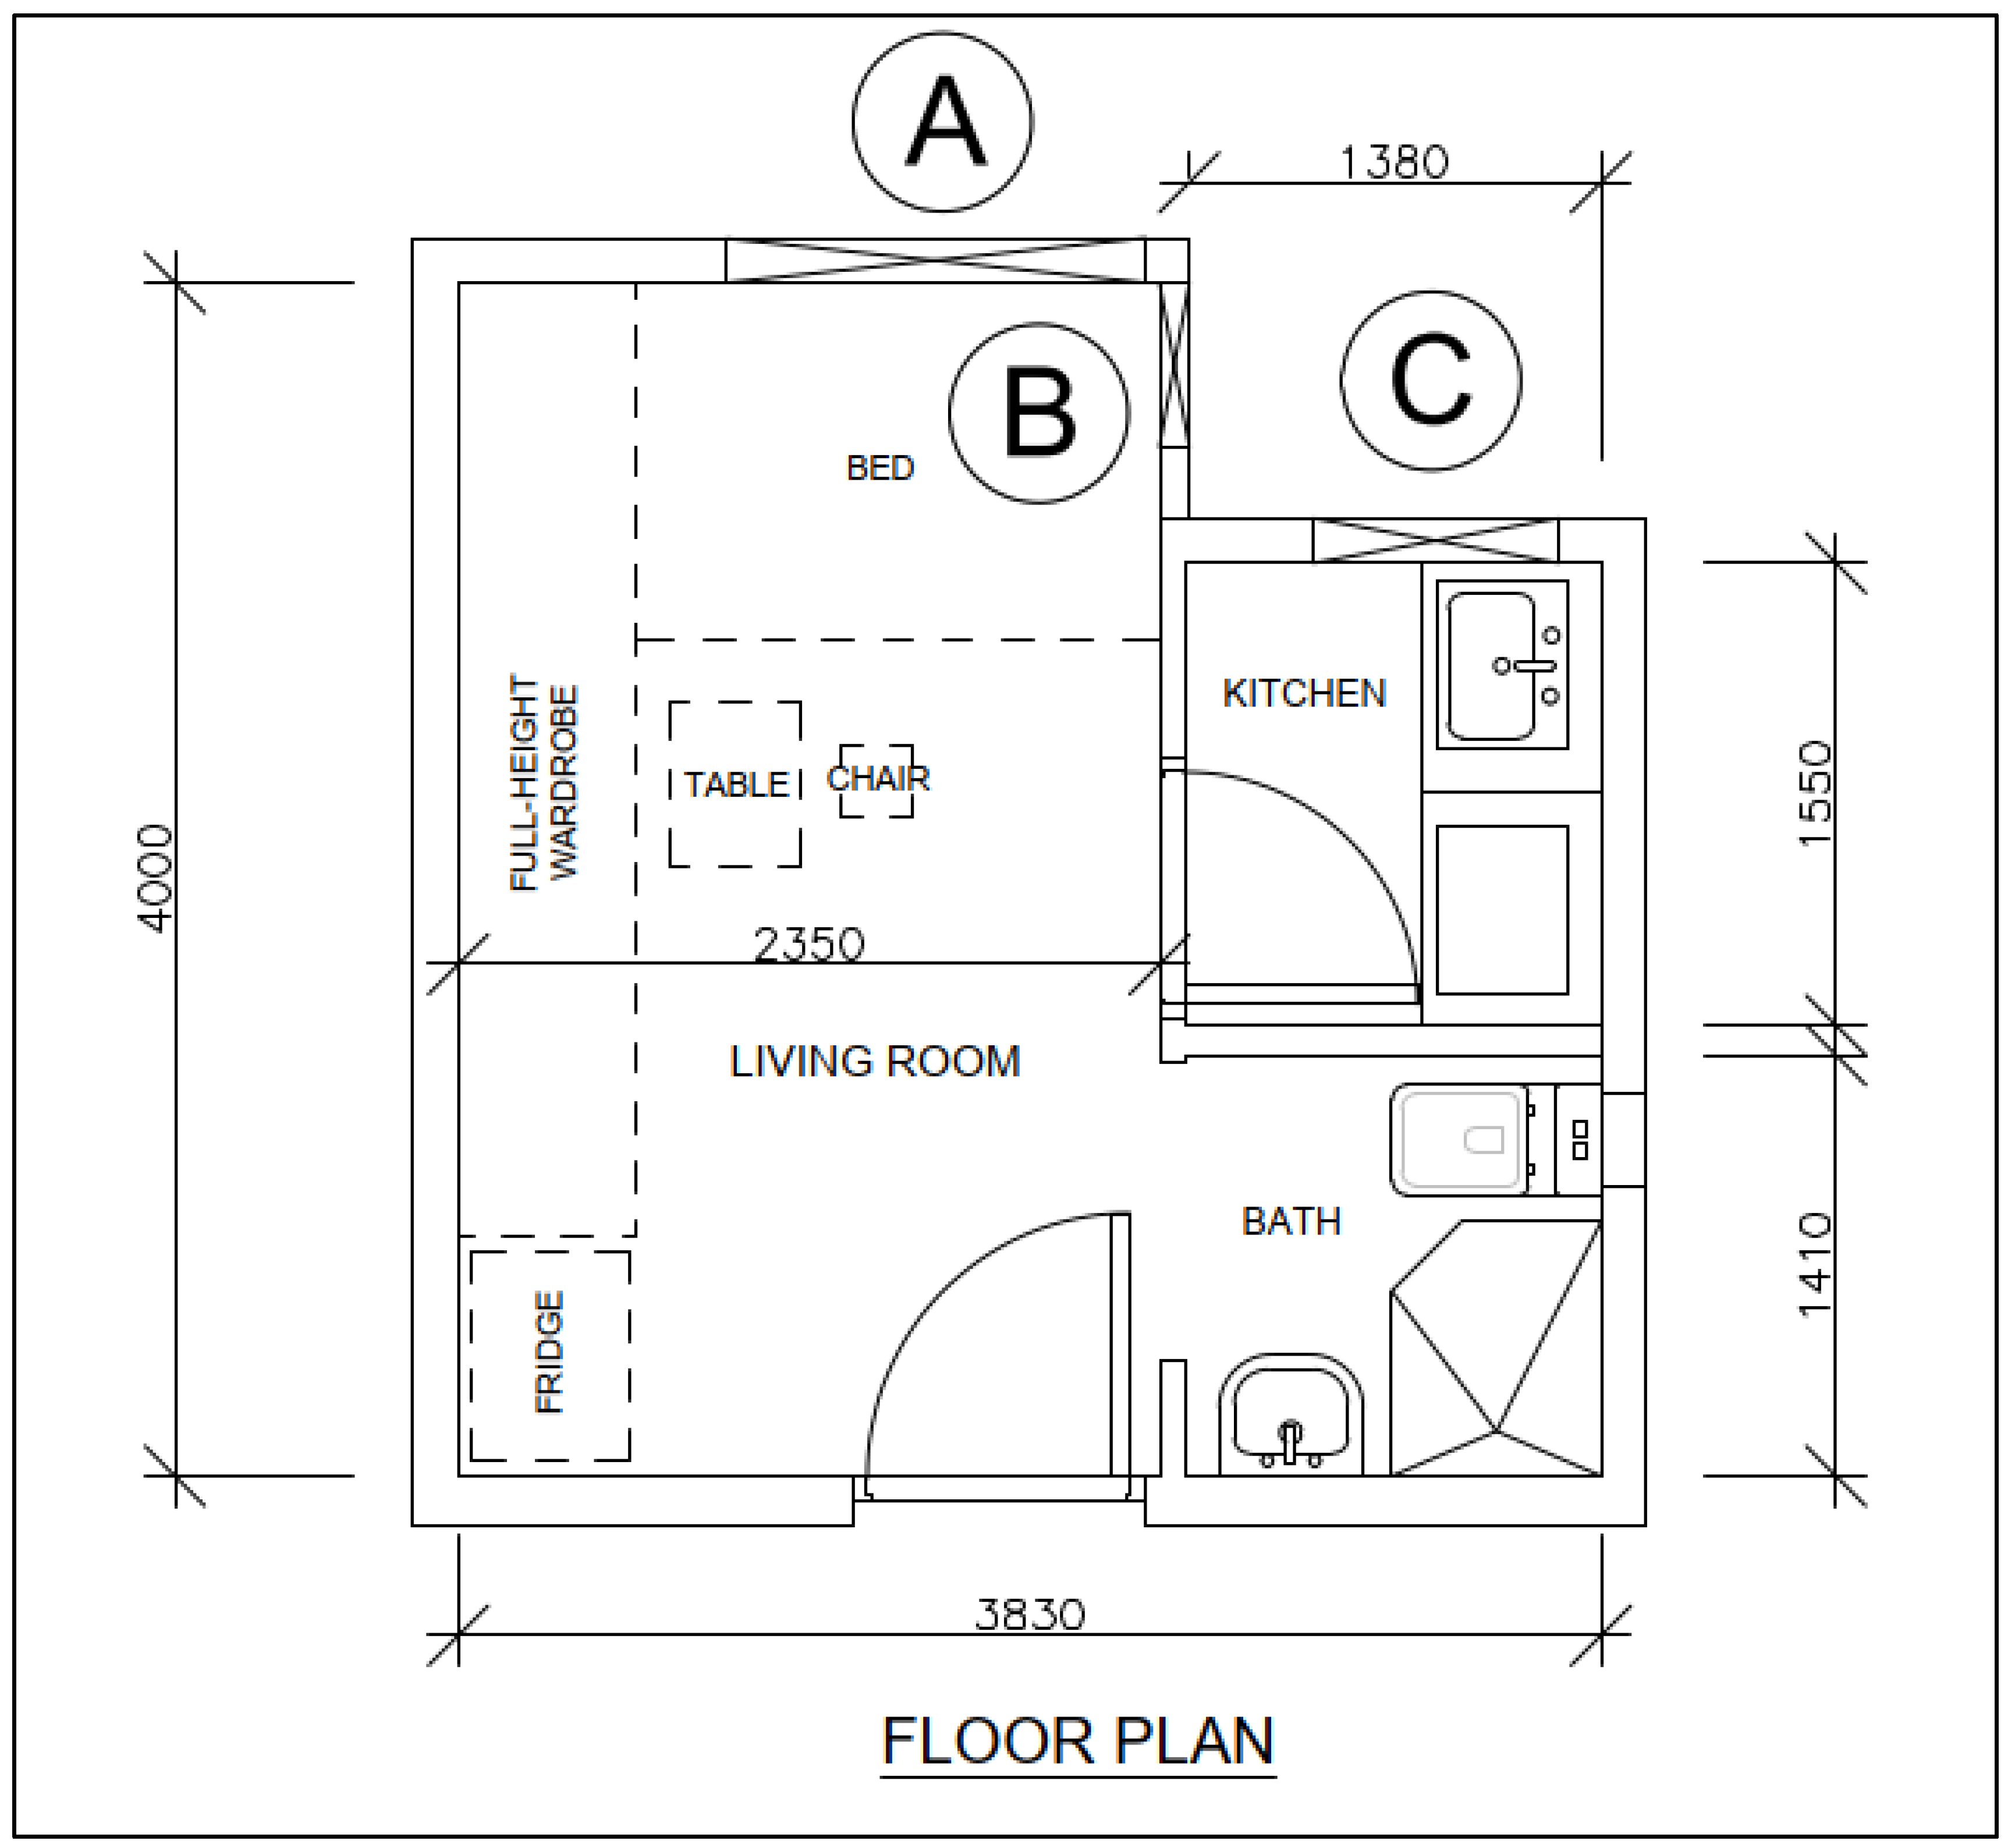
Figure 4.
Elevation view of the side hung type windows (Window number 1 to 4).
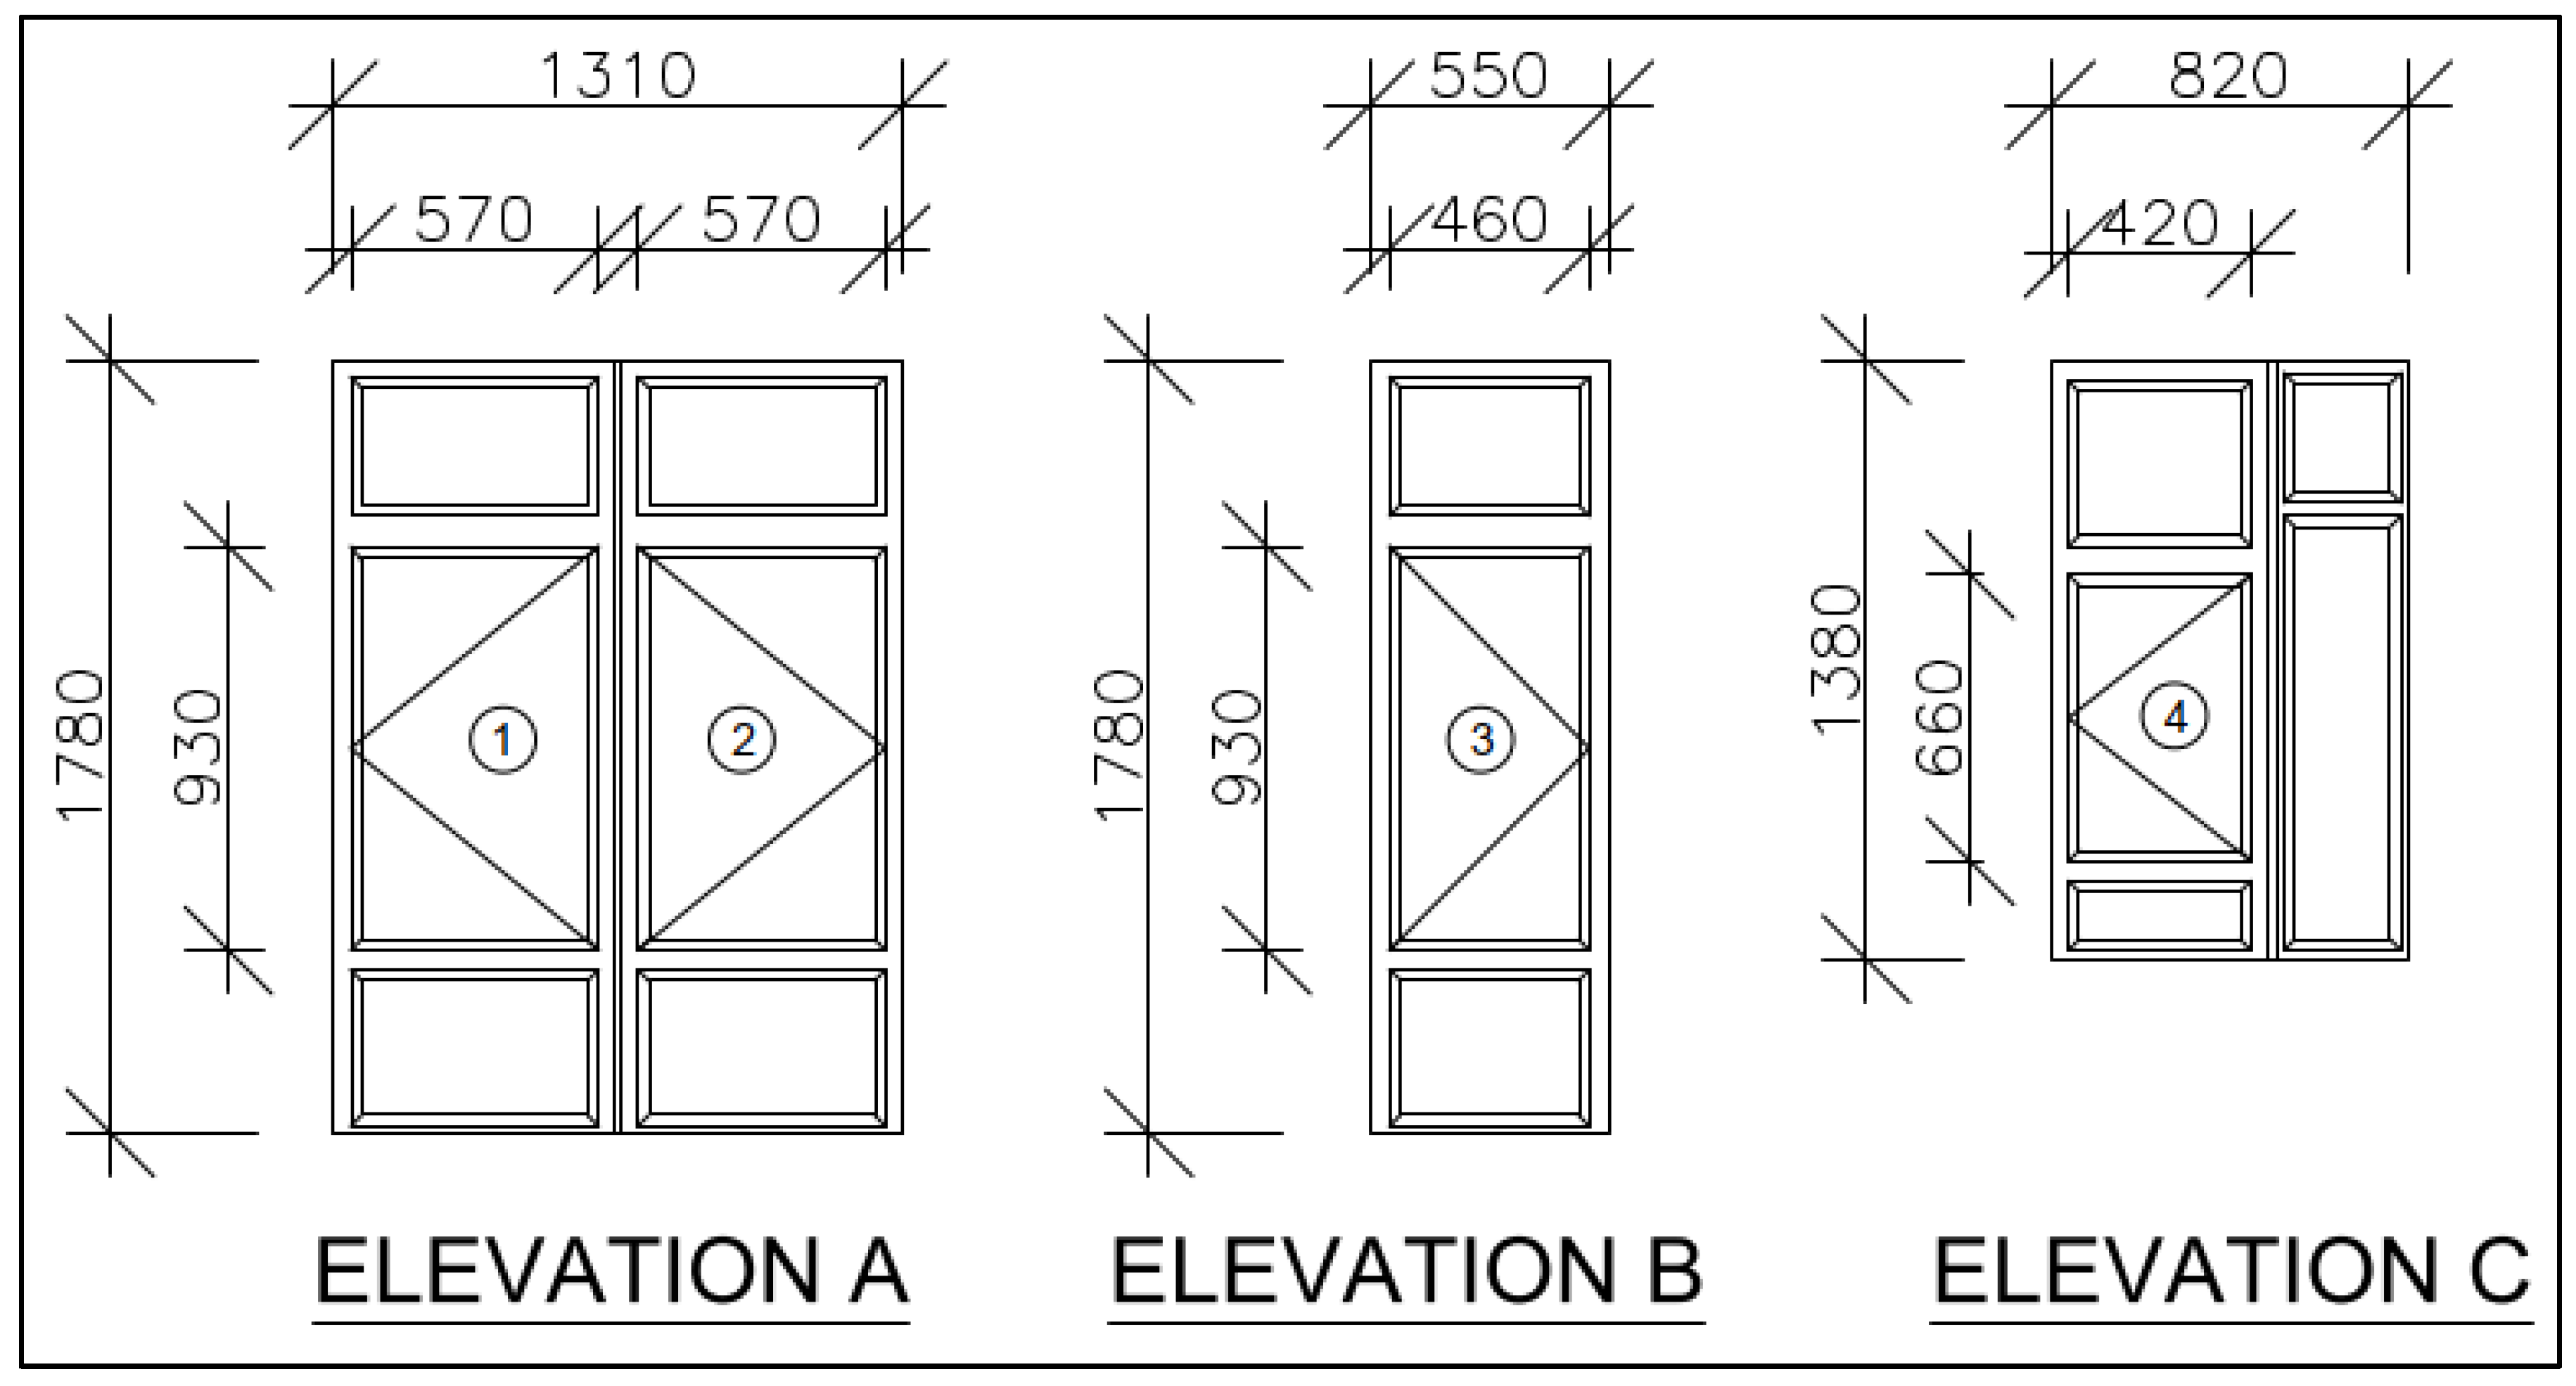
Figure 5.
Framework of study.
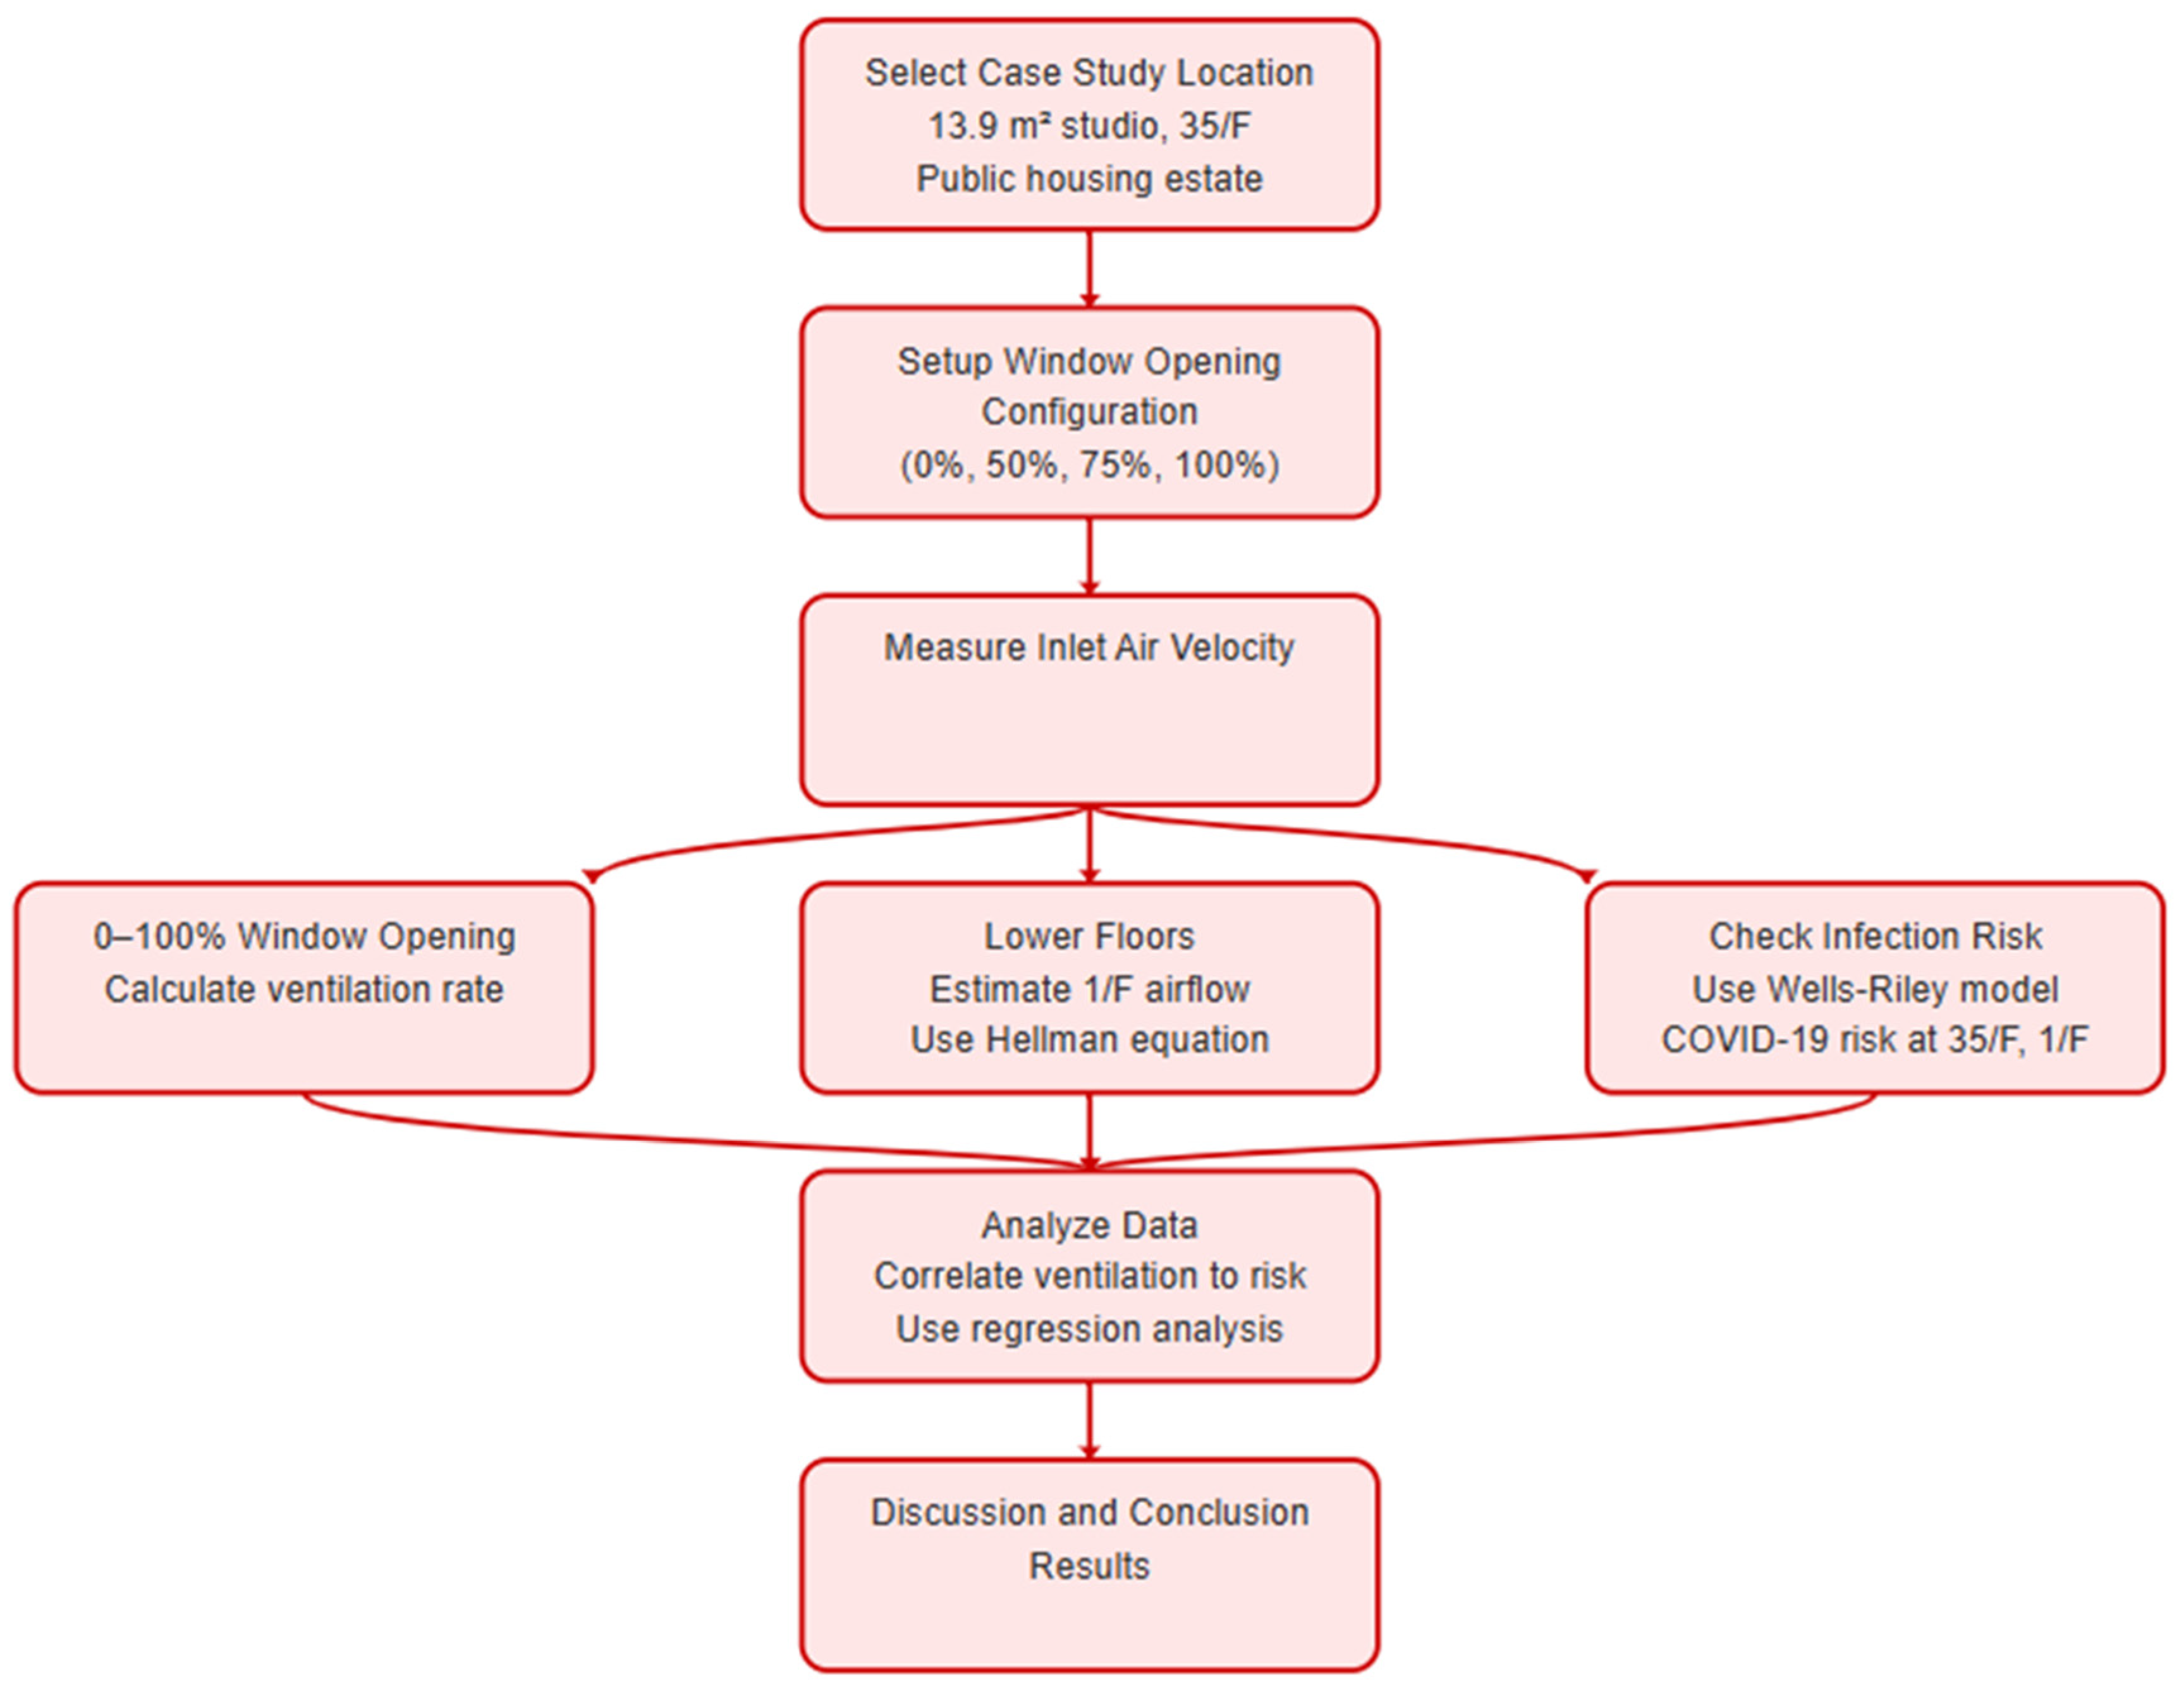
Figure 6.
Effect of uNVeF on ACH.
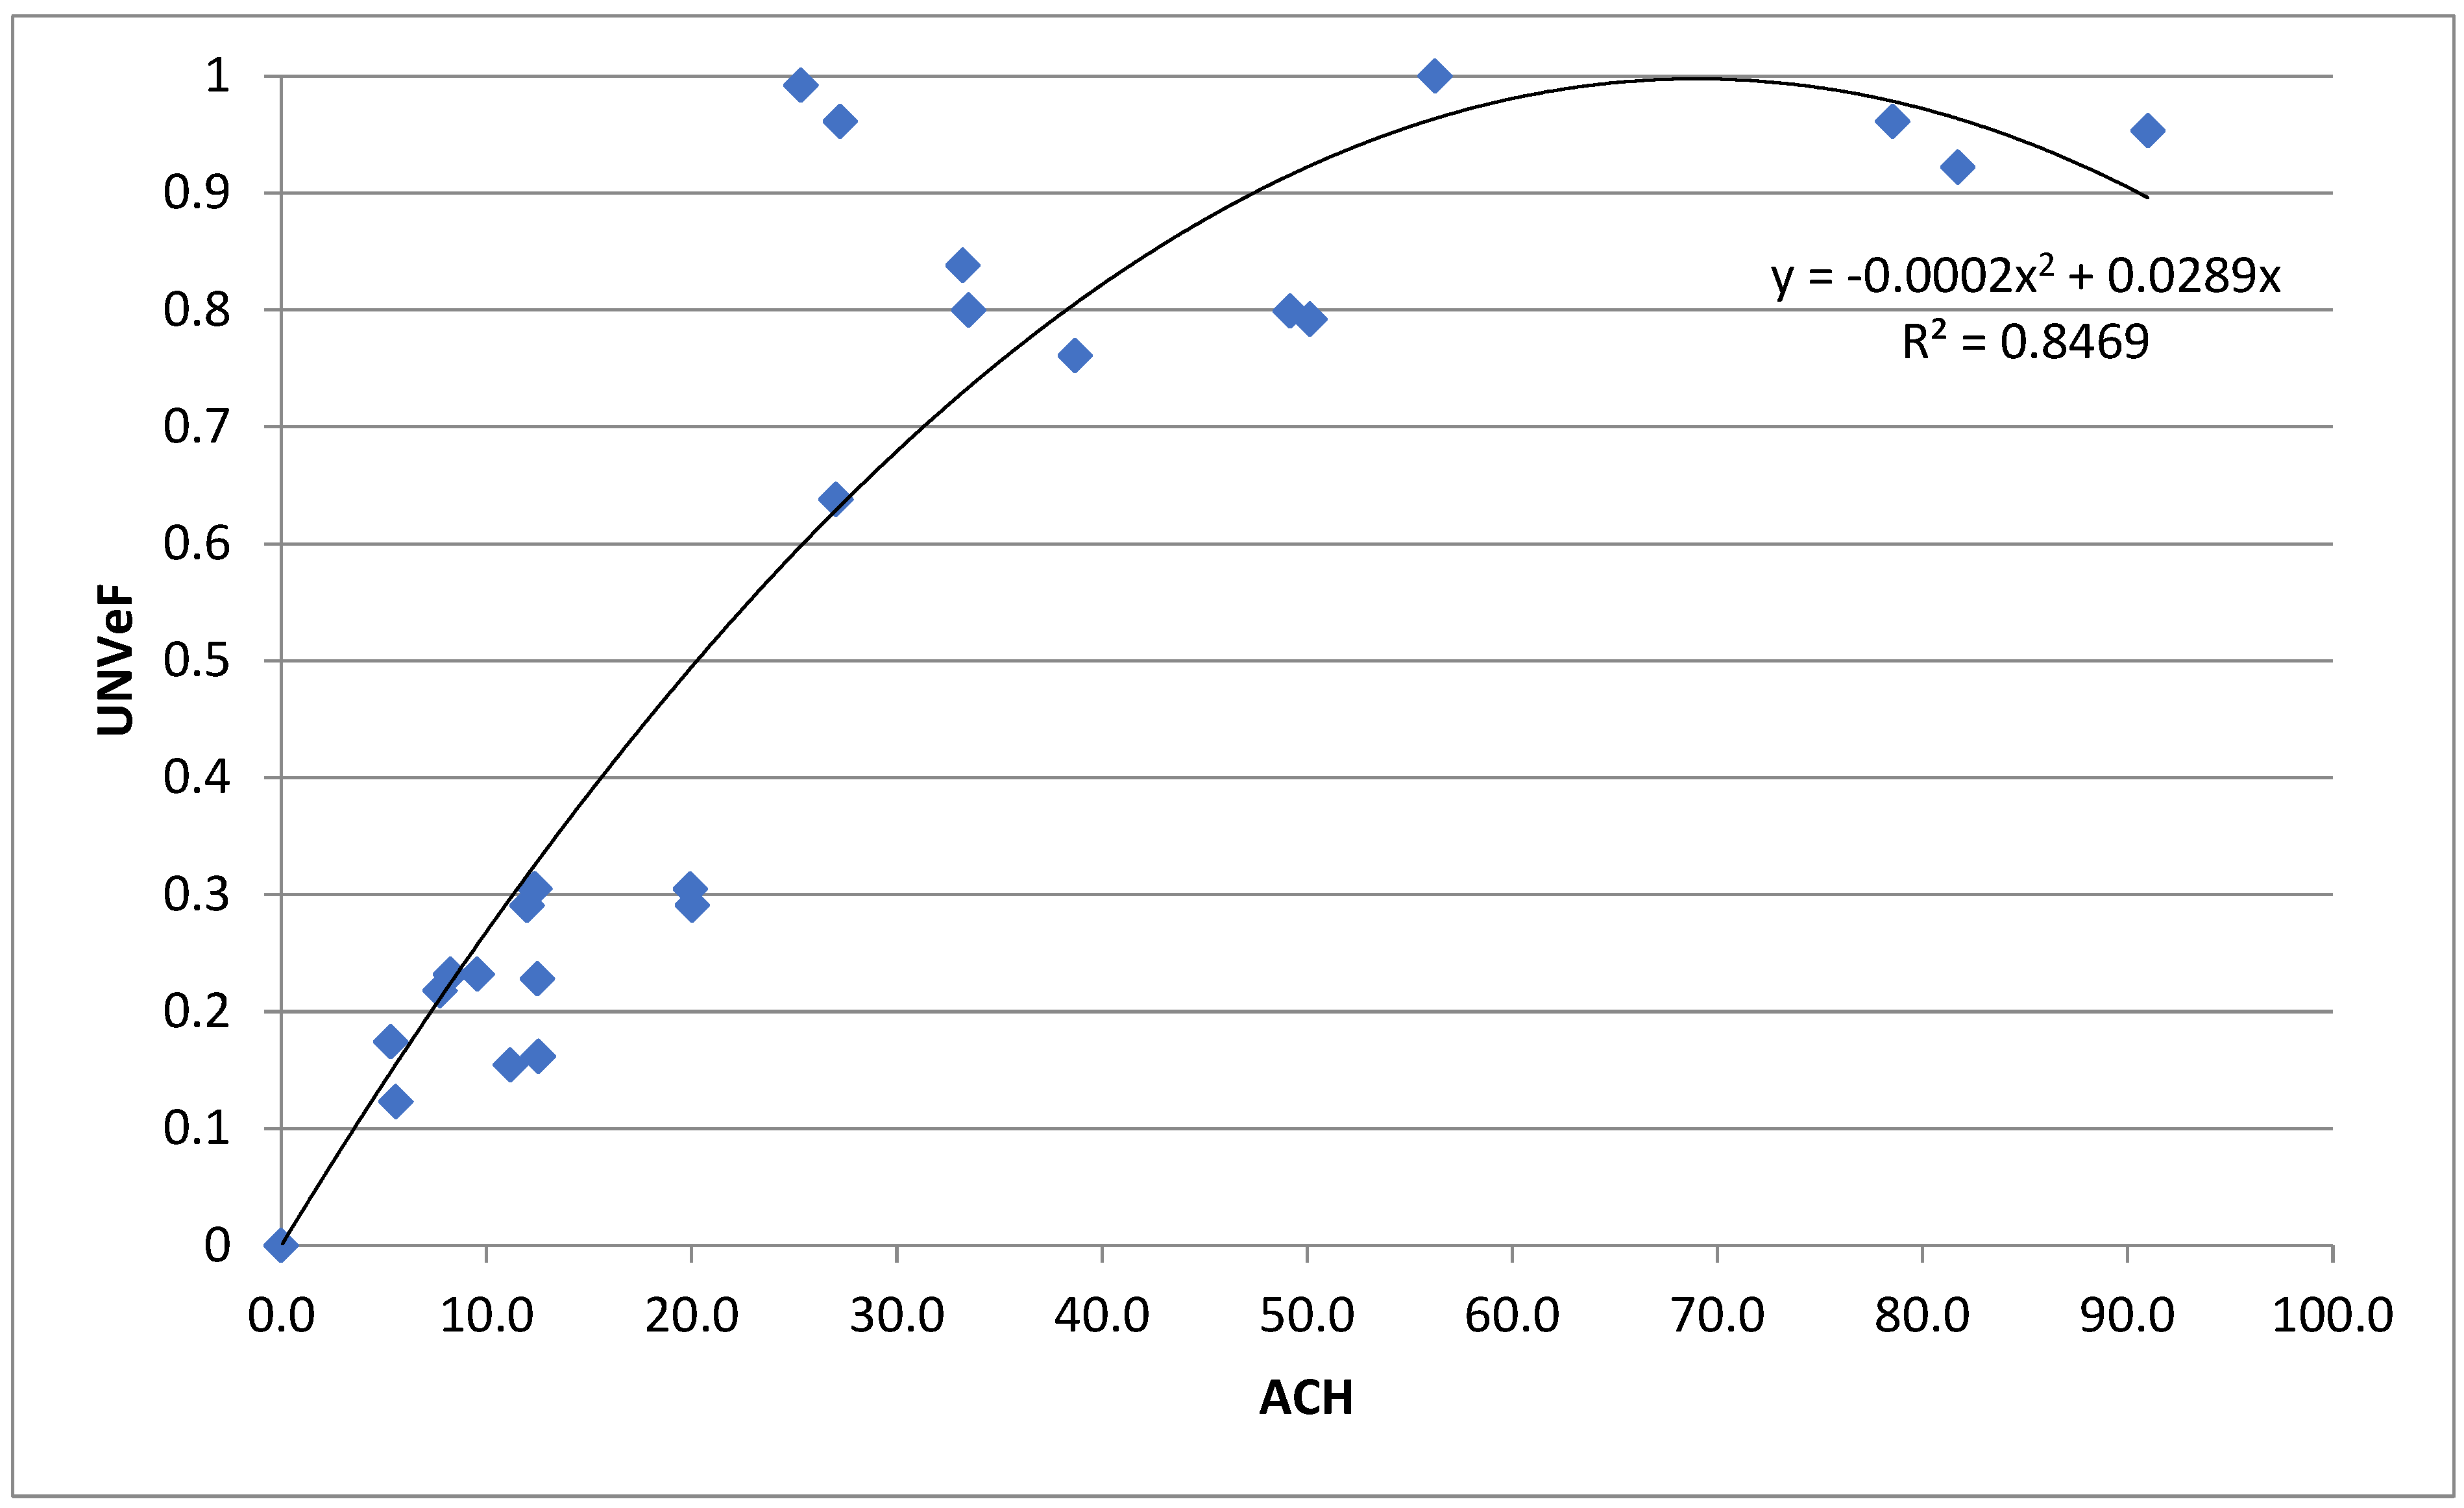
Figure 7.
Effect on wind velocity factor against floor level factor ().
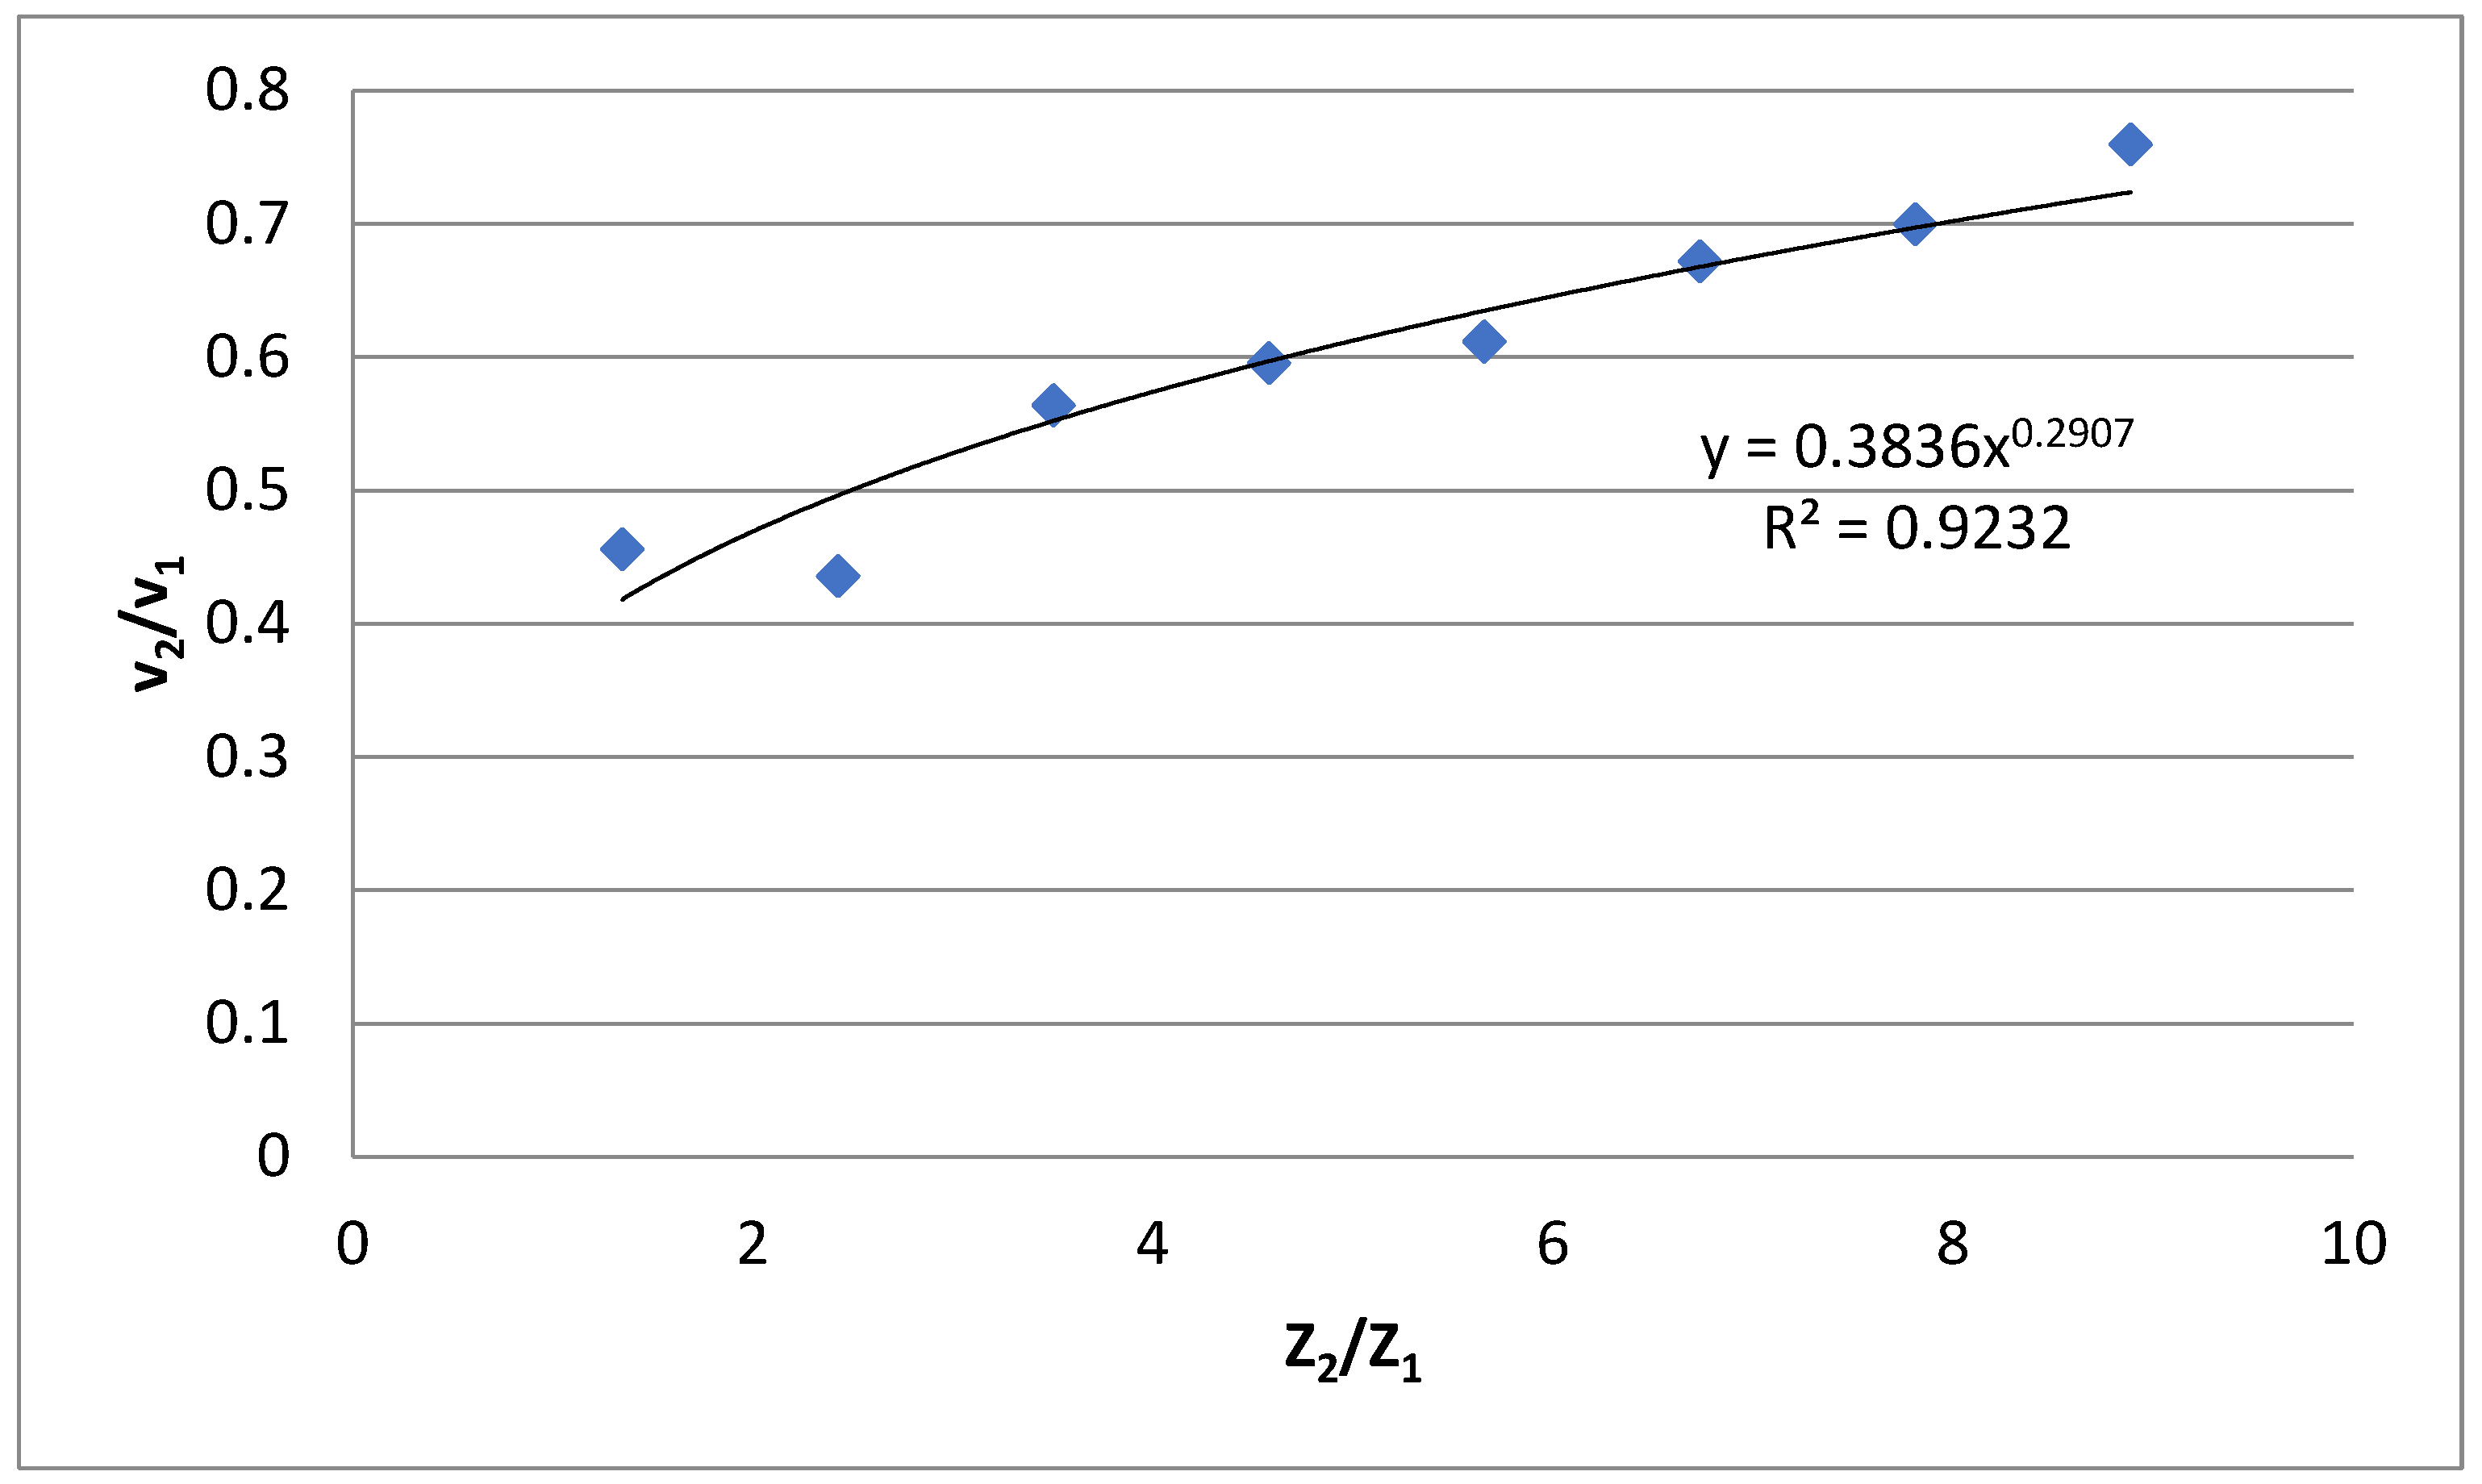
Figure 8.
Effect of COVID-19 infection risk on different uNVeF.
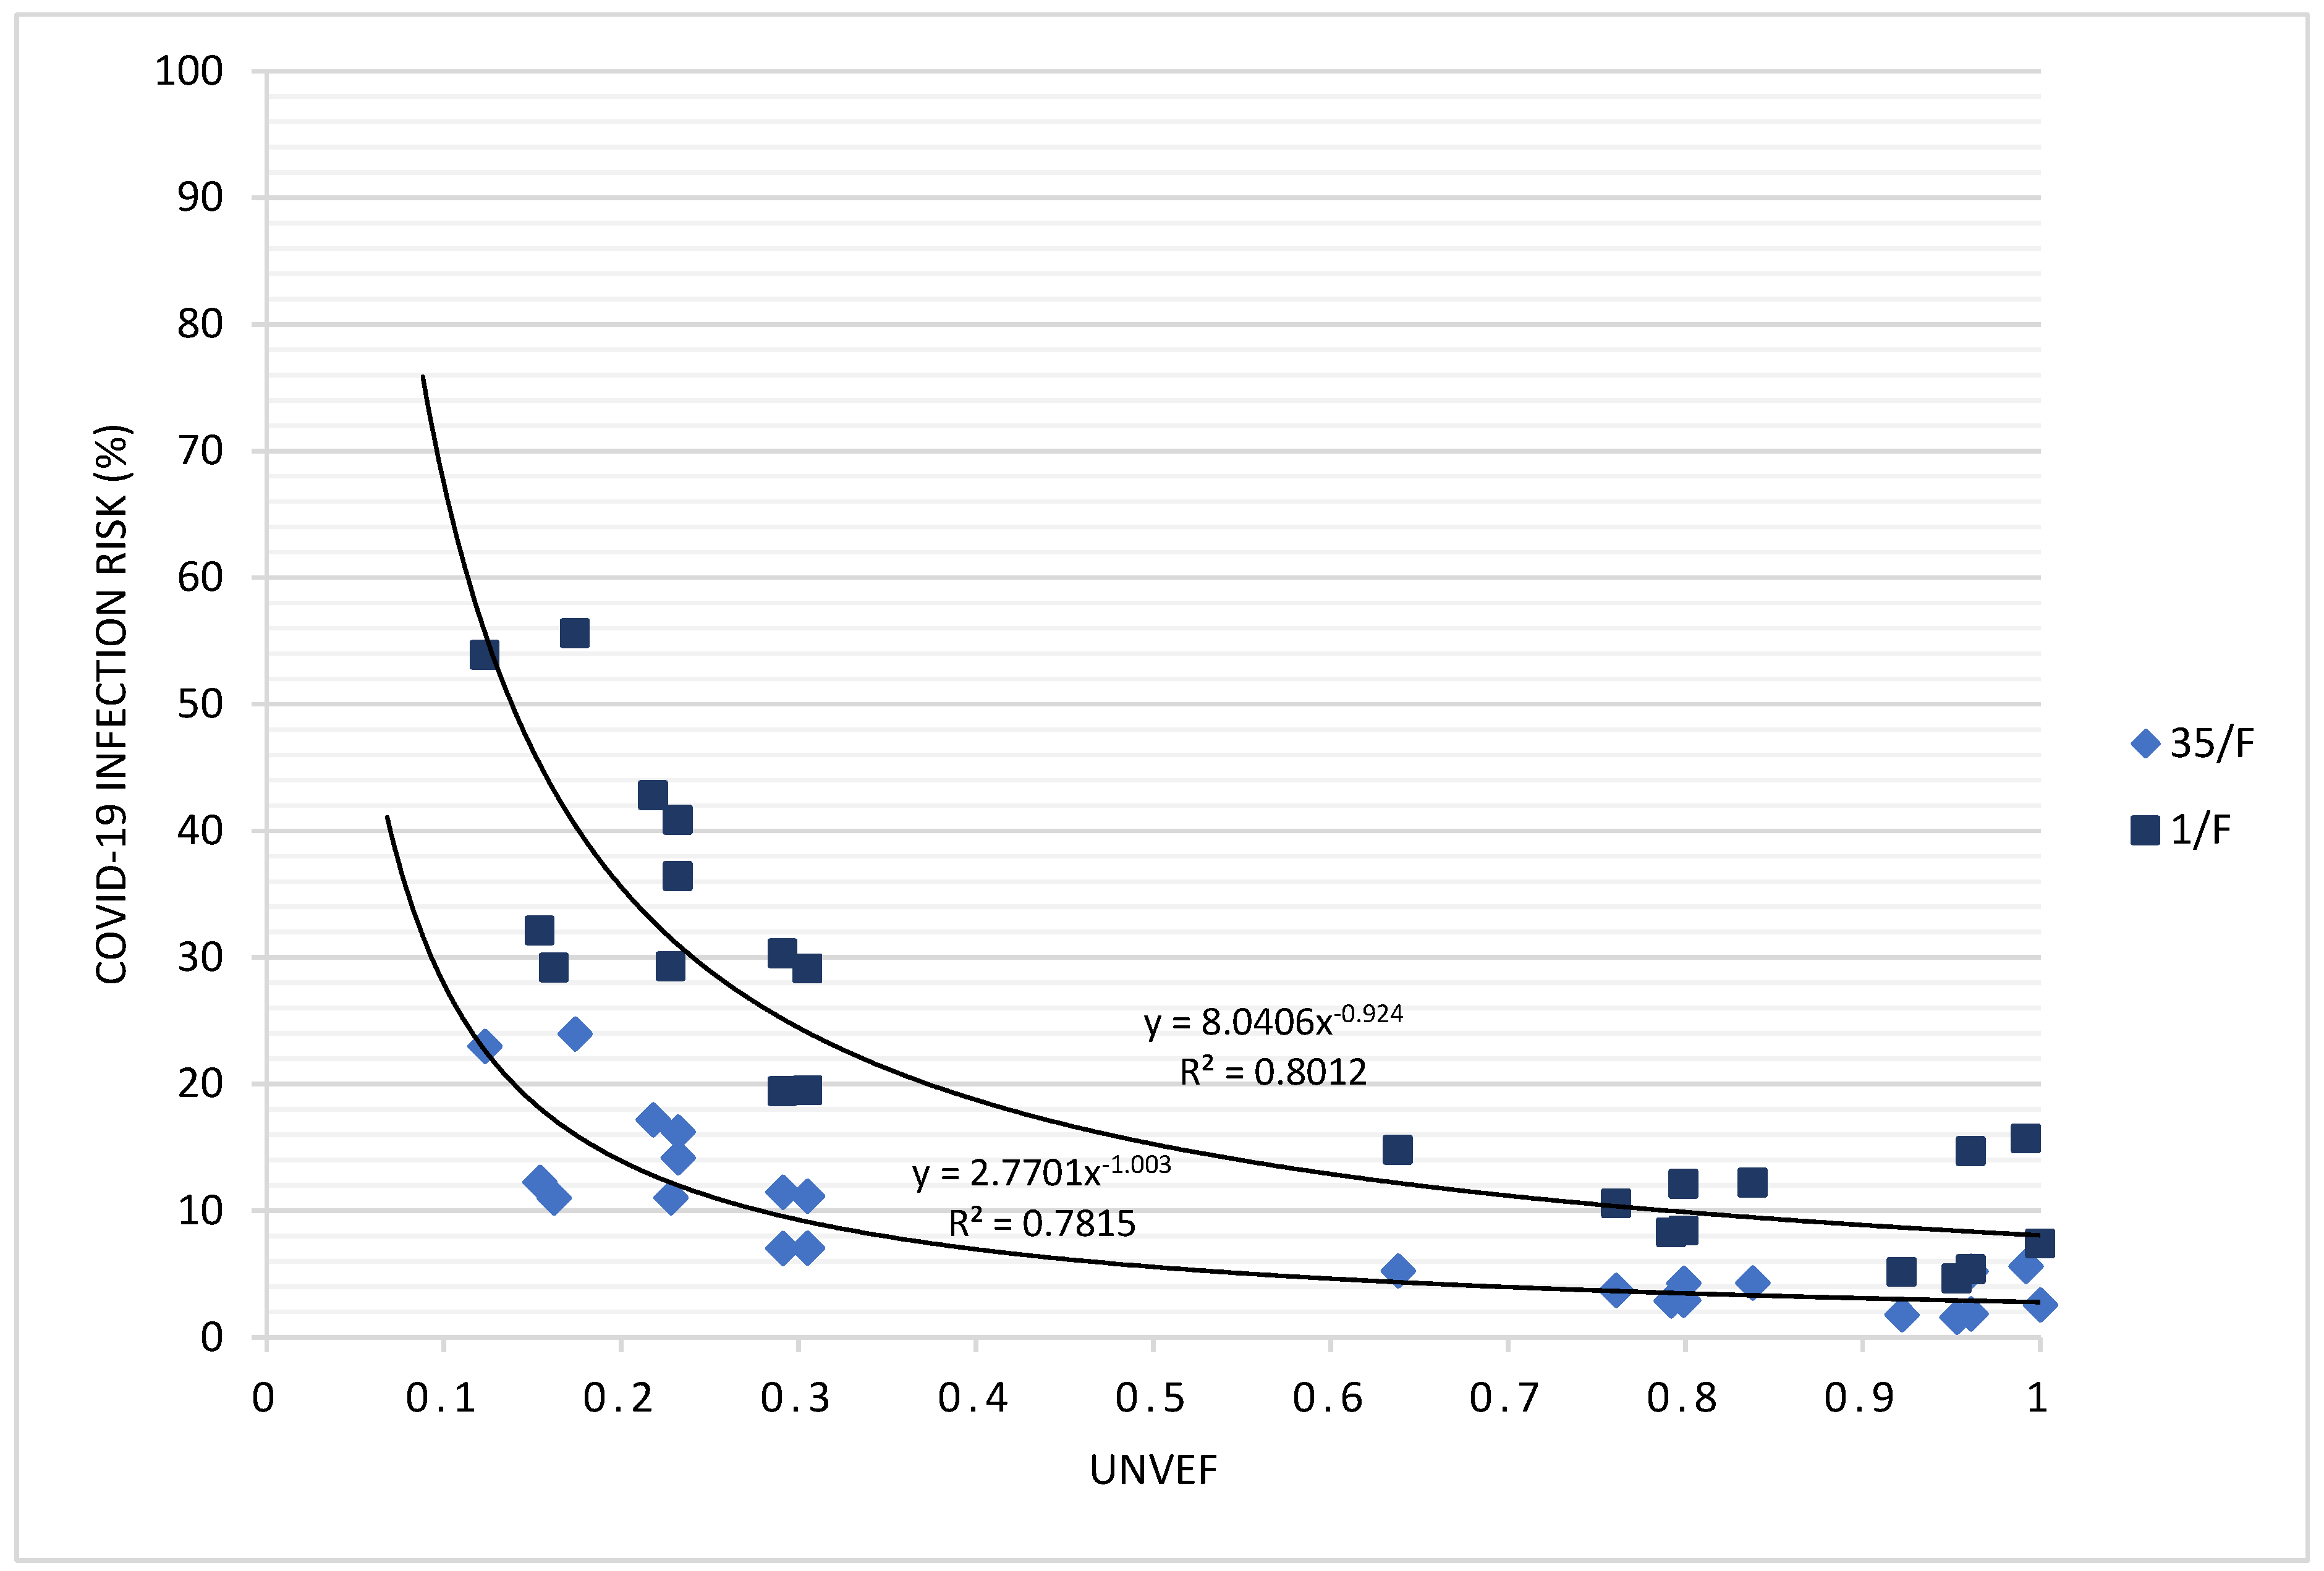
Table 1.
Window opening scenarios for measurement.
| Scenario | Living Room Window 1 | Living Room Window 2 | Living Room Window 3 | Kitchen Window |
|---|---|---|---|---|
| 1 | 100% | 100% | 100% | 50% |
| 2 | 100% | 100% | 100% | 75% |
| 3 | 100% | 100% | 100% | 100% |
| 4 | 100% | 100% | 100% | 0% |
| 5 | 75% | 75% | 75% | 50% |
| 6 | 75% | 75% | 75% | 75% |
| 7 | 75% | 75% | 75% | 100% |
| 8 | 75% | 75% | 75% | 0% |
| 9 | 50% | 50% | 50% | 50% |
| 10 | 50% | 50% | 50% | 75% |
| 11 | 50% | 50% | 50% | 100% |
| 12 | 50% | 50% | 50% | 0% |
| 13 | 0% | 0% | 0% | 50% |
| 14 | 0% | 0% | 0% | 75% |
| 15 | 0% | 0% | 0% | 100% |
| 16 | 0% | 0% | 0% | 0% |
| 17 | 50% | 0% | 0% | 0% |
| 18 | 75% | 0% | 0% | 0% |
| 19 | 100% | 0% | 0% | 0% |
| 20 | 0% | 50% | 0% | 0% |
| 21 | 0% | 75% | 0% | 0% |
| 22 | 0% | 100% | 0% | 0% |
| 23 | 0% | 0% | 50% | 0% |
| 24 | 0% | 0% | 75% | 0% |
| 25 | 0% | 0% | 100% | 0% |
Table 2.
Measuring instruments.
| Name | Brand | Model | Accuracy | Measurement Intervals |
|---|---|---|---|---|
| Hot Wire Anemometer | Testo | 425 | ±(0.03 m/s + 5 % of measured value) | 0.01 m/s |
| Temperature & Humidity Data Logger | Testo | 175 H1 | ±0.4 °C (-20 to +55 °C) ±1 Digit & ±0.03 %RH/K ±1 Digit |
0.1 °C 0.1 %RH |
| CO2 Meter | Testo | 535 | ±(50 ppm + 5% of measured value) | 1 ppm |
| PM2.5 Meter | Aeroqual | S500 | ±0.005 mg/m3 + 15% | 0.001 mg/m3 |
Table 3.
Parameter data set in different scenarios.
| Scenario | Average Inlet Air Velocity (m/s) |
Room Temperature ) |
CO2 Concentration (ppm) |
PM2.5 Concentration (ppm) |
Relative Humidity (%) |
Total Aeff (m2) |
|---|---|---|---|---|---|---|
| 1 | 0.093 | 17.2 | 411 | 0.016 | 50.4 | 2.69 |
| 2 | 0.086 | 17.0 | 418 | 0.018 | 50.2 | 2.78 |
| 3 | 0.188 | 17.3 | 423 | 0.015 | 50.1 | 2.80 |
| 4 | 0.135 | 17.9 | 436 | 0.016 | 50.1 | 2.35 |
| 5 | 0.363 | 17.5 | 418 | 0.016 | 43.1 | 2.58 |
| 6 | 0.383 | 17.8 | 409 | 0.015 | 37.6 | 2.67 |
| 7 | 0.289 | 17.8 | 409 | 0.016 | 37.9 | 2.69 |
| 8 | 0.159 | 17.9 | 423 | 0.019 | 48.6 | 2.24 |
| 9 | 0.193 | 18.0 | 409 | 0.015 | 35.2 | 2.13 |
| 10 | 0.241 | 17.9 | 406 | 0.021 | 37.1 | 2.22 |
| 11 | 0.151 | 17.9 | 410 | 0.015 | 38.6 | 2.24 |
| 12 | 0.040 | 18.2 | 438 | 0.016 | 35.8 | 1.79 |
| 13 | 0.040 | 18.2 | 495 | 0.015 | 34.9 | 0.34 |
| 14 | 0.064 | 18.2 | 535 | 0.015 | 35.2 | 0.43 |
| 15 | 0.068 | 18.3 | 543 | 0.016 | 37.9 | 0.45 |
| 16 | 0 | 18.4 | 548 | 0.014 | 61.6 | 0 |
| 17 | 0.031 | 18.3 | 578 | 0.015 | 38.6 | 0.65 |
| 18 | 0.061 | 18.4 | 574 | 0.017 | 38.2 | 0.81 |
| 19 | 0.058 | 18.4 | 562 | 0.015 | 38.5 | 0.85 |
| 20 | 0.036 | 18.4 | 549 | 0.016 | 38.0 | 0.65 |
| 21 | 0.036 | 18.5 | 507 | 0.016 | 38.5 | 0.81 |
| 22 | 0.036 | 18.5 | 503 | 0.017 | 37.4 | 0.85 |
| 23 | 0.027 | 18.5 | 520 | 0.016 | 38.1 | 0.49 |
| 24 | 0.031 | 18.5 | 538 | 0.016 | 38.1 | 0.61 |
| 25 | 0.048 | 18.5 | 559 | 0.015 | 38.5 | 0.64 |
Table 4.
Measured inlet air velocity and ACH at 35/F.
| Scenario | Living Room Window 1 | Living Room Window 2 | Living Room Window 3 | Kitchen Window | Average Inlet Air Velocity | ACH | |
|---|---|---|---|---|---|---|---|
| (m/s) | |||||||
| 1 | 100% | 100% | 100% | 50% | 0.093 | 27.2 | 0.961 |
| 2 | 100% | 100% | 100% | 75% | 0.086 | 25.3 | 0.992 |
| 3 | 100% | 100% | 100% | 100% | 0.188 | 56.2 | 1 |
| 4 | 100% | 100% | 100% | 0% | 0.135 | 33.2 | 0.838 |
| 5 | 75% | 75% | 75% | 50% | 0.363 | 81.7 | 0.922 |
| 6 | 75% | 75% | 75% | 75% | 0.383 | 91.0 | 0.953 |
| 7 | 75% | 75% | 75% | 100% | 0.289 | 78.5 | 0.961 |
| 8 | 75% | 75% | 75% | 0% | 0.159 | 49.2 | 0.799 |
| 9 | 50% | 50% | 50% | 50% | 0.193 | 38.7 | 0.761 |
| 10 | 50% | 50% | 50% | 75% | 0.241 | 50.1 | 0.792 |
| 11 | 50% | 50% | 50% | 100% | 0.151 | 33.5 | 0.799 |
| 12 | 50% | 50% | 50% | 0% | 0.040 | 27.0 | 0.638 |
| 13 | 0% | 0% | 0% | 50% | 0.040 | 5.6 | 0.123 |
| 14 | 0% | 0% | 0% | 75% | 0.064 | 11.2 | 0.154 |
| 15 | 0% | 0% | 0% | 100% | 0.068 | 12.5 | 0.162 |
| 16 | 0% | 0% | 0% | 0% | 0 | 0 | 0 |
| 17 | 50% | 0% | 0% | 0% | 0.031 | 8.2 | 0.232 |
| 18 | 75% | 0% | 0% | 0% | 0.061 | 20.0 | 0.291 |
| 19 | 100% | 0% | 0% | 0% | 0.058 | 19.9 | 0.305 |
| 20 | 0% | 50% | 0% | 0% | 0.036 | 9.6 | 0.232 |
| 21 | 0% | 75% | 0% | 0% | 0.036 | 12.0 | 0.291 |
| 22 | 0% | 100% | 0% | 0% | 0.036 | 5.3 | 0.305 |
| 23 | 0% | 0% | 50% | 0% | 0.027 | 7.7 | 0.174 |
| 24 | 0% | 0% | 75% | 0% | 0.031 | 12.5 | 0.218 |
| 25 | 0% | 0% | 100% | 0% | 0.048 | 8.3 | 0.228 |
Table 5.
Weather data at Ta Kwu Ling weather station.
| Date | Min. Temperature | Max. Temperature | Wind Direction | |
|---|---|---|---|---|
| 19 Mar 25 | 8.0 | 24.0 | 9 km/hr at 10:00 | SE |
Table 6.
Measured wind velocity at corridor facing north-east.
| Floor | (m/s) | Floor Level from Ground (Z2) (m) |
|---|---|---|
| 40/F | 1.90 | 115.5 |
| 35/F | 1.75 | 101.5 |
| 30/F | 1.68 | 87.5 |
| 25/F | 1.53 | 73.5 |
| 20/F | 1.49 | 59.5 |
| 15/F | 1.14 | 45.5 |
| 10/F | 1.09 | 31.5 |
| 5/F | 1.14 | 17.5 |
Table 9.
Estimated inlet air velocity and ACH at 1/F (lowest floor).
| Scenario | Living Room Window 1 | Living Room Window 2 | Living Room Window 3 | Kitchen Window | Inlet Air Velocity | ACH | |
|---|---|---|---|---|---|---|---|
| (m/s) | |||||||
| 1 | 100% | 100% | 100% | 50% | 0.031 | 9.2 | 0.961 |
| 2 | 100% | 100% | 100% | 75% | 0.029 | 8.5 | 0.992 |
| 3 | 100% | 100% | 100% | 100% | 0.063 | 19.0 | 1 |
| 4 | 100% | 100% | 100% | 0% | 0.046 | 11.2 | 0.838 |
| 5 | 75% | 75% | 75% | 50% | 0.122 | 27.6 | 0.922 |
| 6 | 75% | 75% | 75% | 75% | 0.129 | 30.7 | 0.953 |
| 7 | 75% | 75% | 75% | 100% | 0.098 | 26.5 | 0.961 |
| 8 | 75% | 75% | 75% | 0% | 0.054 | 16.6 | 0.799 |
| 9 | 50% | 50% | 50% | 50% | 0.065 | 13.1 | 0.761 |
| 10 | 50% | 50% | 50% | 75% | 0.081 | 16.9 | 0.792 |
| 11 | 50% | 50% | 50% | 100% | 0.051 | 11.3 | 0.799 |
| 12 | 50% | 50% | 50% | 0% | 0.013 | 9.1 | 0.638 |
| 13 | 0% | 0% | 0% | 50% | 0.013 | 1.9 | 0.123 |
| 14 | 0% | 0% | 0% | 75% | 0.022 | 3.8 | 0.154 |
| 15 | 0% | 0% | 0% | 100% | 0.023 | 4.2 | 0.162 |
| 16 | 0% | 0% | 0% | 0% | 0 | 0 | #undefined |
| 17 | 50% | 0% | 0% | 0% | 0.010 | 2.8 | 0.232 |
| 18 | 75% | 0% | 0% | 0% | 0.021 | 6.8 | 0.291 |
| 19 | 100% | 0% | 0% | 0% | 0.020 | 6.7 | 0.305 |
| 20 | 0% | 50% | 0% | 0% | 0.012 | 3.2 | 0.232 |
| 21 | 0% | 75% | 0% | 0% | 0.012 | 4.0 | 0.291 |
| 22 | 0% | 100% | 0% | 0% | 0.012 | 4.2 | 0.305 |
| 23 | 0% | 0% | 50% | 0% | 0.009 | 1.8 | 0.174 |
| 24 | 0% | 0% | 75% | 0% | 0.010 | 2.6 | 0.218 |
| 25 | 0% | 0% | 100% | 0% | 0.016 | 4.2 | 0.228 |
Table 10.
Summary of best and worst ventilation scenarios.
| Living Room Window Opening | Kitchen Window Opening |
ACH | |
|---|---|---|---|
| Best ventilation scenario at 35/F | 75% | 75% | 91.0 |
| Best ventilation scenario at 1/F | 75% | 75% | 30.7 |
| Worst ventilation scenario at 35/F | 0% | 50% | 5.3 |
| Worst ventilation scenario at 1/F | 0% | 50% | 1.8 |
Table 11.
Values of input parameters.
| Input Parameter | Value |
|---|---|
| Number of infector (I) | 1 |
| Quanta generation rate (q) | 61 quanta/h |
| Pulmonary ventilation rate (p) | 0.8496 m3/h |
| Exposure duration (t) | 1 h |
Table 12.
Probability of COVID-19 infection risk at different ACH at 35/F.
| Scenario | Inlet Air Velocity | ACH | Q | Infection Risk |
|
|---|---|---|---|---|---|
| (m/s) | (m3/h) | (%) | |||
| 1 | 0.093 | 27.2 | 0.961 | 621.5 | 5.2 |
| 2 | 0.086 | 25.3 | 0.992 | 568.3 | 5.6 |
| 3 | 0.188 | 56.2 | 1 | 1260.8 | 2.6 |
| 4 | 0.135 | 33.2 | 0.838 | 752.9 | 4.3 |
| 5 | 0.363 | 81.7 | 0.922 | 2049.3 | 1.8 |
| 6 | 0.383 | 91.0 | 0.953 | 2134.5 | 1.6 |
| 7 | 0.289 | 78.5 | 0.961 | 1807.8 | 1.8 |
| 8 | 0.159 | 49.2 | 0.799 | 1154.3 | 2.9 |
| 9 | 0.193 | 38.7 | 0.761 | 1133.0 | 3.7 |
| 10 | 0.241 | 50.1 | 0.792 | 1374.5 | 2.9 |
| 11 | 0.151 | 33.5 | 0.799 | 941.2 | 4.3 |
| 12 | 0.040 | 27.0 | 0.638 | 799.1 | 5.3 |
| 13 | 0.040 | 5.6 | 0.123 | 159.8 | 23.0 |
| 14 | 0.064 | 11.2 | 0.154 | 255.7 | 12.2 |
| 15 | 0.068 | 12.5 | 0.162 | 273.5 | 11.0 |
| 16 | 0 | 0 | 0 | 0 | ##Undefined |
| 17 | 0.031 | 8.2 | 0.232 | 238.0 | 16.2 |
| 18 | 0.061 | 20.0 | 0.291 | 461.7 | 7.0 |
| 19 | 0.058 | 19.9 | 0.305 | 440.4 | 7.1 |
| 20 | 0.036 | 9.6 | 0.232 | 277.0 | 14.2 |
| 21 | 0.036 | 12.0 | 0.291 | 277.0 | 11.5 |
| 22 | 0.036 | 12.3 | 0.305 | 273.5 | 11.1 |
| 23 | 0.027 | 5.3 | 0.174 | 166.9 | 24.0 |
| 24 | 0.031 | 7.7 | 0.218 | 191.8 | 17.2 |
| 25 | 0.048 | 12.5 | 0.228 | 294.8 | 11.0 |
Table 13.
Probability of COVID-19 infection risk at different ACH at 1/F (lowest floor).
| Scenario | Inlet Air Velocity | ACH | Q | Infection Risk |
|
|---|---|---|---|---|---|
| (m/s) | (m3/h) | (%) | |||
| 1 | 0.031 | 9.2 | 0.961 | 305.4 | 14.7 |
| 2 | 0.029 | 8.5 | 0.992 | 291.2 | 15.7 |
| 3 | 0.063 | 19.0 | 1 | 639.3 | 7.4 |
| 4 | 0.046 | 11.2 | 0.838 | 387.1 | 12.2 |
| 5 | 0.122 | 27.6 | 0.922 | 1136.5 | 5.2 |
| 6 | 0.129 | 30.7 | 0.953 | 1239.5 | 4.6 |
| 7 | 0.098 | 26.5 | 0.961 | 944.7 | 5.4 |
| 8 | 0.054 | 16.6 | 0.799 | 433.3 | 8.4 |
| 9 | 0.065 | 13.1 | 0.761 | 500.8 | 10.6 |
| 10 | 0.081 | 16.9 | 0.792 | 650.0 | 8.3 |
| 11 | 0.051 | 11.3 | 0.799 | 412 | 12.1 |
| 12 | 0.013 | 9.1 | 0.638 | 88.8 | 14.8 |
| 13 | 0.013 | 1.9 | 0.123 | 17.8 | 53.9 |
| 14 | 0.022 | 3.8 | 0.154 | 32.0 | 32.1 |
| 15 | 0.023 | 4.2 | 0.162 | 35.5 | 29.2 |
| 16 | 0 | 0.0 | 0 | 0 | ##Undefined |
| 17 | 0.010 | 2.8 | 0.232 | 24.9 | 40.9 |
| 18 | 0.021 | 6.8 | 0.291 | 60.4 | 19.4 |
| 19 | 0.020 | 6.7 | 0.305 | 60.4 | 19.5 |
| 20 | 0.012 | 3.2 | 0.232 | 28.4 | 36.4 |
| 21 | 0.012 | 4.0 | 0.291 | 35.5 | 30.3 |
| 22 | 0.012 | 4.2 | 0.305 | 35.5 | 29.1 |
| 23 | 0.009 | 1.8 | 0.174 | 17.8 | 55.6 |
| 24 | 0.010 | 2.6 | 0.218 | 21.3 | 42.8 |
| 25 | 0.016 | 4.2 | 0.228 | 39.1 | 29.3 |
Disclaimer/Publisher’s Note: The statements, opinions and data contained in all publications are solely those of the individual author(s) and contributor(s) and not of MDPI and/or the editor(s). MDPI and/or the editor(s) disclaim responsibility for any injury to people or property resulting from any ideas, methods, instructions or products referred to in the content. |
© 2025 by the authors. Licensee MDPI, Basel, Switzerland. This article is an open access article distributed under the terms and conditions of the Creative Commons Attribution (CC BY) license (http://creativecommons.org/licenses/by/4.0/).
Copyright: This open access article is published under a Creative Commons CC BY 4.0 license, which permit the free download, distribution, and reuse, provided that the author and preprint are cited in any reuse.


