
Submitted:
01 May 2025
Posted:
08 May 2025
You are already at the latest version
Abstract
The study was conducted to evaluate the quality of honey produced in Adama District and Adama Town at different market points. Moreover, a total of 23 honey samples were collected from beekeepers and different market points and used for quality analyses. The ash content, free acidity, and pH value of all honey samples were found within the limits of the national standards. Except for the honey samples collected from on-street (24.62±0.67), minimarket (23.23±0.58) and retailer (22.60±0.58) the moisture contents of honey samples were within the national standards. The fructose and glucose contents of the samples were in the ranges of the national standards, whereas any of the samples complied with the national sucrose content standard. High sucrose content was observed in the samples obtained from retailers (32.23±1.78%) and on-street (31.90±2.06%) market points. In general, the results of this study indicated that there is an overall honey quality problem in the sampled area. However, the level of the problem is more inclined towards the on-street and minimarket areas. Thus, honey market legislation is needed in the area in particular and in the country in general to protect honey consumers and other stakeholders involved in the honey market value chain.
Keywords:
adulteration
; adulterant
; market point
; botanical origin
; detection of adulterations
; physicochemical
; quick test
1. Introduction
Ethiopia is blessed with suitable water resources and numerous honeybee floras, which produce fruitful ground for the growth of beekeeping [2]. The majority of beekeepers in Africa are thought to reside in Ethiopia. The apiculture industry has been a part of Ethiopia's economy and continues to support the country's growth. It is evident that beekeeping products, like honey, which supply the required calorie diet, improve the nutritional status of the population. Additionally, apiculture is crucial in Ethiopia's ability to export goods like honey and earn foreign currency. Ethiopia also likely has the longest history of beekeeping among all the African nations. According to [48], Ethiopia produces 21.7% of all the honey produced in Africa and 2.5% globally. Ethiopian honeybee colonies present in beehives are 6.99 million, which contributes to 1.29 million tons of honey production [17].
Water content, ash, pH, electrical conductivity, hydroxy methyl furfuraldehyde (HMF), glucose, fructose, sucrose, and diastase activity were used as physicochemical criteria in the characterization of honey in [14] and [19] specifications. Comparison of the results with naturally occurring values can suggest suspected adulteration [11]. The flavor, color, and granulation of honey are changed, bioactive components and antioxidants are degraded, and product quality degrades when honey is heated to higher temperatures of more than 70 oC [53]. Due to connected occurrences of adulteration, it is vital to control the quality of honey in various markets [29]. It is dishonest and unfair to the consumer when adulterated honey is sold under natural labels and at the same price as pure honey [13]. These practices can cause honey's quality to decline at the producer's, during processing, and while marketing. Due to this, it is now crucial for regulatory agencies, retailers, consumers, and processors to identify adulterant substances in honey [13].
Addis Ababa is the largest and most organized place for honey marketing in Ethiopia, followed by Adama City and its surroundings. In Adama, numerous supermarkets, shops, and retail stores serve as places for honey markets in the area. Most of these honeys are sold without a label or reference to their quality or origins, which may give rise to honey adulteration and/or the marketing of honey with low quality standards. Therefore, a reduction in honey quality could result either from adulteration (deliberate mixing of honey with cheap foreign substances) or post-harvest handling, poor storage facilities, or processing of honey with excessive heat treatment. Despite all these facts, information on honey adulteration and adulterants used, and honey quality, starting from beekeepers through various market points in Adama and the surrounding areas, is limited. Hence, characterizing the physicochemical properties of honey produced and sold in the area is highly vital for honey retailers, consumers, and policymakers.
2. Material and Methods
2.1. Description of the Study Area
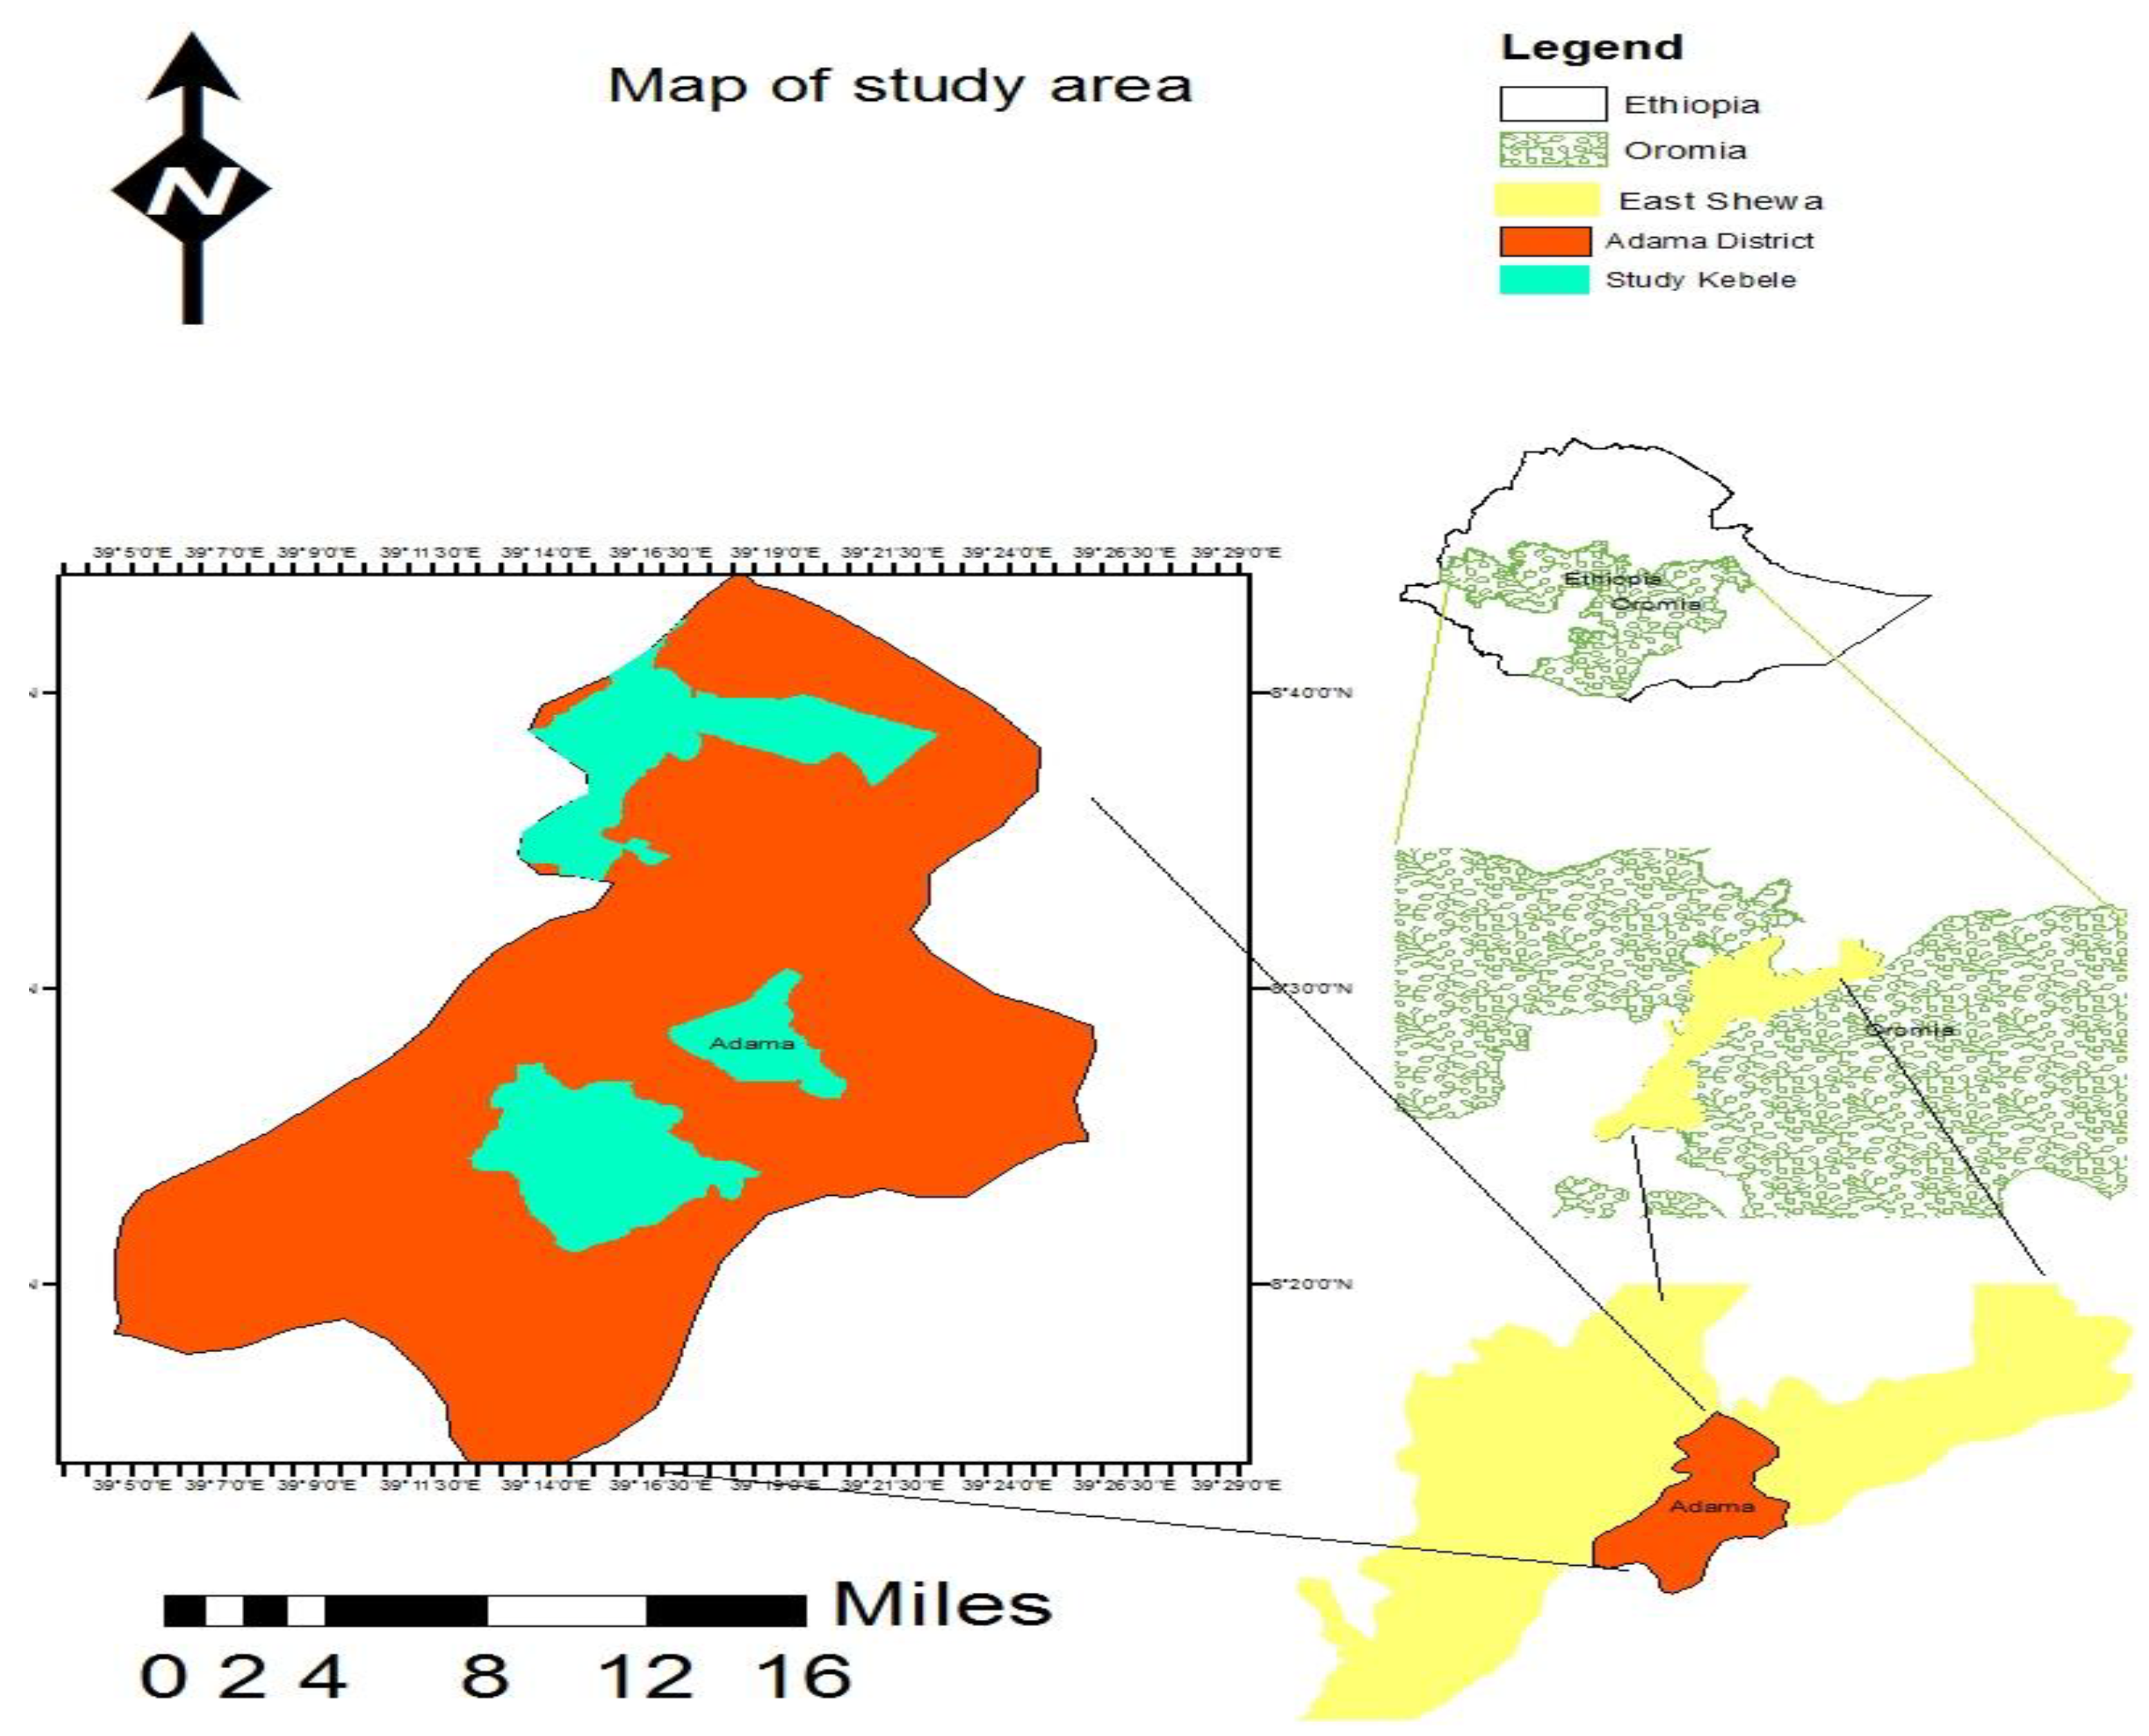
The Adama District is situated between 8.14° and 8.44° north latitude and 39.04° and 39.25° east longitude. It shares a border with Lume, Dodota, Boset, the Amhara region, and Bora in the East Shewa zone. This woreda is located between 1500 and 2300 meters above sea level. Sodere, Gergedi, and Boku Femoral hot springs are notable neighboring attractions. Just 30% of the land in this woreda is found to be arable or cultivable; 6.5% is used for pasture; 5.2% is set aside as forest; and the remaining 58.3% is thought to be swampy, degraded, or otherwise unsuitable. According to [34], fruits, vegetables, and sugarcane are important cash crops.
Figure 1.
Map of the Study Area (Adama Town and the study kebeles in Adama District).
2.2. Honey Sample Collection
The samples were collected from market points (available for customer purchase in rural beekeepers, urban beekeepers, supermarkets, mini markets, retailers, and on-street sellers) located in Adama Town and Adama District. From each market point, four samples were collected. A total of 23 samples were collected. The honey samples were stored in glass jars and kept in the refrigerator at 4oc, until analysis. The sample analysis was conducted at the Holeta Bee Research Center’s laboratory. Honey's physicochemical parameters of the sample results were compared with the standard set by the Ethiopian Standards Agency.
2.3. Laboratory Analysis of Honey Quality
In accordance with the international honey commission methodologies [12], the following physicochemical characteristics of honey from various market points were investigated and compared with the Ethiopian Standard Authority honey physicochemical parameters as comparison.
2.4. Honey Color Determination
The color of samples of honey was determined using the Pfund classifier. In a 10-mm light path cuvette, around half of the homogeneous honey sample was placed. The cuvette was placed inside a color 27 photometer Pfund honey color grader (No. 0061, made in the USA), following the Codex Alimentarius Commission Standards [14].
2.5. The Moisture Content of Honey
Applying an Abbe refractometer that was calibrated often with distilled water and thermostated at 20 °C, the moisture level in honey samples was assessed. Using a standard table created for this reason, the refractive index value of the honey sample was calculated [12].
2.6. The Free Acidity and pH of Honey
Ten grams of honey were taken from every sample and mixed with 75 ml of distilled water in a 250 ml beaker utilizing a magnetic stirrer. The pH of honey was measured while an electrode using a pH meter, was submerged into the solution. The solution is then titrated using 0.1 M NaOH solution to pH 8.30. Using a 10 ml burette, the reading was taken precisely to the nearest 0.2 ml based on [12].
Free Acidity = 10 V, where V is the amount of 0.1N NaOH in 10 g of honey.
2.7. Measuring the Overall Ash Content
As a result of burning samples of honey at 600°C in a muffle furnace to a constant weight, the ash concentration was identified [12]. The ash in the dish was initially heated to an ashing temperature in an electrical muffle furnace, followed by cooling to room temperature in a desiccator, and weighed 0.001 g (M2). A platinum dish was used to weigh 5 g (M0) for every honey sample to the closest 0.001 g, and a pair of drops of olive oil were included to avoid foaming. The ash from the dish was measured after cooling using the desiccators. Until a consistent weight is attained, the ashing process continues (M1). The ash content was calculated using the following formula:
where by,
M0 equals the weight of the honey used
M1 as a = ash weight + dish
M2 is the dish's weight
2.8. Determination of Sugars
High-performance liquid chromatography (HPLC) was used to determine the sugar profiles of honey. In 40 ml of water that were distilled water, 5 g of honey were dissolved. The resulting solution for all honey samples was passed through a syringe filter (0.45 mm) before chromatographic analysis employing 25 ml of acetonitrile that was pumped into a 100 ml volumetric flask. The honey solution was then transferred to the flask and filled to the mark with distilled water. The HPLC isolation system included an analytical stainless-steel column having a diameter of 4.6 mm and a length of 250 mm that contained amine-modified silica gel with 5-7 m particle size1.3 ml/min, mobile phase, rate of flow, acetonitrile: water (80:20, v/v), and sample injection volume of 10 µl. A refractive index sensor thermostated at 30 oC and managed in a column oven at 30 oC was used to find the sugars. By comparing honey sugars' retention periods to those of conventional sugars, honey sugars were identified following the International Honey Commission [12].
2.9. Determination of Hydroxyl Methyl Furfural (HMF)
Using 6800 UV-Vis spectrophotometers, HMF was calculated. In a tiny beaker, a 5-gram sample of honey was weighed, then 25 ml of distilled water was added, and the mixture was then transferred to a 50 ml volumetric flask [12]. In a separate container, combine 0.5 ml of carrezz solution II (30 g Zn acetate/100 ml of distilled water) with 0.5 ml of carrezz solution I (15 g K4Fe (CN) 6 · 3H2O/100 ml distilled water). The solution and the honey solution were combined. Filtrated (10 ml) from the solution's filtering through a filter paper was eliminated. Two test tubes were filled with 5 ml of filtrated each, followed by 5 ml of distilled water in the initial test tube (the sample solution) and 5 ml of sodium bisulfite solution (0.20% of 0.20 g NaHSO3/100 ml of distilled water) in the second testing tube (the reference solution). The ingredients of both test tubes were thoroughly combined using a vortex mixer, and the absorption has been determined spectrophotometrically by comparing the absorbance of reference (the same honey solution treated with sodium bisulfite, 0.2%) at 336 nm to the absorbance determined at 284 nm for HMF in the honey sample solution according to the International Honey Commission [12].
HMF/100 g of honey = (A284 - A336) 14.97 5/g of the sample. Where:
14.97 is a constant,
A284 is the absorbance at 284,
A336 is the absorbance at 336,
g = the mass of the sample of honey, and,
5= the theoretical nominal sample weight.
2.10. Statistical Analysis
The statistical analyses were performed with the SPPSS-statistical software tool, version 20. In order to analyze the variance for honey quality, a completely randomized design (CRD) was used, and the results were given as means and standard deviations. Significant differences were assessed for P< 0.05.
Model Y ij = µ + α i + ε ij
where: Y ij = quality of honey
µ = overall mean
α i = effect of market channels
ε ij = random error
3. Results
3.1. Honey Color Analysis
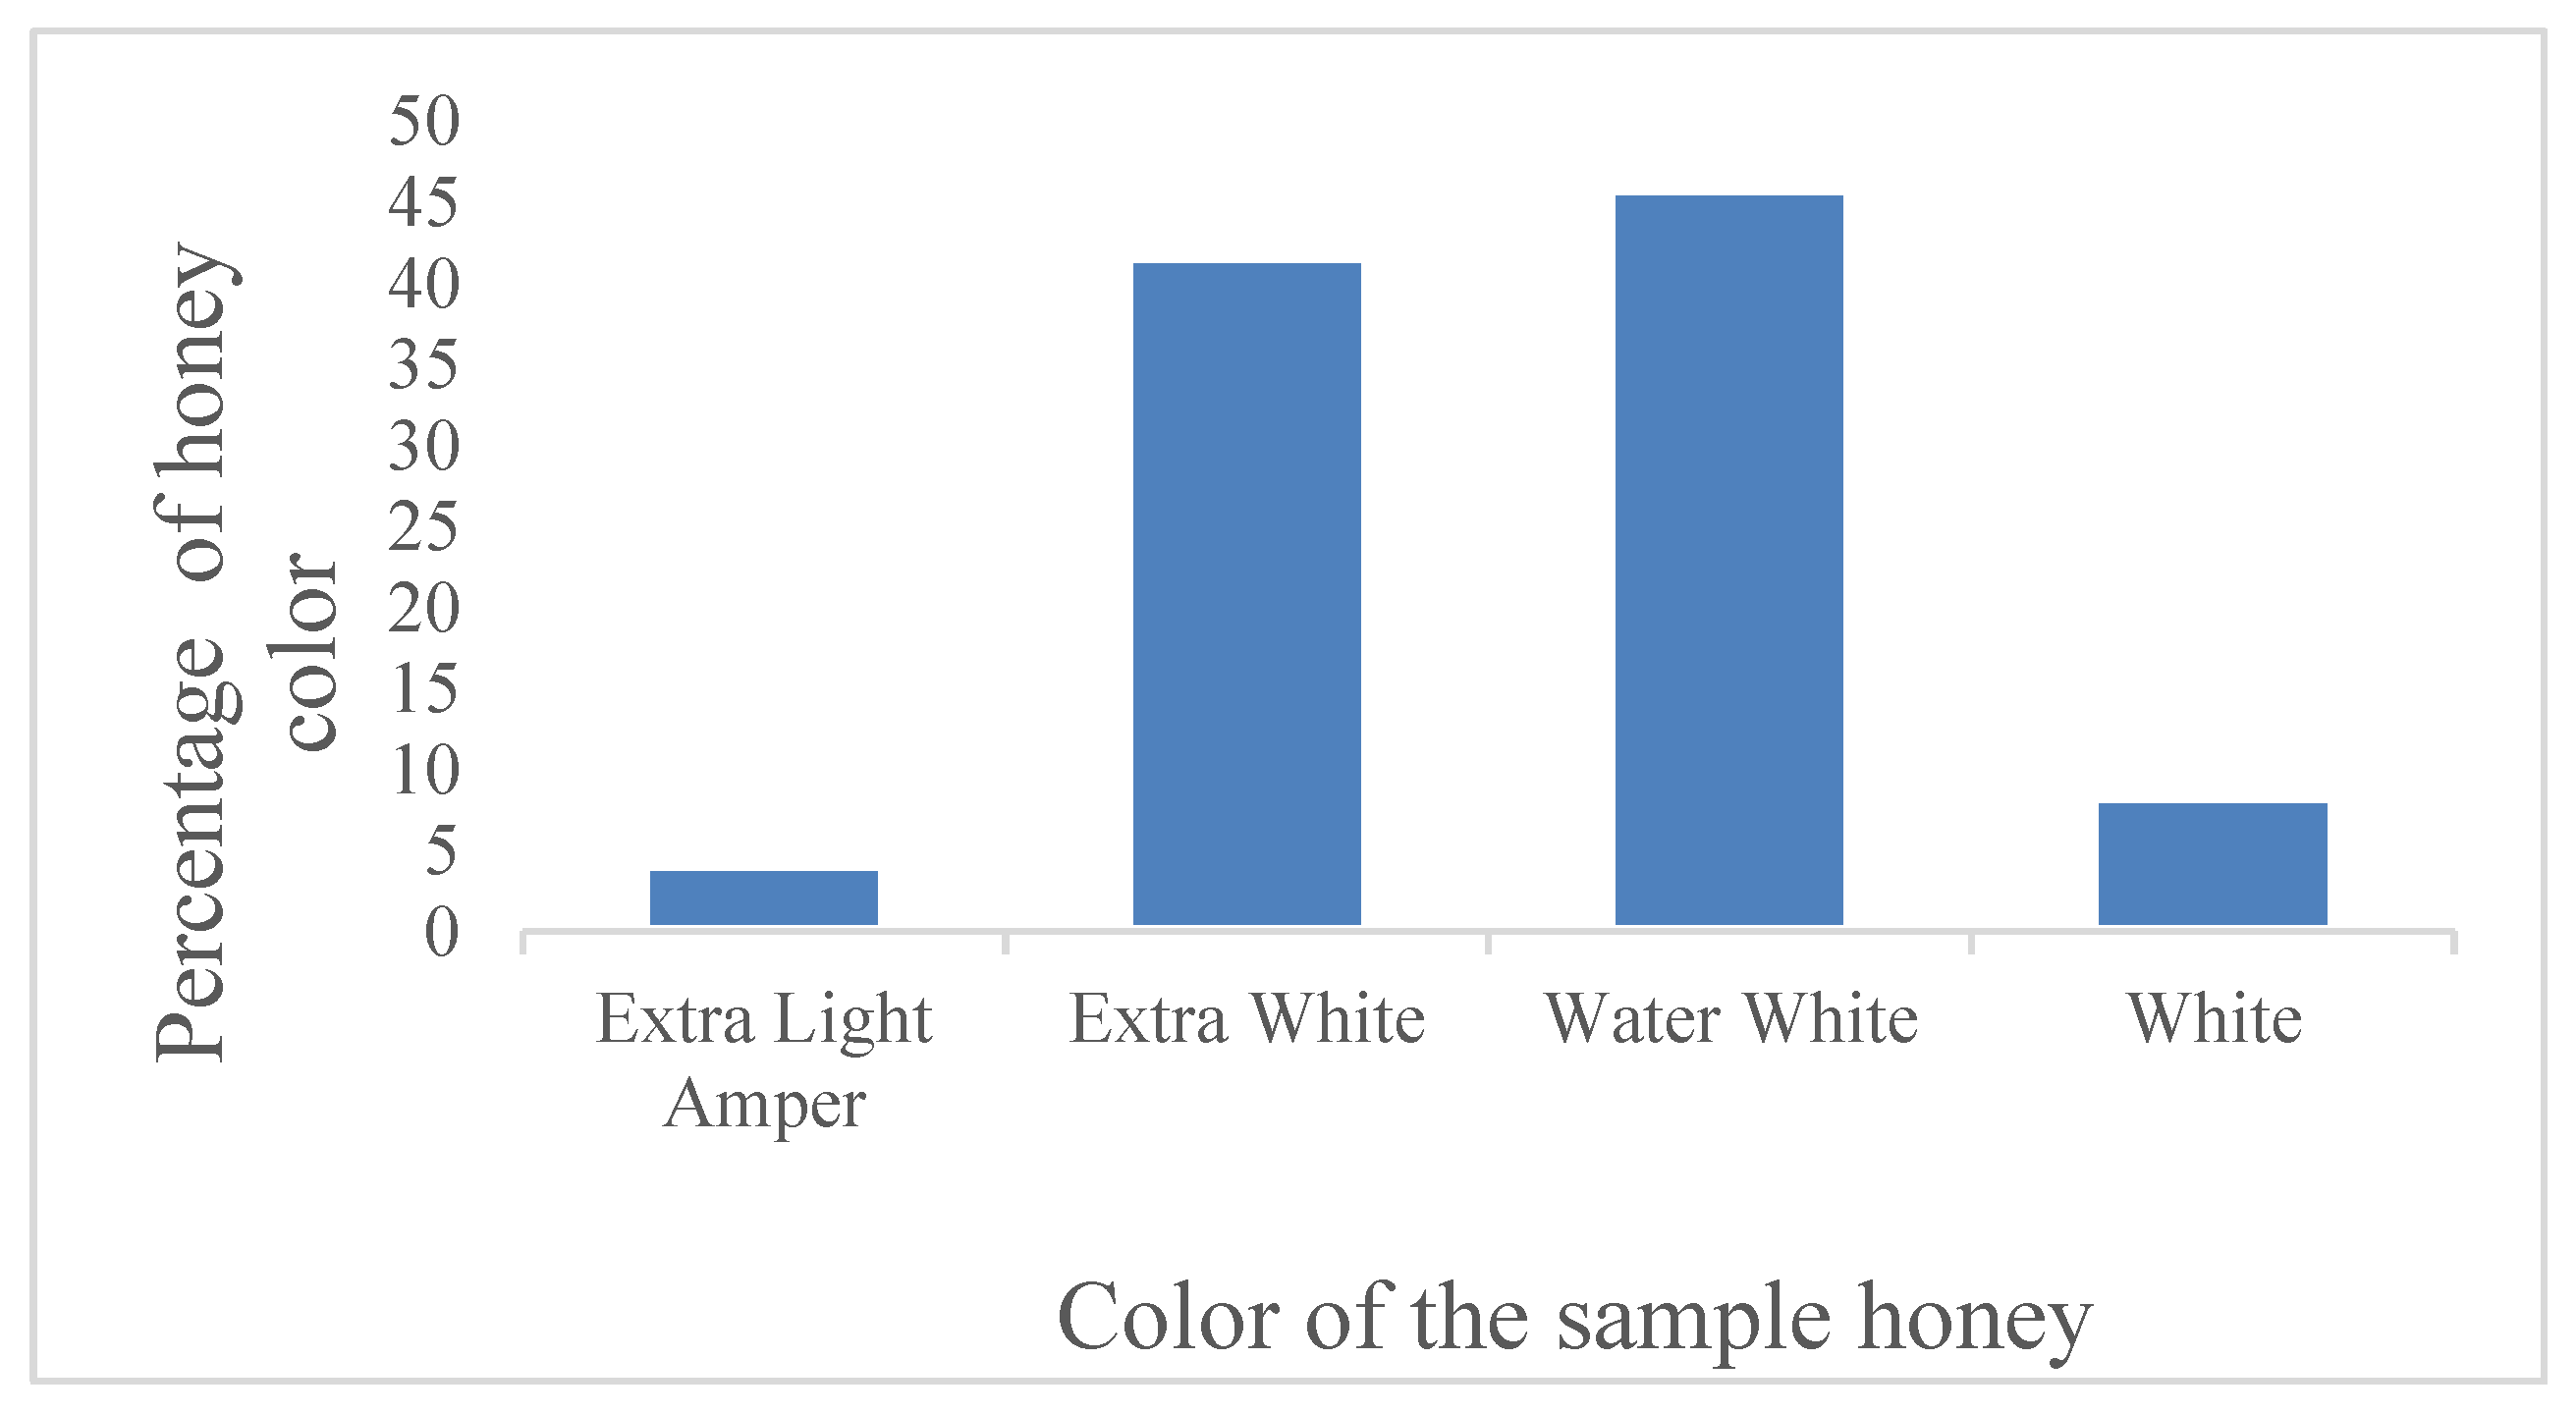
The results of the analysis of honey samples collected from different markets are shown in Figure 1. In this study, 45.83% of the honey samples were water white, 41.67% were extra white, and the remaining samples were very pale yellow (8.33%) and pale yellow (4.17%).
Figure 1.
Honey samples from different market points and their colors proportions.
3.2. The Moisture Content of Honey
A statistically significant difference (P < 0.05) was observed among rural honey market points. The highest moisture content was recorded for honey collected from a street (24.62 ± 0.67%), and the lowest was recorded from rural beekeepers (18.90 ± 0.58%). The moisture content of honey collected from rural and urban beekeepers was not significantly different.
Chromatogram by HPLC, of fructose, glucose, and sucrose of honey samples different market point
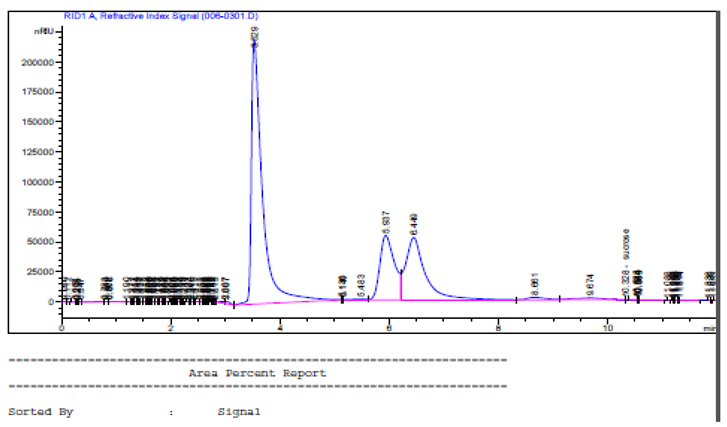

Table 1.
The Mean ± SE Values for the Physicochemical Properties of sample honey.
| Treatment | Moisture content (gm/100gm) | Ash content (gm/100gm) | HMF (mg/kg) | pH value | Free acidity (meq/kg) |
|---|---|---|---|---|---|
| T1 | 24.62±0.67c | 0.05±0.02a | 27.18±3.20a | 3.24±0.08ab | 23.47±2.33ab |
| T2 | 22.60±0.58bc | 0.06±0.02ab | 29.09±2.78ab | 3.13±0.07a | 33.88±2.02c |
| T3 | 23.23±0.58bc | 0.07±0.02ab | 35.14±2.78ab | 3.41±0.07abc | 27.84±2.02abc |
| T4 | 21.05±0.58ab | 0.06±0.02ab | 39.39±2.78b | 3.50±0.07bc | 28.73±2.02bc |
| T5 | 18.90±0.58a | 0.13±0.02b | 31.92±2.78ab | 3.57±0.07c | 20.03±202a |
| T6 | 19.10±0.58a | 0.21±0.02c | 28.31±2.78ab | 3.67±0.07c | 25.88±2.02abc |
| P-value | <0.000 | <0.000 | <0.000 | <0.028 | <0.000 |
Note: a-c Meanings with a different superscript letter across the row shows significantly different (P<0.05), HMF= Hydroxymethyl furfural aldehyde T1= On- street honey market samples, T2= Retailer market honey samples, T3= Minimarket honey samples, T4= Supermarket honey samples, T5= Urban beekeepers honey samples, T6= Rular beekeepers honey samples.
3.3. The Ash Content of Honey
The ash contents of samples from urban and rural beekeepers were significantly different (P < 0.05) from those collected from streets, minimarkets, retailers, and supermarkets. The highest mean ash content was recorded for rural beekeeper’s honey (0.21 ± 0.02 g/100 g), while the lowest was from street honey (0.05 ± 0.02 g/100 g).
3.4. The pH Value of Honey
The highest pH was 3.67, and the lowest was 3.13. The pH values differed significantly (P < 0.05) among market points, with the most acidic values in honeys from retailers, on-street sellers, and minimarkets.
3.5. The Hydroxymethyl Furfural Aldehyde (HMF) in Honey
The highest HMF mean value was recorded in honey from supermarkets (39.39 ± 2.78 mg/kg) and minimarkets (35.14 ± 2.78 mg/kg), while the lowest was from street samples (27.18 ± 3.20 mg/kg).
3.6. The Free Acidity of Honey Samples
A significant difference (P < 0.05) was observed among honey samples from various market points. The highest mean free acidity was recorded from retailers’ samples (33.88 ± 2.02 meq.kg⁻¹), and the lowest was from urban beekeepers’ samples (20.03 ± 2.02 meq.kg⁻¹).
3.7. Sugar Composition of Honey from Different Honey Markets
3.7.1. Fructose in Honey Samples
The mean fructose content in honey from urban and rural beekeepers (39.01 ± 0.97%) was significantly different (P < 0.05) from that of minimarket (34.48 ± 0.97%) and supermarket (37.57 ± 0.97%) samples.
3.7.2. Glucose in Honey Samples
Street honey samples had the highest mean glucose value (32.03 ± 0.88%), significantly different (P < 0.05) from minimarket (26.93 ± 0.76%) and supermarket (28.55 ± 0.76%) samples.
3.7.3. Sucrose in Honey Samples
The highest sucrose content was recorded in retailer’s honey (32.23 ± 1.78%) and street honey (31.90 ± 2.06%).
4. Discussion
The physicochemical properties of honey are critical indicators of its quality, authenticity, and shelf life. This study evaluated honey samples from different market sources, revealing significant variations in color, moisture content, ash content, pH, HMF, free acidity, and sugar composition. These variations can be attributed to differences in floral origin, harvesting techniques, processing methods, storage conditions, and potential adulteration.
4.1. Honey Color Analysis
Honey color is influenced by its botanical and geographical origin, with darker honeys typically containing higher mineral and antioxidant content. In this study, the majority of samples were water white (45.83%) and extra white (41.67%), suggesting a light floral source, possibly acacia or clover. The remaining samples exhibited very pale yellow (8.33%) and pale yellow (4.17%) hues, which may indicate a different nectar source or slight processing differences. Similar findings were reported in Argentinian honey, where color variations were linked to regional flora [5]. The predominance of lighter-colored honey in the market suggests consumer preference for mild-flavored honey, which is often perceived as higher quality.
4.2. Moisture Content and Its Implications
Moisture content is a crucial factor in honey stability, as excessive moisture can lead to fermentation and spoilage. The highest moisture content (24.62 ± 0.67%) was found in street-vended honey, likely due to improper storage or early harvesting before full ripening. In contrast, rural beekeepers' honey had the lowest moisture (18.90 ± 0.58%), aligning with national and international standards (<20%) [11,14,20]. The elevated moisture in some samples may result from:
- Premature harvesting (bees not fully dehydrating nectar).
- Poor storage conditions (exposure to humidity).
- Adulteration with water or syrups to increase volume. Previous studies in Ethiopia [25] also reported market honey exceeding moisture limits, reinforcing the need for better beekeeping and processing practices.
4.3. Ash Content as a Mineral Indicator
Ash content reflects the mineral composition of honey, which varies with soil type and floral source. Rural beekeeper honey had the highest ash content (0.21 ± 0.02 g/100 g), indicating a richer mineral profile, possibly from diverse wildflower sources. In contrast, street honey had the lowest ash (0.05 ± 0.02 g/100 g), suggesting a more refined or diluted product. The results align with findings from Cuba and Nigeria [32], where ash content was linked to soil characteristics and floral diversity [10,22]. All samples complied with EU limits (<0.6%) [20], confirming their authenticity but highlighting variations in nutritional value.
4.4. pH and Honey Acidity
Honey’s natural acidity (pH 3.13–3.67) inhibits microbial growth, extending shelf life. The lowest pH (most acidic) was found in retailer honey, possibly due to prolonged storage, which increases organic acid formation. High acidity can also indicate fermentation, though all samples were within acceptable ranges [14]. The pH differences among markets suggest:
- Floral origin variations (some nectars are naturally more acidic).
- Storage duration (longer storage increases acidity).
- Possible adulteration (sugar syrups can alter pH).
4.5. HMF: A Marker of Freshness and Heat Exposure
HMF levels indicate honey freshness, with high values suggesting overheating or aging. Supermarket honey had the highest HMF (39.39 ± 2.78 mg/kg), likely due to:
- Prolonged storage (supermarket honey may sit longer before sale).
- Exposure to heat (improper pasteurization or transport).
- Adulteration with inverted sugars (industrial processing increases HMF). While within legal limits (<40 mg/kg in Ethiopia [19], <80 mg/kg in EU [20]), these levels exceed those in fresh Ethiopian honey (6.3–15 mg/kg) [26,27,33]. Similar trends were seen in Kenya and Uganda [23,38], where commercial honey had elevated HMF due to poor handling.
4.6. Free Acidity and Fermentation Risk
Free acidity measures organic acids (mainly gluconic acid) and reflects fermentation. Retailer honey had the highest acidity (33.88 ± 2.02 meq/kg), nearing Ethiopia’s limit (40 meq/kg), and suggesting possible fermentation. Urban beekeeper honey had the lowest (20.03 ± 2.02 meq/kg), indicating better freshness. High acidity may result from:
- Microbial activity (yeasts converting sugars to acids).
- Long storage (organic acids accumulate over time).
- Adulteration with acidic syrups.
Comparisons with Nigerian (18.67 meq/kg) and Polish (14.40 meq/kg) honey [46] suggest Ethiopian honey tends toward higher acidity, possibly due to environmental and processing factors.
4.7. Sugar Composition and Adulteration Signs
4.7.1. Fructose & Glucose:
Urban/rural beekeeper honey had higher fructose (39.01 ± 0.97%), indicating natural maturity. Minimarket honey had lower fructose (34.48 ± 0.97%), possibly due to dilution or heating. Street honey had the highest glucose (32.03 ± 0.88%), which may suggest: Adulteration with corn syrup (high in glucose). Feeding bees sugar syrup (alters natural sugar ratios).
Table 2.
Mean ± SE of the sugar profile of honey from different market points.
| Sugars | Treatment | P value | ||||||
|---|---|---|---|---|---|---|---|---|
| T1 | T2 | T3 | T4 | T5 | T6 | |||
| Fructose | 37.47±1.12ab | 38.69±0.97b | 34.48±0.97a | 37.57±0.97a | 39.01±0.97b | 39.01±0.97b | <0.013 | |
| Glucose | 32.03±0.88b | 28.08±0.76a | 26.93±0.76a | 28.55±0.76a | 28.40±0.76a | 28.90±0.76ab | <0.003 | |
| Sucrose | 31.90±2.06c | 32.23±1.78c | 20.79±0.76b | 21.37±1.78b | 9.89±1.78a | 8.60±1.78a | <0.000 | |
Note: a-c Meaning within various superscript letters across the row shows significantly different (P<0.05), T1= On-street honey market samples, T2= Retailer market honey samples, T3= Minimarket honey samples, T4= Supermarket honey samples, T5= Urban beekeepers honey samples, T6= Rular beekeepers honey samples.
4.7.2. Sucrose
Retailer (32.23 ± 1.78%) and street honey (31.90 ± 2.06%) had alarmingly high sucrose, far exceeding Ethiopian (<5 g/100 g) and international (<10 g/100 g) standards [11,14,19]. This strongly suggests: Added sugar or syrups (common adulteration practice). Immature honey harvest (bees had not fully broken down sucrose).
5. Conclusions
This study reveals significant quality variations in market honey, with street and retailer samples showing the highest deviations in moisture, HMF, acidity, and sucrose indicators of poor handling or adulteration. Rural and urban beekeeper honey generally met standards, emphasizing the importance of direct sourcing. To improve honey quality, we recommend:
- ✓ Stricter enforcement of quality standards for commercial sellers.
- ✓ Beekeeper training on proper harvesting and storage.
- ✓ Consumer awareness to identify adulterated honey.
- ✓ Further research on floral traceability and adulteration detection methods.
By addressing these issues, Ethiopia can enhance honey marketability domestically and internationally, supporting its growing apiculture sector.
References
- Abdel-Aal, E.M.; Ziena, H.M.; Youssef, M.M. Adulteration of honey with high fructose corn syrup: sucrose syrups: correlations with HPLC-RID results. Food Research International 1993, 64, 634–646. [Google Scholar]
- Addis, N. Honey Value Chain Analysis: Amhara in the Semen Shewa Zone of Ethiopia; The case of Basona Woreda. MBA Thesis, Addis Ababa, Ethiopia, 2016. [Google Scholar]
- Alemu, T.; Seifu, E.; Bezabih, A. Physicochemical Properties of Honey Produced in Sekota District, Northern Ethiopia. International Food Research Journal 2013, 20, 3061–3067. [Google Scholar]
- Aljohar, H.I.; Maher, H.M.; Albaqami, J.; Al-Mehaizie, M.; Orfali, R.; Orfali, R.; Alrubia, S. Physical and chemical screening of honey samples available in the Saudi market: An important aspect in the authentication process and quality assessment. Saudi Pharmaceutical Journal 2018, 26, 932–942. [Google Scholar] [CrossRef]
- Aloisi, F.; Serafini, B.; Magliozzi, R.; Howell, O.W.; Reynolds, R. Detection of Epstein–Barr virus and B-cell follicles in the multiple sclerosis brain. Brain 2010, 133, e157–e157. [Google Scholar] [CrossRef]
- Alvarez-Suarez, J.M.; Tulipani, S.; Romandini, S.; Bertoli, E.; Battino, M. Contribution of honey to nutrition and human health: a review. Mediterranean Journal of Nutrition and Metabolism 2010, 3, 15–23. [Google Scholar] [CrossRef]
- Amir, R.M.; Anjum, F.M.; Khan, M.I.; Khan, M.R.; Pasha, I.; Nadeem, M. Application of Fourier transform infrared spectroscopy (FTIR) to identify wheat cultivars. Journal of Food Science and Technology 2013, 50, 1018–1023. [Google Scholar] [CrossRef]
- Amir, Y.; Yesli, A.; Bengana, M.; Sadoudi, R.; Amrouche, T. Physico-chemical and microbiological evaluation of honey from Algeria. Electronic Journal of Environmental, Agricultural & Food Chemistry 2010, 9. [Google Scholar]
- Belay, A.; Haki, G.D.; Birringer, M.; Borck, H.; Chul, Y.; Cho, C.-W. Sugar Profile and Physicochemical Properties of Ethiopian Monofloral Honey. International Journal of Food Properties 2016. [Google Scholar] [CrossRef]
- Biluca, F.C.; Braghini, F.; Gonzaga, L.V.; Costa, A.C.O.; Fett, R. Physicochemical profiles, minerals and bioactive compounds of stingless bee (Meliponinae) honey. Journal of Food Composition and Analysis 2017, 50, 61–69. [Google Scholar] [CrossRef]
- Bogdanov, S.; Martin, P. The authenticity of the honey. Food Inspection and Hygiene Notices 2003, 93, 232–254. [Google Scholar]
- Bogdanov, S. (2009). Composition of honey. Book of Honey, Chapter 5. Bee Products Science, International Honey Commission, accessed 29 August 2012.
- Chen, L.; Xue, X.; Ye, Z.; Zhou, J.; Chen, F.; Zhao, J. Determination of Chinese honey adulterated with fructose corn syrup by near-infrared spectroscopy. Food Chemistry 2011, 128, 1110–1114. [Google Scholar] [CrossRef]
- Codex, A.; Intergovernmental, T.F.O. (2001). 24th Session of the Codex Alimentarius Commission of the Joint FAO/WHO Food Standards Programme, Geneva, 2–7 July 2001 Codex.
- Crane, E.; Visscher, P.K. (2009). Hunaya Encyclopedia of Insects (459-461): Academic Journalism.
- Crane E (1990). A book full of honey. International Bee Research Association, Oxford University Press, UK.
- CSA (Centre for Statistics), (2020/21). Agricultural Selection Study of Cattle and Livestock Traits: Vol. (II), No. 581, March 2021, Addis Ababa.
- da Silva, P.M.; Gauche, C.; Gonzaga, L.V.; Costa AC, O.; Fett, R. Honey: chemical composition, stability, and authenticity. Food Chemistry 2016, 196, 309–323. [Google Scholar] [CrossRef]
- Ethiopia Standard Authority, (2005). Honey Specification: Ethiopian Standard, ES 1202: 2005. In: Addis Ababa, Ethiopia.
- EU Council. (2002). Council Directive 2001/11 O/EC of December 20, 2001, on honey: Official Journal of the European Communities.
- Fikru, S.; Gebresilassie, G.; Kassa, A. (2015). Assessment of beekeeping practices (absconding, bee forage, and bee diseases and pests) in Jigjiga zone, Somali regional state of Ethiopia: Poultry, Fisheries & Wildlife Sciences.
- Finola, M.S.; Lasagno, M.C.; Marioli, J.M. Microbiological and chemical Characterization of honey from central Argentina. Food Chemistry 2007, 100, 1649–1653. [Google Scholar] [CrossRef]
- Fredrick, N.; Anam, O.; Antony, G.; Elijah, N. (2013): Food Sci. Qua. Man., 12:30-36.
- Gebremedhin, G.; Tadesse, G.; Kebede, E. Physiochemical Properties of Honey Produced from Traditional and Modern Beehive Production Systems in the Tigray Region of Northern Ethiopia. Momona Ethiopian Journal of Science (MEJS) 2014, 5, 115–128. [Google Scholar] [CrossRef]
- Gebremariam, T.; Brhane, G. Determination of Quality and Adulteration Effects of Honey from Adigrat And its Surrounding Areas. International journal of technology enhancements and emerging engineering research 2014, 2, 71. [Google Scholar]
- Gebru, Y.G. (2015). Characterization of beekeeping systems and the honey value chain, and effects of storage containers and durations on the physicochemical properties of 120 honeys in Kiltie Awlaelo District, East Tigray, Ethiopia. PhD Dissertation, Department Animal Production Studies.
- Getu, A.; Birhan, M. Chemical analysis of honey and major challenges of honey production in and around Gondar. Ethiopia Academic Journal of Nutrition 2014, 3, 06–14. [Google Scholar]
- Hana’a, Y.A.E.H. (2007). Physicochemical Properties of Honey from different floral sources. A dissertation of the Degree of Master of Science in Food Science and Technology Agriculture University of Khartou.
- Iftikhar, F.; Mahmood, R.; Islam, N.; Sarwar, G.; Masood, M.A.; Shafiq, H. Physicochemical analysis of honey samples collected from local markets in Rawalpindi and Islamabad. Pakistan, American Journal of Biochemistry 2014, 4, 35–40. [Google Scholar]
- Islam, M.R.; Pervin, T.; Hossain, H.; Saha, B.; Hossain, S.J. Physicochemical and antioxidant properties of honeys from the Sundarbans mangrove forest of Bangladesh. Preventive nutrition and Food Science 2017, 22, 335. [Google Scholar] [CrossRef]
- Jeanne, F. Le miel: éléments d’analyse. Bulletin Technique Apicole 2005, 32, 69–76. [Google Scholar]
- Kayode, J.; Oyeyemi, S.D. Physicochemical Investigation of Honey Samples from Bee Farmers in Ekiti State, Southwest Nigeria. Journal of Plant Sciences 2014, 2, 246–249. [Google Scholar] [CrossRef]
- Kinati, C.; Tolemariam, T.; Debele, K. Evaluation of the quality of honey produced in Gomma Woreda, Southwest Ethiopia. Rural Development Livestock Research 2011, 23, 6–14. [Google Scholar]
- Kirko, V.; Kononova, E.; Lukyanova, A.; Razumovskaya, V. (2020). Education as an instrument of human capital development. In Edulearn20 Proceedings (pp. 8765–8770). Iated.
- Kelly, J.D.; Downey, G.; Fouratier, V. An initial study of honey adulteration by sugar solutions using midinfrared (MIR) spectroscopy and chemometrics. Journal of agricultural and food chemistry 2004, 52, 33–39. [Google Scholar] [CrossRef]
- Krell, R. (1996). Value-added Products from Beekeeping. FAO Agricultural Services Bulletin No. 124, Rome.
- Kucuk, M.; Kolayli, S.; Karaoglu, S.; Ulusoy, E.; Baltaci, C.; Candan, F. Biological activities and chemical composition of three honeys of different species from Anatolia. Food chemistry 2007, 100, 526–534. [Google Scholar] [CrossRef]
- Kugonza, D.R.; Nabakabya, D. Processing and distribution channels affect the quality of honey in Uganda. Tropicultura 2008, 26, 113–118. [Google Scholar]
- Louveaux, J.; Maurizio, A.; Vorwohl, G. Methods of Melissopalynology. Bee World 1985, 59, 139157. [Google Scholar]
- Makarewicz, M.; Kowalski, S.; Lukasiewicz, M.; Małysa-Paśko, M. Antimicrobial and antioxidant properties of some commercial honeys available on the Polish market. Czech Journal of Food Sciences 2017, 35, 401–406. [Google Scholar] [CrossRef]
- Marchini, J.; Howie, B.; Myers, S.; McVean, G.; Donnelly, P. A adulteration and improper storage association. Nature genetics 2007, 39, 906–913. [Google Scholar] [CrossRef]
- Mohammed, S.A. (2014). Commercial Sudanese Honey: National Research Center. Faculty of Agricultural Sciences, University of Khartoum, Khartoum, Sudan.
- Moniruzzaman, M.; Sulaiman, S.A.; Khalil, M.I.; Gan, S.H. Evaluation of the physicochemical and antioxidant properties of sourwood and other Malaysian honeys: a comparison with manuka honey. Chemistry Central Journal 2013, 7, 138. [Google Scholar] [CrossRef]
- Muli, E.; Munguti, A.; Raina, S.K. Quality of honey collected and processed using traditional methods in rural areas of Kenya. Acta Veterinaria Brno 2007, 76, 315–320. [Google Scholar] [CrossRef]
- Muthui, B., N. (2012). Physiochemical properties of honey from Mwingi and selected urban areas in Kenya, effects of adulteration and some levels of population awareness of honey adulteration. Master's thesis, Kenyatta University.
- Nweze, J.A.; Okafor, J.I.; Nweze, E.I.; Nweze, J.E. Evaluation of the physicochemical and antioxidant properties of two stingless bee honeys: a comparison with Apis mellifera honey from Nsukka, Nigeria. BMC Research Notes 2017, 10, 566. [Google Scholar] [CrossRef]
- Rybak-Chmielewska, H. Changes in the carbohydrate composition of honey undergoing during storage. Journal of Apicultural Science 2007, 51, 39–47. [Google Scholar]
- Sebeho, H.K. Honey production and quality characteristics in Ethiopia, review: Academic Journal of Entomology. Academic Journal of Entomology 2015, 8, 168–173. [Google Scholar]
- Silva, L.R.; Videira, R.; Monteiro, A.P.; Valentão, P.; Andrade, P.B. Honey from Luso region (Portugal): Physicochemical characteristics and mineral contents. Microchemical Journal 2009, 93, 73–77. [Google Scholar] [CrossRef]
- Teferi D. (2020). Quality assessment and failure detection using multiple analytical approaches using commercially available honey samples from Addis Ababa, Ethiopia: Addis Ababa University.
- Díez, M.J.; Andrés, C.; Terrab, A. Physicochemical Parameters and Pollen Analysis of Moroccan Honeydew Honeys. International Journal of Food Science and Technology 2002, 39, 167–176. [Google Scholar] [CrossRef]
- Tesfaye, B.; Begna, D.; Eshetu, M. Evaluation of the physico-chemical characteristics of honey produced in Bale Natural Forest, Southeast Ethiopia. International Journal of Agricultural Science and Food Technology 2016, 2, 21–27. [Google Scholar] [CrossRef]
- Visquert, M.; Escriche, I.; Andres, A.; Fito, P. Changes in honey quality parameters caused by thermal processes. Alimentacion-Equipos-y-Tecnologia 2004, 23, 87–92. [Google Scholar]
- Visquert, M.; Vargas, M.; Escriche, I. Effect of post-harvest storage conditions on the color and freshness parameters of raw honey. International Journal of Food Science and Technology 2014, 49, 181–187. [Google Scholar] [CrossRef]
- White, J.W. (1962). Composition of American honeys: US Dept. of Agriculture.
Disclaimer/Publisher’s Note: The statements, opinions and data contained in all publications are solely those of the individual author(s) and contributor(s) and not of MDPI and/or the editor(s). MDPI and/or the editor(s) disclaim responsibility for any injury to people or property resulting from any ideas, methods, instructions or products referred to in the content. |
© 2025 by the authors. Licensee MDPI, Basel, Switzerland. This article is an open access article distributed under the terms and conditions of the Creative Commons Attribution (CC BY) license (http://creativecommons.org/licenses/by/4.0/).
Copyright: This open access article is published under a Creative Commons CC BY 4.0 license, which permit the free download, distribution, and reuse, provided that the author and preprint are cited in any reuse.


