Submitted:
06 May 2025
Posted:
07 May 2025
Read the latest preprint version here
Abstract
Spinocerebellar ataxia type 2 (SCA2) is a neurodegenerative disorder marked by progressive brainstem and cerebellar atrophy, leading to gait ataxia. Quantifying this atrophy in magnetic resonance imaging (MRI) is critical for tracking disease progression in both symptomatic patients and preclinical subjects. However, manual segmentation of brainstem subregions (mesencephalon, pons, and medulla) is time-consuming and prone to human error. This work presents an automated deep learning framework to assess brainstem atrophy in SCA2. Using T1-weighted MRI scans from patients, preclinical carriers, and healthy controls, an U-shape convolutional neural network (CNN) was trained to segment brainstem subregions and quantify volume loss. The model achieved strong agreement with manual segmentations (min DSC: 0.93), and significantly reduced processing time from hours to minutes. Results revealed severe atrophy in preclinical and symptomatic cohorts, with pons volumes reduced by nearly 50% compared to controls (p< 0.001). The mesencephalon and medulla showed milder degeneration, underscoring regional vulnerability differences. This automated approach enables rapid, precise assessment of brainstem atrophy, advancing early diagnosis and monitoring in SCA2. By streamlining analysis, deep learning bridges translational gaps in neurodegenerative disease research.
Keywords:
Deep Learning
; Brainstem Segmentation
; Medical Imaging Processing
; Brain MRI segmentation
; Convolutional Neural Networks
; U-Net
- Highlights
- What are the main findings?
- Superior Segmentation Performance: The proposed modified U-Net architecture (with attention-enhanced skip connections and inception modules) significantly outperforms three comparative approaches in brainstem parcellation, achieving higher Dice scores across all substructures (medulla, pons, mesencephalon) and the whole brainstem.
- Volume Differences Across Groups: Automated segmentation reveals distinct volumetric patterns, with controls exhibiting larger volumes (whole brainstem: 1.62) compared to preclinical (1.49) and patient groups (1.12), suggesting potential atrophy linked to disease progression.
- What is the implication of the main finding?
- Clinical Utility: The method’s accuracy and robustness support its potential for precise brainstem assessment in neurodegenerative disorders, enabling earlier detection of structural changes (e.g., reduced medulla volume in patients: 0.26 vs. 0.31 in controls).
- Technical Advancements: The success of attention mechanisms and inception modules highlights their value for complex anatomical segmentation, paving the way for similar adaptations in other small-structure parcellation tasks.
1. Introduction
Spinocerebellar Ataxia type 2 (SCA2) is a rare neurodegenerative disorder characterized by progressive degeneration of the brainstem and cerebellum. As one of the most prevalent spinocerebellar ataxias globally [1,2,3,4], it exhibits a notably high incidence in Holguin, Cuba [1,5]. Clinical manifestations include a cerebellar syndrome, slowing of the saccadic ocular movements, cognitive disorders, sensory neuropathy, etc.
Three patterns of macroscopic atrophy reflecting damage of different neuronal system are recognized in spinocerebellar ataxias, named spinal atrophy (SA), olivopontocerebellar atrophy (OPCA) and cortico-cerebellar atrophy (CCA) [6]. Neuroimaging has played a pivotal role in diagnosing these atrophy patterns since 1995, when Kumas et al. [7] first described OPCA features in pediatric populations. Magnetic resonance imaging (MRI) remains the gold standard for structural segmentation and volumetric analysis due to its superior resolution [8], outperforming other modalities such as single-photon emission computed tomography (SPECT) and positron emission tomography (PET) in visualizing SA, OPCA, and CCA [9]. As emphasized by Klaes et al. [10], MRI is the most extensively validated biomarker candidate for spinocerebellar ataxias.
Brainstem atrophy has been documented across both symptomatic and prodromal stages of SCA2 [1,2,3,11,12,13,14,15,16,17,18,19]. However, most studies rely on manual segmentation, a method constrained by time-intensive workflows, inter-rater variability, and scalability limitations in large cohorts. To address these challenges, this work introduces an automated deep learning framework for quantifying volumetric changes in SCA2 patients, preclinical carriers, and healthy controls.
Convolutional neural networks (CNNs or convnets) [20,21] have demonstrated outstanding performances at tasks such as hand-written digit classification, face and contour detection [22], automatic video processing [23], and neurological behavior analysis and prediction [24,25,26]. In neuroimaging, CNNs have been applied to brain lesion segmentation using 3D architectures [27], U-Net models [28,29,30,31,32] and adversarial training [33], leveraging hierarchical feature extraction. While 2D CNNs reduce computational costs [34,35,36,37], they often sacrifice accuracy compared to hybrid 2D-3D approaches that optimize feature integration [38,39]. One of the most interesting advances includes cerebellum parcellation via cascaded CNNs [40,41], highlighting their potential for fine-grained neuroanatomical analysis.
Building on prior work [42], this study applies CNNs to brainstem segmentation in MRI, with a focus on mesencephalon, pons, and medulla volumetric changes. To date, no studies have employed deep learning to compare brainstem atrophy between symptomatic SCA2 patients, preclinical carriers, and controls in Cuba. This approach aims to establish a scalable, objective tool for identifying early biomarkers of SCA2 progression.
2. Materials and Methods
The proposed model architecture builds upon the method described in [42], utilizing a 3D U-Net-like framework to perform volumetric segmentations. This design processes the input images in their native 3D spatial context, which allows to preserve anatomical relationships. The main architecture contains four downsampling and upsampling operations. To enhance feature extraction, each convolutional layer was replaced with an inception module [37], which optimizes computational efficiency by processing multi-scale features in parallel. Additionally, skip connections were refined using three consecutive Convolutional Block Attention Modules (CBAM) [43], enabling the model to focus on spatially and channel-wise relevant features in these branches. The overall model and inception architectures are illustrated in Figure 1, with detailed schematics of the CBAM blocks provided in Figure 2.
The study employed a cohort of 42 MRI scans obtained from the Cuban Neurosciences Center. These scans correspond to 25 individuals, comprising five healthy controls, seven preclinical subjects, and 13 SCA2 patients. Given hardware limitations, the model was designed to balance computational efficiency with performance, ensuring feasibility on available infrastructure while maintaining robust segmentation accuracy.
2.1. Image Preparation
The full preparation process for one single image can be depicted in Figure 3. All MRI scans underwent preprocessing to ensure consistency and improve segmentation accuracy. First, N4 bias field correction [44] was applied to address intensity inhomogeneities, enhancing image quality for subsequent analysis. Following this, each scan was registered to the ICBM 2009c nonlinear symmetric template [45] using Advanced Normalization Tools (ANTS) [46]. The registration process employed a three-stage approach: rigid, affine, and symmetric normalization (SyN), ensuring optimal alignment of individual scans to the standardized template space. The Figure 3a shows the original image, and 3b displays the result of N4+MNIregistration.
To optimize computational efficiency, MRI scans were automatically cropped to focus exclusively on the brainstem region. Using training set segmentations as reference, a standardized region of interest (ROI) measuring 80×80×96 voxels was extracted for each scan. This approach reduced the computational load by 93%, decreasing processed volumes from approximately 8.5 million voxels per full scan to ~614,000 voxels. The cropped ROIs enabled efficient model training and inference while preserving all relevant anatomical data for brainstem analysis. The Figure 3d shows the result of the cropping operation. Following the crop, intensity normalization was applied for every image (Figure 3e). The reduced volumes were used as inputs to the 3D U-Net. The Figure 3f shows one fully preprocessed image overlapped with its manual segmentations.
2.2. Analysis Description
The study was implemented in Python 3.9, utilizing TensorFlow [47] and Keras [48] for model development and training. The model was trained over 250 epochs using the Adam optimizer [49] with default parameters. To mitigate overfitting, a dropout rate of 0.2 was applied before the final layer.
For training, the label maps are converted into C binary channels, and each channel represents a label. At the same time, each voxel can only belong to one label. The loss function used was one minus the average Dice score (DSC) across all channels, and the DSC is computed using equation (1), where N is the number of voxels in the image domain, is the voxel in the channel of the prediction, and ε prevents division by zero [41].
The experiment was conducted on an NVIDIA RTX 3060 6GB GPU. The dataset was partitioned into 17 images for training, 3 for validation, and 22 for testing. To enhance model generalization, data augmentation techniques were applied during training, including rotations, translations, and flipping. No augmentation was applied to testing images.
Volumetric comparisons were performed using the percentage of the region of interest with respect to the total intracranial volume (% TICV).
3. Results
The evaluation results, summarized in Table 1, demonstrate high segmentation accuracy across all regions of interest. Mean Dice similarity coefficients (DSC) exceeded 0.95 for all structures, with the highest score (0.97) achieved for the whole brainstem. The mesencephalon exhibited the lowest mean DSC (0.93), indicating consistent yet slightly reduced performance in this region. These results highlight the model’s robustness and reliability in segmenting brainstem subregions.
Figure 4 presents a qualitative comparison of segmentation results, showing a representative test image alongside its predicted segmentation. The proposed method was evaluated against three established approaches: (1) an upscaled version of the model architecture from [42], (2) the cerebellar parcellation network by Han et al. [41], and (3) the brainstem parcellation model by Magnusson et al. [50]. To ensure a fair comparison, all models were re-trained under identical conditions, maintaining consistent training protocols (loss functions, optimizer parameters, and regularization strategies). Quantitative results of this comparative analysis are presented in Table 1.
The quantitative results in Table 1 demonstrate that the proposed method achieves consistently superior segmentation performance across all brainstem substructures compared to existing approaches. The method attains higher DSC for the medulla (0.96 ± 0.022 vs. ≤0.93), pons (0.96 ± 0.015 vs. ≤0.94), mesencephalon (0.95 ± 0.021 vs. ≤0.92), and full brainstem (0.96 ± 0.008 vs. ≤0.95), alongside reduced standard deviations, indicating enhanced robustness. These improvements can be attributed to the two key architectural changes made to the U-Net: (1) the integration of attention mechanisms within skip connections to refine feature aggregation, and (2) the replacement of conventional convolutional layers with inception modules to capture multi-scale contextual information more effectively. By addressing limitations related to structural heterogeneity and boundary ambiguity—common challenges in brain MRI segmentation—the method offers improved accuracy and consistency. Its performance suggests strong potential for clinical applications requiring precise anatomical delineation, such as degenerative disease monitoring.
Quantitative evaluation of computational efficiency revealed segmentation times of <1 second per image when utilizing GPU acceleration (NVIDIA RTX 3060 MOBILE, 6GB GDDR6), while CPU-based processing (Intel Core i5-10500H, 16GB DDR4 RAM) required 210±15 seconds per case. This represents a 60-120× speed improvement compared to manual segmentation protocols while maintaining diagnostic-grade accuracy.
Using the segmentation results for all the images of the initial cohort, volumetric changes were calculated for SCA2 patients, preclinical subjects, and healthy controls. Volumes were normalized as a percentage of the total intracranial volume (% TICV), with TICV computed using ROBEX [51]. The results, illustrated in Table 2, align with findings reported by Reetz et al. [52]. In all cases, mean volumes for patients were lower than those for preclinical subjects, which in turn were lower than controls.
The most pronounced differences were observed in the pons, with mean volumes of 0.47% TICV for patients, 0.76% TICV for preclinical subjects, and 0.82% TICV for controls. Notably, the median volume for controls was nearly double that of patients. Differences between preclinical subjects and controls were less pronounced. In the mesencephalon, mean volumes were 0.40% TICV for patients, 0.44% TICV for preclinical subjects, and 0.48% TICV for controls. The medulla exhibited the smallest volumetric differences, with values of 0.26%, 0.29%, and 0.31% TICV for patients, preclinical subjects, and controls, respectively. At the whole brainstem level, mean volumes were 1.12%, 1.49%, and 1.62% TICV for patients, preclinical subjects, and controls, respectively, further highlighting the progressive nature of brainstem atrophy in SCA2.
4. Discussion
This study presented a deep learning-based framework for analyzing MRI scans to quantify volumetric changes in the brainstem of SCA2 patients and preclinical subjects compared to healthy controls. To the best of our knowledge, this represents the first such study conducted in Cuba, addressing a critical need for accessible and efficient tools to study neurodegenerative diseases in resource-constrained settings.
The success of our approach stems from the inherent advantages of the 3D U-Net for medical image segmentation. Unlike classical techniques (e.g., atlas-based or graph-cut methods) that rely on handcrafted features—which often fail to capture complex anatomical variability [29]—CNNs automatically learn discriminative hierarchical features, enabling precise parcellation of challenging structures like the brainstem substructures [53]. Our modified 3D U-Net architecture incorporates two key changes—attention mechanisms in skip connections and inception modules replacing standard convolutions. This advanced and complex architecture achieves expert-level segmentation accuracy (Dice >0.95 for all brainstem substructures). The attention modules enable precise localization of anatomical boundaries by selectively emphasizing relevant spatial features, while the inception modules capture multi-scale contextual information critical for distinguishing between adjacent brainstem subregions.
A notable limitation of the proposed approach is its reliance on the registration phase. While registration was successful for all MRI scans in this study, its performance may vary with different datasets, potentially leading to segmentation errors if registration fails. Future work will focus on developing registration-free pipelines to enhance robustness and generalizability.
Despite this limitation, the results demonstrate that deep learning techniques can effectively characterize brainstem atrophy, enabling rapid differentiation between patients, preclinical subjects, and controls. The computational efficiency of the proposed method represents a significant advancement, with GPU-based segmentation completing in under one second per image—a dramatic improvement over manual segmentation, which can require over an hour per case. Even without GPU acceleration, segmentation times of up to 3.5 minutes on a standard CPU still offer a substantial reduction in processing time compared to manual methods.
These findings suggest that the proposed framework can be integrated into larger neuroimaging pipelines to assess volumetric changes in SCA2 patients and preclinical subjects. The development of user-friendly software based on this approach could provide clinicians with a powerful tool for rapid diagnosis and monitoring of disease progression. By highlighting key atrophic changes and enabling longitudinal evaluation, such tools could improve patient care and support early intervention strategies.
In the broader context of neurodegenerative disease research, this work underscores the potential of deep learning to bridge gaps in neuroimaging analysis, particularly in regions with limited access to advanced computational resources. Future research directions include expanding the dataset to improve model generalizability, exploring multi-modal imaging approaches, and investigating the applicability to other neurodegenerative conditions.
5. Conclusions
This study introduced a deep learning-based framework to quantify brainstem atrophy in SCA2 patients, preclinical subjects, and healthy controls, representing a pioneering effort in Cuba. By achieving mean Dice scores above 0.96 for the whole brainstem and 0.95 for its subregions, the approach demonstrates high accuracy in detecting significant volumetric differences, particularly in the pons. These findings highlight the potential of deep learning to address critical gaps in neuroimaging analysis. The method enables rapid, scalable assessments, reducing reliance on time-intensive manual segmentation and supporting earlier diagnosis and monitoring of SCA2.
Author Contributions
Conceptualization, L.V., R.P. and R.C.; methodology, R.C., L.V.; software, R.C.; validation, R.C., L.V., R.P. and A.L.; formal analysis, L.V. and R.P.; investigation, R.C.; resources, L.V.; data curation, R.C.; writing—original draft preparation, R.C.; writing—review and editing, L.V., R.P. and A.L.; visualization, R.C.; supervision, L.V., R.P and A.L. All authors have read and agreed to the published version of the manuscript.
Funding
This research received no external funding.
Institutional Review Board Statement
Not applicable
Informed Consent Statement
Not applicable
Data Availability Statement
The preprocessed (totally anonymized) MRIs used in this study can be shared with authors upon a reasonable request. The source code for this study is publicly available at the GitHub account https://github.com/robbinc91/mipaim_unet.
Conflicts of Interest
The authors declare no conflict of interest.
References
- K. Seidel, S. Siswanto, E.R.P. Brunt, W. Den Dunnen, H.W. Korf, U. Rüb, Brain pathology of spinocerebellar ataxias, Acta Neuropathol. 124 (2012) 1–21. [CrossRef]
- M. Mascalchi, S. Diciotti, M. Giannelli, A. Ginestroni, A. Soricelli, E. Nicolai, M. Aiello, C. Tessa, L. Galli, M.T. Dotti, S. Piacentini, Progression of Brain Atrophy in Spinocerebellar Ataxia Type 2 : A Longitudinal Tensor-Based Morphometry Study, PLoS One. 9 (2014). [CrossRef]
- C. Marzi, S. Ciulli, M. Giannelli, A. Ginestroni, C. Tessa, M. Mascalchi, S. Diciotti, Structural Complexity of the Cerebellum and Cerebral Cortex is Reduced in Spinocerebellar Ataxia Type 2, J. Neuroimaging. 28 (2018) 1–6. [CrossRef]
- A. Antenora, C. Rinaldi, A. Roca, C. Pane, M. Lieto, F. Saccà, S. Peluso, G. De Michele, A. Filla, The Multiple Faces of Spinocerebellar Ataxia type 2, Ann. Clin. Transl. Neurol. 4 (2017) 687–695. [CrossRef]
- L. Velázquez-Pérez, J. Medrano-Montero, R. Rodríguez-Labrada, N. Canales-Ochoa, J.C. Alí, F.J.C. Rodes, T.R. Graña, M.O.H. Oliver, R.A. Rodríguez, Y.D. Barrios, R.T. Vega, L.F. Angulo, Hereditary Ataxias in Cuba : A Nationwide Epidemiological and Clinical Study in 1001 Patients, (2020). [CrossRef]
- M. Mascalchi, Spinocerebellar ataxias, Neurol Sci. 29 (2008) 311–313. [CrossRef]
- S.D. Kumar, R.P. Chand, A.K. Gururaj, W.D. Jeans, CT features of olivopontocerebellar atrophy in children, Acta Radiol. 36 (1995) 593–596. [CrossRef]
- A.T. Meira, W.O. Arruda, S.E. Ono, A.D.C. Neto, S. Raskin, C.H. Camargo, H.A.G. Teive, Neuroradiological Findings in the Spinocerebellar Ataxias, Tremor and Other Hyperkinetic Movements. (2019) 1–8. [CrossRef]
- M. Mascalchi, A. Vella, Neuroimaging Applications in Chronic Ataxias, Int. Rev. Neurobiol. 143 (2018) 109–162. [CrossRef]
- X.A. Klaes, X.E. Reckziegel, X.M.C.F. Jr, X.T.J.R. Rezende, X.L.M. Vedolin, X.L.B. Jardim, X.J.A. Saute, MR Imaging in Spinocerebellar Ataxias : A Systematic Review, Am. J. f Neuroradiol. 37 (2016) 1405–1412. [CrossRef]
- C.R. Hernandez-Castillo, V. Galvez, R. Mercadillo, R. Diaz, A. Campos-Romo, J. Fernandez-Ruiz, Extensive white matter alterations and its correlations with ataxia severity in SCA 2 patients, PLoS One. 10 (2015) 1–10. [CrossRef]
- S. Döhlinger, T.K. Hauser, J. Borkert, A.R. Luft, J.B. Schulz, Magnetic resonance imaging in spinocerebellar ataxias, Cerebellum. 7 (2008) 204–214. [CrossRef]
- D. Tamuli, M. Kaur, T. Sethi, A. Singh, M. Faruq, A.K. Jaryal, A.K. Srivastava, S. Senthil, Cortical and Subcortical Brain Area Atrophy in SCA1 and SCA2 Patients in India : The Structural MRI Underpinnings and Correlative Insight Among the Atrophy and Disease Attributes, Neurol. India. 69 (2021) 1318–1325. [CrossRef]
- L. Peipei, L. Yang, G. Weihong, S. Xiaonan, Clinical Manifestation, Imaging, and Genotype Analysis of Two Pedigrees with Spinocerebellar Ataxia, Cell Biochem. Biophys. 61 (2011) 691–698. [CrossRef]
- H. Jacobi, T. Hauser, P. Giunti, C. Globas, P. Bauer, Spinocerebellar Ataxia Types 1 , 2 , 3 and 6 : the Clinical Spectrum of Ataxia and Morphometric Brainstem and Cerebellar Findings, Cerebellum. 11 (2012) 155–166. [CrossRef]
- T. Van Dijk, P. Barth, L. Reneman, B. Appelhof, F. Baas, B.T. Poll-the, A De Novo Missense Mutation in the Inositol 1 , 4 , 5-Triphosphate Receptor Type 1 Gene Causing Severe Pontine and Cerebellar Hypoplasia : Expanding the Phenotype of ITPR1 -Related Spinocerebellar Ataxia ’ s, Am. J. Med. Genet. (2016). [CrossRef]
- R. Della Nave, A. Ginestroni, C. Tessa, E. Salvatore, D. De Grandis, R. Plasmati, F. Salvi, G. De Michele, M.T. Dotti, S. Piacentini, M. Mascalchi, Brain white matter damage in SCA1 and SCA2. An in vivo study using voxel-based morphometry, histogram analysis of mean diffusivity and tract-based spatial statistics, Neuroimage. 43 (2008) 10–19. [CrossRef]
- L.S. Politi, S. Bianchi Marzoli, C. Godi, M. Panzeri, P. Ciasca, G. Brugnara, A. Castaldo, D. Di Bella, F. Taroni, L. Nanetti, C. Mariotti, MRI evidence of cerebellar and extraocular muscle atrophy differently contributing to eye movement abnormalities in SCA2 and SCA28 diseases, Investig. Ophthalmol. Vis. Sci. 57 (2016) 2714–2720. [CrossRef]
- M. Mascalchi, A. Vella, Neuroimaging biomarkers in SCA2 gene carriers, Int. J. Mol. Sci. 21 (2020) 1–14. [CrossRef]
- Y. LeCun, B. Boser, J.S. Denker, D. Henderson, R.E. Howard, W. Hubbard, L.D. Jackel, Backpropagation applied to digit recognition, Neural Comput. 1 (1989) 541–551. https://www.ics.uci.edu/~welling/teaching/273ASpring09/lecun-89e.pdf.
- M.D. Zeiler, R. Fergus, Visualizing and Understanding Convolutional Networks, Anal. Chem. Res. 12 (2014) 818–833. [CrossRef]
- B. Hariharan, P. Arbeláez, L. Bourdev, S. Maji, J. Malik, Semantic Contours from Inverse Detectors, in: Int. Conf. Comput. Vis., 2011: pp. 991–998. http://home.bharathh.info/pubs/pdfs/BharathICCV2011.pdf.
- R. Jaroensri, A. Zhao, G. Balakrishnan, D. Lo, J.D. Schmahmann, F. Durand, J. Guttag, A Video-Based Method for Automatically Rating Ataxia, in: Proc. Mach. Learn., 2017: pp. 1–13.
- C. Kawahara, C.J. Brown, S.P. Miller, B.G. Booth, V. Chau, R.E. Grunau, J.G. Zwicker, G. Hamarneh, BrainNetCNN : Convolutional Neural Networks for Brain Networks ; Towards Predicting Neurodevelopment, Neuroimage. 146 (2017) 1038–1049. [CrossRef]
- C. Stoean, R. Stoean, M. Atencia, M. Abdar, L. Velázquez-Pérez, A. Khosrabi, S. Nahavandi, U.R. Acharya, G. Joya, Automated Detection of Presymptomatic Conditions in Spinocerebellar Ataxia Type 2 Using Monte Carlo Dropout and Deep Neural Network Techniques with Electrooculogram Signals, Sensors. 20 (2020) 3032. [CrossRef]
- J. Dolz, C. Desrosiers, L. Wang, J. Yuan, D. Shen, I. Ben Ayed, Deep CNN ensembles and suggestive annotations for infant brain MRI segmentation, Comput. Med. Imaging Graph. 79 (2020) 101660. [CrossRef]
- K. Kamnitsas, C. Ledig, V.F.J. Newcombe, J.P. Simpson, A.D. Kane, D.K. Menon, D. Rueckert, B. Glocker, Efficient multi-scale 3D CNN with fully connected CRF for accurate brain lesion segmentation, Med. Image Anal. 36 (2016) 61–78. [CrossRef]
- B. Erden, N. Gamboa, S. Wood, 3D Convolutional Neural Network for Brain Tumor Segmentation, Stanford, 2017.
- O. Ronneberger, P. Fischer, T. Brox, U-net: Convolutional networks for biomedical image segmentation, Lect. Notes Comput. Sci. (Including Subser. Lect. Notes Artif. Intell. Lect. Notes Bioinformatics). 9351 (2015) 234–241. [CrossRef]
- B. Mansencal, B.D. De Senneville, V. Ta, V. Lepetit, AssemblyNet : A large ensemble of CNNs for 3D whole brain MRI segmentation, Neuroimage. 219 (2020) 117026. [CrossRef]
- I. Mecheter, M. Abbod, A. Amira, H. Zaidi, Deep Learning with Multiresolution Handcrafted Features for Brain MRI Segmentation, Artif. Intell. Med. 131 (2022) 102365. [CrossRef]
- J. Faber, D. Kügler, E. Bahrami, L.S. Heinz, D. Timmann, T.M. Ernst, K. Deike-Hofmann, T. Klockgether, B. van de Warrenburg, J. van Gaalen, K. Reetz, S. Romanzetti, G. Oz, J.M. Joers, J. Diedrichsen, P. Giunti, H. Garcia-Moreno, H. Jacobi, J. Jende, J. de Vries, M. Povazan, P.B. Barker, K.M. Steiner, J. Krahe, M. Reuter, CerebNet: A fast and reliable deep-learning pipeline for detailed cerebellum sub-segmentation, Neuroimage. 264 (2022) 119703. [CrossRef]
- P. Moeskops, M. Veta, M.W. Lafarge, K.A.J. Eppenhof, J.P.W. Pluim, Adversarial training and dilated convolutions for brain MRI segmentation, in: Deep Learn. Med. Image Anal. Multimodal Learn. Clin. Decis. Support, Springer, 2017: pp. 56–64. [CrossRef]
- R. Mehta, J. Sivaswamy, M-NET : A Convolutional Neural Network for Deep Brain Structure Segmentation, in: 2017 IEEE Int. Symp. Biomed. Imaging, 2017: pp. 437–440. [CrossRef]
- M. Havaei, A. Davy, D. Warde-farley, A. Biard, A. Courville, Y. Bengio, C. Pal, P. Jodoin, H. Larochelle, Brain Tumor Segmentation with Deep Neural Networks, Med. Image Anal. 35 (2017) 18–31. [CrossRef]
- L. Chen, P. Bentley, K. Mori, K. Misawa, M. Fujiwara, D. Rueckert, DRINet for Medical Image Segmentation, IEEE Trans. Med. Imaging. 37 (2018) 1–11. [CrossRef]
- D.E. Cahall, G. Rasool, N.C. Bouaynaya, H.M. Fathallah-Shaykh, Inception Modules Enhance Brain Tumor Segmentation, Front. Comput. Neurosci. 13 (2019) 1–8. [CrossRef]
- R. Mehta, A. Majumdar, J. Sivaswamy, BrainSegNet : a convolutional neural network architecture for automated segmentation of human brain structures BrainSegNet : a convolutional neural network architecture for automated segmentation of, J. Med. Imaging. 4 (2017). [CrossRef]
- H. Chen, Q. Dou, L. Yu, J. Qin, P. Heng, VoxResNet : Deep voxelwise residual networks for brain segmentation from 3D MR images, Neuroimage. 170 (2018) 446–455. [CrossRef]
- S. Han, Y. He, A. Carass, S.H. Ying, J.L. Prince, Cerebellum Parcellation with Convolutional Neural Networks, Proc SPIE Int Soc Opt Eng. 10949 (2019). [CrossRef]
- S. Han, A. Carass, Y. He, J.L. Prince, Automatic Cerebellum Anatomical Parcellation using U-Net with Locally Constrained Optimization, Neuroimage. (2020) 116819. [CrossRef]
- R. Cabeza-Ruiz, L. Velázquez-Pérez, A. Linares-Barranco, R. Pérez-Rodríguez, Convolutional Neural Networks for Segmenting Cerebellar Fissures from Magnetic Resonance Imaging, Sensors. 22 (2022) 1345. [CrossRef]
- S. Woo, J. Park, J. Lee, I.S. Kweon, CBAM : Convolutional Block Attention Module, in: Proc. Eur. Conf. Comput. Vis., 2018: pp. 3–19.
- N.J. Tustison, B.B. Avants, P.A. Cook, Y. Zheng, A. Egan, P.A. Yushkevich, J.C. Gee, N4ITK : Improved N3 Bias Correction, in: IEEE Trans. Med. Imaging, 2010: pp. 1310–1320. [CrossRef]
- V.S. Fonov, A.C. Evans, R.C. Mckinstry, C.R. Almli, D.L. Collins, Unbiased nonlinear average age-appropriate brain templates from birth to adulthood, Neuroimage. 47 (2009). [CrossRef]
- B.B. Avants, N. Tustison, H. Johnson, Advanced Normalization Tools ( ANTS ), Insight J. 2 (2009).
- A. Agarwal, P. Barham, E. Brevdo, Z. Chen, C. Citro, G.S. Corrado, A. Davis, J. Dean, M. Devin, S. Ghemawat, I. Goodfellow, A. Harp, G. Irving, M. Isard, Y. Jia, R. Jozefowicz, L. Kaiser, M. Kudlur, J. Levenberg, D. Man, R. Monga, S. Moore, D. Murray, C. Olah, M. Schuster, J. Shlens, B. Steiner, I. Sutskever, K. Talwar, P. Tucker, V. Vanhoucke, V. Vasudevan, F. Vi, O. Vinyals, P. Warden, M. Wattenberg, M. Wicke, Y. Yu, X. Zheng, TensorFlow: Large-Scale Machine Learning on Heterogeneous Distributed Systems, ArXiv Prepr. ArXiv1603.04467. (2016).
- F. Chollet, Keras: The Python deep learning library, Astrophys. Source Code Libr. ascl-1806 (2018).
- D.P. Kingma, J.L. Ba, Adam: a method for stochastic optimization, in: 3rd Int. Conf. Learn. Represent., 2015.
- M. Magnusson, A. Love, L.M. Ellingsen, Automated brainstem parcellation using multi-atlas segmentation and deep neural network, in: Med. Imaging 2021 Image Process., 2021: pp. 645–650. [CrossRef]
- J.E. Iglesias, C.Y. Liu, P.M. Thompson, Z. Tu, Robust brain extraction across datasets and comparison with publicly available methods, IEEE Trans. Med. Imaging. 30 (2011) 1617–1634. [CrossRef]
- K. Reetz, R. Rodríguez, I. Dogan, S. Mirzazade, S. Romanzetti, J.B. Schulz, E.M. Cruz-Rivas, J.A. Alvarez-Cuesta, R. Aguilera Rodríguez, Y. Gonzalez Zaldivar, G. Auburger, L. Velázquez-Pérez, Brain atrophy measures in preclinical and manifest spinocerebellar ataxia type 2, Ann. Clin. Transl. Neurol. 5 (2018) 128–137. [CrossRef]
- Ö. Çiçek, A. Abdulkadir, S.S. Lienkamp, T. Brox, O. Ronneberger, 3D U-net: Learning dense volumetric segmentation from sparse annotation, in: Med. Image Comput. Comput. Interv. 2016 19th Int. Conf., Springer International Publishing, Athens, Greece, 2016: pp. 424–432. [CrossRef]
Figure 1.
Basic structure of the 3D U-Net and inception used.
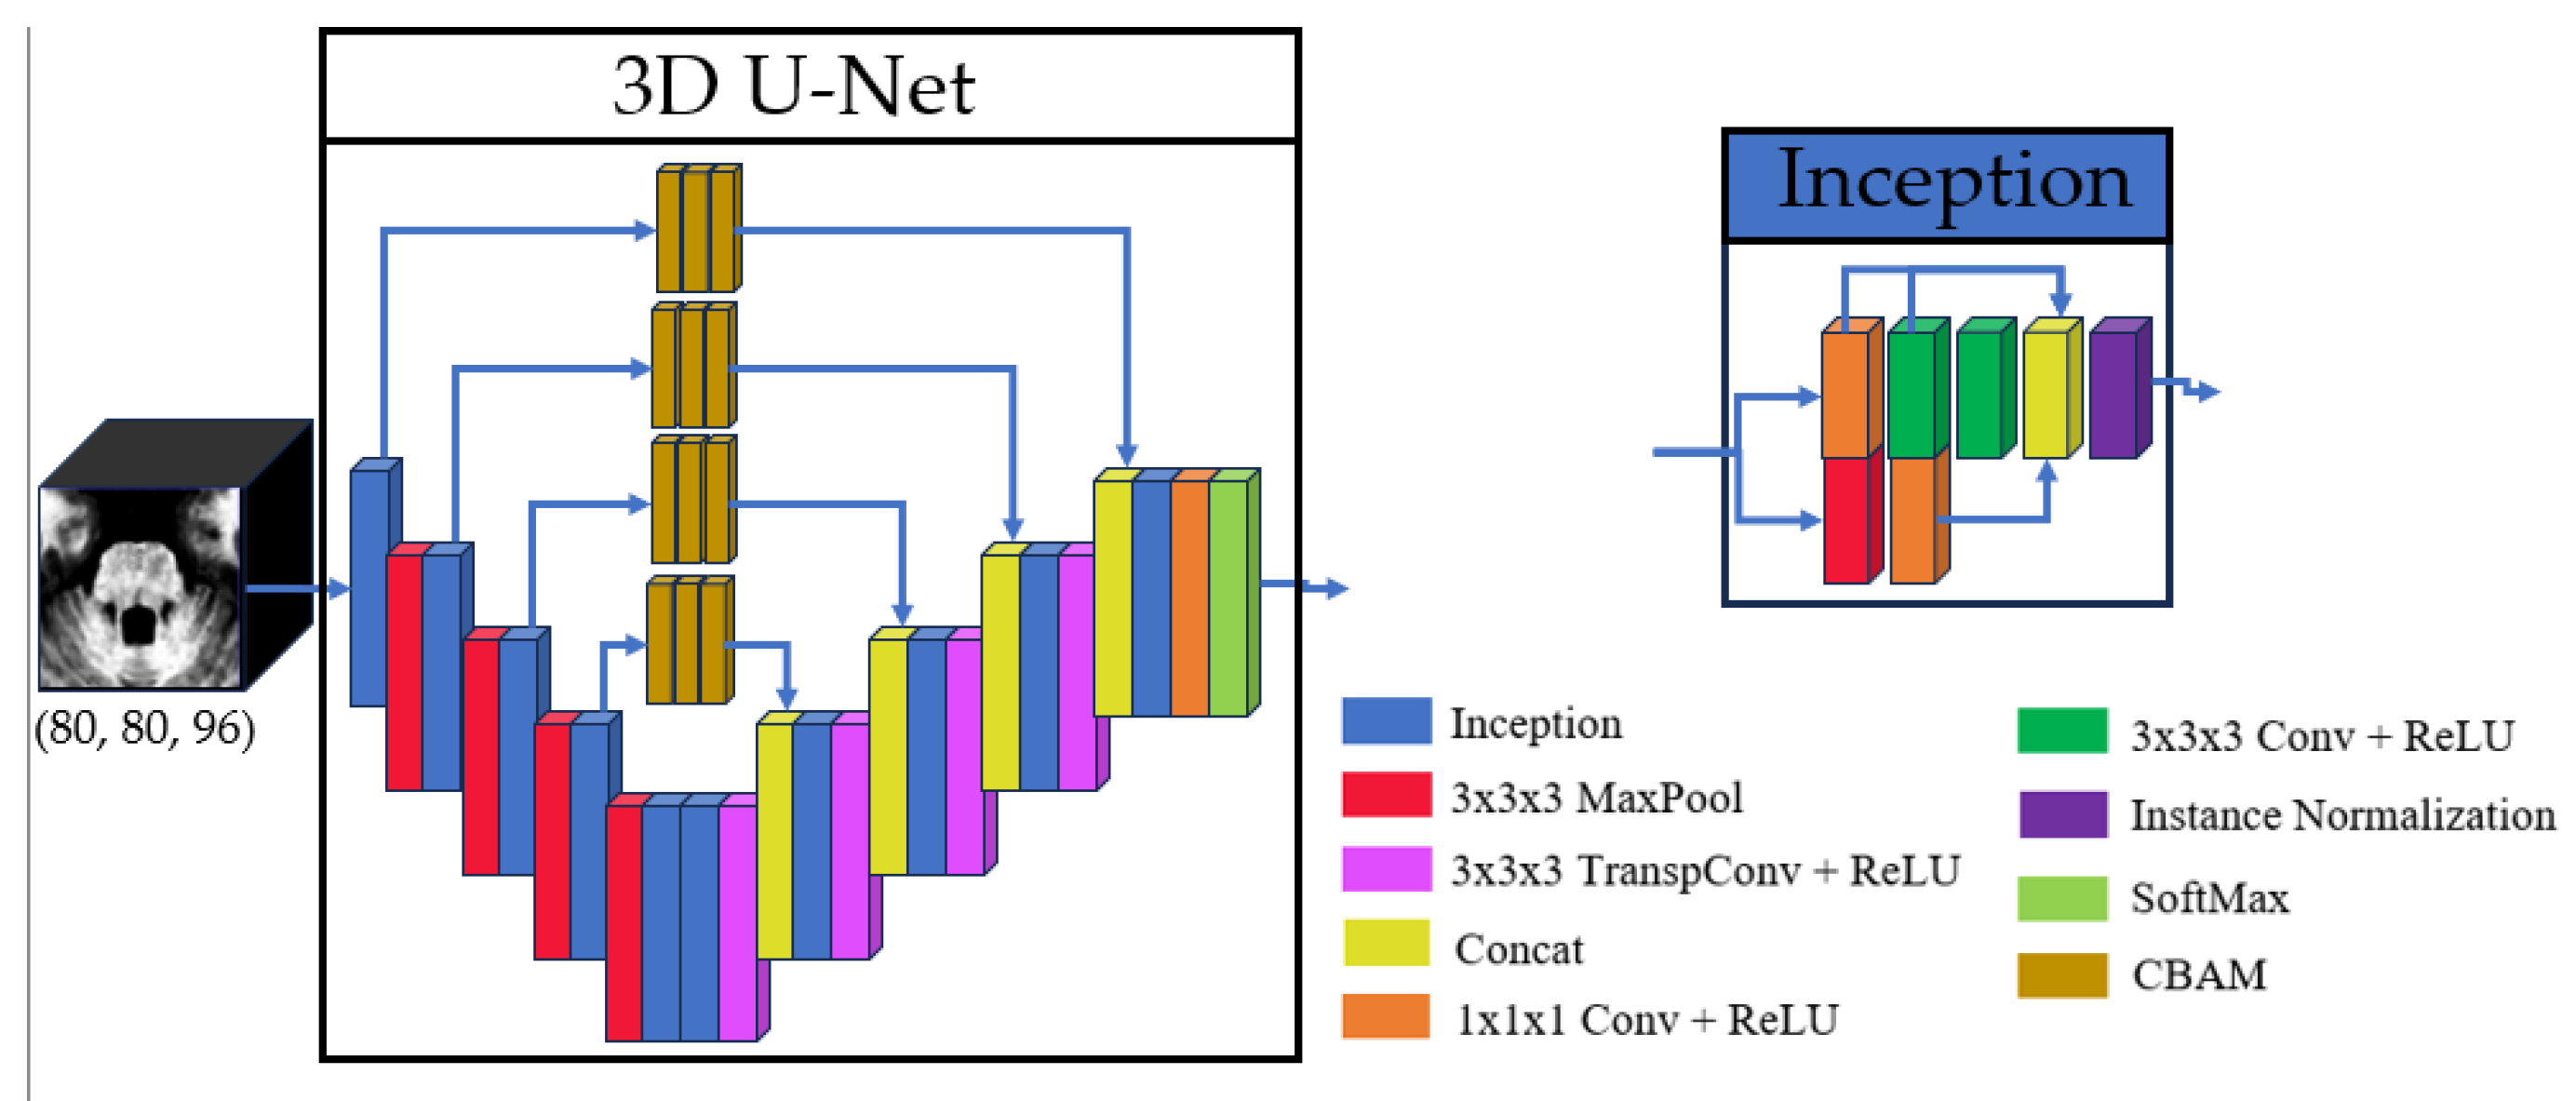
Figure 2.
Structures of Convolutional Block Attention Module (CBAM), Channel Attention Module (CAM) and Spatial Attention Module (SAM).
Figure 2.
Structures of Convolutional Block Attention Module (CBAM), Channel Attention Module (CAM) and Spatial Attention Module (SAM).

Figure 3.
Full preprocessing routine for a single image. Original image (a), followed by N4 Norm.+MNI Registration (b) and manual labels superposition (c). Follows the result of crop operation (d) and intensity normalization (e). In (f) the manually segmented labels in the cropped region, and (g) shows a 3D view. Label colors: medulla (red), pons (green), and mesencephalon (blue).
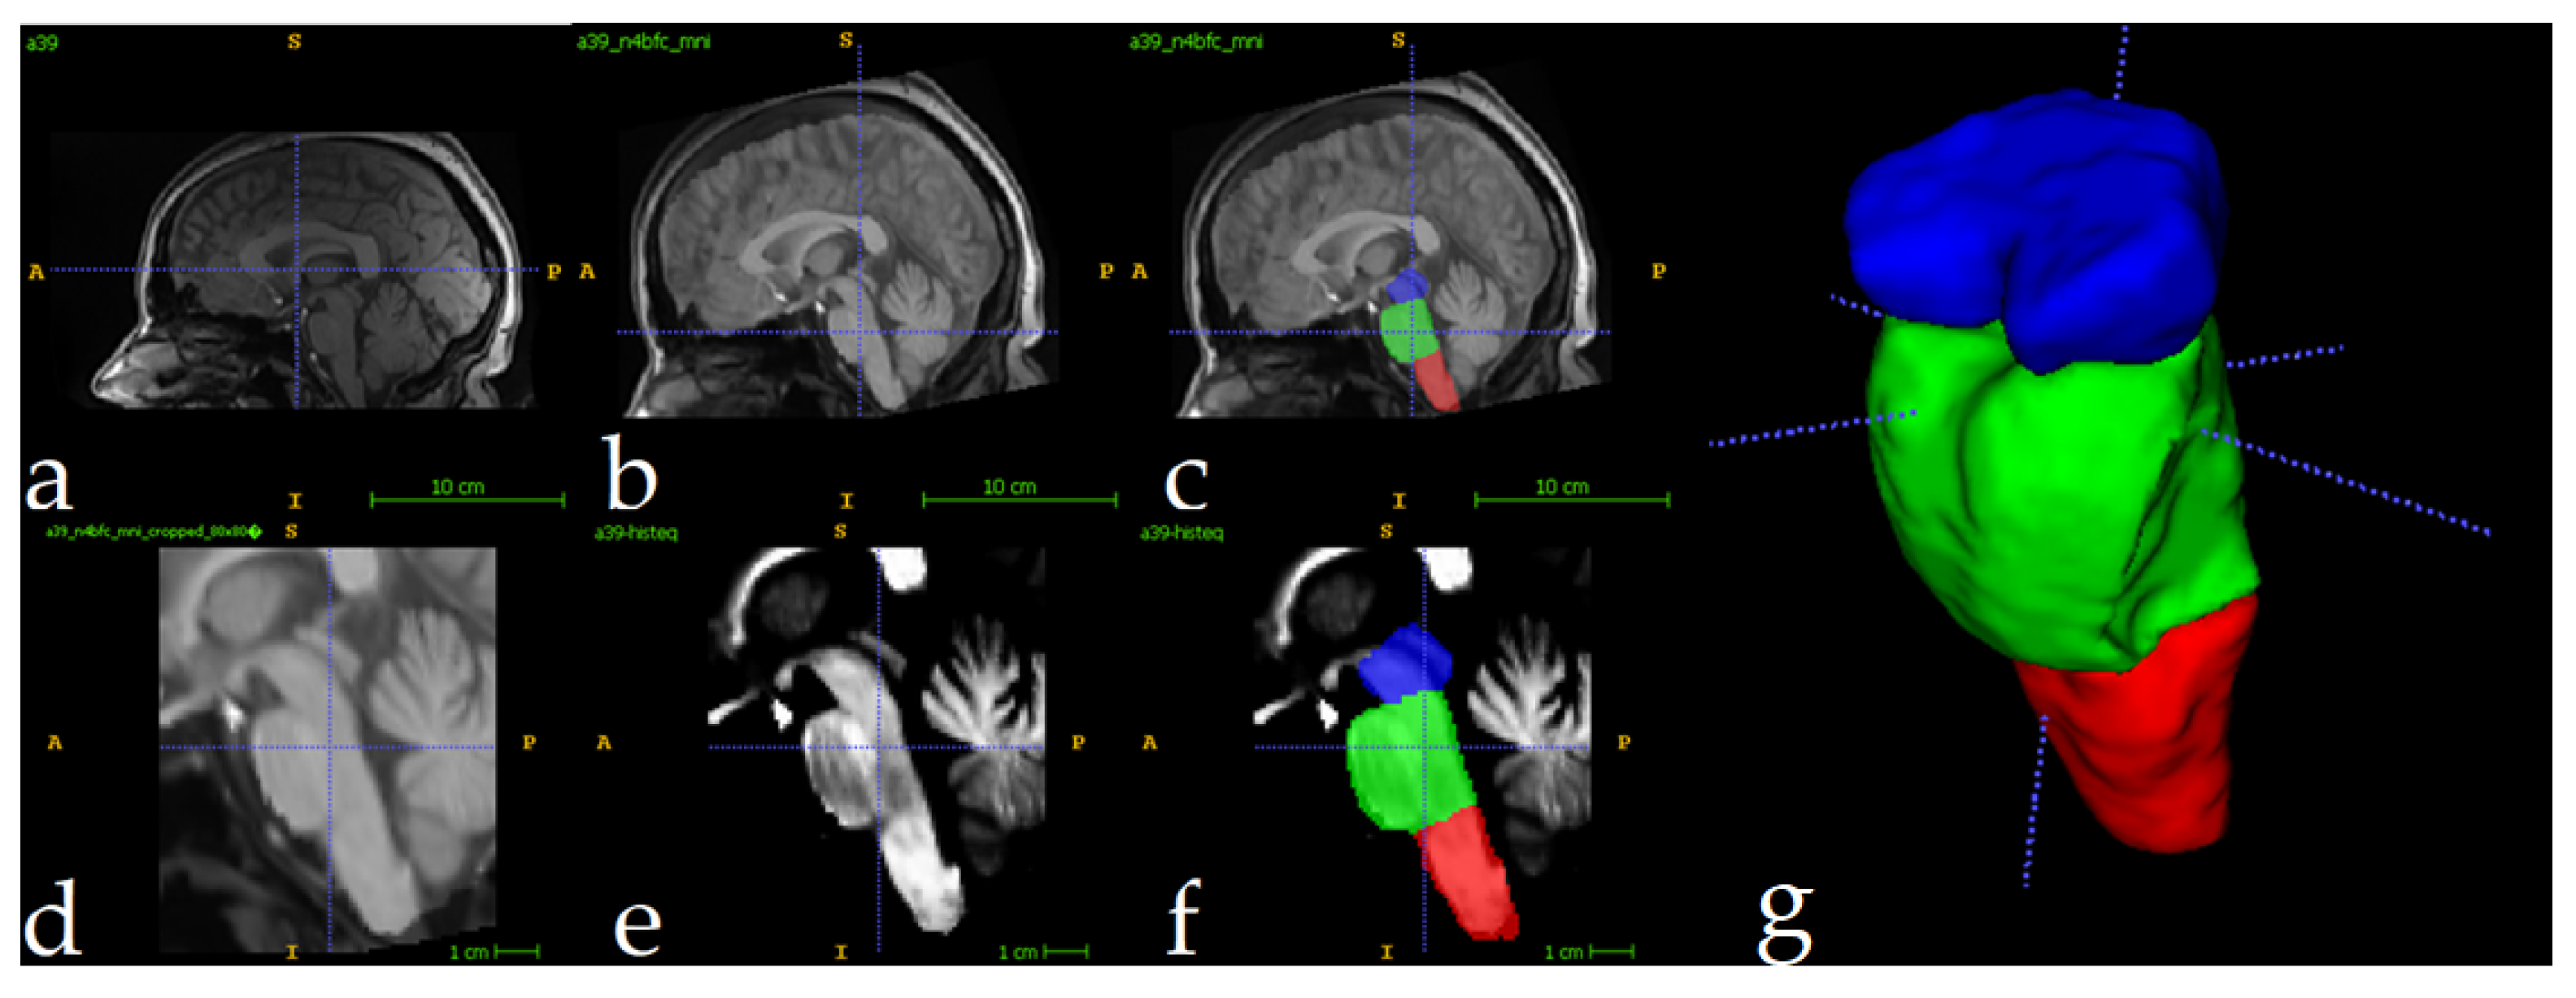
Figure 4.
From top to bottom: axial, sagittal, coronal and 3D views of segmentations for a test image. From left to right: preprocessed image, ground-truth segmentations, and results of segmentation by this research, Han et al. [41], and Magnusson et al. [50].
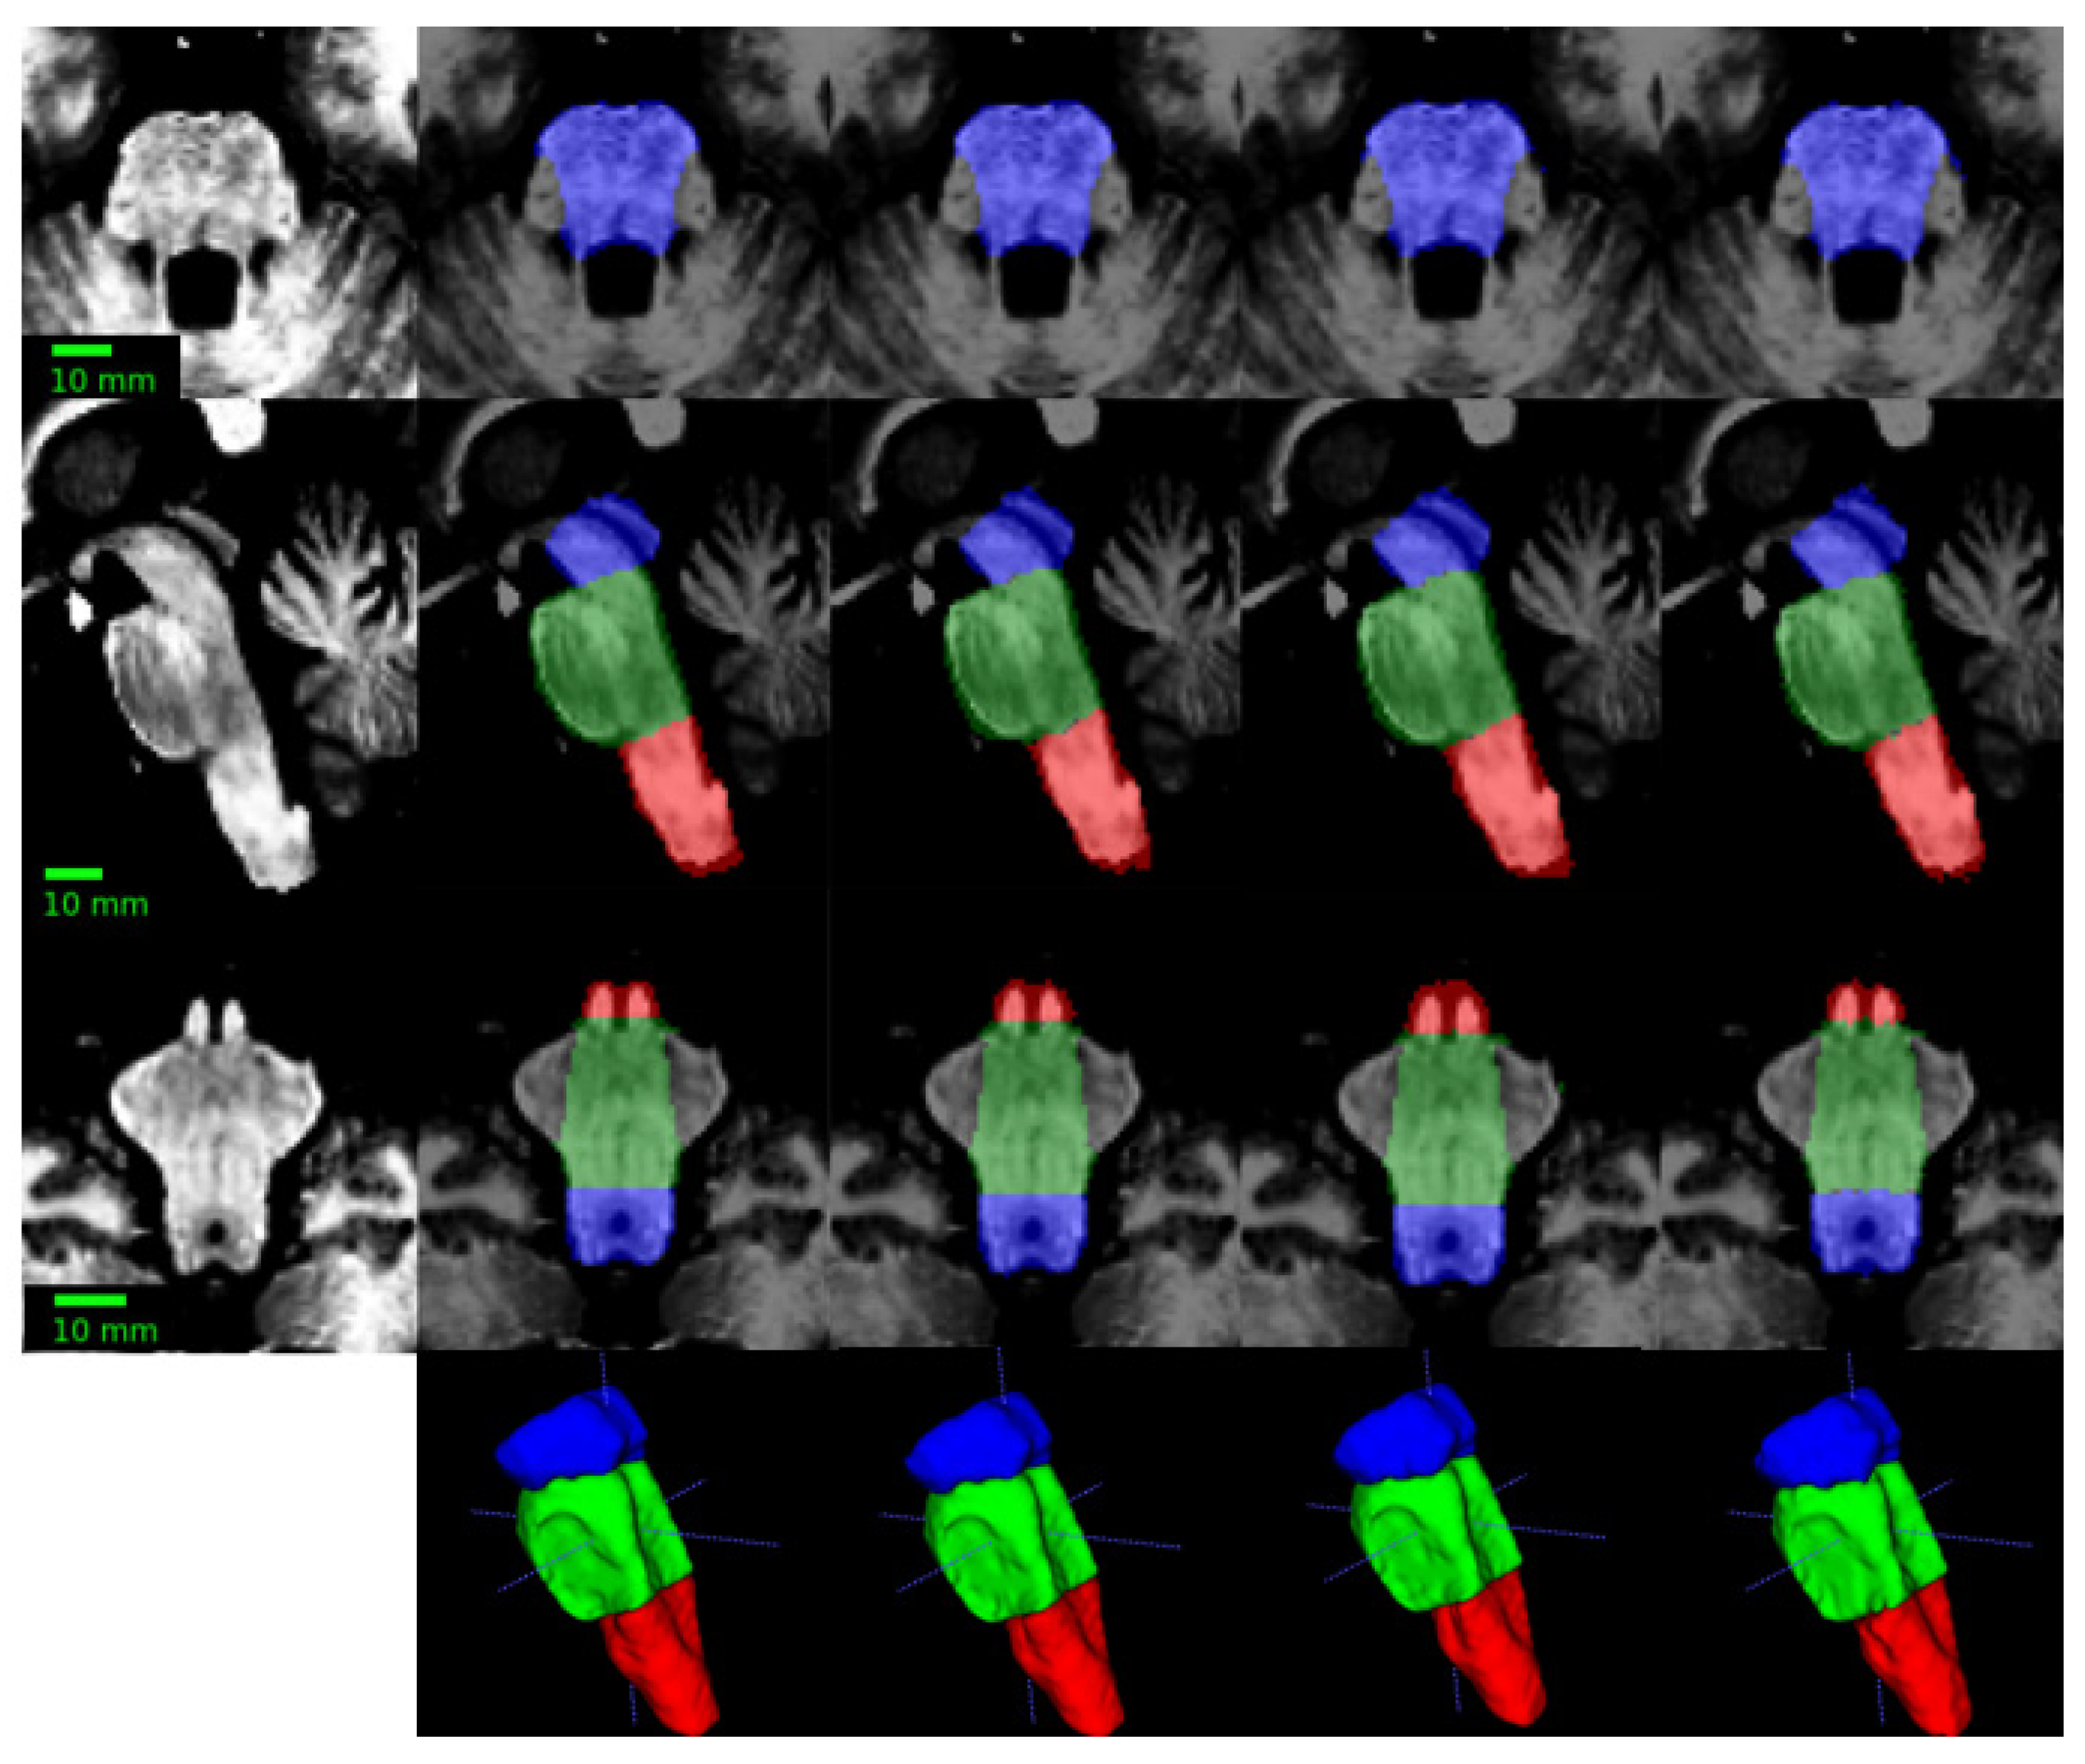

Table 1.
Mean dice scores and stdev achieved in evaluations.
| Label | Mean DSC±stdev | |||
|---|---|---|---|---|
| This research | [42] | Han et al.[41] | Magnusson et al.[50] | |
| Mesencephalon | 0.96±0.022 | 0.91±0.023 | 0.93±0.019 | 0.89±0.031 |
| Pons | 0.96±0.015 | 0.93±0.016 | 0.94±0.013 | 0.91±0.029 |
| Medulla | 0.95±0.021 | 0.91±0.022 | 0.92±0.021 | 0.91±0.023 |
| Full brainstem | 0.96±0.008 | 0.94±0.008 | 0.95±0.007 | 0.93±0.013 |
Table 2.
Mean volumes for manifest SCA2 patients, preclinical and control subjects. P: p-values from Kruskal—Wallis test.
Table 2.
Mean volumes for manifest SCA2 patients, preclinical and control subjects. P: p-values from Kruskal—Wallis test.
| Brainstem section | Mean volumes (% TICV) | P | ||
|---|---|---|---|---|
| Patients | Preclinical | Controls | ||
| Mesencephalon | 0.4 | 0.44 | 0.48 | 0.007 |
| Pons | 0.47 | 0.76 | 0.82 | < 0.0001 |
| Medulla | 0.26 | 0.29 | 0.31 | 0.00012 |
| Whole brainstem | 1.12 | 1.49 | 1.62 | < 0.0001 |
Disclaimer/Publisher’s Note: The statements, opinions and data contained in all publications are solely those of the individual author(s) and contributor(s) and not of MDPI and/or the editor(s). MDPI and/or the editor(s) disclaim responsibility for any injury to people or property resulting from any ideas, methods, instructions or products referred to in the content. |
© 2025 by the authors. Licensee MDPI, Basel, Switzerland. This article is an open access article distributed under the terms and conditions of the Creative Commons Attribution (CC BY) license (http://creativecommons.org/licenses/by/4.0/).
Copyright: This open access article is published under a Creative Commons CC BY 4.0 license, which permit the free download, distribution, and reuse, provided that the author and preprint are cited in any reuse.


