
Submitted:
06 May 2025
Posted:
07 May 2025
You are already at the latest version
Abstract
Blindness and low vision are increasing serious public health issues that affect a significant percentage of the population worldwide. Vision plays a crucial role in spatial navigation and daily activities. Its reduction or loss creates numerous challenges for an individual. Assistive technology can enhance mobility and navigation in outdoor environments. In the field of orientation and mobility training, technologies with haptic interaction can assist individuals with visual impairments in learning how to navigate safely and effectively using the sense of touch. This paper introduces a virtual reality platform as a groundbreaking tool for developing navigation techniques within a safe yet realistic environment. Following extensive optimization, we present a visual representation that accurately simulates various 3D tile textures using graphics replicating real tactile surfaces. We conducted a user interaction study in a virtual environment consisting of 3D navigation tiles enhanced with tactile textures, placed appropriately for a real-world scenario, to assess user performance and experience. The study also assess the usability and User Experience of the platform. The findings contribute to developing of novel navigation techniques for individuals with visual impairments.
Keywords:
visual impairment
; tactile paving
; haptic feedback
; human-computer interaction
; virtual reality
; orientation and mobility
; assistive technology
; user experience
1. Introduction
The population with visual problems has increased over the past two decades. Visual impairment affects hundreds of millions globally and manifests in various forms and severities. Vision loss significantly impacts individuals’ quality of life and daily functioning. A 2015 World Health Organization’s (WHO) study reported a reduction in blindness prevalence from 0.75% in 1990 to 0.48% in 2015, with moderate to severe vision loss decreasing from 3.83% to 2.90% [1]. A 2020 WHO report estimates that approximately 2.2 billion people worldwide have low vision [1]. The projections for the future are concerning. The number of people affected by these conditions is estimated to increase significantly in the coming years. Specifically, the affected individuals are expected to reach nearly 115 million by 2050. Contributing factors include population growth and aging, increasing diabetes prevalence, one of the leading causes of blindness, urbanization with poor environmental conditions, and limited access to healthcare, resulting in delays in diagnosis and treatment.
For individuals with visual impairments, independence and self-confidence in performing daily activities are significantly affected. Blindness affects both the psychological well-being and the practical ability of individuals to function independently. The main areas include:
- Independence (daily activities, mobility, use of public transportation)
- Self-confidence (reduced self-esteem, decreased confidence in their abilities)
- Emotional impact (influence on social relationships, isolation, social prejudice and stereotypes, social activity, grouping)
A decline in quality of life and productivity, particularly among older adults, imposes significant economic costs on society, including increased expenditures for long-term care [2]. Most studies emphasize that reduced quality of life primarily concerns elderly populations. The study by Tore Bonsaksen et al. expands the literature by showing that variations in quality of life occur across adults of all age groups [3]. Moreover, the findings suggest that these differences are mainly found at higher quality of life, as individuals with visual impairments tend to adapt more comfortably to intermediate levels. The results indicate that visual impairment hinders individuals from attaining the highest levels of their perceived ideal quality of life. The extent to which these effects are felt depends on how well a society has created the appropriate conditions for people with vision impairments to live socially active, meaningful, and fulfilling lives.
Factors such as functional independence, community inclusion, and satisfaction with daily life and employment can improve quality of life. A related study conducted in Taiwan [4] examines how visual impairment influences social participation, intending to develop interventions that promote inclusion and well-being among individuals with visual disabilities. Overall, the study underscores the need for policies that enhance access to employment and support independent living for individuals with visual impairments.
This research focuses on mobility and navigation challenges faced by individuals with visual impairments in urban environments. Specifically, the difficulties they face are centered on:
- Outdoor navigation (safety while moving, risk of traffic accidents, navigating routes without assistance)
- Public transportation usage (inability to orient themselves at stations, difficulty accessing vehicles)
- Sensory-guided routes (tactile paving and other guidance technologies, use of tools such as GPS and navigation devices)
- Indoor orientation (difficulty navigating enclosed environments, need for voice guidance systems)
In recent years, modern object positioning detection systems have been developed. These systems utilize a combination of radio frequency technologies, sensors, and vision-based methods, including GPS, WPS, RFID, cellular-based systems, UWB, WLAN, and Bluetooth. In their study, Hui Liu et al. [5] review these technologies and conclude that new hybrid positioning algorithms are needed to integrate the strengths of the existing methods. Many major cities have embraced the concept of accessible tourism, which emphasizes that the built environment should be usable by individuals with diverse abilities [6]. This approach encourages individuals with disabilities to travel to these cities without experiencing feelings of isolation, fear, or insecurity. Tactile ground surface indicators are an effective tool in these cities to ensure safe mobility for blind individuals. These indicators were first implemented in Okayama, Japan, in 1967. They are mostly embossed square tiles that indicate direction, change of direction, hazard zones, and service points [6] [7]. Architecturally, these are textured surfaces made from durable materials such as steel, granite, or hard rubber, and feature contrasting colors like red and yellow to ensure they are easily perceptible and recognizable by touch. The tiles design and strategic placement in urban environments is a critical consideration. However, it has been observed that while tactile surfaces aid individuals with visual impairments, they may pose obstacles for wheelchair users or elderly individuals [6].
Mobility and navigation in urban environments remain major challenges for individuals with visual impairments. However, with adequate support, targeted training, and the integration of modern technologies, there is considerable potential to enhance their independence and rebuild self-confidence. Orientation and Mobility (O&M) training is a key factor in enabling individuals to move independently in any environment, whether familiar or unfamiliar [2,8].
Navigation aids, such as canes, guide dogs, and assistive technologies, are crucial in enhancing mobility and independence for individuals with visual impairments [9]. However, each of these aids, along with Orientation and Mobility (O&M) training techniques, presents certain limitations and drawbacks. Their effectiveness varies depending on individual preferences, the type of visual impairment, and the specific navigation strategies employed. This highlights the need for consistent and universal navigation aids [10]. A significant concern is that these tools can expose users, particularly trainees, to risks such as falls, injuries, or unintended contact with people or objects [2]. A study involving students with visual impairments investigated the challenges encountered during Orientation and Mobility training [8]. Commonly reported challenges include difficulty recognizing obstacles while in motion, increased risk of accidents, and limitations in self-protective behaviors.
To address these issues, we propose an immersive virtual reality experience for guided movement, specifically designed for individuals who are blind, incorporating haptic feedback technology. Within a safe environment, participants can work and train, while also quantitative and qualitative data can be collected in real time.
2. Related Work
Although research specifically addressing the simulation and interaction with tactile paving in urban environments for individuals with visual impairments remains limited, several studies have explored related domains using virtual reality (VR) and augmented reality (AR) technologies to improve navigation and mobility. In their study, Fabiana Sofia Ricci et al. [2] examine the use of virtual reality as a tool for mobility and orientation training among individuals with visual impairments. The virtual environment designed in Unity and the use of the Oculus Quest VR headset offer interactive training through haptic, visual, and auditory feedback. The study focuses on simulating glaucoma, during which users demonstrated decreased performance in orientation and mobility assessments. Additionally, participants reported high levels of engagement and immersion in the VR environment. The platform proved effective in raising awareness about the challenges of visual impairments.
In their study, Alice Lo Valvo et al. present ARIANNA+ [10], a navigation system that uses computer vision [11], machine learning [12], and augmented reality (AR) to support the mobility of individuals with visual impairments. Essentially, ARIANNA+ is an enhanced version of the original ARIANNA system [13], which assists users in following predefined routes in both indoor and outdoor environments. Testing demonstrated that the system achieves high accuracy in guiding users and recognizing landmarks using machine-learning techniques. Leveraging technologies such as ARKit, SceneKit, convolutional neural networks (CNNs), and optical flow tracking, ARIANNA+ delivers an innovative and accessible navigation solution operable on a standard smartphone. Similar research deals with the development of autonomous navigation systems , presenting SEVN (Sidewalk Environment for Visual Navigation) an innovative navigation system based on reinforcement learning (RL) [14]. The study investigates the system’s ability to accurately reach designated destinations using multimodal input data. Experimental results showed a 74.9% success rate, indicating promising performance but also highlighting the need for further research to improve generalization and efficiency. Many navigation applications use various spatial landmarks to help users orient themselves and navigate safely. However, there is a lack of systematic categorization and integration of these landmarks within navigation systems. A related study addresses this gap by categorizing the most frequently used landmarks, based on interviews with individuals who are blind [15]. The landmarks are classified into those detectable by touch (e.g., tactile floors, stairs, building corners) and those that confirm the user is on the correct path (e.g., auditory signals, traffic light signals). The study concludes that incorporating these landmarks into mapping algorithms and route planning can significantly enhance navigation for individuals with visual impairments. To further enhance and facilitate this integration, specific geometric features and constraints were established for each type of landmark. For instance, tactile flooring is modeled as a 400×400 mm rectangle, while pedestrian crossings are represented as rectangular areas connecting the BEVs (Built Environment Vertices) on either side of the street [15].
In a related experiment, nine distinct geometric patterns were tested for their ability to convey haptic properties within a virtual 3D environment [16]. Using the H3D software and the Touch Haptic Device (Phantom Omni), the study examined users’ ability to recognize and differentiate between the nine patterns. Users could distinguish the different textures, with varying recognition rates for each. The VirtuNav system is an innovative navigation system that offers independence and autonomy [17,18]. It combines virtual reality (VR), haptic feedback, audio cues, and advanced navigation algorithms to assist users in exploring indoor spaces. The system reconstructs 2D floorplans into immersive 3D environments using the X3D graphical format to generate detailed scenes and models. Obstacle recognition in the scene is achieved using image processing algorithms. Participants using the Novint Falcon 3-degrees-of-freedom (DoF) Haptic Device demonstrated improved spatial awareness over time, with concurrent reductions in collisions during repeated trials. The transfer of knowledge from the virtual to the real environment was successful. The article by Suayder M. Costa et al. proposes an innovative navigation system combining visual attention and haptic guidance [19]. This research focuses on a machine learning framework designed to detect optimal navigation paths using weakly supervised learning, requiring minimal human intervention. Haptic feedback is achieved through vibrations with accurate guidance, even in complex environments. Another noteworthy innovation is Virtual Paving [20], which supports independent navigation through non-visual sensory feedback. Its design guidelines are informed by interviews and usability tests with blind individuals, aiming to facilitate smooth and efficient walking experiences. Feedback is delivered through a wearable, everyday-use backpack. Trial evaluations indicated that participants were able to navigate smoothly along primary pathways measuring 2.1 meters in width. Matthew S. K. Yeo's research [7] is based on an effort to combine hazard detection methods while robots move through public spaces with visual and haptic tools. The approach enhances conventional tactile paving to convey additional spatial hazard information. This experimental tactile paving design enables robots to interpret embedded information using a custom TSM haptic detection system in combination with a graph neural network (GNN). Experimental results demonstrated a 71.6% improvement in proactive hazard detection capabilities.
3. Materials and Methods
3.1. Short description
This section presents the implementation of an application designed to train and familiarize blind individuals with navigating pathways using virtual 3d haptic tactile paving tiles. The section begins by introducing the hardware and software components, along with the experimental conditions and key design considerations. The focus then shifts to the environment's design, detailing the haptic elements and the tasks assigned to participants within the platform. Next, the experimental simulation is presented along with the hypotheses underlying the experiment and the statistical methods used to test them. The virtual reality platform is intended to equip specialists with a tool for teaching visually impaired individuals to navigate in an informed, effective, and safe manner, while enhancing their engagement through an immersive virtual experience.
3.2. Software and Device
To create the virtual environment, the Unity platform has been selected among other available options. According to research, it is a popular free software development tool primarily used for creating games and applications with interactive 3D and 2D graphics [21,22]. It offers robust tools for graphics development, user interaction, and scene management. Unity supports a wide range of platforms, including PCs, consoles, mobile devices, and VR systems, enabling developers to deploy applications across diverse environments. The platform utilizes the C# programming language and provides extensive libraries and tools for developing, designing, and integrating graphics and interactive elements.
The haptic device used to interact with the virtual environment is the “Touch”, developed by 3D Systems (Figure 1). The “Touch” is an electromechanical device designed to provide kinesthetic feedback by simulating the sensation of physical objects through resistance to the user’s movements. This enables users to "feel" different textures and shapes, and to interact with virtual objects via a contact and deformation algorithm [23]. The device is commonly used in VR applications, medical simulations, training scenarios, and fields that demand precise manipulation of virtual models, helping reduce product design and development costs [24]. The device features a stylus with three degrees of freedom (DOF) of motion, which provides resistance or “feedback” to mimic the sensation of physical objects, such as touching hard or soft surfaces. Previous studies have evaluated the device in human-machine interaction contexts, particularly for haptic guidance applications [23]. A key design consideration for the application was identifying the device’s optimal operating zone and effective working area [25]. The device’s structural features and capabilities aligned well with the application’s interaction requirements. It supports 3-DOF force feedback and 6-DOF positional sensing [26].
3.3. Experimental Design
Tactile paving surfaces play a crucial role in assisting individuals with visual impairments by helping them orient themselves and detect potential hazards. However, significant variations in the technical implementations across countries may lead to confusion for users. Literature review identified diverse implementation approaches of tactile flooring at bus stops in various countries [6]. Tactile paving tiles are designed to provide orientation and safety information to visually impaired individuals through touch, either via the feet or a cane. The primary pattern types include linear grooves or ridges, which indicate the direction of movement and are typically installed along pathways and corridors leading to key locations. Another common pattern consists of round domes, which signal caution or stopping points. These are usually placed before turns or intersections to prompt increased environmental awareness near platform edges or information points. Studies evaluating the effectiveness of tactile paving at pedestrian crossings for visually impaired individuals have shown that well-designed tactile guides positively impact safety and navigation [28]. In our work, the 3D modeling of the guidance tiles followed standards set by Greek legislation, specifically Government Gazette No. 2, dated December 7, 2022, Article 7 [29]. Tile patterns (Figure 2 and Table 1) were selected based on their prescribed textures, dimensions, and color specifications. In the virtual interaction environment, regulations were adhered to concerning tile size, the distance from the pedestrian free-walk zone and building line, and the width of the blind guidance path. At points where the direction changes perpendicularly, three Type A tiles are placed perpendicular to the pathway to serve as a warning. The table below presents the tile types designed and used in our application. Type A is further categorized into Type A1 and Type A2, depending on whether it is used for directional guidance (aligned with movement) or as a turning warning (perpendicular to movement).
Designing interactive systems remains a complex endeavor, particularly due to the diversity of users, which necessitates interfaces that are intuitive, accessible, and adaptable to varying levels of user experience. In his study, Guerra A. [30] proposes a model that integrates technological innovation with sustainable design principles, drawing on craft-based methodologies and strongly emphasizing interdisciplinary collaboration.
This study investigates whether blind and blindfolded users can recognize tactile guidance tiles accurately. Additionally, we assess users’ ability to navigate a predefined path, designed according to Greek legislation on tactile guidance systems, using only their sense of touch. Specific haptic parameters were assigned to each guidance tile to support tactile differentiation. The parameters used to distinguish tile textures included stiffness, damping, static friction, and dynamic friction. Multiple value combinations for each parameter were tested in a laboratory setting. These tests produced varying force feedback responses and distinct texture perceptions among the users. Three optimized combinations, referred to as Tile Presets, were selected based on the results, as presented in Table 2. These combinations were chosen to maximize perceptual discrimination during tactile interaction and to reflect the natural material of the tile as closely as possible. Furthermore, the application allows users to customize the collider size, as detailed in Table 3.
Moreover, our aim is to design virtual spaces with tactile interaction that meet the accessibility standards required for blind users. This implies that the integration of both tactile and auditory feedback in a harmonized manner, is essential for enhancing the user experience of individuals who are blind. This aligns with the findings of Sara Alzalabny et al. [31], who combines tactile and auditory feedback in user interface design. In a multimodal system, coordinating the integration of interaction modes is vital to ensure no conflicts arise. This research investigates the key aspects of multimodal interaction, including haptic interaction, offering insights into their practical application in real-world environments [32].
To achieve a more realistic experience, we added audio messages to the application, complementing the haptic and visual information. Audio feedback is crucial in enriching the user experience in haptic applications. In our implementation, audio cues inform users of ongoing actions, alert them to errors, and provide confirmation of successful interactions.
3.4. Experimental Conditions
The experiment consisted of four scenarios, one educational and three experimental. These were conducted with participants who were either totally or partially blind, as well as with sighted individuals, blindfolded. Flamine Alary [33] revealed that blind individuals can outperform sighted individuals in specific haptic discrimination tasks. Other studies also indicate that blind individuals possess superior tactile acuity, defined as the ability to perceive fine haptic differences, compared to their sighted counterparts [34]. Despite differences in tactile ability between sighted and blind users, haptic applications must be designed to ensure accessibility and comprehensibility for users of all visual abilities. Before beginning the tasks, all participant groups attended a familiarization session in which the experimental procedures and rules were clearly explained. During this session, participants were allowed to familiarize themselves with the haptic device and its controls through guided instructions and brief practice activities.
The study involved 19 participants in total, comprising 9 men and 10 women , most aged between 36 and 45. Four 4 participants had partial blindness, 2 had total blindness, and 13 were sighted individuals. The experiment took place in a quiet, controlled laboratory environment. Each participant was seated at an individual workstation equipped with a Touch haptic feedback device and a laptop running the interactive application (Figure 3).
Before the start of the procedure, participants were fully briefed on the study’s objectives and provided informed consent in accordance with ethical research guidelines. Participants then completed an initial tutorial task designed to familiarize them with the virtual environment, the haptic device, the various tactile tile textures and the audio messages. During interaction with the tile patterns, users were given the opportunity to adjust the Tile Preset (Table 2) and Collider Preset settings (Table 3), enabling them to select the combination that best facilitated haptic texture perception. In this phase, users were invited to freely explore the tile surfaces and the surrounding virtual environment, with audio messages offering guidance for scene navigation. Subsequently, participants completed a five-step movement test in which they were asked to identify the five tile types (Table 1). Each tile type appeared once per trial in a randomized sequence along the haptic five-step path. The application recorded both the accuracy of tile recognition and the total duration of user interaction. In the subsequent condition, participants navigated two urban scenarios, one with low difficulty (Scenario_2) and one with moderate difficulty (Scenario_3) , featuring structured layouts composed of the previously encountered tile types (Figure 4a, Figure 4b). During navigation along route of Scenario_2 (Figure 4a), participants had direct control over their movement using a keyboard, proceeding along a predefined path. The design of the application did not allow for deviations; any attempt to stray from the designated route triggered an error sound and was recorded as a mistake. In contrast, in Scenario_3 (Figure 4b), route navigation was controlled by the application designer (applicator), who followed the verbal instructions of the user as the latter interacted with the Touch device. At this stage, the design allowed movement outside the tactile path, with the application recording the percentage of relative motion versus total interaction time.
Several studies suggest that the primary challenges of wayfinding are rooted in cognitive processes [35]. Orientation in navigation requires cognitive processes such as determining one’s current position relative to a reference point, selecting a route toward a destination, maintaining that route, and recognizing the endpoint upon arrival. Participants explored the virtual environment using the haptic device, which provided vibrotactile feedback as they moved along or deviated from the designated path. Distinct vibration patterns and audio cues aided participants in perceiving movement direction, staying on course, and making corrections when necessary, thereby delivering essential spatial information throughout the task. Accordingly, the haptic device functioned as an input mechanism for navigation and an output device for delivering vibrotactile stimulation. The application tracked the number of errors (i.e., deviations from the path), movement duration along the path, and total interaction time (Figure 5a, Figure 5b).
The design of the experimental procedure of Scenario_2 and 3 was based on a realistic urban navigation scenario, as individuals with visual impairments might experience it. The platform was developed to simulate a realistic training session, which had a maximum duration of 30 minutes, to minimize potential discomfort caused by prolonged exposure to a virtual reality environment. Specific specifications were established during the experimental phase to achieve this goal. In the initial task, which involved pattern recognition, participants were given a time limit of 5 minutes, so familiarization, after which their performance was recorded. The remaining time (up to 25 minutes) was used to navigate the two routes of Scenario_2 and 3 with increasing difficulty (Figure 4a, Figure 4b). Successful completion of the first route was not a prerequisite for proceeding to the second. In any case, if the participant experienced fatigue or discomfort, they were allowed to terminate the interaction at any time.
Participant performance was evaluated based on total interaction time, tile recognition accuracy, error count, and the duration spent navigating along the intended path. Finally, all participants, regardless of whether they completed the experimental procedure, provided feedback on the application by completing a post-experiment questionnaire (Appendix A).
4. Results
The study’s primary objective was to gain a deeper understanding of how blind users perceive haptic technology through interaction with objects in three-dimensional virtual environments. The following analysis presents the results of participants' interactions across the three experimental scenarios and the questionnaire findings. The findings highlight the participants’ ability to distinguish various texture patterns on pathway virtual tiles within a 3D environment, with the ultimate goal of transferring this perceptual experience to urban navigation in the real world. User performance and evaluation scores were analyzed independently. According to the experimental design, participants interacted with the virtual haptic tiles in three different scenarios (Scenario_1, Scenario_2, Scenario_3). A mathematical model was developed for each scenario to calculate navigation ability, based on the experimental data. The goal of the mathematic formula is to reflect the user’s ability to correctly identify textures, navigate accurately and quickly, and maintain precision in their path without making errors.
Upon completion of the experiment, participants answered a series of 20 questions, 12 based on the USE usability questionnaire and 8 based on the UEQ experience questionnaire. The USE (Usefulness, Satisfaction, and Ease of Use) consists of four thematic sections (Usefulness, Ease of Use, Ease of Learning, and Satisfaction), each comprising three questions. It measures usefulness, ease of use, learning curve, and satisfaction, focusing on the functional aspects of the system. The UEQ (User Experience Questionnaire), consisting of 8 questions, examines more emotional dimensions, such as attractiveness, innovation, and the overall user experience with the system. Combining the two questionaires helped us gain a complete picture of the practicality and the emotional interaction of the users.
4.1. Analysis of the Experimental Procedure Results
During the first scenario, the participants were asked to recognize each of the five tile patterns of Figure 2. We calculate the overall Ability Score (AS1) for each participant, based on the recognition rate (A) and the interaction time (T1). Using the mathematical equation (1), we defined a performance function that rewards high recognition accuracy (A) and penalizes long interaction times (T1).
Ability Score (AS1) = A * (T1min/T1)b
A: the normalized recognition rate, with values ranging between [0,1]
T1: the total interaction time in Scenario_1
T1min: the shortest interaction time among all participants
b: the weighting factor (we set b = 1)
A participant exhibiting a high recognition rate but a slow interaction speed will demonstrate low overall proficiency. Conversely, a participant with a moderate recognition rate who interacts rapidly will also not achieve a high Ability Score. The highest Ability Score is attained when a high recognition rate is combined with rapid interaction.
In the second (Scenario_2) the participants were asked to virtually navigate along a predefined path in Unity that is composed of various virtual tactile tiles (Figure 4a). For the Scenario_2, we calculate the overall Ability Score 2 (AS2) for each participant based on two criteria: whether the navigation task was completed (C2) and the interaction time (T2). Errors in navigations, such as Collisions and wrong deviations from the tactile path, lead to longer completion times, which in turn directly affect the navigation ability score (AS2).
The Ability Score 2 is based on mathematical equation (2). The performance function AS2 penalizes errors and delays, assigns zero performance in case of incomplete execution, and rewards fast, accurate, and complete task completion. This specific metric was designed by Yokoyama et al. [36] to evaluate navigation performance by considering both the success and the speed of completion.
Ability Score 2 (AS2) = C2 * (T2min/T2)
C2: Task completion status, with values 1 for completion and 0 for non-completion
T2: Total interaction time in Scenario_2
T2min: Fastest interaction time among participants who completed the task
Similarly, for Scenario_3, we calculate the overall Ability Score (AS3) for each participant when they were navigated through virtual path of Scenario_3 in Figure 4b.
Ability Score 3 (AS3) = C3 * (T3min/T3)
C3: Task completion status, with values 1 for completion and 0 for non-completion
T3: Total interaction time in Scenario_3
T3min: Fastest interaction time among participants who completed the task
If participants fail to complete a task, their ability score is set to zero. For completed tasks, the ability index is determined by the completion time.
We calculate the average navigation ability ASmean in equation (4) and the overall performance AStotal in equation (5) for each participant.
ASmean = (AS1 + AS2 + AS3)/3
AStotal = AS1 + AS2 + AS3
In Table 4, the average, standard deviation, the min and max values of AS1, AS2 and AS3 for all category users are presented.
4.1.1. Scenarios Comparison
We categorize the scenarios into two groups. The first group is consisted of Scenario_1, which assesses tile recognition ability. The second group consists Scenario_2 and Scenario_3, which focus on evaluating navigation ability. During the analysis of the results, minimum fulfillment time were used for each user per scenario (66, 193, and 188 seconds, respectively), meaning that these times served as the basis for normalization, for the calculation of AS1, AS2, and AS3.
In Scenario_1, a lower mean performance is observed compared to Scenarios_2 and 3, indicating that tile recognition may be more demanding or may require a different set of skills than navigation. This finding can be explained by the fact that recognition tasks demand greater precision and clarity in responses, whereas in navigation tasks, users were able to make faster decisions by relying on pre-existing tile sequence rules, thus requiring less interaction time. Moreover, Scenario_1 exhibits lower performance variability (standard deviation = 0.18), suggesting greater homogeneity among users. In contrast, Scenario_2 presents the highest variability (standard deviation = 0.26), indicating a wider range of navigation abilities. This variation is attributed to the adoption of diverse navigation strategies by users: individuals with visual impairments employed techniques they already use in real-world environments, while sighted users, encountering these tactile patterns for the first time, developed new interaction strategies.
The average Ability Score in Scenario_2 (AS2) is higher than Scenario_3. This indicates that users had improved performance in navigation in Scenario_2 than Scenario_3. This outcome can be attributed to the reduced complexity of Scenario_2, as the environment in Scenario_2 is consisted solely of turns, without the presence of intersections or other complex navigation elements. However, it was observed that several users encountered difficulties distinguishing between turn warning tiles (Type A2) and hazard warning tiles (Type D). Additionally, the larger standard deviation observed in Scenario_2 suggests greater variability in user performance, which may be associated with different levels of familiarity with the navigation system. This variability was also influenced by the amount of time each user dedicated to familiarizing themselves with the device and the overall application environment. Navigation times varied significantly, with some users exhibiting either considerably higher or notably lower times compared to the average, potentially indicating difficulties or errors during navigation.
4.1.2. User Performance Analysis
Before proceeding to the individual analysis of user performance, we aim to establish a categorization of navigation ability levels according to the following methodology:
- High ability: User_AS_mean ≥ 0.75
- Moderate ability: 0.50 ≤ User_AS_mean < 0.75
- Low ability: User_AS_mean < 0.50
Overall, no user managed to exceed the 0.75 threshold, which we defined for "High Ability." Five users demonstrated moderate ability, while the majority of users (74%) exhibited low navigation and recognition ability. Only one user achieved a performance of ASmean = 0.72, almost reaching the "High Ability" threshold (>0.75). The low values of ASmean indicates potential difficulties in using the system or making incorrect decisions during the execution of the scenarios.
Furthermore, it is observed that the choices of "Tiles Preset" and "Collider Preset" of Table 2 and Table 3 influence the navigation ability score AS. Specifically, "Tiles Preset 1" and "Collider Preset 1" are associated with higher navigation ability, while users who worked with "Tiles Preset 2" and "Collider Preset 2" demonstrated lower performance.
The performance of blind and sighted users across the three distinct scenarios (AS1, AS2, AS3), reveal substantial differences both in mean performance and in performance variability between the two groups of users. In Scenario_1, blind users exhibited a lower mean score of AS1(0.25) compared to sighted users (0.34), accompanied by an exceptionally low standard deviation (0.03), indicating systematic barriers but also a high degree of internal consistency within the group. This happened because sighted users could see the shape and layout of the tiles before the experiment began. In contrast, blind users could only touch them through the "Touch" device, without having a visual image. Sighted users had an advantage, as they were able to visually perceive the tiles during the training interaction. In contrast, in Scenario_3 (AS3) , blind users outperformed sighted users (mean score of AS3 for blind users 0.68 vs 0.30 for blindfolded users). Scenario_2 (AS2) demonstrated intermediate results (mean score of AS2 = 0.52 for blind users versus 0.44 for sighted users). Overall, the results highlight the importance of designing user interfaces to be accessible for individuals with different abilities, both cognitive and sensory. This emphasizes the need for scenarios to be adapted to the needs of each user group.
4.2. Analysis of the Results of the Evaluation Questionnaire
All participants, comprising 10 women and 9 men, responded to the evaluation form provided at the conclusion of the experiment. The majority of participants (52.6%) were aged between 36 and 45 years, and a significant proportion (56.2%) were employed in the public sector. For the analysis of the responses, a total of 19 participants were considered. A Likert-type questionnaire, with a scale ranging from 1 to 5, was used for the 12 usability questions (USE) (Appendix A1), while a 7-point Likert-type scale was employed for the 8 user experience-related questions (UEQ) (Appendix A2). This method allowed for a comprehensive assessment of both the usability and user experience of the system.
In order to normalize and facilitate the comparison of the results, we calculated the average score percentage (RATE) for each question as shown in equation (6) and (7). This approach allowed for a standardized representation of the participants' evaluations, making it easier to interpret and compare the responses across different questions and Linkert scales.
RATE = (SUM * 100)/MAXSUM
MAXSUM = 19(participants) * 5(maximum scale score) or 7(maximum scale score)
The usability evaluation yielded overall very positive results, with all percentages exceeding 85%. The system's utility was rated at 88.8%, confirming that it effectively meets users' needs. Ease of use received a score of 85.6%, while ease of learning reached 86%, indicating that the system is largely user-friendly and does not require significant effort for comprehension. The highest score was observed in user satisfaction (90.5%), suggesting that the overall user experience was exceptionally positive. Despite the excellent results, small improvements in ease of use could further enhance the system's overall efficiency and user experience (Table 5).
The analysis of the User Experience of the UEQ questionnaire in Table 6 revealed an overall highly positive evaluation by the participants. The individual dimensions of the experience, such as supportiveness (88.7%), ease of use (84.2%), efficiency (85.7%), and clarity (83.5%), demonstrated high levels of acceptance, indicating that the system is highly functional and user-friendly. Particularly positive evaluations were recorded in the dimensions of innovation and engagement, with the characteristics "Interesting" (94%), "Inventive" (91.7%), and "Leading edge" (92.5%) receiving the highest percentages, suggesting that our application was regarded as both pioneering and attractive. Despite the generally high satisfaction levels, it is notable that clarity received the lowest (yet still highly positive) score, potentially indicating an area for further improvement. Overall, the findings highlight an extremely positive assessment of the experience by users, with particular emphasis on innovation, engagement, and support.
4. Discussion
This study highlighted the potential of virtual reality (VR) and haptic feedback as training tools for individuals with visual impairments. The quantitative results of Ability scores AS and qualitative results of questionnaires revealed the strengths and limitations of the proposed platform. Based on the questionnaire results, the application received high scores in usability (USE) and user experience (UEQ), with particularly positive responses regarding its innovation and functionality. Nevertheless, during interaction, users pointed out several areas for further improvement. Most participants found it useful to have more time to familiarize themselves with the device, the virtual environment and understand the navigation rules. Difficulties were observed in distinguishing the different haptic tile types (particularly B and C, A2 and D), indicating a need for stronger texture differences or the addition of extra vibration patterns. Suggestions for incorporating auditory stimuli (e.g., natural ambient sounds) and abrupt vibrations upon encountering obstacles would enhance realism and safety. The Touch device caused fatigue after prolonged use due to the requirement of holding it in the air, a common observation among several users. A blind participant suggested alternatives, such as direct interaction with the palm, which could improve comfort. Additionally, blind users reported that, in reality, they prefer tactile paths primarily due to the absence of obstacles rather than the textures themselves, pointing to a need for design reassessment to better align with real-world needs. Future studies should focus on investigating the long-term impact of the platform on actual mobility.
5. Conclusions
Research on tactile paving patterns in virtual reality remains in its nascent stages. Nevertheless, future findings and conclusions derived from such investigations are expected to contribute meaningfully to sustainable development and the enhancement of everyday life , particularly for individuals who are blind or experience significant visual impairments. The present study examined the ability to recognize and distinguish between various tactile paving patterns. A series of experiments involving interactions with virtual three-dimensional models revealed key perceptual characteristics among users. Participants engaged with five distinct paving designs, simulating navigational scenarios within urban environments. The perceptual evaluations indicated that substantial potential exists for improving the design and tactile properties of the virtual haptic tiles, intending to maximize both functionality and user safety.
Author Contributions
Conceptualization, N.T., I.K, and G.K.; methodology, N.T.; software, I.K.; validation, N.T., I.K. and G.K.; formal analysis, N.T.; investigation, N.T.; data curation, G.V and N.T..; writing—original draft preparation, N.T.; writing—review and editing, G.K and S.K..; visualization, I.K.; supervision, G.K.; project administration, G.K. All authors have read and agreed to the published version of the manuscript.
Funding
This research received no external funding.
Institutional Review Board Statement
The study was conducted in accordance with the Declaration of Helsinki, and approved by the Ethics Committee of IHU (91\25-2-2025) on 25 Feb 2025.
Informed Consent Statement
Informed consent was obtained from all subjects involved in the study. Written informed consent has been obtained from the patient(s) to publish this paper.
Data Availability Statement
Data are provided on request.
Acknowledgments
The authors would like to express their sincere gratitude to all the individuals that participated in this study. Εspecially in the members of the "Association of the Blind of Western Macedonia, Greece" and the "Panhellenic Association of the Blind of Central Macedonia, Greece.".
Conflicts of Interest
The authors declare no conflicts of interest.
Appendix A
Appendix A.1. USE Questionnairen
| USE sections | Question | Likert scale (1-5) | |
| Usefulness | It helps me be more effective? | 1 (Strongly Disagree) | 5 (Strongly Agree) |
| It is useful? | 1 (Strongly Disagree) | 5 (Strongly Agree) | |
| It gives me more control over the activities in my life? | 1 (Strongly Disagree) | 5 (Strongly Agree) | |
| Ease of Use | It is easy to use? It is user friendly? |
1 (Strongly Disagree) 1 (Strongly Disagree) |
5 (Strongly Agree) 5 (Strongly Agree) |
| I can recover from mistakes quickly and easily? | 1 (Strongly Disagree) | 5 (Strongly Agree) | |
| Ease of Learning | I learned to use it quickly? | 1 (Strongly Disagree) | 5 (Strongly Agree) |
| I easily remember how to use it? | 1 (Strongly Disagree) | 5 (Strongly Agree) | |
| It is easy to learn to use it? | 1 (Strongly Disagree) | 5 (Strongly Agree) | |
| Satisfaction | I feel I need to have it? | 1 (Strongly Disagree) | 5 (Strongly Agree) |
| I would recommend it to a friend? | 1 (Strongly Disagree) | 5 (Strongly Agree) | |
| It is fun to use? | 1 (Strongly Disagree) | 5 (Strongly Agree) | |
Appendix A.2. UEQ Questionnaire (Short Version)
| UEQ Option A | Likert scale (1 to 7) | UEQ Option B |
| Obstructive | ◦ 1 ◦ 2 ◦ 3 ◦ 4 ◦ 5 ◦ 6 ◦ 7 | Supportive |
| Complicated | ◦ 1 ◦ 2 ◦ 3 ◦ 4 ◦ 5 ◦ 6 ◦ 7 | Easy |
| Inefficient | ◦ 1 ◦ 2 ◦ 3 ◦ 4 ◦ 5 ◦ 6 ◦ 7 | Efficient |
| Clear | ◦ 1 ◦ 2 ◦ 3 ◦ 4 ◦ 5 ◦ 6 ◦ 7 | Confusing |
| Boring | ◦ 1 ◦ 2 ◦ 3 ◦ 4 ◦ 5 ◦ 6 ◦ 7 | Exciting |
| Not interesting | ◦ 1 ◦ 2 ◦ 3 ◦ 4 ◦ 5 ◦ 6 ◦ 7 | Interesting |
| Conventional | ◦ 1 ◦ 2 ◦ 3 ◦ 4 ◦ 5 ◦ 6 ◦ 7 | Inventive |
| Usual | ◦ 1 ◦ 2 ◦ 3 ◦ 4 ◦ 5 ◦ 6 ◦ 7 | Leading edge |
References
- [Online]. Available: https://www.who.int/.
- F. S. Ricci, A. Boldini, M. Beheshti, J. Rizzo and M. Porfiri, "A virtual reality platform to simulate orientation and mobility training for the visually impaired," Virtual Reality, no. 27, pp. 797-814, September 2022. [CrossRef]
- T. Bonsaksen, A. Brunes and T. Heir, "Quality of life in people with visual impairment compared with the general population," Journal of Public Health, no. 33, pp. 23-31, 2025. [CrossRef]
- H.-m. Kim and S.-m. Son, "Impacts of Daily Life and Job Satisfaction on Social Participation of Persons with Visual Impairment," Wiley, 2023. [CrossRef] [PubMed]
- H. Liu, H. Darabi, P. Banerjee and J. Liu, "Survey of Wireless Indoor Positioning Techniques and Systems," IEEE TRANSACTIONS ONSYSTEMS,MAN,ANDCYBERNETICS—PARTC, vol. 37, no. 6, pp. 1067-1080, 2007. [CrossRef]
- M. P. Rosa, G. S. De Mello and S. Morato, "Tactile Paving Surfaces at Bus Stop. The needof Homogeneous Technical Solutions for Accessible Tourism," Journal of Accessibility and Design for All, vol. 11, no. 2, pp. 259-294, 2021.
- "Passive Auto-Tactile Heuristic (PATH) Tiles: Novel Robot-Inclusive Tactile Paving Hazard Alert System," Buildings, vol. 13, no. 10, p. 2504, 2023.
- J. Muhammad, M. Javed Aftab, S. Bano and U. Iram, "Challenges encountered by Students With Visual Impairment in Accessing Orientation and Mobility Training Corresponding Author," Annals of Human and Social Sciences, vol. 5, no. 2, pp. 514-523, 2024. [CrossRef]
- R. W. Emerson and T. McCarthy, "Orientation and Mobility for Students with Visual Impairments:Priorities for Research," International Review of Research in Mental Retardation, vol. 46, p. 253–280, 2014.
- A. Lo Valvo, D. Croce, D. Garlisi, F. Giuliano, L. Giarré and I. Tinnirello, "ANavigation and Augmented Reality System for Visually Impaired People," Sensors, vol. 21, no. 9, p. 3061, 2021. [CrossRef] [PubMed]
- N. Navarro-Guerrero, S. Toprak, J. Josifovski and L. Jamone, "Visuo-haptic object perception for robots: an overview," AutonomousRobots, vol. 47, p. 377–403, 2023. [CrossRef]
- Z. Hu, L. Lin, W. Lin, Y. Xu, X. Xia, Z. Peng, Z. Sun and Z. Wang, "Machine Learning for Tactile Perception: Advancements,Challenges, and Opportunities," Advanced Intelligent Systems, vol. 5, no. 7, p. 2200371, 2023.
- D. Croce, L. Giarre, F. G. La Rosa, E. Montana and I. Tinnirello, "Enhancing tracking performance in a smartphone-based navigation system for visually impaired people," in 24th Mediterranean Conference on Control and Automation (MED), Athens, Greece, 2016.
- M. Weiss, S. Chamorro, R. Girgis, M. Luck, S. E. Kahou, J. P. Cohen, D. Nowrouzezahrai, D. Precup, F. Golemo and C. Pal, "Navigation Agents for the Visually Impaired:A Sidewalk Simulator and Experiments," in Conference on Robot Learning (CoRL), Osaka,Japan, 2019.
- M. Wang, A. Dommes, V. Renaudin and N. Zhu, "Analysis of Spatial Landmarks for Seamless Urban Navigation of Visually Impaired People," IEEE Journal of Indoor and Seamless Positioning and Navigation, vol. PP, no. 99, pp. 1-11, 2023. [CrossRef]
- N. Tzimos, G. Voutsakelis, S. Kontogiannis and G. Kokkonis, "Evaluation of Haptic Textures for Tangible Interfaces for the Tactile Internet," Electronics, vol. 13, no. 18, 2024. [CrossRef]
- C. Todd, S. Mallya, S. Majeed, J. Rojas and K. Naylor, "Haptic-Audio Simulator for Visually Impaired Indoor Exploration," Journal of Assistive Technologies, vol. 9, no. 2, pp. 71 - 85, 2015. [CrossRef]
- C. Todd, S. Mallya, S. Majeed, J. Rojas and K. Naylor, "VirtuNav: A Virtual Reality Indoor Navigation Simulator with Haptic and Audio Feedback for the Visually Impaired," in IEEE Symposium on Computational Intelligence in Robotic Rehabilitation and Assistive Technologies (CIR2AT), Orlando, Florida, USA, 2014.
- S. M. Costa, R. J. P. Damaceno, H. Morimitsu and R. M. Cesar-Jr., "Tactile Path Guidance via Weakly Supervised Visual Attention," in 4th Annual Workshop on The Future of Urban Accessibility (UrbanAccess), Online, 2024.
- S. Xu, C. Yang, W. Ge, C. Yu and Y. Shi, "Virtual Paving: Rendering a Smooth Path for People with Visual Impairment through Vibrotactile and Audio Feedback," Proceedings of the ACM on Interactive, Mobile, Wearable and Ubiquitous Technologies (IMWUT), vol. 4, no. 3, pp. 1-25, 2020.
- P. E. Dickson, J. E. Block, G. N. Echevarria and K. C. Keenan, "An Experience-based Comparison of Unity and Unreal for a Stand-alone 3D Game Development Course," in International Conference on Innovation and Technology in Computer Science Education (ITiCSE), Bologna, Italy, 2017.
- A. Hussain, H. Shakeel, F. Hussain, N. Uddin and T. L. Ghouri, "Unity Game Development Engine: A Technical Survey," University of Sindh Journal of Information and Communication Technology (USJICT), vol. 4, no. 2, p. 73–81, 2020.
- Silva, O. A. Domínguez Ramírez, V. P. Vega and J. P. Ordaz Oliver, "PHANToM OMNI Haptic Device: Kinematic and Manipulability," in Electronics, Robotics and Automotive Mechanics Conference (CERMA), Cuernavaca,Mexico, 2009. [CrossRef]
- H. G. Teklemariam and A. K. Das, "A Case Study of PHANToM OMNI Force Feedback Device for Virtual Product Design," International Journal on Interactive Design and Manufacturing (IJIDeM), vol. 9, no. 4, p. 881–892, 2015. [CrossRef]
- J. S. Martín and G. Trivino, "A Study of the Manipulability of the PHANToM OMNI Haptic Interface," in Third Workshop on Virtual Reality Interactions and Physical Simulations (VRIPHYS), Madrid, Spain, 2006.
- M. Isaksson, B. Horan and S. Nahavandi, "Low-Cost 5-DOF Haptic Stylus Interaction Using Two Phantom Omni Devices," in EuroHaptics (International Conference on Haptics: Neuroscience, Devices, Modeling, and Applications), Tampere, Finland, 2012.
- [Online]. Available: https://www.3dsystems.com/haptics-devices/touch.
- S. Hu, Y. Ma, X. Dong and W. Zhang, "Evaluating the Effectiveness of Street-Crossing Tactile Paving for People with Visual Impairment Using a Structural Equation Model," in 20th COTA International Conference of Transportation Professionals (CICTP 2020), Xi'an, China, 2020.
- G. g. (. o. E. a. Energy), "Gazette of the Government of the Hellenic Republic," Gazette of the Government of the Hellenic Republic, vol. 7, no. 2, December 2022.
- A. Guerra, "Craft-Based Methodologies in Human–Computer Interaction: Exploring Interdisciplinary Design Approaches," Multimodal Technologies and Interaction, vol. 9, no. 2, p. 13, 2025. [CrossRef]
- S. Alzalabny, O. Moured, K. Müller, T. Schwarz and B. Rapp, "Designing a Tactile Document UI for 2D Refreshable Tactile Displays: Towards Accessible Document Layouts for Blind People," Multimodal Technologies and Interaction, vol. 8, no. 11, p. 102, 2024. [CrossRef]
- E. Dritsas, M. Trigka, C. Troussas and P. Mylonas, "Multimodal Interaction, Interfaces, and Communication: A Survey," Multimodal Technologies and Interaction, vol. 9, no. 1, p. 6, 2025.
- F. Alary, M. Duquette, R. Goldsteina, C. E. Chapman, P. Voss, V. La Buissonnière-Arizaa and F. Lepore, "Tactile acuity in the blind: A closer look reveals superiority over the sighted in some but not all cutaneous tasks," Neuropsychologia, vol. 47, no. 10, pp. 2037-43. [CrossRef] [PubMed]
- D. Goldreich and I. M. Kanics, "Tactile Acuity is Enhanced in Blindness," The Journal of Neuroscience, vol. 23, no. 8, p. 3439–3445, 2003. [CrossRef] [PubMed]
- W. Heuten, N. Henze, S. Boll and M. Pielot, "Tactile Wayfinder: A Non-Visual Support System for Wayfinding," in 5ο Nordic Conference on Human-Computer Interaction (NordiCHI 2008), Lund, Sweden, 2008.
- N. Yokoyama, S. Ha and D. Batra, "Success Weighted by Completion Time: A Dynamics-Aware Evaluation Criteria for Embodied Navigation," in 2021 IEEE/RSJ International Conference on Intelligent Robots and Systems (IROS), Prague, Czech Republic, 2021.
Figure 1.
“Touch Haptic Device”, developed by 3D Systems [27].
Figure 1.
“Touch Haptic Device”, developed by 3D Systems [27].
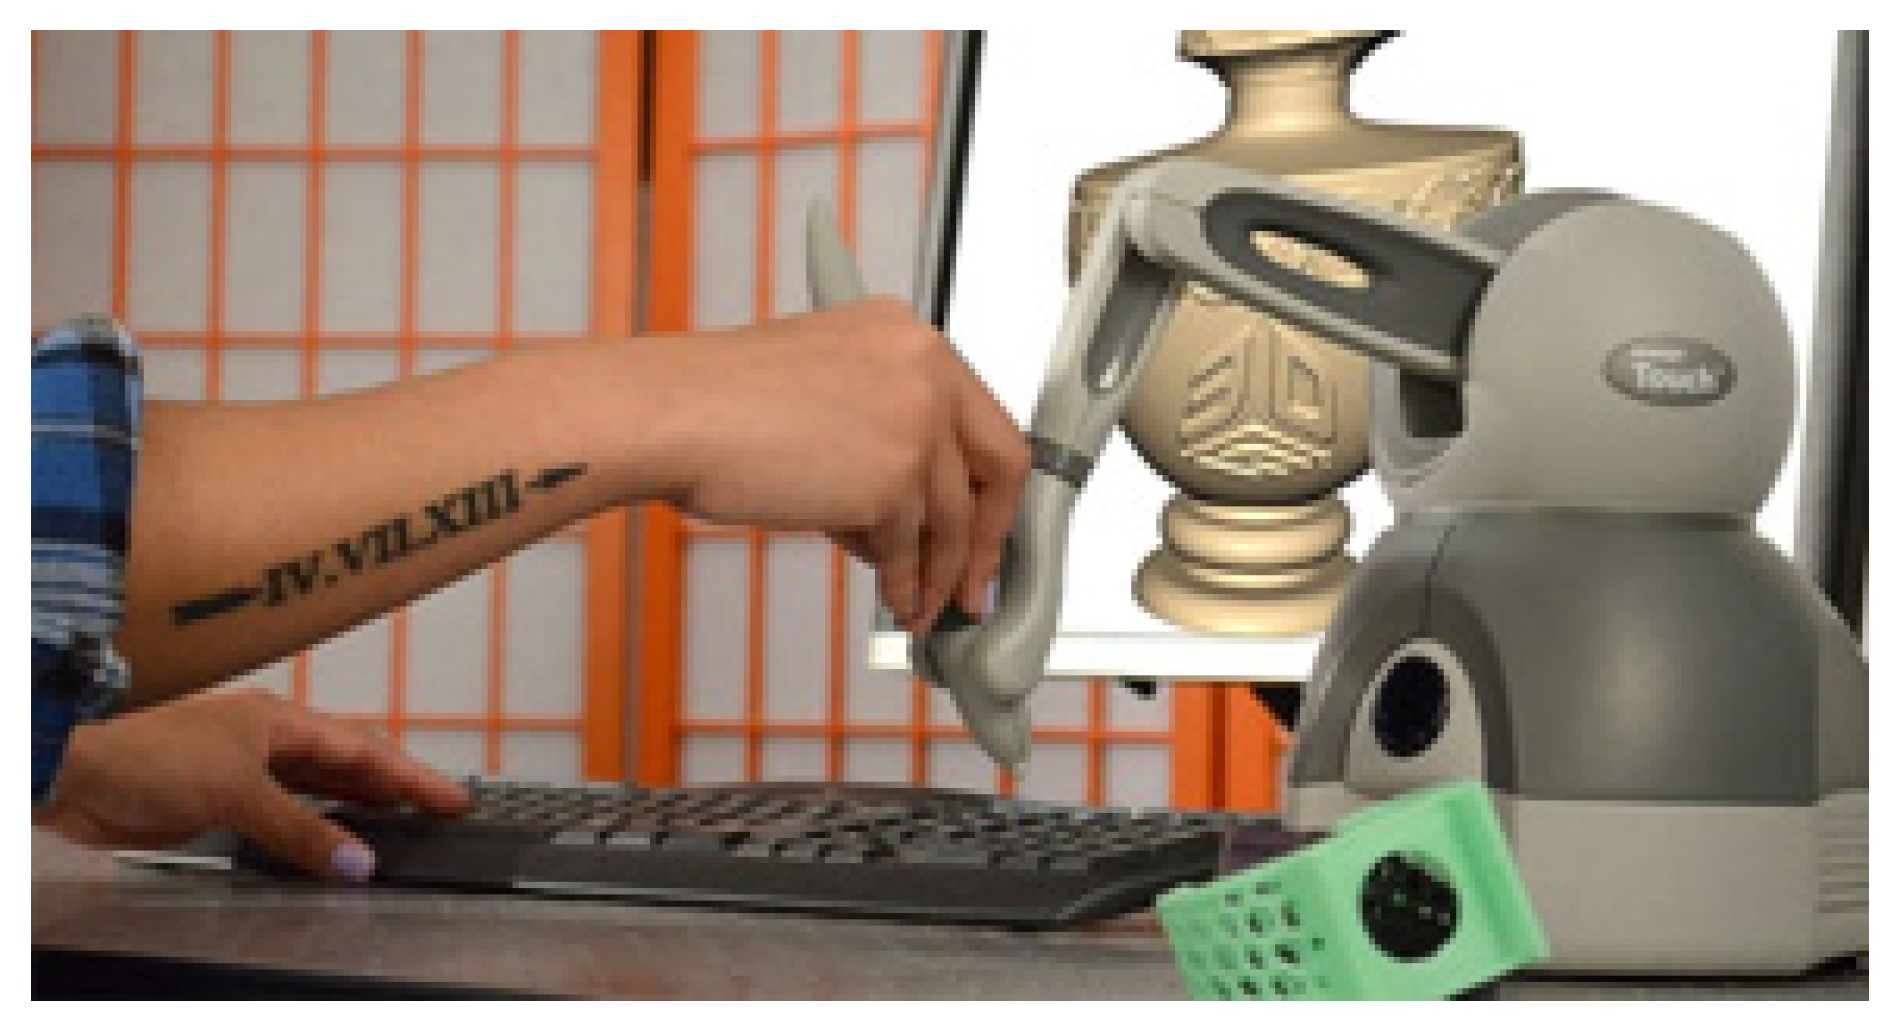
Figure 2.
Paving tile patterns.
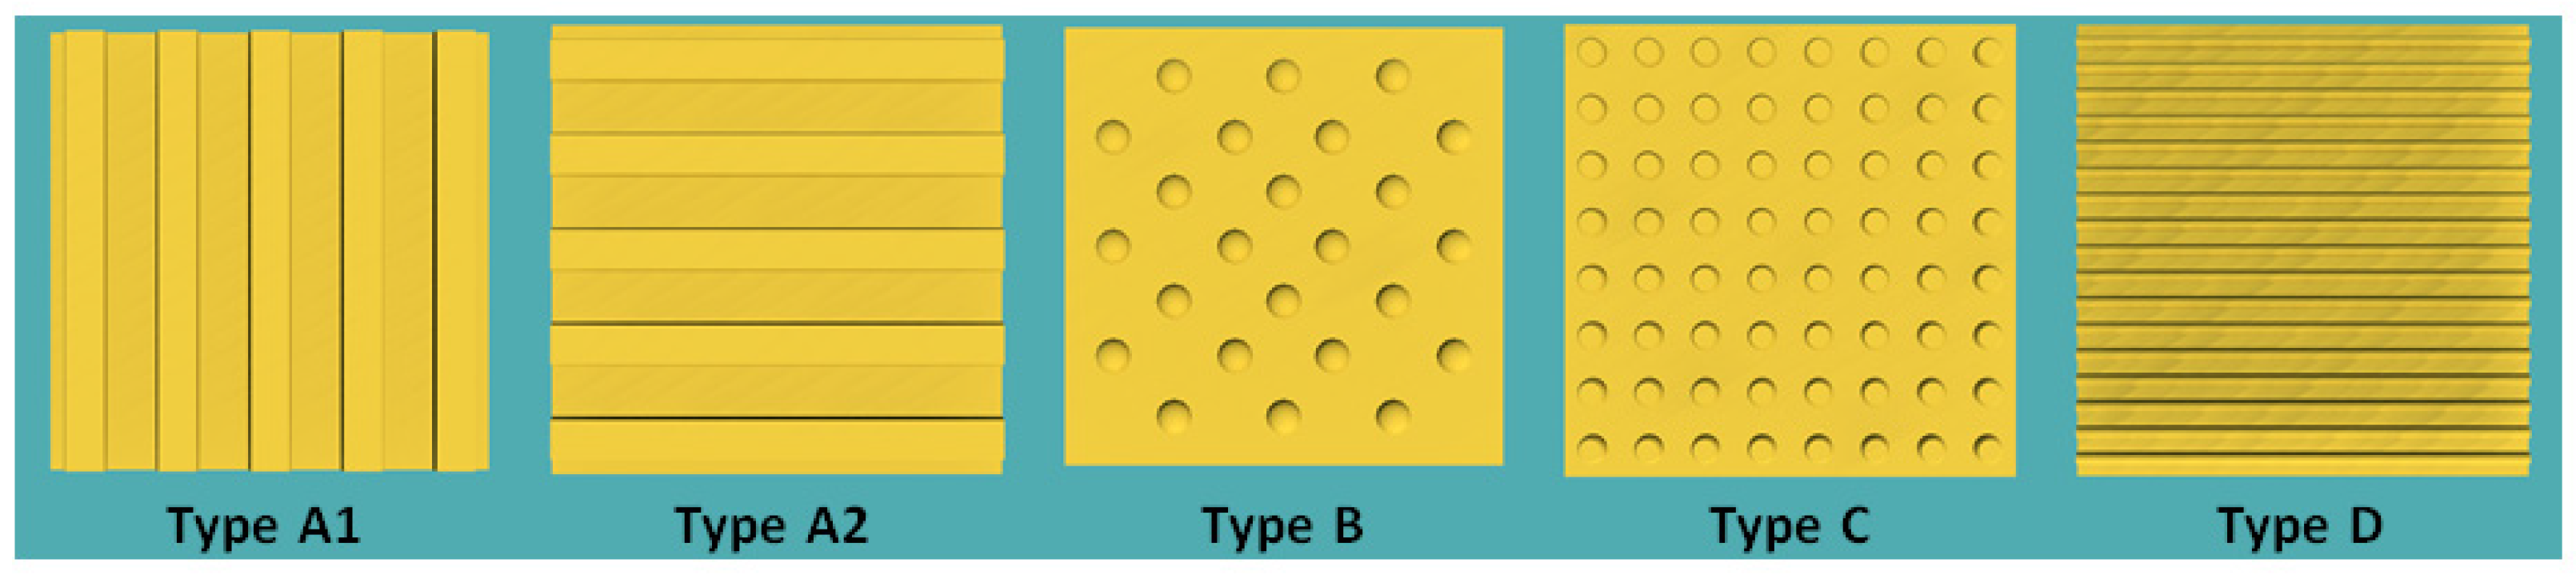
Figure 3.
The Touch device and a computer monitor.
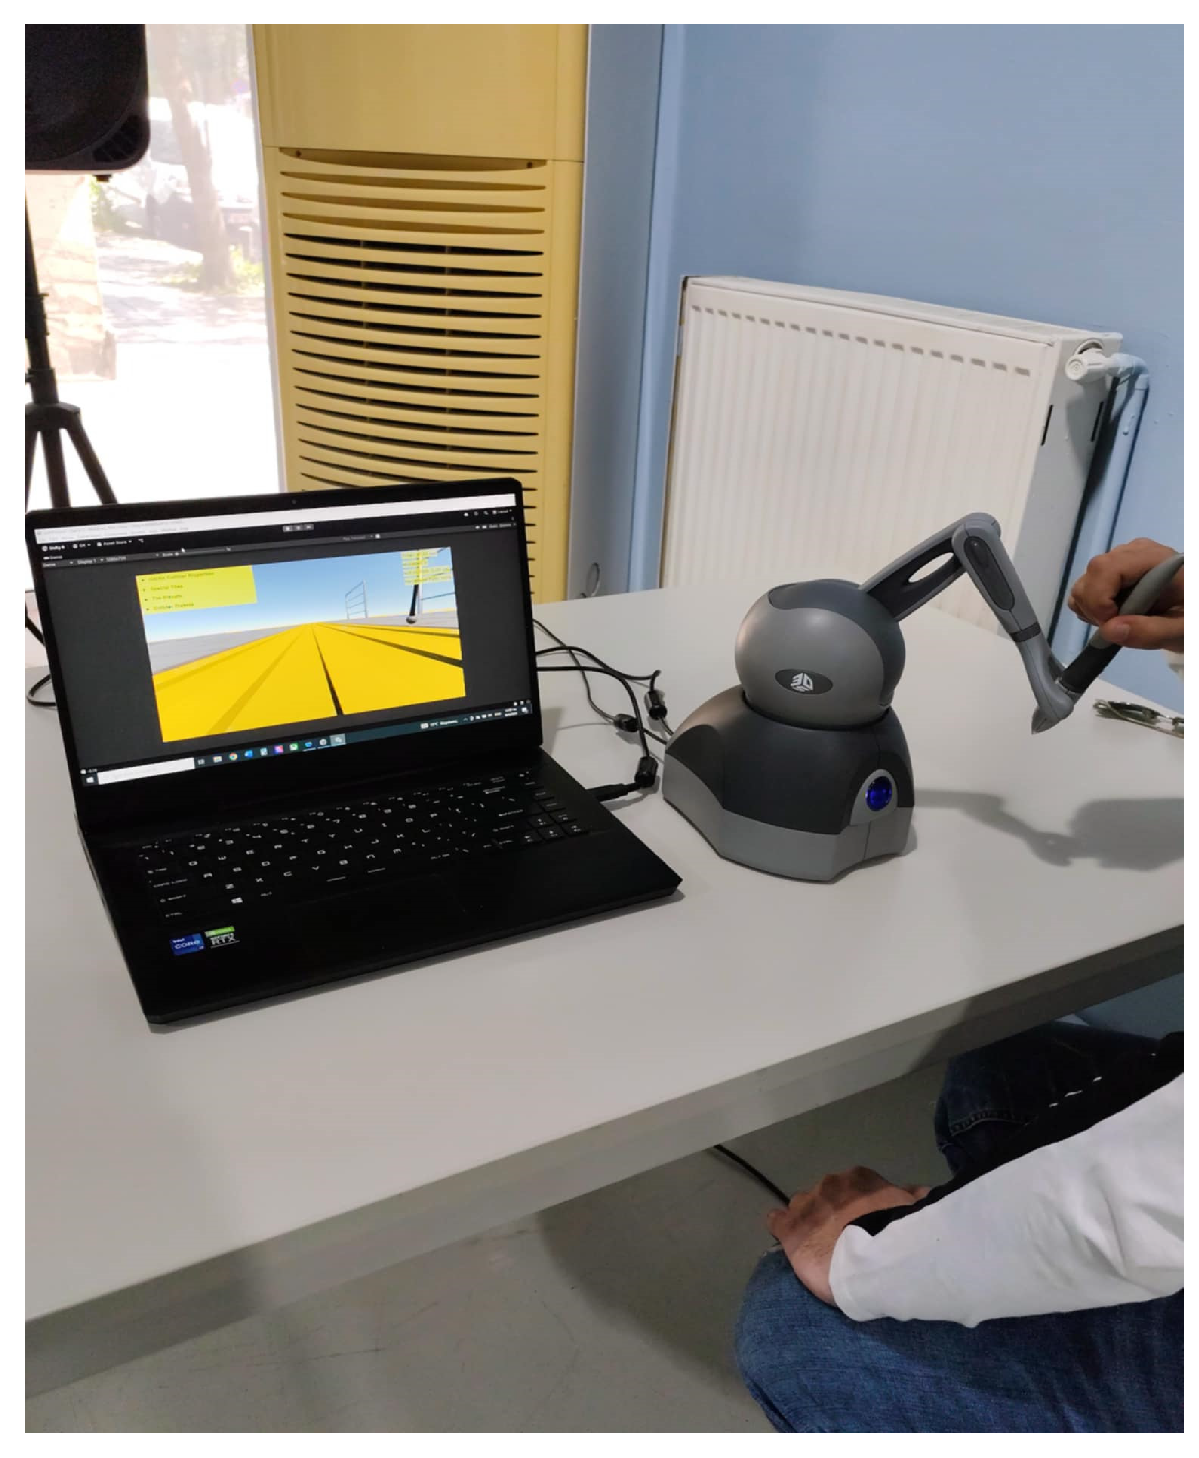
Figure 4.
Scenario_2 with a low degree of difficulty (a) and Scenario_3 with a higher degree of difficulty (b).
Figure 4.
Scenario_2 with a low degree of difficulty (a) and Scenario_3 with a higher degree of difficulty (b).
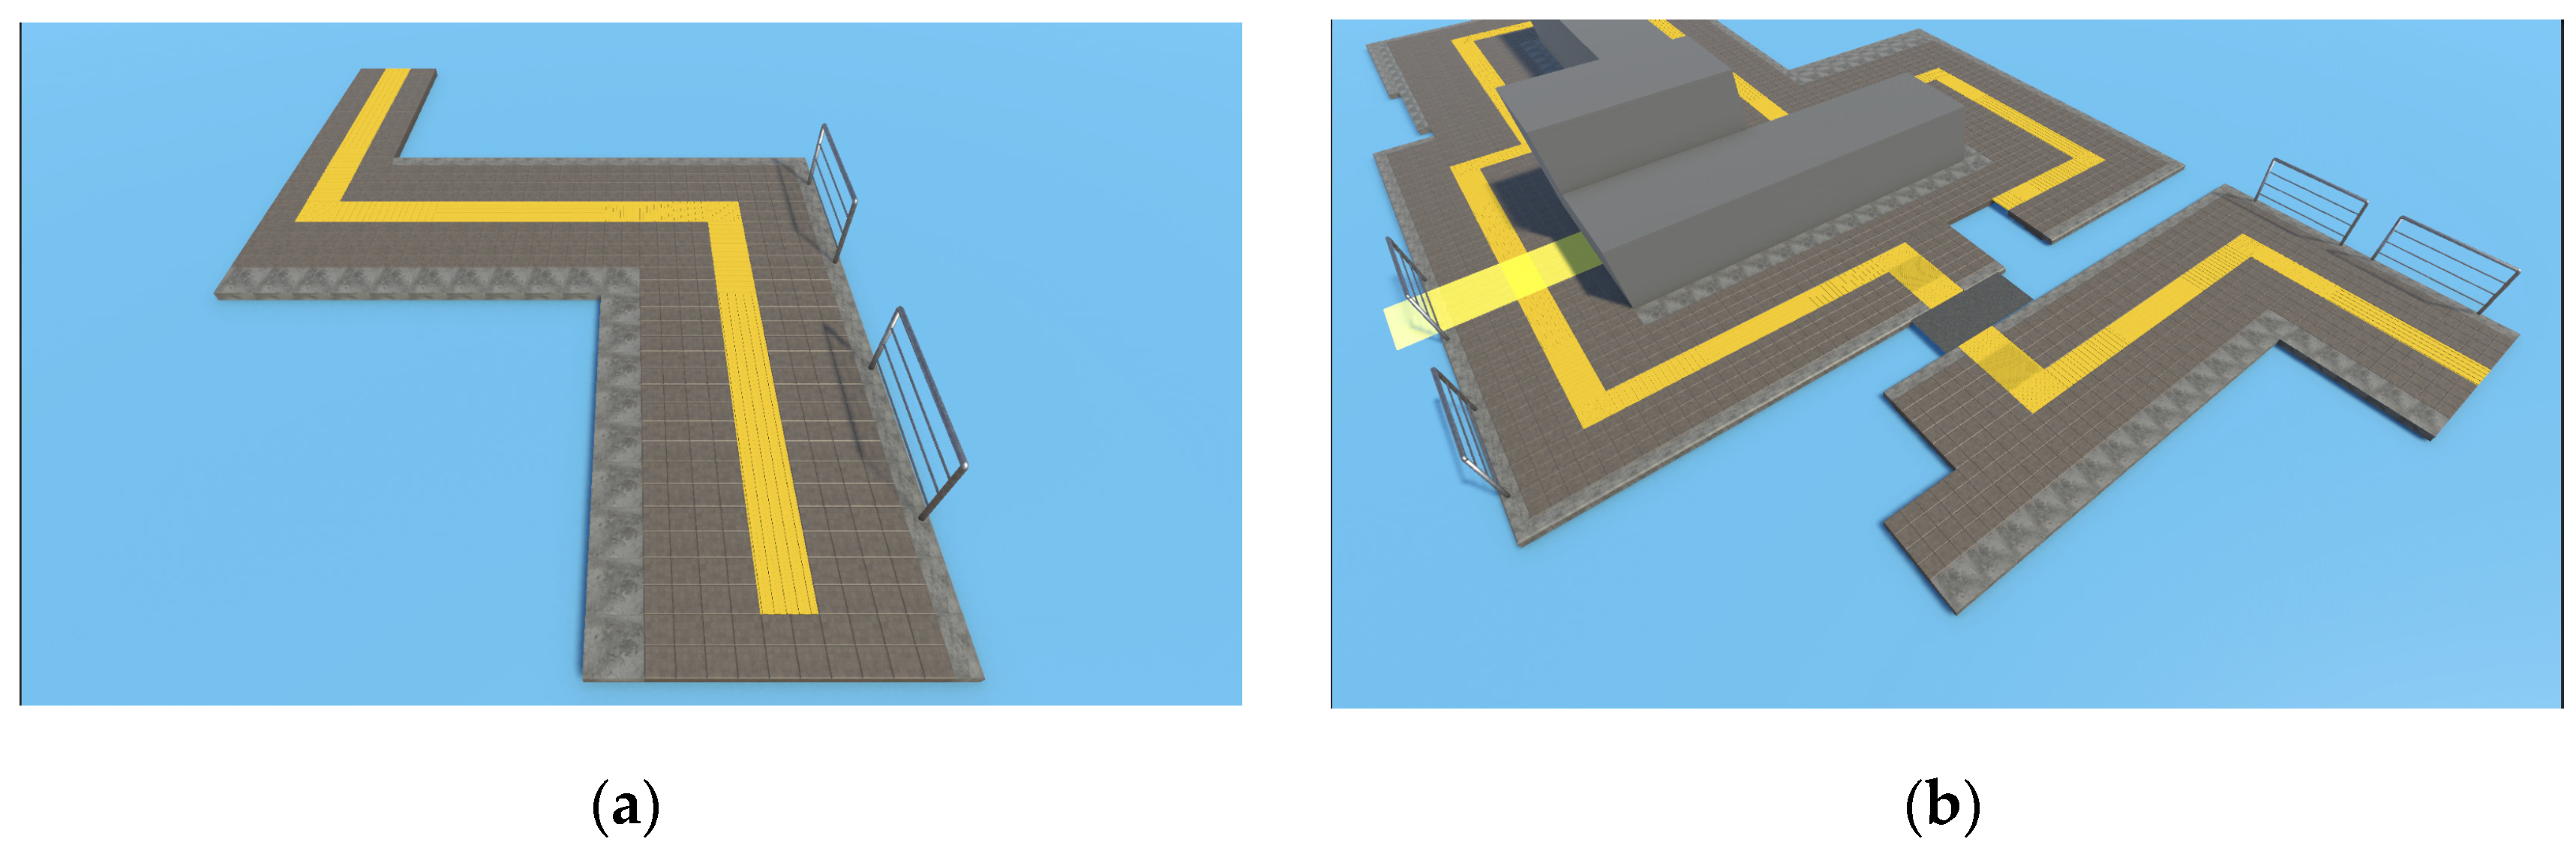
Figure 5.
Movement along the route of Scenario_2 (a) and movement along the route of Scenario_3 (b).
Figure 5.
Movement along the route of Scenario_2 (a) and movement along the route of Scenario_3 (b).
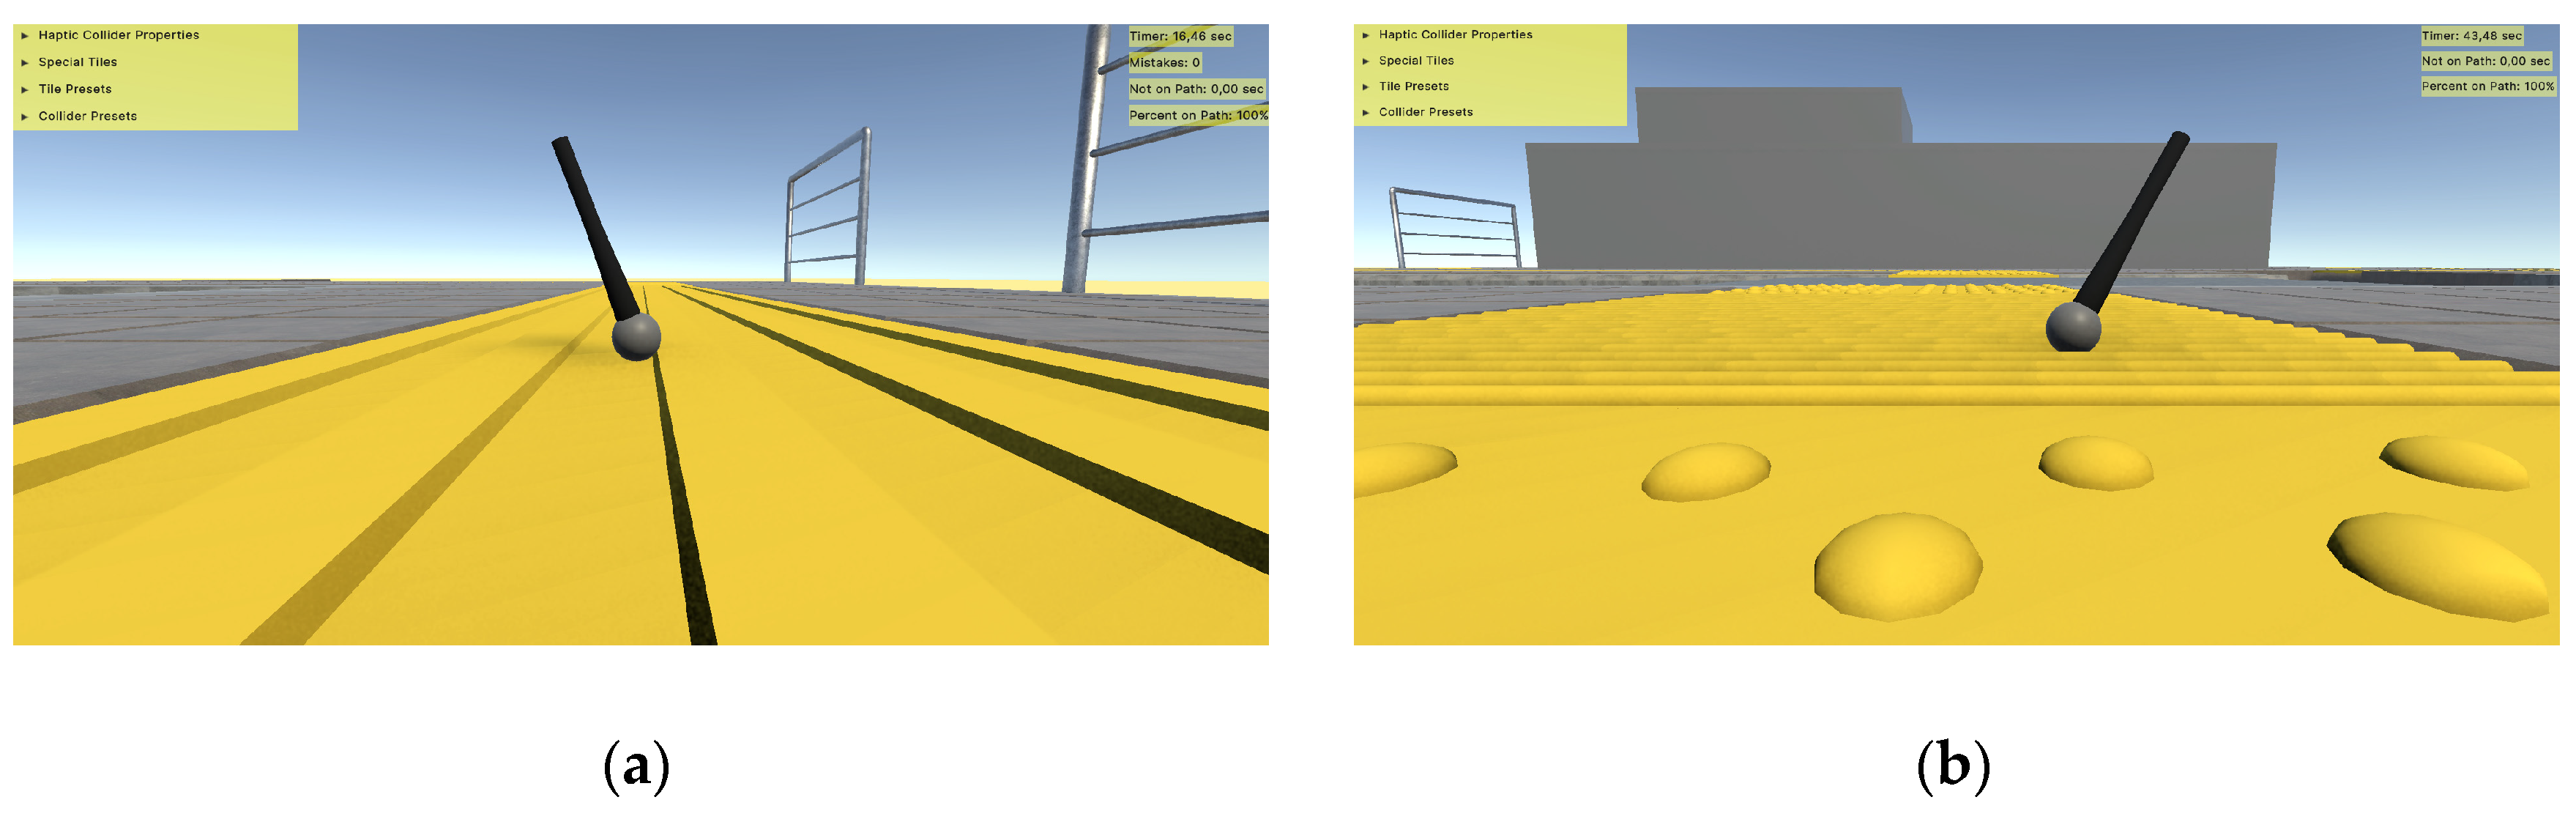

Table 1.
Paving Tile Types.
| Type | Function | Description | Place |
| A1(40x40) | Directional(Parallel to the axis of movement) | Stripes with wide and thin stripes | Guide people with visual impairments on their way |
| A2(40x40) | Imminent turn (Perpendicular to the axis of movement) |
Turn warning | At the points of vertical course change |
| B(40x40) | Warning (Arranged in a square canvas with an arrangement diagonal to the movement) |
Scalloped with strong scales | At the beginning and end of inclined planes, at all door levels, along all landings |
| C(40x40) | Direction Change (Arranged in a square canvas with an arrangement parallel to the movement) |
Scalloped with denser and less pronounced scales | Points of change of direction of type A plates |
| D(40x40) | Service (Parallel to the axis of movement) |
Striped with narrow and dense stripes | Public transport stops, telephone booths, special tactile signs for people with visual disabilities, etc |
Table 2.
Tile Presets.
| Haptic Parameters | Tile Preset 1 | Tile Preset 2 | Tile Preset 3 |
| Tile Stiffness | 1 | 1 | 1 |
| Damping | 1 | 1 | 1 |
| Static Friction | 0.25 | 0.5 | 0.75 |
| Dynamic Friction | 0.25 | 0.5 | 0.75 |
Table 3.
Collider Presets.
| Collider Preset | Collider Preset 1 | Collider Preset 2 | Collider Preset 3 |
| Size | Small | Medium | Big |
Table 4.
Experimental data for the three scenarios.
| Scenario |
Average All / Blind / Not Blind |
Standard Deviation All / Blind / Not Blind |
Minimum All / Blind / Not Blind |
Maximum All / Blind / Not Blind |
| AS1 | 0.32 / 0.25 / 0.34 | 0.18 / 0.03 / 0.20 | 0.08 / 0.20 / 0.08 | 0.65 / 0.29 / 0.65 |
| AS2 | 0.47 / 0.52 / 0.44 | 0.26 / 0.14 / 0.30 | 0 / 0.29 / 0 | 1 / 0.70 / 1 |
| AS3 | 0.63 / 0.68 / 0.30 | 0.22 / 0.31 / 0.16 | 0 / 0 / 0 | 1 / 1 / 0.56 |
Table 5.
Usability Evaluation.
| Usability Evaluation | Percentage |
| Usefulness | 88.8% |
| Ease of Use | 85.6% |
| Ease of Learning | 86% |
| Satisfaction | 90.5% |
Table 6.
UEQ – User Experience Questionnaire.
| Questions | Percentage |
| Supportive | 88.7% |
| Easy | 84.2% |
| Efficient | 85.7% |
| Clear | 83.5% |
| Exciting | 86.5% |
| Interesting | 94% |
| Inventive | 91.7% |
| Leading edge | 92.5% |
Disclaimer/Publisher’s Note: The statements, opinions and data contained in all publications are solely those of the individual author(s) and contributor(s) and not of MDPI and/or the editor(s). MDPI and/or the editor(s) disclaim responsibility for any injury to people or property resulting from any ideas, methods, instructions or products referred to in the content. |
© 2025 by the authors. Licensee MDPI, Basel, Switzerland. This article is an open access article distributed under the terms and conditions of the Creative Commons Attribution (CC BY) license (http://creativecommons.org/licenses/by/4.0/).
Copyright: This open access article is published under a Creative Commons CC BY 4.0 license, which permit the free download, distribution, and reuse, provided that the author and preprint are cited in any reuse.


