
Submitted:
04 May 2025
Posted:
06 May 2025
You are already at the latest version
Abstract
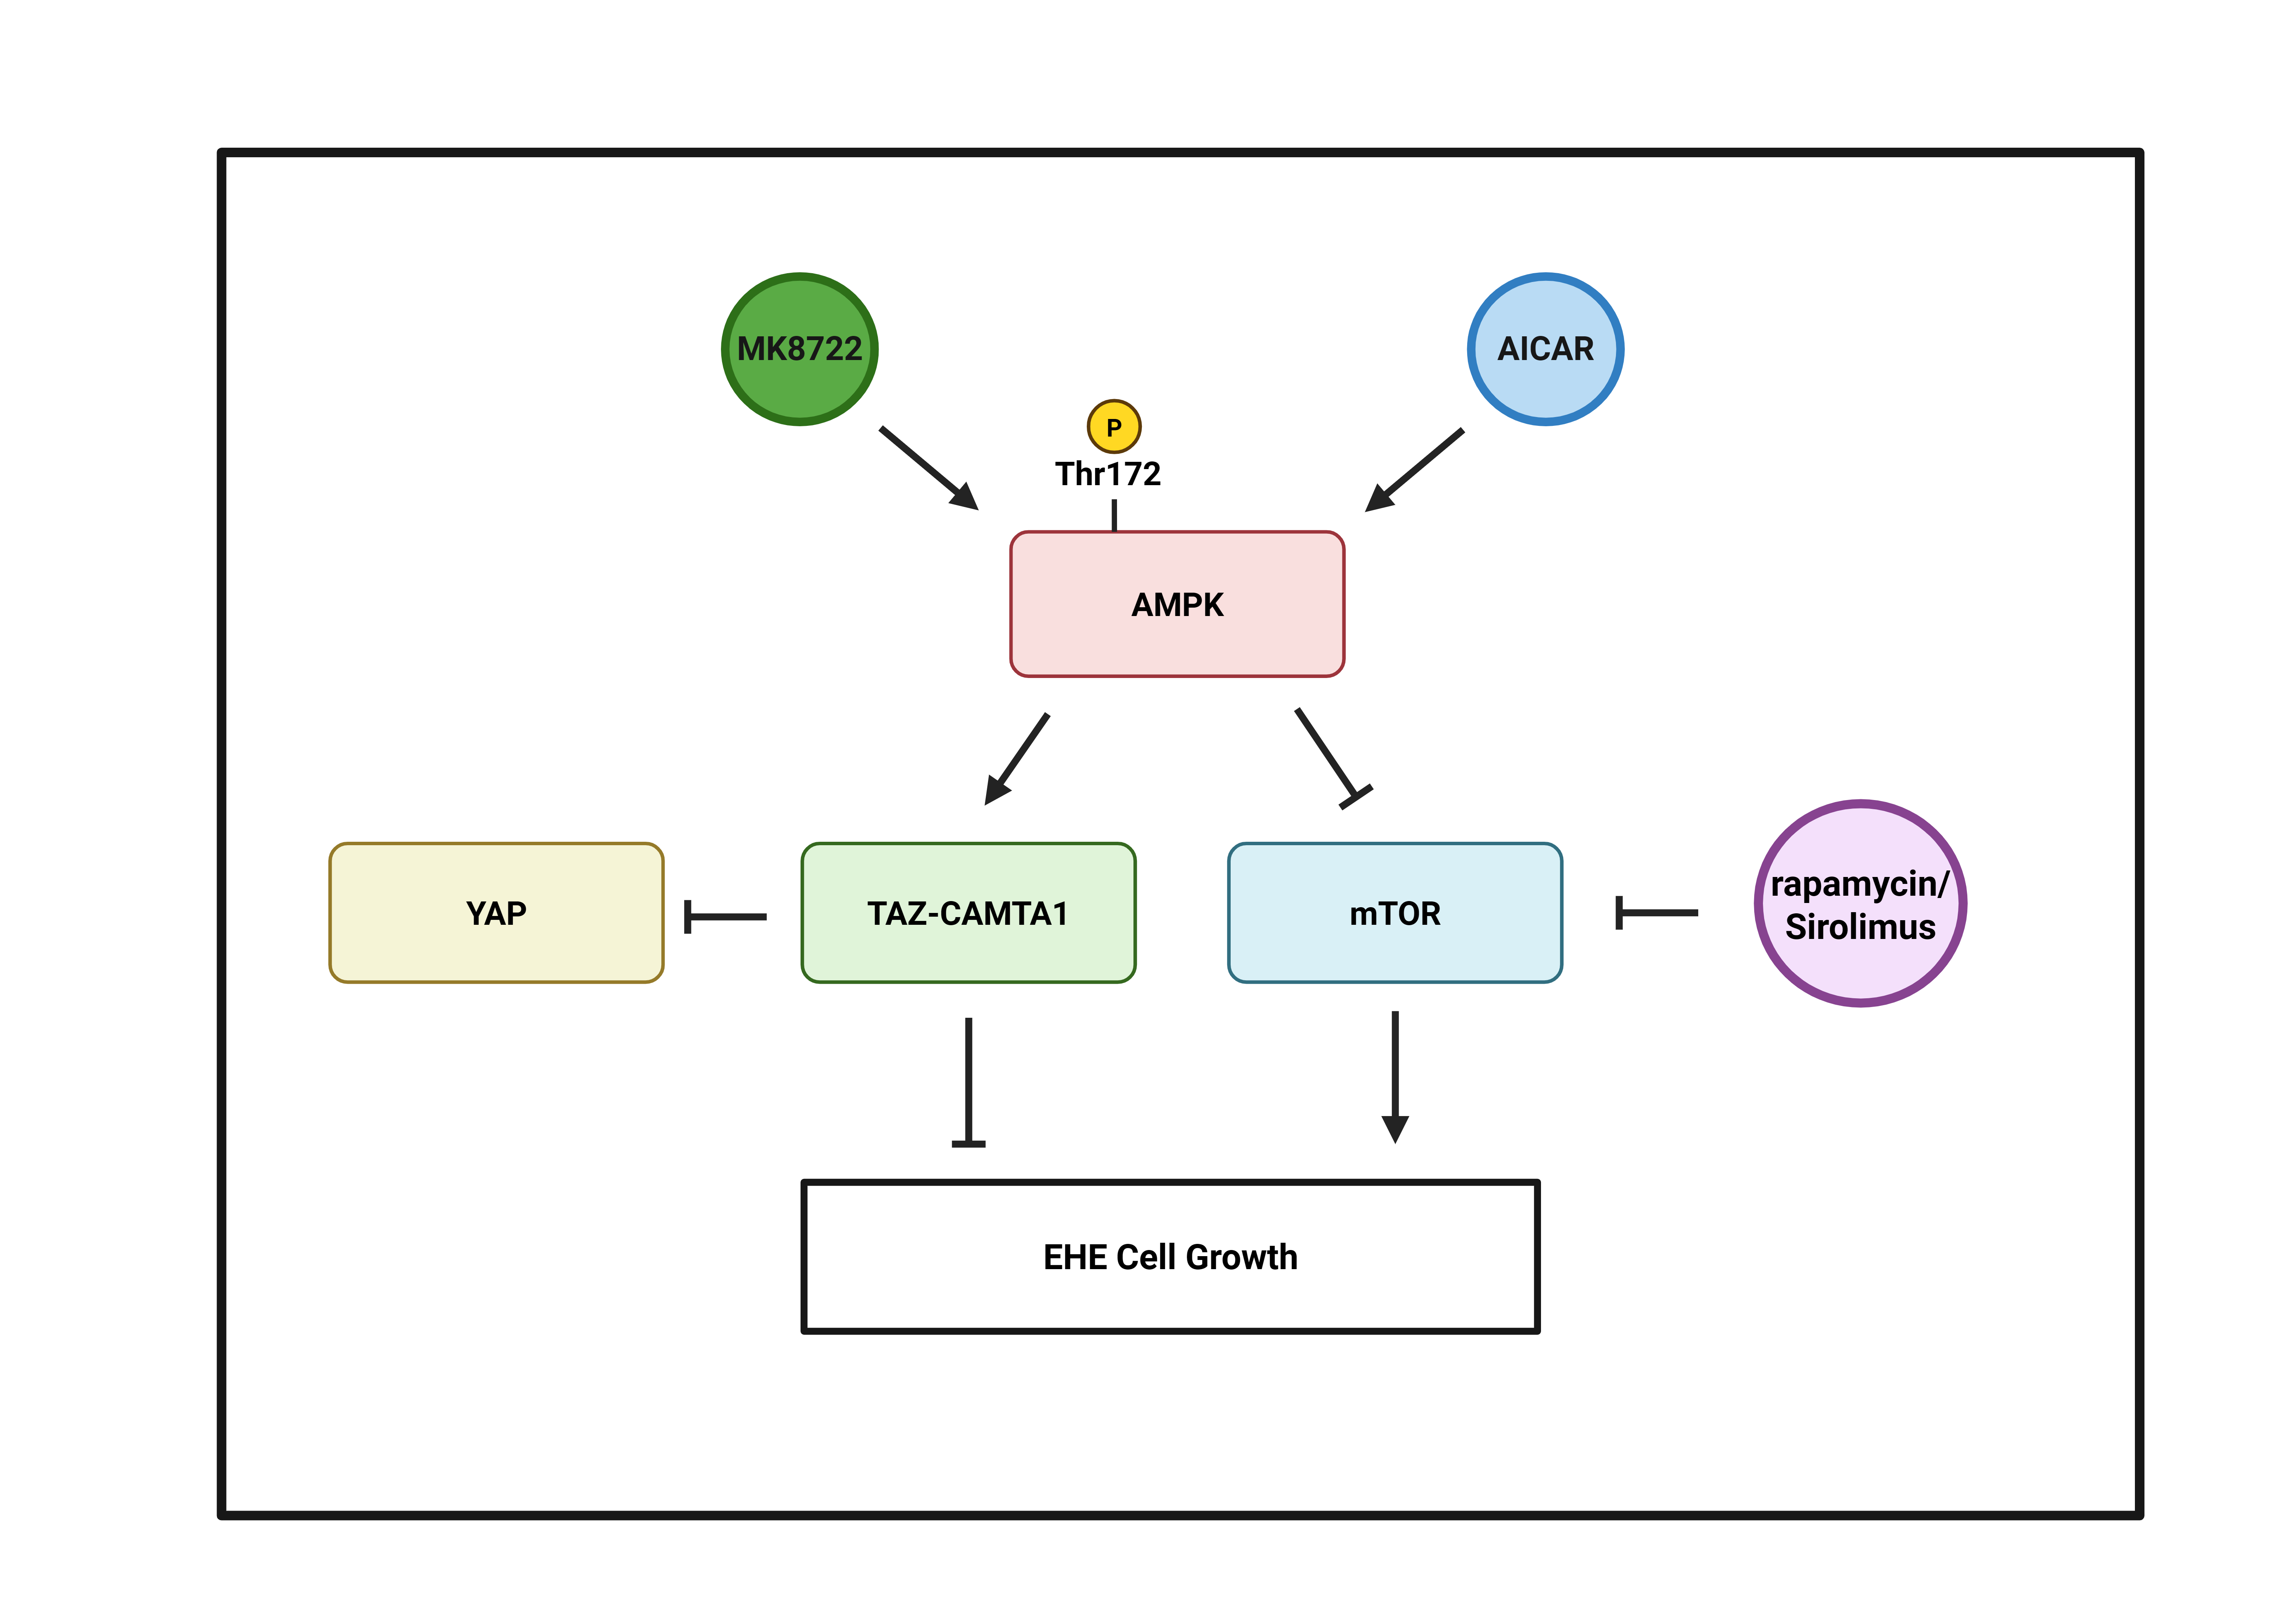
Epithelioid Hemangioendothelioma (EHE) is an ultra-rare, metastatic vascular sarcoma with limited therapeutic options. The hallmark of EHE is a chromosomal trans-location that produces the WWTR1-CAMTA1 gene fusion, encoding the aberrant transcriptional regulator TAZ-CAMTA1. Given its central role in EHE initiation and progression, TAZ-CAMTA1 represents a compelling therapeutic target. In this study, we identified AMP-activated protein kinase (AMPK) as one of several proteins capable of repressing TAZ-CAMTA1 transcriptional activity in NIH3T3 and HEK293 cell lines. Pharmacologic activation of AMPK inhibited the growth of EHE cell lines; however, in contrast to the NIH3T3 and HEK293 models, AMPK activation in EHE cells unexpectedly increased TAZ-CAMTA1 expression and activity. Notably, elevated TAZ-CAMTA1 expression was also associated with reduced EHE cell growth, suggesting that induction of TAZ-CAMTA1 may be one mechanism by which AMPK sup-presses EHE growth. Additionally, we found that AMPK inhibits mTOR activity, and that direct mTOR inhibition also suppresses EHE cell growth. Together, these findings demonstrate that AMPK activation impairs EHE viability through dual mechanisms: by promoting TAZ-CAMTA1 expression and by inhibiting mTOR signaling. This work highlights AMPK as a potential therapeutic target in EHE and supports the growing body of evidence favoring mTOR inhibitors as promising treatments for this rare cancer.
Keywords:
Epithelioid Hemangioendothelioma (EHE)
; AMPK
; TAZ-CAMTA1
; YAP
; mTOR
; Hippo Pathway
1. Introduction
Epithelioid Hemangioendothelioma (EHE) is an ultra-rare vascular sarcoma with an incidence of fewer than 1 per 1,000,000 people worldwide [1,2]. EHE can occur at any age but is mostly diagnosed in patients in their 20s and 30s, with a slightly higher prevalence in women [1,2]. EHE can form in any soft tissue but is most commonly occurs in liver, lungs, and bone [1,2,3] and often presents as multifocal and metastatic disease. There are no Food and Drug Administration (FDA)-approved treatments for EHE, so patients with inoperable disease have limited treatment options. Due to its rarity, EHE is severely understudied, and its natural history is poorly understood, which has limited efforts to discover effective treatments. Thus, there is a critical need to advance our understanding of EHE biology so that new treatments can be identified.
EHE is a fusion-driven cancer with more than 90% of patients positive for a t(1;3)(p36.3;q25) translocation that results in a WW Domain-Containing Transcription Regulator Protein 1-Calmodulin-Binding Transcription Activator 1 (WWTR1-CAMTA1) gene fusion [4,5]. The majority of the remaining 10% of EHEs are positive for a t(X;11) (p11;q22) translocation that generates a Yes-Associated Protein 1-Transcription factor E3 (YAP1-TFE3) gene fusion [6]. The WWTR1-CAMTA1 fusion gene encodes an oncogenic fusion protein in which the amino terminus of the transcriptional coactivator with a PDZ binding motif (TAZ) protein (encoded by WWTR1) is fused to the carboxy terminus of the CAMTA1 protein (encoded by the CAMTA1 gene). Recent studies have demonstrated that TAZ-CAMTA1 is sufficient to drive EHE [7,8] and is required for tumor maintenance and progression [8]. Interestingly, TAZ-CAMTA1 is unique to EHE, having never been observed in any other cancer. Like endogenous TAZ, the TAZ-CAMTA1 protein is a transcriptional coactivator that promotes tumorigenicity [7,8,9,10,11,12] by partnering with the TEA domain (TEAD) family of transcription factors to regulate transcriptional programs [8,9,10,12]. Indeed, mutation of Serine 51 to Alanine (S51A), which prevents TAZ interaction with the TEADs [13,14,15], eliminated TAZ-CAMTA1’s transcriptional and tumorigenic function [8,9]. Given the critical role of TAZ-CAMTA1 in EHE tumorigenesis, pathways that regulate TAZ-CAMTA1 are attractive therapeutic targets in EHE. However, while several studies have investigated the tumorigenic function of the TAZ-CAMTA1 fusion [7,8,9,10,11,12], little is known about the pathways regulating TAZ-CAMTA1.
While CAMTA1 is relatively understudied, numerous proteins that regulate TAZ and its paralog, Yes-Associated Protein (YAP), have been identified. This includes AMP-activated protein kinase (AMPK), which can regulate YAP and TAZ through multiple mechanisms [16,17,18,19,20]. AMPK is a heterotrimeric protein comprised of a catalytic α subunit and β and γ regulatory subunits [21,22]. AMPK acts as a cellular energy sensor that is directly activated by binding to adenosine monophosphate (AMP) in conditions with high amounts of AMP and low amounts of adenosine triphosphate (ATP) [21,22]. In these low energy conditions, activated AMPK inhibits anabolic pathways to limit energy consumption while promoting catabolic pathways to restore cellular ATP levels [21,22]. Importantly, AMPK-mediated inhibition of YAP and TAZ has been shown to reduce cancer cell proliferation and re-sensitize cancer cells to anti-cancer drugs [16,17,18,20].
Here, to identify molecular pathways that could be exploited to inhibit EHE cell growth, we performed a focused screen of known regulators of YAP and TAZ in TAZ-CAMTA1-expressing NIH3T3 and HEK293 cells. We found several proteins, including AMPK, that repressed TAZ-CAMTA1 transcriptional activity. We subsequently found that pharmacologic activation of AMPK repressed the growth of EHE cells through both TAZ-CAMTA1-dependent and independent mechanisms. Surprisingly, we found that instead of inhibiting TAZ-CAMTA1 as it did in NIH3T3 and HEK293 cells, activation of AMPK in EHE cells increased TAZ-CAMTA1 levels and activity. We also found that increasing TAZ-CAMTA1 expression repressed EHE cell growth. In addition, AMPK repressed EHE growth through inhibition of mechanistic target of rapamycin (mTOR). Altogether, these findings support AMPK as a potential therapeutic target in EHE.
2. Materials and Methods
Cell lines, plasmids, and cloning: All cell lines were cultured at 37◦C and 5% CO2 in the appropriate growth medium listed below. Cells were maintained at low passage number and routinely tested for mycoplasma and other bacterial contaminants. Cells were passaged when subconfluent and all assays were performed on cells at 60–80% confluence. Mouse EHE cells (EHE6, EHE17) [12] used (DMEM/F12, 20% fetal bovine serum, 0.1 mg/mL Endothelial Cell Growth Supplement (Corning, Cat#356006), 1X Antibiotic-Antimycotic solution (Millipore Sigma, Cat#A5955), and 0.1 mg/mL Heparin (Millipore Sigma, Cat#H3393)). HEK293 and 293FT cells used (DMEM+ 10% fetal bovine serum, 2 mM L-glutamine). NIH3T3 cells used (DMEM+ 10% bovine calf serum, 2 mM L-glutamine). EHE6 and EHE17 cells were obtained from Dr. Brian Rubin’s lab at the Cleveland Clinic [12]. HEK293 and NIH3T3 cells were purchased from ATCC. 293FT cells were purchased from Invitrogen. Plasmids and their source [9,12,23,24,25,26,27,28,29,30,31,32,33] are listed in Table S1. New vectors were generated using standard cloning procedures, and the source constructs used for each insert and vector backbone are indicated. All newly developed vectors were confirmed by test restriction enzyme cuts and sequenced using Plasmidsaurus to confirm their identity.
Lentivirus and Retrovirus: For virus packaging, 293FT cells were seeded on 6-well plates at 5.0 x 10⁵ cells per well in 2 mL of growth medium. After overnight incubation, cells were transfected (according to the manufacturer’s protocol) with a mixture containing 3.6 μg of DNA (1:1:1 molar ratio of viral vector, packaging vector (Gag/Pol or psPax2), and (VSVG)), 11 μL of X-tremeGENE™9 (Millipore Sigma, Cat#6365779001), and 189 μL of Opti-MEM™ (Thermo Fisher, Cat#31985062). The transfection mixture was added to the cells for twenty-four hours, after which, the mixture was removed, and the cells were fed with fresh DMEM without any supplements. Twenty-four hours after the medium change, the virus-containing supernatant was collected and filtered through a 0.45 μm filter. For stable transduction, cells at roughly 60–80% confluence were incubated with a 1:1 mixture of virus-containing supernatant and fresh growth medium, along with 6 μg /mL of DEAE-Dextran (Millipore Sigma, Cat#D9885). After twenty-four hours, the virus-containing medium was removed, and cells were fed with fresh growth medium. Cells began stable selection with the appropriate antibiotic seventy-two hours after the initial addition of viral supernatant.
TEAD transcriptional reporter assays: Two transcriptional reporter assays were used in this study. Reporter assays in NIH3T3 or HEK293 cells used a transient transfection in which cells were seeded onto 12-well plates in growth medium at 50,000 cells (NIH3T3) or 150,00 cells (HEK293) per well. The next day, using the manufacturer’s protocol, cells were transfected with 800 ng of a 20:1 mixture of TEAD firefly luciferase reporter (pGL3–5xMCAT(SV)-49) [32,33,34] and Renilla luciferase control plasmid PRL-TK (Promega) and 500 ng of the indicated co-transfected plasmid using 100 μL of Opti-MEM™ (Thermo Fisher, Cat#31985062), 3 μL of LipofectamineTM 3000, and 2 μL P1000 per 1 μg DNA. Twenty-four hours after transfection, cells were assayed using the Dual-Luciferase Reporter Assay System (Promega, Cat#E1910) and read on a Spectramax I3 plate reader as described previously [35]. EHE studies used a stably transduced reporter assay. Here, EHE6 and EHE17 cells were stably transduced with a lentiviral version of the TEAD reporter construct (pLenti-8xGTIIC-Firefly Luciferase-Puro [12]) and a lentiviral Renilla luciferase control construct (pLenti-PGK-Blast-Renilla Luciferase [31] . Then, cells were seeded onto 12-well plates at 5.3 x 10⁴ cells per well. Twenty-four hours after seeding, cells were treated with the indicated compound. Twenty-four hours after treatment, cells were assayed using the Dual-Luciferase Reporter Assay System (Promega) as detailed above. All TEAD reporter data was normalized by dividing the raw firefly luciferase signal by the raw Renilla luciferase signal for each well, averaging replicate wells, and then normalizing this average firefly/Renilla value to the average firefly/Renilla value of the control sample indicated in the legend.
RNAi: siRNA experiments used Horizon Discovery SMARTPools™ and included a non-targeting control siRNA (Horizon Discovery, Cat#D-001810-01-05) or a SMARTPool™ targeting mouse Yap (Horizon Discovery, Cat#L-046247-01-0005). EHE6 cells were seeded on 6-well plates at 2.9 × 10⁵ cells per well and cultured in growth medium overnight. The next day, cells were changed into growth medium without heparin or serum and transfected with a mixture containing 70 pmol of siRNA, 9 μL of Lipofectamine™ RNAiMAX (Thermo Fisher, Cat#13778150) and 230 μL Opti-MEM™ (Thermo Fisher, Cat#31985062) according to the manufacturer’s protocol. Twenty-four hours after the transfection, cells were fed with growth medium. Twenty-four hours later, the cells were trypsinized and seeded for Western Blot, qPCR, or cell growth assays.
Western Blot: Cells were seeded on 10 cm plates at 6.8 x 10⁵ cells per plate in growth medium. The next day, cells were treated with drug for twenty-four hours then lysed in Cell Lysis Buffer (Cell Signaling Technology, Cat#9803) containing Pierce™ Pierce Protease and Phosphatase Inhibitor Mini Tablets (Thermo Fisher, Cat#A32959). The protein concentration was determined using the Pierce™ BCA protein assay kit (Thermo Fisher Scientific, Cat#23225) and equal protein (10-20ug) was subjected to 10% SDS-PAGE, transferred to PVDF membranes, and assayed by Western blot. Primary antibody information is provided in Table S2. Blots were quantified using Bio-Rad’s Image Lab Software, in which band intensities were quantified and subsequently normalized to the housekeeping gene used for that experiment (either GAPDH or Beta-actin). Housekeeping-normalized phosphorylated protein bands were then normalized to housekeeping-normalized total protein bands.
qPCR: Cells were seeded on 60 mm plates at 3.75 x 10⁵ cells per plate in growth medium. The next day, cells were treated with drug for twenty-four hours and then lysed in TRIzol® (Thermo Fisher, Cat#15596018). RNA was isolated using a PureLinkTM RNA mini kit (Thermo Fisher, Cat#12183025) and 200 ng of total RNA was reverse transcribed to produce cDNA template using the qScript cDNA synthesis kit (QuantaBio, Cat#95048). qPCR was carried out using 2 μL of cDNA, 10 μL PerfeCTa SYBR Green Fastmix Universal (QuantaBio, Cat#101414-270), and 2 pmol of each primer (See Table S3). The reaction mixture was brought to a total volume of 20 μL with nuclease-free water. qPCR reactions were run using a CFX Connect real-time PCR detection system (Bio-Rad, Cat#1855201) according to the manufacturer’s instructions. PCR conditions were 95 ◦C for 30 s, followed by 40 cycles of 95 ◦C for 10 s and 55.9 ◦C for 30 s, followed by a melt temperature analysis. The Bio-Rad CFX Maestro software was used to calculate the fold-change in mRNA for each indicated gene for each sample relative to a pre-determined control sample using the ΔΔCt method and Gapdh as a reference gene.
Cell viability and growth: Both cell viability and cell number were assayed from the same well of cells as follows. First, cells were seeded at 3,200 cells per well on 96-well black, clear bottom plates (Millipore Sigma, Cat#BR781971). Twenty-four hours later cells were treated with the indicated drug for 96 h and then assayed using a CCK8 live cell counting kit (Dojindo, Cat#CK-04) according to the manufacturer’s protocol. After the CCK8 assay was completed, cells were fixed with 4% paraformaldehyde and stained with either 10 μg/mL Hoechst stain in 1X PBS (Thermo Fisher, Cat#H1399) or 1X NucSpot Live 488 in 1X PBS (Biotium, Cat#40081) for 60 or 30 minutes at 37 oC, respectively. Then, nuclei were counted using a BioTek Cytation 5 Cell Imaging Multimode Reader. For multi-day CCK8 dose curves, absorbance values from 4 replicate wells were averaged for each sample at each timepoint. Then, the average absorbance for each sample at every timepoint was normalized to the average of the untreated wells at 24 h. For all other CCK8 and nuclei counting, absorbance values or cell numbers from 4 replicate wells at the 96 h timepoint were averaged for each sample. Then, the sample averages were normalized to the untreated well at the 96 h timepoint.
Statistical Analysis: Statistical analyses were performed in GraphPad Prism (version 10.1.1). The statistical tests used to determine significance, and the number of n’s are indicated in the legends. All scatter plots show mean ± SD unless noted otherwise in the legend.
3. Results
3.1. Identification of Negative Regulators of TAZ-CAMTA1-TEAD Transcriptional Activity
Previous findings have demonstrated that TAZ-CAMTA1 is critical for EHE development and tumor progression [7,8], and that interaction with TEAD transcription factors is required for TAZ-CAMTA1’s tumorigenic function [9]. This suggests that pathways that regulate TAZ-CAMTA1-TEAD activity could be exploited to inhibit EHE growth. We first confirmed that EHE cell growth is sensitive to TEAD inhibition. We treated two previously described murine EHE cell lines (EHE6 and EHE17 [12]) with the TEAD2/4 inhibitor, MGH-CP1 [36], at a range of doses similar to those previously reported [12,36,37] and then assayed the cells for TEAD transcriptional activity using a lentiviral TEAD reporter construct [12], and cell growth using both the CCK8 cell viability assay and by counting cell number. As expected, MGH-CP1 treatment reduced TEAD transcriptional activity in both cell lines in a dose-dependent manner at 8 (Figure 1A,B) and 24 hours (Figure S1A,B). EHE cell viability was also reduced in a dose-dependent manner (Figure 1C and Figure S1C). At 15 μM of MGH-CP1, a dose where TEAD transcriptional activity was substantially inhibited, there was a significant reduction in both cell viability (assayed by CCK8 assay) and cell number in both cell lines (Figure 1D-F and Figure S1D). Altogether, these data confirm that the growth of these EHE cells is dependent upon TAZ-CAMTA1-TEAD function, suggesting that pathways that repress TAZ-CAMTA1 could be exploited to repress EHE growth.
EHE6 and EHE17 cell lines cannot be efficiently transfected with cDNA constructs, making it difficult to test candidate TAZ-CAMTA1 regulators using these cells. Therefore, we used HEK293 and NIH3T3 cells ectopically expressing TAZ-CAMTA1, two more genetically tractable models used to study TAZ-CAMTA1 function [9,10,11]. We first infected NIH3T3 cells with several concentrations of a retrovirus encoding TAZ-CAMTA1 and confirmed that TEAD transcriptional activity increased as TAZ-CAMTA1 protein expression increased (Figure S2A-C). Stable expression of TAZ-CAMTA1 also induced TEAD transcriptional activity in HEK293 cells, and this was dependent upon interaction with TEADs because a mutant form of TAZ-CAMTA1 unable to bind TEADs (TC-S51A) did not induce TEAD transcriptional activity (Figure S2D,E). This confirms that our TEAD reporter assays can be used to measure TAZ-CAMTA1-TEAD transcriptional activity.
The TAZ-CAMTA1 fusion retains several residues and domains through which other pathways negatively regulate TAZ and/or its paralog, YAP1 [18,20,38,39,40,41,42,43,44] (Figure S3A,B). Therefore, we hypothesized that TAZ-CAMTA1 would be sensitive to negative regulation by several proteins that regulate TAZ-CAMTA1 through this part of the protein. NIH3T3 cells stably expressing TAZ-CAMTA1 were co-transfected with the TEAD reporter constructs and either an empty vector (EV), AMPKα1 [28], AMPKα2 [29], Protein Tyrosine Phosphatase Non-Receptor Type 14 (PTPN14) [26], Gelsolin [27], Cofilin [30], an activated form of Cofilin (S9A) [30], an activated from of Glycogen Synthase Kinase-3 beta (GSK3β) [23], and activated form of Angiomotin (P130) [24], or 2 distinct NF2 isoforms and then assayed for TEAD reporter activity. This revealed several proteins able to repress TAZ-CAMTA1-TEAD transcriptional activity (Figure S3C). We retested formative proteins in HEK293 cells expressing TAZ-CAMTA1 and found they also repressed TAZ-CAMTA1-TEAD (Figure S3D). Thus, TAZ-CAMTA1 remains sensitive to regulation by pathways that repress TAZ through its N-terminus.
3.2. AMPK Activation Represses EHE Cell Growth.
Among the regulators of TAZ-CAMTA1 that we identified, AMPK was particularly interesting because therapeutic AMPK activators are available. To test if AMPK activation can repress EHE cell growth, we treated EHE6 and EHE17 cells with the AMP-mimetic 5-Aminoimidazole-4-carboxyamide ribonucleoside (AICAR) [45,46] or the small molecular MK8722 [47,48], two direct pharmacologic activators of AMPK. AICAR[49–51 and MK8722 each reduced the viability of both EHE cell lines in a dose-dependent manner (Figure 2A,F and Figure S4A,D). To confirm that the doses of AICAR and MK8722 that repressed EHE viability correlated with increased AMPK activation, we performed Western Blots for phosphorylation of the α subunit of AMPK at Threonine 172 (Thr172) [49,50,51] and phosphorylation of the AMPK substrate, Acetyl CoA Carboxylase (ACC), at Serine 79 (Ser79) [52,53], two established readouts of AMPK activity. MK8722 and AICAR each increased AMPKα and ACC phosphorylation in both EHE cell lines (Figure 2B,G and Figure S4B,E). Although both drugs started to induce AMPKα and ACC phosphorylation at doses that did not inhibit EHE viability, robust AMPK activation occurred at 10 μM of MK8722 and 500 μM of AICAR, doses that did reduce EHE cell viability (Figure 2A,F and Figure S4A,D). These doses, which are similar to those used in other studies with AICAR [54,55,56] or MK8722 [48,57,58], substantially reduced cell viability and cell number in both EHE cell lines (Figure 2C-E, H-J and Figure S4C,F). Collectively, these results show that robust pharmacological activation of AMPK leads to reduced EHE cell growth.
3.3. AMPK Activation Represses EHE Through Two Distinct Mechanisms
Given that AMPK repressed TAZ-CAMTA1 in NIH3T3 and HEK293 cells, we next investigated whether AMPK activation represses EHE cell growth by inhibiting TAZ-CAMTA1. Paradoxically, instead of decreasing TAZ-CAMTA1-TEAD transcriptional activity, treatment with either AICAR or MK8722 resulted in a dose-dependent increase in activity in both cell lines (Figure 3A,B and Figure S5A,B). Interestingly, AMPK activation increased TAZ-CAMTA1 protein levels (Figure 3C,D and Figure S5C,D), a potential explanation for this increased TEAD transcriptional activity. Both drugs also decreased YAP protein levels in these cells (Figure 3C,E and Figure S5C,E). We did not observe any change in the expression of TAZ-CAMTA1 or YAP at the mRNA level (Figure 3F,G and Figure S5F,G), suggesting that in EHE cells, AMPK regulates TAZ-CAMTA1 and YAP expression at the post-translational level. Thus, despite our initial observation that AMPK can repress ectopically expressed TAZ-CAMTA1 in NIH3T3 and HEK293 cells, it appears to promote TAZ-CAMTA1 protein expression and TEAD transcriptional activity in EHE cells.
Results in Figure 3 were unexpected given that TAZ-CAMTA1 is known to play a causal role in EHE [7,8] and that we and others have found that the inhibition of TAZ-CAMTA1-TEAD activity represses EHE cell growth (Figure 1 and [12]). However, recent work revealed that TAZ-CAMTA1 can cause oncogene-induced senescence when expressed at high levels in endothelial progenitor cells [59]. This raises the intriguing possibility that while necessary for EHE cell growth, TAZ-CAMTA1 can also be detrimental if its activity is too high. YAP is also an established driver of cell growth in many cancers [60,61], and it can partner with other transcription factors in addition to TEADs. Thus, we next tested if the decrease in EHE cell viability caused by AMPK activation is due to the changes in either TAZ-CAMTA1 or YAP protein levels. To determine whether reduced YAP expression impairs EHE cell growth, we transfected EHE6 cells with either a non-targeting control siRNA (siNTC) or pooled siRNAs targeting YAP and then confirmed YAP knockdown by qPCR and Western Blot (Figure 4A-C). EHE cell growth was not impaired by loss of YAP protein expression (Figure 4E), indicating that the AMPK-mediated decrease in YAP expression is not responsible for the reduced EHE cell viability. In addition, we did not observe any changes in TAZ-CAMTA1 protein expression in the YAP knockdown cells (Figure 4D), indicating that the increase in TAZ-CAMTA1 expression caused by AMPK activation is not due to loss of YAP protein levels.
To investigate whether elevated TAZ-CAMTA1 expression directly impairs EHE cell growth, we generated EHE6 cells stably expressing either a control empty vector (EV) or exogenous TAZ-CAMTA1. Western blot analysis confirmed that TAZ-CAMTA1 levels were significantly higher in the engineered cells compared to controls (Figure 5A). Strikingly, cells with increased TAZ-CAMTA1 expression exhibited reduced cell growth (Figure 5C), supporting the idea that excessive TAZ-CAMTA1 activity can be detrimental to EHE cells. Interestingly, we also observed a decrease in YAP expression in cells overexpressing TAZ-CAMTA1 (Figure 5A,B), although this reduction was not as pronounced as the decrease following AMPK activation. Together, these findings suggest that AMPK activation leads to an upregulation of TAZ-CAMTA1, a potential mechanism through which AMPK exerts its growth-inhibitory effects in EHE.
Although our data suggests that the AMPK-mediated increase in TAZ-CAMTA1 expression contributes to the inhibition of EHE cell growth, AMPK is an established inhibitor of mTOR [62,63,64,65,66], and growing pre-clinical and clinical data demonstrates that the mTOR inhibitor rapamycin (also called Sirolimus) is a viable treatment for EHE [67,68,69]. Therefore, we tested if AMPK activation in EHE cells inhibits mTOR activity and, if so, whether this impairs EHE cell growth. First, we treated EHE6 cells with doses of AICAR or MK8722 that repressed EHE growth and examined mTOR activity by measuring phosphorylation of the S6 ribosomal protein at Ser235/236, a direct target of mTOR [70,71]. As expected, we observed a decrease in S6 phosphorylation with either AICAR or MK8722 treatment (Figure 6A-D), indicating that AMPK activation inhibits mTOR in EHE cells. To test if mTOR inhibition represses EHE cell growth, we treated EHE6 and EHE17 cells with the mTOR inhibitor, rapamycin, and observed a significant inhibtion of cell growth at all doses we tested (Figure 6E and Figure S6A). Indeed, 50 nM rapamycin treatment inhibited cell viability and cell number by greater than 50% in both EHE6 and EHE17 cells (Figure 6E-G and Figure S6A-C). Western Blots confirmed that mTOR activity (S6 phosphorylation) was significanlty impaired at this dose of rapamycin (Figure 6H and Figure S6D). Rapamycin treatment did not result in any changes in either YAP or TAZ-CAMTA1 protein levels in EHE cells (Figure 6I-K). Altogether, our results suggest that AMPK activation impairs EHE cell growth through both inhibition of mTOR signaling and independently by increasing TAZ-CAMTA1 protein expression.
4. Discussion
Given the lack of FDA-approved treatments for EHE, the goal of this study was to identify new therapeutic targets that could be exploited to inhibit EHE cell growth. We identified AMPK signaling as a promising avenue as its activation not only suppresses mTOR signaling, but also unexpectedly increases TAZ-CAMTA1 expression, ultimately leading to reduced EHE cell growth.
4.1. AMPK Regulates EHE Cell Growth Through Inhibition of mTOR.
AMPK is an established regulator of mTOR [62,63,64,72] and can inhibit mTOR signaling through multiple mechanisms. It can directly phosphorylate the GTPase activating protein (GAP) Tuberous Sclerosis 2 Protein (TSC2) on Tyrosine 1227 and Serine 1345, leading to activation of the TSC1/2 complex [64,66]. This allows TSC1/2 to interact with Ras Homolog Enriched In Brain (Rheb) and promote hydrolysis of guanosine triphosphate (GTP) to guanosine diphosphate (GDP) [73,74,75,76,77], ultimately reducing mTOR activity [71,78,79]. AMPK can also phosphorylate Raptor, a scaffold for proteins subject to mTOR phosphorylation [80,81,82], which in turn inhibits mTORC1 signaling [65]. We found that AMPK represses mTOR signaling in EHE cells and that mTOR inhibition impairs cell growth (Figure 6). This is consistent with a recent study that used an EHE patient-derived xenograft (PDX) and corresponding cell line to show that Sirolimus suppressed the growth of human EHE cells in vitro and repressed EHE growth in vivo [67]. Although Sirolimus has not yet received FDA or European Medicines Agency approval for EHE, it is used off-label to treat EHE and has shown efficacy in some patients [1,67,68,69,83,84,85,86,87,88,89,90,91,92]. Thus, our findings further support the potential of Sirolimus in EHE and suggest that pharmacologic activation of AMPK may provide an additional way to target mTOR in EHE patients.
mTOR plays critical roles in cell metabolism, growth, proliferation, and survival [93,94,95,96], and mTOR inhibition impairs tumor cell proliferation by repressing metabolic pathways critical for protein and lipid biosynthesis [94,97,98]. What makes EHE cells susceptible to mTOR inhibition is unclear. Cancers with elevated mTOR signaling are often more susceptible to its inhibition [99,100], and EHE cells appear to have elevated PI3K-AKT-mTOR signaling [7,8,101]. Whether TAZ-CAMTA1 itself plays a role in EHE cell susceptibility to mTOR inhibition has not been explored. Although mTOR can promote YAP/TAZ expression by inhibiting autophagy [102], our results suggest that mTOR inhibition does not alter YAP or TAZ-CAMTA1 expression in EHE cells. However, there is also evidence that YAP and TAZ can promote mTOR activity [15,103,104,105], raising the possibility that mTOR activation is a downstream consequence of TAZ-CAMTA1 in EHE. Alternatively, sensitivity to mTOR inhibition could be due to the endothelial origin of EHE, as other vascular sarcomas and vascular malformations have elevated mTOR signaling [83,106,107,108,109,110] and show sensitivity to Sirolimus [91,111,112,113,114,115,116,117,118]. It is also possible that in EHE cells, basal AMPK signaling is too low to effectively restrain mTOR signaling. Understanding the causes of elevated mTOR activity in EHE cells could help explain why not all EHE patients benefit from Sirolimus and provide a more effective way to identify the ones that will.
4.2. AMPK Regulation of YAP and TAZ-CAMTA1 in EHE
AMPK can inhibit YAP function through multiple mechanisms, including activation of Large Tumor Suppressor Kinase (LATS) [16,18,20], as well as direct phosphorylation at Serine 61 and Serine 94 [18,19], with the latter preventing YAP-TEAD interaction [13,14]. Based on these data and given the paralogous nature of YAP and TAZ, we hypothesized that AMPK would inhibit TAZ-CAMTA1. While AMPK activation in NIH3T3 and HEK293 cells did repress TAZ-CAMTA1-TEAD transcriptional activity (Figure S3), this was not the case in EHE cells. Instead, TAZ-CAMTA1 protein levels and TEAD transcriptional activity both increased following AMPK activation (Figure 3). We further showed that increasing TAZ-CAMTA1 protein expression inhibits EHE cell growth (Figure 5), suggesting that AMPK represses EHE growth in part through upregulation of TAZ-CAMTA1. An important caveat here is that exogenous expression of TAZ-CAMTA1 increased its expression expression to a much higher level than the increase we observed with AMPK activation. Despite trying a range of viral supernatants, we could not generate EHE cells that showed TAZ-CAMTA1 levels comparable to those in which we pharmacologically activated AMPK. Thus, it is difficult to determine how significantly the AMPK-mediated induction of TAZ-CAMTA1 impacts cell growth. Nevertheless, our findings are consistent with a recent study that showed that endothelial progenitor cells with higher TAZ-CAMTA1 expression grew slower than cells with lower TAZ-CAMTA1 expression [59]. This study further demonstrated that high TAZ-CAMTA1 expression caused growth arrest by driving hypertranscription [59]. Elevated YAP or TAZ activity can also cause hypertranscription in other cells [119]. While this suggests that too much TAZ-CAMTA1-TEAD activity may be detrimental to EHE cells, it is also clear that loss of TAZ-CAMTA1 or inhibition of TAZ-CAMTA1-TEAD activity is similarly detrimental to EHE cells (Figure 1 and [12,120] ) Collectively, these findings suggest that the level of TAZ-CAMTA1 activity needs to be tightly controlled in EHE cells, which could have important therapeutic implications given that TEAD inhibitors are currently being tested in EHE patients.
The mechanism by which AMPK increases TAZ-CAMTA1 levels remains unclear. Given that YAP levels decreased concurrently with increased TAZ-CAMTA1, we initially hypothesized that AMPK was causing degradation of YAP, which led to an increase in TAZ-CAMTA1. However, the direct knockdown of YAP did not alter TAZ-CAMTA1 expression. Instead, we found that overexpression of TAZ-CAMTA1 reduced YAP expression, indicating that the AMPK-mediated increase in TAZ-CAMTA1 expression is partially responsible for the decreased YAP protein levels we observed. This did not play a causal role in AMPK-mediated repression EHE cell growth, suggesting that YAP is not essential for EHE cell survival or proliferation. We also ruled out a role for AMPK-mediated suppression of mTOR in regulating TAZ-CAMTA1 levels (Figure 6).
AMPK activation did not increase TAZ-CAMTA1 mRNA expression (Figure 3), indicating it is either enhancing its translation or preventing its degradation. The TAZ portion of the TAZ-CAMTA1 fusion retains the N-terminal phosphodegron, which when phosphorylated by GSK3β leads to proteasomal degradation of TAZ through βTRCP [42]. Our data in NIH3T3 and HEK293 cells suggests that TAZ-CAMTA1 is still sensitive to this regulation since overexpression of GSK3B inhibited TAZ-CAMTA1-TEAD activity (Figure S3). Importantly, AMPK can regulate proteasomal degradation by influencing the activity and expression of ubiquitin ligases (reviewed in [121] ), and by suppressing the proteasome itself [122,123,124]. This raises the possibility that AMPK increases TAZ-CAMTA1 protein levels by inhibiting its proteasomal degradation.
4.3. Negative Regulation of TAZ-CAMTA1 is Context-Dependent.
Since TAZ-CAMTA1 plays a causal role in EHE [7,8] and TAZ-CAMTA1-TEAD activity is required for EHE cell growth [12,120], we predicted that pathways that typically repress TAZ or YAP would repress TAZ-CAMTA1 and inhibit EHE cell viability. TAZ-CAMTA1 lacks a critical LATS phosphorylation site through which the Hippo pathway promotes proteasomal degradation of TAZ [125]. Although TAZ-CAMTA1 retains another critical serine residue through which LATS promotes cytoplasmic sequestration of full-length TAZ, early studies in TAZ-CAMTA1-expressing cells suggested that TAZ-CAMTA1 is resistant to regulation by LATS [8,9]. This may suggest that the strong nuclear localization sequence contributed by the CAMTA1 portion of the fusion [9] overrides inhibitory phosphorylation by LATS and drives TAZ-CAMTA1 to the nucleus. Nevertheless, the TAZ portion of TAZ-CAMAT1 retains other residues subject to Hippo-independent regulation [126].
In NIH3T3 and HEK293 cells it appears that activation of the pathways that regulate some of these residues can indeed repress the transcriptional activity of TAZ-CAMTA1. In addition to AMPK and GSK3β, we also found PTPN14, Gelsolin, and Cofilin could each repress TAZ-CAMTA1. Gelsolin and Cofilin repress YAP and TAZ through disruption of the F-actin cytoskeleton [40] , while PTPN14 can regulate YAP through multiple mechanisms [26,38,39,41] . While this suggests that the TAZ-CAMTA1 protein is still subject to negative regulation via its N-terminus, whether GSK3β, PTPN14, Gelsolin, or Cofilin can regulate TAZ-CAMTA1 in EHE cells needs to be further explored given our finding that AMPK repressed TAZ-CAMTA1-TEAD in NIH3T3 and HEK293, but not in EHE cells. This highlights the importance of using EHE model systems to study TAZ-CAMTA1 regulation and function.
5. Conclusions
In conclusion, our study highlights AMPK as a promising therapeutic target for EHE. We demonstrate that AMPK activation suppresses mTOR signaling to slow EHE cell growth. This not only reinforces the growing interest in mTOR inhibitors like Sirolimus for EHE treatment but also introduces AMPK activation as an alternative strategy to target the mTOR pathway. However, the potential of AMPK is not without its caveats. While AMPK activation clearly limits EHE cell growth in vitro, we were unable to determine its effects in vivo due to limitations with our murine allograft models, which fail to develop aggressive EHE tumors. It will also be important to confirm these findings in human EHE cells lines, once available. Therapeutically, AMPK activation still faces hurdles. AICAR, though effective as a research compound, lacks clinical viability due to its short half-life and poor bioavailability [127]. MK8722 marked a significant advance with its improved potency, selectivity, and pharmacokinetics in vivo [47,48], but is hindered by side effects like cardiac hypertrophy [48]. We also tested metformin, a widely used and well-tolerated AMPK activator. Unfortunately, EHE cells proved resistant, requiring high doses to achieve meaningful activation of AMPK and impair viability (not shown), suggesting that EHE cells are more resistant to this drug than the other AMPK activators. Still, the continued development of new AMPK-activating compounds [128,129] offers hope that AMPK could become a powerful tool in the fight against EHE in the future.
In parallel, our research uncovers new insights into the regulation of the TAZ-CAMTA1 fusion protein in EHE. Notably, we discovered that TAZ-CAMTA1 remains susceptible to inhibition via its N-terminal region, highlighting a novel and potentially powerful therapeutic avenue to disrupt this oncogenic driver. We also show that TAZ-CAMTA1-TEAD activity must be carefully balanced as excessive or insufficient activity both proved detrimental to EHE cells. While this reinforces the concept that effective inhibition of TAZ-CAMTA1-TEAD could suppress EHE cell growth, our findings also suggest a more complex picture where in some contexts, TAZ-CAMTA1-TEAD activity may be so elevated that it paradoxically suppresses EHE growth. In such cases, partial inhibition might inadvertently relieve this suppression and enhance tumor growth. This may shed light on results that emerge from ongoing early-phase clinical trials testing TEAD inhibitors in EHE patients. Based on our findings, it may also be interesting to investigate whether other YAP and TAZ fusion proteins that drive human cancers [130,131,132] remain susceptible to negative regulation through their N-terminus and if this is context dependent.
Supplementary Materials
The following supporting information can be downloaded at: www.mdpi.com/xxx/s1, Figure S1-S6, Table S1-S2.
Author Contributions
Conceptualization, J.M.L., R.K., S.M., B.P.R., and C.N.S.; methodology, J.M.L., R.K., S.M., E.N., C.T.P., P.,B., and K.L.; validation, J.M.L., R.K., S.M., E.N., C.T.P., P.,B., and K.L.; formal analysis, J.M.L., R.K., S.M., E.N., C.T.P., P.,B., and K.L.; investigation, J.M.L., R.K., S.M., E.N., C.T.P., P.,B., and K.L.; resources, B.P.R., and C.N.S.; data curation, J.M.L., R.K., S.M., E.N., C.T.P., P.,B., and K.L.; writing—original draft preparation, J.M.L., and R.K.; writing—review and editing, J.M.L., R.K., S.M., E.N., C.T.P., P.,B., K.L.; B.P.R., and C.N.S.; supervision, J.M.L. and B.P.R.; project administration J.M.L. and B.P.R.; funding acquisition, J.M.L. and B.P.R.. All authors have read and agreed to the published version of the manuscript.
Funding
This work received generous financial support from the Margie and Robert E. Petersen Foundation, the Department of Defense (RA200178), the Epithelioid Hemangioendothelioma Foundation (http://www.fightehe.org), EHE Rare Cancer Charity (UK; https://www.ehercc.org.uk), EHE Rare Cancer Charity (Australia; http://www.ehefoundation.com.au), The Center for Research and Analysis of Vascular Tumors Foundation (http://www.cravatfoundation.org), and a VeloSano grant provided by the Cleveland Clinic. C.N.S. was supported in part by a Crile Research Fellowship, Cleveland Clinic, and the Department of General Surgery, Cleveland Clinic. During this project, C.N.S. was a pre-doctoral candidate in the Molecular Medicine Ph.D. Program of Case Western Reserve University. R.K. was supported by the Epithelioid Hemangioendothelioma Foundation (http://www.fightehe.org).
Institutional Review Board Statement
Not Applicable.
Informed Consent Statement
Not Applicable.
Data Availability Statement
No omics data were generated in this study. All other data is provided in the manuscript or Supplemental Materials.
Acknowledgments
We would like to thank Denise Robinson, Jane Gutkovich, Hugh Leonard and Jane Biddlecombe from the EHE foundations and Guy Weinberg from the CRAVAT foundation for their support. Biorender was used to create the graphical abstract for this publication.
Conflicts of Interest
The authors declare no conflicts of interest.
Abbreviations
The following abbreviations are used in this manuscript:
| AMP | Adenosine Monophosphate |
| AMPK | AMP-activated Protein Kinase |
| AICAR | 5-Aminoimidazole-4-carboxyamide ribonucleoside |
| ATP | Adenosine Triphosphate |
| CAMTA1 | Calmodulin-Binding Transcription Activator 1 |
| EHE | Epithelioid Hemangioendothelioma |
| FDA | Food and Drug Administration |
| GAP | GTPase activating protein |
| GDP | Guanosine Diphosphate |
| GTP | Guanosine Triphosphate |
| GSK3b | Glycogen Synthase Kinase-3 beta |
| LATS | Large Tumor Suppressor Kinase |
| mTOR | Mechanistic Target of Rapamycin |
| PTPN14 | Protein Tyrosine Phosphatase Non-Receptor Type 14 |
| PDX | Patient-derived Xenograft () |
| Rheb | Ras Homolog Enriched In Brain |
| TAZ | Transcriptional Co-activator with PDZ-binding Motif |
| TC | TAZ-CAMTA1 |
| TEAD | TEA Domain |
| TFE3 | Transcription Factor E3 |
| TSC2 | Tuberous Sclerosis 2 Protein |
| YAP | Yes-Associated Protein 1 |
| WWTR1 | WW Domain-Containing Transcription Regulator Protein 1 |
References
- Stacchiotti, S.; Tap, W.; Leonard, H.; Zaffaroni, N.; Baldi, G.G. New Molecular Insights, and the Role of Systemic Therapies and Collaboration for Treatment of Epithelioid Hemangioendothelioma (EHE). Curr Treat Options Oncol 2023, 24, 667–679. [Google Scholar] [CrossRef] [PubMed]
- Seavey, C.N.; Pobbati, A.V.; Rubin, B.P. Unraveling the Biology of Epithelioid Hemangioendothelioma, a TAZ-CAMTA1 Fusion Driven Sarcoma. Cancers (Basel) 2022, 14. [Google Scholar] [CrossRef] [PubMed]
- Sardaro, A.; Bardoscia, L.; Petruzzelli, M.F.; Portaluri, M. Epithelioid hemangioendothelioma: an overview and update on a rare vascular tumor. Oncol Rev 2014, 8, 259. [Google Scholar] [CrossRef] [PubMed]
- Errani, C.; Zhang, L.; Sung, Y.S.; Hajdu, M.; Singer, S.; Maki, R.G.; Healey, J.H.; Antonescu, C.R. A novel WWTR1-CAMTA1 gene fusion is a consistent abnormality in epithelioid hemangioendothelioma of different anatomic sites. Genes Chromosomes Cancer 2011, 50, 644–653. [Google Scholar] [CrossRef]
- Tanas, M.R.; Sboner, A.; Oliveira, A.M.; Erickson-Johnson, M.R.; Hespelt, J.; Hanwright, P.J.; Flanagan, J.; Luo, Y.; Fenwick, K.; Natrajan, R.; et al. Identification of a disease-defining gene fusion in epithelioid hemangioendothelioma. Sci Transl Med 2011, 3, 98ra82. [Google Scholar] [CrossRef]
- Antonescu, C.R.; Le Loarer, F.; Mosquera, J.M.; Sboner, A.; Zhang, L.; Chen, C.L.; Chen, H.W.; Pathan, N.; Krausz, T.; Dickson, B.C.; et al. Novel YAP1-TFE3 fusion defines a distinct subset of epithelioid hemangioendothelioma. Genes Chromosomes Cancer 2013, 52, 775–784. [Google Scholar] [CrossRef]
- Seavey, C.N.; Pobbati, A.V.; Hallett, A.; Ma, S.; Reynolds, J.P.; Kanai, R.; Lamar, J.M.; Rubin, B.P. WWTR1(TAZ)-CAMTA1 gene fusion is sufficient to dysregulate YAP/TAZ signaling and drive epithelioid hemangioendothelioma tumorigenesis. Genes Dev 2021, 35, 512–527. [Google Scholar] [CrossRef]
- Driskill, J.H.; Zheng, Y.; Wu, B.K.; Wang, L.; Cai, J.; Rakheja, D.; Dellinger, M.; Pan, D. WWTR1(TAZ)-CAMTA1 reprograms endothelial cells to drive epithelioid hemangioendothelioma. Genes Dev 2021, 35, 495–511. [Google Scholar] [CrossRef]
- Tanas, M.R.; Ma, S.; Jadaan, F.O.; Ng, C.K.; Weigelt, B.; Reis-Filho, J.S.; Rubin, B.P. Mechanism of action of a WWTR1(TAZ)-CAMTA1 fusion oncoprotein. Oncogene 2016, 35, 929–938. [Google Scholar] [CrossRef]
- Merritt, N.; Garcia, K.; Rajendran, D.; Lin, Z.Y.; Zhang, X.; Mitchell, K.A.; Borcherding, N.; Fullenkamp, C.; Chimenti, M.S.; Gingras, A.C.; et al. TAZ-CAMTA1 and YAP-TFE3 alter the TAZ/YAP transcriptome by recruiting the ATAC histone acetyltransferase complex. Elife 2021, 10. [Google Scholar] [CrossRef]
- Ma, S.; Kanai, R.; Pobbati, A.V.; Li, S.; Che, K.; Seavey, C.N.; Hallett, A.; Burtscher, A.; Lamar, J.M.; Rubin, B.P. The TAZ-CAMTA1 Fusion Protein Promotes Tumorigenesis via Connective Tissue Growth Factor and Ras-MAPK Signaling in Epithelioid Hemangioendothelioma. Clin Cancer Res 2022, 28, 3116–3126. [Google Scholar] [CrossRef] [PubMed]
- Seavey, C.N.; Hallett, A.; Li, S.; Che, K.; Pobbati, A.V.; Ma, S.; Burtscher, A.; Kanai, R.; Lamar, J.M.; Rubin, B.P. Loss of CDKN2A Cooperates with WWTR1(TAZ)-CAMTA1 Gene Fusion to Promote Tumor Progression in Epithelioid Hemangioendothelioma. Clin Cancer Res 2023, 29, 2480–2493. [Google Scholar] [CrossRef] [PubMed]
- Zhao, B.; Ye, X.; Yu, J.; Li, L.; Li, W.; Li, S.; Yu, J.; Lin, J.D.; Wang, C.Y.; Chinnaiyan, A.M.; et al. TEAD mediates YAP-dependent gene induction and growth control. Genes Dev 2008, 22, 1962–1971. [Google Scholar] [CrossRef] [PubMed]
- Dai, X.; Liu, H.; Shen, S.; Guo, X.; Yan, H.; Ji, X.; Li, L.; Huang, J.; Feng, X.H.; Zhao, B. YAP activates the Hippo pathway in a negative feedback loop. Cell Res 2017, 27, 1073. [Google Scholar] [CrossRef]
- Ong, Y.T.; Andrade, J.; Armbruster, M.; Shi, C.; Castro, M.; Costa, A.S.H.; Sugino, T.; Eelen, G.; Zimmermann, B.; Wilhelm, K.; et al. A YAP/TAZ-TEAD signalling module links endothelial nutrient acquisition to angiogenic growth. Nat Metab 2022, 4, 672–682. [Google Scholar] [CrossRef]
- Liu, J.; Li, J.; Chen, H.; Wang, R.; Li, P.; Miao, Y.; Liu, P. Metformin suppresses proliferation and invasion of drug-resistant breast cancer cells by activation of the Hippo pathway. J Cell Mol Med 2020, 24, 5786–5796. [Google Scholar] [CrossRef]
- Wu, Y.; Zheng, Q.; Li, Y.; Wang, G.; Gao, S.; Zhang, X.; Yan, X.; Zhang, X.; Xie, J.; Wang, Y.; et al. Metformin targets a YAP1-TEAD4 complex via AMPKalpha to regulate CCNE1/2 in bladder cancer cells. J Exp Clin Cancer Res 2019, 38, 376. [Google Scholar] [CrossRef]
- Mo, J.S.; Meng, Z.; Kim, Y.C.; Park, H.W.; Hansen, C.G.; Kim, S.; Lim, D.S.; Guan, K.L. Cellular energy stress induces AMPK-mediated regulation of YAP and the Hippo pathway. Nat Cell Biol 2015, 17, 500–510. [Google Scholar] [CrossRef]
- Wang, W.; Xiao, Z.D.; Li, X.; Aziz, K.E.; Gan, B.; Johnson, R.L.; Chen, J. AMPK modulates Hippo pathway activity to regulate energy homeostasis. Nat Cell Biol 2015, 17, 490–499. [Google Scholar] [CrossRef]
- DeRan, M.; Yang, J.; Shen, C.H.; Peters, E.C.; Fitamant, J.; Chan, P.; Hsieh, M.; Zhu, S.; Asara, J.M.; Zheng, B.; et al. Energy stress regulates hippo-YAP signaling involving AMPK-mediated regulation of angiomotin-like 1 protein. Cell Rep 2014, 9, 495–503. [Google Scholar] [CrossRef]
- Herzig, S.; Shaw, R.J. AMPK: guardian of metabolism and mitochondrial homeostasis. Nat Rev Mol Cell Biol 2018, 19, 121–135. [Google Scholar] [CrossRef] [PubMed]
- Lin, S.C.; Hardie, D.G. AMPK: Sensing Glucose as well as Cellular Energy Status. Cell Metab 2018, 27, 299–313. [Google Scholar] [CrossRef]
- Stambolic, V.; Woodgett, J.R. Mitogen inactivation of glycogen synthase kinase-3 beta in intact cells via serine 9 phosphorylation. Biochem J 1994, 303 (Pt 3), 701–704. [Google Scholar] [CrossRef]
- Zhao, B.; Li, L.; Lu, Q.; Wang, L.H.; Liu, C.Y.; Lei, Q.; Guan, K.L. Angiomotin is a novel Hippo pathway component that inhibits YAP oncoprotein. Genes Dev 2011, 25, 51–63. [Google Scholar] [CrossRef] [PubMed]
- Reya, T.; Duncan, A.W.; Ailles, L.; Domen, J.; Scherer, D.C.; Willert, K.; Hintz, L.; Nusse, R.; Weissman, I.L. A role for Wnt signalling in self-renewal of haematopoietic stem cells. Nature 2003, 423, 409–414. [Google Scholar] [CrossRef]
- Wilson, K.E.; Li, Y.W.; Yang, N.; Shen, H.; Orillion, A.R.; Zhang, J. PTPN14 forms a complex with Kibra and LATS1 proteins and negatively regulates the YAP oncogenic function. J Biol Chem 2014, 289, 23693–23700. [Google Scholar] [CrossRef]
- Harterink, M.; da Silva, M.E.; Will, L.; Turan, J.; Ibrahim, A.; Lang, A.E.; van Battum, E.Y.; Pasterkamp, R.J.; Kapitein, L.C.; Kudryashov, D.; et al. DeActs: genetically encoded tools for perturbing the actin cytoskeleton in single cells. Nat Methods 2017, 14, 479–482. [Google Scholar] [CrossRef]
- Schaffer, B.E.; Levin, R.S.; Hertz, N.T.; Maures, T.J.; Schoof, M.L.; Hollstein, P.E.; Benayoun, B.A.; Banko, M.R.; Shaw, R.J.; Shokat, K.M.; et al. Identification of AMPK Phosphorylation Sites Reveals a Network of Proteins Involved in Cell Invasion and Facilitates Large-Scale Substrate Prediction. Cell Metab 2015, 22, 907–921. [Google Scholar] [CrossRef]
- Banko, M.R.; Allen, J.J.; Schaffer, B.E.; Wilker, E.W.; Tsou, P.; White, J.L.; Villen, J.; Wang, B.; Kim, S.R.; Sakamoto, K.; et al. Chemical genetic screen for AMPKalpha2 substrates uncovers a network of proteins involved in mitosis. Mol Cell 2011, 44, 878–892. [Google Scholar] [CrossRef]
- Garvalov, B.K.; Flynn, K.C.; Neukirchen, D.; Meyn, L.; Teusch, N.; Wu, X.; Brakebusch, C.; Bamburg, J.R.; Bradke, F. Cdc42 regulates cofilin during the establishment of neuronal polarity. J Neurosci 2007, 27, 13117–13129. [Google Scholar] [CrossRef]
- Toyama, E.Q.; Herzig, S.; Courchet, J.; Lewis, T.L., Jr.; Loson, O.C.; Hellberg, K.; Young, N.P.; Chen, H.; Polleux, F.; Chan, D.C.; et al. Metabolism. AMP-activated protein kinase mediates mitochondrial fission in response to energy stress. Science 2016, 351, 275–281. [Google Scholar] [CrossRef] [PubMed]
- Lamar, J.M.; Xiao, Y.; Norton, E.; Jiang, Z.G.; Gerhard, G.M.; Kooner, S.; Warren, J.S.A.; Hynes, R.O. SRC tyrosine kinase activates the YAP/TAZ axis and thereby drives tumor growth and metastasis. J Biol Chem 2019, 294, 2302–2317. [Google Scholar] [CrossRef] [PubMed]
- Mahoney, W.M., Jr.; Hong, J.H.; Yaffe, M.B.; Farrance, I.K. The transcriptional co-activator TAZ interacts differentially with transcriptional enhancer factor-1 (TEF-1) family members. Biochem J 2005, 388, 217–225. [Google Scholar] [CrossRef] [PubMed]
- Xiao, Y.; Lamar, J.M. Identification of Transcription Factor Regulators using Medium-Throughput Screening of Arrayed Libraries and a Dual-Luciferase-Based Reporter. J Vis Exp 2020. [Google Scholar] [CrossRef]
- Kanai, R.; Norton, E.; Stern, P.; Hynes, R.O.; Lamar, J.M. Identification of a Gene Signature That Predicts Dependence upon YAP/TAZ-TEAD. Cancers (Basel) 2024, 16. [Google Scholar] [CrossRef]
- Li, Q.; Sun, Y.; Jarugumilli, G.K.; Liu, S.; Dang, K.; Cotton, J.L.; Xiol, J.; Chan, P.Y.; DeRan, M.; Ma, L.; et al. Lats1/2 Sustain Intestinal Stem Cells and Wnt Activation through TEAD-Dependent and Independent Transcription. Cell Stem Cell 2020, 26, 675–692 e678. [Google Scholar] [CrossRef]
- Sun, Y.; Hu, L.; Tao, Z.; Jarugumilli, G.K.; Erb, H.; Singh, A.; Li, Q.; Cotton, J.L.; Greninger, P.; Egan, R.K.; et al. Pharmacological blockade of TEAD-YAP reveals its therapeutic limitation in cancer cells. Nat Commun 2022, 13, 6744. [Google Scholar] [CrossRef]
- Liu, X.; Yang, N.; Figel, S.A.; Wilson, K.E.; Morrison, C.D.; Gelman, I.H.; Zhang, J. PTPN14 interacts with and negatively regulates the oncogenic function of YAP. Oncogene 2013, 32, 1266–1273. [Google Scholar] [CrossRef]
- Michaloglou, C.; Lehmann, W.; Martin, T.; Delaunay, C.; Hueber, A.; Barys, L.; Niu, H.; Billy, E.; Wartmann, M.; Ito, M.; et al. The tyrosine phosphatase PTPN14 is a negative regulator of YAP activity. PLoS One 2013, 8, e61916. [Google Scholar] [CrossRef]
- Aragona, M.; Panciera, T.; Manfrin, A.; Giulitti, S.; Michielin, F.; Elvassore, N.; Dupont, S.; Piccolo, S. A mechanical checkpoint controls multicellular growth through YAP/TAZ regulation by actin-processing factors. Cell 2013, 154, 1047–1059. [Google Scholar] [CrossRef]
- Wang, W.; Huang, J.; Wang, X.; Yuan, J.; Li, X.; Feng, L.; Park, J.I.; Chen, J. PTPN14 is required for the density-dependent control of YAP1. Genes Dev 2012, 26, 1959–1971. [Google Scholar] [CrossRef] [PubMed]
- Huang, W.; Lv, X.; Liu, C.; Zha, Z.; Zhang, H.; Jiang, Y.; Xiong, Y.; Lei, Q.Y.; Guan, K.L. The N-terminal phosphodegron targets TAZ/WWTR1 protein for SCFbeta-TrCP-dependent degradation in response to phosphatidylinositol 3-kinase inhibition. J Biol Chem 2012, 287, 26245–26253. [Google Scholar] [CrossRef] [PubMed]
- Chan, S.W.; Lim, C.J.; Chong, Y.F.; Pobbati, A.V.; Huang, C.; Hong, W. Hippo pathway-independent restriction of TAZ and YAP by angiomotin. J Biol Chem 2011, 286, 7018–7026. [Google Scholar] [CrossRef] [PubMed]
- Hamaratoglu, F.; Willecke, M.; Kango-Singh, M.; Nolo, R.; Hyun, E.; Tao, C.; Jafar-Nejad, H.; Halder, G. The tumour-suppressor genes NF2/Merlin and Expanded act through Hippo signalling to regulate cell proliferation and apoptosis. Nat Cell Biol 2006, 8, 27–36. [Google Scholar] [CrossRef]
- Corton, J.M.; Gillespie, J.G.; Hawley, S.A.; Hardie, D.G. 5-aminoimidazole-4-carboxamide ribonucleoside. A specific method for activating AMP-activated protein kinase in intact cells? Eur J Biochem 1995, 229, 558–565. [Google Scholar] [CrossRef]
- Sullivan, J.E.; Brocklehurst, K.J.; Marley, A.E.; Carey, F.; Carling, D.; Beri, R.K. Inhibition of lipolysis and lipogenesis in isolated rat adipocytes with AICAR, a cell-permeable activator of AMP-activated protein kinase. FEBS Lett 1994, 353, 33–36. [Google Scholar] [CrossRef]
- Feng, D.; Biftu, T.; Romero, F.A.; Kekec, A.; Dropinski, J.; Kassick, A.; Xu, S.; Kurtz, M.M.; Gollapudi, A.; Shao, Q.; et al. Discovery of MK-8722: A Systemic, Direct Pan-Activator of AMP-Activated Protein Kinase. ACS Med Chem Lett 2018, 9, 39–44. [Google Scholar] [CrossRef]
- Myers, R.W.; Guan, H.P.; Ehrhart, J.; Petrov, A.; Prahalada, S.; Tozzo, E.; Yang, X.; Kurtz, M.M.; Trujillo, M.; Gonzalez Trotter, D.; et al. Systemic pan-AMPK activator MK-8722 improves glucose homeostasis but induces cardiac hypertrophy. Science 2017, 357, 507–511. [Google Scholar] [CrossRef]
- Hawley, S.A.; Davison, M.; Woods, A.; Davies, S.P.; Beri, R.K.; Carling, D.; Hardie, D.G. Characterization of the AMP-activated protein kinase kinase from rat liver and identification of threonine 172 as the major site at which it phosphorylates AMP-activated protein kinase. J Biol Chem 1996, 271, 27879–27887. [Google Scholar] [CrossRef]
- Stein, S.C.; Woods, A.; Jones, N.A.; Davison, M.D.; Carling, D. The regulation of AMP-activated protein kinase by phosphorylation. Biochem J 2000, 345 Pt 3, 437–443. [Google Scholar] [CrossRef]
- Crute, B.E.; Seefeld, K.; Gamble, J.; Kemp, B.E.; Witters, L.A. Functional domains of the alpha1 catalytic subunit of the AMP-activated protein kinase. J Biol Chem 1998, 273, 35347–35354. [Google Scholar] [CrossRef] [PubMed]
- Carling, D.; Zammit, V.A.; Hardie, D.G. A common bicyclic protein kinase cascade inactivates the regulatory enzymes of fatty acid and cholesterol biosynthesis. FEBS Lett 1987, 223, 217–222. [Google Scholar] [CrossRef] [PubMed]
- Munday, M.R.; Campbell, D.G.; Carling, D.; Hardie, D.G. Identification by amino acid sequencing of three major regulatory phosphorylation sites on rat acetyl-CoA carboxylase. Eur J Biochem 1988, 175, 331–338. [Google Scholar] [CrossRef] [PubMed]
- Jose, C.; Hebert-Chatelain, E.; Bellance, N.; Larendra, A.; Su, M.; Nouette-Gaulain, K.; Rossignol, R. AICAR inhibits cancer cell growth and triggers cell-type distinct effects on OXPHOS biogenesis, oxidative stress and Akt activation. Biochim Biophys Acta 2011, 1807, 707–718. [Google Scholar] [CrossRef]
- Su, C.C.; Hsieh, K.L.; Liu, P.L.; Yeh, H.C.; Huang, S.P.; Fang, S.H.; Cheng, W.C.; Huang, K.H.; Chiu, F.Y.; Lin, I.L.; et al. AICAR Induces Apoptosis and Inhibits Migration and Invasion in Prostate Cancer Cells Through an AMPK/mTOR-Dependent Pathway. Int J Mol Sci 2019, 20. [Google Scholar] [CrossRef]
- Rae, C.; Mairs, R.J. AMPK activation by AICAR sensitizes prostate cancer cells to radiotherapy. Oncotarget 2019, 10, 749–759. [Google Scholar] [CrossRef]
- Wang, C.; Huang, B.; Sun, L.; Wang, X.; Zhou, B.; Tang, H.; Geng, W. MK8722, an AMPK activator, inhibiting carcinoma proliferation, invasion and migration in human pancreatic cancer cells. Biomed Pharmacother 2021, 144, 112325. [Google Scholar] [CrossRef]
- Wang, L.; Zhu, H.; Shi, Z.; Chen, B.; Huang, H.; Lin, G.; Li, J.; Yu, H.; Xu, S.; Chen, G.; et al. MK8722 initiates early-stage autophagy while inhibiting late-stage autophagy via FASN-dependent reprogramming of lipid metabolism. Theranostics 2024, 14, 75–95. [Google Scholar] [CrossRef]
- Neil, E.; Paredes, R.; Pooley, O.; Rubin, B.; Kouskoff, V. The oncogenic fusion protein TAZ::CAMTA1 promotes genomic instability and senescence through hypertranscription. Commun Biol 2023, 6, 1174. [Google Scholar] [CrossRef]
- Piccolo, S.; Panciera, T.; Contessotto, P.; Cordenonsi, M. YAP/TAZ as master regulators in cancer: modulation, function and therapeutic approaches. Nat Cancer 2023, 4, 9–26. [Google Scholar] [CrossRef]
- Zanconato, F.; Cordenonsi, M.; Piccolo, S. YAP/TAZ at the Roots of Cancer. Cancer Cell 2016, 29, 783–803. [Google Scholar] [CrossRef] [PubMed]
- Bolster, D.R.; Crozier, S.J.; Kimball, S.R.; Jefferson, L.S. AMP-activated protein kinase suppresses protein synthesis in rat skeletal muscle through down-regulated mammalian target of rapamycin (mTOR) signaling. J Biol Chem 2002, 277, 23977–23980. [Google Scholar] [CrossRef] [PubMed]
- Liu, L.; Cash, T.P.; Jones, R.G.; Keith, B.; Thompson, C.B.; Simon, M.C. Hypoxia-induced energy stress regulates mRNA translation and cell growth. Mol Cell 2006, 21, 521–531. [Google Scholar] [CrossRef] [PubMed]
- Inoki, K.; Zhu, T.; Guan, K.L. TSC2 mediates cellular energy response to control cell growth and survival. Cell 2003, 115, 577–590. [Google Scholar] [CrossRef]
- Gwinn, D.M.; Shackelford, D.B.; Egan, D.F.; Mihaylova, M.M.; Mery, A.; Vasquez, D.S.; Turk, B.E.; Shaw, R.J. AMPK phosphorylation of raptor mediates a metabolic checkpoint. Mol Cell 2008, 30, 214–226. [Google Scholar] [CrossRef]
- Corradetti, M.N.; Inoki, K.; Bardeesy, N.; DePinho, R.A.; Guan, K.L. Regulation of the TSC pathway by LKB1: evidence of a molecular link between tuberous sclerosis complex and Peutz-Jeghers syndrome. Genes Dev 2004, 18, 1533–1538. [Google Scholar] [CrossRef]
- Stacchiotti, S.; Martini, S.; Pasquali, S.; Frezza, A.M.; Beretta, A.; Percio, S.; Lecchi, M.; Tortoreto, M.; Barisella, M.; Collini, P.; et al. GDF-15 Predicts Epithelioid Hemangioendothelioma Aggressiveness and Is Downregulated by Sirolimus through ATF4/ATF5 Suppression. Clin Cancer Res 2024, 30, 5122–5137. [Google Scholar] [CrossRef]
- Stacchiotti, S.; Simeone, N.; Lo Vullo, S.; Baldi, G.G.; Brunello, A.; Vincenzi, B.; Palassini, E.; Dagrada, G.; Collini, P.; Morosi, C.; et al. Activity of sirolimus in patients with progressive epithelioid hemangioendothelioma: A case-series analysis within the Italian Rare Cancer Network. Cancer 2021, 127, 569–576. [Google Scholar] [CrossRef]
- Stacchiotti, S.; Provenzano, S.; Dagrada, G.; Negri, T.; Brich, S.; Basso, U.; Brunello, A.; Grosso, F.; Galli, L.; Palassini, E.; et al. Sirolimus in Advanced Epithelioid Hemangioendothelioma: A Retrospective Case-Series Analysis from the Italian Rare Cancer Network Database. Ann Surg Oncol 2016, 23, 2735–2744. [Google Scholar] [CrossRef]
- Isotani, S.; Hara, K.; Tokunaga, C.; Inoue, H.; Avruch, J.; Yonezawa, K. Immunopurified mammalian target of rapamycin phosphorylates and activates p70 S6 kinase alpha in vitro. J Biol Chem 1999, 274, 34493–34498. [Google Scholar] [CrossRef]
- Stocker, H.; Radimerski, T.; Schindelholz, B.; Wittwer, F.; Belawat, P.; Daram, P.; Breuer, S.; Thomas, G.; Hafen, E. Rheb is an essential regulator of S6K in controlling cell growth in Drosophila. Nat Cell Biol 2003, 5, 559–565. [Google Scholar] [CrossRef] [PubMed]
- Kimura, N.; Tokunaga, C.; Dalal, S.; Richardson, C.; Yoshino, K.; Hara, K.; Kemp, B.E.; Witters, L.A.; Mimura, O.; Yonezawa, K. A possible linkage between AMP-activated protein kinase (AMPK) and mammalian target of rapamycin (mTOR) signalling pathway. Genes Cells 2003, 8, 65–79. [Google Scholar] [CrossRef] [PubMed]
- Castro, A.F.; Rebhun, J.F.; Clark, G.J.; Quilliam, L.A. Rheb binds tuberous sclerosis complex 2 (TSC2) and promotes S6 kinase activation in a rapamycin- and farnesylation-dependent manner. J Biol Chem 2003, 278, 32493–32496. [Google Scholar] [CrossRef] [PubMed]
- Inoki, K.; Li, Y.; Xu, T.; Guan, K.L. Rheb GTPase is a direct target of TSC2 GAP activity and regulates mTOR signaling. Genes Dev 2003, 17, 1829–1834. [Google Scholar] [CrossRef]
- Li, Y.; Inoki, K.; Guan, K.L. Biochemical and functional characterizations of small GTPase Rheb and TSC2 GAP activity. Mol Cell Biol 2004, 24, 7965–7975. [Google Scholar] [CrossRef]
- Zhang, Y.; Gao, X.; Saucedo, L.J.; Ru, B.; Edgar, B.A.; Pan, D. Rheb is a direct target of the tuberous sclerosis tumour suppressor proteins. Nat Cell Biol 2003, 5, 578–581. [Google Scholar] [CrossRef]
- Tee, A.R.; Manning, B.D.; Roux, P.P.; Cantley, L.C.; Blenis, J. Tuberous sclerosis complex gene products, Tuberin and Hamartin, control mTOR signaling by acting as a GTPase-activating protein complex toward Rheb. Curr Biol 2003, 13, 1259–1268. [Google Scholar] [CrossRef]
- Sato, T.; Umetsu, A.; Tamanoi, F. Characterization of the Rheb-mTOR signaling pathway in mammalian cells: constitutive active mutants of Rheb and mTOR. Methods Enzymol 2008, 438, 307–320. [Google Scholar] [CrossRef]
- Saucedo, L.J.; Gao, X.; Chiarelli, D.A.; Li, L.; Pan, D.; Edgar, B.A. Rheb promotes cell growth as a component of the insulin/TOR signalling network. Nat Cell Biol 2003, 5, 566–571. [Google Scholar] [CrossRef]
- Hara, K.; Maruki, Y.; Long, X.; Yoshino, K.; Oshiro, N.; Hidayat, S.; Tokunaga, C.; Avruch, J.; Yonezawa, K. Raptor, a binding partner of target of rapamycin (TOR), mediates TOR action. Cell 2002, 110, 177–189. [Google Scholar] [CrossRef]
- Loewith, R.; Jacinto, E.; Wullschleger, S.; Lorberg, A.; Crespo, J.L.; Bonenfant, D.; Oppliger, W.; Jenoe, P.; Hall, M.N. Two TOR complexes, only one of which is rapamycin sensitive, have distinct roles in cell growth control. Mol Cell 2002, 10, 457–468. [Google Scholar] [CrossRef] [PubMed]
- Kim, D.H.; Sarbassov, D.D.; Ali, S.M.; King, J.E.; Latek, R.R.; Erdjument-Bromage, H.; Tempst, P.; Sabatini, D.M. mTOR interacts with raptor to form a nutrient-sensitive complex that signals to the cell growth machinery. Cell 2002, 110, 163–175. [Google Scholar] [CrossRef] [PubMed]
- Karastaneva, A.; Gasparella, P.; Tschauner, S.; Crazzolara, R.; Kropshofer, G.; Modl, M.; Pfleger, A.; Burmas, A.; Pocivalnik, M.; Ulreich, R.; et al. Indications and Limitations of Sirolimus in the Treatment of Vascular Anomalies-Insights From a Retrospective Case Series. Front Pediatr 2022, 10, 857436. [Google Scholar] [CrossRef] [PubMed]
- Liu, X.; Zhou, R.; Si, S.; Liu, L.; Yang, S.; Han, D.; Tan, H. Sirolimus combined with interferon-alpha 2b therapy for giant hepatic epithelioid hemangioendothelioma: a case report. Front Oncol 2022, 12, 972306. [Google Scholar] [CrossRef]
- Liu, X.; Zhou, R.; Liu, L.; Si, S.; Yang, S.; Han, D.; Tan, H. Short-term outcomes of combined therapy with sirolimus and interferon-alpha 2b for advanced hepatic epithelioid hemangioendothelioma. Ther Adv Med Oncol 2024, 16, 17588359231220509. [Google Scholar] [CrossRef]
- Robinson, D.; Leonard, H.; Baldi, G.G.; Tap, W.D.; Jones, R.L.; Stacchiotti, S.; Pantziarka, P. The patient perspective on sirolimus for epithelioid hemangioendothelioma (EHE): results of a community survey highlighting the importance of equitable access to treatments. Front Oncol 2024, 14, 1367237. [Google Scholar] [CrossRef]
- Liu, X.; Yang, P.; Liu, L.; Si, S.; Zhou, R.; Liu, T.; Tan, H. Long-term prognosis and treatment modalities of hepatic epithelioid hemangioendothelioma: a retrospective study of 228 patients. BMC Cancer 2024, 24, 1285. [Google Scholar] [CrossRef]
- Cournoyer, E.; Al-Ibraheemi, A.; Engel, E.; Chaudry, G.; Stapleton, S.; Adams, D.M. Clinical characterization and long-term outcomes in pediatric epithelioid hemangioendothelioma. Pediatr Blood Cancer 2020, 67, e28045. [Google Scholar] [CrossRef]
- Engel, E.R.; Cournoyer, E.; Adams, D.M.; Stapleton, S. A Retrospective Review of the Use of Sirolimus for Pediatric Patients With Epithelioid Hemangioendothelioma. J Pediatr Hematol Oncol 2020, 42, e826–e829. [Google Scholar] [CrossRef]
- Smrke, A.M.; Huang, P.H.; Jones, R.L. Sirolimus for patients with progressive epithelioid hemangioendothelioma. Cancer 2021, 127, 504–506. [Google Scholar] [CrossRef]
- Cohen, E.E.; Wu, K.; Hartford, C.; Kocherginsky, M.; Eaton, K.N.; Zha, Y.; Nallari, A.; Maitland, M.L.; Fox-Kay, K.; Moshier, K.; et al. Phase I studies of sirolimus alone or in combination with pharmacokinetic modulators in advanced cancer patients. Clin Cancer Res 2012, 18, 4785–4793. [Google Scholar] [CrossRef] [PubMed]
- Stacchiotti, S.; Miah, A.B.; Frezza, A.M.; Messiou, C.; Morosi, C.; Caraceni, A.; Antonescu, C.R.; Bajpai, J.; Baldini, E.; Bauer, S.; et al. Epithelioid hemangioendothelioma, an ultra-rare cancer: a consensus paper from the community of experts. ESMO Open 2021, 6, 100170. [Google Scholar] [CrossRef] [PubMed]
- Liu, X.; Guo, B.; Li, Q.; Nie, J. mTOR in metabolic homeostasis and disease. Exp Cell Res 2024, 441, 114173. [Google Scholar] [CrossRef] [PubMed]
- Marafie, S.K.; Al-Mulla, F.; Abubaker, J. mTOR: Its Critical Role in Metabolic Diseases, Cancer, and the Aging Process. Int J Mol Sci 2024, 25. [Google Scholar] [CrossRef] [PubMed]
- Sarbassov, D.D.; Ali, S.M.; Sabatini, D.M. Growing roles for the mTOR pathway. Curr Opin Cell Biol 2005, 17, 596–603. [Google Scholar] [CrossRef]
- Saxton, R.A.; Sabatini, D.M. mTOR Signaling in Growth, Metabolism, and Disease. Cell 2017, 168, 960–976. [Google Scholar] [CrossRef]
- El-Tanani, M.; Nsairat, H.; Aljabali, A.A.; Serrano-Aroca, A.; Mishra, V.; Mishra, Y.; Naikoo, G.A.; Alshaer, W.; Tambuwala, M.M. Role of mammalian target of rapamycin (mTOR) signalling in oncogenesis. Life Sci 2023, 323, 121662. [Google Scholar] [CrossRef]
- Rad, E.; Murray, J.T.; Tee, A.R. Oncogenic Signalling through Mechanistic Target of Rapamycin (mTOR): A Driver of Metabolic Transformation and Cancer Progression. Cancers (Basel) 2018, 10. [Google Scholar] [CrossRef]
- Grabiner, B.C.; Nardi, V.; Birsoy, K.; Possemato, R.; Shen, K.; Sinha, S.; Jordan, A.; Beck, A.H.; Sabatini, D.M. A diverse array of cancer-associated MTOR mutations are hyperactivating and can predict rapamycin sensitivity. Cancer Discov 2014, 4, 554–563. [Google Scholar] [CrossRef]
- Tian, T.; Li, X.; Zhang, J. mTOR Signaling in Cancer and mTOR Inhibitors in Solid Tumor Targeting Therapy. Int J Mol Sci 2019, 20. [Google Scholar] [CrossRef]
- Scalora, N.; DeWane, G.; Drebot, Y.; Khan, A.A.; Sinha, S.; Ghosh, K.; Robinson, D.; Cogswell, P.; Bellizzi, A.M.; Snow, A.N.; et al. EHE cell cultures: a platform for mechanistic and therapeutic investigation. bioRxiv 2025. [Google Scholar] [CrossRef]
- Liang, N.; Zhang, C.; Dill, P.; Panasyuk, G.; Pion, D.; Koka, V.; Gallazzini, M.; Olson, E.N.; Lam, H.; Henske, E.P.; et al. Regulation of YAP by mTOR and autophagy reveals a therapeutic target of tuberous sclerosis complex. J Exp Med 2014, 211, 2249–2263. [Google Scholar] [CrossRef] [PubMed]
- Hu, J.K.; Du, W.; Shelton, S.J.; Oldham, M.C.; DiPersio, C.M.; Klein, O.D. An FAK-YAP-mTOR Signaling Axis Regulates Stem Cell-Based Tissue Renewal in Mice. Cell Stem Cell 2017, 21, 91–106 e106. [Google Scholar] [CrossRef] [PubMed]
- Kudryashova, T.V.; Goncharov, D.A.; Pena, A.; Kelly, N.; Vanderpool, R.; Baust, J.; Kobir, A.; Shufesky, W.; Mora, A.L.; Morelli, A.E.; et al. HIPPO-Integrin-linked Kinase Cross-Talk Controls Self-Sustaining Proliferation and Survival in Pulmonary Hypertension. Am J Respir Crit Care Med 2016, 194, 866–877. [Google Scholar] [CrossRef] [PubMed]
- Tumaneng, K.; Schlegelmilch, K.; Russell, R.C.; Yimlamai, D.; Basnet, H.; Mahadevan, N.; Fitamant, J.; Bardeesy, N.; Camargo, F.D.; Guan, K.L. YAP mediates crosstalk between the Hippo and PI(3)K-TOR pathways by suppressing PTEN via miR-29. Nat Cell Biol 2012, 14, 1322–1329. [Google Scholar] [CrossRef]
- Seront, E.; Hermans, C.; Boon, L.M.; Vikkula, M. Targeted treatments for vascular malformations: current state of the art. J Thromb Haemost 2024, 22, 2961–2975. [Google Scholar] [CrossRef]
- Kopec, J.; Salacinska-Los, E.; Orzechowska, M.; Sokolnicka, M.; Gawlowska-Marciniak, A.; Przemyslaw, P. mTOR Pathway Substrates Present High Activation in Vascular Malformations and Significantly Decrease with Age. Diagnostics (Basel) 2023, 14. [Google Scholar] [CrossRef]
- Rose, A.L.; Cathey, S.S. Genetic Causes of Vascular Malformations and Common Signaling Pathways Involved in Their Formation. Dermatol Clin 2022, 40, 449–459. [Google Scholar] [CrossRef]
- Cooke-Barber, J.; Kreimer, S.; Patel, M.; Dasgupta, R.; Jeng, M. Venous malformations. Semin Pediatr Surg 2020, 29, 150976. [Google Scholar] [CrossRef]
- Fereydooni, A.; Dardik, A.; Nassiri, N. Molecular changes associated with vascular malformations. J Vasc Surg 2019, 70, 314–326 e311. [Google Scholar] [CrossRef]
- Wiegand, S.; Dietz, A.; Wichmann, G. Efficacy of sirolimus in children with lymphatic malformations of the head and neck. Eur Arch Otorhinolaryngol 2022, 279, 3801–3810. [Google Scholar] [CrossRef] [PubMed]
- di Blasio, L.; Puliafito, A.; Gagliardi, P.A.; Comunanza, V.; Somale, D.; Chiaverina, G.; Bussolino, F.; Primo, L. PI3K/mTOR inhibition promotes the regression of experimental vascular malformations driven by PIK3CA-activating mutations. Cell Death Dis 2018, 9, 45. [Google Scholar] [CrossRef] [PubMed]
- Seront, E.; Van Damme, A.; Legrand, C.; Bisdorff-Bresson, A.; Orcel, P.; Funck-Brentano, T.; Sevestre, M.A.; Dompmartin, A.; Quere, I.; Brouillard, P.; et al. Preliminary results of the European multicentric phase III trial regarding sirolimus in slow-flow vascular malformations. JCI Insight 2023, 8. [Google Scholar] [CrossRef]
- Ji, Y.; Chen, S.; Yang, K.; Zhou, J.; Zhang, X.; Jiang, X.; Xu, X.; Lu, G.; Qiu, L.; Kong, F.; et al. A prospective multicenter study of sirolimus for complicated vascular anomalies. J Vasc Surg 2021, 74, 1673–1681 e1673. [Google Scholar] [CrossRef] [PubMed]
- Maruani, A.; Tavernier, E.; Boccara, O.; Mazereeuw-Hautier, J.; Leducq, S.; Bessis, D.; Guibaud, L.; Vabres, P.; Carmignac, V.; Mallet, S.; et al. Sirolimus (Rapamycin) for Slow-Flow Malformations in Children: The Observational-Phase Randomized Clinical PERFORMUS Trial. JAMA Dermatol 2021, 157, 1289–1298. [Google Scholar] [CrossRef] [PubMed]
- Ozeki, M.; Endo, S.; Yasue, S.; Asada, R.; Saito, A.M.; Hashimoto, H.; Ueno, S.; Watanabe, S.; Kato, M.; Deie, K.; et al. Sirolimus treatment for intractable vascular anomalies (SIVA): An open-label, single-arm, multicenter, prospective trial. Pediatr Int 2025, 67, e70002. [Google Scholar] [CrossRef]
- Maza-Morales, M.; Valdes-Loperena, S.; Duran-McKinster, L.C.; Garcia-Romero, M.T. The use of mTOR inhibitors for the treatment of kaposiform hemangioendothelioma. A systematic review. Pediatr Dermatol 2023, 40, 440–445. [Google Scholar] [CrossRef]
- Blatt, J.; McLean, T.W.; Castellino, S.M.; Burkhart, C.N. A review of contemporary options for medical management of hemangiomas, other vascular tumors, and vascular malformations. Pharmacol Ther 2013, 139, 327–333. [Google Scholar] [CrossRef]
- Lavado, A.; Park, J.Y.; Pare, J.; Finkelstein, D.; Pan, H.; Xu, B.; Fan, Y.; Kumar, R.P.; Neale, G.; Kwak, Y.D.; et al. The Hippo Pathway Prevents YAP/TAZ-Driven Hypertranscription and Controls Neural Progenitor Number. Dev Cell 2018, 47, 576–591 e578. [Google Scholar] [CrossRef]
- Pobbati, A.V.; Burtscher, A.; Rajaram Siva, N.; Hallett, A.; Romigh, T.; Che, K.; Zhao, B.; Coker, J.A.; Wang, N.; Stauffer, S.R.; et al. CDK9 Inhibition by Dinaciclib Is a Therapeutic Vulnerability in Epithelioid Hemangioendothelioma. Clin Cancer Res 2024, 30, 4179–4189. [Google Scholar] [CrossRef]
- Ronnebaum, S.M.; Patterson, C.; Schisler, J.C. Minireview: hey U(PS): metabolic and proteolytic homeostasis linked via AMPK and the ubiquitin proteasome system. Mol Endocrinol 2014, 28, 1602–1615. [Google Scholar] [CrossRef] [PubMed]
- He, C.; Li, H.; Viollet, B.; Zou, M.H.; Xie, Z. AMPK Suppresses Vascular Inflammation In Vivo by Inhibiting Signal Transducer and Activator of Transcription-1. Diabetes 2015, 64, 4285–4297. [Google Scholar] [CrossRef] [PubMed]
- Wang, S.; Zhang, M.; Liang, B.; Xu, J.; Xie, Z.; Liu, C.; Viollet, B.; Yan, D.; Zou, M.H. AMPKalpha2 deletion causes aberrant expression and activation of NAD(P)H oxidase and consequent endothelial dysfunction in vivo: role of 26S proteasomes. Circ Res 2010, 106, 1117–1128. [Google Scholar] [CrossRef]
- Viana, R.; Aguado, C.; Esteban, I.; Moreno, D.; Viollet, B.; Knecht, E.; Sanz, P. Role of AMP-activated protein kinase in autophagy and proteasome function. Biochem Biophys Res Commun 2008, 369, 964–968. [Google Scholar] [CrossRef]
- Liu, C.Y.; Zha, Z.Y.; Zhou, X.; Zhang, H.; Huang, W.; Zhao, D.; Li, T.; Chan, S.W.; Lim, C.J.; Hong, W.; et al. The hippo tumor pathway promotes TAZ degradation by phosphorylating a phosphodegron and recruiting the SCFbeta-TrCP E3 ligase. J Biol Chem 2010, 285, 37159–37169. [Google Scholar] [CrossRef]
- Lamar, J.M.; Motilal Nehru, V.; Weinberg, G. Epithelioid Hemangioendothelioma as a Model of YAP/TAZ-Driven Cancer: Insights from a Rare Fusion Sarcoma. Cancers (Basel) 2018, 10. [Google Scholar] [CrossRef]
- Dixon, R.; Gourzis, J.; McDermott, D.; Fujitaki, J.; Dewland, P.; Gruber, H. AICA-riboside: safety, tolerance, and pharmacokinetics of a novel adenosine-regulating agent. J Clin Pharmacol 1991, 31, 342–347. [Google Scholar] [CrossRef]
- Ovens, A.J.; Gee, Y.S.; Ling, N.X.Y.; Yu, D.; Hardee, J.P.; Chung, J.D.; Ngoei, K.R.W.; Waters, N.J.; Hoffman, N.J.; Scott, J.W.; et al. Structure-function analysis of the AMPK activator SC4 and identification of a potent pan AMPK activator. Biochem J 2022, 479, 1181–1204. [Google Scholar] [CrossRef]
- Sun, G.; You, Y.; Li, H.; Cheng, Y.; Qian, M.; Zhou, X.; Yuan, H.; Xu, Q.L.; Dai, L.; Wang, P.; et al. Discovery of AdipoRon analogues as novel AMPK activators without inhibiting mitochondrial complex I. Eur J Med Chem 2020, 200, 112466. [Google Scholar] [CrossRef]
- Szulzewsky, F.; Arora, S.; Hoellerbauer, P.; King, C.; Nathan, E.; Chan, M.; Cimino, P.J.; Ozawa, T.; Kawauchi, D.; Pajtler, K.W.; et al. Comparison of tumor-associated YAP1 fusions identifies a recurrent set of functions critical for oncogenesis. Genes Dev 2020, 34, 1051–1064. [Google Scholar] [CrossRef]
- Szulzewsky, F.; Holland, E.C.; Vasioukhin, V. YAP1 and its fusion proteins in cancer initiation, progression and therapeutic resistance. Dev Biol 2021, 475, 205–221. [Google Scholar] [CrossRef] [PubMed]
- Garcia, K.; Gingras, A.C.; Harvey, K.F.; Tanas, M.R. TAZ/YAP fusion proteins: mechanistic insights and therapeutic opportunities. Trends Cancer 2022, 8, 1033–1045. [Google Scholar] [CrossRef] [PubMed]
Figure 1.
EHE cells are sensitive to TEAD inhibition. EHE6 (A, C-E) and EHE17 (B,F) cells were treated with the indicated doses of the TEAD2/4 inhibitor MGH-CP1 for 8 hours (A,B) or every day for 4 days (C-F) and then assayed for TEAD transcriptional activity (A,B), or for cell viability using a CCK8 assay (C,D) and by counting cell number (E,F). (A,B, D-F) The plots the show mean ± SD and each group was normalized to untreated cells (represented by the dotted line at Y=1). (A,B) n=3 independent experiments where 2 wells read in duplicate were averaged; ****p ≤ 0.0001 by One-way ANOVA with Dunnett’s post-hoc test comparing each group to vehicle control. (C) For each group, the absorbance at each timepoint was normalized to the absorbance of untreated cells at the 24-hour timepoint for n=1 experiment where 4 wells were averaged. (D-F) n=3 (D,E) or n=4 (F) independent experiments where 4 replicate wells were averaged; **p ≤ 0.01, ***p ≤ 0.001, and ****p ≤ 0.0001 by unpaired t-test.
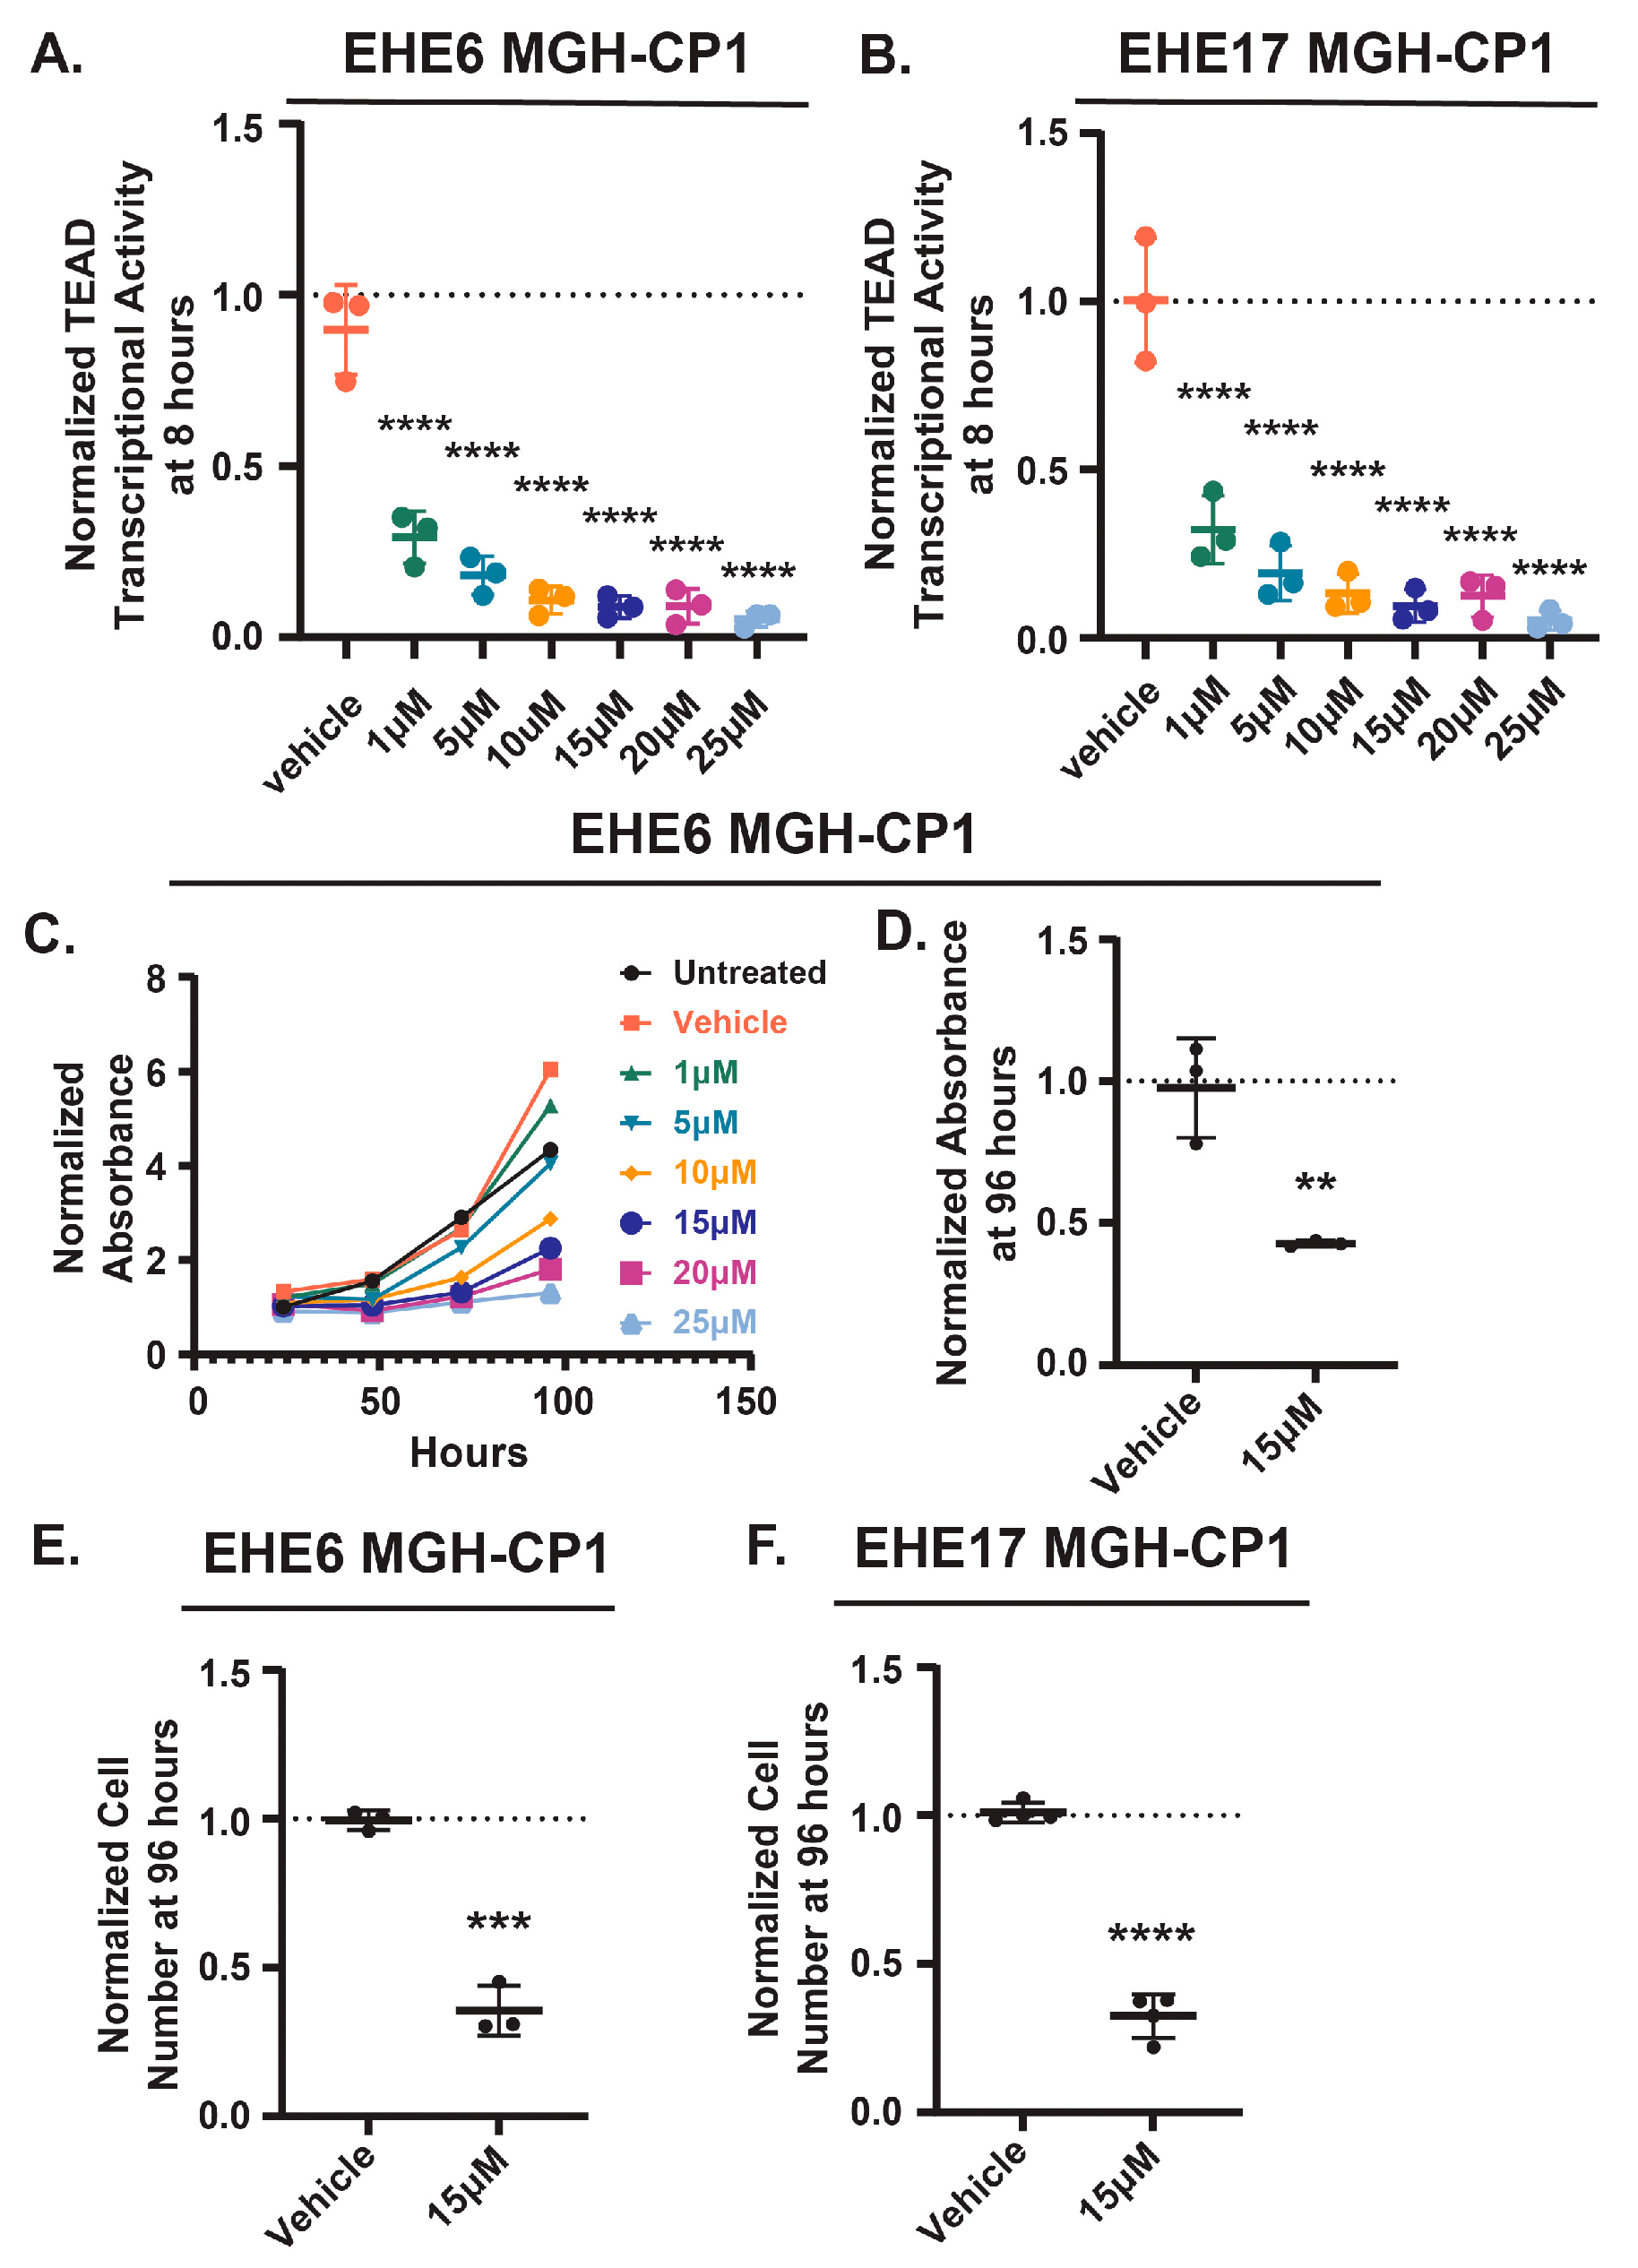
Figure 2.
The AMPK activators AICAR and MK8722 inhibit EHE cell viability. EHE6 (A-D, F-I) and EHE17 (E,K) cells were treated with the AMPK activators AICAR (A-E) or MK8722 (F-K) at the indicated doses every day for 4 days (A, C-F, H-J) or for 24 hours (B,G). Cells were then assayed for cell viability using a CCK8 assay (A,C,F,H) and by counting cell numbers (D,E,I,J), or by Western Blot (B,G). (A,F) For each group, the absorbance at each timepoint was normalized to the absorbance of untreated cells at the 24-hour timepoint; n=1 independent experiment where 4 wells were averaged. (B,G) Representative Western blots with quantification of phosphorylated over total AMPK and ACC shown. (C-E, H-J) The plots show the mean ± SD and each group was normalized to untreated cells (represented by dotted lines at Y=1 on graphs).n=3 independent experiments where 4 replicate wells were averaged; **p ≤ 0.01 and ****p ≤ 0.0001 by unpaired t-test.
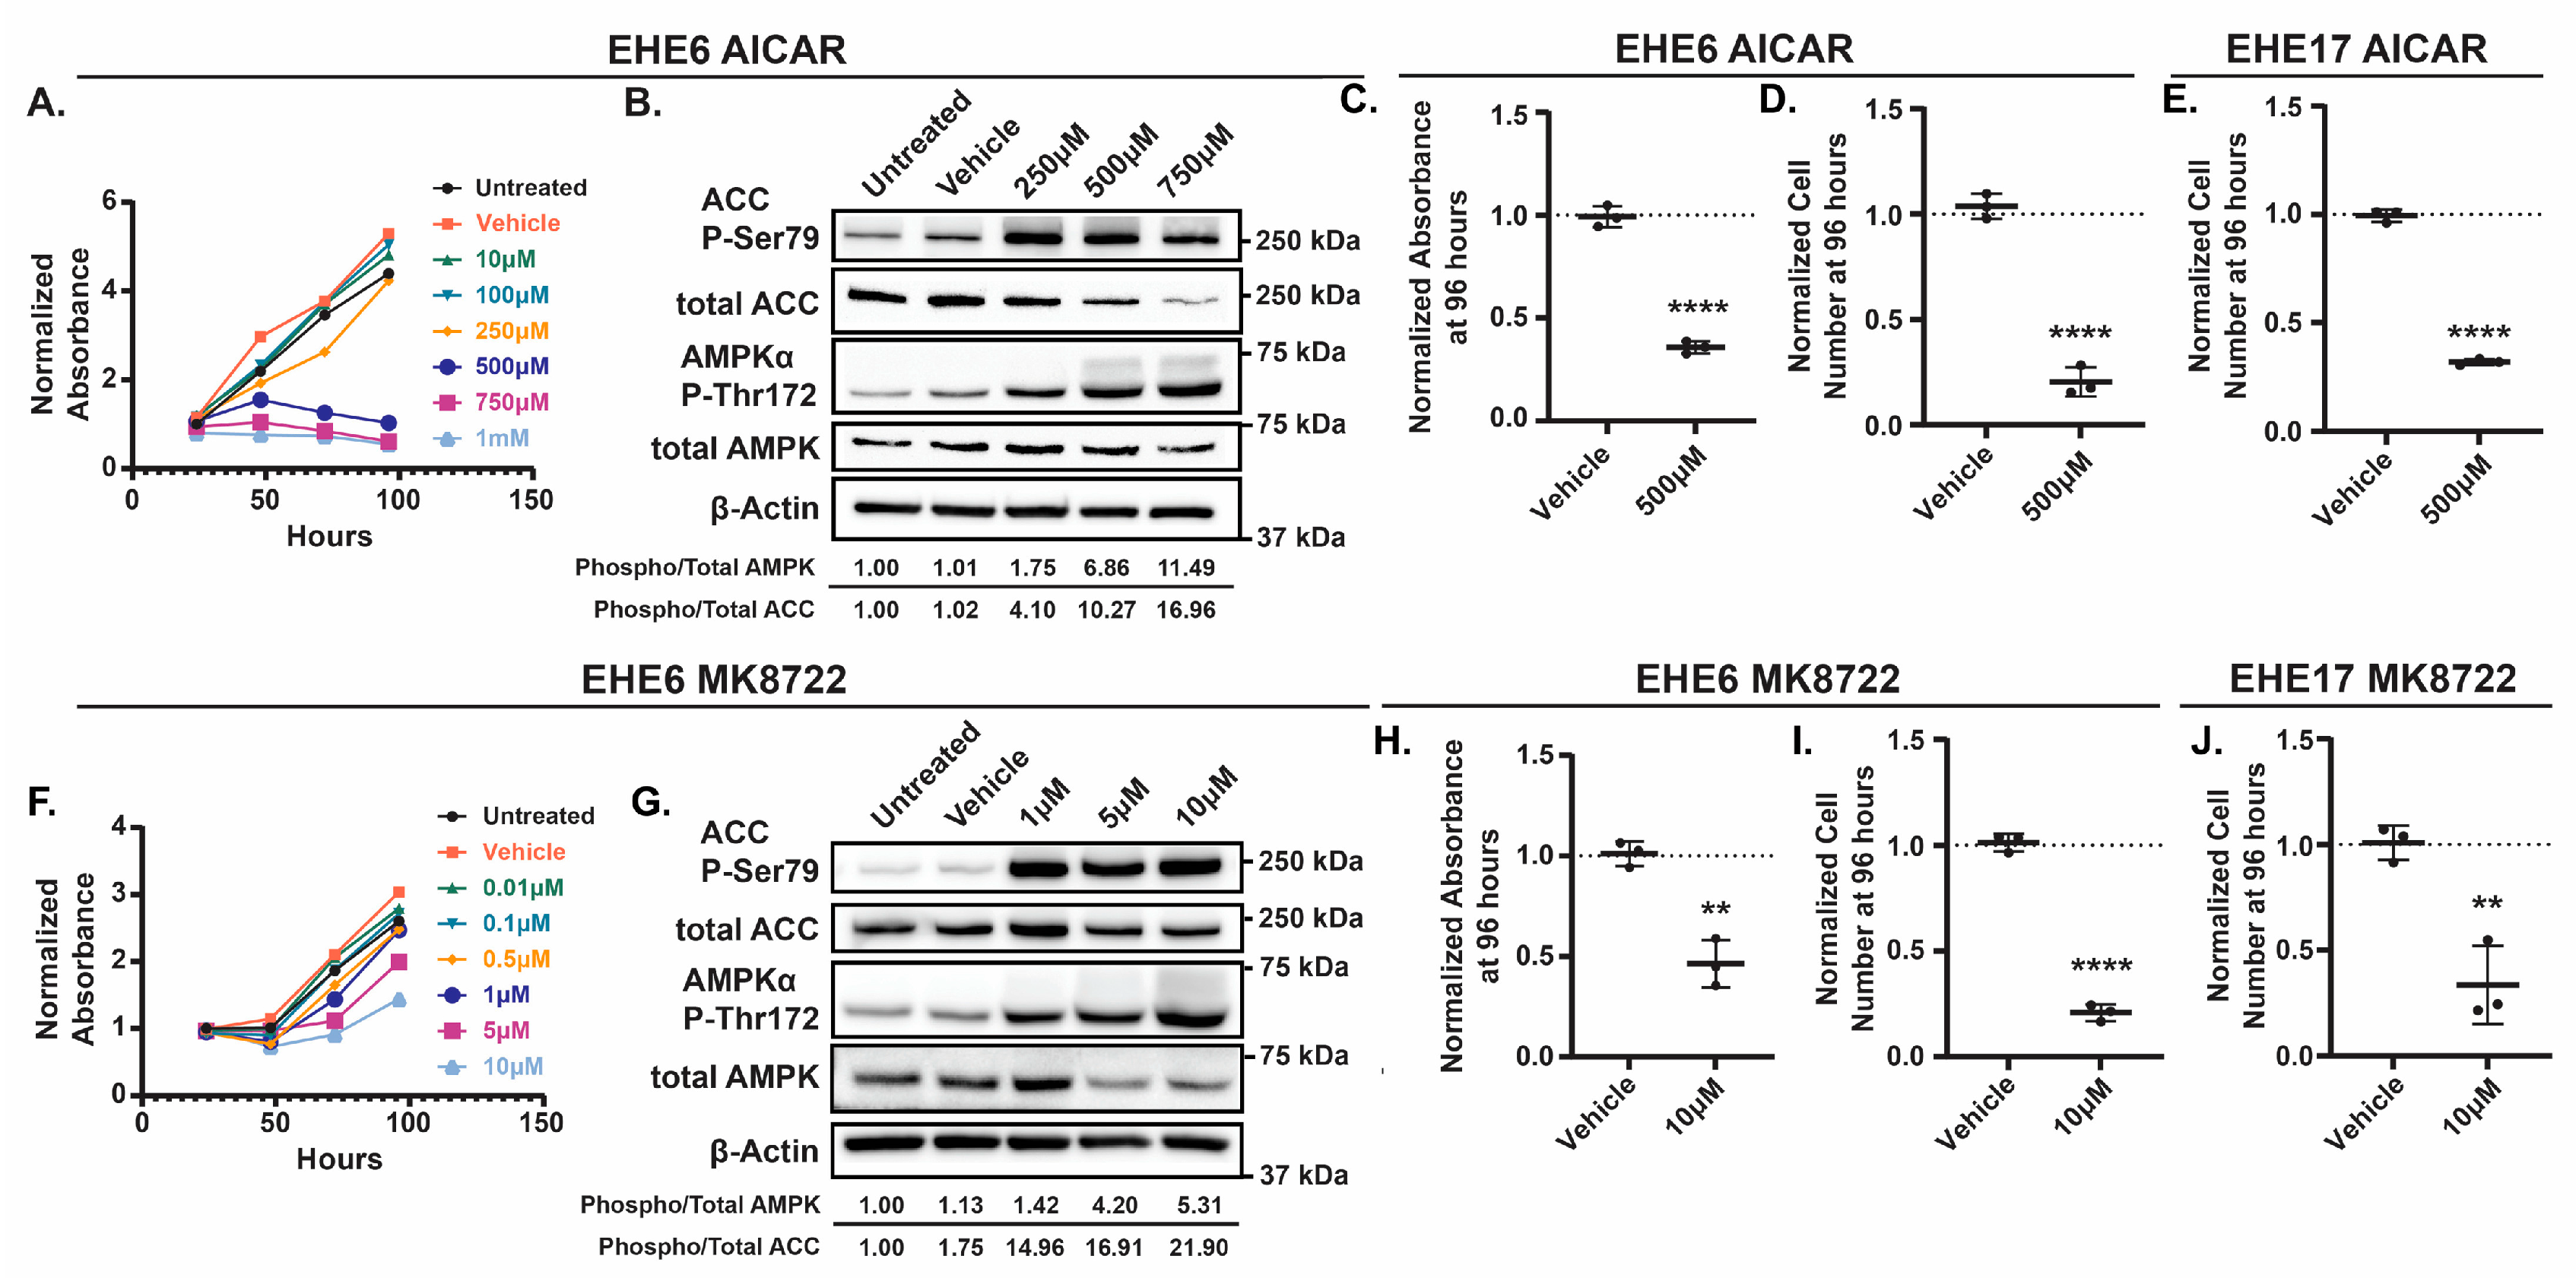
Figure 3.
AMPK activation increases TAZ-CAMTA1 and decreases YAP protein levels. EHE6 cells were treated for 24 hours with AICAR (A, C-G) or MK8722 (B) and assayed for TEAD transcriptional activity (A,B), by Western Blot (C-E), or by qPCR (F,G). All plots show the mean ± SD. (A,B) Each group was normalized to untreated cells (represented by dotted lines at Y=1 on graphs), n=3 independent experiments where 2 wells read in duplicate were averaged; ns = not significant, *p ≤ 0.05, **p ≤ 0.01, ****p ≤ 0.0001, by One-way ANOVA with Dunnett’s Post-hoc test comparing each group to vehicle treated cells. (C-E) Representative Western blots. (D,E) Band intensity was quantified and normalized to GAPDH for n=4 independent Western blot experiments where each group was normalized to vehicle treated cells (represented by dotted lines at Y=1 on graphs); *p ≤ 0.05 and ***p ≤ 0.001 by one sample t-test. (F-G) n=3 independent experiments where 3 technical replicates were averaged and each group was normalized to untreated cells (represented by dotted lines at Y=1 on graphs); ns = not significant by unpaired t-test.
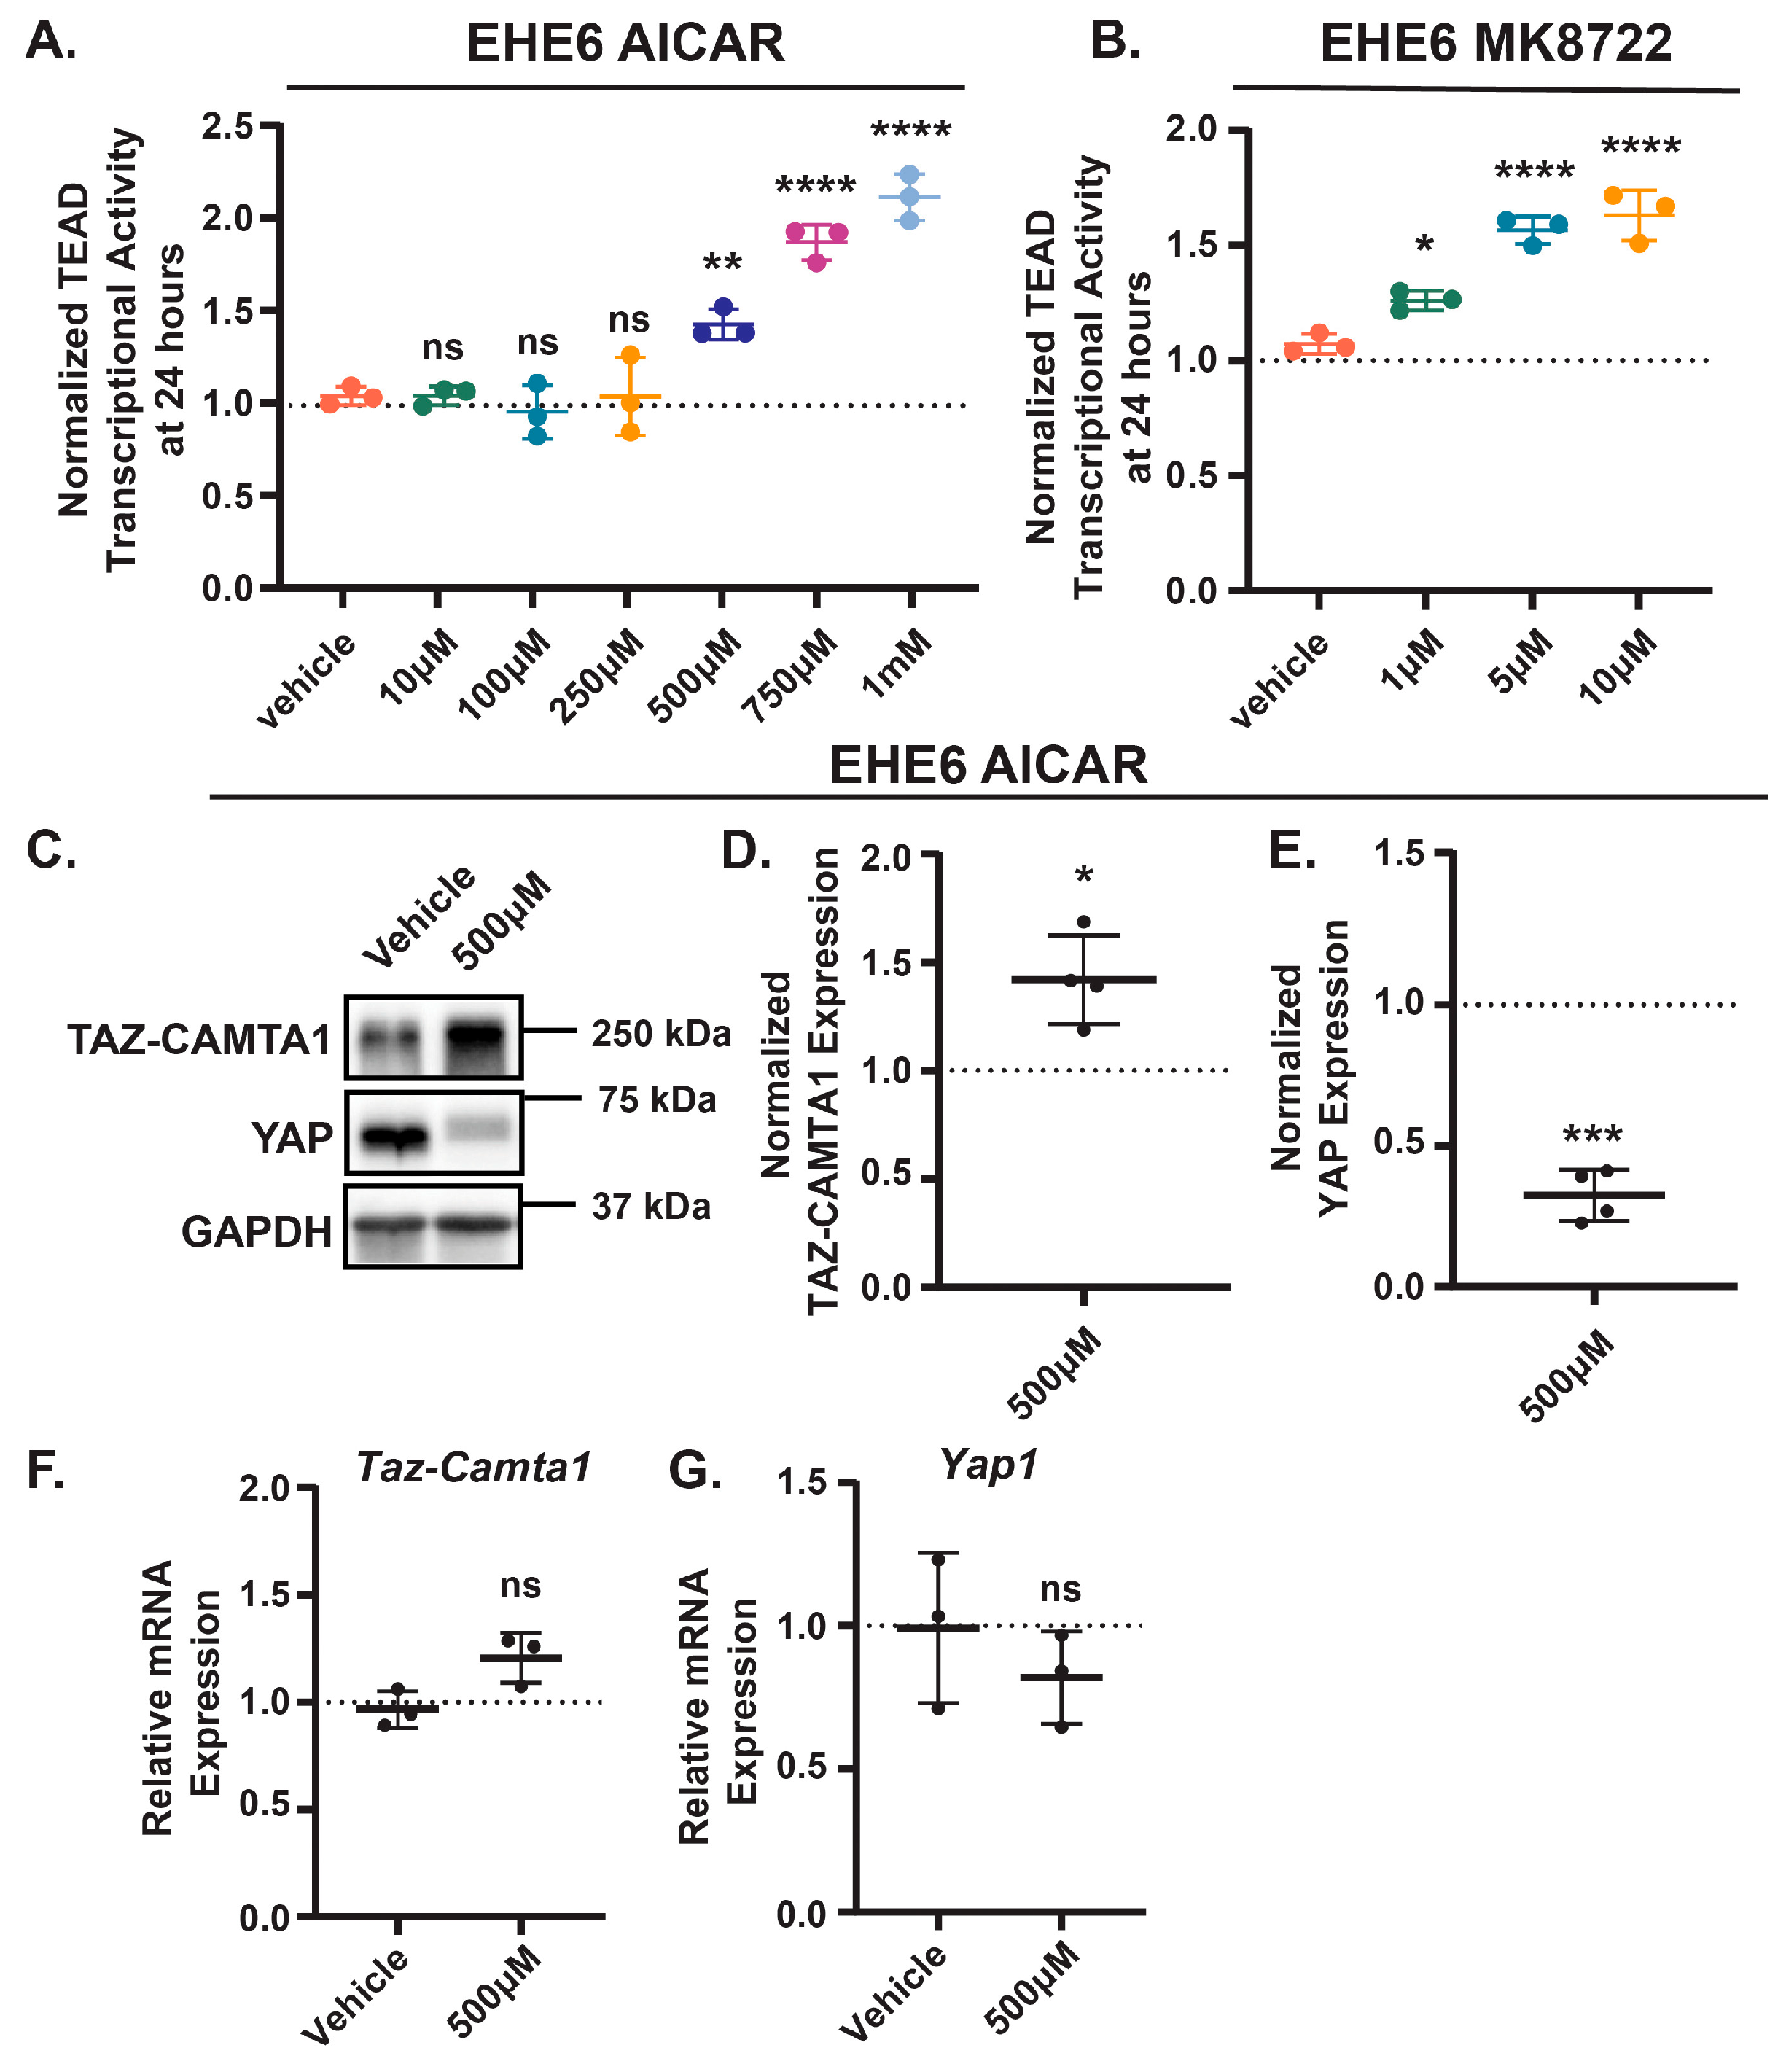
Figure 4.
Loss of YAP doesn’t affect EHE cell viability or TAZ-CAMTA1 expression. (A-E) EHE6 cells were transfected with a non-targeting siRNA (siNTC) or pooled siRNAs that target YAP (siYAP) and then assayed by qPCR (A), Western blot (B-D), or for cell viability by counting cell number (E). All plots show the mean ± SD where each group was normalized to untransfected cells (represented by dotted lines at Y=1 on graphs). (B) Representative Western blots. (C,D) Band intensity was quantified and normalized to GAPDH for n=3 independent Western blot experiments. n=3 (A) or n=4 (E) independent experiments where 4 replicates were averaged; ns = not significant, ***p ≤ 0.001, and ****p ≤ 0.0001 by unpaired t-test.
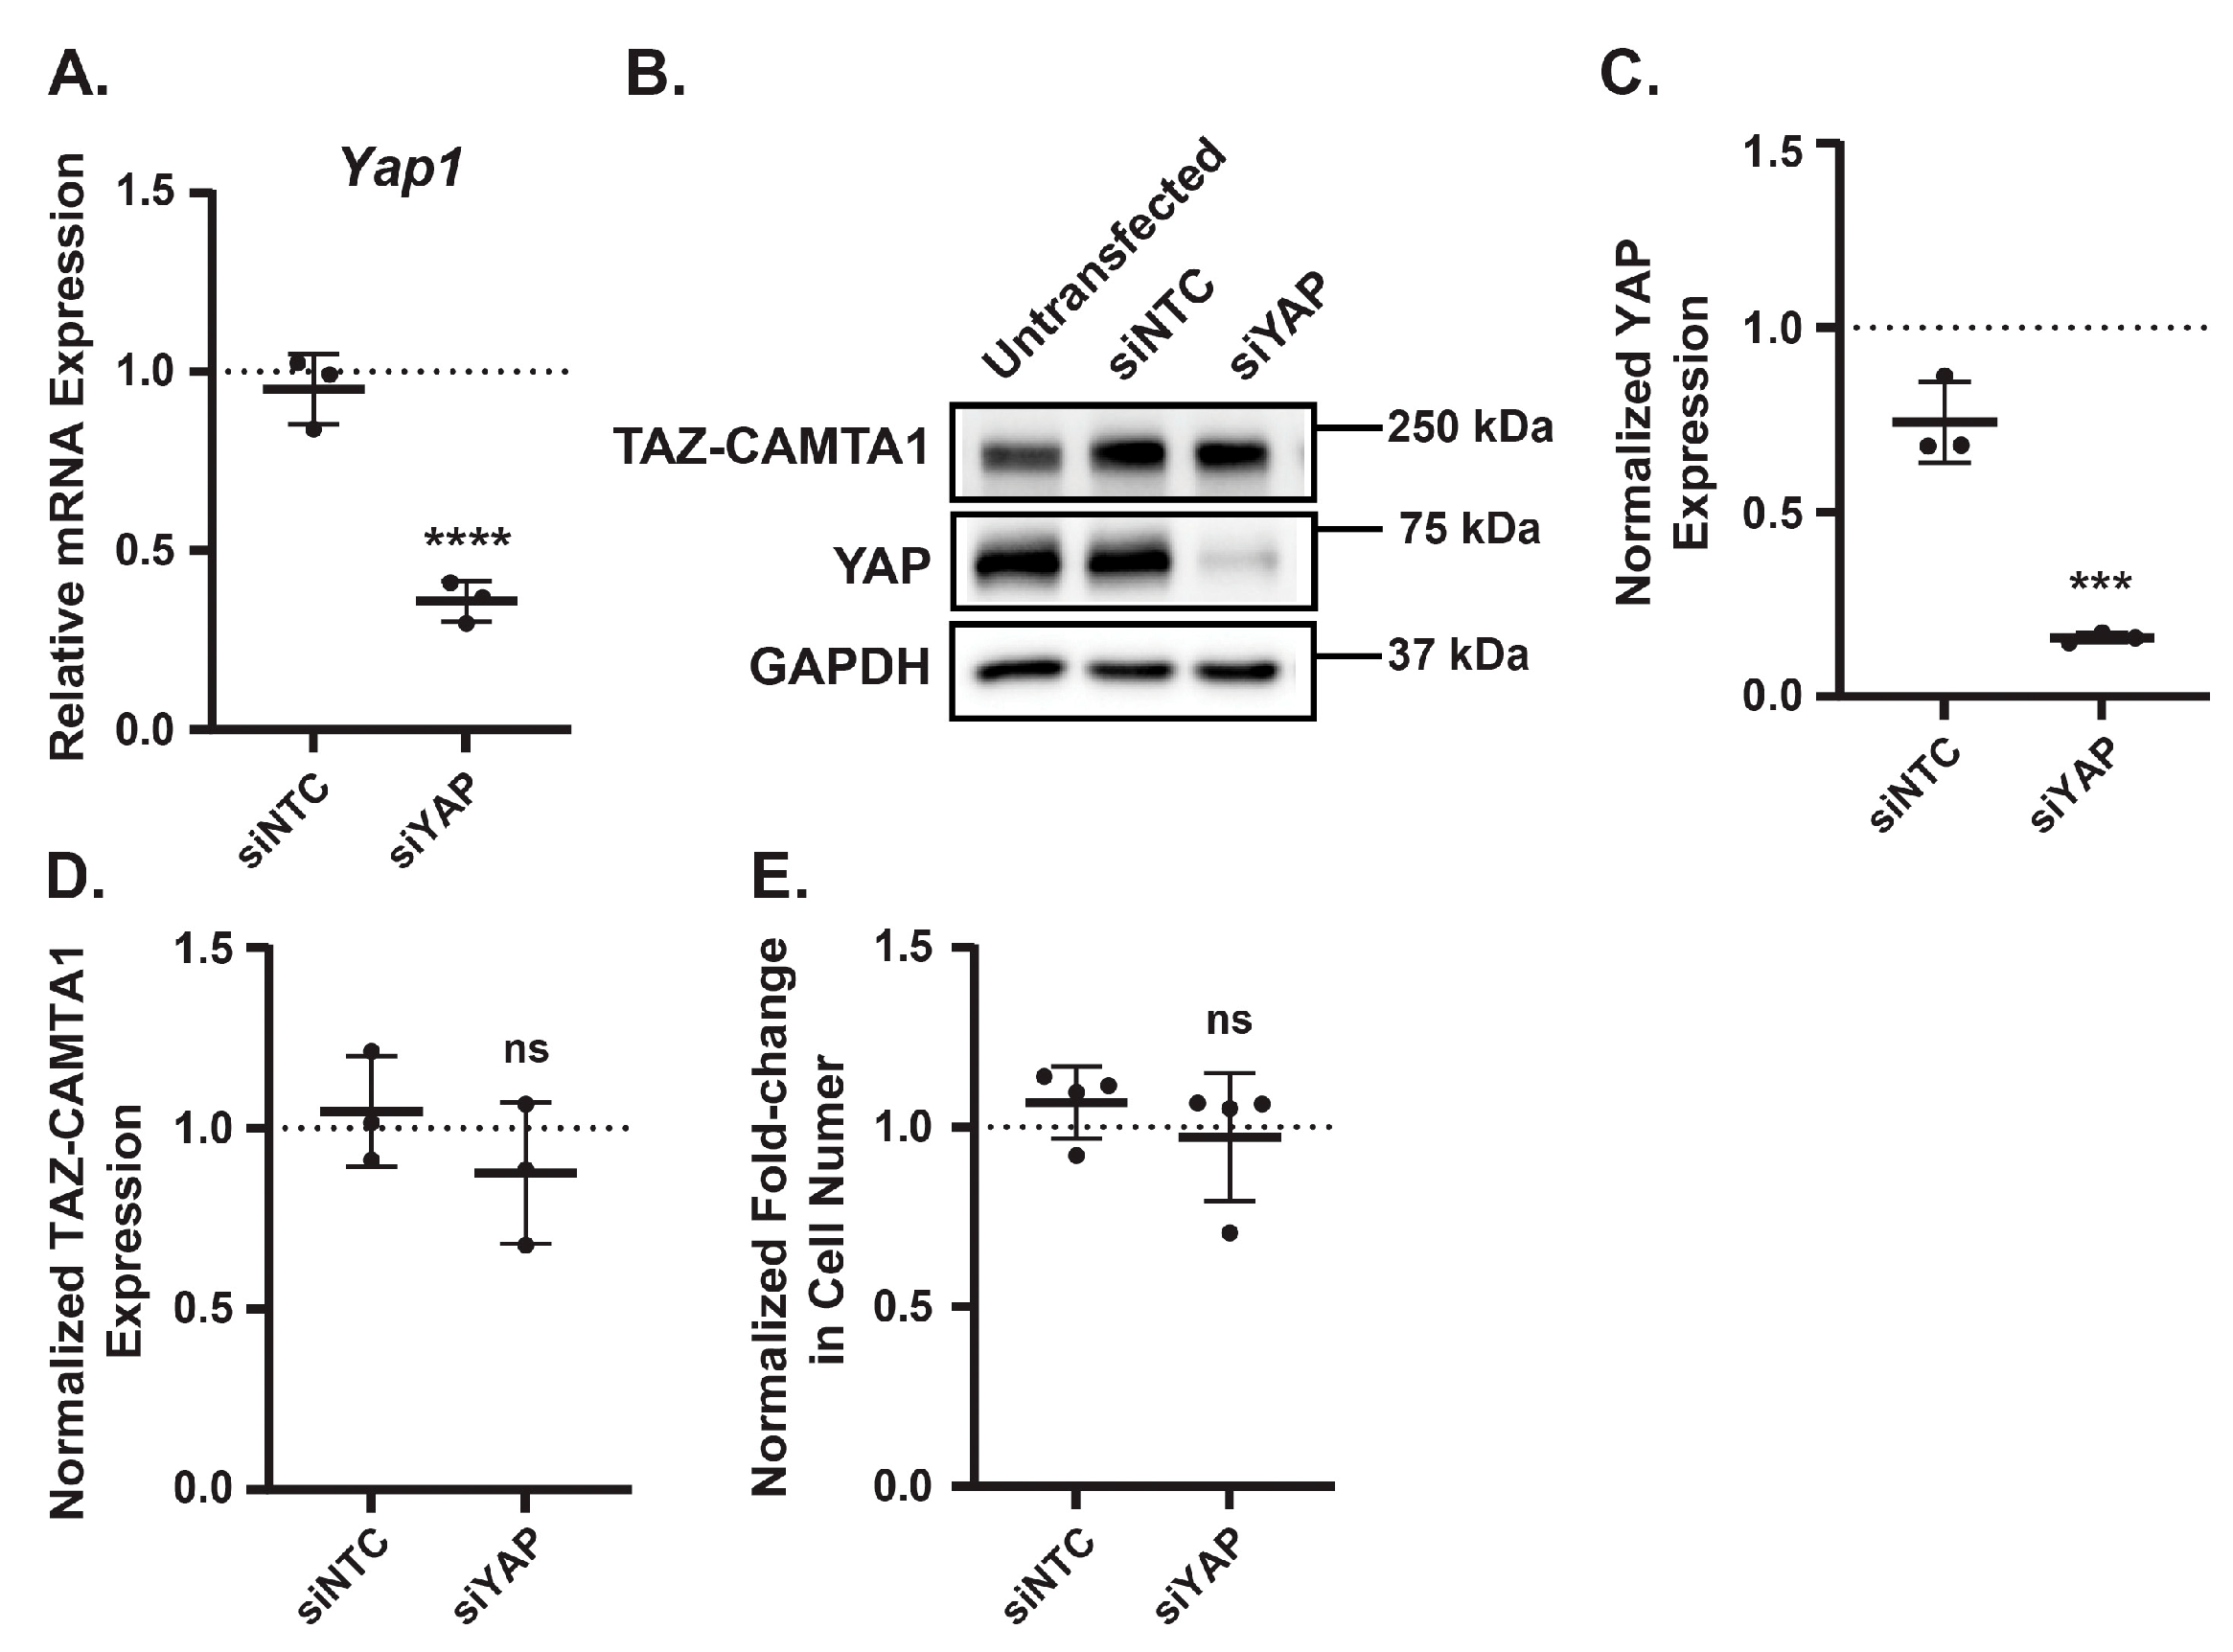
Figure 5.
Increased TAZ-CAMTA1 expression reduces EHE cell viability and YAP expression. (A,B) EHE6 cells were stably transduced with control empty vector (EV) or TAZ-CAMTA1 an then assayed by Western blot (A,B) or for cell viability by counting cell number (C). All plots show the mean ± SD where each group was normalized to cells transduced with EV (represented by dotted lines at Y=1 on graphs) (A) Representative Western Blots. (B) Band intensity was quantified and normalized to GAPDH for n=3 independent experiments. (C) n=3 independent experiments where 4 replicate wells were averaged. *p ≤ 0.05 and ***p ≤ 0.001 by one sample t-test.
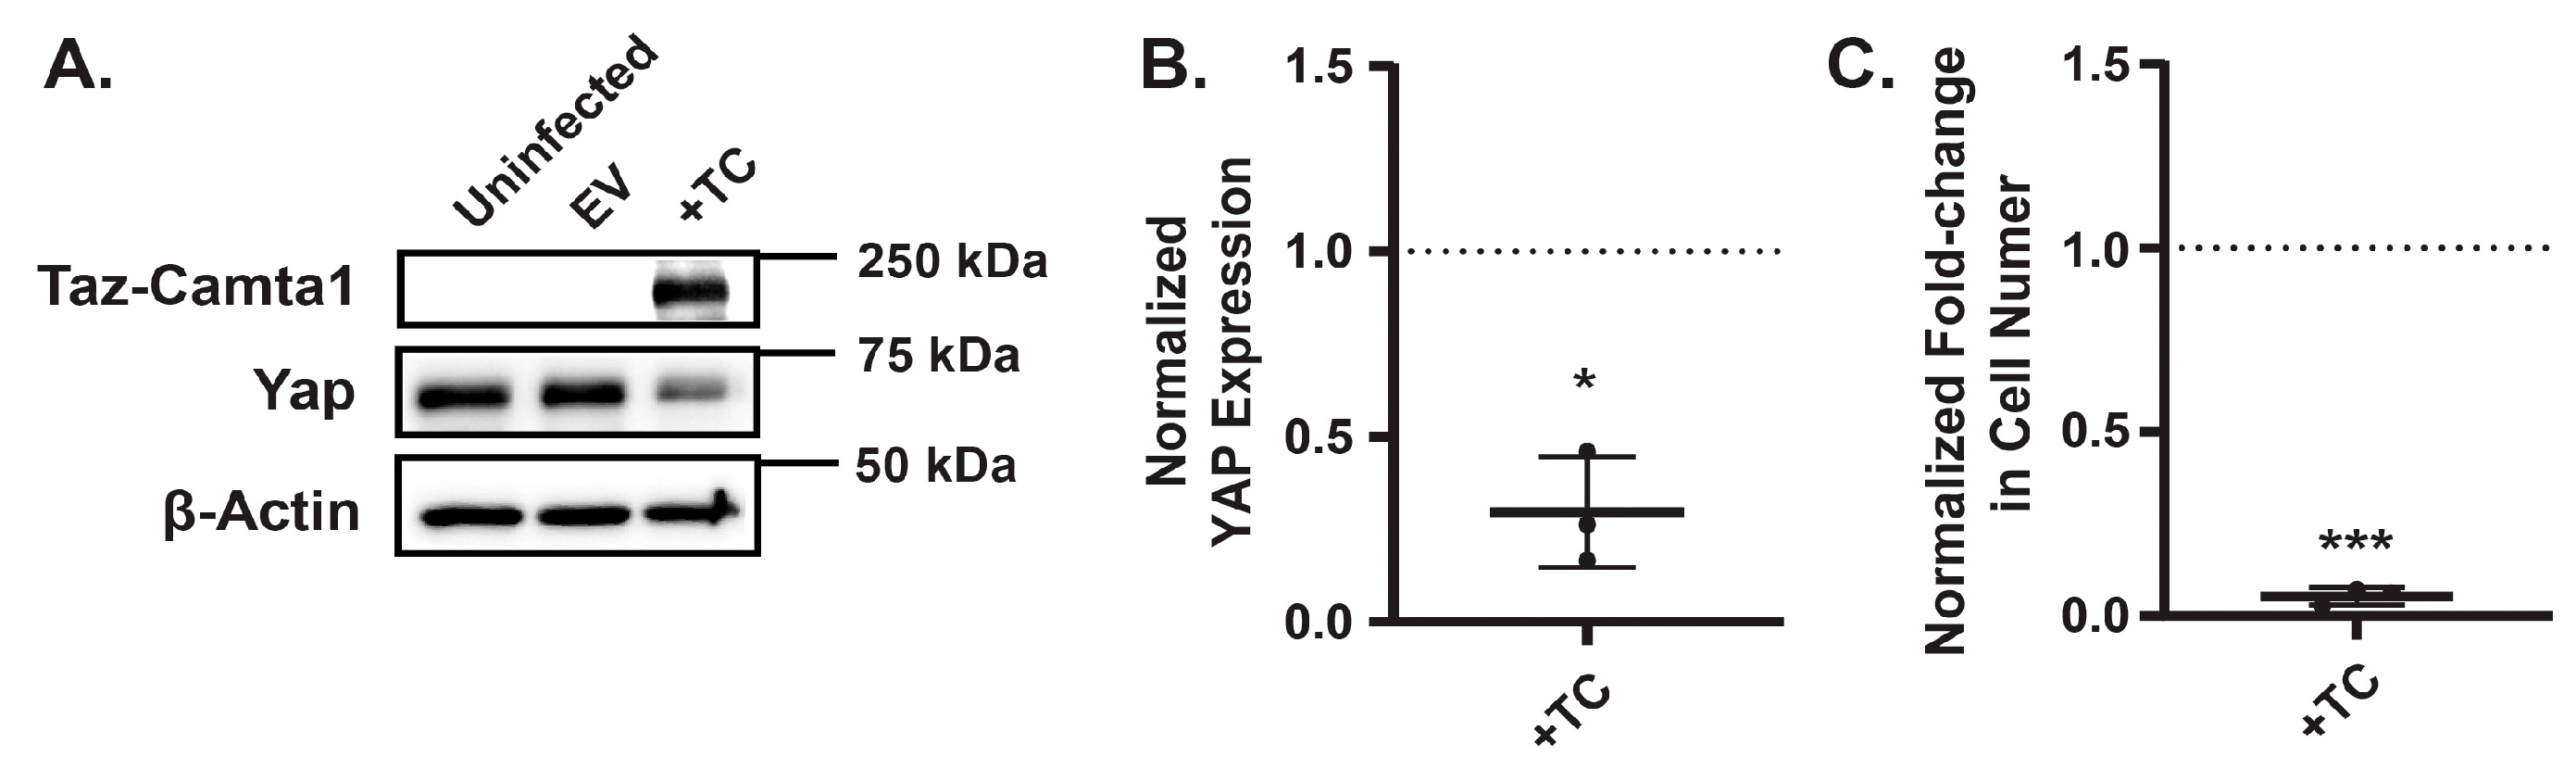
Figure 6.
AMPK activation represses mTOR activity, inhibiting EHE cell viability. EHE6 cells were treated for 24 hours with AICAR (A,B) or MK8722 (C,D) and assayed by Western Blot. (E-K) EHE6 cells were treated with the mTOR inhibitor rapamycin at the indicated doses every day for 4 days (E-G) or for 24 hours (H-K). Cells were then assayed for cell viability using a CCK8 assay (E,F) and by counting cell number (G), or by Western blot (H-K). (A,C,H,I) Representative Western blots. (B,D) Band intensity was quantified and normalized to GAPDH for n=4 independent experiments and the plots show the mean ± SD where each group was normalized to vehicle treated cells (represented by dotted lines at Y=1 on graphs); **p ≤ 0.01 by one sample t-test. (E) Each group was normalized to the absorbance of untreated cells at the 24-hour timepoint; n=1 independent experiment where 4 wells were averaged. (F,G,J,K) The plots show the mean ± SD and each group was normalized to untreated cells (represented by dotted lines at Y=1 on graphs). (F,G) n=3 independent experiments where 4 replicate wells were averaged; ***p ≤ 0.001 by unpaired t-test. (J,K) n=3 independent experiments; ns = not significant by One-way ANOVA.
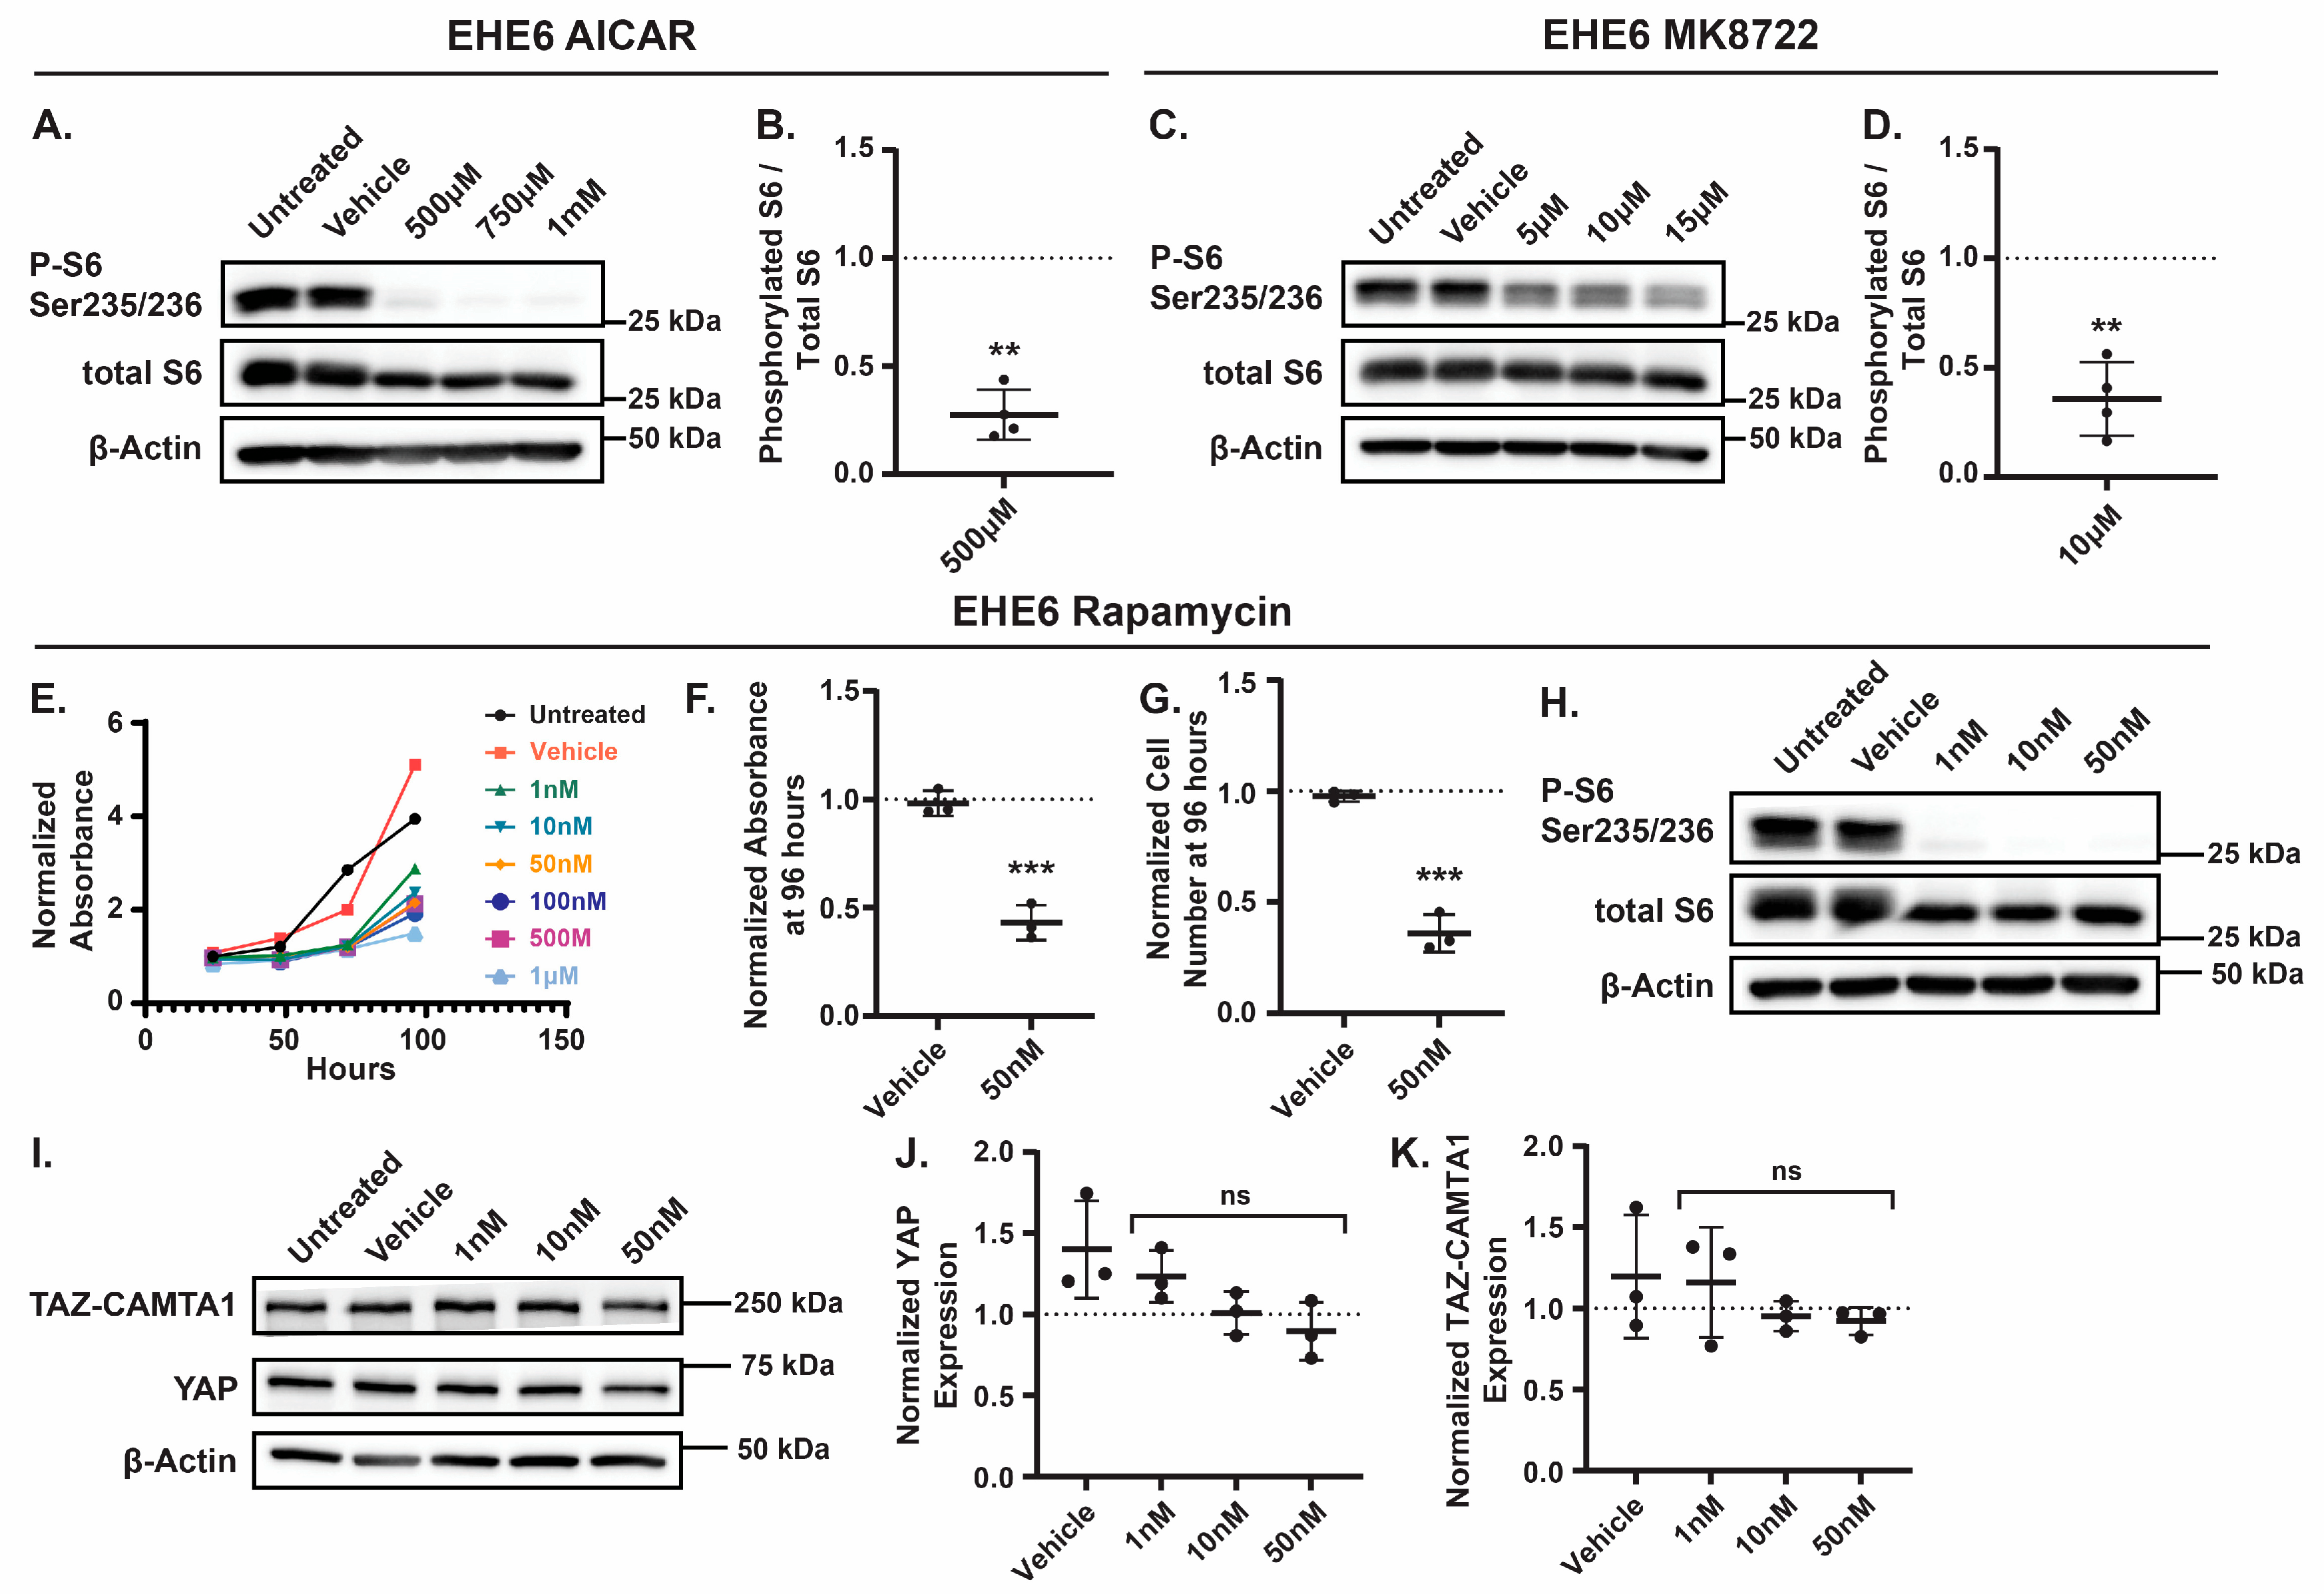
Disclaimer/Publisher’s Note: The statements, opinions and data contained in all publications are solely those of the individual author(s) and contributor(s) and not of MDPI and/or the editor(s). MDPI and/or the editor(s) disclaim responsibility for any injury to people or property resulting from any ideas, methods, instructions or products referred to in the content. |
© 2025 by the authors. Licensee MDPI, Basel, Switzerland. This article is an open access article distributed under the terms and conditions of the Creative Commons Attribution (CC BY) license (http://creativecommons.org/licenses/by/4.0/).
Copyright: This open access article is published under a Creative Commons CC BY 4.0 license, which permit the free download, distribution, and reuse, provided that the author and preprint are cited in any reuse.


