
Submitted:
05 May 2025
Posted:
06 May 2025
You are already at the latest version
Abstract
Background/Objectives: Type 2 Diabetes Mellitus (DM2) is a metabolic disease whose importance rises with aging. Its effects may damage renal and heart functioning. Plasma biomarkers of DM2 have been shown through metabolomic studies under different conditions, mainly obesity, but untargeted metabolomic studies on DM2 were lacking for elderly people. Methods: A UPLC-MS-based metabolomics approach was conducted to ascertain potential plasma biomarkers in an older than 65 years cohort. Results: the dipeptide Gly-His, along with diverse lysophosphatidylcholines (LPCs), mainly LPC(14:0) and LPC(20:4), as well as three gangliosides, were found to have a different plasma content in DM2 subjects as compared to control (non-diabetic) subjects (NDM2). LPC(20:4) exhibited a gender dependence with statistically significant differences only in females. Gly-His correlated with MEDAS-14, whereas LPC(14:0) did with sugar-rich food consumption. Conclusions: as previously shown for other conditions, mainly obesity, altered lipid metabolism was shown in this study to be a hallmark of DM2 also in elderly people.
Keywords:
diabetes mellitus type 2
; elderly people
; metabolomics
; diet
; UPLC-MS
1. Introduction
Aging of population has become a relevant concern at present in most western countries. Aging is currently associated with diverse metabolic malfunctions, which will likely lead to cardiovascular and renal diseases in the short range. Even though not exclusive to elderly, one of this age associated diseases is diabetes mellitus type 2 (DM2), which is a metabolic disorder characterized by persistent hyperglycemia. Elderly people tend to accumulate fat in ectopic tissues, mainly liver and skeletal muscle, a factor that may elicit insulin resistance or impaired insulin secretion and, ultimately, DM2 [1]. Genetic and behavioral factors like a high carbohydrate-based nutrition together with lack of exercise predispose to DM2 development [2,3]. However, the complex molecular mechanisms involved in its development are not still well known [4]. More than 12.2% of world population is foreseen to have DM2 in 2045, and the percentage might be higher because of not diagnosed people [5]. To reduce the economic burden of DM2 treatments is a major concern for national health systems.
Metabolomics is an analytical methodology that allows drawing a real time image of the physiological state in a given moment [2,6]. By comparing the metabolic snapshot of DM2 patients with that of healthy individuals, insights can be gained into the metabolic pathways that become affected in the development of DM2 in the unhealthy individuals and, concurrently, to find out biomarkers that could help early diagnosis and treatment. A number of studies have used metabolomics approaches, either targeted or untargeted, to seek for new biomarkers that contribute to define a more complete picture of DM2 [2,6,7,8,9,10]. Elevated contents of branched-chain amino acids (BCAAs) and aromatic amino acids (AAAs) in blood have been observed in DM2 patients, a fact that is due to their reduced catabolism with age [7,11,12,13]. A recent study has involved the cAMP response element-binding protein (CREB) regulated transcription coactivator (CRTC) 2 in the regulation of metabolic homeostasis in visceral white adipose tissue (VAT), whose implication in the perturbation of BCAA catabolism leads to an age-associated metabolic decline [12]. Even though the link of altered lipid metabolism to insulin resistance is known long time ago, the exact molecular mechanisms remain still to be unveiled [4]. Using untargeted first and targeted afterwards lipidomic approaches, Feng et al. [10] have shown specific lipid species whose content is altered in DM2 patients in comparison to healthy controls in males aged 35-65 years according to their DM2 state, namely high risk, recently diagnosed and diagnosed for more than two years; and the lipid species they reported to have their concentration altered in DM2 individuals were mainly those bearing the phosphocholine group, ceramides, short-chain saturated triglycerides, and hydroxylinoleic cholesteryl esters.
DM2 is currently accompanied by other comorbidities in elderly people, a situation that may provoke some hassle regarding treatment application and response [14]. In this regard, metabolomics may help to disclose differences with less aged people of the altered metabolic pathways, and define a personal treatment for elderly patients [8,12,15,16,17]. In this prospective study, the metabolic profile of DM2 patients aged more than 65 years was compared with that of non-diabetic individuals within a similar age range in an untargeted metabolomics study.
2. Materials and Methods
2.1. Chemicals and Reagents
Methanol and acetonitrile were OPTIMA® LC-MS GRADE from Merck. Formic acid was pro analysi ACS, Reag. Ph Eur from Merck. Ammonium acetate was pro analysi ACS, Reag. Ph Eur from Merck. And ammonia solution 32% was from Merck. Water was own lab produced with a Milli-Q equipment.
2.2. Population Characteristics and Recruitment
Fifty-nine subjects aged ≥ 65 years (mean age 73.5 ± 8.8 years) were recruited at the medical center of Calaceite (Teruel, Spain). The volunteers comprised a non-diabetic control group (NDM2) formed by 21 females and 11 males, with a mean age of 71.4 ± 9.0 years, and a diabetic diagnosed individuals (DM2) formed by 15 females and 12 males, with a mean age of 75.9 ± 8.1 years. The clinical and other characteristics of the cohort are depicted in Table 1. Information on ethical concerns is stated below.
2.3. Metabolomics Experiments
2.3.1. Sample Harvesting and Processing
Blood samples from all participants were obtained by puncture on the forearm and collected in tubes containing lithium heparin. Plasma was harvested after centrifugation of tubes containing the blood at 738 g and 4ºC for 10 minutes, and 500 μL were transferred to Eppendorf containers and kept at -80ºC until UPLC-MS measurements.
For metabolite extraction, 100 μL of plasma were mixed with 500 μL of cold acetonitrile, vortexed and kept at 4ºC for 1 hour. Afterwards, the mixture was centrifuged at 1,660 g and 4ºC for 10 minutes and 500 μL of supernatant were taken out to new containers. Three blanks for the UPLC-MS measurements were prepared by using 100 μL of Milli-Q water instead of plasma. Additionally, quality control (QC) samples (in triplicate) were prepared by pooling 50 μL each of plasma samples and of which 100 μL were processed in the same way as the individual plasma samples.
2.3.2. UPLC-MS Measurements
These measurements were conducted as in Albillos et al. [18]. An Acquity UPLC HSS T3 1.8 µm, 2.1 × 100 mm column was used for the liquid chromatographic separation of the extracted compounds. The chromatography was carried out in an Acquity Ultraperformance LC (UPLC) from WATERS (Barcelona, Spain) with an eluent flow of 0.35 mL/min, and 7.5 µL of each sample were injected. In order to disperse error propagation plasma samples were randomly injected. The blanks were injected at the onset of the chromatographic analysis, and quality control samples were injected next as well as after every 20 sample injections. Two solvents were used for the elution gradient, with solvent A being methanol:water (2:8, v/v) + 0.1% formic acid, and solvent B being 100% acetonitrile + 0.1% formic acid, and its steps were initial, 99.9% A; time 1 minute, isocratic; 3.5 minutos, 20% A; 5 minutes, isocratic; 9.5 minutes, 0.1% A; 11.0 minutes, isocratic; 14.0 min, 99.9% A; and 15.0 minutes, isocratic. The column eluent was directly connected to a mass spectrometer SYNAPT HDMS G2 (WATERS, Barcelona, Spain) fitted with an electrospray ionization source (ESI, Z-spray®) and time of flight analyser (ESI-QToF-MS). The metabolites were detected with positive ionization, and the parameters were capillarity 2.5 KV, cone 25 V, source temperature 100 ºC, desolvation temperature 320 ºC, cone gas (nitrogen) 35 L/h, and desolvation gas flow (nitrogen) 700 L/h.
2.3.3. UPLC-MS Data Analysis
Using MarkerLynx® software (WATERS, Manchester, UK) the UPLC-MS data were processed and the variables plasma sample (including blanks), retention time_m/z values (molecular features), and normalized (scaled to Pareto variance) signal intensity of the m/z value were arranged in a three-dimensional Pareto-scaled data array. Following, m/z values considered as noise or contaminants were manually excluded. Original data are included in an EXCEL file and reported as supplementary material.
The softwares Extended Statistics® (XS) application included in the MarkerLynx® software, and the freely on-line accessible MetaboAnalyst (https://www.metaboanalyst.ca/) were used to conduct multivariate statistical analysis on the generated data array. Normalization by sum and Pareto scaling was chosen in both softwares. Binary comparisons were conducted for the two sample groups: DM2 of diagnosed patients and NDM2 (not diagnosed control group). Cross-validation (10-fold) and 1000 permutations were run for each comparison after removal of outliers. The QuantLynx® application (Waters, Manchester, UK) was used to integer the chromatographic peak area of the selected metabolites as potential biomarkers.
2.3.4. Classical Statistical Analysis
A descriptive analysis of the data was performed. Qualitative variables were presented using frequency distributions and percentages for each category. For quantitative variables, measures of central tendency (mean or median) and dispersion (standard deviation or percentiles) were calculated.
The association between variables was evaluated using hypothesis testing. For qualitative variables, proportions were compared using the chi-square test or, when necessary, Fisher’s exact test. For quantitative variables, the Shapiro-Wilk normality test was applied to determine whether they followed a normal distribution. Since they did not meet this assumption, nonparametric tests were used for group comparisons.
To analyze the relationship between variables while controlling for potential confounding factors, multivariate regression models were used. Some variables, such as MEDAS, were categorized to facilitate the interpretation of coefficients and to reduce bias in parameter estimation due to low-frequency categories. Odds ratios with their 95% confidence intervals were calculated for each variable.
Statistical significance was considered for p < 0.05, and all tests were two-tailed.
3. Results
3.1. Evaluation of the Cohort Characteristics
The cohort characteristics are shown in Table 1. Age was significantly higher in the DM2 group (p > 0.004). Females were predominant in both groups and, in particular in the NDM2 group, where they accounted for 66%. There were no significant differences in the body mass index (BMI) between both groups, but the number of individuals with obesity was higher in the control (NDM2) group than in the DM2 group (14 versus 9).
Regarding lifestyle, a high proportion of DM2 group individuals (78%) did not take alcohol, and non-smokers were predominant in both groups. Both groups reported comparable individuals’ distribution regarding physical activity, this measured as MET-h/week, with vigorous-intensity activity being the most common in both groups. The adherence to the mediterranean diet (MEDAS-14) was also comparable in both groups, with no significantly different scores. Sugar intake was significantly reduced in the DM2 group (p=0.013), with only 33% of the DM2 subjects reporting high sugar intake (>36 g/day for men and >25 g/day for women). Only 5 NDM2 and 6 DM2 subjects ate a meat-free diet, with no significant differences between groups regarding high fat food consumption and meat intake patterns.
Familiar Endocrine disease was more common in the DM2 group than in the NDM2 group (70% vs. 25%; p< 0.001), whereas a family history of cardiovascular disease was more prevalent in the control group (47% vs. 26%). Twenty-four DM2 individuals (89%) against twelve NDM2 individuals (38%) had an intake of 3 or more drugs, but only twelve of the DM2 patients (44%) and eleven of the controls (34%) had prescription for dyslipidemia medication.
Concerning biochemical parameters, only fasting glucose, total serum cholesterol and LDL cholesterol showed statistically significant differences, the cholesterol related parameters being higher in the NDM2 group while the opposite happened for fasting glucose, likely because 44% of the DM2 group was receiving lipid-lowering therapy.
3.2. UPLC-MS Data Analysis
As indicated previously, participants were grouped as DM2 for type 2 diabetes mellitus diagnosed patients and NDM2 for DM2-free individuals (controls). Typical chromatograms for both groups are shown in Figure 1. Subtle variations of the peak intensities can be observed between both groups in the chromatograms.
Results were comparable in both softwares, XS application and MetaboAnalyst. Principal component analysis (PCA) did not render good separation of the two groups (data not shown). In contrast, both groups were clearly separated when partial least squares discriminant analysis (PLS-DA) was used for the multivariate statistical analysis (Figure 2). Correlation coefficients obtained in the XS application were R2Y(cum) = 0.80 and Q2(cum) = 0.71 for component 1, and R2Y(cum) = 0.91 and Q2(cum) = 0.87 for component 2. According to MetaboAnalyst output, components 1 and 2 explained 28.9% of variance; this is not high but enough to get full separation and a good prediction capacity of the model according to Q2 and R2 parameters.
About 14 metabolites were pointed out as potential biomarkers according to the PLS-DA in both XS application and MetaboAnalyst (VIP score>1.0). Seven lysophosphatidylcholines (LPCs), one lysophosphoinositide (LPI), three gangliosides, two phosphatidylcholines (PCs), and one dipeptide (Gly-His), and were tentatively identified taken into consideration the m/z, elemental composition, and retention time. Additionally, compounds could not be ascribed to four features that were also shown as differential ones in the PLS-DA and remained as unidentified. The ganglioside species provided in the foot note of the Table 2 were obtained from the LipidMaps database but could not be verified. Apart from LPC(20:4) all metabolites exhibited lower values in the DM2 group than in the NDM2 group (negative value of Log2 FC). However, only LPCs 14:0, 16:0, 18:0 and 18:2, gangliosides 1 and 2, Gly-His and the unidentified compound pointed out significant differences between both groups according to the chromatographic peak area normalized to that of the reference compound reserpine (unpaired t-test).
Classical statistical analysis was conducted to find out whether the potential biomarkers arising from the PLS-DA showed any correlation between them and with the cohort characteristics reported in Table 1. Positive correlations were shown between the lipids (LPCs and the ganglioside 2), whereas negative correlations were obtained for the dipeptide Gly-His with the lipids apart from LPC(14:0) (see Table 3). Significant correlations (p < 0.05) were found for Gly-His with LPC(22:6) and LPC(14:0); ganglioside 2 correlated significantly with the three LPCs, and, additionally, LPC(22:6) significantly correlated with LPC(20:4).
Significant correlations of the selected biomarkers with some of the cohort characteristics are shown in Table 4 (p values determined after Wilcoxon rank sum exact test). Gly-His correlated with MEDAS-14 (p = 0.004), with increasing values from strong to low; and LPC(14:0) correlated positively with consumption of sugar-rich foods ( p = 0.012). Even though not significantly (p = 0.075), consumption of sugar-rich foods also rendered a higher value of ganglioside 2. LPC(20:4) was significantly (p = 0.005) higher in males (1718.3 ± 741.2) than in females (1217.4 ± 604.7). Ganglioside 2, which showed higher values in the NDM2 group than in the DM2 group, exhibited significant differences between groups only for males (p = 0.02), with mean values of the medians of 82.69 and 55.02 in the NDM2 and DM2 groups, respectively. Somewhat similar happened for LPC(14:0), with mean values of the medians of 253.26 and 126.34 in the NDM2 and DM2 groups for males. Results from univariate and multivariate analyses pointed out that the gender variable influenced the statistical significance of differences between groups (Table 4), at least to some extent. In particular, significant differences between groups of LPC(20:4) were clearly bound to the other variables, and specifically to gender. Thus, a p value of 0.100 resulted in the univariate analysis, whereas p values of 0.049 and 0.026 are obtained in the multivariate analysis with and without gender, respectively. Nonetheless, the odds ratio (OR) was always slightly higher than 1 (1.0007 in the univariate analysis and 1.0016 or 1.0018 in the multivariate analysis).
4. Discussion
Amino acids have been shown to play an essential role in the pathogenesis of diabetes [7]. Indeed, high plasma or serum levels of branched-chain (BCAAs) and aromatic (AAAs) amino acids have been found in different studies to be reliable indicators of insulin resistance and pre-diabetes state [2,13,21]. In contrast, high serum levels of glutamine (Gln) and histidine (His) were proposed to be indicative of lower risk for incident diabetes mellitus type 2 (DM2) in obese subjects [16], and oral supplementation of histidine was shown to improve IR [22,23]. In the study by Gu et al. [16], dipeptides containing Glycine (Gly) showed reduced contents in diabetic obese patients as compared with non-diabetic obese individuals. The results of our study show that a dipeptide, namely Gly-His, whose plasma content was lower in diabetic patients than in the controls, might be a biomarker for high risk of DM2 development when its content drops below a given value. Indeed, reduced Gly content is considered a biomarker for insulin resistance and subsequent DM2 development [24,25,26,27,28]. Glycine takes part in a number of pathways that may decrease its availability, especially gluconeogenesis and glutathione (GSH) synthesis [29], a fact that leads to chronic deficiency of GSH in elderly people; and, indeed, it was shown that a diet supplemented with Gly (and Cysteine, Cys) could raises the GSH level in 82-week-old mice up to that measured in 22-week-old mice as well as, respectively, in old humans with regard to young humans [15]. GSH deficiency may cause malfunction of mitochondria due to excessive oxidative stress and increased lipid oxidation.
A number of studies have shown that lipid metabolism is altered in subjects with DM2 pathology [2,3,10,30], and even long before disease manifestations [31]. In agreement with other published studies, our results show that some lysophosphatidylcholines (LPCs) have reduced contents in DM2 patients as compared with non-diabetic subjects. In particular, we found that the circulating content of the myristoyl-glycerophosphocholine (1-tetradecanoyl-sn-glycero-3-phosphocholine, LPC(14:0)) was significantly reduced in DM2 patients (Table 2). This metabolite had previously been proposed by Ha et al. [30] as a relevant biomarker, even showing a positive correlation with arterial stiffness; however, contrary to the finding of Ha et al., we found its content was lower in the DM2 group than in the NMD2 group. Similar results were found in this study for other saturated LPCs (16:0 and 18:0), as well as for LPC(18:2). Ferrannini et al. [26] and Wang-Sattler et al. [32] also pointed out decreased content of this latter LPC (linoleoyl-glycerophosphocholine, L-GPC) in patients as indicative of IR and DM2. Conversely, Feng et al. [10] did not report LPC(18:2) as a potential biomarker but did instead an increased content in diabetic subjects of the hydroxy-linoleic acid cholesteryl ester (CE(18:2-OH)), a fact that the authors attribute to enhanced oxidative stress. Reduced content of the PC(16:0/18:2) in DM2 group was also found in this study, as well as in that by Feng et al. for the high risk group as compared to controls, which could be indicative of the relevance of the linoleic acid in diabetes mellitus. Indeed, hydroxy-linoleic acid acts as an agonist of the peroxisome proliferator-activated receptor γ (PPARγ), which is implicated in inflammation, IR and glucose metabolism [33].
LPC(20:4) exhibited an opposite pattern to that of the aforementioned LPCs, with values higher in DM2 individuals than in NMD2 individuals (Table 2), but only LPC(20:4) showed significant differences (p = 0.026 without gender and p = 0.049 when gender was included) in the multivariate analysis (Table 4). From our knowledge, LPC(20:4) has not previously been reported regarding IR and diabetes type 2 biomarkers. This is surprising because the arachidonic acid is positively related to inflammation through its oxidized metabolites, the eicosanoids, inflammation being associated to DM2 progress [34,35,36,37]. Nonetheless, Zhang et al. [38] found that free arachidonic acid could inhibit inflammatory responses through modulating the activity of toll-like receptor 4 (TLR4), and it may be that the increased content of arachidonic acid in the form of LPC(20:4) in DM2 patients has prevented the inhibitory regulation of inflammation. LPC(22:6) was evaluated as a less predictive metabolite by Ha et al. [30]. Even though the majority of LPCs are formed from oxidized phospholipids (PPLs), plasma LPC(20:4) and LPC(22:6) come from the action of the human lecithin cholesterol acyltransferase (LCAT) [39]; however, low LCAT activity in diabetic patients, particularly in women, was reported [40], which is contradictory to the apparently higher content of LPC(20:4) in the DM2 group that is found in this study.
Nowadays dysregulation of the lipid metabolism is accepted as one of the diabetes mellitus type 2 hallmarks, even playing a central role in its pathogenesis [10]. The significantly positive correlation of relevant LPCs (20:4) and (22:6) between them and with ganglioside 2 (Table 3) indicates an interplay between specific lipid pathways. Currently, PCs have a saturated fatty acyl chain esterified at the sn-1 position of the glycerol backbone and an unsaturated fatty acyl chain at the sn-2 position; an enhanced content of the mentioned LPCs and ganglioside(s) may represent a rise in the release of saturated acyl chains for ceramide synthesis [41], which in turn would derive excess of circulating glucose for ganglioside synthesis [42]. Enhanced derivation of ceramides towards gangliosides may be bound to a counteracting mechanism that intends to reduce the ceramide content. Aberrant accumulation of ceramides may block the translocation of the glucose transporter 4 through the inhibition of Akt/PKB activation, which leads to inhibition of glucose uptake and glycogen synthesis in adipocytes and isolated skeletal muscle [41,43].
Gly-His correlated positively with MEDAS-14 while LPC(14) did with sugar-rich foods. LPC(20:4) seems to be bound to a gender-dependent effect (Table 4). Accordingly, it seems that different metabolites might be representative of different affected pathways o even organs, which leads to show varying potential biomarkers relying on the particular cohort characteristics like age, gender predominance and, of course, life style. Thus, even though there seems to be a general pattern of altered lipid and amino acid metabolisms, a number of factors may output different specific biomarkers, and to unveil which biomarkers are representative of disease development and which of them correspond to evolution under treatment and at every age period is necessary to actually understand the disease.
5. Conclusions
Biomarkers related to type 2 diabetes mellitus (DM2) in aged people (> 65 years) are presented as shown by results of an untargeted metabolomics study. Lysophosphatidylcholines (LPCs) and gangliosides were pointed out as potential biomarkers, thus confirming altered lipid metabolism. The dipeptide Gly-His was also revealed as a potential biomarker, which seems to be in agreement with the reported role of amino acids in DM2 through deficient anti-oxidative pathways related to GSH and mitochondria malfunction. Some biomarkers could be specifically related to gender, like LPC(20:4), and others to diet like LPC(14:0) and ganglioside 2. Nonetheless, no correlation was shown for the biomarkers with particular diet characteristics like fat or sugar intake. Further studies addressing the role played by age and obesity in addition to diet are required for a more complete understanding of this metabolic disease.
Supplementary Materials
The following supporting information can be downloaded at the website of this paper posted on Preprints.org, Table S1 (EXCEL file): original UPLC-MS data as obtained from the MarkerLynx application, original data with zeros removed, and chromatographic peak area of selected metabolites. Supplementary figure S1.
Author Contributions
Conceptualization, I.C., A.S. and O.M.; methodology O.M., A.S., J.S.-C., and I.C.; statistics, D.B-B. and O.M.; formal analysis, I.C., A.S., D.B-B., J.S-C. and O.M.; data curation, O.M.; writing—original draft preparation, O.M., A.S., and I.C.; writing—review and editing, O.M.; visualization, I.C. and A.S.; supervision, O.M. and I.C. All authors have read and agreed to the published version of the manuscript. Conceptualization, Alba Simón, Olimpio Montero and Irma Caro; Data curation, Olimpio Montero; Formal analysis, Daniel Bordonaba-Bosque and Javier Solano-Castán; Investigation, Olimpio Montero and Irma Caro; Methodology, Alba Simón, Olimpio Montero and Javier Solano-Castán; Project administration, Irma Caro; Resources, Irma Caro; Software, Daniel Bordonaba-Bosque; Supervision, Olimpio Montero; Writing – original draft, Olimpio Montero; Writing – review & editing, Alba Simón, Olimpio Montero and Irma Caro.
Funding
This research received no external funding.
Institutional Review Board Statement
This observational case-control study was conducted in accordance with the Declaration of Helsinki and was approved by the Comité de Ética de la Investigación de la Comunidad Autónoma de Aragón (CEICA) on May 13, 2024 (C.I. PI24/213).
Informed Consent Statement
Written informed consent was obtained from all participants for both their participation in the study and the review of their medical records. The consent process was conducted in accordance with the guidelines established by the Ethics Committee for Clinical Research of the Autonomous Community of Aragon (CEICA).
Data Availability Statement
Original UPLC-MS data are provided as supplemental material in an EXCEL file format.
Acknowledgments
We gratefully acknowledge the support of the CEICA, as well as the Primary Care Directorate and the coordination of the Calaceite Health Center, whose collaboration was essential for the development of this study. We also sincerely appreciate the voluntary participation of the 59 patients from the Calaceite Basic Health Zone (ZBS), whose involvement was key to making this research possible. We also thank Marta Velasco for her valuable technical assistance.
Conflicts of Interest
The authors declare no conflicts of interest.
Abbreviations
The following abbreviations are used in this manuscript:
| UPLC | Ultra-high Pressure Liquid Chromatography |
| MS | Mass Spectrometry |
| QToF | Quadrupole Time of Fligh |
| XS | Extended Statistics |
| MEDAS-14 | Mediterranean Diet Adherence Screener-14 ítems |
| LPC | Lysophosphatidylcholine |
| DM2 | Type 2 Diabetes Mellitus |
| GSH | Glutathione |
| BCAAs | Branched-Chain Amino Acids |
| AAAs | Aromatic Amino Acids |
| IR | Insulin Resistance |
| NDM2 | Non-Diabetic Metabolic Syndrome |
| PC | Phosphatidylcholine |
| PPARγ | Peroxisome Proliferator-Activated Receptor Gamma |
| TLR4 | Toll-Like Receptor 4 |
| CE | Cholesteryl Ester |
| OR | Odds Ratio |
| CI | Confidence Interval |
References
- Johannsen, D.L.; Conley, K.E.; Bajpeyi, S.; Punyanitya, M.; Gallagher, D.; Zhang, Z.; Covington, J.; Smith, S.R.; Ravussin, E. Ectopic Lipid Accumulation and Reduced Glucose Tolerance in Elderly Adults Are Accompanied by Altered Skeletal Muscle Mitochondrial Activity. The Journal of Clinical Endocrinology & Metabolism 2012, 97, 242–250. [CrossRef]
- Guasch-Ferré, M.; Hruby, A.; Toledo, E.; Clish, C.B.; Martínez-González, M.A.; Salas-Salvadó, J.; Hu, F.B. Metabolomics in Prediabetes and Diabetes: A Systematic Review and Meta-Analysis. Diabetes Care 2016, 39, 833–846. [CrossRef]
- Arneth, B.; Arneth, R.; Shams, M. Metabolomics of Type 1 and Type 2 Diabetes. IJMS 2019, 20, 2467. [CrossRef]
- Arroyo, M.N.; Green, J.A.; Cnop, M.; Igoillo-Esteve, M. tRNA Biology in the Pathogenesis of Diabetes: Role of Genetic and Environmental Factors. IJMS 2021, 22, 496. [CrossRef]
- Ferdous, S.-E.; Ferrell, J.M. Pathophysiological Relationship between Type 2 Diabetes Mellitus and Metabolic Dysfunction-Associated Steatotic Liver Disease: Novel Therapeutic Approaches. IJMS 2024, 25, 8731. [CrossRef]
- Pallares-Méndez, R.; Aguilar-Salinas, C.A.; Cruz-Bautista, I.; Del Bosque-Plata, L. Metabolomics in Diabetes, a Review. Annals of Medicine 2016, 48, 89–102. [CrossRef]
- Wang, T.J.; Larson, M.G.; Vasan, R.S.; Cheng, S.; Rhee, E.P.; McCabe, E.; Lewis, G.D.; Fox, C.S.; Jacques, P.F.; Fernandez, C.; et al. Metabolite Profiles and the Risk of Developing Diabetes. Nat Med 2011, 17, 448–453. [CrossRef]
- Xu, F.; Tavintharan, S.; Sum, C.F.; Woon, K.; Lim, S.C.; Ong, C.N. Metabolic Signature Shift in Type 2 Diabetes Mellitus Revealed by Mass Spectrometry-Based Metabolomics. The Journal of Clinical Endocrinology & Metabolism 2013, 98, E1060–E1065. [CrossRef]
- Roberts, L.D.; Koulman, A.; Griffin, J.L. Towards Metabolic Biomarkers of Insulin Resistance and Type 2 Diabetes: Progress from the Metabolome. The Lancet Diabetes & Endocrinology 2014, 2, 65–75. [CrossRef]
- Feng, L.; He, B.; Xia, J.; Wang, Z. Untargeted and Targeted Lipidomics Unveil Dynamic Lipid Metabolism Alterations in Type 2 Diabetes. Metabolites 2024, 14, 610. [CrossRef]
- Lynch, C.J.; Adams, S.H. Branched-Chain Amino Acids in Metabolic Signalling and Insulin Resistance. Nat Rev Endocrinol 2014, 10, 723–736. [CrossRef]
- Han, H.-S.; Ahn, E.; Park, E.S.; Huh, T.; Choi, S.; Kwon, Y.; Choi, B.H.; Lee, J.; Choi, Y.H.; Jeong, Y.L.; et al. Impaired BCAA Catabolism in Adipose Tissues Promotes Age-Associated Metabolic Derangement. Nat Aging 2023, 3, 982–1000. [CrossRef]
- Choi, B.H.; Hyun, S.; Koo, S.-H. The Role of BCAA Metabolism in Metabolic Health and Disease. Exp Mol Med 2024, 56, 1552–1559. [CrossRef]
- Shahisavandi, M.; Wang, K.; Ghanbari, M.; Ahmadizar, F. Exploring Metabolomic Patterns in Type 2 Diabetes Mellitus and Response to Glucose-Lowering Medications—Review. Genes 2023, 14, 1464. [CrossRef]
- Nguyen, D.; Samson, S.L.; Reddy, V.T.; Gonzalez, E.V.; Sekhar, R.V. Impaired Mitochondrial Fatty Acid Oxidation and Insulin Resistance in Aging: Novel Protective Role of Glutathione. Aging Cell 2013, 12, 415–425. [CrossRef]
- Gu, X.; Al Dubayee, M.; Alshahrani, A.; Masood, A.; Benabdelkamel, H.; Zahra, M.; Li, L.; Abdel Rahman, A.M.; Aljada, A. Distinctive Metabolomics Patterns Associated With Insulin Resistance and Type 2 Diabetes Mellitus. Front. Mol. Biosci. 2020, 7, 609806. [CrossRef]
- Cortés Tormo, M.; Marcos Tomás, J.V.; Giner Galvañ, V.; Redón I Mas, J. Metabolomics as a tool towards personalized medicine in type 2 diabetes mellitus. Rev Med Lab 2021. [CrossRef]
- Albillos, S.M.; Montero, O.; Calvo, S.; Solano-Vila, B.; Trejo, J.M.; Cubo, E. Plasma Acyl-Carnitines, Bilirubin, Tyramine and Tetrahydro-21-Deoxycortisol in Parkinson’s Disease and Essential Tremor. A Case Control Biomarker Study. Parkinsonism & Related Disorders 2021, 91, 167–172. [CrossRef]
- Vaughan D, W.H. Dplyr: A Grammar of Data Manipulation.
- Sjoberg, D., D.; Whiting, K.; Curry, M.; Lavery, J., A.; Larmarange, J. Reproducible Summary Tables with the Gtsummary Package. The R Journal 2021, 13, 570. [CrossRef]
- Ahola-Olli, A.V.; Mustelin, L.; Kalimeri, M.; Kettunen, J.; Jokelainen, J.; Auvinen, J.; Puukka, K.; Havulinna, A.S.; Lehtimäki, T.; Kähönen, M.; et al. Circulating Metabolites and the Risk of Type 2 Diabetes: A Prospective Study of 11,896 Young Adults from Four Finnish Cohorts. Diabetologia 2019, 62, 2298–2309. [CrossRef]
- Kimura, K.; Nakamura, Y.; Inaba, Y.; Matsumoto, M.; Kido, Y.; Asahara, S.; Matsuda, T.; Watanabe, H.; Maeda, A.; Inagaki, F.; et al. Histidine Augments the Suppression of Hepatic Glucose Production by Central Insulin Action. Diabetes 2013, 62, 2266–2277. [CrossRef]
- DiNicolantonio, J.J.; McCarty, M.F.; OKeefe, J.H. Role of Dietary Histidine in the Prevention of Obesity and Metabolic Syndrome. Open Heart 2018, 5, e000676. [CrossRef]
- Gall, W.E.; Beebe, K.; Lawton, K.A.; Adam, K.-P.; Mitchell, M.W.; Nakhle, P.J.; Ryals, J.A.; Milburn, M.V.; Nannipieri, M.; Camastra, S.; et al. α-Hydroxybutyrate Is an Early Biomarker of Insulin Resistance and Glucose Intolerance in a Nondiabetic Population. PLoS ONE 2010, 5, e10883. [CrossRef]
- Floegel, A.; Stefan, N.; Yu, Z.; Mühlenbruch, K.; Drogan, D.; Joost, H.-G.; Fritsche, A.; Häring, H.-U.; Hrabě De Angelis, M.; Peters, A.; et al. Identification of Serum Metabolites Associated With Risk of Type 2 Diabetes Using a Targeted Metabolomic Approach. Diabetes 2013, 62, 639–648. [CrossRef]
- Ferrannini, E.; Natali, A.; Camastra, S.; Nannipieri, M.; Mari, A.; Adam, K.-P.; Milburn, M.V.; Kastenmüller, G.; Adamski, J.; Tuomi, T.; et al. Early Metabolic Markers of the Development of Dysglycemia and Type 2 Diabetes and Their Physiological Significance. Diabetes 2013, 62, 1730–1737. [CrossRef]
- Wittenbecher, C.; Mühlenbruch, K.; Kröger, J.; Jacobs, S.; Kuxhaus, O.; Floegel, A.; Fritsche, A.; Pischon, T.; Prehn, C.; Adamski, J.; et al. Amino Acids, Lipid Metabolites, and Ferritin as Potential Mediators Linking Red Meat Consumption to Type 2 Diabetes. The American Journal of Clinical Nutrition 2015, 101, 1241–1250. [CrossRef]
- Drabkova, P.; Sanderova, J.; Kovarik, J.; Kandar, R. An Assay of Selected Serum Amino Acids in Patients with Type 2 Diabetes Mellitus. Adv Clin Exp Med 2015, 24, 447–451. [CrossRef]
- Wang, W.; Wu, Z.; Dai, Z.; Yang, Y.; Wang, J.; Wu, G. Glycine Metabolism in Animals and Humans: Implications for Nutrition and Health. Amino Acids 2013, 45, 463–477. [CrossRef]
- Ha, C.Y.; Kim, J.Y.; Paik, J.K.; Kim, O.Y.; Paik, Y.; Lee, E.J.; Lee, J.H. The Association of Specific Metabolites of Lipid Metabolism with Markers of Oxidative Stress, Inflammation and Arterial Stiffness in Men with Newly Diagnosed Type 2 Diabetes. Clinical Endocrinology 2012, 76, 674–682. [CrossRef]
- Lewis, G.F.; Carpentier, A.; Adeli, K.; Giacca, A. Disordered Fat Storage and Mobilization in the Pathogenesis of Insulin Resistance and Type 2 Diabetes. Endocrine Reviews 2002, 23, 201–229. [CrossRef]
- Wang-Sattler, R.; Yu, Z.; Herder, C.; Messias, A.C.; Floegel, A.; He, Y.; Heim, K.; Campillos, M.; Holzapfel, C.; Thorand, B.; et al. Novel Biomarkers for Pre-diabetes Identified by Metabolomics. Molecular Systems Biology 2012, 8, 615. [CrossRef]
- Mirza, A.Z.; Althagafi, I.I.; Shamshad, H. Role of PPAR Receptor in Different Diseases and Their Ligands: Physiological Importance and Clinical Implications. European Journal of Medicinal Chemistry 2019, 166, 502–513. [CrossRef]
- Donath, M.Y.; Shoelson, S.E. Type 2 Diabetes as an Inflammatory Disease. Nat Rev Immunol 2011, 11, 98–107. [CrossRef]
- Wang, B.; Wu, L.; Chen, J.; Dong, L.; Chen, C.; Wen, Z.; Hu, J.; Fleming, I.; Wang, D.W. Metabolism Pathways of Arachidonic Acids: Mechanisms and Potential Therapeutic Targets. Sig Transduct Target Ther 2021, 6, 94. [CrossRef]
- Ellulu, M.S.; Samouda, H. Clinical and Biological Risk Factors Associated with Inflammation in Patients with Type 2 Diabetes Mellitus. BMC Endocr Disord 2022, 22, 16. [CrossRef]
- Zhang, Y.; Liu, Y.; Sun, J.; Zhang, W.; Guo, Z.; Ma, Q. Arachidonic Acid Metabolism in Health and Disease. MedComm 2023, 4, e363. [CrossRef]
- Zhang, Y.; Chen, H.; Zhang, W.; Cai, Y.; Shan, P.; Wu, D.; Zhang, B.; Liu, H.; Khan, Z.A.; Liang, G. Arachidonic Acid Inhibits Inflammatory Responses by Binding to Myeloid Differentiation Factor-2 (MD2) and Preventing MD2/Toll-like Receptor 4 Signaling Activation. Biochimica et Biophysica Acta (BBA) - Molecular Basis of Disease 2020, 1866, 165683. [CrossRef]
- Liu, M.; Subramanian, V.S.; Subbaiah, P.V. Modulation of the Positional Specificity of Lecithin−Cholesterol Acyltransferase by the Acyl Group Composition of Its Phosphatidylcholine Substrate: Role of the Sn -1-Acyl Group. Biochemistry 1998, 37, 13626–13633. [CrossRef]
- Nakhjavani, M.; Morteza, A.; Karimi, R.; Banihashmi, Z.; Esteghamati, A. Diabetes Induces Gender Gap on LCAT Levels and Activity. Life Sciences 2013, 92, 51–54. [CrossRef]
- Bandet, C.L.; Mahfouz, R.; Véret, J.; Sotiropoulos, A.; Poirier, M.; Giussani, P.; Campana, M.; Philippe, E.; Blachnio-Zabielska, A.; Ballaire, R.; et al. Ceramide Transporter CERT Is Involved in Muscle Insulin Signaling Defects Under Lipotoxic Conditions. Diabetes 2018, 67, 1258–1271. [CrossRef]
- Sandhoff, R.; Schulze, H.; Sandhoff, K. Ganglioside Metabolism in Health and Disease. In Progress in Molecular Biology and Translational Science; Elsevier, 2018; Vol. 156, pp. 1–62 ISBN 978-0-12-812341-6.
- Xia, Q.-S.; Lu, F.-E.; Wu, F.; Huang, Z.-Y.; Dong, H.; Xu, L.-J.; Gong, J. New Role for Ceramide in Hypoxia and Insulin Resistance. WJG 2020, 26, 2177–2186. [CrossRef]
Figure 1.
Typical base peak chromatograms (BPI) obtained for DM2 (diabetic participants) and NDM2 (non-diabetic controls) groups with positive ionization.
Figure 1.
Typical base peak chromatograms (BPI) obtained for DM2 (diabetic participants) and NDM2 (non-diabetic controls) groups with positive ionization.
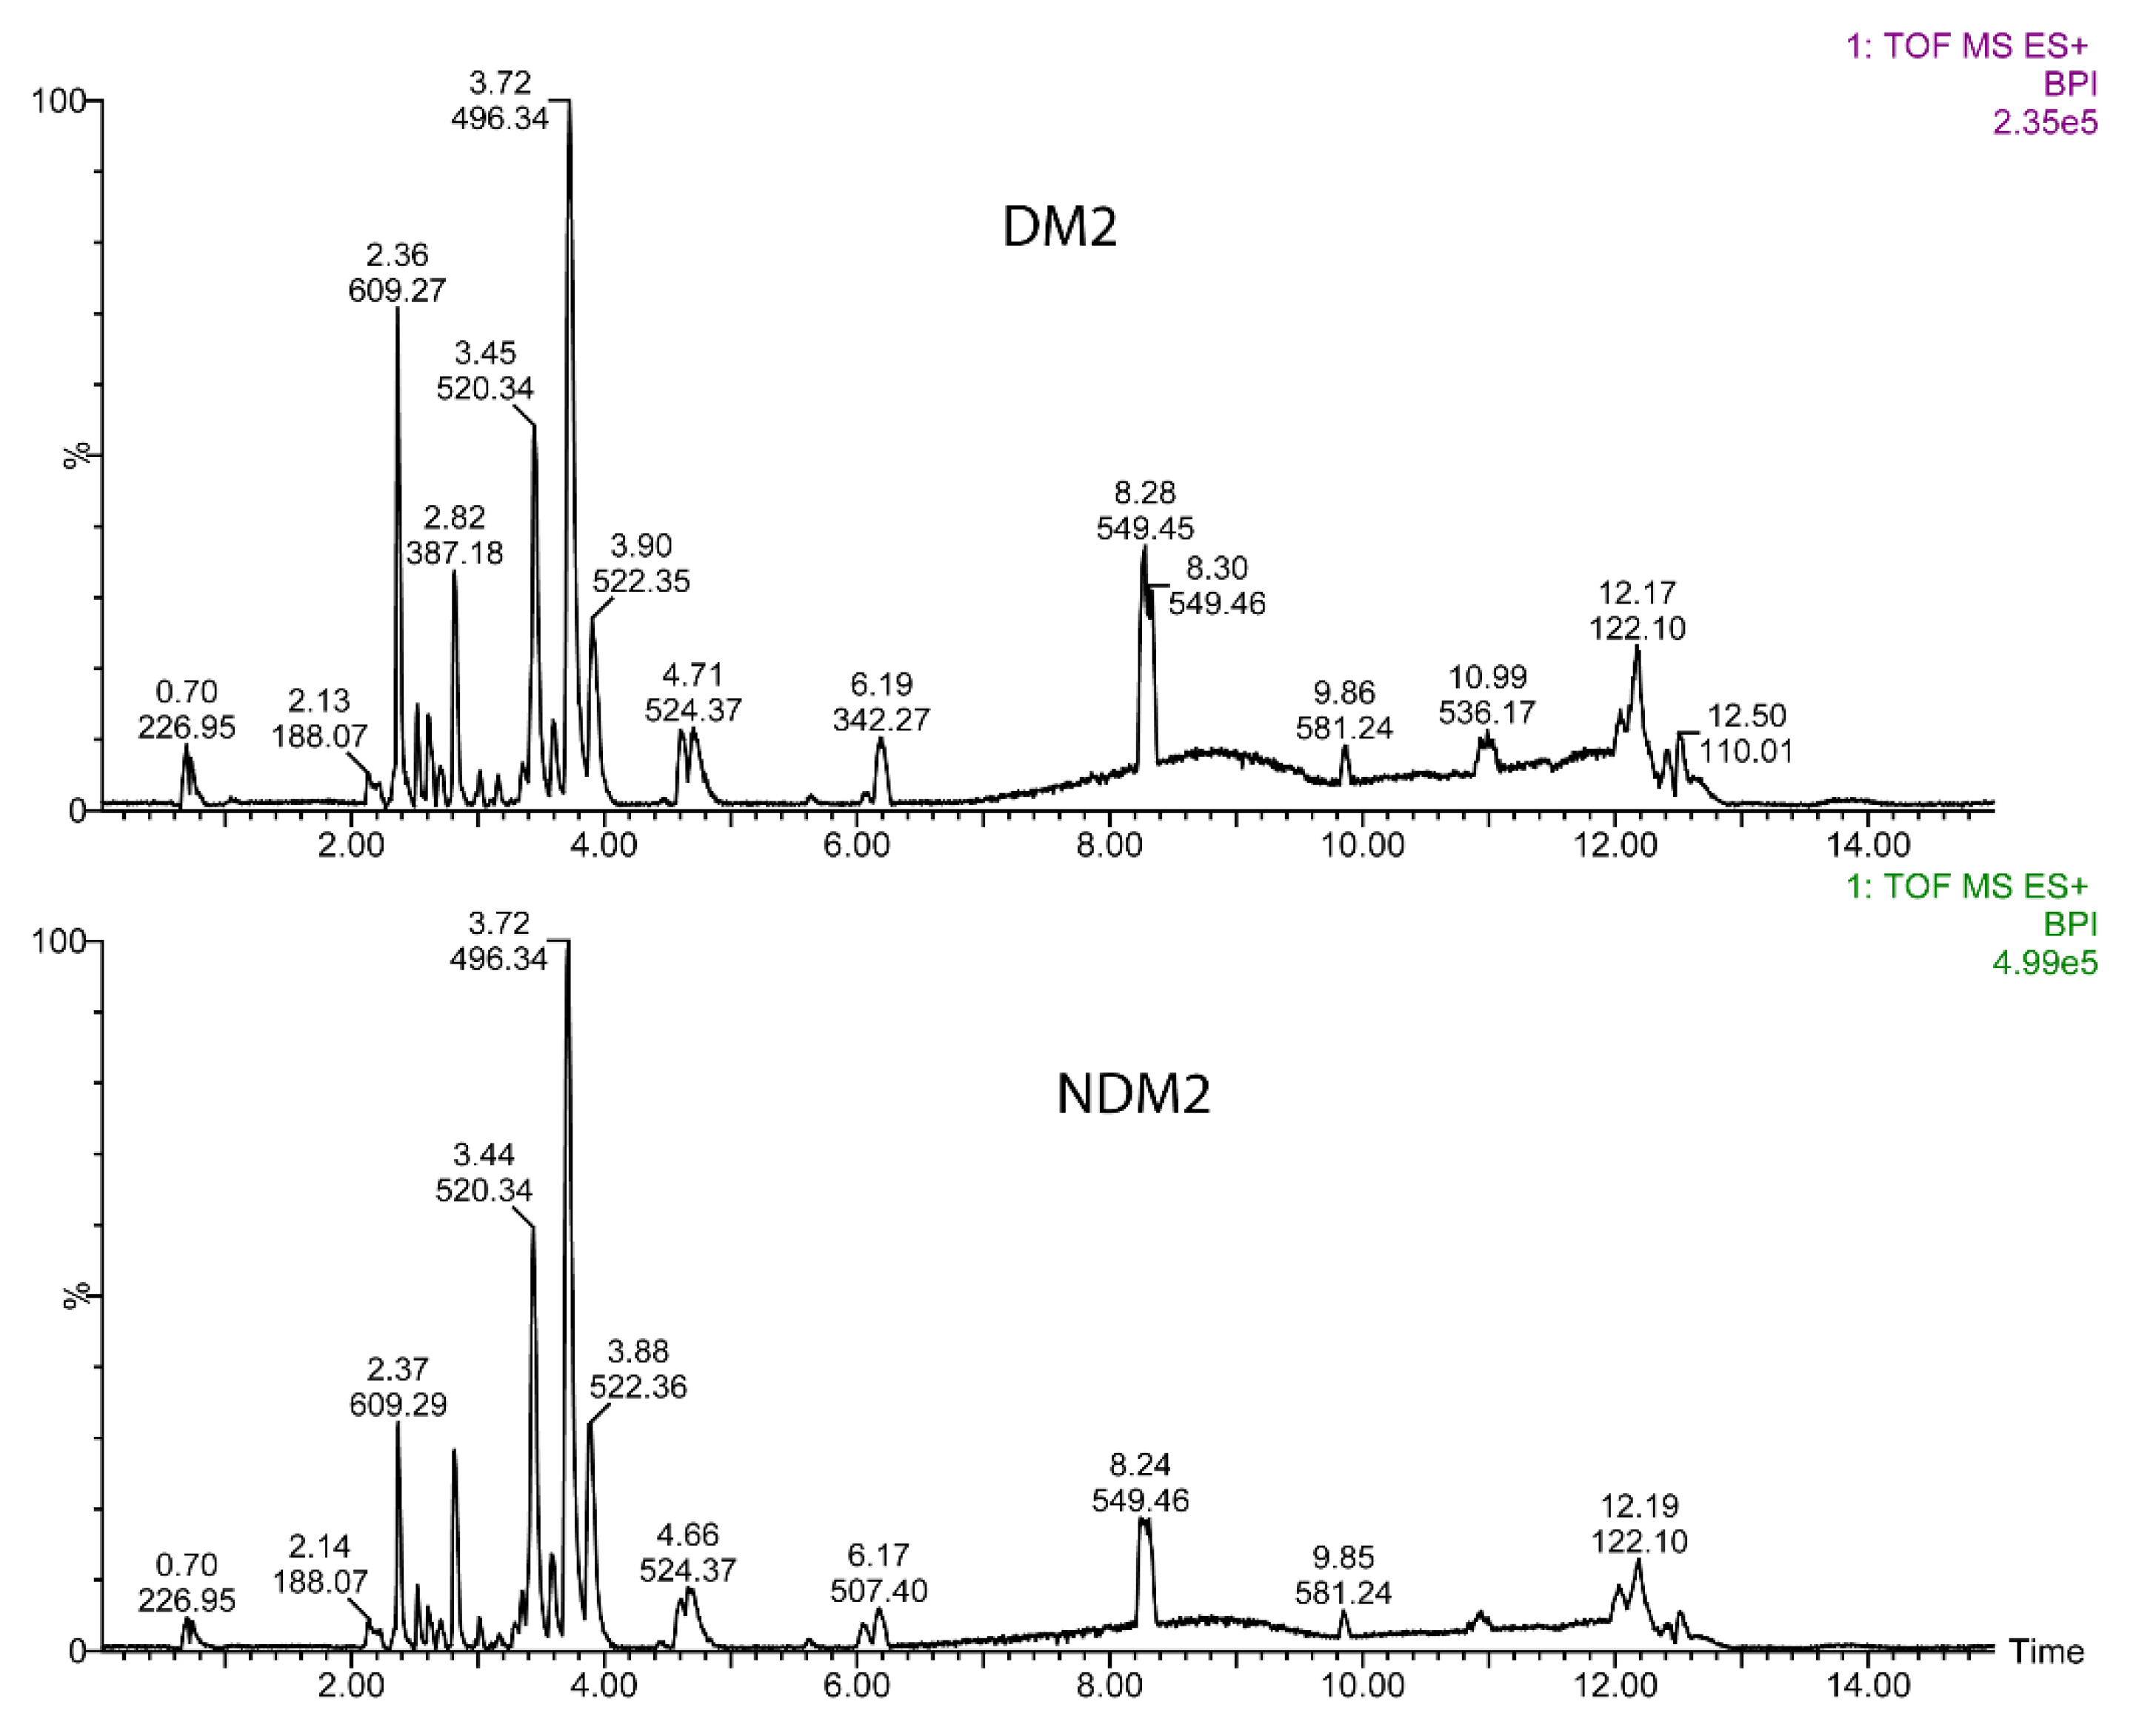
Figure 2.
Score-plots of the UPLC-MS data obtained after processing with partial least square discriminant analysis (PLS-DA) using the softwares XS application (upper panel) and MetaboAnalyst (lower panel). Sample 47 was considered outlier and excluded.
Figure 2.
Score-plots of the UPLC-MS data obtained after processing with partial least square discriminant analysis (PLS-DA) using the softwares XS application (upper panel) and MetaboAnalyst (lower panel). Sample 47 was considered outlier and excluded.
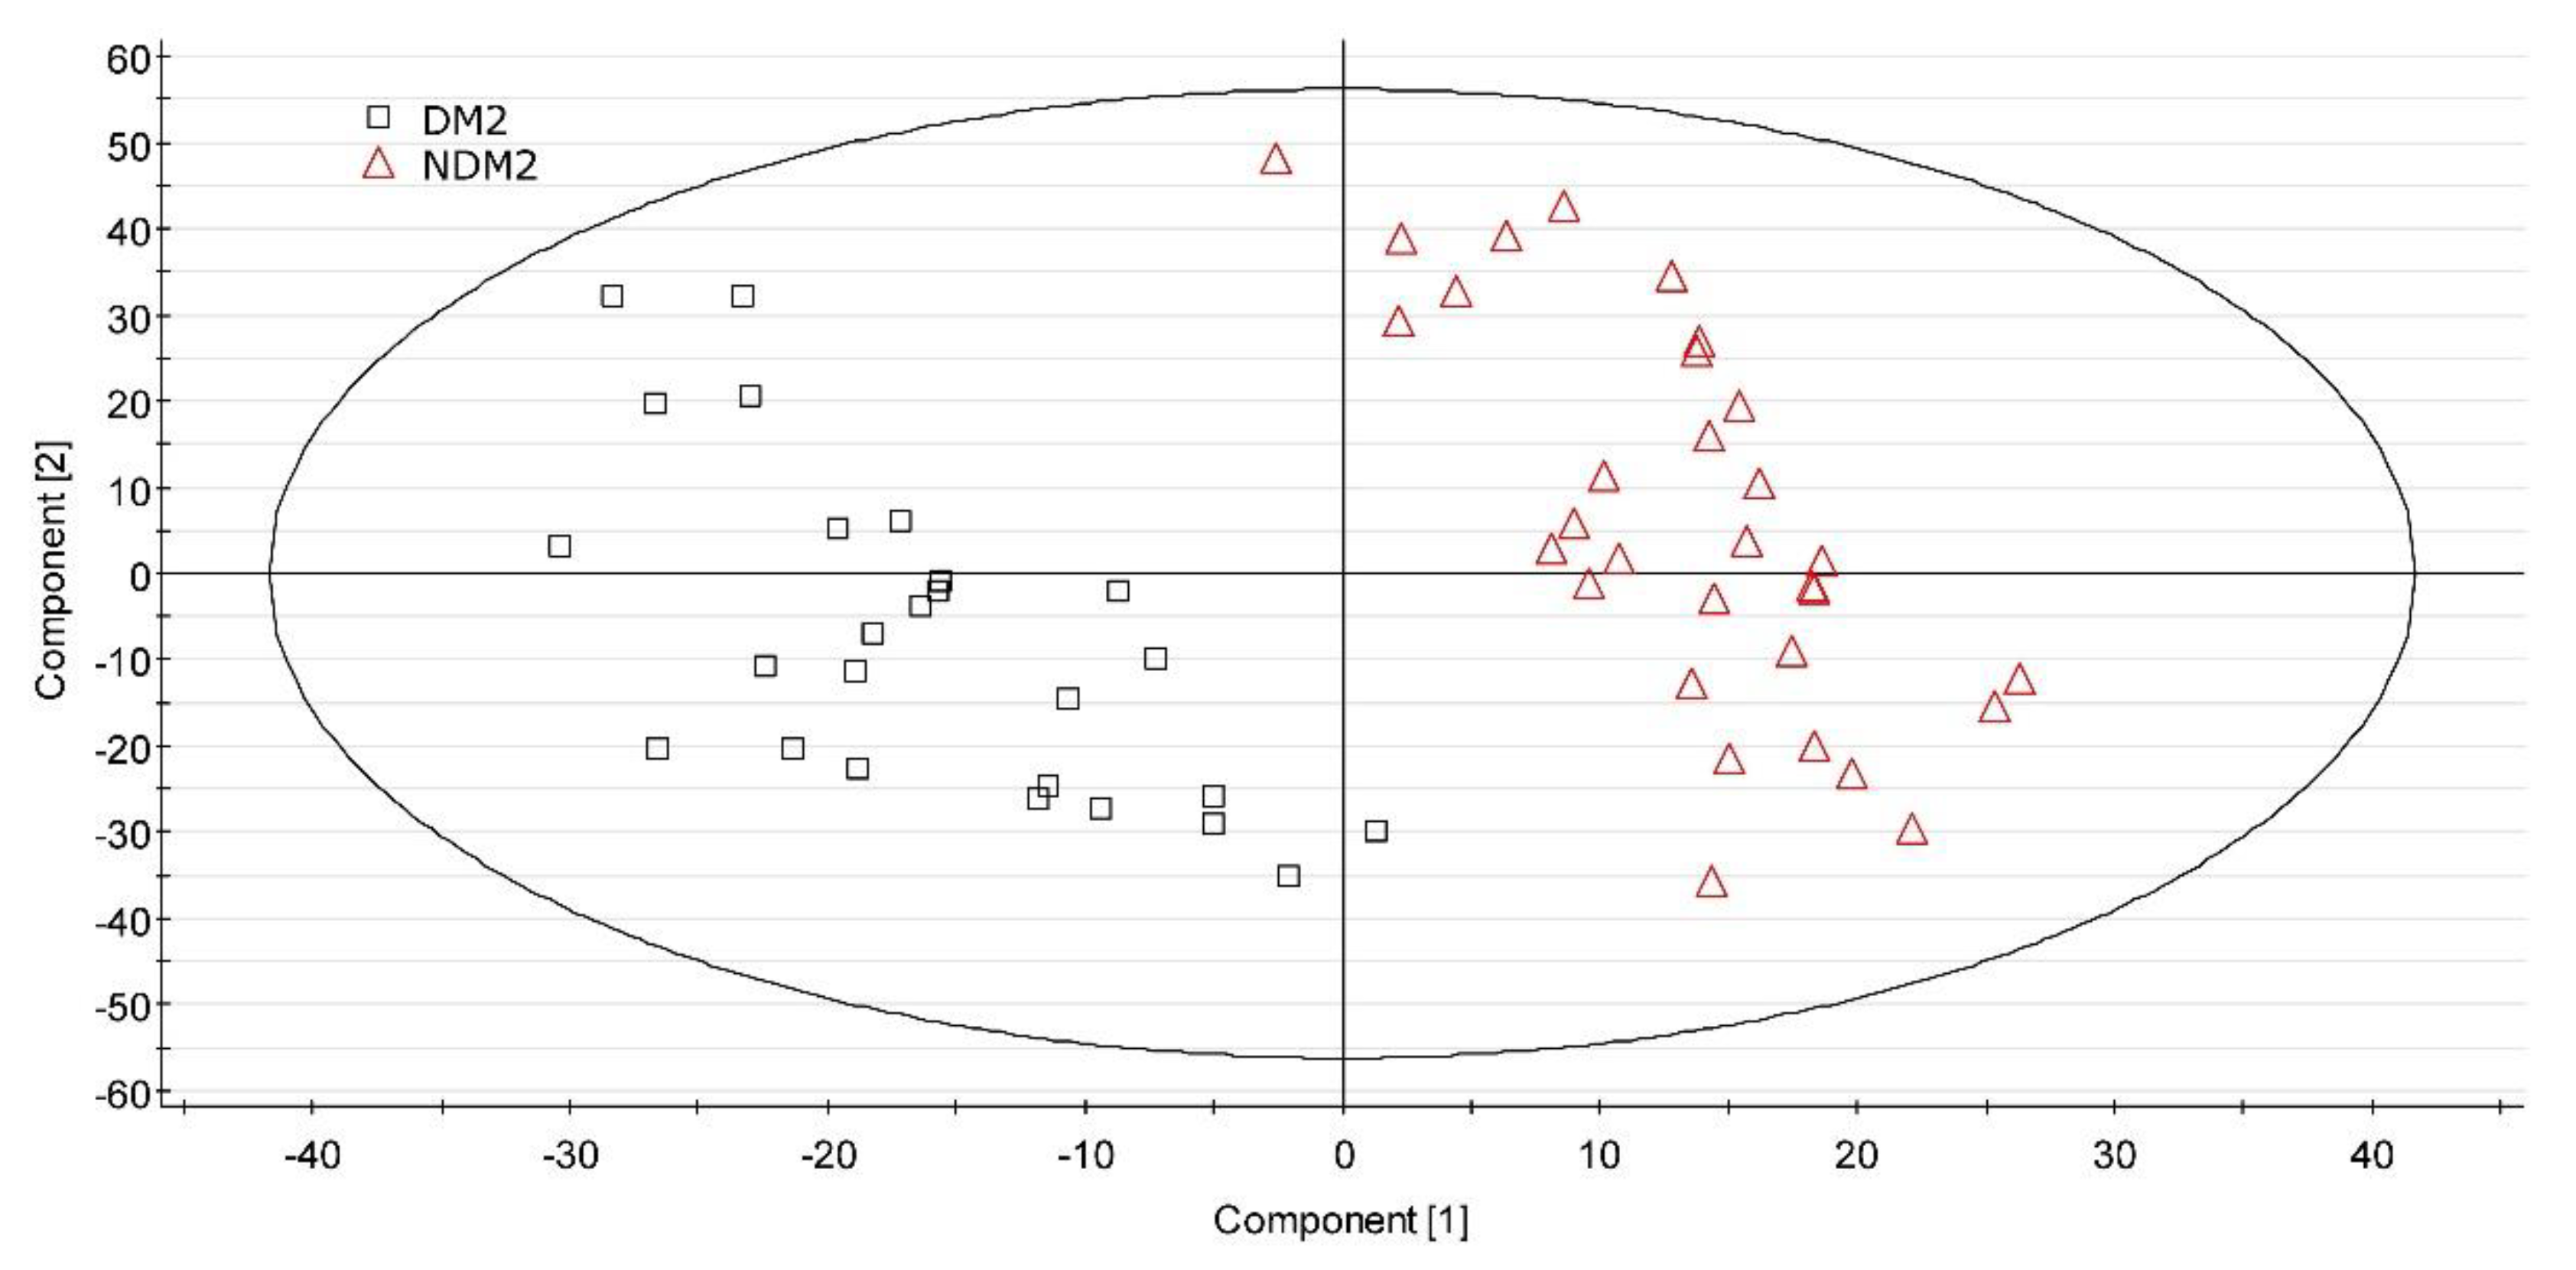
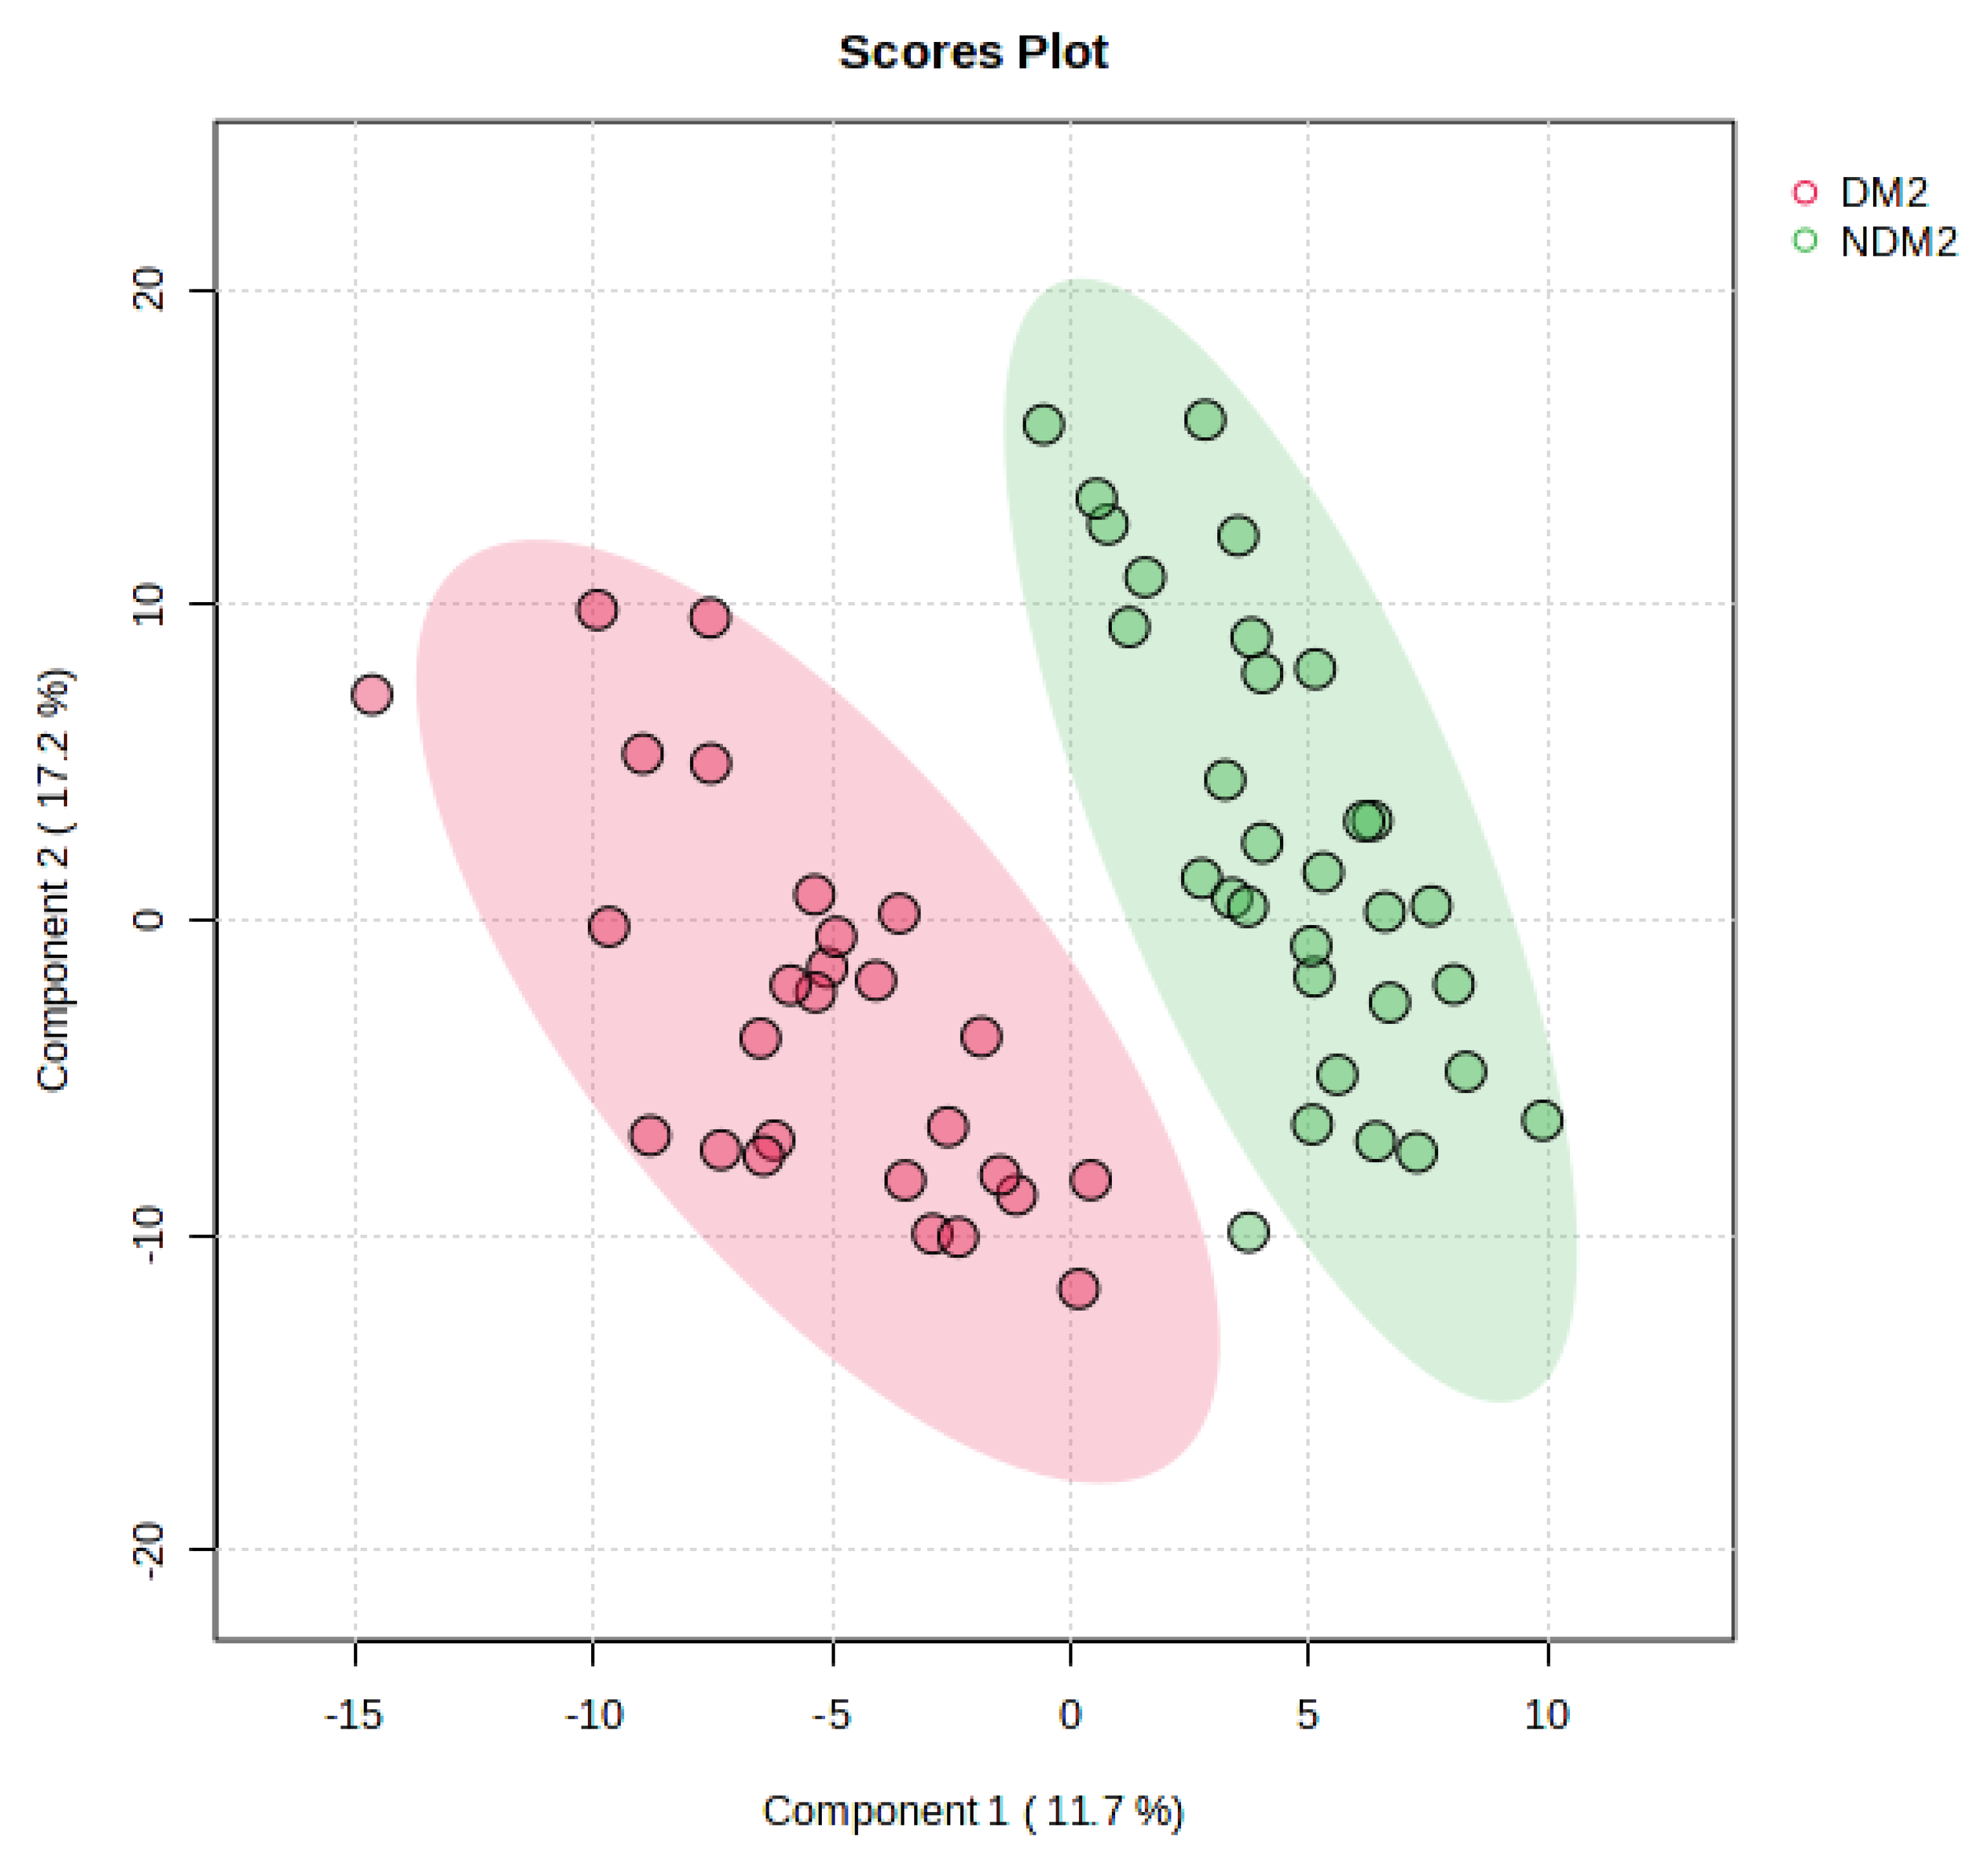

Table 1.
Characteristics of participants. NMD2 group is the control one. DM2 group is the diabetic diagnosed one. Continuous variables are expressed as mean ± standard deviation. .
Table 1.
Characteristics of participants. NMD2 group is the control one. DM2 group is the diabetic diagnosed one. Continuous variables are expressed as mean ± standard deviation. .
| Variable | NDM2 Group (n=32) | DM2 Group (n=27) |
|---|---|---|
| Demographics and anthropometric characteristics | ||
| Age (years; p = 0.004) | 71.4 ± 9.0 | 75.9 ± 8.1 |
| Sex (Female/Male) | 21 (66%) / 11 (34%) | 15 (56%) / 12 (44%) |
| BMI (kg/m2)1 | 28.8 ± 5.8 | 28.5 ± 6.3 |
| Underweight | 4 (13%) | 3 (11%) |
| Normal | 7 (22%) | 9 (33%) |
| Overweight | 7 (22%) | 6 (22%) |
| Obese | 14 (44%) | 9 (33%) |
| Waist circumference-Female (cm)2 | 100.6 ± 16.0 (n = 21) | 100.6 ± 14.9 (n = 15) |
| Waist circumference-Male (cm)2 | 104.8 ± 10.4 (n = 11) | 108.9 ± 11.4 (n = 12) |
| Lifestyle and dietary habits | ||
| Alcohol intake3 (p = 0.049) | 15 (47%) | 6 (22%) |
| Smoking status | ||
| Never smoker | 22 (69%) | 20 (74%) |
| Former smoker | 6 (19%) | 5 (19%) |
| Current smoker | 4 (13%) | 2 (7.4%) |
| Physical activity (MET-h/week)4 | 77.1 ± 93.8 | 64.9 ± 67.0 |
| Vigorous-intensity | 16 (50%) | 14 (52%) |
| Moderate | 10 (31%) | 7 (26%) |
| Light | 2 (6.3%) | 2 (7.4%) |
| Rest-being | 4 (13%) | 4 (15%) |
| Mediterranean diet score (MEDAS-14)5 | 8.6 ± 1.5 | 7.9 ± 1.1 |
| Low adherence | 7 (22%) | 8 (30%) |
| Moderate adherence | 19 (59%) | 18 (67%) |
| Strong adherence | 6 (19%) | 1 (3.7%) |
| High sugar food intake6 (p = 0.013) | 21 (66%) | 9 (33%) |
| Sugar intake (g/day: p = 0.019) | 47.3 ± 83.7 | 26.7 ± 55.5 |
| High fat food intake7 | 13 (41%) | 8 (30%) |
| Meat intake type | ||
| No meat diet | 5 (16%) | 6 (22%) |
| White and processed meat | 8 (25%) | 7 (26%) |
| Red and processed meat | 8 (25%) | 11 (41%) |
| White meat | 11 (34%) | 3 (11%) |
| Family history, treatments, polypharmacy, blood pressure, and biochemical parameters | ||
| Family history of cardiovascular disease | 15 (47%) | 7 (26%) |
| Family history of endocrine disease (p < 0.001) | 8 (25%) | 19 (70%) |
| Treatment for dyslipidemia | 11 (34%) | 12 (44%) |
| Polypharmacy (> 3 medications, p < 0.001) | 12 (38%) | 24 (89%) |
| Systolic blood pressure left arm (mmHg) (p = 0.038) | 134.6 ± 19.4 | 138.4 ± 15.2 |
| Diastolic blood pressure right arm (mmHg) | 83.1 ± 9.0 | 79.1 ± 8.5 |
| HbA1c (%) | - | 6.9 ± 0.9 |
| Fasting glucose (mmol/L, p < 0.001) | 5.1 ± 0.6 | 7.2 ± 1.9 |
| Total serum cholesterol (mg/dL, p < 0.001) | 193.0 ± 28.8 | 164.2 ± 36.3 |
| HDL (mg/dL) | 61.8 ± 16.2 | 61.6 ± 32.9 |
| LDL (mg/dL, p < 0.001) | 109.0 ± 24.2 | 86.4 ± 29.5 |
| Triglycerides (mg/dL) | 102.4 ± 37.3 | 105.4 ± 43.0 |
| TG/HDL ratio | 1.8 ± 1.0 | 2.0 ± 1.1 |
| LDL/HDL cholesterol ratio | 1.7 ± 0.6 | 1.6 ± 0.7 |
| High cardiovascular risk | 13 (41%) | 11 (41%) |
Values: ¹BMI (kg/m²): based on SEGG and SENPE guidelines-Underweight (<18.5), Normal weight (22–26.9), Overweight (27–29.9), and Obesity (>30); ²Waist circumference (cm): WHO thresholds-88 cm (women) and 102 cm (men) as the upper limit for metabolic health; ³Alcohol intake: considered “Yes” if exceeding high-risk levels (>2 UBEs/day for women, >4 UBEs/day for men); ⁴Physical activity (MET-h/week): Categories-Rest (≤4.2), Light (~10-11.2), Moderate (~22.4-39.2), and Vigorous (>40); ⁵Mediterranean diet score (MEDAS-14): high adherence (≥9), moderate adherence (5-8), low adherence (≤4); ⁶High sugar food intake: >36 g/day for men, >25 g/day for women; ⁷High fat food intake: categorized as high (≥2 portion) and low (0–1).
Table 2.
Relevant differential metabolites as shown by the PLS-DA. Chromatographic peak areas of the compounds were normalized to the chromatographic peak area of reserpine, and are indicated as mean ± standard deviation. FC (Log2) is the logarithm in base 2 and was calculated as the ratio of the mean value of the normalized chromatographic peak area of the DM2 group to that of the NDM2 group. P-value was determined after statistical comparisons were performed using independent t-tests and the Mann–Whitney U test, as appropriate. .
| Metabolite | Formula [M + H]+ |
m/z | Normalized Chromatographic Peak Areas | Retention Time (min) |
FC (Log2) |
Regulation | p | |
|---|---|---|---|---|---|---|---|---|
| DM2 | NDM2 | |||||||
| LPC(14:0) | C22H47NO7P | 468.3072 | 0.032 ± 0.016 | 0.053 ± 0.029 | 3.18 | - 0.73 | Down | <0.001 |
| LPC(16:0) | C24H50NO7P | 496.3413 | 3.321 ± 0.982 | 4.075 ± 0.984 | 3.72 | - 0.29 | Down | 0.003 |
| LPC(18:0) | C26H54NO7P | 525.3698 | 0.235 ± 0.067 | 0.332 ± 0.109 | 4.68 | - 0.50 | Down | <0.001 |
| LPC(18:1) | C26H52N89P | 522.3556 | 1.253 ± 0.502 | 1.306 ± 0.494 | 3.90 | - 0.06 | Down | 0.344 |
| LPC(18:2) | C26H50NO7P | 520.3401 | 1.834 ± 0.794 | 2.320 ± 1.027 | 3.45 | - 0.34 | Down | 0.023 |
| LPC(20:4) | C28H50NO7P | 544.3397 | 0.323 ± 0.139 | 0.313 ± 0.159 | 3.42 | + 0.05 | Up | 0.400 |
| LPC(22:6) | C30H50NO7P | 569.3391 | 0.077 ± 0.038 | 0.083 ± 0.040 | 3.36 | - 0.10 | Down | 0.296 |
| PC(16:0/18:2) | C42H80NO8P | 758.5605 | 2.29 10-4 ± 6.55 10-4 | 6.22 10-4 ± 12.6 10-4 | 7.54 | - 1.44 | Down | 0.081 |
| Ganglioside 1 | C75H137N3O27 | 754.9894 | 0.074 ± 0.041 | 0.096 ± 0.045 | 3.72 | - 0.37 | Down | 0.032 |
| Ganglioside 2 | C75H135N3O27 | 762.9800 | 0.013 ± 0.010 | 0.019 ± 0.009 | 3.72 | - 0.57 | Down | 0.009 |
| Ganglioside 3 | C78H142N2O31 | 791.4910 | 0.017 ± 0.014 | 0.024 ± 0.022 | 3.44 | - 0.52 | Down | 0.080 |
| Glycine-Histidine | C8H12N4O3 | 195.0888 | 0.008 ± 0.013 | 0.021 ± 0.035 | 2.18 | - 1.43 | Down | 0.040 |
| Unidentified 1 | C26H47N2O7P? | 531.8243 | 0.100 ± 0.056 | 0.133 ± 0.064 | 3.44 | - 0.41 | Down | 0.020 |
Table 3.
Matrix of correlations between the most relevant PLS-DA biomarkers. The correlation is indicated by the r and p (into brackets) values.
Table 3.
Matrix of correlations between the most relevant PLS-DA biomarkers. The correlation is indicated by the r and p (into brackets) values.
| Gly-His | LPC(22:6) | LPC(20:4) | LPC(14:0) | Ganglioside 2 | |
|---|---|---|---|---|---|
| Gly-His | - | - 0.211 (0.113) | - 0.057 (0.669) | 0.366 (0.005) | 0.006 (0.963) |
| LPC(22:6) | - 0.211 (0.113) | - | 0.513 (<0.001) | 0.250 (0.059) | 0.540 (<0.001) |
| LPC(20:4) | - 0.057 (0.669) | 0.513 (<0.001) | - | 0.190 (0.153) | 0.333 (0.011) |
| LPC(14:0) | 0.366 (0.005) | 0.250 (0.059) | 0.190 (0.153) | - | 0.480 (<0.001) |
| Ganglioside 2 | 0.006 (0.963) | 0.540 (<0.001) | 0.333 (0.011) | 0.480 (<0.001) | - |
Table 4.
Results of the statistical univariate and multivariate analyses. OR: Odds Ratio. CI: 95% Confidence Interval. p-values < 0.05 were considered statistically significant.
Table 4.
Results of the statistical univariate and multivariate analyses. OR: Odds Ratio. CI: 95% Confidence Interval. p-values < 0.05 were considered statistically significant.
| Univariate Analysis | Multivariate Analysis | |||||||
|---|---|---|---|---|---|---|---|---|
| Characteristics | n | OR | 95% CI2 | p-Value | OR | 95% CI | p-Value | |
| Age | 59 | 1.064 | 1.000-1.140 | 0.060 | 1.096 | 1.009-1.208 | 0.041 | |
| Gender masculine | 59 | 1.527 | 0.533-4.441 | 0.430 | 1.413 | 0.281-7.305 | 0.670 | |
| Gly-Hist | Gender | 59 | 0.994 | 0.985-1.000 | 0.108 | 0.995 | 0.985-1.003 | 0.349 |
| No gender | 59 | 0.994 | 0.986-1.000 | 0.108 | 0.996 | 0.986-1.003 | 0.336 | |
| LPC(22:6) | Gender | 59 | 1.000 | 0.997-1.003 | 0.624 | 1.001 | 0.995-1.008 | 0.652 |
| No gender | 59 | 1.001 | 0.998-1.004 | 0.624 | 1.001 | 0.995-1.008 | 0.740 | |
| LPC(20:4) | Gender | 59 | 1.000 | 0.999-1.001 | 0.100 | 1.001 | 1.000-1.003 | 0.049 |
| No gender | 59 | 1.001 | 0.999-1.002 | 0.100 | 1.002 | 1.001-1.004 | 0.026 | |
| LPC(14:0) | Gender | 59 | 0.990 | 0.982-0.996 | 0.009 | 0.988 | 0.977-0.997 | 0.018 |
| No gender | 59 | 0.991 | 0.983-0.997 | 0.009 | 0.989 | 0.978-0.997 | 0.019 | |
| Ganglioside 2 | Gender | 59 | 0.986 | 0.971-0.998 | 0.044 | 0.976 | 0.950-0.996 | 0.042 |
| No gender | 59 | 0.986 | 0.971-0.999 | 0.044 | 0.977 | 0.952-0.997 | 0.045 | |
Disclaimer/Publisher’s Note: The statements, opinions and data contained in all publications are solely those of the individual author(s) and contributor(s) and not of MDPI and/or the editor(s). MDPI and/or the editor(s) disclaim responsibility for any injury to people or property resulting from any ideas, methods, instructions or products referred to in the content. |
© 2025 by the authors. Licensee MDPI, Basel, Switzerland. This article is an open access article distributed under the terms and conditions of the Creative Commons Attribution (CC BY) license (http://creativecommons.org/licenses/by/4.0/).
Copyright: This open access article is published under a Creative Commons CC BY 4.0 license, which permit the free download, distribution, and reuse, provided that the author and preprint are cited in any reuse.


