
Submitted:
05 May 2025
Posted:
06 May 2025
You are already at the latest version
Abstract
Background/Objectives: High-intensity intermittent training (HIIT) has been proven to improve cardio-metabolic and respiratory health outcomes. In addition, 20-hydroxyecdysone from plant extracts has been studied for its anabolic effects. However, studies examining these two interventions in individuals who are obese or overweight are limited. This study, thus, examined the effects of HIIT combined with Asparagus officinalis (A. officinalis) extract supplementation on cardiovascular and pulmonary function parameters in obese and overweight individuals. Methods: Seventy-two obese and overweight participants were randomized into four groups (n = 18 each): the control (CON) group, HIIT group (HIIT for 3 days/week), AOE (A. officinalis extract) group (supplementation with 20E at 1.71 mg/kg/day), and HIIT+AOE group. Pre- and 12-week post-intervention measures included heart rate (HR), HR variability, endothelial function, blood pressure (BP), BP variability, pulmonary function and volume, respiratory muscle strength, chest expansion, and body composition. Results: The high-frequency power of HR variability was higher (p=0.038) and the low-frequency–high-frequency ratio was lower in the HIIT+AOE group (p=0.038) compared to the CON group. Peak blood flow increased in both the HIIT (p=0.03) and HIIT+AOE (p=0.028) groups, but only the HIIT group had a shorter vascular recovery time (p=0.048) compared to the CON group. Similarly, maximum expiratory pressure was increased in both the HIIT and HIIT+AOE groups compared to the CON group (p=0.029 and p=0.041). In addition, the ratio of forced expiratory volume in one second to forced vital capacity, the percent-predicted FEV1/FVC, and chest wall expansion were higher in the HIIT+AOE group than in the CON group (p=0.047, p=0.038, and p = 0.001). In addition, the waist-to-hip ratio was lower in the HIIT+AOE group than in the CON group (p= 0.043). There were no significant differences in HR, BP, BP variability, or pulmonary volume parameters among groups. Conclusions: The combination of HIIT with A. officinalis extract supplementation markedly improves HR variability. Moreover, it also greatly improves expiratory muscle strength, chest wall expansion, pulmonary function, and body composition parameters in obese and overweight individuals.
Keywords:
Obesity
; Asparagus
; High-intensity intermittent training
; Blood pressure
; Pulmonary function
; Endothelial function
; Heart rate variability
1. Introduction
Obesity is a major risk factor for increased all-cause mortality, particularly due to cardiovascular diseases [1]. It is also related to systemic inflammation, cancer, and respiratory comorbidities [2]. In individuals with obesity, an imbalance in autonomic nervous system activity can increase the risk of non-communicable diseases, such as hypertension and type 2 diabetes, and can lead to higher cardiovascular disease mortality [3]. This imbalance can manifest in a change in either heart rate (HR) variability or blood pressure (BP) variability, which predominantly originates from increased sympathetic activity and reduced vagal control [4,5].
Moreover, pulmonary function is frequently significantly altered in obesity. This alteration is a consequence of the reduced compliance of the lungs, chest wall, and entire respiratory system [6,7,8,9,10]. These underlying changes alter the breathing pattern, resulting in a substantial reduction in both the expiratory reserve volume (ERV) and the static resting volume of the lungs, known as the functional residual capacity (FRC) [11]. Dynamic measures of pulmonary function, such as forced vital capacity (FVC) and forced expiratory volume in one second (FEV1), are slightly reduced in obesity, but the FEV1/FVC ratio is usually unaffected [10,12,13,14,15]. Taken together, these findings suggest that obesity not only disturbs pulmonary function but also significantly diminishes pulmonary volume.
Previous studies have examined non-pharmacologic treatments, including physical activity and exercise, as effective strategies for managing obesity and overweight [16,17]. High-intensity intermittent training (HIIT) is a structured exercise regimen that alternates short bursts of vigorous activity with periods of complete rest or low-intensity recovery [18]. The duration of exercise and rest periods ranges from 6 seconds to 4 minutes, with training programs typically lasting between 2 and 15 weeks. [19]. While the positive effects of HIIT on muscular performance, muscle thickness, and cardiopulmonary fitness (e.g., maximal oxygen uptake) are well established [20,21,22], the efficacy of HIIT in improving cardiovascular and pulmonary function indices—such as HR, HR variability, endothelial function, BP, and BP variability—in obese and overweight individuals has not yet been thoroughly examined.
Over the past two decades, one class of dietary supplements that has garnered increasing interest is ecdysteroids, which are found in animals, plants (phytoecdysteroids), and fungi [23]. The most common type of phytoecdysteroid is 20-hydroxyecdysone (20E), which is often the predominant phytoecdysteroid in plants [24]. Asparagus or Asparagus officinalis (A. officinalis), also known as the "king of vegetables", has been identified as a source of 20E, particularly in its hard stem by-product, which contains relatively high levels of 20E, approximately 2.34 mg/g dry weight [25]. Pharmacological studies of 20E in mammals have clearly demonstrated its anabolic properties, as well as its potential benefits in fat reduction, anti-diabetic activity, anti-inflammatory and antioxidant effects, vasorelaxation, cardioprotective properties, and neuromuscular and pulmonary protection [24]. Studies conducted in healthy individuals have demonstrated that 20E enhances physical performance and exhibits anabolic effects in both athletes and young adults [23]. Only two studies have investigated the effects of 20E in individuals with obesity. These studies revealed that 20E supplementation for approximately three months reduced body weight, waist circumference, body fat, systemic inflammation, and blood lipids; increased muscle strength; and prevented osteoporosis [26].
Despite existing research, there remains a lack of studies examining the effects of consuming 20E as a dietary supplement in combination with HIIT on cardiovascular and pulmonary function outcomes in obese and overweight individuals. This research gap presents an opportunity to explore potential alternative strategies to reduce the risk of chronic cardiovascular diseases (e.g., hypertension and atherosclerosis) and chronic restrictive lung diseases in obese and overweight individuals. Therefore, this study examined the effects of HIIT combined with A. officinalis extract as a dietary supplement on cardiovascular and pulmonary function parameters as primary outcomes in obese and overweight individuals. In addition, body composition parameters were also examined as secondary outcomes.
2. Materials and Methods
2.1. Study Design
This randomized controlled trial started in September 2022 and recruited obese and overweight individuals living in Chonburi Province. As illustrated by the CONSORT flow diagram (Figure 1), a stratified blocked randomization method was used to assign eligible participants to one of four groups through the RAND function in Microsoft Excel: the control (CON) group, the HIIT group, the A. officinalis extract (AOE) group, or the HIIT combined with AOE (HIIT+AOE) group. This study was non-blinded, and the same researcher (T.P.) oversaw screening, randomization, allocation, data collection, and analysis. However, to minimize biases, another researcher (P.P.) inspected all phases throughout the trial.
This study was registered in the Thai Clinical Trials Registry (ID: TCTR20220518001) and approved by the Burapha University Institutional Review Board on May 24, 2022 (ID: G-HS018/2565). Participants were provided with and signed an informed consent form before screening.
2.2. Screening of Participants
The inclusion criteria for participants in this study were as follows: male or female, aged 18 to 30 years, body mass index (BMI) >22.9 kg/m² [27]. Exclusion criteria were daily supplementation with drugs or dietary supplements, food allergies—especially shoots or bulbs such as asparagus, bamboo shoots, green onions, onions, leeks, garlic bulbs, and chives—drug allergies, and the use of lithium drugs (e.g., lithium carbonate). Additional exclusion factors were pregnancy or breastfeeding, regular smoking (>30 packs/year), regular alcohol consumption (>1 cup/day), and a history of drug use or cardiovascular, liver, renal, musculoskeletal, infectious, cancer, neurological, or psychiatric disorders. Participants were withdrawn from the study if they experienced adverse symptoms during testing (e.g., nausea, vomiting, or fainting), reported serious study-related adverse effects (e.g., hospitalization due to exercise or supplementation), or chose to withdraw voluntarily.
2.3. Sample Size
The sample size was determined based on our pilot study involving eight individuals who were obese or overweight, divided into four groups of two participants each. The mean change in expiratory muscle strength (MEP) for each group was calculated as follows: CON, -3.60 cm H₂O; HIIT, 7.60 cm H₂O; AOE, 1.60 cm H₂O; and HIIT+AOE, 7.40 cm H₂O. The standard error of the mean across all groups was 3.00. The required sample size was calculated with the G*Power Version 3.1.9.4 program using an alpha error of 0.05 and a test power of 0.95 [28]. Accounting for a 10% dropout rate, 18 participants per group were required, resulting in a total sample size of 72 individuals who were obese or overweight.
2.4. HIIT
This study utilized home-based bodyweight-bearing HIIT that was modified from a Tabata-style program, based on the protocol established in our previous study [22]. Each session comprised 4-minute exercise cycles, alternating between 20 seconds of activity and 10 seconds of rest, followed by an additional 4-minute active rest period, resulting in an 8-minute cycle. Participants trained three times per week over 12 weeks, beginning with two cycles during the first four weeks, progressing to three cycles from weeks 5 to 8, and completing four cycles from weeks 9 to 12. Exercise intensity was maintained at 75–85% of maximum perceived exertion, with active rest periods involving arm swings at 40–50% exertion.
Participants in the HIIT and HIIT+AOE groups received an exercise diagram and video demonstration. The researcher monitored posture and compliance and provided real-time feedback. Sessions were scheduled individually, with communication via online platforms such as Line, Google Meet, or Microsoft Teams. Exercise intensity was measured using Borg's RPE scale (6–20) [29]. Participants were trained in its use before data collection and reported their exertion levels during home exercises. During each session, the exercise video played while the researcher corrected the participant’s posture in real time, recorded RPE scores, and provided real-time encouragement to maintain the target intensity.
2.5. Supplement
Preparation of the A. officinalis extract was conducted at the Faculty of Liberal Arts and Science, Kasetsart University, Nakhon Pathom, Thailand. In brief, hard stems of A. officinalis were collected from Nakhon Pathom, Thailand, from April to May 2022 and transported to the laboratory within one day. The samples were washed, rewashed in an ultrasonic bath for 10 minutes, chopped into 5 mm pieces, and oven-dried for 30 hours at 60°C to achieve a consistent weight with 5% moisture content. The dried A. officinalis was powdered, extracted with 95% ethanol for 3 days (repeated twice), filtered, and evaporated to dryness. The residue was suspended in water and analyzed using HPLC chromatography with a C18 Sep-Pak cartridge (Agilent Technologies, Waldbronn, Germany) at 40°C with a 1 mL/min flow rate and a 20:80 acetonitrile/H2O mobile phase. The 20E compound was identified using UV absorbance at 245 nm, retention time, and spectral matching. A previously described method was used to quantify 20E [25,30]. During capsule preparation, capsules were filled with the A. officinalis extract powder under aseptic conditions, with each capsule weighing 500 mg. Each capsule contained 32.2 mg of 20E per gram of dry weight. The capsules were shipped frozen to Chonburi Province and stored at -20°C in a freezer for subsequent experiments.
To monitor the intake of the supplement, the researchers invited participants in the AOE and HIIT+AOE groups to join designated Line application groups specific to their respective groups. Following pre-experiment data collection, participants received the capsules for home consumption. The researcher provided daily reminders via the Line group and instructed participants to record their supplement intake twice daily—once in the morning and once in the evening—using the group’s note function. Compliance with supplement intake was monitored and documented by the same researcher throughout the 12-week study period.
2.6. Experiments
The participants in each group were asked to perform the following during the 12 weeks of experiments:
1. Participants in the CON group maintained their daily physical activity and dietary intake.
2. Participants in the HIIT group performed a home-based HIIT program for 3 days/week.
3. Participants in the AOE group took A. officinalis extract powder capsules containing 20E at 1.71 ± 0.24 mg/kg/day daily after a meal (1 or 2 capsules for breakfast and 2 capsules for dinner) [31].
4. Participants in the HIIT+AOE group performed a home-based HIIT program for 3 days/week and took A. officinalis extract powder capsules containing 20E at 1.71 ± 0.24 mg/kg/day daily after a meal (1 or 2 capsules for breakfast and 2 capsules for dinner) [31].
2.7. Study End Points
The primary outcomes included cardiovascular function parameters, including HR, HR variability, endothelial function, BP, and BP variability, as well as pulmonary function parameters, including static and dynamic lung volume, respiratory muscle strength, and chest wall expansion. In addition, the secondary outcomes comprised body composition parameters in order to determine the cumulative impacts of the independent variables (i.e., HIIT program and A. officinalis extract supplementation). All outcomes were measured before and after the 12-week intervention by the same researcher, a certified physical therapist. Measurements were conducted between 08:00 and 12:00 on the appointment date at the Exercise and Nutrition Innovation and Sciences Research Unit Room, Faculty of Allied Health Sciences, Burapha University, Chonburi Province. The order of measurements over the study period is outlined in Figure 2.
2.7.1. HR Variability
Measuring HR variability is a non-invasive method of assessing autonomic nervous system control over HR. In this study, short-term HR variability was applied and recorded for 10 minutes using Lead II electrocardiography (PowerLab® 4/30, ADInstruments, Australia) and analyzed through both time-domain (the standard deviation of normal beat-to-beat (R-R) intervals (SDNN) and the root mean square of successive RR intervals (RMSSD)) and frequency-domain (total power (TP), very low-frequency (VLF) power, low-frequency (LF) power, high-frequency (HF) power, and LF/HF ratio) parameters [32] using the HR variability module (LabChart® Pro, ADInstruments, Australia). These HR variability measures reflect the activities of the sympathetic and parasympathetic nervous systems and their balance, which control the heart [33].
2.7.2. Endothelial Function
Endothelial function was assessed using the endothelium-dependent vasodilation technique [34]. Forearm blood flow was measured with the Laser Doppler Flowmetry Module (LDF100C, BIOPAC Systems Inc., CA, USA) with the probe positioned perpendicularly to the brachial artery of the dominant arm. To measure blood flow during occlusion and recovery, a cuff from a standard mercury sphygmomanometer (Spirit™ CK-101, Germany) was placed around the arm just above the probe. The cuff was inflated to approximately 200 mm Hg to fully occlude the brachial artery and then gradually deflated. Forearm blood flow was recorded during three phases—at rest, during occlusion, and after occlusion, each lasting 5 minutes—and is reported in perfusion units. The following parameters were analyzed: resting blood flow, blood flow during occlusion, peak blood flow after occlusion, the peak blood flow/resting blood flow ratio, and recovery time after occlusion. Recovery time is defined as the duration after occlusion when blood flow returns to levels similar to the resting value.
2.7.3. BP and BP Variability
After a 10-minute rest period, BP and HR were measured with the individual in the supine position using a digital automatic BP monitor (HEM-7121, Omron Healthcare Co., Ltd., Japan), which provided BP values with ± 3 mmHg accuracy and supported an arm cuff circumference of 22-32 cm. The BP cuff thoroughly enveloped the arm, and the inferior edge of the cuff was nearly 1 inch above the elbow crease. BP and HR were measured three times at 1 min intervals, and the mean of these three readings was recorded as the final result for systolic BP (SBP), diastolic BP (DBP), and HR values.
Pulse pressure (PP: SBP − DBP), mean arterial pressure (MAP: DBP + (PP/3)), and the rate–pressure product (RPP: HR × SBP) were calculated based on the SBP, DBP, and HR values. Very short-term beat-to-beat BPV was assessed using the coefficient of variation for SBP and DBP (SBP CV and DBP CV, respectively). SBP CV was calculated as the standard deviation (SD) of the three SBP readings divided by the average SBP and multiplied by 100. Similarly, DBP CV was determined by dividing the SD of the three DBP readings by the mean DBP and multiplying by 100.
2.7.4. Static and Dynamic Lung Volume and Capacity
Static lung volumes (including tidal volume (TV), vital capacity (VC), inspiratory capacity (IC), expiratory reserve volume (ERV), and inspiratory reserve volume (IRV)), as well as dynamic lung capacities (including forced expiratory volume in one second (FEV1), forced vital capacity (FVC), FEV1/FVC ratio, maximal voluntary ventilation (MVV), peak inspiratory and expiratory flow rate (PIF and PEF), and forced expiratory time (FET)), were measured using a portable automated spirometer (MicroLab, Micro Medical®, UK). Participants were instructed to perform two maneuvers: (1) maximum inspiration followed by slow and complete exhalation to assess slow vital capacity, and (2) maximum inspiration followed by rapid and complete exhalation to assess forced vital capacity. All measurements were conducted in accordance with the standardized guidelines of the American Thoracic Society and the European Respiratory Society [35].
2.7.5. Respiratory Muscle Strength
Inspiratory and expiratory muscle strength were determined by measuring maximum inspiratory pressure (MIP) and maximum expiratory pressure (MEP) through the mouth, respectively, using a portable respiratory pressure meter (MicroRPM, CareFusion, UK). Participants were asked to perform maximum inspiration and rapidly and completely exhale for MEP, as well as perform maximum expiration and completely inhale for MIP. The measurement procedure followed the standard guidelines of the ATS/ERS Statement [36].
2.7.6. Chest Wall Expansion
Expansion of the chest wall was circumferentially measured using a standard measuring tape in centimeters at the three following levels: the 3rd intercostal space (upper), the 5th intercostal space (middle), and the tip of the xyphoid process (lower) [37]. The difference between deep expiration and deep inspiration was measured twice. Three measurements were taken at each level, and the average of the three readings is reported. Participants were in the sitting position with their elbows slightly flexed so that their hands rested on their hips. Intra-tester reliability of upper-, middle-, and lower-chest expansion measurements was evaluated with five obese participants. Measurements of each participant were performed for 3 days. The intra-class correlation coefficient (ICC) shows good intra-tester reliabilities of upper- and lower-chest expansions (ICC = 0.88 and 0.83, respectively) and moderate intra-tester reliability for middle-chest expansion (ICC = 0.72) [38].
2.7.7. Body Composition
Body composition parameters, including BM, BMI, skeletal muscle mass, fat-free mass, fat mass, percent body fat, waist circumference, waist–hip ratio, and basal metabolic rate, were assessed using a bioelectrical impedance analyzer (InBody270, InBody Co., Ltd., Daejeon, Republic of Korea).
2.7.8. Physical Activity
To minimize the influence of external factors, all participants were instructed to maintain their routine physical activities and dietary intake throughout the study period. The Thai version of the Baecke Habitual Physical Activity Questionnaire was also used to assess participants' activity levels, categorizing them as sedentary or physically active [39,40].
2.7.9. Feasibility
Completion and dropout rates were recorded for all groups. Additionally, compliance (number of HIIT sessions completed), adherence (number of participants who reached the target exertion level during HIIT), and RPE were documented to assess exercise intensity during the HIIT program in the HIIT and HIIT+AOE groups. For the AOE and HIIT+AOE groups, the number of supplement capsules consumed over the 12-week study period was recorded.
2.8. Statistical Analysis
Data were analyzed using SPSS version 26 (IBM Corp., Armonk, NY, USA) and are presented as mean ± SD or range. The Kolmogorov–Smirnov test was used to assess the normality of data distributions, and appropriate parametric or non-parametric tests were applied accordingly. Between-group differences were analyzed using the one-way analysis of variance (ANOVA), followed by Bonferroni post hoc testing. Since body composition, vital signs, and pulmonary function data did not follow a normal distribution, they were analyzed using the Kruskal–Wallis test, followed by the Mann–Whitney U test for pairwise comparisons. Except for endothelial function values, some participants' post-test data could not be recorded due to technical issues with the instrument. As a result, an intention-to-treat analysis was employed to account for missing data. Within-group differences between pre- and post-test measurements were assessed using the paired t-test. Statistical significance was set at p < 0.05. The effect size (ES) was calculated following Cohen’s guidelines, with values above 0.8 denoting large effects, 0.5–0.8 medium effects, and 0.2–0.5 small effects.
3. Results
3.1. Participant Characteristics and Feasibility
Seventy-six participants who were obese or overweight voluntarily participated in the study; however, only seventy-three met the inclusion criteria and were enrolled. Of these, seventy-two participants completed the study, as one participant from the control group declined participation. The final participants consisted of seventy-two participants (fifty-eight males, 80.60%) classified as obese (n = 55, 23.6%) or overweight (n = 17, 76.4%). The characteristics of the participants in each group are presented in Table 1. There were no statistically significant differences in baseline physical characteristics between the four groups.
The exercise dropout rate remained at zero percent in both the HIIT and HIIT+AOE groups, and no serious adverse events occurred during the trial. The rating of perceived exertion during the home-based HIIT program ranged from 7 to 11 (extremely light to light intensity) during the warm-up phase, 13 to 17 (hard to very hard intensity) during the exercise phase, and 9 to 11 (light intensity) during the cool-down phase. A few minor adverse events were reported in both groups. Specifically, two participants from the HIIT group and two from the HIIT+AOE group experienced leg muscle soreness and nausea during the fourth cycle of the HIIT program. However, none of the participants discontinued the trial.
All participants in both the AOE and HIIT+AOE groups consumed A. officinalis extract capsules without experiencing any adverse effects or complications. The AOE group consumed an average of 245.94 ± 2.94 capsules, corresponding to 79.99 ± 11.48% of the prescribed supplement dosage, while the HIIT+AOE group consumed an average of 256.94 ± 2.83 capsules, equivalent to 80.24 ± 2.83% of the prescribed dosage.
Furthermore, throughout the 12-week intervention period, no significant changes in daily physical activity were observed over time, and no notable differences were detected between the groups (Table 1).
3.2. HR and HR Variability
Before the 12-week intervention, no significant differences were observed in HR or HR variability among the four groups. After the 12-week intervention, a significant reduction in LF power was found in the HIIT group (−12.34 ± 14.12 nu, p = 0.002) and the HIIT+AOE group (−6.54 ± 10.21 nu, p = 0.015) compared to the baseline. Similarly, the LF/HF ratio significantly decreased in both the HIIT group (−0.52 ± 0.75 nu, p = 0.010) and the HIIT+AOE group (−0.33 ± 0.66 nu, p = 0.048). Between-group comparisons after the intervention revealed that the HIIT+AOE group had significantly higher HF power (p = 0.038, ES = 0.51) as well as a significantly lower LF/HF ratio (p = 0.038, ES = 0.45) compared to the control group (Table 2).
3.3. Endothelial Function
Before the intervention, no significant differences were observed in resting blood flow, blood flow during occlusion, peak blood flow after occlusion, the ratio of peak blood flow after occlusion to resting blood flow, or recovery time after occlusion. However, after the 12-week intervention, the HIIT group demonstrated a significant increase in peak blood flow after occlusion (86.09 ± 152.77 BPU, p = 0.003) (Figure 3A) and a shorter recovery time after occlusion (-18.66 ± 21.76 s, p = 0.004) (Figure 3C). Moreover, the HIIT+AOE group also exhibited a significant increase in peak blood flow after occlusion (96.23 ± 169.92 BPU, p = 0.028) (Figure 3A) and the ratio of peak blood flow after occlusion to resting blood flow (2.68 ± 7.06, p = 0.048) (Figure 3B).
When groups were compared, the HIIT group exhibited a significantly shorter recovery time after occlusion compared to the CON group (-13.19 ± 6.13 s, p = 0.02, ES = 0.65), AOE group (-25.27 ± 6.13 s, p < 0.001, ES = 0.57), and HIIT+AOE group (-22.19 ± 6.13 s, p < 0.01, ES = 0.54) (Figure 3C). No significant differences were observed in resting blood flow, blood flow during occlusion, peak blood flow after occlusion, the ratio of peak to resting blood flow, or recovery time between the CON and AOE groups or between the CON and HIIT+AOE groups.
3.4. BP and BP Variability
During the pre-test phase, no significant differences were observed in BP variables, namely, SBP, DBP, MAP, PP, and RPP. After 12 weeks, the HIIT group exhibited a significant reduction in SBP (−4.18 ± 8.80 mmHg, p = 0.03), DBP (−3.36 ± 7.94 mmHg, p = 0.045), MAP (−3.64 ± 7.68 mmHg, p = 0.030), and RPP (−772.96 ± 1814.83 mmHg/min, p = 0.044); however, no significant differences were observed compared to the CON group. No significant within-group changes were observed in either the AOE or HIIT+AOE group, nor were they significantly different from the CON group, as shown in Table 3.
For BPV variables, no significant differences were observed between the groups prior to the experiment. After 12 weeks, the HIIT+AOE group exhibited a reduction in SBP CV (−0.94 ± 1.73 %, p = 0.033) and DBP CV (−1.2 ± 2.8 %, p = 0.042); however, these changes were not significantly different from those in the CON group. Additionally, no significant changes were observed in the AOE and HIIT groups between the pre- and post-experiment phases, and no differences were found among groups after 12 weeks, as shown in Figure 4.
3.5. Pulmonary Function
Table 4 shows that participants in the HIIT+AOE group demonstrated improvements in pulmonary function, as indicated by significant increases of 3.44 ± 1.38% in the FEV1/FVC ratio (p = 0.047, ES = 0.12) and 3.94 ± 1.54 %predicted in the percent-predicted FEV1/FVC (p = 0.038, ES = 0.01) compared to the CON group.
Intra-group analysis also showed that the HIIT+AOE group had increases of 2.44 ± 1.69% in the FEV1/FVC ratio (p = 0.049), 2.83 ± 1.89 %predicted in the percent-predicted FEV1/FVC ratio (p = 0.045), 0.78 ± 1.14 L/min in PIF (p = 0.01), and 0.49 ± 1.02 L/min (p = 0.018) and 7.72 ± 16.53 %predicted in PEF (p = 0.022). The AOE group had increases of 1.38 ± 2.76% in the FEV1/FVC ratio (p = 0.032), 1.00 ± 1.08 L/min in PIF (p = 0.001), 0.71 ± 1.10 L/min (p = 0.022), and 9.05 ± 18.31 %predicted in PEF (p = 0.049). Similarly, the HIIT group had increases of 1.27 ± 1.47 L/min in PIF (p = 0.002), 0.71 ± 0.82 L/min (p = 0.01), and 10.05 ± 11.68 %predicted in PEF (p = 0.002). In contrast, the CON group had decreases of 1.00 ± 2.02% in the FEV1/FVC ratio (p = 0.049) and 1.11 ± 2.08 %predicted in the percent-predicted FEV1/FVC ratio (p = 0.037).
3.6. Respiratory Muscle Strength
Intra-group analysis showed that MIP improved in all four groups: the CON group (4.39 ± 3.17 cmH2O, p <0.001), the HIIT group (6.31 ± 9.65 cmH2O, p = 0.03), the AOE group (4.71 ± 3.80 cmH2O, p <0.001), and the HIIT+AOE group (4.22 ± 3.27 cmH2O, p <0.001) (Figure 5A). However, no differences were observed between groups.
Regarding expiratory muscle strength, MEP was improved only in the HIIT group (7.61 ± 13.71 cmH2O, p = 0.031) and the HIIT+AOE group (7.11 ± 13.05 cmH2O, p = 0.034). Moreover, it was significantly higher in the HIIT group (p = 0.029, ES = 0.12) and the HIIT+AOE group (p = 0.041, ES = 0.13) when compared to the CON group (Figure 5B).
3.7. Chest Wall Expansion and Pulmonary Volume
There were no significant differences in chest wall expansion among the four groups before the intervention. As shown in Table 5, the HIIT+AOE group had a significant improvement in lower-chest wall expansion, with an increase of 0.97 ± 1.26 cm (p = 0.005), which was 1.90 ± 0.48 cm greater than that in the CON group (p = 0.001, ES = 0.53). In addition, the HIIT group had an increase in upper-chest wall expansion of 0.82 ± 1.20 cm (p = 0.010). In contrast, neither the AOE group nor the CON group showed significant changes in chest wall expansion.
There were no significant differences in pulmonary volume indices between groups either before or after the 12-week intervention. However, VC was improved in both the HIIT group (0.12±0.20 L, p<0.05) and the AOE group (0.18±0.28 L, p<0.05). Additionally, the AOE group also increased in IC (0.31±0.33 L, p<0.05) and IRV (0.27±0.51 L, p<0.05).
3.8. Body Composition
Table 6 presents the body composition parameters of participants in the CON, HIIT, AOE, and HIIT+AOE groups before and after the 12-week intervention. A significant increase in the waist–hip ratio was observed in both the CON group (Δ = 0.02 ± 0.04, p < 0.05) and the AOE group (Δ = 0.01 ± 0.03, p < 0.05) following the intervention. In contrast, the HIIT+AOE group demonstrated a significantly lower waist–hip ratio compared to the CON group after the intervention (p = 0.043, ES = 0.83). No other significant changes in body composition parameters were found in the groups.
4. Discussion
This study's findings indicate that HR variability and endothelial function parameters were improved after a combination of HIIT and A. officinalis extract supplementation for 12 weeks. Furthermore, expiratory muscle strength was increased following this regimen, leading to increased forced exhalation, which better reflects lung emptying and enhanced lung expansion in participants who are obese or overweight. In addition, this intervention also helped maintain body proportions, such as the waist-to-hip ratio, as compared to the control intervention.
4.1. Effects of HIIT Combined with A. officinalis Extract Supplementation on Cardiovascular Function Parameters
The results show that HIIT combined with A. officinalis extract (20E) supplementation improved endothelial function, as observed during hyperemic conditions. This may facilitate vascular adaptation to pressure fluctuations and thus reduce BP variability. Previous studies have not yet examined the effects of HIIT in combination with 20E supplementation. In a previous study examining the effects of a 4-week sprint/high-intensity interval training (sprint/HIIT) program—consisting of 4 to 7 constant-workload intervals at 200% of maximal power output, three times per week—in 16 obese men, the intervention was found to be effective in enhancing skeletal muscle capillarization, increasing endothelial nitric oxide synthase content, and reducing aortic stiffness [41]. According to a previous animal model study, HIIT comprising 14 repetitions of 20-second swimming sessions with 10-second rest intervals, four days per week for six weeks, significantly reduced central arterial stiffness—as assessed by arterial pulse-wave velocity—via an increase in aortic nitric oxide bioavailability [42]. These findings are consistent with our results, which were obtained by assessing arterial function using an endothelium-dependent vasodilation technique, and Laser Doppler measurements revealed an increase in peak blood flow following occlusion—indicating enhanced arterial vasodilation—in both the HIIT and HIIT+AOE interventions. Notably, the HIIT+AOE group exhibited a greater increase in peak blood flow, resulting in a higher ratio of peak post-occlusion blood flow to resting blood flow. On the other hand, the HIIT group demonstrated a faster vascular recovery time, suggesting predominantly improved vascular responsiveness.
Although studies regarding 20E in humans are still limited in some aspects, such as endothelial function, emerging evidence suggests its promising potential. Most investigations into the effects of 20E on endothelial function have been conducted in animal models such as mice, rats, and ovine [43]. For instance, a study on ovine found that 20E induced vasodilation in skeletal muscle arterioles via a nitric oxide-dependent mechanism that is independent of estrogen receptor β signaling. This suggests a vasorelaxant pathway for 20E [44]. Pharmacokinetic studies indicate that 20E is well tolerated in humans, and clinical investigations have shown that 20E has a good safety profile and may function as a multifunctional agent with the potential to modulate endothelial function, reduce vascular resistance, and enhance cardio-metabolic health [24]. To the best of our knowledge, our study is among the first to investigate the effects of 20E alone and in combination with HIIT on endothelial function. The findings indicate that 20E supplementation alone did not produce significant changes in endothelial function. However, when combined with HIIT, there was a markedly greater improvement. It is important to note that our study employed a relatively low dose of 1.71 mg/kg/day, which falls within the range considered safe for human use. Higher doses of 20E may elicit different effects, but potential toxicity at increased levels must be carefully considered.
In this study, resting BP decreased only in the HIIT intervention, with statistically significant reductions of −4.18 ± 8.80 mmHg in SBP and −3.36 ± 7.94 mmHg in DBP. These diminutions are near clinically significant thresholds, which are defined as a reduction of at least 5 mmHg in SBP or a reduction of at least 2 mmHg in DBP [45,46]. These findings are consistent with a previous study by Lu et al. (2023), who investigated the effects of a 12-week Tabata-style bodyweight functional HIIT program in 60 university students. Participants exercised for 13 minutes per session at 90% of their age-predicted maximum HR. The intervention reduced resting SBP from an average of 121.37 mmHg to 116.56 mmHg (a decrease of approximately 4–5 mmHg) compared to the control group. In the same study, a subgroup analysis of 10 overweight participants revealed a decrease in resting SBP from 121 mmHg to 117 mmHg (approximately 4 mmHg), with no change in DBP (71.6 mmHg pre- and post-intervention). Remarkably, our findings demonstrate a significant reduction in both SBP and DBP, which may be attributed to the longer and progressively increasing exercise duration used—16, 24, and 32 minutes every four weeks—potentially allowing for more pronounced cardiovascular adaptations [47]. These results indicate that HIIT alone can produce a clinically meaningful reduction in BP, which is associated with a lower risk of stroke, coronary heart disease, heart failure, major cardiovascular events, cardiovascular mortality, and all-cause mortality.
Meanwhile, 20E has demonstrated beneficial effects on BP in animal studies, particularly in spontaneously hypertensive rats. Treatment with 20E has been shown to lower BP via a hypolipidemic effect and prevent the development of dilated cardiac hypertrophy in these models [48]. A recent study investigating the effects of consuming approximately 30 mg/day of 20E extracted from the hard stems of asparagus—similar to the source used in our study—in combination with resistance exercise over a 12-week period in 20 male athletes showed a reduction in plasma cortisone levels [25]. This stress hormone induces vasoconstriction and impairs vascular function; thus, its reduction may enhance the susceptibility of blood vessels to dilation, potentially contributing to improved vascular function [49]. Obesity is usually linked to higher BP, both SBP and DBP. This may cause greater variations in BP readings, which could indicate an unstable cardiovascular system. Notably, when 20E supplementation was combined with HIIT, the vascular benefits were further amplified, suggesting a synergistic effect that may help reduce BP variability.
Data on HR variability, particularly in the frequency domain, e.g., LF power, HF power, or their ratio, show significant improvements in the HIIT and HIIT+AOE groups. Similarly, a previous study examining the effects of whole-body HIIT—consisting of 10 minutes of exercises such as burpees, mountain climbers, jumping jacks, and squats—on HR variability in 21 insufficiently active adults. This study showed significant increases in time-domain HRV parameters, specifically SDNN and RMSSD, while no significant changes were observed in any frequency-domain parameters [50]. Likewise, a previous investigation of 12-week HIIT on autonomic function in 38 young males revealed significant increases in HR variability parameters, specifically in both LF and HF power, indicating improved autonomic regulation of the heart [51]. Notably, changes in HRV following a HIIT program may exhibit either positive or negative effects, depending on physical, physiological, and external factors, such as the baseline physical activity level (sedentary, active, or deconditioned), individual stress response, and intensity and duration of the exercise intervention.
Research regarding the effects of 20E on HR variability remains limited as well, highlighting the need for further studies to confirm existing and novel findings and to establish the optimal dosage and duration of 20E supplementation for improving autonomic function [52]. However, the current study suggests that 20E supplementation may be beneficial to cardiovascular health when combined with HIIT—particularly in improving HR variability, endothelial function, and BP regulation—although our findings do not indicate the direct effects of this supplement alone on cardiovascular outcomes.
4.2. Effects of HIIT Combined with A. officinalis Extract Supplementation on Pulmonary Function Parameters
Participants in the HIIT+AOE group had increased expiratory muscle strength as measured by MEP, leading to improved lower-chest wall compliance and lung function parameters, including FEV1/FVC, FEV1/FEV %predicted, PEF, and %PEF. This allows more lung emptying in individuals with obesity and overweight, who tend to experience restrictive lung issues. Based on a review of the existing literature, this study is likely the first to demonstrate that a combination of HIIT and A. officinalis extract supplementation significantly enhances respiratory muscle strength and pulmonary function. According to a previous study on HIIT, 12 weeks of HIIT (functional bodyweight Tabata/HIIT and cycling/HIIT) decreased waist-to-hip ratio by -0.02 cm and waist circumference by -3.7 cm in obesity and overweight [22,53], which, in turn, might expand lung volume and capacity within the abdominal cavity. This expansion also increases the space between chest ribs, resulting in an extension of the initial length of the expiratory muscles and thus improving the length–tension relationship of the muscle fibers [54].
This study is also the first to investigate the effects of 20E supplementation with HIIT on pulmonary function. Our findings indicate that the consumption of approximately 90 mg/day, or 1.71 mg/kg/day, of 20E with HIIT resulted in enhanced pulmonary function, as indicated by improvements in the FEV1/FVC ratio and percent-predicted FEV1/FVC. Currently, research on the effects of 20E on pulmonary function remains in the development phase in terms of therapeutic applications in humans, particularly among patients with pulmonary arterial hypertension and severe pneumonia. Preliminary evidence suggests that 20E may activate non-peptide receptors and exert anti-inflammatory, anti-thrombotic, and anti-fibrotic effects. These mechanisms are anticipated to improve pulmonary function and potentially enhance survival rates in affected patients [55]. The observed improvements in our study suggest a possible enhancement in airway ventilation, as indicated by increased FEV₁/FEV% and PEF. This enhancement may be attributed to increased respiratory muscle strength, as evidenced by elevated MEP, as well as a reduction in airway constriction. These changes may be associated with reduced systemic inflammation and fibrosis linked to restrictive lung dysfunction in obesity, as indicated by the improved FEV1/FVC ratio. Although the effects of 20E on pulmonary health are still unclear and under investigation, existing findings are promising. Importantly, further research is warranted to elucidate the underlying mechanisms involved.
4.3. Effects of HIIT Combined with A. officinalis Extract Supplementation on Body Composition Parameters
Despite the growing popularity of HIIT for bodyweight and fat reduction, its effectiveness remains debatable. In the present study, a 12-week HIIT intervention did not significantly reduce BM, BMI, skeletal muscle mass, fat-free mass, fat mass, percent body fat, or the waist-to-hip ratio. These findings suggest that HIIT alone, with regard to this study’s regimen, may be insufficient to induce meaningful changes in body composition outcomes. This finding aligns with a previous study in which a 6-week Wingate sprint/HIIT program conducted with ten participants did not alter BM [56]. While many HIIT studies involving athletes and healthy adolescents or adults have demonstrated beneficial effects on BM and fat loss, evidence in populations with non-communicable diseases remains limited [19]. This may be due to the demanding nature of high-intensity protocols, which could pose challenges or risks to individuals with compromised health status.
Supplementation with 20E in overweight individuals has shown potential benefits in reducing BM and improving body composition indices. For instance, a study administering 20E at a dose of 100–200 mg/day (2 × 50 mg) over a three-month period reported 1.3%, 3.2%, and 7.6% reductions in BM, waist circumference, and body fat, respectively [57]. These outcomes differ from our findings, which may be attributable to the low dosage applied (approximately 90–120 mg of 20E/day).
Interestingly, when 20E was combined with HIIT, the waist-to-hip ratio was maintained, despite no significant changes in BM, fat mass, or muscle mass. This suggests a stabilization of body proportions, in contrast to the control group, which demonstrated an approximate 2% increase in the waist-to-hip ratio. Recent studies have highlighted the waist-to-hip ratio and waist circumference as more reliable predictors of cardiopulmonary health risks compared to the traditional measure, BMI. An elevated waist-to-hip ratio has been significantly associated with an increased risk of myocardial infarction (odds ratio of 1.98) [58,59]. Beyond cardiovascular implications, a higher waist-to-hip ratio is inversely associated with lung function metrics such as FVC and FEV1, indicating compromised pulmonary health [60]. These findings emphasize the importance of the waist-to-hip ratio as a critical anthropometric measure in assessing both cardiovascular and pulmonary health risks.
There are some limitations in this study that should be addressed. Firstly, BP variability was assessed using a simple method with very short-term beat-to-beat measurements taken 10 minutes after the participants assumed a supine position, with three readings recorded at 1-minute intervals. In clinical practice, Ambulatory Blood Pressure Monitoring (ABPM) conducted at 15- or 30-minute intervals and Home Blood Pressure Monitoring (HBPM) are considered the gold-standard methods for assessing mid-term BP variability, offering high reliability for capturing day-to-day or week-to-week fluctuations. Therefore, it is recommended that future studies incorporate ABPM or HBPM to provide a more comprehensive assessment of BP variability. Secondly, participants were instructed to maintain their usual physical activity and dietary habits throughout the experimental period; however, complete control over their activity levels and dietary intake was not feasible, as they were ecologically valid. Nevertheless, baseline data indicated no significant differences in overall physical activity and dietary intake before and after the interventions or between groups. However, to minimize potential confounding factors, such as natural physiological fluctuations, learning effects, or other external factors (e.g., emotional arousal), future studies should incorporate a familiarization session prior to the actual measurements. Lastly, this study did not examine molecular and biochemical factors that may influence BP and pulmonary function, such as blood lipid profiles, blood glucose levels, inflammatory mediators, or oxidative stress biomarkers. Therefore, further investigation of these parameters is recommended to provide a more comprehensive understanding of the underlying mechanisms.
5. Conclusions
This study indicated that a 12-week HIIT program combined with A. officinalis extract supplementation improved HR variability indices, potentially lowering cardiovascular disease and atherosclerosis risk via increased endothelial function. It also enhanced expiratory muscle strength, lower-chest wall expansion, and, consequently, pulmonary function. Moreover, it also helped obese and overweight participants maintain body proportions. The clinical implication is that utilizing HIIT in conjunction with supplementation with A. officinalis extract containing 20E at 1.71 ± 0.24 mg/kg/day daily for 12 weeks is safe and could be an option for individuals who are obese or overweight. This combination has the potential to improve cardiovascular and respiratory function and body composition and might serve as a preventive strategy against cardiovascular and respiratory disorders in obese and overweight individuals.
Author Contributions
Conceptualization, P.P. and T.P.; methodology, P.P. and T.P.; software, T.P.; validation, T.P.; formal analysis, T.P.; investigation, T.P.; resources, P.P.; data curation, T.P.; writing—original draft preparation, T.P.; writing—review and editing, P.P.; visualization, T.P.; supervision, P.P.; project administration, P.P.; funding acquisition, P.P. All authors have read and agreed to the published version of the manuscript.
Funding
This research was funded by the National Research Council of Thailand, grant number N41A660293/2566; the Graduate School, grant number 0118/2565; and the Faculty of Allied Health Sciences, grant number AHS08/2565, Burapha University.
Institutional Review Board Statement
This study was conducted in accordance with the Declaration of Helsinki and approved by the Institutional Review Board of Burapha University (ID: G-HS018/2565 and approval date 24 May 2022).
Informed Consent Statement
Informed consent was obtained from all participants involved in the study.
Data Availability Statement
The data are available upon request from the corresponding author.
Acknowledgments
We are extremely grateful to Siriporn Sripinyowanich and Jatuporn Phoemsapthawee for their valuable cooperation and insightful suggestions throughout the study.
Conflicts of Interest
The authors declare no conflicts of interest.
Abbreviations
The following abbreviations are used in this manuscript:
| 20E | 20-Hydroxyecdysone |
| AOE | A. officinalis extract group |
| BMI | Body mass index |
| BP | Blood pressure |
| BPV | Blood pressure variability |
| COM | Combined group |
| CON | Control group |
| CV | Coefficient of variation |
| DBP | Diastolic blood pressure |
| ERV | Expiratory reserve volume |
| ES | Effect size |
| FET | Forced expiratory time |
| FEV1 | Forced expiratory volume in one second |
| FRC | Functional residual capacity |
| FVC | Forced vital capacity |
| HF | High frequency |
| HIIT | High-intensity intermittent training |
| HPLC | High-performance liquid chromatography |
| HR | Heart rate |
| HRV | Heart rate variability |
| ICC | Intra-class correlation coefficient |
| IRV | Inspiratory reserve volume |
| LF | Low frequency |
| MAP | Mean arterial pressure |
| MEP | Maximum expiratory mouth pressure |
| MIP | Maximum inspiratory mouth pressure |
| MVV | Maximal voluntary ventilation |
| PEF | Peak expiratory flow rate |
| PIF | Peak inspiratory flow rate |
| PP | Pulse pressure |
| RMSSD | Root mean square of successive RR interval |
| RPE | Rating of perceived exertion |
| RPP | Rate–pressure product |
| SD | Standard deviation |
| SDNN | Standard deviation of normal beat-to-beat |
| TP | Total power |
| TV | Tidal volume |
| UV | Ultraviolet |
| VC | Vital capacity |
| VLF | Very low frequency |
References
- Collaborators, G.F. Burden of disease scenarios for 204 countries and territories, 2022-2050: a forecasting analysis for the Global Burden of Disease Study 2021. Lancet 2024, 403, 2204–2256. [Google Scholar] [CrossRef]
- Ansari, S.; Haboubi, H.; Haboubi, N. Adult obesity complications: challenges and clinical impact. Ther Adv Endocrinol Metab 2020, 11, 2042018820934955. [Google Scholar] [CrossRef] [PubMed]
- Kaufman, C.L.; Kaiser, D.R.; Steinberger, J.; Kelly, A.S.; Dengel, D.R. Relationships of cardiac autonomic function with metabolic abnormalities in childhood obesity. Obesity (Silver Spring) 2007, 15, 1164–1171. [Google Scholar] [CrossRef]
- Tadic, M.; Cuspidi, C.; Vukomanovic, V.; Kocijancic, V.; Celic, V.; Stanisavljevic, D. The Association between Obesity, Blood Pressure Variability, and Right Ventricular Function and Mechanics in Hypertensive Patients. J Am Soc Echocardiogr 2016, 29, 802–811. [Google Scholar] [CrossRef] [PubMed]
- Yadav, R.L.; Yadav, P.K.; Yadav, L.K.; Agrawal, K.; Sah, S.K.; Islam, M.N. Association between obesity and heart rate variability indices: an intuition toward cardiac autonomic alteration - a risk of CVD. Diabetes Metab Syndr Obes 2017, 10, 57–64. [Google Scholar] [CrossRef]
- Pelosi, P.; Croci, M.; Ravagnan, I.; Tredici, S.; Pedoto, A.; Lissoni, A.; Gattinoni, L. The effects of body mass on lung volumes, respiratory mechanics, and gas exchange during general anesthesia. Anesth Analg 1998, 87, 654–660. [Google Scholar] [CrossRef]
- Hedenstierna, G.; Santesson, J. Breathing mechanics, dead space and gas exchange in the extremely obese, breathing spontaneously and during anaesthesia with intermittent positive pressure ventilation. Acta Anaesthesiol Scand 1976, 20, 248–254. [Google Scholar] [CrossRef]
- Sharp, J.T.; Henry, J.P.; Sweany, S.K.; Meadows, W.R.; Pietras, R.J. THE TOTAL WORK OF BREATHING IN NORMAL AND OBESE MEN. J Clin Invest 1964, 43, 728–739. [Google Scholar] [CrossRef]
- Naimark, A.; Cherniack, R.M. Compliance of the respiratory system and its components in health and obesity. J Appl Physiol 1960, 15, 377–382. [Google Scholar] [CrossRef]
- Schachter, L.M.; Salome, C.M.; Peat, J.K.; Woolcock, A.J. Obesity is a risk for asthma and wheeze but not airway hyperresponsiveness. Thorax 2001, 56, 4–8. [Google Scholar] [CrossRef]
- Jones, R.L.; Nzekwu, M.M. The effects of body mass index on lung volumes. Chest 2006, 130, 827–833. [Google Scholar] [CrossRef] [PubMed]
- Sin, D.D.; Jones, R.L.; Man, S.F. Obesity is a risk factor for dyspnea but not for airflow obstruction. Arch Intern Med 2002, 162, 1477–1481. [Google Scholar] [CrossRef] [PubMed]
- Zerah, F.; Harf, A.; Perlemuter, L.; Lorino, H.; Lorino, A.M.; Atlan, G. Effects of obesity on respiratory resistance. Chest 1993, 103, 1470–1476. [Google Scholar] [CrossRef] [PubMed]
- Lazarus, R.; Sparrow, D.; Weiss, S.T. Effects of obesity and fat distribution on ventilatory function: the normative aging study. Chest 1997, 111, 891–898. [Google Scholar] [CrossRef]
- Biring, M.S.; Lewis, M.I.; Liu, J.T.; Mohsenifar, Z. Pulmonary physiologic changes of morbid obesity. Am J Med Sci 1999, 318, 293–297. [Google Scholar] [CrossRef]
- Bull, F.C.; Al-Ansari, S.S.; Biddle, S.; Borodulin, K.; Buman, M.P.; Cardon, G.; Carty, C.; Chaput, J.P.; Chastin, S.; Chou, R.; et al. World Health Organization 2020 guidelines on physical activity and sedentary behaviour. Br J Sports Med 2020, 54, 1451–1462. [Google Scholar] [CrossRef] [PubMed]
- American College of Sports, M.; Liguori, G.; Feito, Y.; Fountaine, C.; Roy, B.A. ACSM's guidelines for exercise testing and prescription, Eleventh edition ed.; Wolters Kluwer: Philadelphia, 2022. [Google Scholar]
- Tschakert, G.; Hofmann, P. High-Intensity Intermittent Exercise: Methodological and Physiological Aspects. International journal of sports physiology and performance 2013, 8. [Google Scholar] [CrossRef]
- Boutcher, S.H. High-intensity intermittent exercise and fat loss. J Obes 2011, 2011, 868305. [Google Scholar] [CrossRef]
- Tabata, I.; Irisawa, K.; Kouzaki, M.; Nishimura, K.; Ogita, F.; Miyachi, M. Metabolic profile of high intensity intermittent exercises. Med Sci Sports Exerc 1997, 29, 390–395. [Google Scholar] [CrossRef]
- Tabata, I. Tabata training: one of the most energetically effective high-intensity intermittent training methods. J Physiol Sci 2019, 69, 559–572. [Google Scholar] [CrossRef]
- Padkao, T.; Prasertsri, P. The Impact of Modified Tabata Training on Segmental Fat Accumulation, Muscle Mass, Muscle Thickness, and Physical and Cardiorespiratory Fitness in Overweight and Obese Participants: A Randomized Control Trial. Sports 2025, 13, 99. [Google Scholar] [CrossRef] [PubMed]
- Lafont, R.; Balducci, C.; Dinan, L. Ecdysteroids. Encyclopedia 2021, 1, 1267–1302. [Google Scholar] [CrossRef]
- Dinan, L.; Dioh, W.; Veillet, S.; Lafont, R. 20-Hydroxyecdysone, from Plant Extracts to Clinical Use: Therapeutic Potential for the Treatment of Neuromuscular, Cardio-Metabolic and Respiratory Diseases. Biomedicines 2021, 9, 492. [Google Scholar] [CrossRef]
- Denben, B.; Sripinyowanich, S.; Ruangthai, R.; Phoemsapthawee, J. Beneficial Effects of Asparagus officinalis Extract Supplementation on Muscle Mass and Strength following Resistance Training and Detraining in Healthy Males. Sports 2023, 11, 175. [Google Scholar] [CrossRef] [PubMed]
- Wuttke, W.; Seidlova-Wuttke, D. Beta-ecdysone (Ecd) prevents visceral, bone marrow and joint fat accumulation and has positive effects on serum lipids, bone and joint cartilage. Planta Medica 2012, 78, PD68. [Google Scholar] [CrossRef]
- World Health Organization. Regional Office for the Western, P. The Asia-Pacific perspective : redefining obesity and its treatment; Sydney : Health Communications Australia: 2000.
- Faul, F.; Erdfelder, E.; Lang, A.-G.; Buchner, A. G*Power 3: A flexible statistical power analysis program for the social, behavioral, and biomedical sciences. Behavior Research Methods 2007, 39, 175–191. [Google Scholar] [CrossRef]
- Borg, G. Perceived exertion as an indicator of somatic stress. Journal of Rehabilitation Medicine 1970, 2, 92–98. [Google Scholar] [CrossRef]
- Sripinyowanich, S.; Petchsri, S.; Tongyoo, P.; Lee, T.K.; Lee, S.; Cho, W.K. Comparative Transcriptomic Analysis of Genes in the 20-Hydroxyecdysone Biosynthesis in the Fern Microsorum scolopendria towards Challenges with Foliar Application of Chitosan. Int J Mol Sci 2023, 24. [Google Scholar] [CrossRef] [PubMed]
- Dinan, L.; Dioh, W.; Veillet, S.; Lafont, R. 20-Hydroxyecdysone, from Plant Extracts to Clinical Use: Therapeutic Potential for the Treatment of Neuromuscular, Cardio-Metabolic and Respiratory Diseases. Biomedicines 2021, 9. [Google Scholar] [CrossRef]
- Vierra, J.; Boonla, O.; Prasertsri, P. Effects of sleep deprivation and 4-7-8 breathing control on heart rate variability, blood pressure, blood glucose, and endothelial function in healthy young adults. Physiol Rep 2022, 10, e15389. [Google Scholar] [CrossRef]
- Shaffer, F.; Ginsberg, J.P. An Overview of Heart Rate Variability Metrics and Norms. Front Public Health 2017, 5, 258. [Google Scholar] [CrossRef] [PubMed]
- Lind, L.; Hall, J.; Larsson, A.; Annuk, M.; Fellstrom, B.; Lithell, H. Evaluation of endothelium-dependent vasodilation in the human peripheral circulation. Clin Physiol 2000, 20, 440–448. [Google Scholar] [CrossRef]
- Graham, B.L.; Steenbruggen, I.; Miller, M.R.; Barjaktarevic, I.Z.; Cooper, B.G.; Hall, G.L.; Hallstrand, T.S.; Kaminsky, D.A.; McCarthy, K.; McCormack, M.C.; et al. Standardization of Spirometry 2019 Update. An Official American Thoracic Society and European Respiratory Society Technical Statement. Am J Respir Crit Care Med 2019, 200, e70–e88. [Google Scholar] [CrossRef]
- ATS/ERS Statement on respiratory muscle testing. Am J Respir Crit Care Med 2002, 166, 518–624. [CrossRef]
- Debouche, S.; Pitance, L.; Robert, A.; Liistro, G.; Reychler, G. Reliability and Reproducibility of Chest Wall Expansion Measurement in Young Healthy Adults. J Manipulative Physiol Ther 2016, 39, 443–449. [Google Scholar] [CrossRef] [PubMed]
- Koo, T.K.; Li, M.Y. A Guideline of Selecting and Reporting Intraclass Correlation Coefficients for Reliability Research. J Chiropr Med 2016, 15, 155–163. [Google Scholar] [CrossRef] [PubMed]
- Jalayondeja, C.; Jalayondeja, W.; Vachalathiti, R.; Bovonsunthonchai, S.; Sakulsriprasert, P.; Kaewkhuntee, W.; Bunprajun, T.; Upiriyasakul, R. Cross-Cultural Adaptation of the Compendium of Physical Activity: Thai Translation and Content Validity. J Med Assoc Thai 2015, 98 Suppl 5, S53–59. [Google Scholar]
- Baecke, J.A.; Burema, J.; Frijters, J.E. A short questionnaire for the measurement of habitual physical activity in epidemiological studies. Am J Clin Nutr 1982, 36, 936–942. [Google Scholar] [CrossRef] [PubMed]
- Cocks, M.; Shaw, C.S.; Shepherd, S.O.; Fisher, J.P.; Ranasinghe, A.; Barker, T.A.; Wagenmakers, A.J. Sprint interval and moderate-intensity continuous training have equal benefits on aerobic capacity, insulin sensitivity, muscle capillarisation and endothelial eNOS/NAD(P)Hoxidase protein ratio in obese men. J Physiol 2016, 594, 2307–2321. [Google Scholar] [CrossRef]
- Hasegawa, N.; Fujie, S.; Horii, N.; Miyamoto-Mikami, E.; Tsuji, K.; Uchida, M.; Hamaoka, T.; Tabata, I.; Iemitsu, M. Effects of Different Exercise Modes on Arterial Stiffness and Nitric Oxide Synthesis. Med Sci Sports Exerc 2018, 50, 1177–1185. [Google Scholar] [CrossRef]
- Zador, E. Molecular Targets of 20-Hydroxyecdysone in Mammals, Mechanism of Action: Is It a Calorie Restriction Mimetic and Anti-Aging Compound? Cells 2025, 14, 431. [Google Scholar] [CrossRef] [PubMed]
- Orie, N.N.; Raees, A.; Aljaber, M.Y.; Mohamed-Ali, N.; Bensmail, H.; Hamza, M.M.; Al-Ansari, N.; Beotra, A.; Mohamed-Ali, V.; Almaadheed, M. 20-hydroxyecdysone dilates muscle arterioles in a nitric oxide-dependent, estrogen ER-β receptor-independent manner. Phytomedicine Plus 2021, 1, 100078. [Google Scholar] [CrossRef]
- Turnbull, F. Effects of different blood-pressure-lowering regimens on major cardiovascular events: results of prospectively-designed overviews of randomised trials. Lancet 2003, 362, 1527–1535. [Google Scholar] [CrossRef]
- Collaboration, T.B.P.L.T.T. Pharmacological blood pressure lowering for primary and secondary prevention of cardiovascular disease across different levels of blood pressure: an individual participant-level data meta-analysis. Lancet 2021, 397, 1625–1636. [Google Scholar] [CrossRef]
- Lu, Y.; Wiltshire, H.D.; Baker, J.S.; Wang, Q.; Ying, S. The effect of Tabata-style functional high-intensity interval training on cardiometabolic health and physical activity in female university students. Front Physiol 2023, 14, 1095315. [Google Scholar] [CrossRef]
- Buniam, J.; Chukijrungroat, N.; Rattanavichit, Y.; Surapongchai, J.; Weerachayaphorn, J.; Bupha-Intr, T.; Saengsirisuwan, V. 20-Hydroxyecdysone ameliorates metabolic and cardiovascular dysfunction in high-fat-high-fructose-fed ovariectomized rats. BMC Complement Med Ther 2020, 20, 140. [Google Scholar] [CrossRef]
- Tsai, S.Y.; Hsu, J.Y.; Lin, C.H.; Kuo, Y.C.; Chen, C.H.; Chen, H.Y.; Liu, S.J.; Chien, K.L. Association of stress hormones and the risk of cardiovascular diseases systematic review and meta-analysis. Int J Cardiol Cardiovasc Risk Prev 2024, 23, 200305. [Google Scholar] [CrossRef]
- Songsorn, P.; Somnarin, K.; Jaitan, S.; Kupradit, A. The effect of whole-body high-intensity interval training on heart rate variability in insufficiently active adults. J Exerc Sci Fit 2022, 20, 48–53. [Google Scholar] [CrossRef]
- Heydari, M.; Boutcher, Y.N.; Boutcher, S.H. High-intensity intermittent exercise and cardiovascular and autonomic function. Clinical Autonomic Research 2013, 23, 57–65. [Google Scholar] [CrossRef]
- Phungphong, S.; Kijtawornrat, A.; Chaiduang, S.; Saengsirisuwan, V.; Bupha-Intr, T. 20-Hydroxyecdysone attenuates cardiac remodeling in spontaneously hypertensive rats. Steroids 2017, 126, 79–84. [Google Scholar] [CrossRef]
- Heydari, M.; Freund, J.; Boutcher, S.H. The effect of high-intensity intermittent exercise on body composition of overweight young males. J Obes 2012, 2012, 480467. [Google Scholar] [CrossRef]
- Sieck, G.C.; Ferreira, L.F.; Reid, M.B.; Mantilla, C.B. Mechanical properties of respiratory muscles. Compr Physiol 2013, 3, 1553–1567. [Google Scholar] [CrossRef]
- Dioh, W.; Chabane, M.; Tourette, C.; Azbekyan, A.; Morelot-Panzini, C.; Hajjar, L.A.; Lins, M.; Nair, G.B.; Whitehouse, T.; Mariani, J.; et al. Testing the efficacy and safety of BIO101, for the prevention of respiratory deterioration, in patients with COVID-19 pneumonia (COVA study): a structured summary of a study protocol for a randomised controlled trial. Trials 2021, 22, 42. [Google Scholar] [CrossRef] [PubMed]
- Burgomaster, K.A.; Howarth, K.R.; Phillips, S.M.; Rakobowchuk, M.; Macdonald, M.J.; McGee, S.L.; Gibala, M.J. Similar metabolic adaptations during exercise after low volume sprint interval and traditional endurance training in humans. J Physiol 2008, 586, 151–160. [Google Scholar] [CrossRef] [PubMed]
- Seidlova-Wuttke, D.; Wuttke, W. In a placebo-controlled study ß-Ecdysone (ECD) prevented the development of the metabolic syndrome. Planta Medica 2012, 78, CL37. [Google Scholar] [CrossRef]
- Zhang, X.; Yang, L.; Xiao, C.; Li, J.; Hu, T.; Li, L. Association between waist-to-hip ratio and risk of myocardial infarction: a systematic evaluation and meta-analysis. Front Cardiovasc Med 2024, 11, 1438817. [Google Scholar] [CrossRef] [PubMed]
- Robledo-Millan, C.R.; Diaz-Dominguez, M.R.; Castaneda-Ramirez, A.E.; Quinones-Lara, E.; Valencia-Marin, S.; Suarez-Garcia, R.X.; Lopez-Desiderio, N.G.; Ramos-Cortes, C.A.; Gaytan Gomez, A.M.; Bello-Lopez, J.M.; et al. A Novel Metabolic Risk Classification System Incorporating Body Fat, Waist Circumference, and Muscle Strength. J Funct Morphol Kinesiol 2025, 10, 72. [Google Scholar] [CrossRef]
- Liu, J.; Xu, H.; Cupples, L.A.; GT, O.C.; Liu, C.T. The impact of obesity on lung function measurements and respiratory disease: A Mendelian randomization study. Ann Hum Genet 2023, 87, 174–183. [Google Scholar] [CrossRef]
Figure 1.
CONSORT flow diagram.
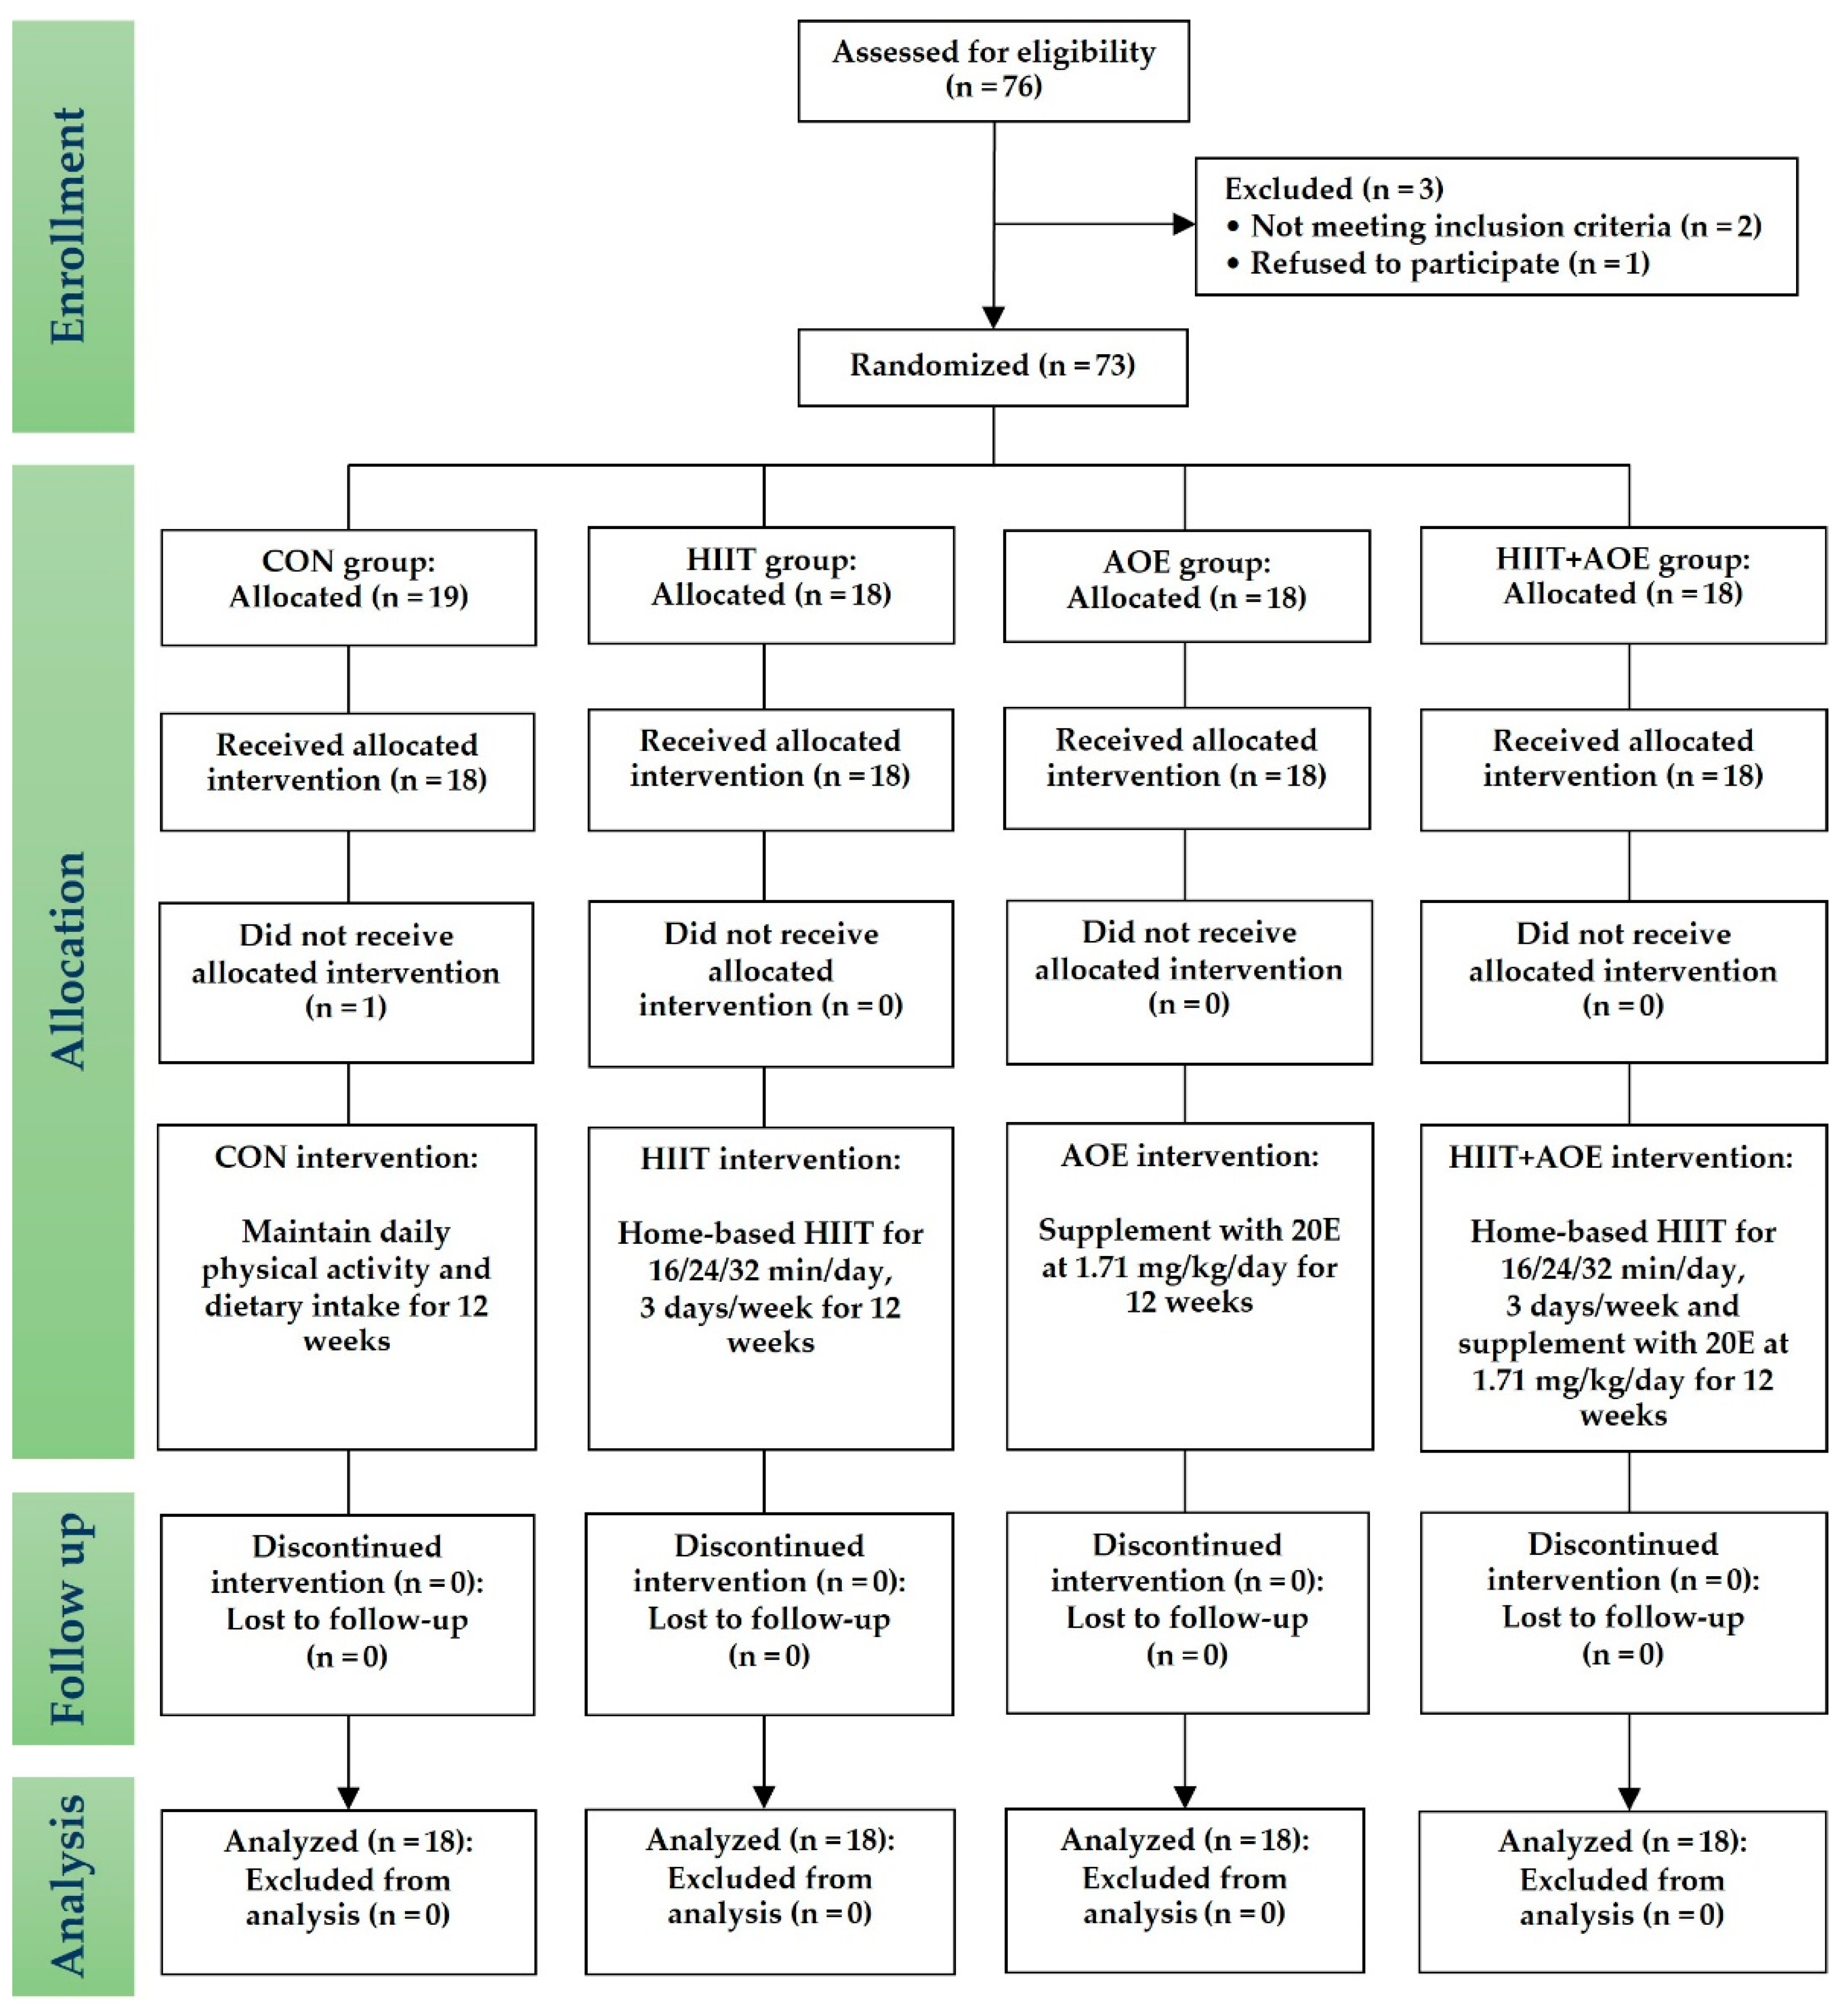
Figure 2.
Experimental design for this study. Abbreviations: CON, control group; HIIT, HIIT group; AOE, A. officinalis extract group; HIIT+AOE, HIIT combined with A. officinalis extract group.
Figure 2.
Experimental design for this study. Abbreviations: CON, control group; HIIT, HIIT group; AOE, A. officinalis extract group; HIIT+AOE, HIIT combined with A. officinalis extract group.
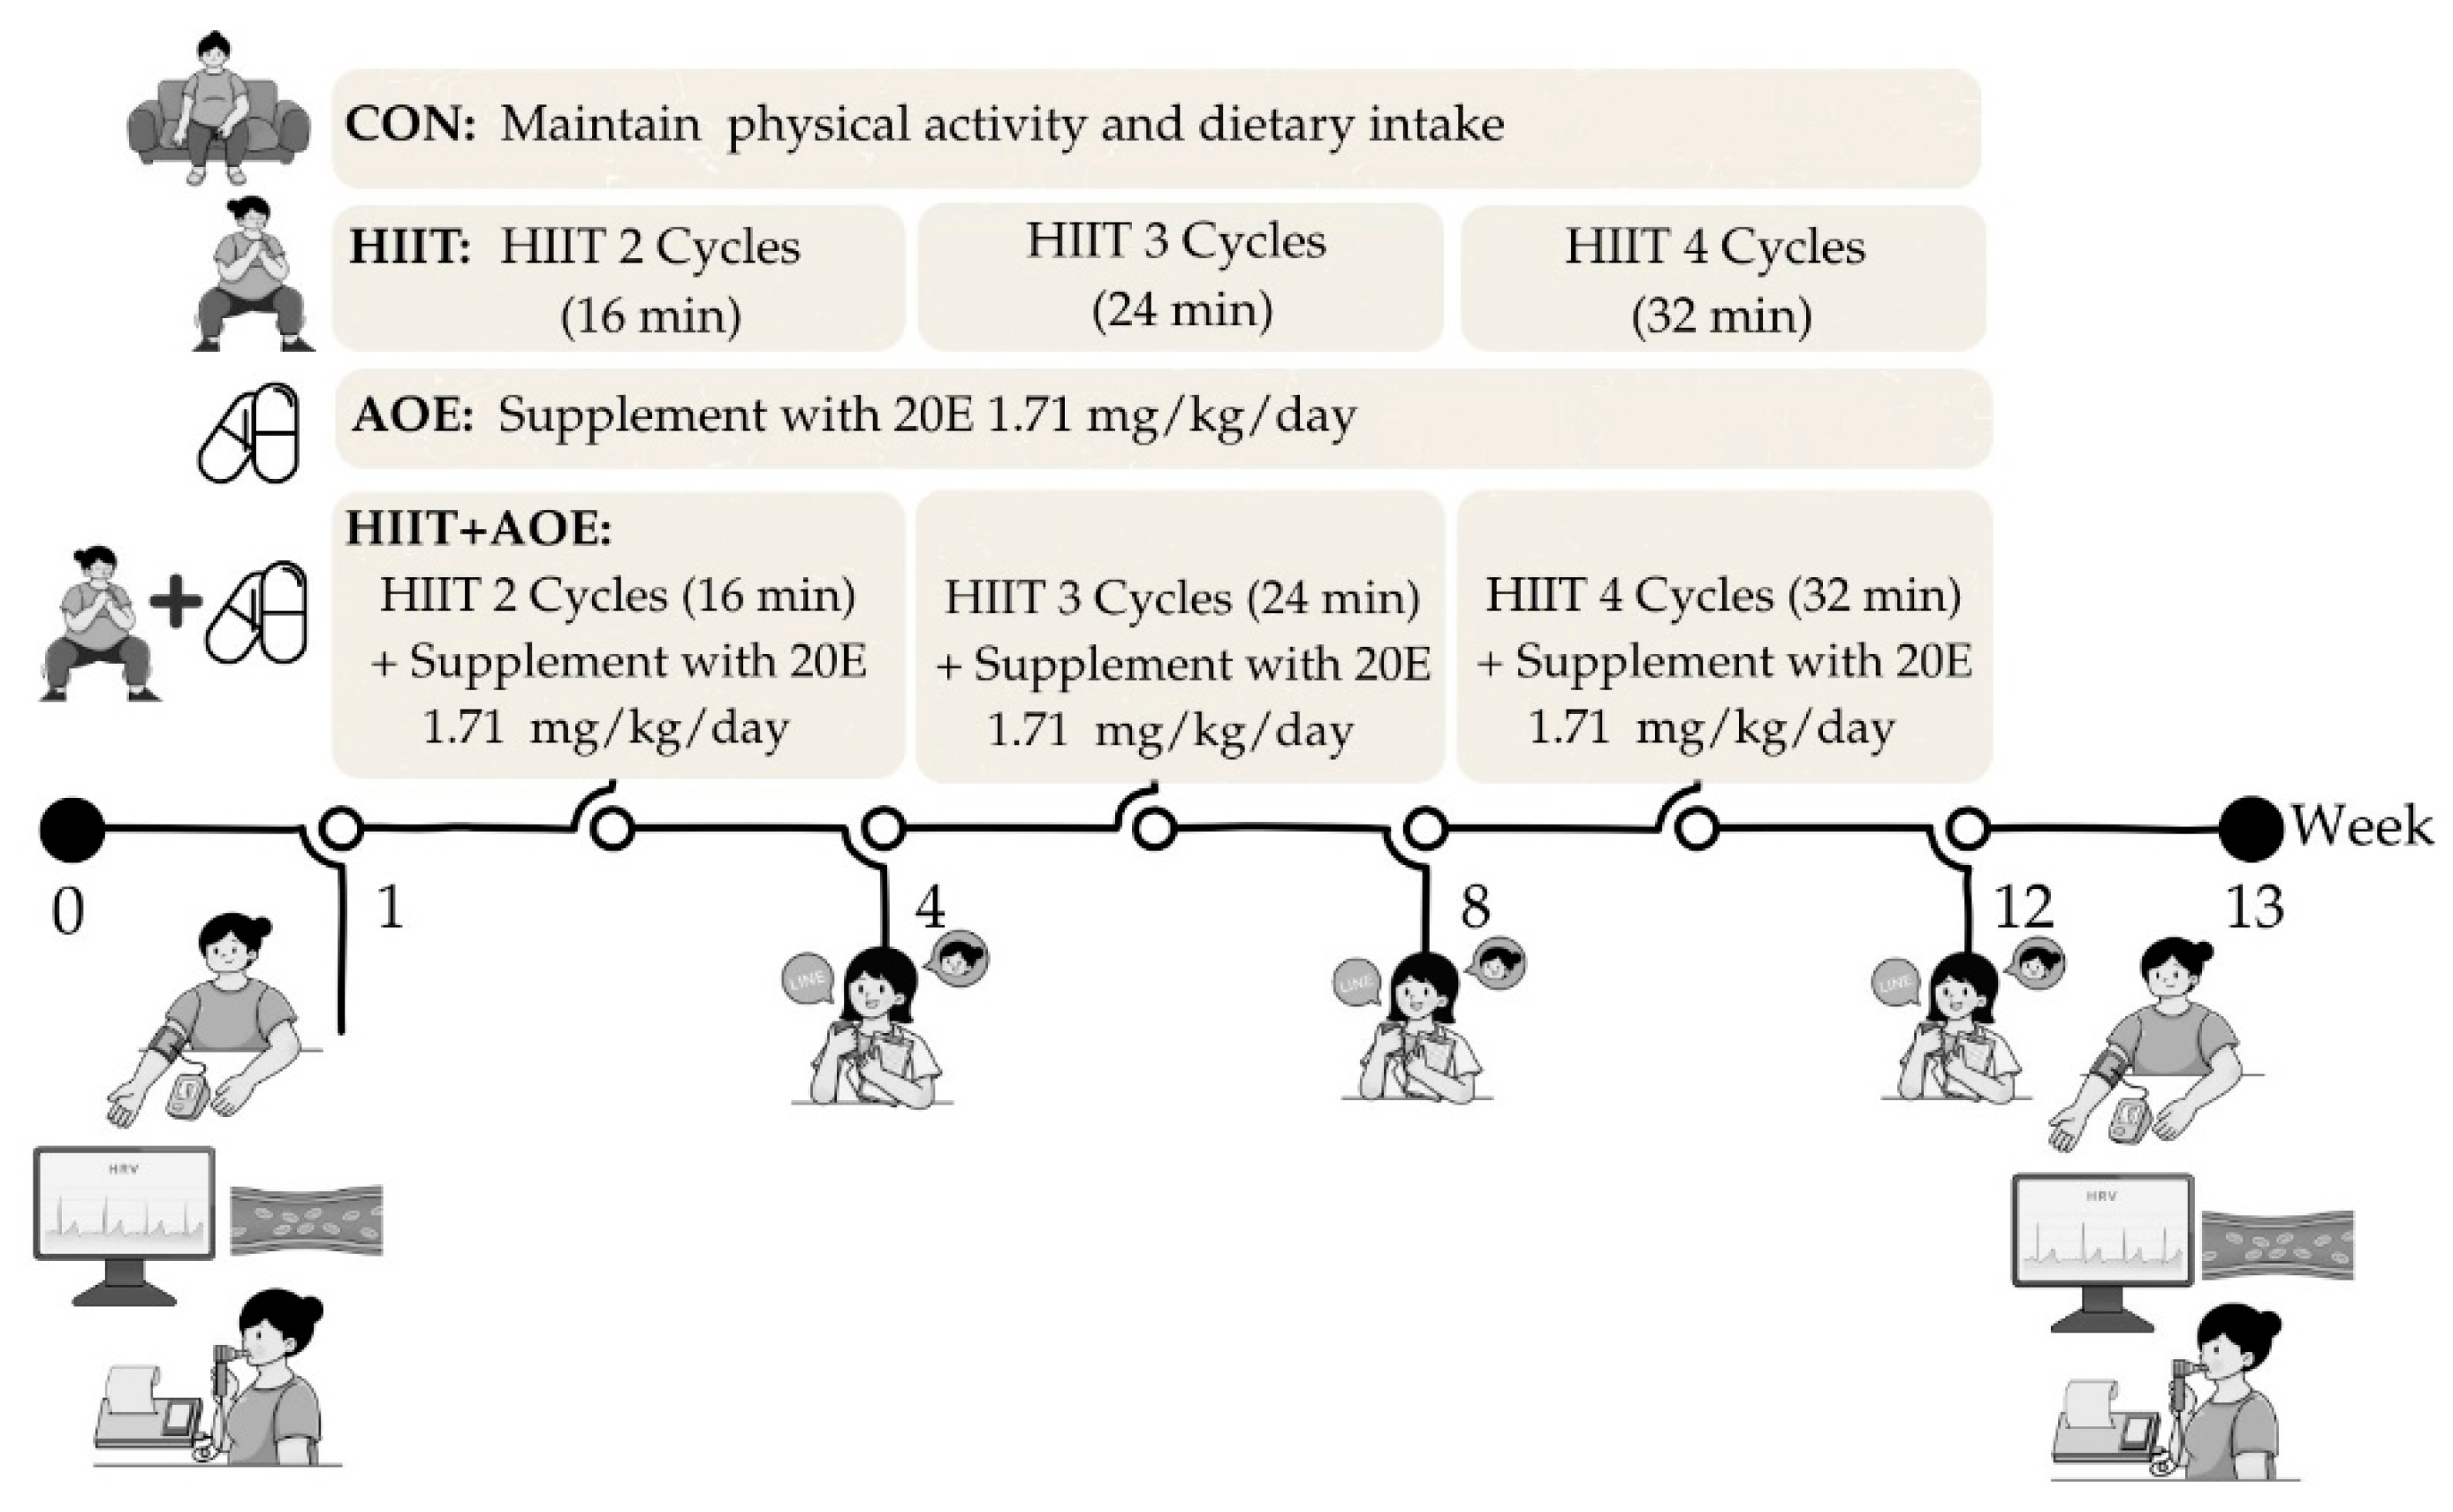
Figure 3.
Blood flow at rest, during brachial artery occlusion, and after occlusion (A), ratio of peak blood flow after occlusion to resting blood flow (ratio of peak/baseline) (B), and recovery time after occlusion (C) in participants in control group (CON), HIIT group (HIIT), A. officinalis extract group (AOE), and HIIT combined with A. officinalis extract group (HIIT+AOE) before and after 12-week intervention. *, p<0.05 vs. before intervention; **, p<0.05 vs. CON group; #, p<0.05 vs. AOE group; ##, p<0.05 vs. HIIT+AOE group.
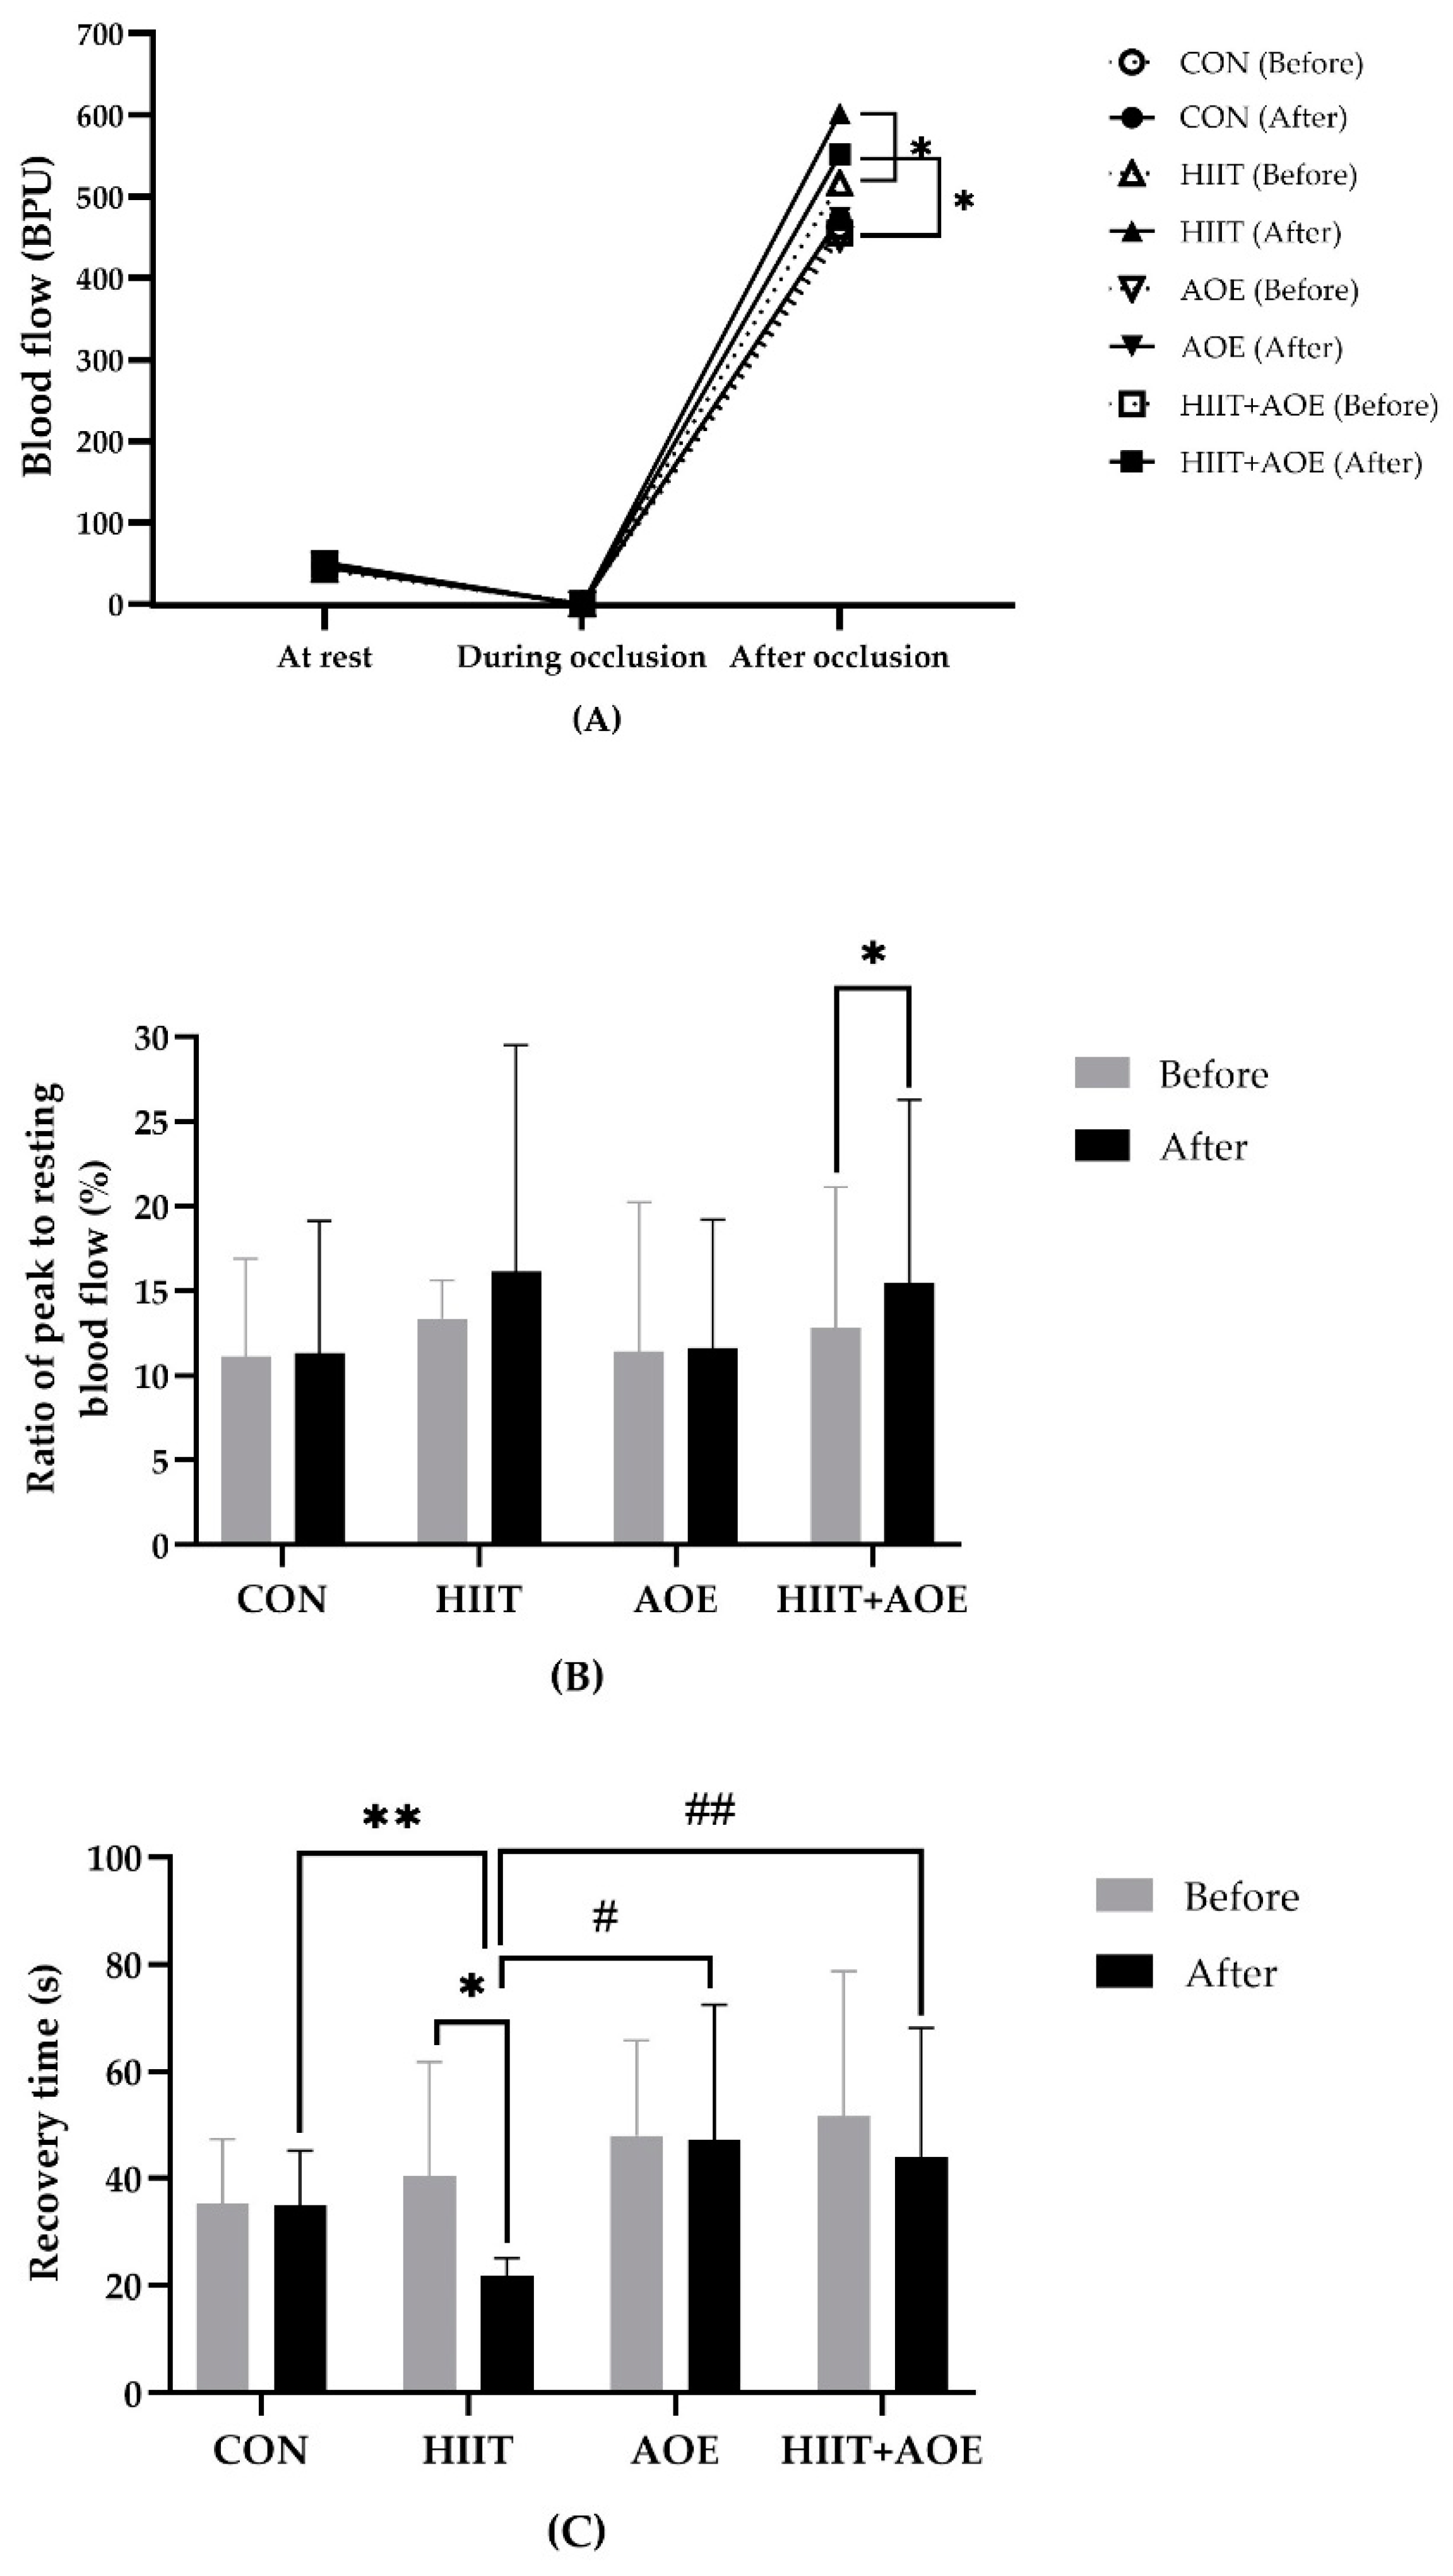
Figure 4.
Very short-term blood pressure variability represented by the systolic blood pressure coefficient of variation (SBP CV) (A) and the diastolic blood pressure coefficient of variation (DBP CV) (B) in participants in the control group (CON), HIIT group (HIIT), A. officinalis extract group (AOE), and HIIT combined with A. officinalis extract group (HIIT+AOE) before and after the 12-week intervention. *, p<0.05 vs. before intervention.
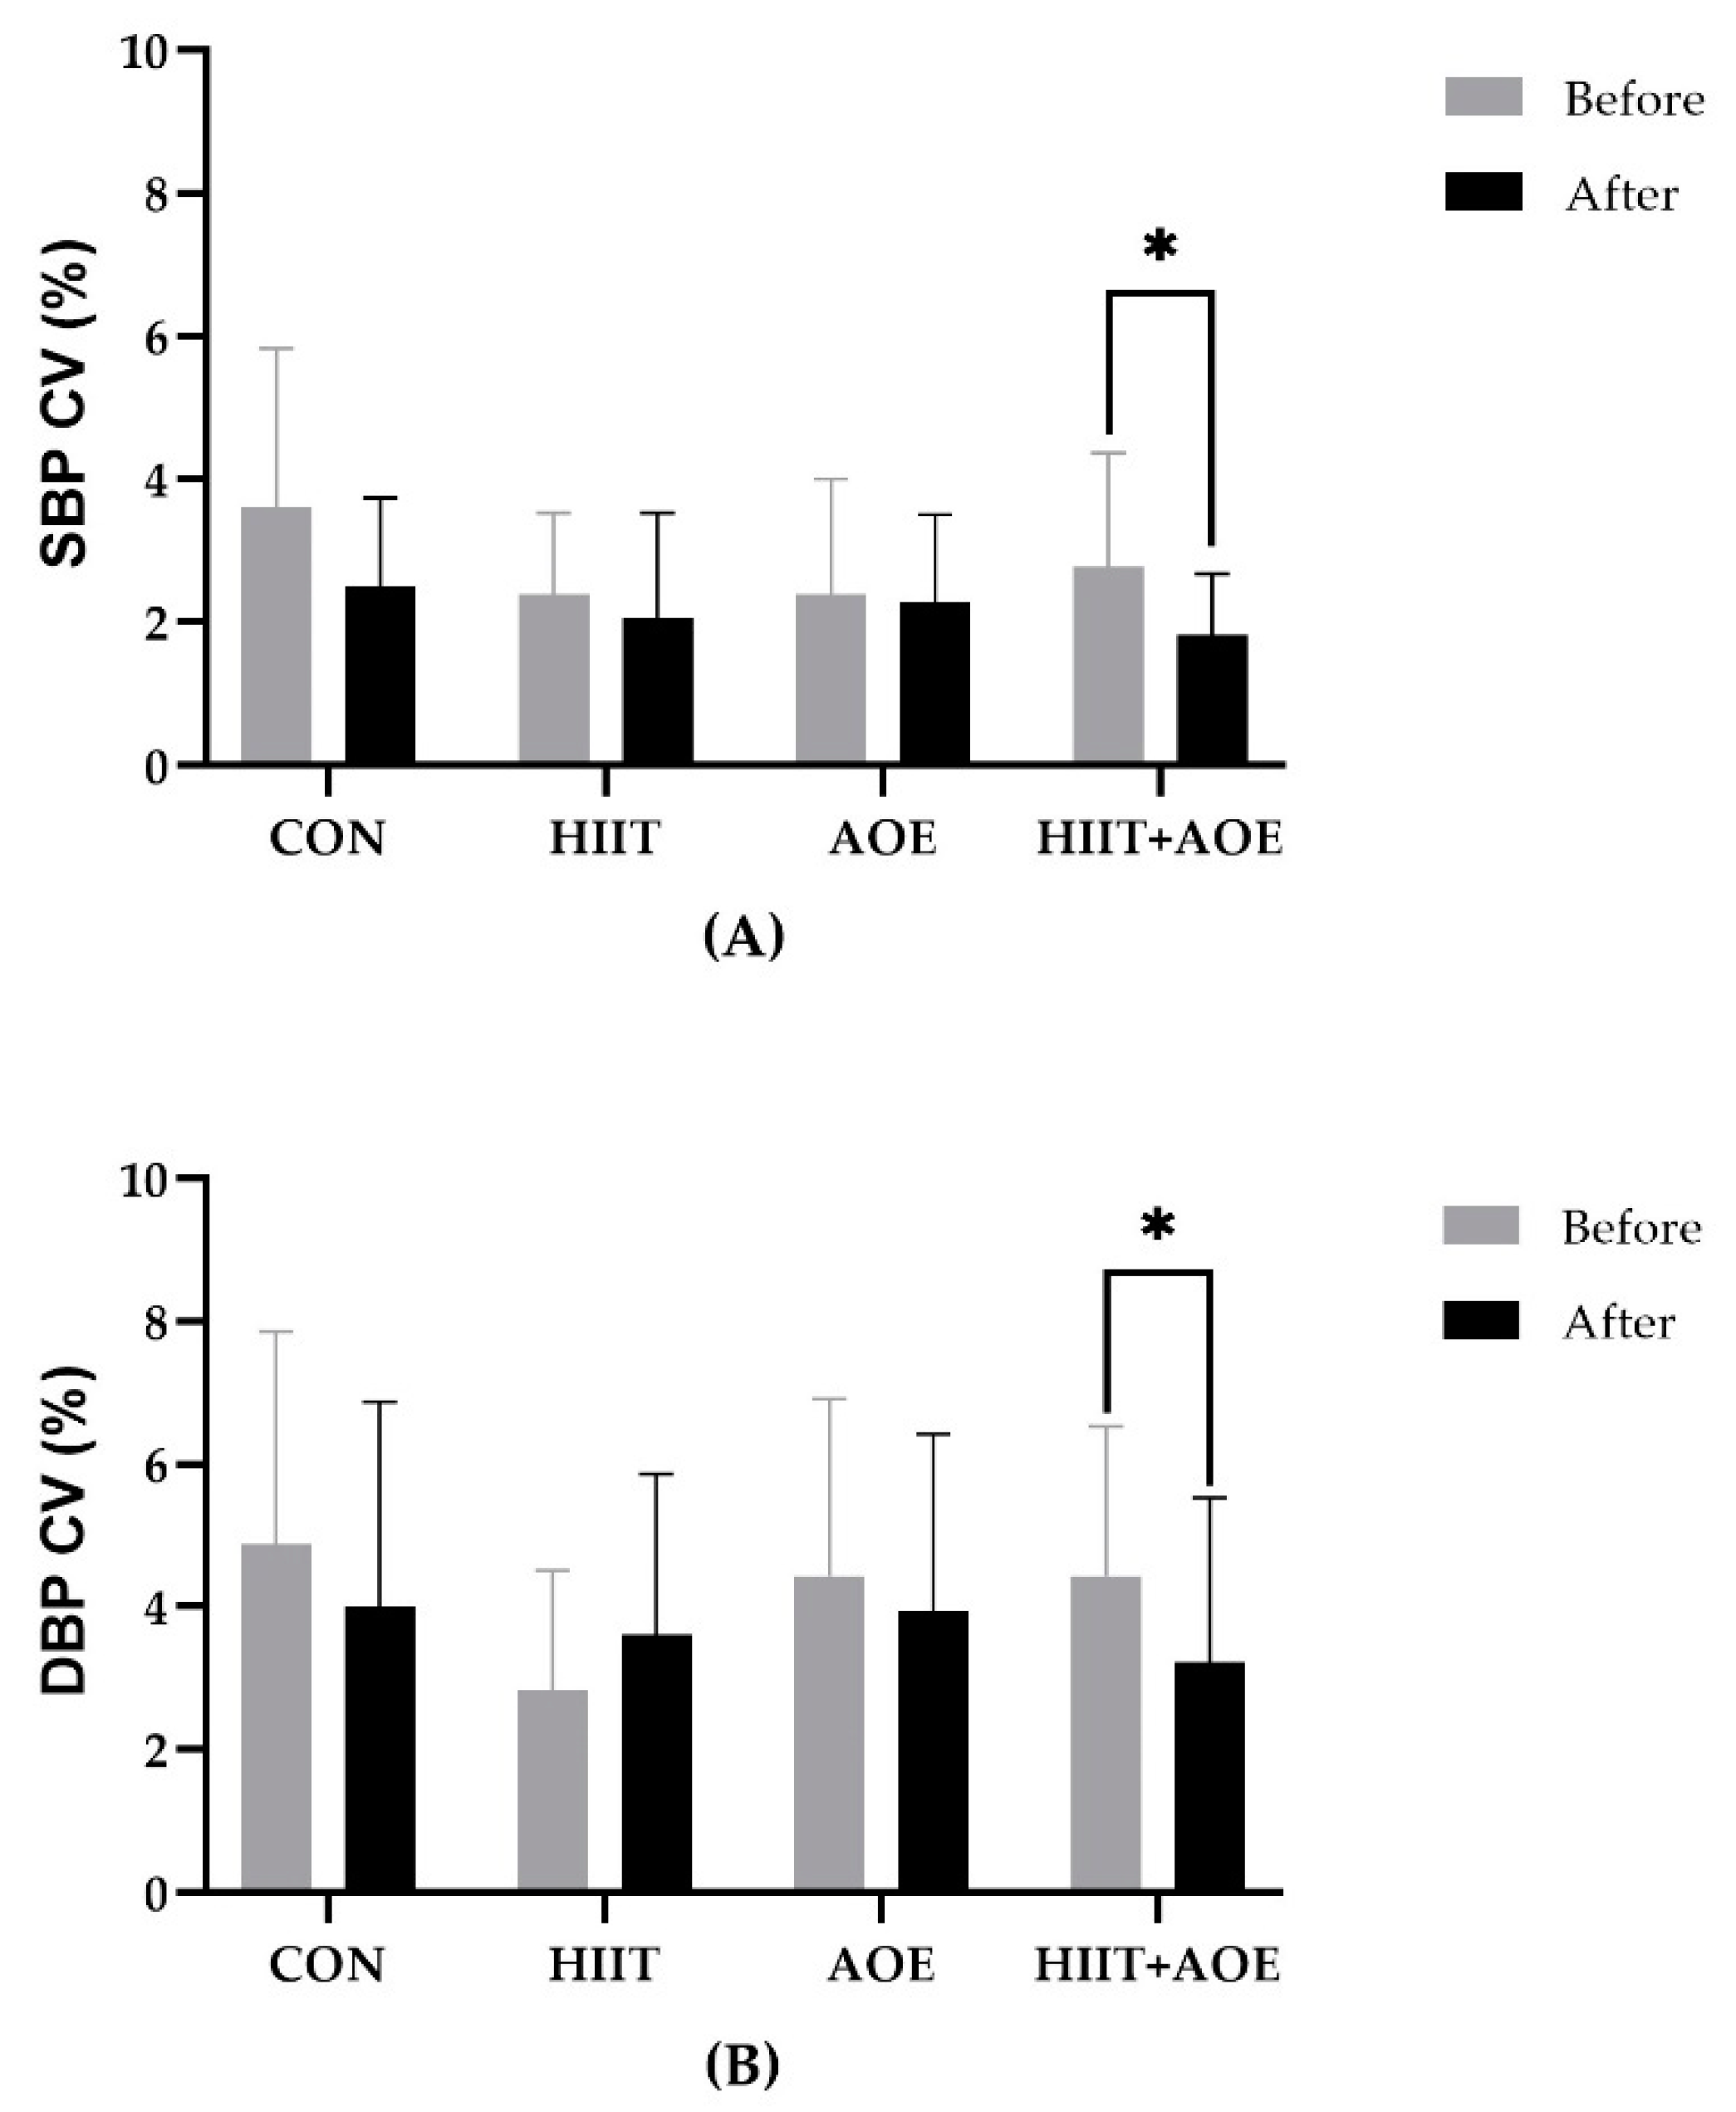
Figure 5.
Maximal inspiratory pressure (MIP) (A) and maximal expiratory pressure (MEP) (B) in participants in control group (CON) (a), HIIT group (HIIT) (b), A. officinalis extract group (AOE) (c), and HIIT combined with A. officinalis extract group (HIIT+AOE) (d) before and after 12-week intervention. *, p<0.05 vs. before intervention; **, p<0.05 vs. CON group.
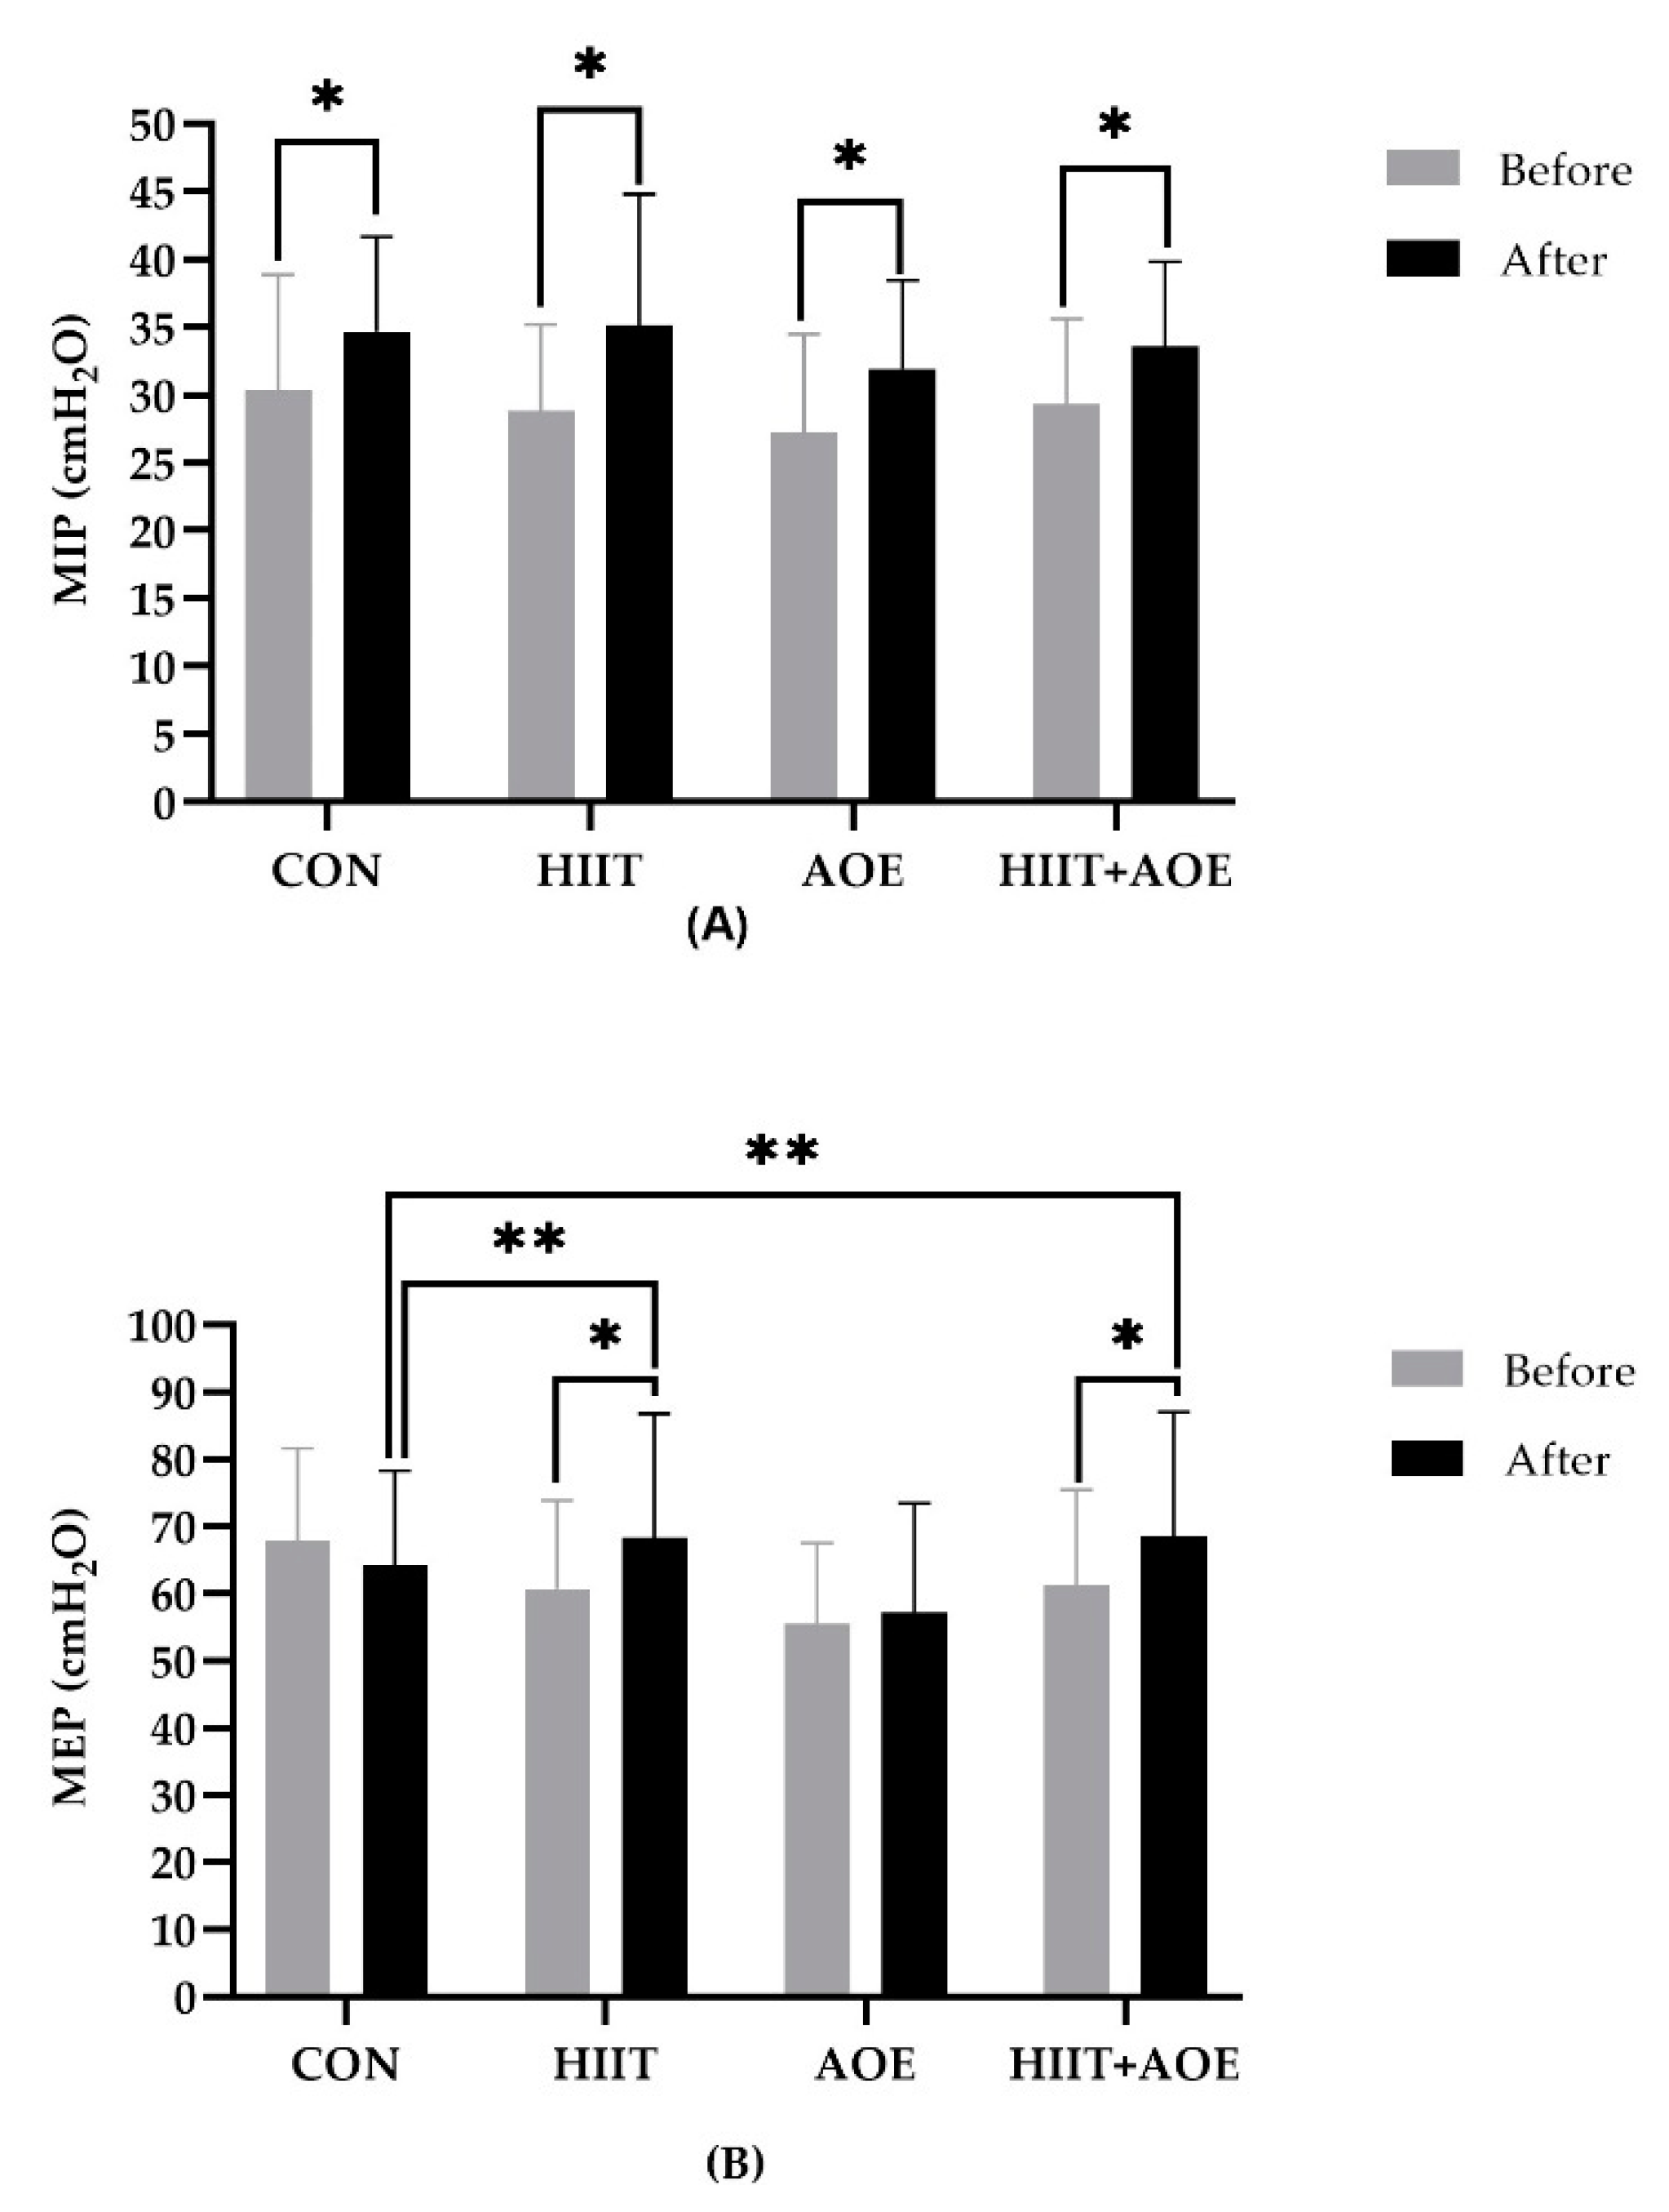

Table 1.
Baseline physical characteristics of participants.
| CON group | HIIT group | AOE group | HIIT+AOE group | |
|---|---|---|---|---|
| Number | 18 | 18 | 18 | 18 |
| Sex (n, male–female) | 5:13 | 5:13 | 2:16 | 2:16 |
| Age (years) | 21.61±2.06 | 20.72±1.32 | 20.22±1.93 | 20.06±2.01 |
| WHO BMI classification (n, obese–overweight) | 16:2 | 13:5 | 13:5 | 13:5 |
| Physical activity level | ||||
| Sedentary (n, %) | 3 (17%) | 3 (17%) | 3 (17%) | 1 (6%) |
| Active (n, %) | 11 (61%) | 12 (66%) | 9 (55%) | 14 (78%) |
| Athletic (n, %) | 4 (22%) | 3 (17%) | 6 (33%) | 3 (17%) |
| Physical activity score | ||||
| Before | 7.01±1.07 | 7.04±0.99 | 7.46±1.19 | 6.86±0.85 |
| After | 6.96±0.79 | 7.31±1.22 | 7.27±0.99 | 7.37±1.20 |
Data are presented as the number, percentage, ratio, and mean ± SD. BMI, body mass index; WHO, World Health Organization.
Table 2.
Heart rate and its variability in participants before and after a 12-week intervention.
| CON group (n=18) | HIIT group (n=18) | AOE group (n=18) | HIIT+AOE group (n=18) | |||||
|---|---|---|---|---|---|---|---|---|
| Before | After | Before | After | Before | After | Before | After | |
| HR (beats/min) | 76.53±10.56 | 73.55±11.04 | 77.95±10.82 | 76.04±10.03 | 75.03±15.69 | 78.07±9.94 | 74.09±9.98 | 72.00±8.25 |
| NN interval (ms) | 795.97±93.24 | 831.07±110.27 | 783.90±110.24 | 803.33±116.17 | 830.61±161.17 | 781.56±110.01 | 823.12±106.74 | 844.26±102.25 |
| SDNN (ms) | 56.42±23.76 | 57.83±21.09 | 48.79±25.81 | 52.67±20.47 | 62.02±35.66 | 66.09±45.50 | 62.77±26.12 | 64.09±26.12 |
| RMSSD (ms) | 48.36±32.78 | 48.86±22.86 | 39.32±29.86 | 42.11±25.69 | 64.15±57.77 | 60.56±65.05 | 56.22±34.57 | 57.99±35.70 |
| Total power (ms2) | 3536.15±2982.59 | 3274.70±2221.98 | 2965.62±3132.98 | 2987.58±2328.17 | 4895.11±3803.14 | 6562.20±4461.31 | 4397.41±3847.59 | 4616.22±4457.35 |
| VLF power (ms2) | 1377.50±895.81 | 1564.83±1024.58 | 1139.12±1542.15 | 1182.67±899.51 | 1366.86±1100.79 | 2437.27±2623.72 | 1678.00±1474.66 | 1929.49±1743.83 |
| LF power (ms2) | 799.42±842.98 | 924.37±448.48 | 715.01±542.55 | 652.06±462.84 | 953.64±839.18 | 922.38±3586.96 | 1170.22±1492.73 | 963.91±973.55 |
| LF power (nu) | 44.82±18.09 | 49.09±19.98 | 53.14±13.72 | 40.80±16.33* | 44.04±21.70 | 40.23±23.03 | 40.53±16.38 | 33.99±11.74* |
| HF power (ms2) | 1044.01±1429.90 | 609.39±478.49 | 1035.46±1690.28 | 1168.29±1165.66 | 2293.36±3511.80 | 2467.31±4393.79 | 1226.39±985.26 | 1396.06±1532.63 |
| HF power (nu) | 40.89±17.65 | 39.06±15.97 | 43.59±17.03 | 49.54±19.45 | 48.00±21.62 | 50.75±21.47 | 50.18±15.37 | 55.47±11.10** |
| LF/HF ratio | 1.65±1.90 | 1.66±1.31 | 1.58±1.14 | 1.06±0.81* | 1.63±2.11 | 1.30±1.39 | 1.00±0.78 | 0.67±0.36* ** |
Group comparisons were conducted using one-way ANOVA, followed by Bonferroni correction. Intra-group comparisons were performed using the Wilcoxon Signed-Rank test. HR, heart rate; NN, normal-to-normal beat; SDNN, standard deviation of normal beat-to-normal beat interval; RMSSD, root mean square of successive R-R interval difference; VLF, very low frequency; LF, low frequency; HF, high frequency; nu, normalized units. *, p<0.05 vs. before intervention; **, p<0.05 vs. CON group.
Table 3.
Blood pressure variables of participants before and after the 12-week intervention.
| CON group (n=18) | HIIT group (n=18) | AOE group (n=18) | HIIT+AOE group (n=18) | |||||
|---|---|---|---|---|---|---|---|---|
| Before | After | Before | After | Before | After | Before | After | |
| SBP (mmHg) | 118.64±16.15 | 112.42±12.28 | 118.31±11.77 | 114.12±12.27* | 112.33±13.24 | 112.46±12.56 | 110.70±8.08 | 111.01±9.17 |
| DBP (mmHg) | 74.40±12.53 | 70.64±8,14 | 73.94±8.54 | 70.57±8.72* | 70.81±11.46 | 71.72±10.35 | 69.77±7.16 | 69.24±6.58 |
| MAP (mmHg) | 89.15±13.03 | 84.57±8.74 | 88.73±8.99 | 85.09±9.05* | 84.65±11.34 | 85.30±10.57 | 83.42±7.16 | 83.16±7.10 |
| PP (mmHg) | 44.24±9.91 | 41.77±9.00 | 44.37±7.89 | 43.55±9.25 | 41.51±8.85 | 40.74±7.44 | 40.92±4.61 | 41.77±5.41 |
| RPP (mmHg/min) | 9156.46±1604.82 | 8170.73±1372.36 | 9147.75±1704.77 | 8374.79±1358.85* | 8433.38±2621.42 | 8043.40±1408.16 | 8647.23±1093.37 | 8179.88±1589.57 |
Group comparisons were conducted using one-way ANOVA, followed by Bonferroni correction. Intra-group comparisons were performed using paired t-test. SBP, systolic blood pressure; DBP, diastolic blood pressure; MAP, mean arterial pressure; PP, pulse pressure; RPP, rate–pressure product. *, p<0.05 vs. before intervention.
Table 4.
Pulmonary function of participants before and after 12-week intervention.
| CON group (n=18) | HIIT group (n=18) | AOE group (n=18) | HIIT+AOE group (n=18) | ||||||
| Before | After | Before | After | Before | After | Before | After | ||
| Forced expiratory volume in one second (FEV1) | |||||||||
| FEV1 (L) | 2.89±0.52 | 2.87±0.50 | 3.02±0.87 | 3.06±0.85 | 2.92±0.59 | 3.00±0.52 | 2.88±0.54 | 2.94±0.50 | |
| FEV1 (%predicted) | 95.72±9.81 | 95.44±10.01 | 98.88±11.58 | 100.44±11.50 | 99.61±15.95 | 101.11±13.23 | 99.16±14.27 | 101.44±10.52 | |
| Forced vital capacity (FVC) | |||||||||
| FVC (L) | 3.19±0.65 | 3.21±0.63 | 3.39±1.08 | 3.44±1.04 | 3.28±0.64 | 3.34±0.58 | 3.26±0.58 | 3.26±0.66 | |
| FVC (%predicted) | 93.55±8.16 | 94.22±9.34 | 98.50±13.09 | 100.11±12.41 | 99.83±14.68 | 100.00±13.55 | 100.77±11.55 | 100.67±12.46 | |
| Peak expiratory flow (PEF) | |||||||||
| PEF (L/min) | 6.95±1.64 | 6.98±1.62 | 6.49±1.39 | 7.20±1.41* | 6.44±1.79 | 7.15±1.53* | 6.24±1.18 | 6.74±1.12* | |
| PEF (%predicted) | 97.27±25.16 | 97.50±23.90 | 91.50±15.45 | 101.56±15.06* | 92.27±19.14 | 101.33±16.78* | 92.11±12.87 | 99.83±14.72* | |
| Forced expiratory volume in one second per forced vital capacity (FEV1/FVC) | |||||||||
| FEV1/FVC (%) | 90.77±5.63 | 89.77±5.57* | 89.72±5.54 | 89.61±4.85 | 89.38±6.89 | 90.33±6.53* | 88.72±9.28 | 91.17±5.34* ** | |
| FEV1/FVC (%predicted) | 101.05±5.57 | 99.94±5.59* | 99.55±5.92 | 99.50±5.03 | 98.83±7.48 | 100.22±7.22 | 97.77±10.14 | 100.61±6.00* ** | |
| Forced expiratory flow at 25 – 75 % of FVC (FEF25-75) | |||||||||
| FEF25-75 (L) | 3.71±0.96 | 3.58±0.89 | 3.67±0.98 | 3.56±0.76 | 3.61±1.03 | 3.76±0.95 | 3.46±0.99 | 3.73±0.60 | |
| FEF25-75 (%predicted) | 98.00±25.95 | 94.61±24.24 | 96.00±18.58 | 95.22±17.82 | 97.1±26.30 | 100.56±24.68 | 94.11±27.456 | 101.94±18.35 | |
| Maximal voluntary ventilation (MVV) (L/min) | 108.43±19.59 | 107.85±18.89 | 113.46±32.73 | 114.92±31.86 | 109.84±22.43 | 112.88±110.60 | 108.14±20.25 | 110.60±18.80 | |
| Peak inspiratory flow (PIF) (L/min) | 4.71±1.36 | 5.03±1.31 | 4.22±1.50 | 5.49±1.61* | 4.17±1.41 | 5.17±1.41* | 4.11±0.70 | 4.89±1.21* | |
| Forced expiratory time (s) | 2.40±0.61 | 2.51±0.65 | 2.72±0.65 | 2.82±0.64 | 2.58±0.73 | 2.50±0.79 | 2.88±0.90 | 2.61±0.85 | |
Group comparisons were conducted using one-way ANOVA, followed by Bonferroni correction. Intra-group comparisons were performed using paired t-test. *, p<0.05 vs. before intervention; **, p<0.05 vs. CON group.
Table 5.
Chest wall expansion and pulmonary volume of participants before and after 12-week intervention.
Table 5.
Chest wall expansion and pulmonary volume of participants before and after 12-week intervention.
| CON group (n=18) | HIIT group (n=18) | AOE group (n=18) | HIIT+AOE group (n=18) | ||||||||||
| Before | After | Before | After | Before | After | Before | After | ||||||
| Chest expansion | |||||||||||||
| Upper chest (cm) | 2.94±1.49 | 3.02±1.26 | 2.71±1.11 | 3.54±1.50* | 2.83±0.79 | 3.30±0.84 | 3.40±0.83 | 3.62±1.39 | |||||
| Middle chest (cm) | 2.07±1.45 | 2.21±1.46 | 2.36±1.36 | 2.88±2.00 | 2.37±1.02 | 2.98±1.36 | 2.97±1.10 | 3.22±1.36 | |||||
| Lower chest (cm) | 2.89±1.52 | 2.88±1.56 | 3.41±1.30 | 3.85±1.75 | 3.85±1.46 | 3.71±0.92 | 3.81±0.97 | 4.79±1.49* ** | |||||
| Pulmonary volume | |||||||||||||
| VC (L) | 3.01±0.73 | 3.10±0.71 | 3.22±1.16 | 3.34±1.13* | 3.02±0.62 | 3.21±0.58* | 3.13±0.69 | 3.17±0.67 | |||||
| IC (L) | 1.93±0.05 | 2.00±0.59 | 2.02±0.64 | 2.17±0.63 | 1.77±0.64 | 2.08±0.60* | 1.91±0.30 | 1.96±0.44 | |||||
| TV (L) | 0.96±0.38 | 0.86±0.54 | 0.94±0.47 | 0.99±0.39 | 0.84±0.35 | 0.88±0.43 | 0.99±0.41 | 0.95±0.47 | |||||
| ERV (L) | 1.12±0.56 | 1.11±0.51 | 1.19±0.62 | 1.17±0.58 | 1.25±0.41 | 1.13±0.38 | 1.22±0.50 | 1.21±0.42 | |||||
| IRV (L) | 0.96±0.47 | 1.15±0.59 | 1.07±0.52 | 1.19±0.52 | 0.93±0.60 | 1.20±0.41* | 0.92±0.31 | 1.01±0.51 | |||||
Group comparisons were conducted using one-way ANOVA, followed by Bonferroni correction. Intra-group comparisons were performed using paired t-test. VC, vital capacity; IC, inspiratory capacity; TV, tidal volume; ERV, expiratory reserve volume; IRV, inspiratory reserve volume. *, p<0.05 vs. before intervention; **, p<0.05 vs. CON group.
Table 6.
Body composition of participants before and after 12-week intervention.
| CON group (n=18) | HIIT group (n=18) | AOE group (n=18) | HIIT+AOE group (n=18) | |||||
| Before | After | Before | After | Before | After | Before | After | |
| Body mass (kg) | 77.40±15.25 | 77.36±14.49 | 77.64±16.60 | 78.89±16.75 | 71.43±13.05 | 72.71±13.54 | 70.47±7.60 | 71.19±7.67 |
| Body mass index (kg/m2) | 29.10±5.11 | 29.11±4.87 | 29.13±5.48 | 29.59±5.65 | 26.98±2.97 | 27.44±3.04 | 26.92±2.50 | 27.19±2.32 |
| Skeletal muscle mass (kg) | 25.37±5.52 | 25.25±5.55 | 25.88±6.08 | 26.14±6.27 | 24.60±5.79 | 24.79±6.09 | 24.14±3.97 | 23.96±3.84 |
| Fat-free mass (kg) | 46.04±9.06 | 45.82±9.06 | 46.85±9.84 | 47.24±10.20 | 44.73±9.60 | 45.11±10.12 | 44.12±6.50 | 43.77±6.28 |
| Fat mass (kg) | 31.36±10.23 | 31.53±9.62 | 30.79±11.64 | 31.65±11.85 | 26.70±6.21 | 27.60±6.52 | 26.34±5.26 | 27.42±4.84 |
| Percent body fat (%) | 40.07±7.38 | 40.44±7.14 | 39.02±8.98 | 39.54±9.21 | 37.44±5.53 | 38.04±5.64 | 37.37±5.79 | 38.52±5.10 |
| Waist circumference (cm) | 95.13±9.53 | 95.41±11.75 | 95.31±12.97 | 94.38±12.99 | 87.73±9.92 | 89.28±9.44 | 85.04±8.13 | 86.96±6.99 |
| Waist–hip ratio | 0.92±0.06 | 0.94±0.06* | 0.91±0.06 | 0.91±0.06 | 0.91±0.15 | 0.93±0.81 | 0.87±0.04 | 0.88±0.05** |
| Basal metabolic rate (kcal) | 1364±195 | 1359±196 | 1382±212 | 1390±220 | 1336±207 | 1344±218 | 1323±140 | 1315±135 |
Group comparisons were conducted using one-way ANOVA, followed by Bonferroni correction. Intra-group comparisons were performed using paired t-test. *, p<0.05 vs. before intervention; **, p<0.05 vs. CON group.
Disclaimer/Publisher’s Note: The statements, opinions and data contained in all publications are solely those of the individual author(s) and contributor(s) and not of MDPI and/or the editor(s). MDPI and/or the editor(s) disclaim responsibility for any injury to people or property resulting from any ideas, methods, instructions or products referred to in the content. |
© 2025 by the authors. Licensee MDPI, Basel, Switzerland. This article is an open access article distributed under the terms and conditions of the Creative Commons Attribution (CC BY) license (http://creativecommons.org/licenses/by/4.0/).
Copyright: This open access article is published under a Creative Commons CC BY 4.0 license, which permit the free download, distribution, and reuse, provided that the author and preprint are cited in any reuse.


