
Submitted:
03 May 2025
Posted:
06 May 2025
You are already at the latest version
Abstract
Air quality standards (AQS) are key regulatory tools to protect public health by setting pollutant thresholds. However, most are based on sea-level data. High-altitude (HA) environments differ in atmospheric conditions, influencing pollutant behavior and human vulnerability. These conditions have prompted proposals for altitude-specific AQS adjustments. This systematic review identifies models and criteria supporting such adapta-tions and examines regulatory air quality frameworks in countries with substantial populations living in HA. PRISMA-P guidelines and a Population/Concept/Context (PCC) framework were used to define the search terms: Population (Air Quality Standards), Concept (Air Pollutants), and Context (Altitude). Relevant literature was retrieved from MEDLINE, SCOPUS, Web of Science, and Gale OneFile: Environmental Studies and Poli-cy. A total of 2,093 articles were identified after duplicate removal. Following title and ab-stract screening, 2,081 papers were excluded, leaving 12 for full-text evaluation. Ultimately, six studies met the eligibility criteria. Three studies focused on adjustment models based on atmospheric conditions, such as temperature and pressure changes, while the other three examined human physiological responses, particularly the increased inhaled air volume. China, Peru, and Bolivia have the largest populations living above 3,500 m a.s.l., yet none of these countries have specific air quality regulations tailored to HA conditions. The review underscores the necessity for tailored AQS in HA environments.
Keywords:
Altitude
; Air Quality Standards
; pollution
; adjustment
; scoping review
Air quality standards (AQS) are key regulatory tools to protect public health by setting pollutant thresholds. However, most are based on sea-level data. High-altitude (HA) environments differ in atmospheric conditions, influencing pollutant behavior and human vulnerability. These differences have prompted proposals for altitude-specific AQS adjustments. This systematic review identifies models and criteria supporting such adaptations and examines regulatory air quality frameworks in countries with substantial populations living in very high-altitude. This review followed PRISMA-P guidelines, focusing on studies examining AQS adjustment approaches based on altitude. The Population/Concept/Context (PCC) framework was used to define search terms: Population (AQS), Concept (Air Pollutants), and Context (Altitude), with equivalents. Literature was retrieved from MEDLINE, SCOPUS, Web of Science and Gale OneFile: Environmental Studies and Policy. A total of 2,974 articles were identified, with 2,093 remaining after duplicate removal. Following title and abstract screening, 2,081 papers were excluded, leaving 12 for full-text evaluation. Ultimately, six studies met the eligibility criteria. Three studies focused on adjustment models based on atmospheric conditions, such as temperature and pressure changes, while the other three examined human physiological responses, particularly the increased inhaled air volume. China, Peru, and Bolivia have the largest populations living above 3,500 m a.s.l., yet none of these countries have specific air quality regulations tailored to HA conditions. The review underscores the necessity for tailored AQS in HA environments, highlighting specific criteria related to both atmospheric conditions and human physiological responses.
1. Introduction
The World Health Organization (WHO) estimates that 99% of the global population breathes air with pollutant levels exceeding recommended limits, making it the primary environmental medium for pollutant exposure and the second leading risk factor for death worldwide (Health Effects Institute, 2024; WHO, 2022). Outdoor air pollution is responsible for nearly 7 million excess deaths annually, with the highest burden observed in low- and middle-income countries. This critical situation underscores the need to strengthen public health policies aimed at reducing pollution levels (Feng et al., 2024; Jonidi Jafari et al., 2021).
Air Quality Standards (AQS) are legally binding instruments and essential components of public health strategies aimed at managing exposure to air pollutants (Kutlar Joss et al., 2017). They establish pollutant concentration thresholds and objectives to minimize the risk of adverse health effects (Fowler et al., 2020; UNEP, 2021). Most countries develop their national (or federal) AQS primarily based on international guidelines provided by organizations such as the World Health Organization (WHO), the U.S. Environmental Protection Agency (EPA), and the European Environment Agency (EEA), among others (Shairsingh et al., 2023; Wooley et al., 2024).
These guidelines offer evidence-based recommendations derived primarily from a systematic analysis of environmental epidemiology studies conducted predominantly in metropolitan areas with adequate resources and well-established monitoring networks (Ravindra et al., 2024; Shairsingh et al., 2023). However, these conditions may not be replicable in developing countries, which often feature diverse environmental settings and limited air quality management infrastructure (Vahlsing and Smith, 2012). In this context, the guidelines highlight the need to adapt air quality target values to local conditions before implementing international standards (WHO, 2021).
High-altitude (HA) environments can significantly influence pollution levels and impact population exposure (Masiol et al., 2024). A 1978 report by EPA highlighted that HA atmospheric conditions—such as reduced barometric pressure, lower temperatures, increased solar radiation, and other factors—affect pollutant dynamics through various mechanisms (U.S. EPA, 1978). These include intensifying photochemical reactions, increasing the frequency of thermal inversions, promoting aerosol formation, dispersion, deposition, condensation, and altering vehicle emissions, among others (Dordević and Šolević, 2008; Herrmann et al., 2015).
The respiratory physiology of native HA populations is another critical factor to consider in this context (Bigham et al., 2013; Storz, 2021). Over generations, these populations have developed anatomical and physiological adaptations that enhance lung capacity, allowing them to cope with hypoxic conditions at altitudes (Moore, 2001). As a result, they exhibit higher ventilatory rates than sea-level populations, leading to the inhalation of larger air volumes—and consequently, greater exposure to airborne pollutants (Li et al., 2024).
These conditions underscore the numerous variables that pose a complex challenge when considering the need for altitude-specific AQS (Ortiz-Prado et al., 2022). However, previous research in the biological field has demonstrated that adjusting parameters based on biological markers is feasible (Dzhalilova and Makarova, 2020). A notable example is the classification criteria for anemia at high altitudes, where a non-linear increase in blood hemoglobin (Hb) levels has guided the establishment of specialized reference values and clinical decision thresholds for these populations (Sullivan et al., 2008).
Altitude-dependent pollution dynamics are particularly critical for rapidly expanding HA cities, where emissions and meteorological challenges are exacerbated by urbanization and population growth (Ehrlich et al., 2021). Approximately 81 million people live at altitudes above 2,500 meters above sea level (m a.s.l.), with major population centers located in low- and middle-income regions, such as the Tibetan Plateau in China and the Andean countries in South America (Tremblay and Ainslie, 2021).
It is well known that these countries often enforce less stringent regulations, frequently exceeding both AQS and WHO guidelines (Wiedensohler et al., 2018). The combined effect of overexposure and altitude may help explain the higher prevalence of respiratory diseases associated with air pollution—such as asthma—among individuals living at HA compared to those at sea level (Guo et al., 2020; Vargas et al., 2018). Furthermore, this issue remains largely underexplored, exposing a social inequality gap driven by inadequate regulatory frameworks in these regions.
This scoping review aims to identify available literature that address setting AQS adapting to altitude environments and the factors implying it. Additionally, it seeks to summarize existing regulations regarding AQS in major HA countries, discussing the criteria and conditions relevant to protecting the health of populations living at very HA. This review highlights gaps and opportunities for developing effective air quality guidelines tailored to specific contexts and for establishing public policies and regulations that prioritize health protection.
2. Methods
We conducted a scoping review to inform the proposed models and criteria for adjusting air quality standards (AQS) to altitude, complemented by an overview of regulations AQS applied in countries with a higher proportion of the population living in HA cities.
2.1. Protocol Registration and Search Strategies
This study follows the PRISMA-P (Preferred Reporting Items for Systematic Review and Meta-Analysis Protocols) guidelines to ensure transparency, reproducibility, and quality throughout the review process. We utilized the Population/Concept/Context (PCC) framework to define and organize the search terms. These terms included Population (Air Quality Standards), Concept (Air Pollutants), and Context (Altitude), along with their corresponding equivalents identified through PubMed MeSH and PAHO DeCS web portals. The protocol was designed a priori and registered on the Open Science Framework (OSF) platform, available at https://osf.io/c3fnh/.
This review was conducted using literature from key databases, including MEDLINE, SCOPUS, Web of Science, and Gale OneFile: Environmental Studies and Policy. Detailed search algorithms are provided in Supplementary material 1. The search strategy was designed to avoid duplication of existing systematic reviews, ensuring the novelty and relevance of the present study. For the overview of AQS regulations, we focused on countries with the largest populations living above 3,500 m.a.s.l.: China, Peru, and Bolivia (Tremblay and Ainslie, 2021). Reports on air quality regulations from the environmental agency repositories of these countries were analyzed and summarized alongside contextual studies
2.2. Eligibility Criteria and Selection Studies
This study included all study designs limited to studies published in English up to November 2024, covering all the period from the implementation of the first formal AQS globally to the present. The inclusion criteria were as follows:
- Studies proposing, modeling, or establishing criteria for altitude-adjusted AQS in outdoor air, considering any methodological approach.
- The primary pollutants (criteria pollutants) (Saxena and Sonwani, 2019) of interest included particulate matter, nitrogenous species, carbon oxides, and ozone.
2.3. Data Management
Relevant data were systematically and consistently collected from the selected studies. A standardized form was used to ensure uniformity in data extraction among reviewers. This form included specific fields to capture critical information such as study characteristics (author, year of publication, country of origin), study design, study population, contaminants criteria for AQS adjust and primary results or outcome measures.
Initially, two reviewers independently screened the information by titles and abstracts. If a decision could not be made based on theses, the full text of the article was reviewed. Any disagreements between reviewers were resolved by consensus or through the intervention of a third reviewer. The Rayyan QCRI web platform was used to manage the selection of articles, exclude duplicates, and record the reasons for exclusion, further ensuring the validity of our research.
3. Results
Our initial search identified a total of 2,974 articles, but 2,093 documents remained after removal duplicates. Following the titles and abstracts screening, 2,081 papers were excluded, leaving 12 articles for full-text evaluation as shown in Figure 1. A subset of 6 studies met the eligibility criteria and were included in the final review. The main exclusion reasons of studies were the lack of a clear proposal for AQS adjustment.
3.1. Altitude Adjusting Criteria in AQS
Six studies were identified that directly or indirectly address criteria for adjusting air pollutant standards based on altitude (Table 1). These studies fall into two main categories based on the variables and rationale underlying their adjustment models. The first category considers atmospheric and environmental factors, such as barometric pressure, temperature, and air density. The second focuses on human physiological adaptations to altitude, including changes in respiratory volume, hemoglobin-CO dissociation, and other physiological responses.
A pivotal early insight by Goddard and Goddard, 1979 proposed the application of altitude corrections to the California Ambient AQS. Their approach involved converting pollutant concentrations adjusted for pressure and temperature variations at specific altitude. They identified an 8% error lower in the AQS for hydrogen sulfide when comparing the standard at the time to its equivalent at an elevation of 2,200 (670.5 ).
The proposal by Bravo and Urone, 1981 highlighted altitude as a "Fundamental Parameter" for AQS adjustments, contextualized within the challenges posed by Mexico City, a congested capital city with elevation (2,240 m a.s.l.). The approach to adjusting AQS was rationalized based on the physiological implications of reduced barometric pressure and air density on gas exchange at the alveolar-capillary human lungs interface at HA. Under these conditions, lower airway resistance reduces respiratory effort, allowing a greater volume of air to enter the lungs compared to individuals at sea level (Cogo, 2011). Based on this premise, the authors proposed an AQS adjustment factor using the ratio between respiratory rates under standard and HA conditions in Table 1.
Using previous data on resting ventilation volume, body measurements, and average air particulate matter concentrations, they estimated that an average resident of Mexico City inhales an excess daily air volume of approximately 2,664 of body surface area. This would correspond to an additional cumulative particulate matter exposure dose of 690 per square meter of body surface area.
Another notable physiological approach was proposed by Collier and Goldsmith, 1983, focusing on ambient carbon monoxide (CO) levels. It is well established that CO binds to hemoglobin (Hb) 200 to 300 times more strongly than oxygen (Patel et al., 2023), potentially leading to hypoxic effects (Kitagishi and Mao, 2021). The key assumption is that HA conditions would require stricter CO AQS due to the reduced partial pressure of oxygen (PO2), which further enhances CO’s affinity for Hb, resulting in higher carboxyhemoglobin (COHb) levels (McGrath, 1988).
The CO AQS stablished in U.S. set threshold at 10 (9 ) for an 8-hour exposure (U.S. EPA, 2024). However, the states of California and Nevada tightening it to 6 ppm (5.5 ) for the touristy Lake Tahoe Basin elevated at 1,900 m a.s.l (Tahoe Regional Planning Agency, 2021). In that context Collier and Goldsmith evaluated the appropriateness of these adjustments, with a theoretical mathematical model that integrated the relationships between O2, CO, and Hb through the Coburn-Forster-Kane (CFK) equation, the Roughton-Darling equation, the oxygen dissociation curve (ODC), alveolar ventilation equations, and formulas for barometric pressure and pCO as functions of altitude (Collier and Goldsmith, 1983).
The CO AQS established in the U.S. sets a threshold of 10 (9 ) for an 8-hour exposure (U.S. EPA, 2024). However, California and Nevada tightened this limit to 6 ppm (5.5 ) for the Lake Tahoe Basin, a popular tourist destination located at 1,900 m a.s.l. (Tahoe Regional Planning Agency, 2021). In this context, Collier and Goldsmith assessed the appropriateness of these adjustments using a theoretical complex model integrating the relationships between O2, CO, and Hb through the Coburn-Forster-Kane (CFK) equation, the Roughton-Darling equation, the oxygen dissociation curve (ODC), alveolar ventilation equations, and formulas for barometric pressure and pCO as functions of altitude.
The model's results indicated that the 8-hour and 1-hour CO standards established for sea-level conditions would not require modification to ensure health protection at HA, provided if the standards were expressed in volumetric terms. This contrasted with the EPA´s approach, which was based on gravimetric measurements. The rationale behind this finding was that altitude and hyperventilation proportionally decreases both inspired pCO and pO2, maintaining their relative balance (Savioli et al., 2022). However, it was mentioned that other factors not considered, such as increased CO emissions due to inefficient vehicle engine combustion at altitudes, could heighten exposure risks (Jiang et al., 2025).
An indirectly adjusted measure included in this review is the study by Madueño et al., which examines black carbon (BC) exposure at (Madueño et al., 2020). The authors estimate the potential Respiratory Deposited Dose (RDD) of in individuals using different modes of transportation in La Paz and El Alto, Bolivia—cities located at 3,600 and 4,100 m a.s.l., respectively. The study compares RDD findings with similar research conducted in low-altitude regions, revealing that black carbon exposure while walking in Bolivia is, on average, 2.6 times higher than at sea level.
The primary factor for calculating RDD in Table 1 is the minute ventilation rate (MV) associated with a given activity, commonly referred to as the inhalation rate (Horiuchi et al., 2019). MV should be considered the key variable in assessing exposure under the same air pollutant concentration (Dons et al., 2012; Milledge, 1968). Based on these findings, the authors highlight the urgent need for stricter and more aggressive policies and regulations on road emissions in HA cities (Madueño et al., 2020).
Among the studies that adopt environmental and atmospheric approaches to altitude-based AQS adjustments, Bravo Alvarez et al., 2013 is one of the most frequently cited on this topic (Feng et al., 2022; Liu et al., 2021; Torres-Duque et al., 2024). Their approach is based on a straightforward application of the general gas law equation, proposing an adjustment factor derived from the ratio of temperature at sea level (298.15 K) to its corresponding value at a given altitude (), multiplied by the ratio of atmospheric pressure at that altitude () to its standard sea level value (1013 ) in Table 1.
This is a simple but versatile model that can be applied to any AQS pollutant. The study exemplifies its application by adjusting the Mexican AQS for total suspended particles (TSP) and particulate matter less than 10 (PM10) across cities at different altitudes in Latin America (Bravo Alvarez et al., 2013). The specific correction factors for PM10 ranged from 0.97 for Santiago de Chile (567 m a.s.l.) to 0.68 for El Alto, Bolivia (4,050 m a.s.l.), indicating that as altitude increases, AQS values may be proportionally reduced. Among the Latin American cities analyzed were Mexico City (Mexico), with a factor of 0.79; Bogotá and Cali (Colombia), with 0.76; Quito (Ecuador), with 0.75; and Cusco (Peru), with 0.70.
The last study was conducted by Yan et al., 2021, focusing on air quality HA road tunnels. The current Chinese guidelines for tunnel ventilation (China, 2014) recognized the influence of altitude on exacerbated vehicle CO emissions. To address this effect, the guidelines establish a CO altitude emission coefficient, which quantifies the additional emissions produced at a given altitude compared to the same vehicle operating at sea level. According to these regulations, the CO emission coefficient under standard conditions (below 400 m a.s.l.) is set at 1, but it triples at an altitude of 4,000 (China., 2014).
Yan et al., 2021 aimed to assess the validity of the existing CO altitude emission coefficient and to propose a similar coefficient for , which was not included in the guidelines. They measured CO and NO levels in four road tunnels at altitudes ranging from 500 to 3,850 m a.s.l., considering atmospheric parameters, traffic conditions, and structural characteristics. Using mass balance models, they calculated emission factors and found that the CO altitude coefficient increases nearly linearly with altitude, aligning with the values established in the guidelines within the studied altitude range. Additionally, they proposed a NO emission coefficient of 0.403 at 500 , which increases linearly to 0.886 at 3,850 m a.s.l.
3.2. Altitude Influenced Pollutants AQS and Regulation in Major HA Countries
The implementation of AQS levels varies significantly across countries, with differing levels of stringency in pollutant thresholds, leading to a wide range of regulations for the same pollutant (Nazarenko et al., 2021). This variation has been attributed to multiple factors and their interrelations, including government systems, a country's level of development, sociolegal cultures, technical expertise, historical patterns of air quality legislation, and other considerations (UNEP, 2021). However, specific conditions such as topography and altitude are often either overlooked or insufficiently addressed
The WHO AQS (2000) guidelines acknowledge altitude as a factor influencing air pollutant concentrations; however, they do not provide specific recommendations for addressing altitude-related AQS adjustments considerations (WHO, 2000). Growing evidence with strong theoretical plausibility supports the impact of altitude on pollutant concentrations, particularly for ozone (O3), nitrogen oxides (NOx), and particulate matter (PM) (Ning et al., 2018, 2024a; Wang et al., 2024). These criteria pollutants are of major public concern, with PM2.5 being the leading contributor to global morbidity and mortality (Kim et al., 2015; Silva et al., 2013), and O3 ranking as the second most detrimental pollutant to human health (Ebi and McGregor, 2008).
The magnitude effects and outcomes are determined by the absolute altitude. According to the EPA, at elevations above 1,500 m, significant atmospheric changes begin, with pressure decreasing by approximately 15% compared to sea level (U.S. EPA, 1978). HA is defined as elevations between 2,500 and 3,500 m a.s.l. (US standard Atmosphere, 1976), while very high altitude (>3,500 m) presents extreme conditions that exacerbate the impacts of various risk factors (Burtscher, 2013). To evaluate current air quality legislation and specific regulatory approaches in countries where a significant proportion of the population resides above 3,500 m a.s.l. (Fig. 1), we examined national AQS frameworks from China, Peru, and Bolivia. Our analysis focuses on their regulatory standards for PM, O₃, and NO₂ (Table 2)
China has the largest HA population globally, with 5.1 million people residing above 3500 m a.s.l., primarily due to the inclusion of the Tibetan Plateau, the highest landmass on Earth (Wu, 2001). However, this represents only a very small fraction—0.37%—of the country’s total population (Tremblay and Ainslie, 2021). China’s current national AQS (GB 3095-2012) were issued by the Ministry of Environmental Protection in 2012 for primary pollutants and came into effect nationwide in January 2016 (Wang et al., 2023). Since then, air quality in China has steadily improved due to the implementation of various national policies prioritizing clean air targets (Zhao et al., 2020).
A distinctive feature of China’s AQS is its dual-level system, which establishes two classes of limit values for each pollutant. Class I standards apply to areas requiring special protection, such as scenic spots and nature reserves and class II standards for all other areas, including residential, mixed-use, industrial, and rural zones. The annual mean PM2.5 concentration limit across mainland China is set at 35 . Compliance with this standard has been relatively high; in 2022, only 18% of cities (primarily in the north, central regions, and the Sichuan Basin) recorded annual mean PM2.5 concentrations exceeding the national ambient AQS (Zhang et al., 2023).
Despite these efforts, China’s air quality standards (AQS) for particulate matter pollutants remain less stringent than the WHO air quality guidelines (WHO, 2021). Additionally, the 8-hour ozone AQS level (Class II) is the most lenient among the countries analyzed in this review. According to national regulations, provincial governments in China may establish local AQS for parameters not covered by national standards and impose stricter limits on those already regulated. For instance, Song et al. proposed adjustments for Hainan Province (Song et al., 2024), and administrative division adjustments (ADA) have been suggested to modify environmental governance policies for local governments (Feng et al., 2022). However, there is limited literature on the development of local AQS for HA cities in China (Wang et al., 2023).
The spatiotemporal distribution of air pollution indicates low pollution levels in the peripheral areas of HA zones (Ning et al., 2018), likely due to the sparse population and minimal industrial activity in these regions. However, seasonal pollution spikes can occur, as observed in Lhasa, one of the highest cities in China (3,650 ). While the annual average PM2.5 concentration remains within the Chinese standard of 35 (Li et al., 2016), winter pollution is severe. This is primarily attributed to the widespread use of butter lamps, which significantly increase PM2.5 levels, raising the city's average winter concentration to 118 ± 60 (Li et al., 2019).
Peru ranks second, with an estimated 4 million people living above 3,500 m a.s.l., although this figure is likely underestimated due to a lack of comprehensive data (Tremblay and Ainslie, 2021). The HA Peruvian population is primarily distributed along the Andean Cordillera in western South America. After Chile, Peru has the largest proportion of its territory covered by the Andes (CONDESAN, 2012), a region rich in mineral resources that has driven large-scale displacement of households and communities (Bury, 2007; Velásquez, 2013). Notably, the highest-altitude city in the world is the Peruvian mining settlement of La Rinconada, located between 5,100 and 5,300 , where gold mining activities are predominant (Hancco et al., 2020). Another notable city is La Oroya (3,745 ), which has been ranked among the ten most polluted places on Earth. An international court has even assessed the state's responsibility for the severe air contamination affecting its population (Neumann, 2016; Spieler, 2010).
Peru's AQS, established in 2017, align with the WHO Interim Target I (2005) for PM pollutants (World Health Organization., 2006). According to air quality monitoring data from Peru, the PM10/PM2.5 ratio for a 24-hour period ranges between 0.32 and 0.65, consistent with the suggested value of 0.5 for developing countries (Moore, 2001). In the case of NO2, the annual AQS is higher than in other countries and exceeds the WHO recommendation by a factor of ten (Table 2). Currently, there is no specific AQS regulation for HA cities. However, a legislative proposal introduced in 2016 (Draft Law 756/2016-CR) suggested an adjustment model for AQS regarding PM, NO2, O₃, and SO₂, incorporating correction factors based on air density and atmospheric pressure at each measurement altitude (Villanueva Mercado, 2016). As of this review, no further discussion on its implementation has taken place.
Bolivia has the highest proportion population living above 3,500 m, approximately 32.6% of its total habitants (Tremblay and Ainslie, 2021). Additionally, is there the highest capital city in the world (La Paz, 3869 m average elevation). As characteristic of metropolitan areas, the vehicular emissions represent an important contributor to its air pollution (Mardoñez et al., 2023). Cochabamba (2.558 m) Bolivian city was listed by WHO as one of the five most contaminated cities in Latin America (UNEP, 2016). This due to its complex ‘bowl’ topography which influencing accumulation of air pollution associated to the transport emissions (Pareja et al., 2011).
AQS regulation presents a unique case, operating under two frameworks: the official 1992 General Environmental Law (N° 1333) and the Bolivian technical standards (Normas Bolivianas, NB) issued by IBNORCA (Bolivian Institute of Standardization and Quality). The latter is indicated only as a reference guide, without mandatory enforcement. Notably limits for PM2.5, are absent in the General Law and the PM10 and PM2.5 limits set by IBNORCA are among the most stringent compared to other countries and are remarkably close to the WHO air quality guidelines (table 2). The specific reasons for this significant difference remain unclear, and it is uncertain whether they are related to the altitude conditions. In contrast, the General Law establishes the most lenient AQS, with the highest limits for PM10, O₃, and NO₂ (1-hour standard).
4. Discussion
This review assesses the available scientific evidence on the criteria and models proposed for adjusting air quality standards (AQS) in response to altitude conditions, alongside an analysis of air quality regulations and policies implemented in countries with significant populations residing above 3,500 m a.s.l.
Globally, epidemiological studies evaluating health risks associated with pollutant exposure in HA urban populations remain scarce (Ning et al., 2024b; Vilcassim and Thurston, 2023). Air quality monitoring and regulatory efforts have traditionally focused on major metropolitan areas, predominantly located at or near sea level (Carvalho, 2016). Consequently, recommendations, regulations, and international guidelines are largely derived from studies conducted in these settings (WHO, 2021). This knowledge gap may stem, at least in part, from the longstanding perception that HA environments inherently offer fresher and cleaner air due to lower population density and limited industrial activity (Zhang et al., 2018). However, several HA urban centers have undergone significant development, disrupting environmental equilibrium through increasing emissions that pose substantial public health challenges (Dame et al., 2019; Luan and Li, 2021). Furthermore, these challenges may be exacerbated by climate change and urban expansion, as HA environments could become increasingly sought after as refuges from extreme heatwaves (Asad et al., 2023; Ding et al., 2021).
This review identifies six proposals for adjusting AQS, which can be categorized into two distinct groups based on their underlying principles. Three of these proposals primarily focus on atmospheric and external conditions, while the remaining three emphasize human physiological responses. In the first group, both Goddard and Goddard, 1979 and Bravo Alvarez et al., 2013 proposed a similar approach based on the relationship between pollutant concentration, pressure, and volume. This reasoning suggests that AQS—expressed as pollutant concentrations under standard reference conditions (25°C and 760 mmHg at sea level)—would inherently yield lower converted concentrations at higher altitudes. A comparable concept was explored by Warthon Ascarza, 2023 in their doctoral thesis, incorporating an exponential function to adjust PM AQS according to altitude. The adjustment factor estimated for Cusco (0.67) closely aligns with that reported by Bravo (0.70) for the same city, providing empirical support for this method. However, the validity of this approach remains debated, as it relies on the assumption of ideal gas behavior according to theoretical gas laws (Woody, 2013), which may be oversimplified given the complex interactions in real-world atmospheric conditions.
Yan et al., 2021, for its part, conducted an observational study examining variations in vehicle CO and NO emissions in HA tunnels. Multiple studies have reported that tailpipe emissions tend to increase under these conditions due to the diminished performance of internal combustion engines (Giraldo and Huertas, 2019; Martínez et al., 2022). The primary factors contributing to this phenomenon include lower ambient temperatures and reduced oxygen availability, both of which negatively impact fuel combustion efficiency (Bishop et al., 2001). Since most engines are calibrated in standard factory settings at sea level, their performance deteriorates at high altitudes, leading to higher fuel consumption and increased pollutant emissions (Qi et al., 2023). In this context, regulations focus on a specific microenvironment by incorporating an emission coefficient, which plays a crucial role in infrastructure ventilation and air quality management in road tunnels, as seen in China (China., 2014).
The second group shifts the focus to human physiological responses to altitude. Bravo and Urone, 1981 and Madueño et al., 2020 incorporated respiratory variables into their calculations to account for differences in the volume of air inhaled, which serves as a proxy for pollutant intake. Bravo and Urone, 1981 used ventilation volume measurements expressed as daily air intake per unit of body surface area, while Madueño et al., 2020 employed a more recent variable—minute ventilation—as a refined approach to quantify respiratory differences (Borghi et al., 2021). In these cases, the ratio or difference between observed measurements in both representative populations provide a feasible factor for adjusting AQS.
Evidence supporting these physiological adjustments in high-altitude environments has been explored. In vitro respiratory tract models have demonstrated that increasing altitude significantly enhances the deposition of inhaled particles in the respiratory system (Li et al., 2024), making it more vulnerable and less capable of effectively expelling harmful substances (Wuyam et al., 2022). The natural physiological response to altitude is known as the hypoxic ventilatory response (HVR), which triggers an increase in breathing to enhance alveolar ventilation—by up to fivefold in newcomers to HA environments (Grimminger et al., 2017). However, distinct respiratory patterns are observed among native high-altitude populations. Tibetans exhibit high resting ventilation and a strong HVR, similar to acclimatized lowlanders, whereas Andeans tend to have lower resting ventilation and a blunted HVR (Slessarev et al., 2010). Despite these differences, several studies consistently report higher spirometry values in HA populations (Greksa et al., 1988; López Jové et al., 2018; Weitz et al., 2016).
Finally, Collier and Goldsmith, 1983 examined the complex relationship between altitude and CO-Hb binding. Although their calculations did not provide sufficient evidence to justify adjusting CO AQS in volumetric terms, they estimated that exposure to 8 ppm of CO would result in equilibrium COHb levels of 1.4% at sea level and 1.8% at 3,579 m. This finding highlights an increase in COHb levels at altitude, even in the absence of ambient CO, in accordance with Haldane’s principle (Teboul and Scheeren, 2017). CO toxicity primarily causes damage through anoxic injury and lipid peroxidation. At high altitudes, this condition can be potentially fatal, as it clinically mimics acute mountain sickness (AMS). Several reports have documented CO-related fatalities in tents at high altitudes due to poorly ventilated spaces and low-flame camping stoves (Leigh-Smith, 2004). However, such cases appear to be underreported due to the overlap between CO toxicity symptoms and AMS, as well as the lack of definitive diagnostic testing (Foutch and Henrichs, 1988).
Current air quality regulations in the Lake Tahoe Basin, Nevada (1,900 m a.s.l.), enforce stricter thresholds compared to the U.S. National Ambient Air Quality Standards (NAAQS) (Tahoe Regional Planning Agency, 2021). Notably, this is the only policy explicitly based on altitude conditions that we identified. In contrast, Denver, CO (1,600 m a.s.l.) adheres to the CO NAAQS of 9 ppm, a limit that is frequently exceeded during the winter months (Crow, 1979).
The complex interplay between atmospheric physics and human biology at high altitudes underscores the need to discuss potential adjustments to AQS for effective public health protection and air quality monitoring. AQS serves as the core strategic framework for ambient air quality management worldwide, forming the foundation of environmental protection efforts and a key regulatory tool. If AQS are designed primarily to safeguard human health, then physiological respiratory adaptations could provide one of the most relevant approaches for studying long-term exposure risks. This perspective aligns with the methodologies adopted by international air quality guidelines (WHO, 2021).
Models that adjust AQS based on environmental variables can be refined through monitoring systems, such as gravimetric methods for particulate matter collection. The rationale behind this approach is that, even if a fixed threshold is maintained, actual pollutant concentrations may or may not exceed it depending on local pollution levels. This can be verified through environmental monitoring, which already incorporates altitude adjustment protocols. However, developing a comprehensive framework that integrates both environmental and physiological considerations remain a complex challenge.
The rationale for adjusting or normalizing AQS based on altitude is supported by diverse, yet still limited, evidence (U.S. EPA, 1978). Recent studies on new particle formation (NPF) have observed that nucleation processes occur more frequently at high altitudes (Boulon et al., 2011; Venzac et al., 2009) , particularly in the Southern Hemisphere (Sellegri et al., 2019). NPF is a major source of atmospheric ultrafine particles (<100 nm), contributing to approximately 50% of aerosol number concentrations in the troposphere (Spracklen et al., 2008). Additionally, intense solar radiation (UV <410 nm) at high altitudes plays a direct role in accelerating tropospheric O₃ formation (Yu et al., 2021) through the photodissociation of NO₂. This process exhibits an altitude-dependent response, with ozone levels increasing by 21% to 70% at 1,000 m a.s.l. (108). Other environmental factors include the increased occurrence of prolonged thermal inversion events and the influence of topographical features that restrict pollutant dispersion (Nejad et al., 2023).
In the pursuit of tailored air quality regulations for countries with a significant portion of their population residing at very high altitudes (>3,500 m a.s.l.), the most concentrated regions are the Qinghai-Tibet Plateau in Asia and the Andes in South America. These two areas serve as major high-altitude population hotspots, accounting for at least 80% of the world's inhabitants living at such elevations (Tremblay and Ainslie, 2021). Despite these unique environmental conditions, no specific regulations have been identified that explicitly account for altitude or topography in AQS adjustments for high-altitude urban areas. Notably, Bolivia lacks PM2.5 regulations, despite the country's inherently high-altitude setting, highlighting a critical gap in air quality management.
Despite the novelty of this finding, the results are limited by the small number of available studies and the methodological heterogeneity among them. This highlights an important research gap, but also reflects a scientific challenge rooted in the geographically disproportionate nature of high-altitude exposure. Nonetheless, this work outlines the dual-faceted approach needed to adapt AQS to the unique conditions of HA environments.
5. Conclusions
This scoping review provides the first comprehensive assessment of criteria and models proposed for adjusting AQS in altitude environments, systematically identifying and categorizing these approaches. By expanding existing knowledge, this research offers a valuable framework for future studies aimed at developing robust, evidence-based AQS tailored to the unique challenges of HA regions.
The complex interplay between atmospheric, environmental, and physiological factors highlights the need for continued discussion on AQS adjustments to strengthen public health protection and monitoring. While air quality policies have contributed to pollution reduction in some areas, achieving truly safe air quality standards remains a significant global challenge.
Author Contributions
Conceptualization, L.R.-T. and J.W.-A.; methodology, L.R.-T.; formal analysis, L.R.-T., J.W.-A., and S.P.-V.; investigation, L.R.-T., J.W.-A. and S.P.-V.; data curation, L.R.-T.; writing—original draft preparation, L.R.-T., J.W.-A. and S.P.-V.; writing—review and editing, L.R.-T. and S.P.-V.; supervision, L.R.-T.; All authors have read and agreed to the published version of the manuscript.
Funding
This research was financed and subsidized by CONCYTEC (Consejo Nacional de Ciencia, Tecnología e Innovación from Perú) through the PROCIENCIA program within the framework of the “Inter-institutional alliances for doctoral programs” contest, according to contract or agreement PE501088771-2024.
Data Availability Statement
The data that support the findings of this study are available from the corresponding author upon reasonable request.
Acknowledgments
To Leynard Natividad-Marin, Ph.D., James Cook University – adjunct researcher, for supporting the writing review process and providing some Figures and Table formatting suggestions.
Conflicts of Interest
The authors declare no conflict of interest.
References
- Asad A, Ullah K, Butt MJ, Labban A bin H. Analysis of urban heat island effects in high altitude areas of Pakistan. Remote Sens Appl 2023;32:101071. [CrossRef]
- Bigham AW, Wilson MJ, Julian CG, Kiyamu M, Vargas E, Leon-Velarde F, et al. Andean and Tibetan patterns of adaptation to high altitude. American Journal of Human Biology 2013;25:190–7. [CrossRef]
- Bishop GA, Morris JA, Stedman DH, Cohen LH, Countess RJ, Countess SJ, et al. The effects of altitude on heavy-duty diesel truck on-road emissions. Environ Sci Technol 2001;35:1574–8. [CrossRef]
- Borghi F, Spinazzè A, Mandaglio S, Fanti G, Campagnolo D, Rovelli S, et al. Estimation of the inhaled dose of pollutants in different micro-environments: A systematic review of the literature. Toxics 2021;9. [CrossRef]
- Boulon J, Sellegri K, Hervo M, Picard D, Pichon JM, Fréville P, et al. Investigation of nucleation events vertical extent: A long term study at two different altitude sites. Atmos Chem Phys 2011;11:5625–39. [CrossRef]
- Bravo A, Urone P. The altitude: A fundamental parameter in the use of air quality standards. J Air Pollut Control Assoc 1981;31:264–5. [CrossRef]
- Bravo Alvarez H, Sosa Echeverria R, Sanchez Alvarez P, Krupa S. Air Quality Standards for Particulate Matter (PM) at high altitude cities. Environmental Pollution 2013;173:255–6. [CrossRef]
- Burtscher, M. Effects of Living at Higher Altitudes on Mortality: A Narrative Review. Aging Dis 2013;5:274. [CrossRef]
- Bury, J. Mining Migrants: Transnational Mining and Migration Patterns in the Peruvian Andes. The Professional Geographer 2007;59:378–89. [CrossRef]
- Carvalho, H. The air we breathe: differentials in global air quality monitoring. Lancet Respir Med 2016;4:603–5. [CrossRef]
- China. Guidelines for Design of Ventilation of Highway Tunnels (JTG/T D70/2-02-2014). 2014.
- Cogo A. The lung at high altitude. Multidiscip Respir Med 2011;6:14–5. [CrossRef]
- Collier CR, Goldsmith JR. Interactions of carbon-monoxide and hemoglobin at high-altitude. Atmos Environ 1983;17:723–8. [CrossRef]
- CONDESAN. Sustainable Mountain Development in the Andes. Lima: 2012.
- Crow LW. Meteorological and climatological factors affecting Denver air quality. Atmospheric Environment (1967) 1979;13:1472–3. [CrossRef]
- Dame J, Schmidt S, Müller J, Nüsser M. Urbanization and socio-ecological challenges in high mountain towns: Insights from Leh (Ladakh), India. Landsc Urban Plan 2019;189:189–99. [CrossRef]
- Ding Y, Shi B, Su G, Li Q, Meng J, Jiang Y, et al. Assessing Suitability of Human Settlements in High-Altitude Area Using a Comprehensive Index Method: A Case Study of Tibet, China. Sustainability 2021;13:1485. [CrossRef]
- Dons E, Int Panis L, Van Poppel M, Theunis J, Wets G. Personal exposure to Black Carbon in transport microenvironments. Atmos Environ 2012;55:392–8. [CrossRef]
- Dordević DS, Šolević TM. The contributions of high- and low altitude emission sources to the near ground concentrations of air pollutants. Atmos Res 2008;87:170–82. [CrossRef]
- Dzhalilova D, Makarova O. Differences in Tolerance to Hypoxia: Physiological, Biochemical, and Molecular-Biological Characteristics. Biomedicines 2020;8:428. [CrossRef]
- Ebi KL, McGregor G. Climate Change, Tropospheric Ozone and Particulate Matter, and Health Impacts. Environ Health Perspect 2008;116:1449–55. [CrossRef]
- Ehrlich D, Melchiorri M, Capitani C. Population trends and urbanization in mountain ranges of the world. Land (Basel) 2021;10:1–19. [CrossRef]
- Feng R, Wang K, Wang F. Quantifying influences of administrative division adjustment on PM2.5 pollution in China’s mega-urban agglomerations. J Environ Manage 2022;302:113993. [CrossRef]
- Feng T, Sun Y, Shi Y, Ma J, Feng C, Chen Z. Air pollution control policies and impacts: A review. Renewable and Sustainable Energy Reviews 2024;191:1–16. [CrossRef]
- Foutch RG, Henrichs W. Carbon monoxide poisoning at high altitudes. American Journal of Emergency Medicine 1988;6:596–8. [CrossRef]
- Fowler D, Brimblecombe P, Burrows J, Heal MR, Grennfelt P, Stevenson DS, et al. A chronology of global air quality: The development of global air pollution. Philosophical Transactions of the Royal Society A: Mathematical, Physical and Engineering Sciences 2020;378. [CrossRef]
- Giraldo M, Huertas JI. Real emissions, driving patterns and fuel consumption of in-use diesel buses operating at high altitude. Transp Res D Transp Environ 2019;77:21–36. [CrossRef]
- Goddard WB, Goddard CB. Ambient Air Quality Standard-Altitude Corrections. Engineering - Environmental Studies 1979. [CrossRef]
- Greksa LP, Spielvogel H, Paz-Zamora M, Caceres E, Paredes-Fernández L. Effect of altitude on the lung function of high altitude residents of European ancestry. Am J Phys Anthropol 1988;75:77–85. [CrossRef]
- Grimminger J, Richter M, Tello K, Sommer N, Gall H, Ghofrani HA. Thin Air Resulting in High Pressure: Mountain Sickness and Hypoxia-Induced Pulmonary Hypertension. Can Respir J 2017;2017:8381653. [CrossRef]
- Guo Y, Xing Z, Shan G, Janssens JP, Sun T, Chai D, et al. Prevalence and Risk Factors for COPD at High Altitude: A Large Cross-Sectional Survey of Subjects Living Between 2,100–4,700 m Above Sea Level. Front Med (Lausanne) 2020;7. [CrossRef]
- Hancco I, Bailly S, Baillieul S, Doutreleau S, Germain M, Pépin JL, et al. Excessive Erythrocytosis and Chronic Mountain Sickness in Dwellers of the Highest City in the World. Front Physiol 2020;11:773. [CrossRef]
- Health Effects Institute. State of Global Air 2024. Boston: 2024.
- Herrmann E, Weingartner E, Henne S, Vuilleumier L, Bukowiecki N, Steinbacher M, et al. Analysis of long-term aerosol size distribution data from Jungfraujoch with emphasis on free tropospheric conditions, cloud influence, and air mass transport. Journal of Geophysical Research: Atmospheres 2015;120:9459–80. [CrossRef]
- Horiuchi M, Kirihara Y, Fukuoka Y, Pontzer H. Sex differences in respiratory and circulatory cost during hypoxic walking: potential impact on oxygen saturation. Sci Rep 2019;9. [CrossRef]
- Jiang Z, Niu H, Jia Z, Wu L, Zhang Q, Zhang Y, et al. Comparison of vehicular emissions at different altitudes: Characteristics and policy implications. Environmental Pollution 2025;367:125679. [CrossRef]
- Jonidi Jafari A, Charkhloo E, Pasalari H. Urban air pollution control policies and strategies: a systematic review. J Environ Health Sci Eng 2021;19:1911–40. [CrossRef]
- Kim KH, Kabir E, Kabir S. A review on the human health impact of airborne particulate matter. Environ Int 2015;74:136–43. [CrossRef]
- Kitagishi H, Mao Q. Capture of carbon monoxide using a heme protein model: from biomimetic chemistry of heme proteins to physiological and therapeutic applications. Polymer Journal 2021 54:4 2021;54:465–72. [CrossRef]
- Kutlar Joss M, Eeftens M, Gintowt E, Kappeler R, Künzli N. Time to harmonize national ambient air quality standards. Int J Public Health 2017;62:453–62. [CrossRef]
- Leigh-Smith, S. Carbon Monoxide Poisoning in Tents-A Review. Wilderness Environ Med 2004;15:163. [CrossRef]
- Li C, Chen P, Kang S, Yan F, Hu Z, Qu B, et al. Concentrations and light absorption characteristics of carbonaceous aerosol in PM2.5 and PM10 of Lhasa city, the Tibetan Plateau. Atmos Environ 2016;127:340–6. [CrossRef]
- Li C, Han X, Kang S, Yan F, Chen P, Hu Z, et al. Heavy near-surface PM2.5 pollution in Lhasa, China during a relatively static winter period. Chemosphere 2019;214:314–8. [CrossRef]
- Li Y, Frandsen KM, Guo W, Lu Y, Hvelplund MH, Suolang B, et al. Impact of altitude on the dosage of indoor particulates entering an individual’s small airways. J Hazard Mater 2024;468:133856. [CrossRef]
- Liu Z, Cui H, Zhao L, Ma F, Liu Y, Chen Y, et al. Effects of Plateau Air Quality and Low Oxygen Content on Platelet mtDNA Methylation and High Altitude Pulmonary Edema. Aerosol Air Qual Res 2021;21:210222. [CrossRef]
- López Jové OR, Arce SC, Chávez RW, Alaniz A, Lancellotti D, Chiapella MN, et al. Spirometry reference values for an andean high-altitude population. Respir Physiol Neurobiol 2018;247:133–9. [CrossRef]
- Luan W, Li X. Rapid urbanization and its driving mechanism in the Pan-Third Pole region. Science of The Total Environment 2021;750:141270. [CrossRef]
- Madueño L, Kecorius S, Andrade M, Wiedensohler A. Exposure and Respiratory Tract Deposition Dose of Equivalent Black Carbon in High Altitudes. Atmosphere (Basel) 2020;11. [CrossRef]
- Mardoñez V, Pandolfi M, Borlaza LJS, Jaffrezo J-L, Alastuey A, Besombes J-L, et al. Source apportionment study on particulate air pollution in two high-altitude Bolivian cities: La Paz and El Alto. Atmos Chem Phys 2023;23:10325–47. [CrossRef]
- Martínez J, Robles L, Montalvo F, Baño Morales D, Zambrano I. Effects of altitude in the performance of a spark ignition internal combustion engine. Mater Today Proc, vol. 49, Elsevier Ltd; 2022, p. 72–8. [CrossRef]
- Masiol M, Formenton G, Visin F, Bonetto A, Rovea M, Ficotto S, et al. Sources of wintertime PM2.5 at a major city in an Alpine Valley: The role of atmospheric dispersion and inversion dynamics. Atmos Environ 2024;330:120556. [CrossRef]
- McGrath JJ. Carbon monoxide studies at high altitude. Neurosci Biobehav Rev 1988;12:311–4. [CrossRef]
- Milledge JS. The Control of Breathing at High Altitude. University of Birmingham, 1968.
- Moore LG. Human Genetic Adaptation to High Altitude. High Alt Med Biol 2001;2:257–79. [CrossRef]
- Nazarenko Y, Pal D, Ariya PA. Air quality standards for the concentration of particulate matter 2.5, global descriptive analysis. Bull World Health Organ 2021;99:125–37. [CrossRef]
- Nejad MT, Kamran ·, Ghalehteimouri J, Talkhabi H, Dolatshahi Z. The relationship between atmospheric temperature inversion and urban air pollution characteristics: a case study of Tehran, Iran. Discover Environment 2023 1:1 2023;1:1–15. [CrossRef]
- Neumann P. Toxic Talk and Collective (In)action in a Company Town: The Case of La Oroya, Peru. Soc Probl 2016;63:431–46. [CrossRef]
- Ning G, Wang S, Ma M, Ni C, Shang Z, Wang J, et al. Characteristics of air pollution in different zones of Sichuan Basin, China. Science of The Total Environment 2018;612:975–84. [CrossRef]
- Ning Z, He S, Liao X, Ma C, Wu J. Cold waves and fine particulate matter in high-altitude Chinese cities: assessing their interactive impact on outpatient visits for respiratory disease. BMC Public Health 2024a;24:1–10. [CrossRef]
- Ning Z, Ma Y, He S, Li G, Xu Y, Wang Z, et al. High altitude air pollution and respiratory disease: Evaluating compounded exposure events and interactions. Ecotoxicol Environ Saf 2024b;285:117046. [CrossRef]
- Ortiz-Prado E, Encalada S, Mosquera J, Simbaña-Rivera K, Gomez-Barreno L, Duta D, et al. A comparative analysis of lung function and spirometry parameters in genotype-controlled natives living at low and high altitude. BMC Pulm Med 2022;22:1–10. [CrossRef]
- Pareja A, Hinojosa M, Luján M. Inventario de Emisiones Atmosféricas Contaminantes de la Ciudad de Cochabamba, Bolivia, año 2008. Acta Nova 2011;5:344–74.
- Patel S, Jose A, Mohiuddin SS. Physiology, Oxygen Transport And Carbon Dioxide Dissociation Curve. StatPearls 2023.
- Qi Z, Gu M, Cao J, Zhang Z, You C, Zhan Y, et al. The Effects of Varying Altitudes on the Rates of Emissions from Diesel and Gasoline Vehicles Using a Portable Emission Measurement System. Atmosphere 2023, Vol 14, Page 1739 2023;14:1739. [CrossRef]
- Ravindra K, Singh V, Mor S. Why we should have a universal air quality index? Environ Int 2024;187. [CrossRef]
- Savioli G, Ceresa IF, Gori G, Fumoso F, Gri N, Floris V, et al. Pathophysiology and Therapy of High-Altitude Sickness: Practical Approach in Emergency and Critical Care. J Clin Med 2022;11:3937. [CrossRef]
- Saxena P, Sonwani S. Primary Criteria Air Pollutants: Environmental Health Effects. Criteria Air Pollutants and their Impact on Environmental Health. 1st ed., Singapore: Springer; 2019, p. 49–82. [CrossRef]
- Sellegri K, Rose C, Marinoni A, Lupi A, Wiedensohler A, Andrade M, et al. New particle formation: A review of ground-based observations at mountain research stations. Atmosphere (Basel) 2019;10. [CrossRef]
- Shairsingh K, Ruggeri G, Krzyzanowski M, Mudu P, Malkawi M, Castillo J, et al. WHO air quality database: relevance, history and future developments. Bull World Health Organ 2023;101:800–7. [CrossRef]
- Silva RA, West JJ, Zhang Y, Anenberg SC, Lamarque JF, Shindell DT, et al. Global premature mortality due to anthropogenic outdoor air pollution and the contribution of past climate change. Environmental Research Letters 2013;8:034005. [CrossRef]
- Slessarev M, Mardimae A, Preiss D, Vesely A, Balaban DY, Greene R, et al. Differences in the control of breathing between Andean highlanders and lowlanders after 10 days acclimatization at 3850 m. J Physiol 2010;588:1607. [CrossRef]
- Song Q, Zhang N, Zhang Y, Yin D, Hao J, Wang S, et al. The development of local ambient air quality standards: A case study of Hainan Province, China. Eco-Environment and Health 2024;3:11–20. [CrossRef]
- Spieler Paula. The La Oroya Case: the Relationship Between Environmental Degradation and Human Rights Violations. Human Rights Brief 2010;18:19–23.
- Spracklen D V., Carslaw KS, Kulmala M, Kerminen VM, Sihto SL, Riipinen I, et al. Contribution of particle formation to global cloud condensation nuclei concentrations. Geophys Res Lett 2008;35. [CrossRef]
- Storz JF. High-Altitude Adaptation: Mechanistic Insights from Integrated Genomics and Physiology. Mol Biol Evol 2021;38:2677–91. [CrossRef]
- Sullivan KM, Mei Z, Grummer-Strawn L, Parvanta I. Haemoglobin adjustments to define anaemia. Tropical Medicine & International Health 2008;13:1267–71. [CrossRef]
- Tahoe Regional Planning Agency. Lake Tahoe Info | Highest 8-Hour Average Concentration of Carbon Monoxide. TRPA 2021. Available online: https://www.laketahoeinfo.org/Indicator/Detail/64/Overview (accessed on 30 January 2025).
- Teboul JL, Scheeren T. Understanding the Haldane effect. Intensive Care Med 2017;43:91–3.
- Torres-Duque CA, Alí-Munive A, Severiche-Bueno D, Durán-Silva M, Aguirre-Franco CE, González-Florez A, et al. Tropical high altitude and severe asthma in adults: house dust mite sensitization and phenotypic distribution. Journal of Asthma 2024;61:222–31. [CrossRef]
- Tremblay JC, Ainslie PN. Global and country-level estimates of human population at high altitude. Proc Natl Acad Sci USA 2021;118:e2102463118. [CrossRef]
- UNEP. Regulating Air Quality: The first global assessment of air pollution legislation. 2021. Available online: https://www.unep.org/resources/report/regulating-air-quality-first-global-assessment-air-pollution-legislation (accessed on 8 April 2025).
- UNEP. Air Quality Policies in Bolivia (Plurinational state of) 2016. Available online: https://www.unep.org/resources/policy-and-strategy/air-quality-policies-bolivia-plurinational-state (accessed on 10 February 2025).
- U.S. EPA. NAAQS Table | US EPA. Environmental Protection Agency 2024. Available online: https://www.epa.gov/criteria-air-pollutants/naaqs-table (accessed on 30 January 2025).
- U.S. EPA. Altitude as a factor in air pollution. Washington, D.C.: 1978.
- US standard Atmosphere. NASA-TM-X-74335. 1976. Available online: https://ntrs.nasa.gov/archive/nasa/casi.ntrs.nasa.gov/19770009539.pdf (accessed on 25 November 2024).
- Vahlsing C, Smith KR. Global review of national ambient air quality standards for PM10 and SO2 (24 h). Air Qual Atmos Health 2012;5:393–9. [CrossRef]
- Vargas MH, Becerril-Ángeles M, Medina-Reyes IS, Rascón-Pacheco RA. Altitude above 1500 m is a major determinant of asthma incidence. An ecological study. Respir Med 2018;135:1–7. [CrossRef]
- Velásquez MT. El hombre nativo de las grandes alturas. Estudios fisiológicos en los andes peruanos. 1st ed. Lima: Instituto Nacional de Salud.; 2013.
- Venzac H, Sellegri K, Villani P, Picard D, Laj P. Seasonal variation of aerosol size distributions in the free troposphere and residual layer at the puy de Dome station, France. Atmos Chem Phys 2009;9:1465–78. [CrossRef]
- Vilcassim R, Thurston GD. Gaps and future directions in research on health effects of air pollution. EBioMedicine 2023;93:104668. [CrossRef]
- Villanueva Mercado A. Proyecto de ley N° 756/2016-CR. Perú: Congreso de la Republica; 2016.
- Wang CH, Shi GY, Du LT, Ni XL, Hu Y, Pang DB, et al. The source of volatile organic compounds pollution and its effect on ozone in high-altitude areas. Ecotoxicol Environ Saf 2024;286:117221. [CrossRef]
- Wang Z, Tan Y, Guo M, Cheng M, Gu Y, Chen S, et al. Prospect of China’s ambient air quality standards. Journal of Environmental Sciences 2023;123:255–69. [CrossRef]
- Warthon Ascarza JL. Obtención de un factor de ajuste de los estándares de calidad del aire para material particulado en función de la altitud. Universidad Nacional de San Agustín, 2023.
- Weitz CA, Garruto RM, Chin CT. Larger FVC and FEV1 among Tibetans compared to Han born and raised at high altitude. Am J Phys Anthropol 2016;159:244–55. [CrossRef]
- WHO. Billions of people still breathe unhealthy air: new WHO data 2022. Available online: https://www.who.int/news/item/04-04-2022-billions-of-people-still-breathe-unhealthy-air-new-who-data (accessed on 16 October 2024).
- WHO. WHO global air quality guidelines. Particulate matter (PM2.5 and PM10), ozone, nitrogen dioxide, sulfur dioxide and carbon monoxide. 2021.
- WHO. Guidelines for Air Quality. Geneva: 2000.
- Wiedensohler A, Andrade M, Weinhold K, Müller T, Birmili W, Velarde F, et al. Black carbon emission and transport mechanisms to the free troposphere at the La Paz/El Alto (Bolivia) metropolitan area based on the Day of Census (2012). Atmos Environ 2018;194:158–69. [CrossRef]
- Woody AI. How is the Ideal Gas Law Explanatory? Sci Educ (Dordr) 2013;22:1563–80. [CrossRef]
- Wooley D, Leiter A, Salgado M, Zalzal P. EPA’s New Particulate Matter Standard. Environmental Law Reporter 2024;54.
- World Health Organization. Air quality guidelines. Global update 2005: Particulate matter, ozone, nitrogen dioxide, and sulfur dioxide. World Health Organization; 2006.
- Wu T. The Qinghai–Tibetan Plateau: How High Do Tibetans Live? High Alt Med Biol 2001;2:489–99. [CrossRef]
- Wuyam B, Baillieul S, Doutreleau S, Vergès S. Adaptation à l’altitude dans les maladies respiratoires. Rev Mal Respir 2022;39:26–33. [CrossRef]
- Yan G, Wang M, Qin P, Yan T, Li K, Wang X, et al. Field measurements of vehicle pollutant emissions in road tunnels at different altitudes. Tunnelling and Underground Space Technology 2021;118. [CrossRef]
- Yu R, Lin Y, Zou J, Dan Y, Cheng C. Review on Atmospheric Ozone Pollution in China: Formation, Spatiotemporal Distribution, Precursors and Affecting Factors. Atmosphere (Basel) 2021;12:1675. [CrossRef]
- Zhang K, Ba M, Meng H, Sun Y, Shi H. Correlation Analysis of City Air Quality in Henan Province. DEStech Transactions on Computer Science and Engineering 2018. [CrossRef]
- Zhang W, Xu H, Yu X, Li J, Zhang Y, Dai R, et al. Rigorous Regional Air Quality Standards for Substantial Health Benefits. Earths Future 2023;11:e2023EF003860. [CrossRef]
- Zhao Y, Tan Y, Feng S. Does reducing air pollution improve the progress of sustainable development in China? J Clean Prod 2020;272:122759. [CrossRef]
Figure 1.
PRISMA Flowchart recommendations with reviewed information.
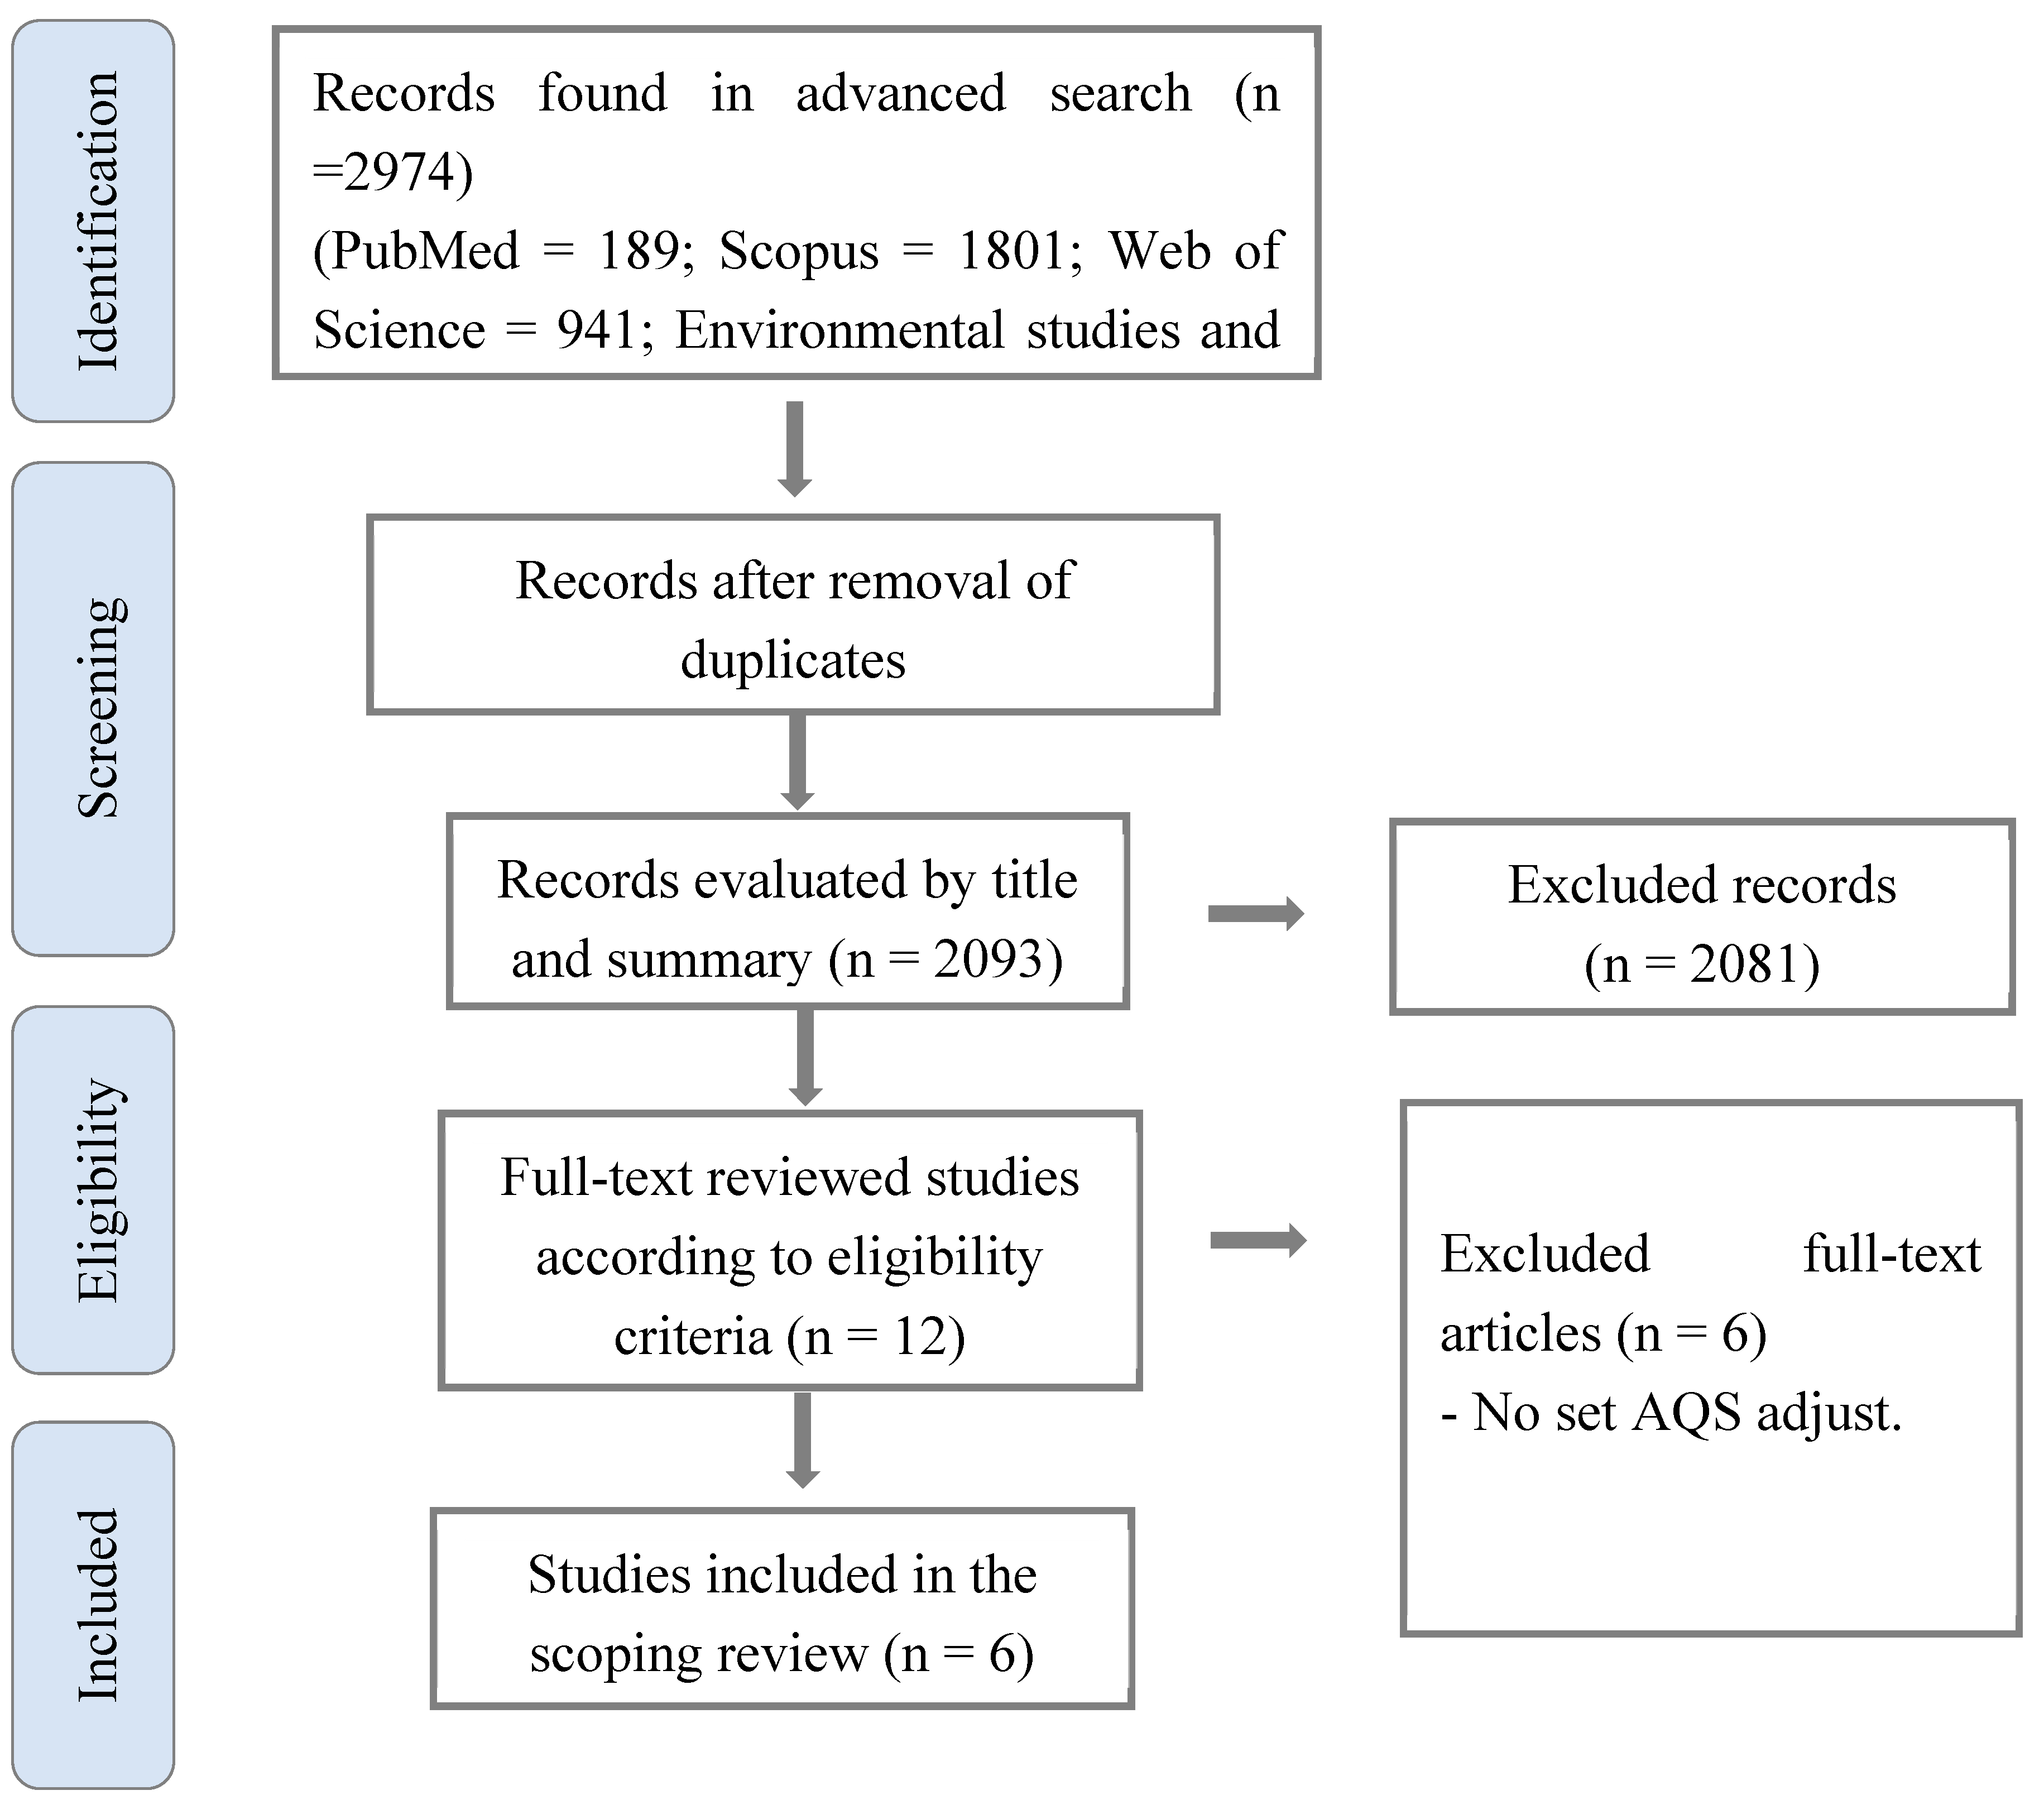
Figure 1.
Global distribution of population living at altitudes ≥3,500 m (log₁₀ scale). The three countries with the largest populations at this altitude are China, Peru, and Bolivia. Data sourced from Tremblay and Ainslie, 2021..
Figure 1.
Global distribution of population living at altitudes ≥3,500 m (log₁₀ scale). The three countries with the largest populations at this altitude are China, Peru, and Bolivia. Data sourced from Tremblay and Ainslie, 2021..
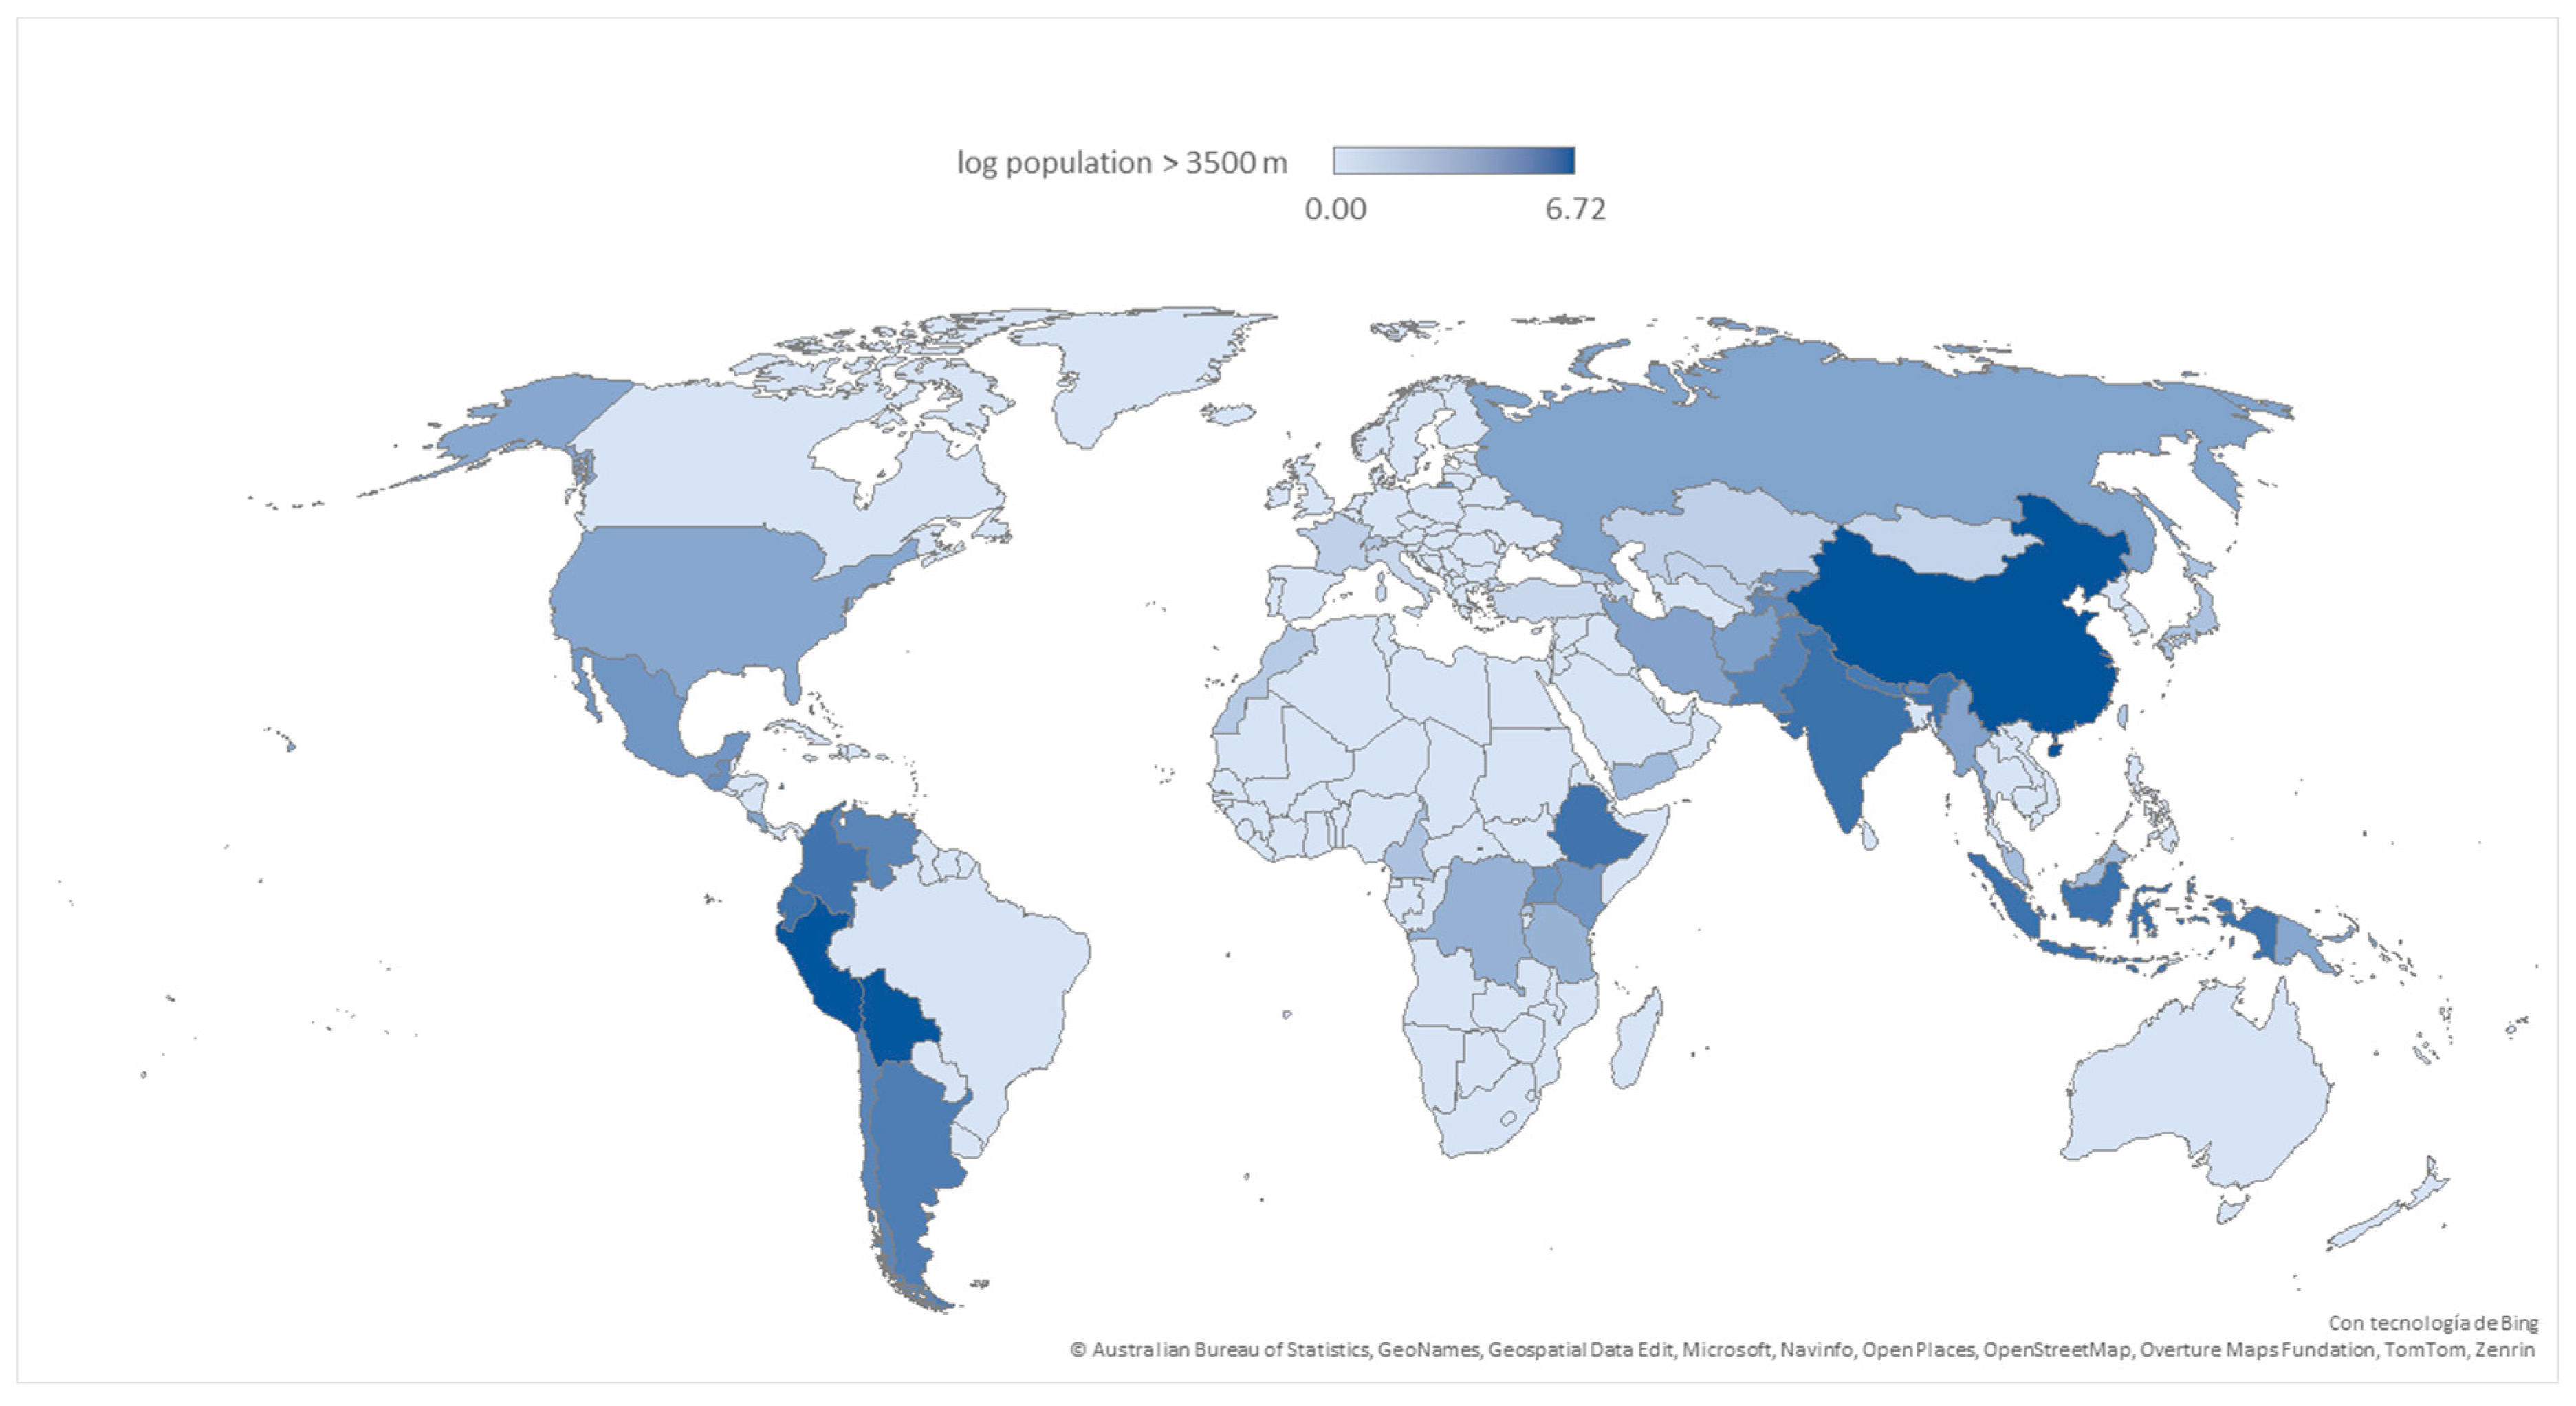

Table 1.
Principles and model strategies for proposed AQS adjustment.
| Author, year and country | Addressed pollutant & Developed methodology |
Rationale of proposed | Model calculation for AQS adjust |
|---|---|---|---|
| Goddard and Goddard, 1979 USA-1979 |
|
Concentration conversion by change of pressure and temperature. | |
| Bravo and Urone, 1981- Mexico |
|
Hyperventilation at altitude increase risk of pollutant exposure. | |
| Collier and Goldsmith, 1983- USA |
|
Less oxygen partial pressure at altitude increases risk of carboxyhemoglobin | Coburn, Forster and Kane () Equation |
| Madueño et al., 2020 - Germany |
|
Hyperventilation at altitude increase risk of pollutant exposure |
Where: C: concentration, MV: minute ventilation, △t: exposure time |
| Bravo Alvarez et al., 2013 - Mexico |
|
General gas law. Volume concentration change at different pressure and temperature |
Where: C: concentration, P: pressure, T: temperature. L: local and St: Standard |
| Yan et al., 2021 - China |
|
Low oxygen content and ambient pressure can influence the vehicle pollutant emissions |
Where: f is the altitude coefficient; Eo is the base emission factor and E is altitude emission factor |
Table 2.
Particulate matter AQS for countries with larger population living in altitude above 3500 m a.s.l.
Table 2.
Particulate matter AQS for countries with larger population living in altitude above 3500 m a.s.l.
| Contaminant | Average time | Bolivia | Peru | China | Guide WHO 2021 | |
| Permissible Air Quality Limits1 | Maximum limits for atmospheric pollutants 2 | Air Quality Standards3 | Ambient air quality standards 4 | |||
| PM2.5, µg/m3 | Annual | -- | 10 | 25 | Class I: 15 | 5 |
| Class II: 35 | ||||||
| 24 hours | -- | 25 | 50 | Class I: 35 | 15 | |
| Class II: 75 | ||||||
| PM10, µg/m3 | Annual | 50 | 20 | 50 | Class I: 40 | 15 |
| Class II: 70 | ||||||
| 24 hours | 150 | 50 | 100 | Class I: 50 | 45 | |
| Class II: 150 | ||||||
| Total suspended particles, µg/m3 | Annual | 75 | 75 | -- | -- | -- |
| 24 hours | 260 | -- | -- | -- | -- | |
|
Ozone, |
1 hour | 236 | -- | -- | Class I: 160 | -- |
| Class II: 200 | ||||||
| 8 hours | -- | 100 | 100 | Class I: 100 | 100 | |
| Class II: 160 | ||||||
| Annual | -- | 60 | -- | -- | -- | |
| µg/m3 | 1 hour | 400 | 200 | 200 | 200 | -- |
| 24 hours | 150 | 150 | -- | 80 | 25 | |
| Annual | --- | 40 | 100 | 40 | 10 | |
1 Regulations on Air Pollution. Environmental Law No. 1333, 2 Bolivian Standard NB 62011:2018, NB 62014:2018 and 62018:2018 of IBNORCA, 3 Ministerial Resolution No. 94-2017-MINAM, 4 GB 3095-2012 standard.
Disclaimer/Publisher’s Note: The statements, opinions and data contained in all publications are solely those of the individual author(s) and contributor(s) and not of MDPI and/or the editor(s). MDPI and/or the editor(s) disclaim responsibility for any injury to people or property resulting from any ideas, methods, instructions or products referred to in the content. |
© 2025 by the authors. Licensee MDPI, Basel, Switzerland. This article is an open access article distributed under the terms and conditions of the Creative Commons Attribution (CC BY) license (http://creativecommons.org/licenses/by/4.0/).
Copyright: This open access article is published under a Creative Commons CC BY 4.0 license, which permit the free download, distribution, and reuse, provided that the author and preprint are cited in any reuse.


