Submitted:
03 May 2025
Posted:
05 May 2025
You are already at the latest version
Abstract
When developing a topical formulation, it is essential to evaluate it from the perspective of its carrier capacity for the controlled release of the encapsulated drug. The drug should be simply quantified through an accurate and reproducible method. This paper presents a rapid, simple, sensitive, and reproducible high-performance liquid chromatography method with UV detection for evaluating the ability of chitosan-graft-β-cyclodextrin/PVA (CS-g-β-CD/PVA) hydrogels as carriers for the controlled release of vemurafenib (VEM). The chromatographic separation was achieved using a Waters CORTECS C18 column (100 × 2.1 mm ID, 2.7 µm). The mobile phase was a mixture of: A (water/formic acid - 99.9/0.1, v/v), B (acetonitrile), and C (methanol) in the ratio of 40:55:5 (v/v/v). The injection sample amount was 10 μL, and the run time was 9 minutes in isocratic mode at a flow rate of 1 mL/min. The analyte was detected using UV absorption at 252 nm. The standard calibration curve was linear over the concentration range of 0.78-100 mg/L. The values for LOD and LOQ were 0.5 mg/L and 0.75 mg/L, respectively. The intra- and inter-day precision of measurements were lower than the accepted criteria (RSD ≤ 2%). The high value of recoveries obtained for VEM indicates that the proposed method was found to be accurate. The stability of VEM solutions was assessed, indicating that the drug remained stable under all relevant conditions. Finally, the validated method was successfully applied to evaluate the ability of chitosan-graft-β-cyclodextrin/PVA hydrogels to load and sustain release of VEM. The drug entrapment efficiency (DEE%) was between 65±0.08% and 70±0.05%.
Keywords:
vemurafenib
; sustained release
; drug delivery system
; HPLC-UV method
; drug targeting
1. Introduction
Melanoma, the most aggressive variant of skin cancer, exhibits a rising trend in morbidity and mortality indicators worldwide [1]. Consequently, it poses a significant threat to global health, characterized by limited treatment options and potential side effects. The currently available strategies for the treatment of this type of cancer include surgery, radiotherapy, chemotherapy, immunotherapy and targeted therapy [2]. Surgical resection of the tumor with adequate margins is the first-line treatment [3], however a significant risk of incomplete removal of the tumor and occurrence of surgical complications still remains. These can cause a series of pathophysiological processes that can subsequently trigger tumor recurrence and the appearance of metastases induced by surgical intervention [4]. Yet, for some patients at stages II, III and IV, surgery alone has limited curative potential [5].
Thus, radiotherapy, chemotherapy, immunotherapy or targeted therapy are often used as adjuvant treatments. Melanoma is a relatively radioresistant tumor, therefore, radiotherapy is widely used as a palliative treatment for metastatic melanoma [6,7]. Chemotherapy remains a therapeutic option for the management of melanoma, but it does not show specificity for tumor cells and, consequently, the accumulation of drugs in the tumor microenvironment is low [8]. Thus, the therapeutic benefits are limited [9] and the prevalence of side effects is high, necessitating the exploration of novel treatment alternatives. Immunotherapy employing the four classes of monoclonal antibodies aims to stimulate and activate the immune system [10]; nevertheless, a large percentage of patients exhibit both innate and acquired resistance resulting in a lack of response to this therapeutic approach.
Targeted therapy is highly effective in treating advanced melanomas when the cancer cells have certain genetic alterations. Half of all melanomas exhibit changes in the BRAF gene. Vemurafenib (VEM) was the first drug approved by the Food and Drug Administration (FDA) and European Medicines Agency (EMA) for metastatic and unresectable melanoma [11] and Erdheim-Chester disease (ECD) associated with BRAFV600 mutation [12]. Clinically, VEM is administered orally, but it is accompanied by a high rate of side effects as liver injury, kidney failure, changes in heart rhythm, muscle, bone, and connective tissue disease. In addition, the drug must pass through the acidic environment of the stomach and the intestinal mucus barrier to reach its target. Many active substances are denatured or degraded by stomach acid and some drugs, especially hydrophobic ones, can be easily trapped by mucus and, as a result, are rapidly eliminated before they can be absorbed by the intestine [13]. To avoid the gastric and intestinal barrier and to reduce toxicity risks, the potential of topical administration of VEM has been explored [14,15]. The skin serves as a suitable route for the topical delivery of drugs intended for localized effects [16]. Administration of vemurafenib by skin is challenging due to its low solubility [17] and the presence of stratum corneum [18], which prevents the penetration of macromolecular drugs into the body. The specialized literature mentions the attempt of topical application of VEM in the form of solid-in-oil nanodispersion as an effective and safe way to deliver VEM but only in the early stage of melanoma [19]. Hydrogels are one of the common drug delivery systems for the skin [18,20] and have garnered high interest due to their remarkable characteristics and applications in the biomedical field during the past decade [21,22,23]. Despite their advantages, there are a number of challenges regarding the potential use of hydrogels in this field. These challenges refer to drug loading, release control, skin permeability efficiency, and long-term stability. The nature of the polymers in the matrix structure plays an important role, as the functional groups on the polymer surface influence the drug loading capacity and their release behavior, specificity, and safety. Also, the hydrogel's composition significantly influences the drug's transdermal permeation. Considering all the aforementioned factors, we considered necessary to develop a novel formulation in the form of a thermosensitive hydrogel loaded with VEM for localized administration in melanoma treatment. For the synthesis of hydrogels, the use of biopolymers is the most common approach, with chitosan and cyclodextrins serving as versatile carriers for antitumor agents [24].
Chitosan (CS) is a biopolymer used due to its ability to form polymer networks that absorb significant quantities of water and biological fluids [25]. These properties are useful in loading drug solutions and absorbing skin exudates. Therefore, CS-based formulations are suitable for cutaneous application due to their hydrophilicity and flexibility [26] and for their attractive biological activity, antitumor, antioxidant, and antimicrobial effects [27,28]. Its cationic polymer can act as a penetration enhancer, being correlated with a certain anticancer activity which is also influenced by its molecular weight and degree of deacetylation [29].
Cyclodextrins (CDs) represent an attractive alternative for the development of carriers for anticancer therapeutics. They were used to design hydrogels as carriers and stabilizers for a large number of drug molecules [30,31]. Among them, β-cyclodextrin (β-CD) is highly advantageous owing to its low cost, effective cavity, lack of toxicity and can enhance the solubility and bioavailability of insoluble drugs [32]. The low aqueous solubility of many pharmaceutical developments is an area of constant research. VEM exhibits low aqueous solubility, which implies a poor absorption by the human body. Increasing its solubility is an important factor in increasing its efficacy. In addition, CDs used in the development of transdermal formulations positively influenced the release and/or permeability of the drug, stabilized the drug in the formulation or at the site of absorption, reduced local irritation induced by the drug, and supported the release of the drug from the vehicle [33].
Polyvinyl alcohol (PVA) is frequently utilized in drug delivery due to its superior adhesive characteristics, biocompatibility, and nontoxicity [34]. PVA has good chemical stability, forming stable complexes with various drugs to ensure their controlled and sustained release [35]. The addition of PVA leads to increased hydrogel porosity, significant mechanical stability, and faster drug release, which may have effective anticancer effects on melanoma cells [36].
The use of hydrogels based on CS, β-CD and PVA could represent an interesting approach to improve the skin release of oncology drugs. In this context, we designed VEM-loaded chitosan-graft-β-cyclodextrin/PVA hydrogels for the local treatment of melanoma [37]. β-Cyclodextrin-grafted chitosan functions as the structural component of the hydrogel that increases VEM solubility, controls drug release, and ensures biodegradability and compatibility, while polyvinyl alcohol (PVA) enhances mechanical properties. Enhancing the solubility and stability in water, the pharmacokinetic and pharmacodynamic profiles of VEM, along with the possibility of applying these hydrogels at the tumor site, could change the current therapeutic strategy for melanoma. Monitoring VEM from the sustained-release hydrogel is crucial to ascertain the efficacy of this prospective melanoma treatment.
High performance liquid chromatography (HPLC) has proven to be the predominant technology used in pharmaceutical laboratories worldwide to analyze various drug substances, because is a rapid, automated and high-throughput screening method. Various assays have been reported for the determination of VEM in bulk and biological matrices [38,39,40]. The other reported methods are sensitive, but they are quite complex and time consuming, rendering them unsuitable for routine analysis, as they require expensive or sophisticated instruments. Most refer to the coupling of liquid chromatography (LC) with mass spectrometry (MS) [41,42,43]. It is a useful and robust technique; yet it is not easily accessible and cost-effective routine analysis for pharmaceutical products. To our knowledge only two research regarding HPLC with ultraviolet (UV) detection methods for determination of VEM in plasma have been reported [44,45]. However, HPLC-UV method has not been reported for the determination of vemurafenib in polymer matrix. To monitor the necessary duration of drug availability (long and short term) and its release profile (continuous or pulsatile), accurate methods of analysis are required. This study aimed to develop and validate a simple, rapid and effective RP-HPLC method with UV detection for the mutated BRAF inhibitor vemurafenib. Full validation was performed, and the validated method was applied to evaluate the ability of chitosan-graft-β-cyclodextrin/PVA hydrogels to load and release sustained VEM.
2. Materials and Methods
2.1. Materials
Vemurafenib (VEM), the pharmaceutically active substance incorporated into the hydrogels (99.98% purity) was purchased from Sigma-Aldrich, St. Louis, MO, USA. Formic acid, acetonitrile and methanol of HPLC grade were purchased from Merck (Darmstadt, Germany). Ultrapure water was obtained with Milli-Q® Type 1 Ultrapure Water Systems (Merck, PA, USA). All the other chemicals and solvents used were of analytical grade.
2.2. Equipment
The high-pressure liquid chromatography (HPLC) system used in this study was Shimadzu Nexera LC-40-XR (Shimadzu, Kyoto, Japan). The system was equipped with a serial dual-plunger pump, an autosampler (SIL 40 XR), an SPD-40V series UV-Vis, and an RF-20Axs fluorescence detector (Shimadzu, Kyoto, Japan). Data were recorded and the system was controlled using the LabSolutionDB software 6.106SP1.
2.3. Method Development
2.3.1. Mobile Phase Optimization
Different mobile phase compositions were tested based on previously published articles [44,46]. Some modifications were implemented [38] to increase applicability under laboratory conditions, and we determined that the mobile phase would consist of a mixture of the following solvents: A (water/formic acid - 99.9/0.1, v/v), B (acetonitrile) and C (methanol). By varying the solvent ratios (30:55:15 (MP1); 50:40:10(MP2); 40:55:5 (MP3)), the appropriate proportions of the three solvents were studied to obtain an optimal resolution.
2.3.2. Column Optimization
The method was performed with various C18 columns, such as ODS column (4.6 × 200 mm, 10 µm) (Thermo Scientific, Vantaa, Finland), Xterra (4.6 × 100 mm, 5 µm), and Waters Cortecs column (2.1 × 100 mm, 2.7 μm) obtained from Waters, Milford, MA, US.
2.3.3. Determination of the Wavelength Corresponding to MAXIMUM absorption (λ max)
The standard solutions of VEM were scanned in the range of 200-400 nm to establish the wavelength at which VEM shows a maximum absorbance.
2.3.4. Determination of the Retention Time for VEM
To determine the retention time, two solutions with different VEM concentrations (8 and 12 mg/L) were prepared. A volume of 10 μL of each sample was injected and the retention time was determined.
2.3.5. Determination of the Flow Rate
To determine the optimal flow rate, VEM samples with known concentrations of 12 mg/L were prepared. A volume of 10 µL was injected, keeping the other parameters constant but varying the flow rate of the mobile phase.
2.4. Validation
Upon establishing the optimal analysis conditions, the method was validated by adhering to the following parameters: selectivity, linearity, limit of detection (LOD), limit of quantification (LOQ), precision (system precision, method precision, intermediate precision), and accuracy [47,48].
2.4.1. Selectivity
Since the hydrogels contain different components, specificity was attained by comparing the maximum retention time of VEM in the formulations with that in the standard solution.
2.4.2. Linearity
To determine the calibration curve for VEM, a stock solution of VEM was prepared by dissolving 0.002 g of pure drug in 10 mL of acetonitrile, brought into a 10 mL volumetric flask. Successive dilutions were performed in the 0.78125-100 mg/L range of concentrations. Each standard solution was analyzed in triplicate.
2.4.3. Limit of Detection (LOD) and Limit of Quantification (LOQ)
Limit of detection and limit of quantification were determined based on the standard deviation of the same concentration and calculated by relations (1) and (2):
where, SD - standard deviation of the response of the curve, and S - Slope.
LOD = 3.3 (SD/S)
LOQ = 10 (SD/S)
2.4.4. System Suitability
Chromatographic system suitability study was done by injecting 6 times consecutively 10 mg/L of VEM standard solution. Injection repeatability, reflected in the invariability of both peak area and retention times, defined the accuracy of the system. The capacity factor, tailing factor, and theoretical plates were also evaluated.
2.4.5. Method Precision
It was done by estimating the corresponding responses three times on the same day and on three different days (first, second, and fifth day) for three different VEM concentration levels (40, 50, 60 mg/L). Each concentration level was analyzed in triplicate.
2.4.6. Accuracy
To determine the accuracy (precision) of the HPLC method for determining VEM, the addition method was used: in a solution containing a known amount of standard, volumes of VEM solution were introduced to obtain concentrations of 80%, 100% and 120% compared to the concentration of the solution that was tested (50 mg/L). For each concentration level, three samples were prepared and analyzed, experimentally measuring the peak areas. The recovery was determined as a percentage of the theoretical concentration value.
2.4.7. Robustness
The robustness was studied by testing the influence of small changes in flow rate (±0.2 mL/min), wavelength (±2 nm), and temperature (±2°C).
2.4.8. Stability study
Freeze–thaw, short-term, and long-term stabilities of vemurafenib were determined according to the FDA guidelines [47,49,50]. The stability of the VEM solution was assessed by comparing the area for the standard solution preserved for various time intervals with the freshly prepared standard. For this study the low and high concentration from the calibration curve were used. The responses of VEM from the stock solutions in mobile phase after 24 h at ambient temperature, after 3 free-thaw cycles, and after 3 months of storage in the freezer (-30°C) were compared in triplicate to fresh stock solutions.
2.5. The HPLC–UV conditions for sample analysis
The chromatographic separation was carried out using a Waters Cortecs C18 column (2.1 × 100 mm, 2.7 μm). The column temperature was SET at 40°C. The mobile phase was a mixture of: A (water/formic acid - 99.9/0.1, v/v), B (acetonitrile) and C (methanol) in a ratio of 40:55:5 (v/v/v). The elution was set at 1 mL/min in isocratic mode. The detection of VEM was performed in UV at λmax = 252 nm. The injection sample amount was 10 μL. The quantitative and qualitative analysis of VEM was based on its retention time and peak areas, respectively.
2.6. Application to Hydrogels' Characterization
The validated method was used to evaluate the chitosan-graft-β-cyclodextrin/PVA hydrogels designed as carriers for the controlled release of vemurafenib.
2.6.1. Sample Preparation
Hydrogels were prepared by mixing the active substance solution with the vehicle solution as presented in our previous study [37].
2.6.2. Drug Loading Capacity (DL) and Drug Entrapment Efficiency (DEE%) of the Formulations
To quantify VEM content from the carrier, we weighed the hydrogel samples, dissolved them in a 50/50 (v/v) methanol/acetonitrile mixture in 2 mL capacity vials, and centrifuged them for 24 h. The supernatant was collected and filtered through a 0.22 μm filter. Then a volume of 10 μL of each sample was injected and analyzed using the HPLC method with UV-Vis detection at 252 nm. The DL capacity was calculated using Equation (3) derived from the calibration curve:
y = 45988∙x + 11405
The DEE% of VEM from the hydrogel was calculated with Equation (4).
DEE = Actual VEM content loaded in the matrix/Theoretical VEM content × 100
Determinations were made in triplicate, and results were reported as the mean of three independent experiments ± SD.
2.6.3. In vitro Drug Release Studies and Drug Release Kinetics
Drug release study of pure VEM and VEM from hydrogel was conducted by the dialysis membrane method. PBS pH = 6.8 was used as the release medium, maintained at 37 ± 0.5°C under continuous stirring at 50 rpm [51]. An aliquot of 1 ml was collected at predetermined intervals and replaced with fresh PBS solution. The drug quantification in each withdrawn sample was done by the HPLC method, as aforementioned. The concentration of VEM in each sample was estimated using the equation obtained from the calibration curve. The experiment was conducted three times, and the mean value was calculated. The cumulative quantity that was released was approximated as a percentage using the concentrations that were determined. The release profiles were fitted to various kinetic models for determining the release mechanism.
2.7. Statistical Analysis
The statistical analysis of all experimental data was conducted using IBM SPSS Statistics 25 software. The data were represented as the mean value accompanied by the standard deviation (SD). One-way Analysis of variance (ANOVA) was used, followed by a post hoc test (Tukey'sHSD test), to establish the statistical significance of the observed differences. The predetermined threshold of significance was set at p ≤ 0.05.
3. Results and Discussions
3.1. Optimization of Chromatographic Conditions
The method development procedure for drug quantification must follow some critical steps in order to be fully completed and accepted. It is important to develop a simple, rapid, reproducible, and sensitive method for VEM quantification. The following parameters were examined for the optimization of HPLC-UV analysis of VEM from the hydrogel: column, mobile phase, flow, retention time, and wavelength [52,53].
When selecting the mobile phase, its participation in the separation process along with the stationary phase was considered [54]. By varying the solvent ratios, convenient proportions of the three solvents, water/formic acid - 99.9/0.1 (v/v), acetonitrile, and methanol, were established to allow for optimal resolution. To further improve the peak shape, formic acid was added.
According to data presented in Figure 1, it was established that the best mobile phase with less retention time and a larger peak area was a mixture of water/formic acid - 99.9/0.1 (v/v), acetonitrile, and methanol in the ratio of 40:55:5 (v/v/v). Altering this ratio would result in a reduction in both the area and height of the peak, thereby diminishing the method's sensitivity. The analyte in isocratic elution was controlled by varying the mobile phase composition. The percentage of organic solvent in the mobile phase influenced the retention time of the analyte and significantly impacted selectivity [55]. Regarding the mobile phase elution program, an isocratic system was optimal for VEM separation.
The C18 column is recommended for reversed-phase analysis [56]. VEM separation was attempted with C18 columns packed with particles of different sizes. The ODS columns with the particle size of 10 µm did not effectively separate VEM. The C18 column with smaller particle sizes such as Xterra C18 (250 mm × 4 mm, 5 mm) gave partial separation. Waters CORTECS C18 column (2.1 × 100 mm, 2.7 μm) was found to be ideal, providing excellent peak shape and resolution at a flow rate of 1.0 mL/min. Since the retention time of VEM was also adequate, the column was selected as optimal for conducting the experiments. Another HPLC–UV method described by Zheng et coll. [57] for simultaneous quantification of vemurafenib and erlotinib in plasma used a C8 Xterra® MS column (250 mm × 4.6 mm, 5 µm).
Based on literature data, we chose 40°C as the working temperature [58]. Only one study reported a column temperature of 50°C [57].
Two samples of VEM with different concentrations (8 and 12 mg/L) were analyzed to determine the retention time (Tr). The obtained chromatograms are reproduced in Figure 2. The retention time for the analyzed samples was 6 min. The acceptance criteria states that a peak should appear at the retention time, but with different areas depending on the concentration.
The influence of the mobile phase flow rate on peak normalization was studied. To achieve optimal separation and to minimize the total analytical time, flow rates ranging from 0.5 to 2 mL/min were tested. It was observed that at identical concentrations, a reduction in flow rate resulted in an increased retention time along with a decrease in signal intensity. Conversely, when the flow rate was increased, a decrease in the intensity of the chromatographic peak was observed, although the retention time remained relatively unchanged (Figure 3). All this caused a decrease in the sensitivity of the method. The negative effect would also affect the calculation of LOD and LOQ, which are performance parameters of the method. According to Figure 3, the optimum flow rate was 1mL/min.
We selected the UV detection coupling because, from an analytical perspective, it is a gold standard analytical technology in the pharmaceutical industry [59]. The optimal wavelength for VEM was decided after recording the spectrum by the UV detector over the range from 190 to 400 nm. Based on the result (Figure 4), a maximum absorbance for VEM was observed at a wavelength of 252 nm, a finding corroborated by Vakhariya et al. [39]. This value was used for all validation tests and practical applications. Other studies reported for vemurafenib a maximum absorbance at 307 nm [60], 310 nm [13] and 249 nm [57], respectively.
3.2. Validation
3.2.1. Selectivity
The developed method was tested for possible interferences due to the polymer matrix. Six samples were analyzed to investigate the behavior of the matrix components. Figure 5 illustrates that no overlapping peaks were detected at the retention times of the VEM. The retention time of VEM from the sample peak was compared with that of the reference substance. The difference between the two retention times should be ±5% [48]. It was found that the retention time of VEM from the sample was 6.02 min, and of VEM for the reference solution was 6.0 min. The proposed method was selective as it effectively separates the peak corresponding to vemurafenib.
3.2.2. System Suitability
According to the validation guidelines, it is necessary to assess the performance of both the HPLC analytical instrument and the method prior to their application [48]. System suitability must be performed before and throughout all regulated assays. System precision was studied by analyzing a number of 6 successive measurements of the same sample (10 mg/L). In this test, the following parameters were investigated: Resolution (R), repeatability (RSD - relative standard deviations - of peak response and retention time), column throughput (N), and tailing factor (T). Considering the values presented in Table 1, it can be stated that the system was eligible.
3.2.3. Linearity, LOD, LOQ
To have a robust calibration line, a series of three replicates of each standard was analyzed using the developed method. To study the linear relationship between concentration of VEM (independent variable) and area (dependent variable), we used a least squares method [61]. The calibration graph was constructed in the range 0.78-100 mg/L (Table 2 and Figure 6). The regression equation was y = 45988∙x + 11405, where y denotes peak area and x the concentration of VEM (mg/L). The linearity of the method was excellent as evidenced by the value of the correlation coefficient (r2 = 0.9999). The response linearity is verified if the correlation coefficient is 0.99 or greater [53]. Also, the Fischer Test showed that Fcalculated = 19840.115 was greater than Ftabulated = 242.98 for a risk of 5% and 11 degrees of freedom, so the correlation ratio between the factorial variable (concentration) and the outcome variable (peak area) is significant. Limit of detection (LOD) and limit of quantification (LOQ) were also performed for VEM with the following results: LOD = 0.5 mg/L and LOQ = 0.75 mg/L. We chose to determine the LOD and LOQ based on the calibration curve because it is more scientifically satisfactory. The LOQ of the present study is 1.66 times lower than that of another previous HPLC-UV method [57] and approximately 4-fold higher than that previously reported with the LC–MS/MS method [38].
3.2.4. Intra- and Inter-Day Accuracy and Precision
The obtained accuracy and precision data are summarized in Table 3. The %RSD values found in the precision study (RSD < 2%) showed that the proposed method provides acceptable intra- and inter-day variations for VEM determination. To estimate the accuracy, the recovery was determined for a number of three samples at three different concentration levels. The proposed analysis method was accurate because the maximum value of RSD% was less than 2% and the recovery efficiency across the entire investigation range was within the range of 99.45-100.01%.
3.2.5. Robustness
The data obtained for the robustness study are presented in Table 4. The results showed that there were no significant changes in the chromatographic pattern when the above modifications were made in the experimental condition (the %RSD values were < 3). Therefore, the method was found to be robust with respect to variability in all robust conditions.
3.2.6. VEM Solution's Stability
The results of the stability study of VEM in mobile phase after different storage procedures are summarized in Table 5. No losses greater than 6.3% were recorded and the deviations found had low standard deviations. The samples could be submitted to further analysis without suffering degradation, the peak area values for VEM being relatively constant. The stability results can be considered satisfactory for the validation and are consistent with those previously reported for vemurafenib [38,40,57].
To evaluate the performance of the developed method, it was compared with other HPLC methods documented in the literature (Table 6). Methods coupled with mass spectrometry [38,41] provide superior sensitivity; nonetheless, they are more complex and require costly and advanced apparatus, rendering them impractical for routine analysis. Thus, it was observed that the linear range was close to other methods [38], and the LOQ had a lower value compared to some data in the literature [57,58] but it was fairly close to that reported with LC-MS/MS [38,41]. Analysis time was similar to that of some methods [57,62]. Most methods used C18 columns and isocratic elution at a flow rate of 1 mL/min. The mobile phase in most cases was a mixture of solvents represented by water-acetonitrile, water-methanol or methanol-acetonitrile in various proportions. Unlike other methods that determine VEM in pure form and from pharmaceutical and biological products, our method determined the drug substance in a polymer matrix.
3.2.7. The Capacity of Hydrogels in Loading and Releasing VEM
To show the applicability of the new method after the validation procedure, we investigated the ability of CS-g-β-CD/PVA hydrogels to load and release VEM sustainably. Drug loading has a significant impact on drug release from transdermal systems. The higher drug loading decreases the rate of diffusion to 50%. Lower drug loading leads to faster drug release.
The drug loading capacity (DL) of the developed formulations, namely CS-g-β-CD/PVA 25/70/5 and CS-g-β-CD/PVA 20/75/5, exhibited 5.7146 μg/mg and 5.7672 μg/mg VEM, respectively. The drug loading process of polymeric networks presented an influence dependent on the composition of hydrogels. It was observed an increase in the networks loading capacity with the decreasing of chitosan content.
The drug entrapment efficiency (DEE%) was between 65±0.08% and 70±0.05%. Those results indicated that both hydrogels exhibited very good DL and DEE% capacity, in line with previous evidence obtained for VEM [13]. The exact amounts and loading efficiencies are presented in Figure 7a and Figure 7b. The evaluation of dosage content homogeneity for topical transdermal preparations is mandated by the United States Pharmacopeia, which sets a maximum acceptability value of ±15% [64].
3.2.8. In Vitro Drug Release Analysis
CS-g-β-CD/PVA hydrogels with different mass ratios were studied in terms of their VEM release capacity by immersion in the release medium (phosphate buffer solution with pH = 6.8, at 37°C) using the validated HPLC method. The calculation of the amount of drug released was performed based on the equation of the calibration curve. The VEM release profiles under conditions that mimic the biological environment from polymer matrices are represented in Figure 8. The results indicated the prolonged release of VEM from the studied hydrogels when compared to the release of VEM from an industrial product. It was also found that by the increasing the CS concentration in polymer matrix decreased the VEM release rate from the matrix tablets.
According to Figure 8, the release process exhibited a relatively equally intense "burst effect" for the two systems studied. In the first 7 h, CS-g-β-CD/PVA+VEM 20/75/5 releasing around 61% and CS-g-β-CD/PVA+VEM 25/70/5 around 65%. The burst release of VEM might be determined by the presence of drug trapped on the hydrogel surface during the preparation process [65]. After that, the release of the drug progressively increases up to 10 hours for both matrices studied, reaching 87% and 91% of the incorporated VEM amount. This stage was followed by a slightly linear sustained release profile with the release of 10% and 12% of the incorporated drug. The slow drug release could be due to poor solubility of drug. At the end of the dissolution test, the amount of VEM in CS-g-β-CD/PVA+VEM 20/75/5 is the lowest.
3.2.9. Kinetics of In Vitro Drug Release Study
To understand the kinetics and the main mechanisms which govern the release of VEM from CH-g-β-CD/PVA hydrogels, the data plotted in Figure 8 were fitted using different kinetic models [66,67,68]. The data are given in Table 7. The selection of the model that most accurately described the release profile of VEM from the obtained hydrogels was based on the Akaike Information Criterion (AIC) and the r2 correlation coefficient.
In Table 7, values of r2 and values of AIC range between 0.983 - 0.991 and 103.589-148.420, respectively. For r2, the value should be as close as possible to 1 to demonstrate a yield as good as possible for a formulation and the AIC must have minimum values [23,69]. In our study the values of r2 and AIC indicated that the obtained hydrogels did not follow an ideal zero-order kinetics, nor a first-order kinetics. The r2 values for the Higuchi and Korsmeyer–Peppas models did not differ significantly. The difference was given by the lower AIC values for the Korsmeyer–Peppas model. This indicated that the release of VEM from hydrogels occurred through the diffusion phenomenon [70]. The diffusion mechanisms were indicated by the values of the diffusion exponent (n) in the Korsmeyer–Peppas equation. The values of n indicated a release by Fickian diffusion for VEM.
The choice of the optimal model for drug release could also be determined if there was an initial release of the active substance of 60%. Taking this into account, Korsmeyer–Peppas was the most effective and best-fitting model for release of VEM based on the data collected after 40 h. Over time, the release profile of VEM from different pharmaceutical forms has been associated with the Korsmeyer–Peppas model.
4. Conclusions
In the present study, a new, simple, rapid and validated HPLC method with UV detection was developed for vemurafenib determination in polymer matrices. The advantages of our method include reduced analysis time, a simple procedure for sample preparation, specificity, and the ability to separate the drug from polymeric matrices, without the need of extraction. It also observed that there was no interference from the hydrogel's components for the determination of the VEM. The recovery percentage for the determination of VEM in polymer matrix had a value close to 100% and was similar to other methods documented in the literature. The obtained results during the in vitro dissolution test indicated the prolonged release of VEM from the studied hydrogels compared to the release of VEM from an industrial product. The method is suitable for routine analysis of VEM in bulk, in tablet dosage forms or hydrogels and can be also used during in vitro studies. The high sensitivity of the method allows its application in further studies of transdermal release or permeability of active ingredients in hydrogels.
Author Contributions
Conceptualization, L.P., A.-D.P. and N.B.; methodology, L.P., A.-D.P., A.S. and N.B.; validation, L.P., A.-D.P., M.A. and N.B.; software, A.S. and L.P.; formal analysis, L.P., A.-D.P., A.C., C.N.Y. and N.B.; investigation, L.P., A.-D.P., M.V. and M.A.; resources, L.P. and N.B.; data curation, L.P. and M.V.; writing—original draft preparation, L.P., A.-D.P., M.V. and N.B.; writing—review and editing, L.P., A.-D.P. and N.B.; visualization, A.C. and A.S.; supervision, A.-D.P. and N.B.; project administration, N.B.; funding acquisition, L.P. and N.B. All authors have read and agreed to the published version of the manuscript.
Funding
This research received no external funding.
Acknowledgments
The authors acknowledge “Grigore T. Popa” University of Medicine and Phar- macy of Iasi, Romania for the partial supply of chemicals and materials, as well as for publication support.
Conflicts of Interest
The authors declare no conflicts of interest.
References
- Richard, M.A.; Paul, C.; Nijsten, T.; Gisondi, P.; Salavastru, C.; Taieb, C.; Trakatelli, M.; Puig, L.; Stratigos, A. Prevalence of Most Common Skin Diseases in Europe: A Population-based Study. J. Eur. Acad. Dermatol. Venereol. 2022, 36, 1088–1096. [CrossRef]
- Lopes, J.; Rodrigues, C.M.P.; Gaspar, M.M.; Reis, C.P. Melanoma Management: From Epidemiology to Treatment and Latest Advances. Cancers (Basel) 2022, 14, 4652. [CrossRef]
- Koizumi, S.; Inozume, T.; Nakamura, Y. Current Surgical Management for Melanoma. J. Dermatol. 2024, 51, 312–323. [CrossRef]
- Alieva, M.; van Rheenen, J.; Broekman, M.L.D. Potential Impact of Invasive Surgical Procedures on Primary Tumor Growth and Metastasis. Clin. Exp. Metastasis 2018, 35, 319–331. [CrossRef]
- National Cancer Institute. Melanoma Treatment (PDQ®)–Health Professional Version. National Institutes of Health, 26 Apr. 2024. https://www.cancer.gov/types/skin/hp/melanoma-treatment-pdq (accessed on 1 May 2025).
- Grynberg, S.; Stoff, R.; Asher, N.; Shapira-Frommer, R.; Schachter, J.; Haisraely, O.; Lawrence, Y.; Ben-Betzalel, G. Radiotherapy May Augment Response to Immunotherapy in Metastatic Uveal Melanoma Patients. Ther. Adv. Med. Oncol. 2022, 14. [CrossRef]
- D’Andrea, M.A.; Reddy, G.K. Systemic Antitumor Effects and Abscopal Responses in Melanoma Patients Receiving Radiation Therapy. Oncology 2020, 98, 202–215. [CrossRef]
- Pham, J.P.; Joshua, A.M.; da Silva, I.P.; Dummer, R.; Goldinger, S.M. Chemotherapy in Cutaneous Melanoma: Is There Still a Role? Curr. Oncol. Rep. 2023, 25, 609–621. [CrossRef]
- Haider, T.; Pandey, V.; Banjare, N.; Gupta, P.N.; Soni, V. Drug Resistance in Cancer: Mechanisms and Tackling Strategies. Pharmacol. Rep. 2020, 72, 1125–1151. [CrossRef]
- Knight, A.; Karapetyan, L.; Kirkwood, J.M. Immunotherapy in Melanoma: Recent Advances and Future Directions. Cancers (Basel) 2023, 15, 1106. [CrossRef]
- da Rocha Dias, S.; Salmonson, T.; van Zwieten-Boot, B.; Jonsson, B.; Marchetti, S.; Schellens, J.H.M.; Giuliani, R.; Pignatti, F. The European Medicines Agency Review of Vemurafenib (Zelboraf®) for the Treatment of Adult Patients with BRAF V600 Mutation-Positive Unresectable or Metastatic Melanoma: Summary of the Scientific Assessment of the Committee for Medicinal Products for Human Use. Eur. J. Cancer 2013, 49, 1654–1661. [CrossRef]
- Oneal, P.A.; Kwitkowski, V.; Luo, L.; Shen, Y.L.; Subramaniam, S.; Shord, S.; Goldberg, K.B.; McKee, A.E.; Kaminskas, E.; Farrell, A.; et al. FDA Approval Summary: Vemurafenib for the Treatment of Patients with Erdheim-Chester Disease with the BRAF V600 Mutation. Oncologist 2018, 23, 1520–1524. [CrossRef]
- Russi, M.; Valeri, R.; Marson, D.; Danielli, C.; Felluga, F.; Tintaru, A.; Skoko, N.; Aulic, S.; Laurini, E.; Pricl, S. Some Things Old, New and Borrowed: Delivery of Dabrafenib and Vemurafenib to Melanoma Cells via Self-Assembled Nanomicelles Based on an Amphiphilic Dendrimer. Eur. J. Pharm. Sci. 2023, 180, 106311. [CrossRef]
- Kim, J.; Archer, P.A.; Manspeaker, M.P.; Avecilla, A.R.C.; Pollack, B.P.; Thomas, S.N. Sustained Release Hydrogel for Durable Locoregional Chemoimmunotherapy for BRAF-Mutated Melanoma. J. Control. Release 2023, 357, 655–668. [CrossRef]
- Zou, L.; Ding, W.; Zhang, Y.; Cheng, S.; Li, F.; Ruan, R.; Wei, P.; Qiu, B. Peptide-Modified Vemurafenib-Loaded Liposomes for Targeted Inhibition of Melanoma via the Skin. Biomaterials 2018, 182, 1–12. [CrossRef]
- Bîrsan, M.; Cristofor, A.C.; Antonoaea, P.; Todoran, N.; Bibire, N.; Panainte, A.D.; Vlad, R.A.; Grigore, M.; Ciurba, A. Evaluation of Miconazole Nitrate Permeability through Biological Membrane from Dermal Systems. Farmacia 2020, 68, 111–115. [CrossRef]
- Almajidi, Y.Q.; Maraie, N.K.; Raauf, A.M.R. Modified Solid in Oil Nanodispersion Containing Vemurafenib-Lipid Complex-in Vitro/in Vivo Study. F1000Res 2022, 11, 841. [CrossRef]
- Alkilani, A.; McCrudden, M.T.; Donnelly, R. Transdermal Drug Delivery: Innovative Pharmaceutical Developments Based on Disruption of the Barrier Properties of the Stratum Corneum. Pharmaceutics 2015, 7, 438–470. [CrossRef]
- Almajidi, Y.Q.; Maraie, N.K.; Raauf, A.M.R. Utilization of Solid in Oil Nanodispersion to Prepare a Topical Vemurafenib as Potential Delivery System for Skin Melanoma. Appl. Nanosci. (Switzerland) 2023, 13, 2845–2856. [CrossRef]
- Alex, M.; Alsawaftah, N.M.; Husseini, G.A. State-of-All-the-Art and Prospective Hydrogel-Based Transdermal Drug Delivery Systems. Appl. Sci. 2024, 14, 2926. [CrossRef]
- Jacob, S.; Nair, A.B.; Shah, J.; Sreeharsha, N.; Gupta, S.; Shinu, P. Emerging Role of Hydrogels in Drug Delivery Systems, Tissue Engineering and Wound Management. Pharmaceutics 2021, 13, 357. [CrossRef]
- Esmaeili, J.; Barati, A.; Ai, J.; Nooshabadi, V.T.; Mirzaei, Z. Employing Hydrogels in Tissue Engineering Approaches to Boost Conventional Cancer-Based Research and Therapies. RSC Adv. 2021, 11, 10646–10669. [CrossRef]
- Caccavo, D.; Cascone, S.; Lamberti, G.; Barba, A.A. Controlled Drug Release from Hydrogel-Based Matrices: Experiments and Modeling. Int. J. Pharm. 2015, 486, 144–152. [CrossRef]
- Păduraru, L.; Panainte, A.-D.; Peptu, C.-A.; Apostu, M.; Vieriu, M.; Bibire, T.; Sava, A.; Bibire, N. Smart Drug Delivery Systems Based on Cyclodextrins and Chitosan for Cancer Therapy. Pharmaceuticals (Basel) 2025, 18. [CrossRef]
- Chuah, L.-H.; Loo, H.-L.; Goh, C.F.; Fu, J.-Y.; Ng, S.-F. Chitosan-Based Drug Delivery Systems for Skin Atopic Dermatitis: Recent Advancements and Patent Trends. Drug Deliv. Transl. Res. 2023, 13, 1436–1455. [CrossRef]
- Chander, S.; Piplani, M.; Waghule, T.; Singhvi, G. Role of Chitosan in Transdermal Drug Delivery. In Chitosan in Drug Delivery; Elsevier, 2022; pp. 83–105.
- Ketabchi, N.; D.R.; A.M.; G.M.; F.S.; A.B.; F.-M.R. Study of Third-Degree Burn Wounds Debridement and Treatment by Actinidin Enzyme Immobilized on Electrospun Chitosan/PEO Nanofibers in Rats. Biointerface Res. Appl. Chem. 2020, 11, 10358–10370. [CrossRef]
- Tiplea, R.E.; Lemnaru, G.M.; Trușcă, R.D.; Holban, A.; Kaya, M.G.A.; Dragu, L.D.; Ficai, D.; Ficai, A.; Bleotu, C. Antimicrobial Films Based on Chitosan, Collagen, and Zno for Skin Tissue Regeneration. Biointerface Res. Appl. Chem. 2021, 11, 11985–11995. [CrossRef]
- Nieto González, N.; Rassu, G.; Cossu, M.; Catenacci, L.; Sorrenti, M.L.; Cama, E.S.; Serri, C.; Giunchedi, P.; Gavini, E. A Thermosensitive Chitosan Hydrogel: An Attempt for the Nasal Delivery of Dimethyl Fumarate. Int. J. Biol. Macromol. 2024, 278. [CrossRef]
- Naeem, A.; Chengqun, Y.; Hetonghui; Zhenzhong, Z.; Weifeng, Z.; Yongmei, G. β-Cyclodextrin/Chitosan-Based (Polyvinyl Alcohol-Co-Acrylic Acid) Interpenetrating Hydrogels for Oral Drug Delivery. Int. J. Biol. Macromol. 2023, 242, 125149. [CrossRef]
- Najm, A.; Niculescu, A.-G.; Bolocan, A.; Rădulescu, M.; Grumezescu, A.M.; Beuran, M.; Gaspar, B.S. Chitosan and Cyclodextrins—Versatile Materials Used to Create Drug Delivery Systems for Gastrointestinal Cancers. Pharmaceutics 2023, 16, 43. [CrossRef]
- Tian, B.; Hua, S.; Liu, J. Cyclodextrin-Based Delivery Systems for Chemotherapeutic Anticancer Drugs: A Review. Carbohydr. Polym. 2020, 232, 115805. [CrossRef]
- Kali, G.; Haddadzadegan, S.; Bernkop-Schnürch, A. Cyclodextrins and Derivatives in Drug Delivery: New Developments, Relevant Clinical Trials, and Advanced Products. Carbohydr. Polym. 2024, 324, 121500. [CrossRef]
- Choi, J.H.; Lee, J.S.; Yang, D.H.; Nah, H.; Min, S.J.; Lee, S.Y.; Yoo, J.H.; Chun, H.J.; Moon, H.-J.; Hong, Y.K.; et al. Development of a Temperature-Responsive Hydrogel Incorporating PVA into NIPAAm for Controllable Drug Release in Skin Regeneration. ACS Omega 2023, 8, 44076–44085. [CrossRef]
- Manohar, D.; Babu, R.S.; Vijaya, B.; Nallakumar, S.; Gobi, R.; Anand, S.; Nishanth, D.S.; Anupama, A.; Rani, M.U. A Review on Exploring the Potential of PVA and Chitosan in Biomedical Applications: A Focus on Tissue Engineering, Drug Delivery and Biomedical Sensors. Int. J. Biol. Macromol. 2024, 283, 137318. [CrossRef]
- Panainte, A.-D.; Popa, G.; Pamfil, D.; Butnaru, E.; Vasile, C.; Tarțău, L.M.; Gafițanu, C. In Vitro Characterization Of Polyvinyl Alcohol/ Chitosan Hydrogels As Modified Release Systems For Bisoprolol. Farmacia 2018, 66, 1.
- Păduraru, L.; Sava, A.; Orhan, H.; Yilmaz, C.N.; Apostu, M.; Panainte, A.D.; Vieriu, M.; Atmaca, K.; Bibire, N. Vemurafenib Based Hydrogels As Potential Topical Bioformulations For The Treatment Of Melanoma. Med. Surg. J.-Rev. Med. Chir. Soc. Med. Nat 2025, 129, 278–290. [CrossRef]
- Sparidans, R.W.; Durmus, S.; Schinkel, A.H.; Schellens, J.H.M.; Beijnen, J.H. Liquid Chromatography–Tandem Mass Spectrometric Assay for the Mutated BRAF Inhibitor Vemurafenib in Human and Mouse Plasma. J. Chromatogr. B 2012, 889–890, 144–147. [CrossRef]
- Vakhariya, R.-R.; Shah, R.-R.; Patil, S.-S.; Salunkhe N.-S.; Mohite, S.K. Development and Validation of Analytical Method for Vemurafenib. Int. J. Curr. Sci. 2024, 14, 519–529.
- Pawanjeet. J. Chhabda, M.B.S.V. and 2K. M.Ch.A.R. Development and Validation of a New Simple and Stability Indicating RP-HPLC Method for the Determination of Vemurafenib in Presence of Degradant Products . Der Pharma Chemica 2013, 5, 189–198.
- Nijenhuis, C.M.; Rosing, H.; Schellens, J.H.M.; Beijnen, J.H. Development and Validation of a High-Performance Liquid Chromatography-Tandem Mass Spectrometry Assay Quantifying Vemurafenib in Human Plasma. J. Pharm. Biomed. Anal. 2014, 88, 630–635. [CrossRef]
- Ravix, A.; Bandiera, C.; Cardoso, E.; Lata-Pedreira, A.; Chtioui, H.; Decosterd, L.A.; Wagner, A.D.; Schneider, M.P.; Csajka, C.; Guidi, M. Population Pharmacokinetics of Trametinib and Impact of Nonadherence on Drug Exposure in Oncology Patients as Part of the Optimizing Oral Targeted Anticancer Therapies Study. Cancers (Basel) 2024, 16. [CrossRef]
- Rousset, M.; Titier, K.; Bouchet, S.; Dutriaux, C.; Pham-Ledard, A.; Prey, S.; Canal-Raffin, M.; Molimard, M. An UPLC-MS/MS Method for the Quantification of BRAF Inhibitors (Vemurafenib, Dabrafenib) and MEK Inhibitors (Cobimetinib, Trametinib, Binimetinib) in Human Plasma. Application to Treated Melanoma Patients. Clin. Chim. Acta 2017, 470, 8–13. [CrossRef]
- Zhen, Y.; Thomas-Schoemann, A.; Sakji, L.; Boudou-Rouquette, P.; Dupin, N.; Mortier, L.; Vidal, M.; Goldwasser, F.; Blanchet, B. An HPLC-UV Method for the Simultaneous Quantification of Vemurafenib and Erlotinib in Plasma from Cancer Patients. J. Chromatogr. B 2013, 928, 93–97. [CrossRef]
- Shah, N.; Iyer, R.M.; Mair, H.-J.; Choi, D.; Tian, H.; Diodone, R.; Fahnrich, K.; Pabst-Ravot, A.; Tang, K.; Scheubel, E.; et al. Improved Human Bioavailability of Vemurafenib, a Practically Insoluble Drug, Using an Amorphous Polymer-Stabilized Solid Dispersion Prepared by a Solvent-Controlled Coprecipitation Process. J. Pharm. Sci. 2013, 102, 967–981. [CrossRef]
- Alvarez, J.-C.; Funck-Brentano, E.; Abe, E.; Etting, I.; Saiag, P.; Knapp, A. A LC/MS/MS Micro-Method for Human Plasma Quantification of Vemurafenib. Application to Treated Melanoma Patients. J. Pharm. Biomed. Anal. 2014, 97, 29–32. [CrossRef]
- U.S. Department of Health and Human Services; Food and Drug Administration (FDA); Center for Drug Evaluation and Research (CDER); Center for Veterinary Medicine (CVM). Bioanalytical Method Validation Guidance for Industry Biopharmaceutics Contains Nonbinding Recommendations, 2018.
- Committee for Medicinal Products for Human Use ICH Q2(R2). Guideline on Validation of Analytical Procedures, 2023;
- Panainte, A.D.; Vieriu, M.; Tantaru, G.; Apostu, M.; Bibire, N. Fast HPLC Method for the Determination of Piroxicam and Its Application to Stability Study. Revista de Chimie 2017, 68, 701–706. [CrossRef]
- Moosavi, S.M.; Ghassabian, S. Linearity of Calibration Curves for Analytical Methods: A Review of Criteria for Assessment of Method Reliability. In Calibration and Validation of Analytical Methods - A Sampling of Current Approaches; InTech, 2018.
- European Pharmacopoeia, 7th edition. Chapter 4.1.3. Buffer Solutions, , Council of Europe, Strasbourg, 2010, pp. 489-494.;
- Kaufmann, A.; Butcher, P.; Maden, K.; Walker, S.; Widmer, M.; Kaempf, R. Improved Method Robustness and Ruggedness in Liquid Chromatography–Mass Spectrometry by Increasing the Acid Content of the Mobile Phase. J. Chromatogr. A 2024, 1717, 464694. [CrossRef]
- International Conferences on Harmonization of Technical requirements for the registration of Drugs for Human use (ICH) Q2B. Validation of Analytical Procedure; Methodology, 2003;
- S. Lakka, N.; Kuppan, C. Principles of Chromatography Method Development. In Biochemical Analysis Tools - Methods for Bio-Molecules Studies; IntechOpen, 2020.
- Handbook of Pharmaceutical Analysis by HPLC; Satinder Ahuja, Michael W. Dong, Eds.; 1st ed.; Academic Press, 2005, 6.
- Almpani, S.; Agiannitou, P.-I.; Monou, P.K.; Kamaris, G.; Markopoulou, C.K. Development of a Validated HPLC-UV Method for the Determination of Panthenol, Hesperidin, Rutin, and Allantoin in Pharmaceutical Gel-Permeability Study. Separations 2025, 12, 19. [CrossRef]
- Zheng, Y.; Thomas-Schoemann, A.; Sakji, L.; Boudou-Rouquette, P.; Dupin, N.; Mortier, L.; Vidal, M.; Goldwasser, F.; Blanchet, B. An HPLC-UV Method for the Simultaneous Quantification of Vemurafenib and Erlotinib in Plasma from Cancer Patients. J. Chromatogr. B Analyt. Technol. Biomed. Life Sci. 2013, 928, 93–37. [CrossRef]
- Nilima, S.; Pragati Ranjan, S.; Madhu Chhanda, M.; Bisakha, T.; Bhavna, G. A New Analytical Rp-Hplc Method For The Estimation Of Vemurafenib In Pure Form And Marketed Pharmaceutical Dosage Form. Der Pharma Chemica 2023. [CrossRef]
- Gioacchino Luca Losacco; Amandine Dispas; Jean-Luc Veuthey and Davy Guillarme. Chapter 2 - Application Space for SFC in Pharmaceutical Drug Discovery and Development. In Practical Application of Supercritical Fluid Chromatography for Pharmaceutical Research and Development; Michael Hicks, Paul Ferguson, Eds.; 2022; Vol. 14, pp. 29–47.
- Neamah, M.J.; Al-Akkam, E.J.M. Preparation and Characterization of Vemurafenib Microemulsion Based Hydrogel Using Surface Active Ionic Liquid. Pharmacia 2024, 71, 1–9. [CrossRef]
- Shi, H.; Zhang, X.; Gao, Y.; Wang, S.; Ning, Y. Robust Total Least Squares Estimation Method for Uncertain Linear Regression Model. Mathematics 2023, 11, 4354. [CrossRef]
- Güven, G. Development and Validation of a RP-HPLC Method for Vemurafenib in Human Urine. Lat. Am. J. Pharm. 2019. 38 (4): 1-5.
- Anusha, D.; Yasodha, A. and Venkatesh, M.-V. A New Analytical RP-HPLC Method for the Estimation of Vemurafenib in Pure Form and Marketed Pharmaceutical Dosage Form. Tijer - International Research Journal 2023, 10.
- The United States Pharmacopeial Convention. USP34 – NF29, Volume 1. Rockville, Maryland, 2011.
- Bibire, T.; Panainte, A.-D.; Yilmaz, C.N.; Timofte, D.V.; Dănilă, R.; Bibire, N.; Păduraru, L.; Ghiciuc, C.M. Dexketoprofen-Loaded Alginate-Grafted Poly(N-Vinylcaprolactam)-Based Hydrogel for Wound Healing. Int J Mol Sci 2025, 26, 3051. [CrossRef]
- Peppas, N.A.; Narasimhan, B. Mathematical Models in Drug Delivery: How Modeling Has Shaped the Way We Design New Drug Delivery Systems. Journal of Controlled Release 2014, 190, 75–81. [CrossRef]
- Grassi, M.; Grassi, G. Application of Mathematical Modeling in Sustained Release Delivery Systems. Expert Opin Drug Deliv 2014, 11, 1299–1321. [CrossRef]
- Jackson, N.; Ortiz, A.C.; Jerez, A.; Morales, J.; Arriagada, F. Kinetics and Mechanism of Camptothecin Release from Transferrin-Gated Mesoporous Silica Nanoparticles through a PH-Responsive Surface Linker. Pharmaceutics 2023, 15, 1590. [CrossRef]
- Ata, S.; Rasool, A.; Islam, A.; Bibi, I.; Rizwan, M.; Azeem, M.K.; Qureshi, A. ur R.; Iqbal, M. Loading of Cefixime to PH Sensitive Chitosan Based Hydrogel and Investigation of Controlled Release Kinetics. Int J Biol Macromol 2020, 155, 1236–1244. [CrossRef]
- Raina, N.; Pahwa, R.; Bhattacharya, J.; Paul, A.K.; Nissapatorn, V.; de Lourdes Pereira, M.; Oliveira, S.M.R.; Dolma, K.G.; Rahmatullah, M.; Wilairatana, P.; et al. Drug Delivery Strategies and Biomedical Significance of Hydrogels: Translational Considerations. Pharmaceutics 2022, 14, 574. [CrossRef]
Figure 1.
The effect of mobile phase content to peak area and the retention time of VEM.
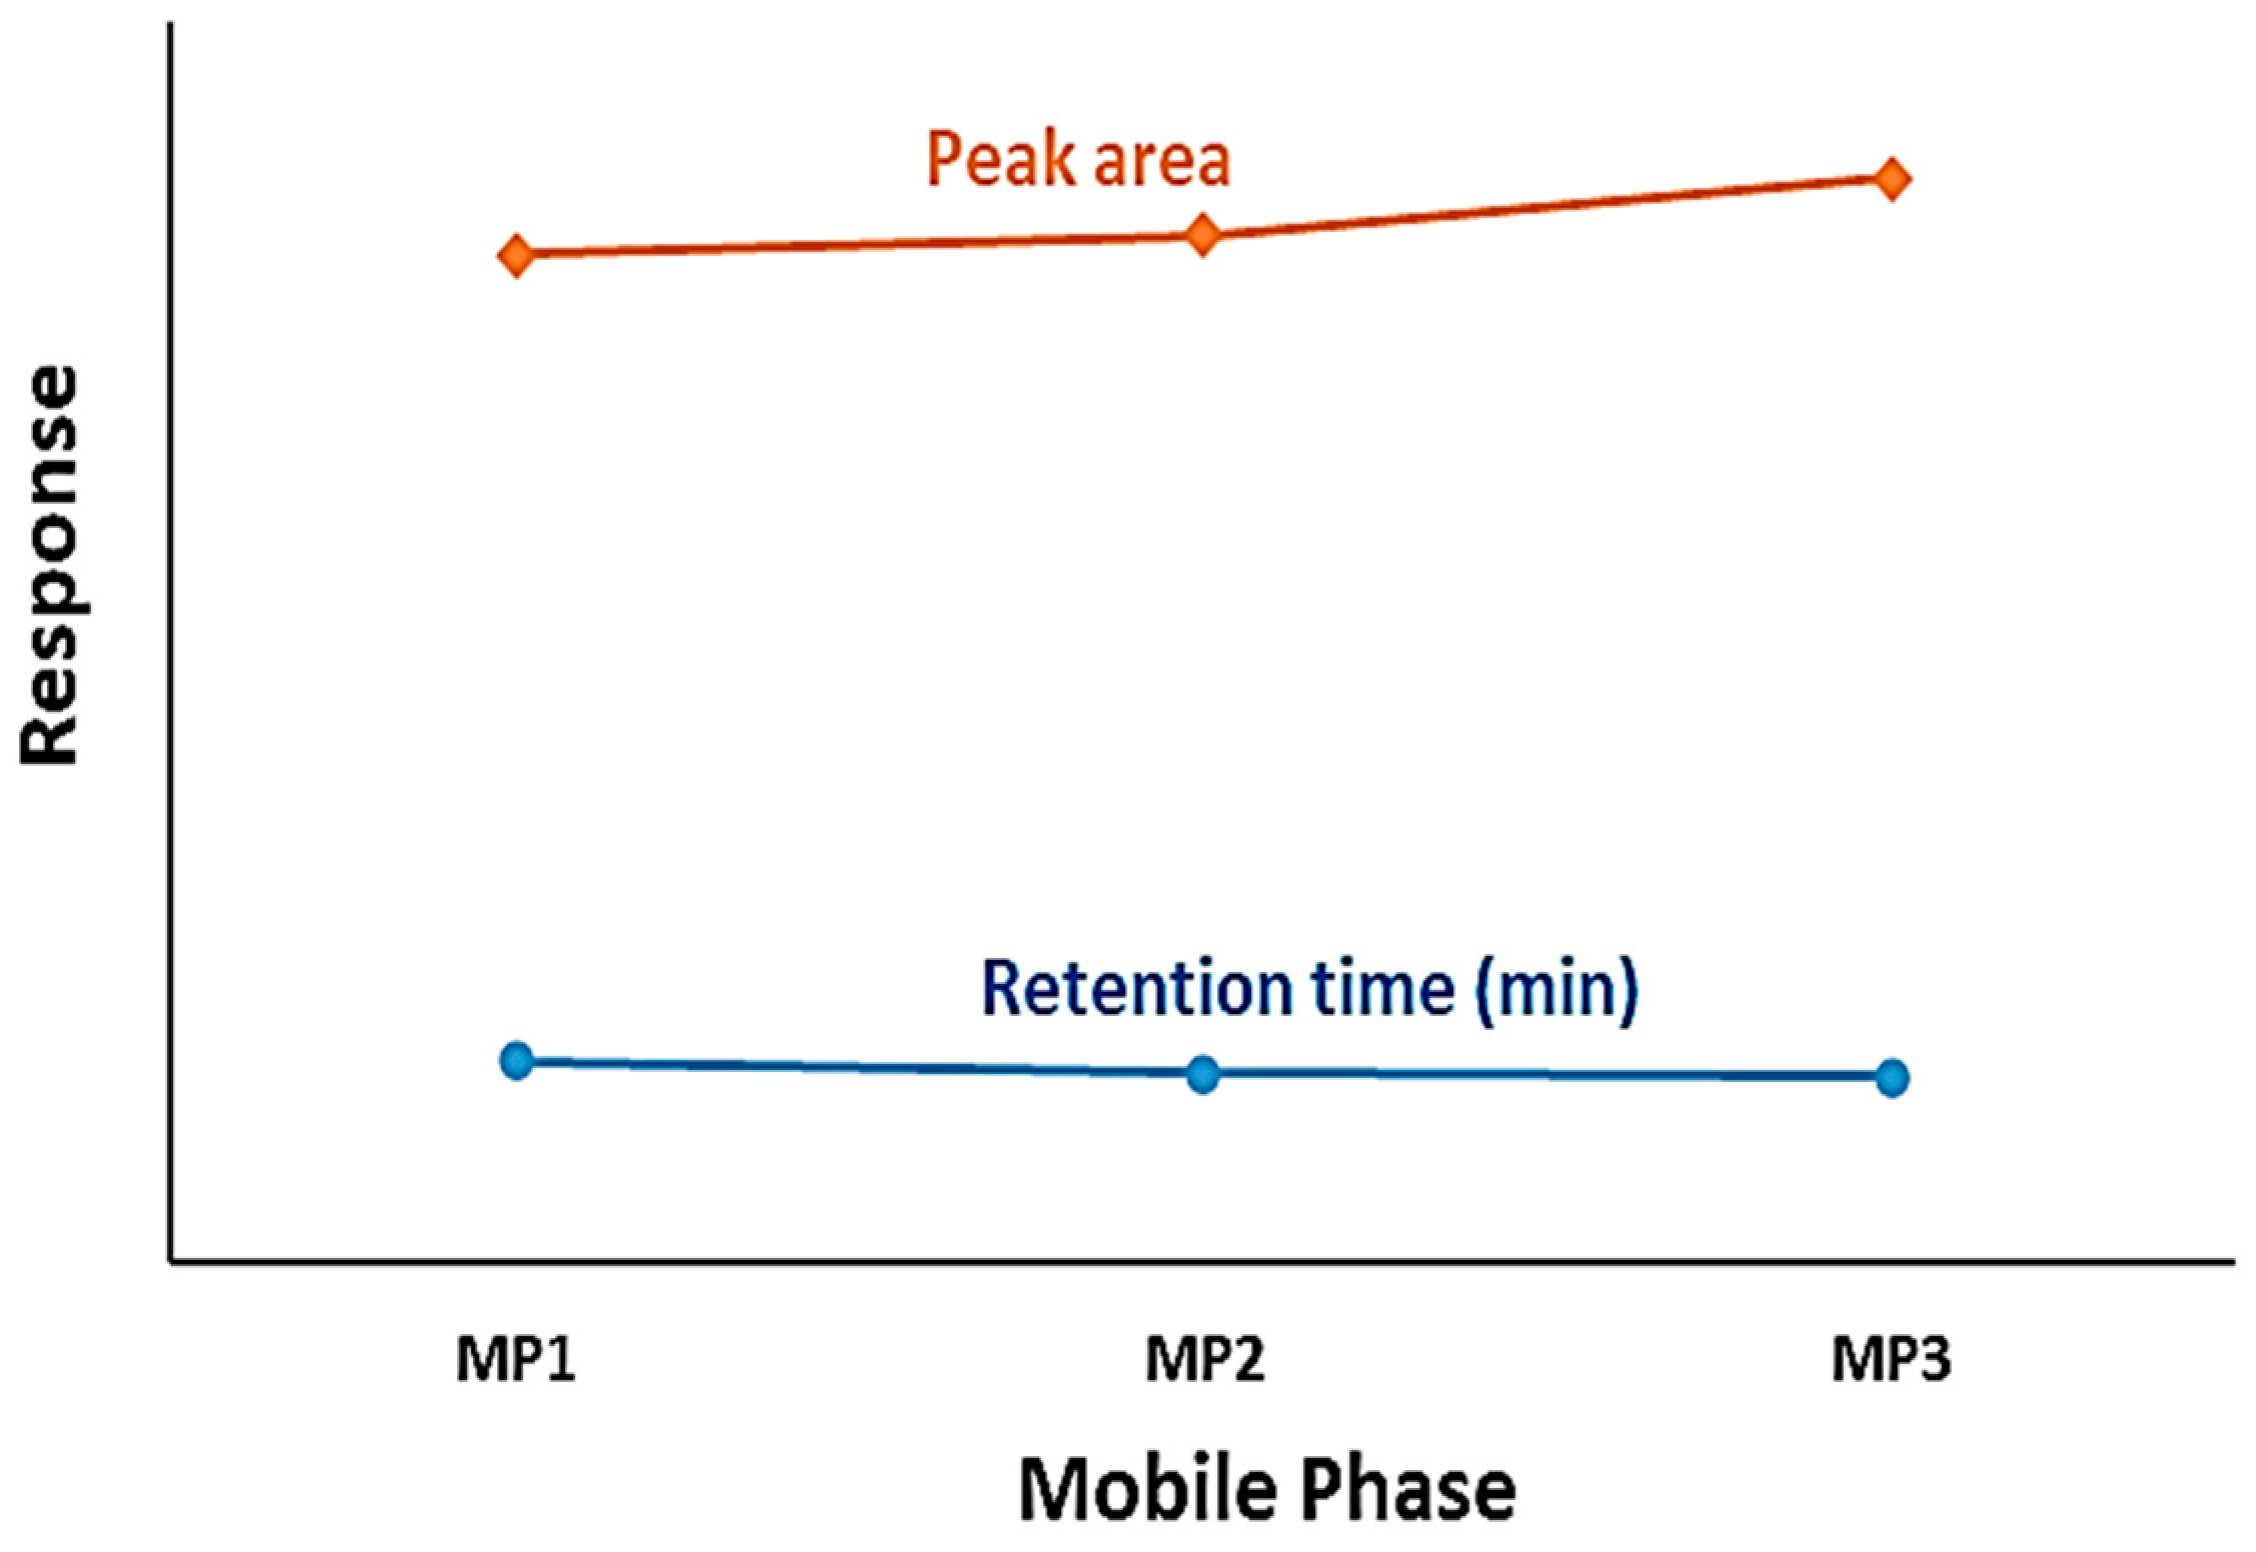
Figure 2.
Overlaid chromatograms of VEM samples with concentrations of 8 and 12 mg/L.
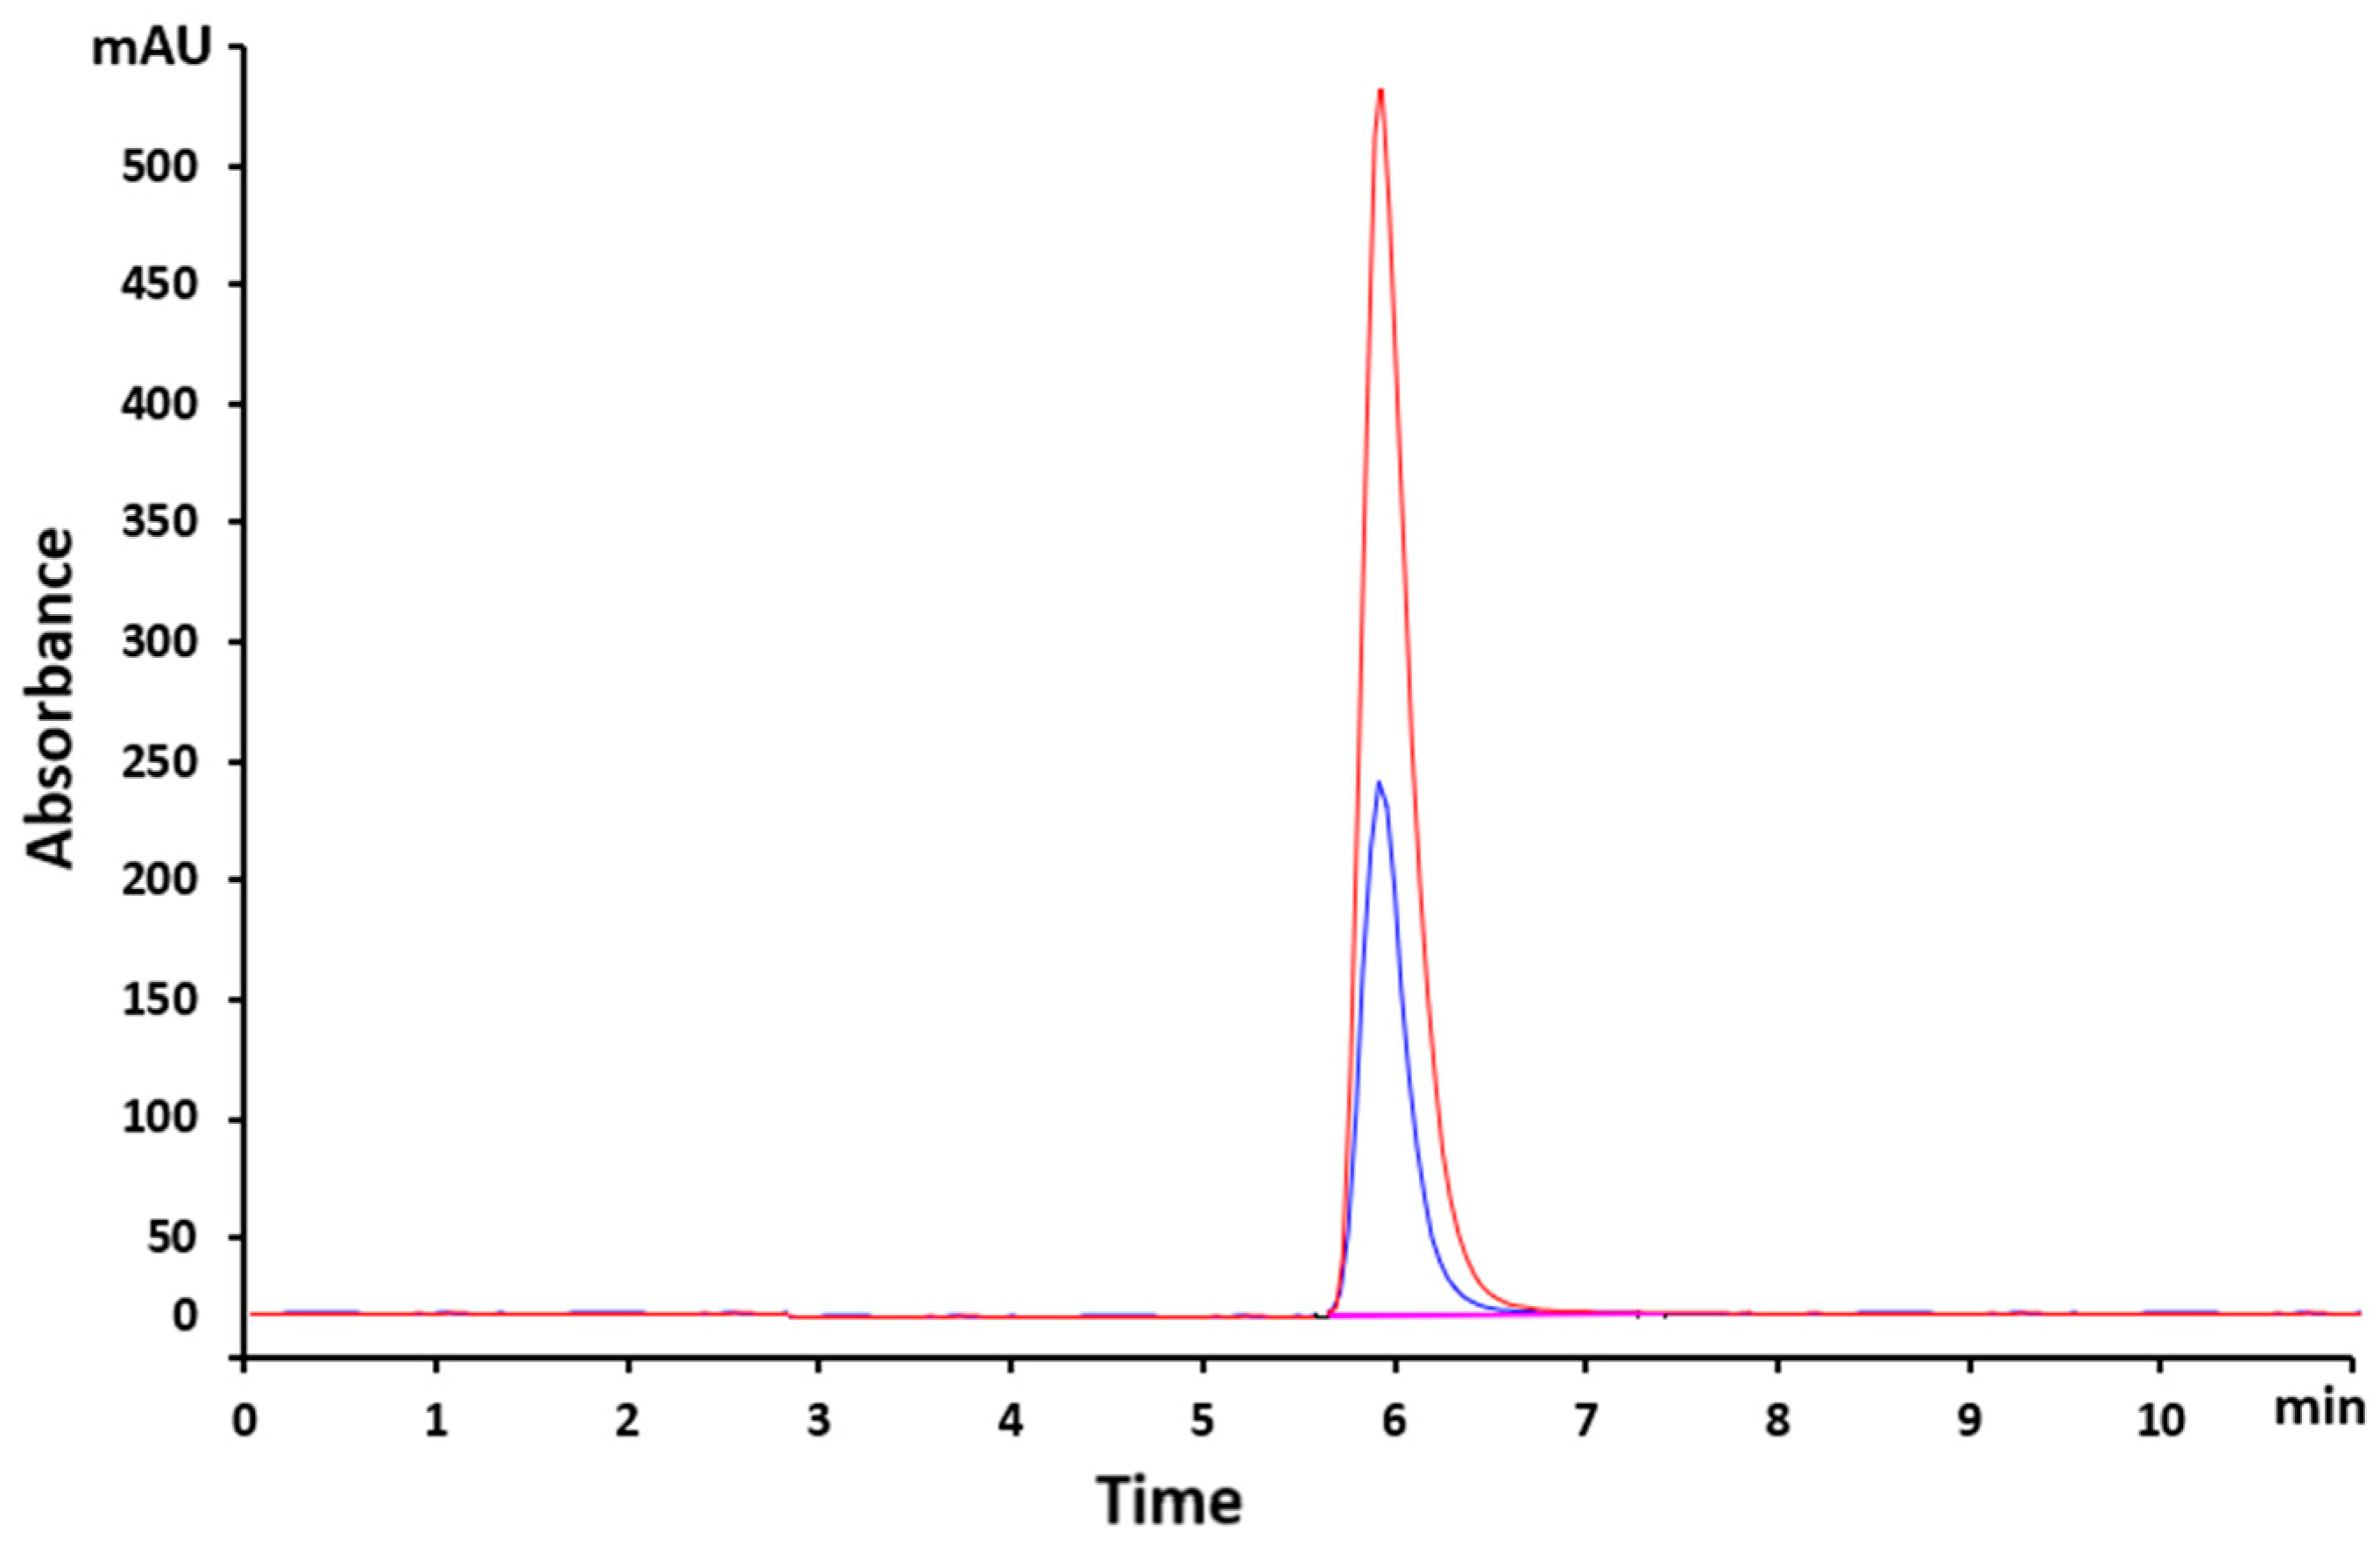
Figure 3.
Overlaid chromatograms of VEM samples with 12 mg/L concentration at different flow rates.
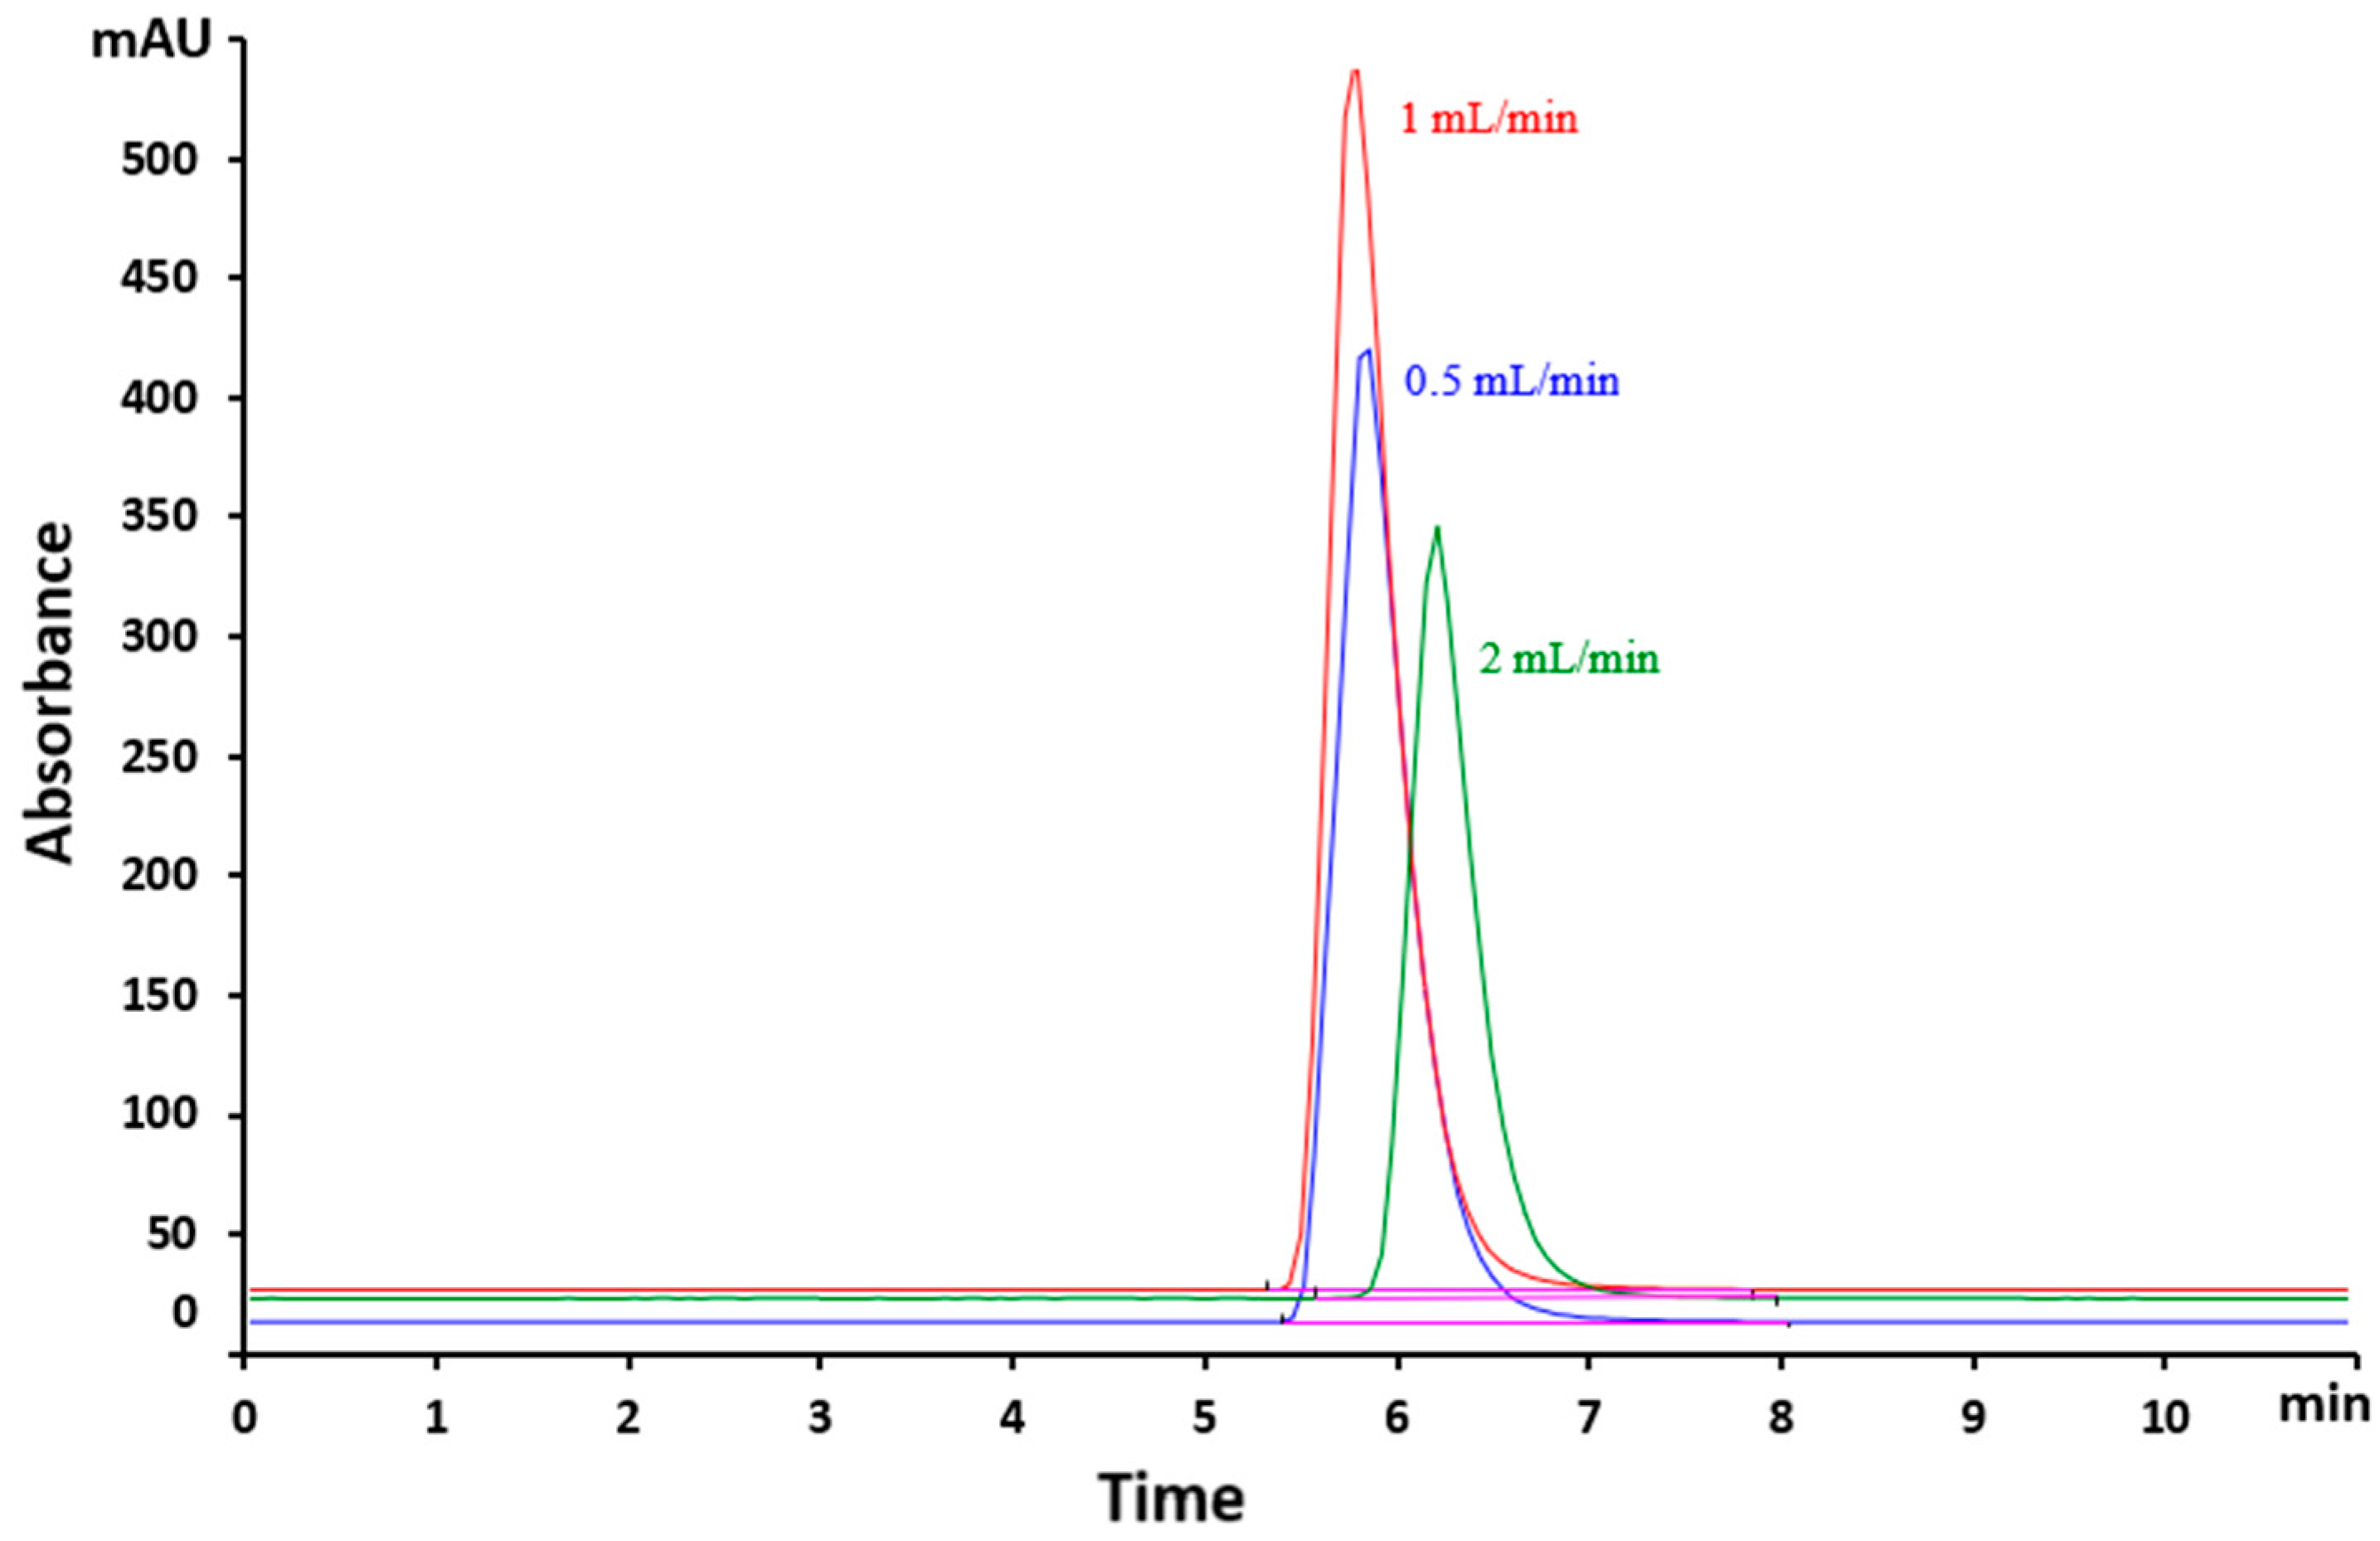
Figure 4.
Absorption spectra of VEM.
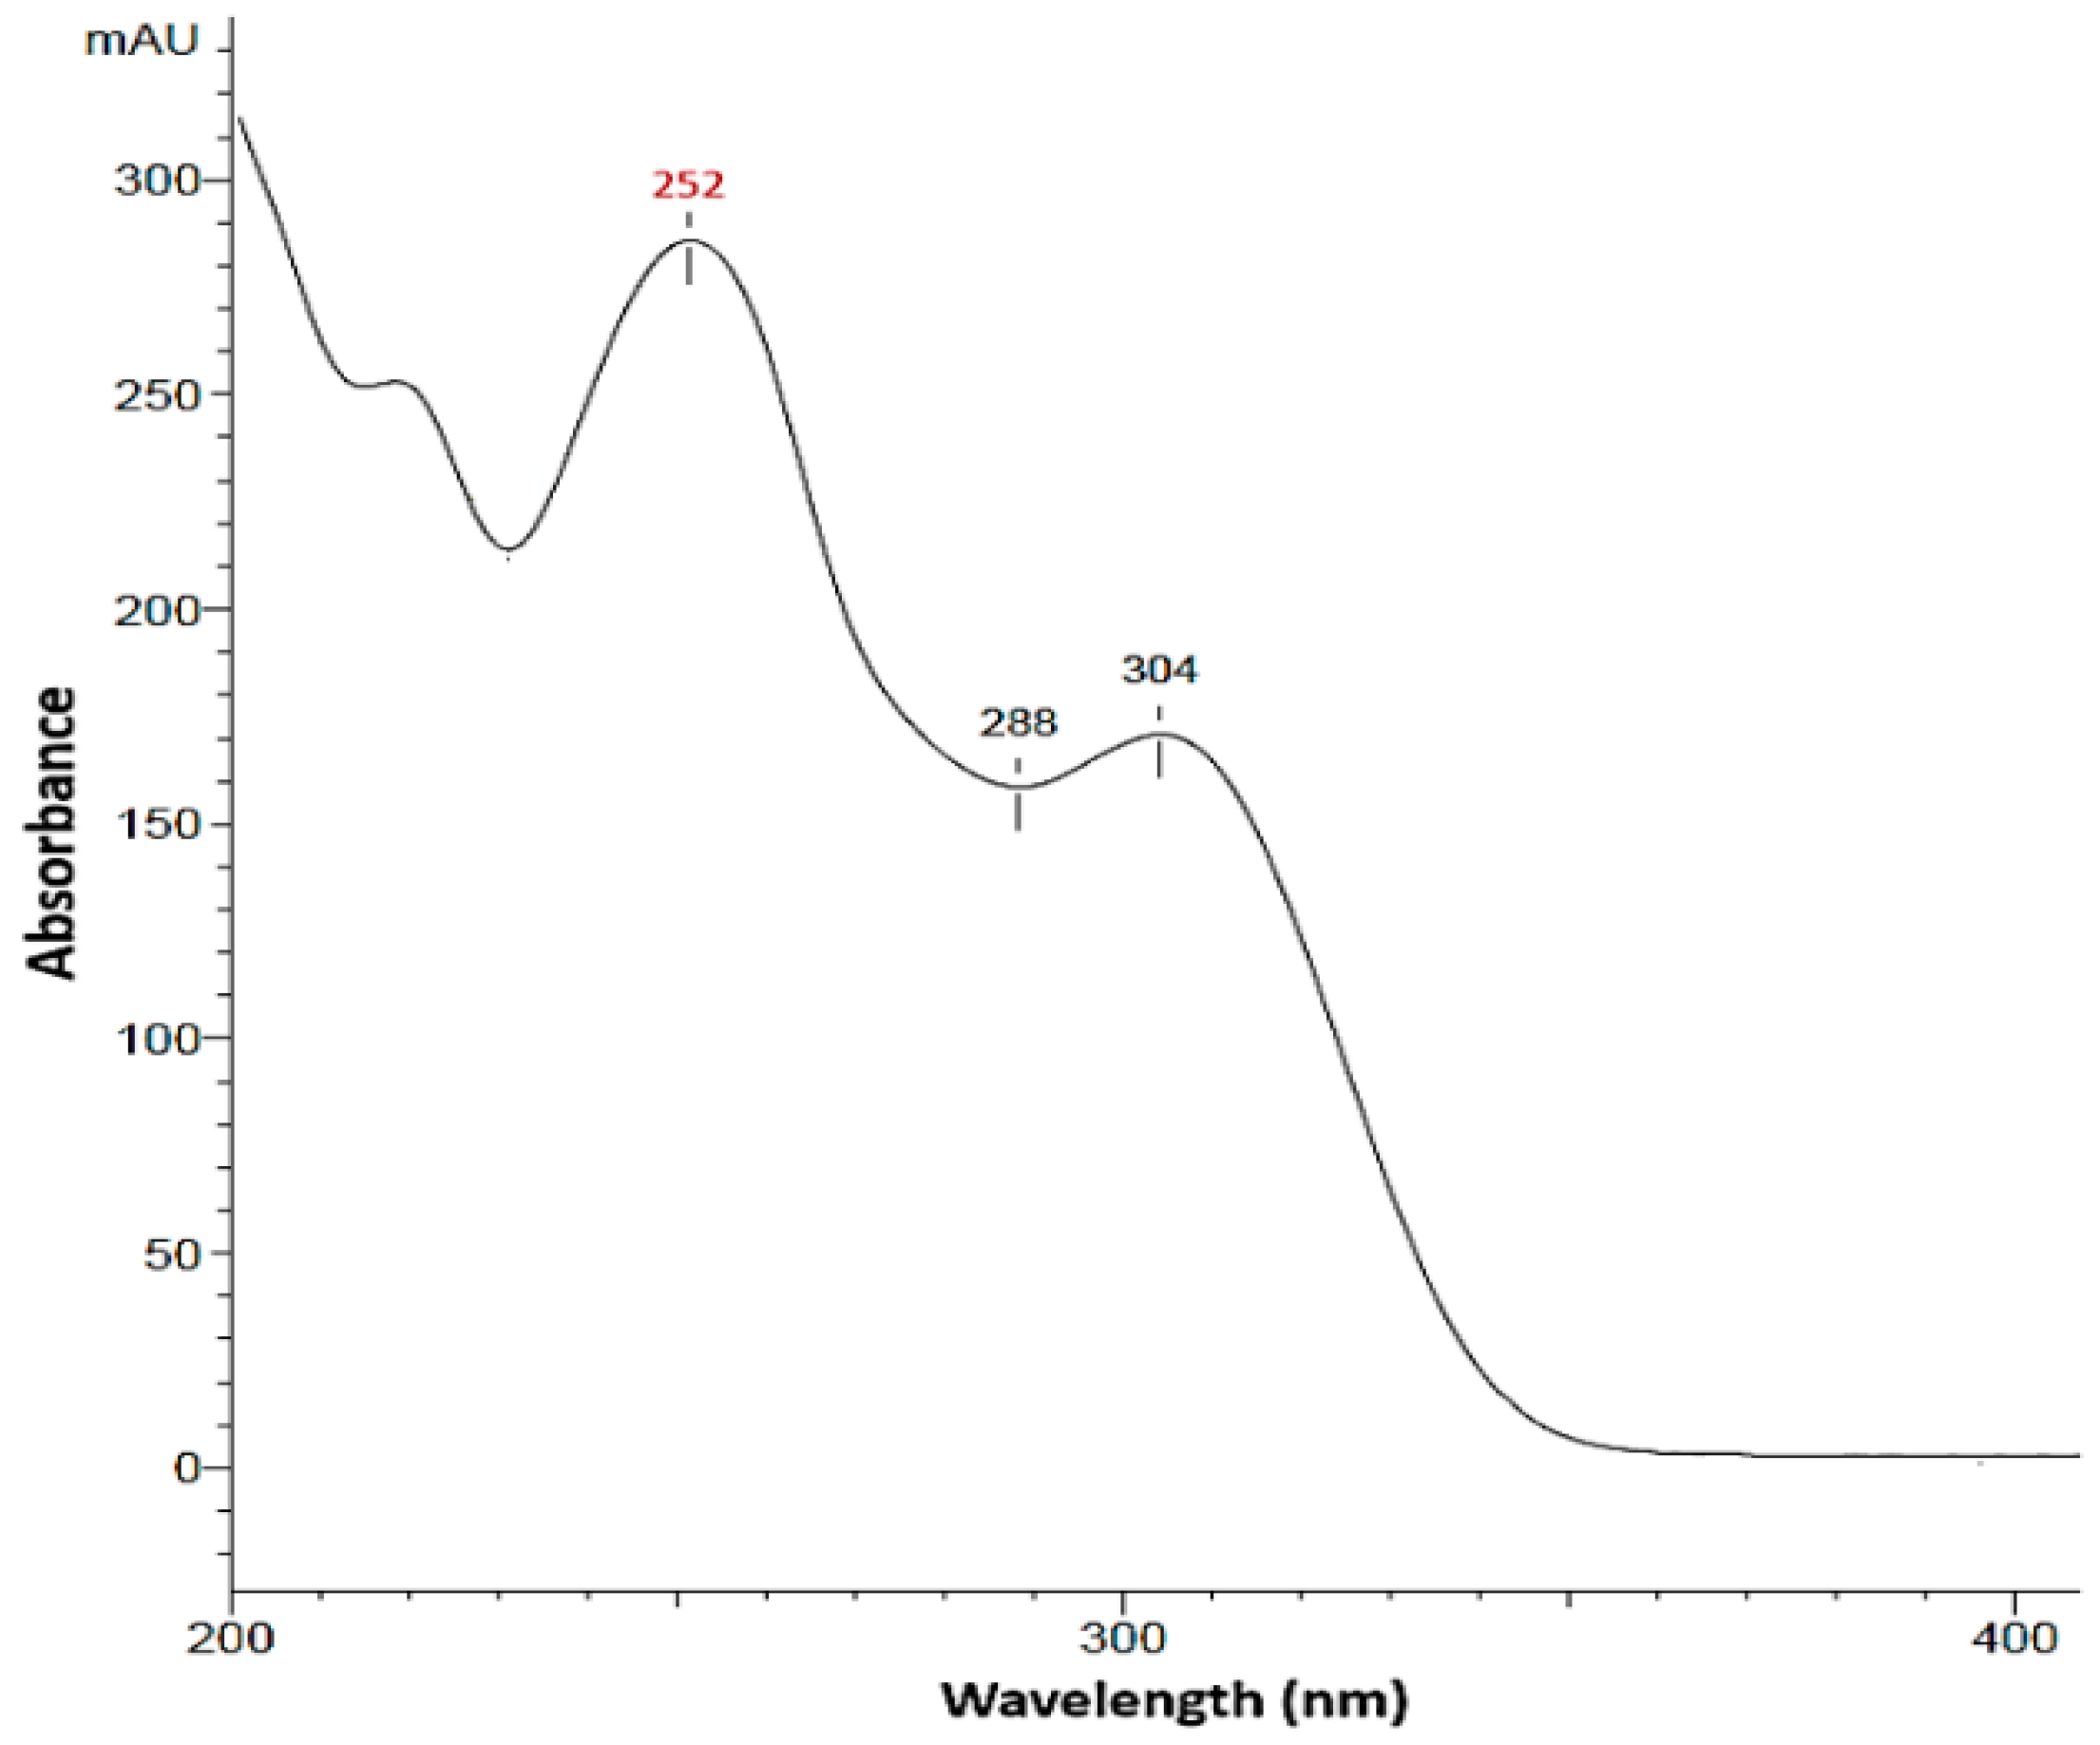
Figure 5.
Sample chromatogram for stability study.
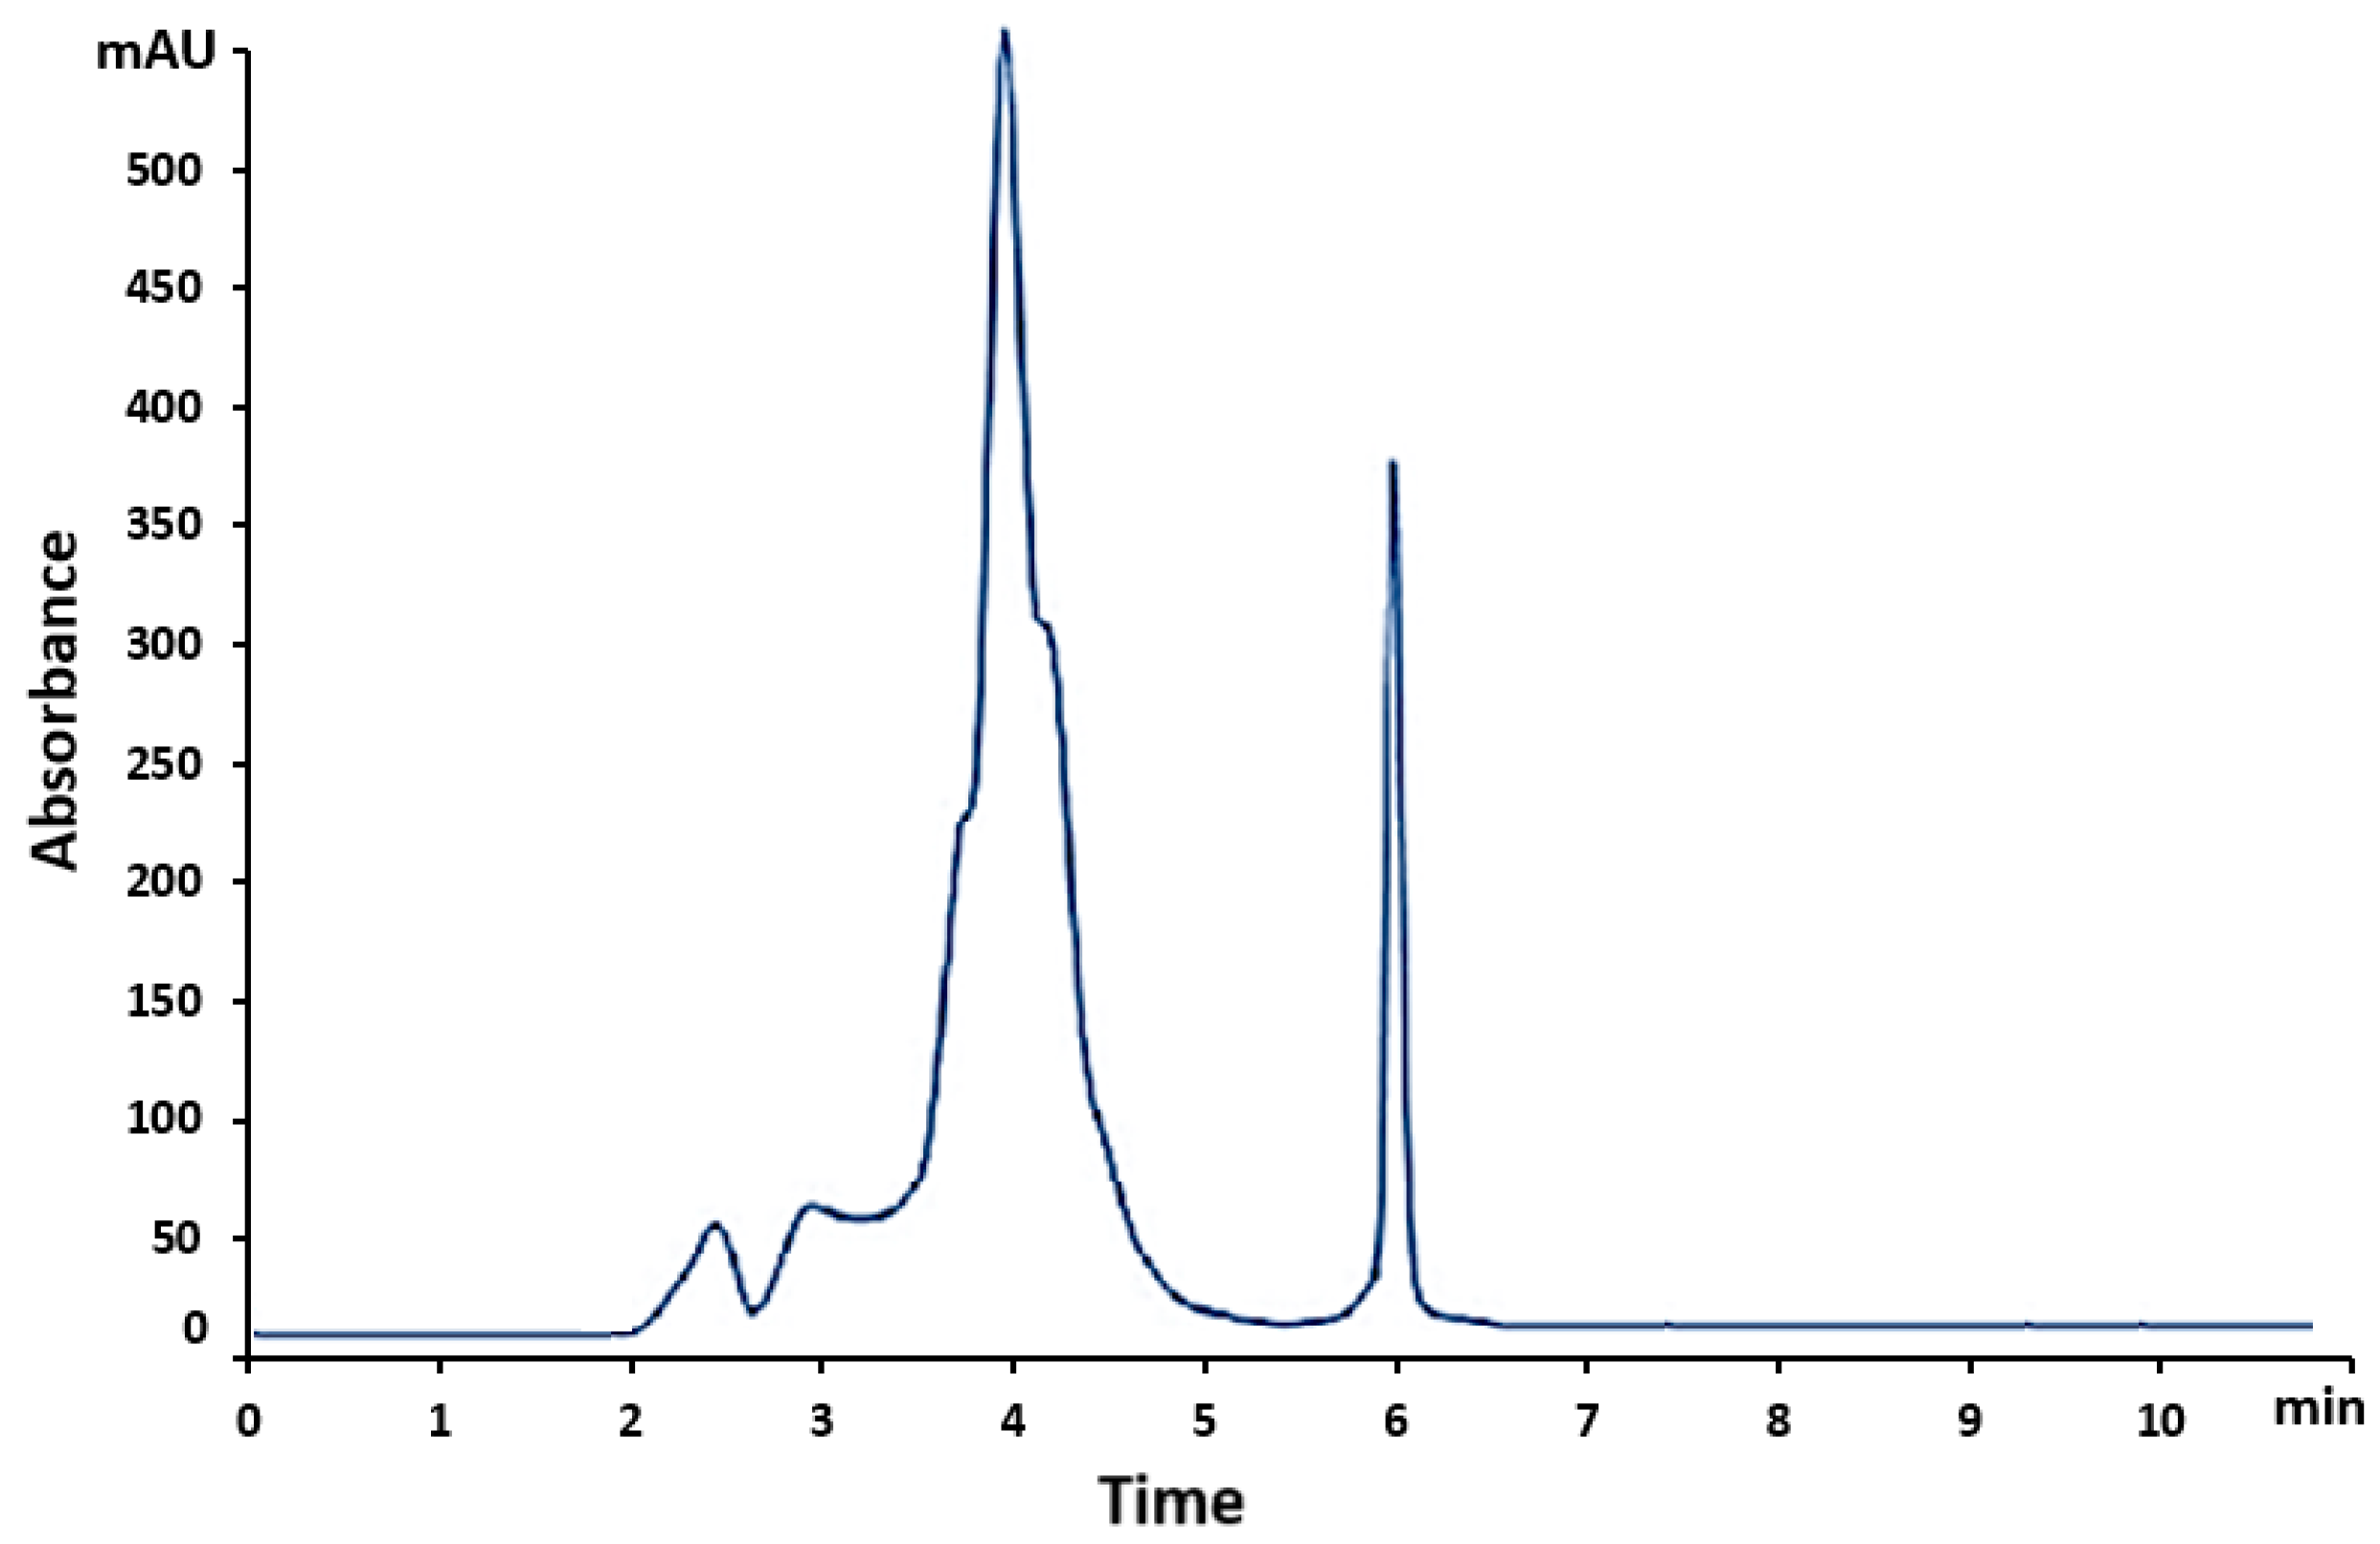
Figure 6.
Calibration graph for VEM over the range of 0.78-100 mg/L. (area mean ± SD, n = 3); SD: Standard Deviation.
Figure 6.
Calibration graph for VEM over the range of 0.78-100 mg/L. (area mean ± SD, n = 3); SD: Standard Deviation.
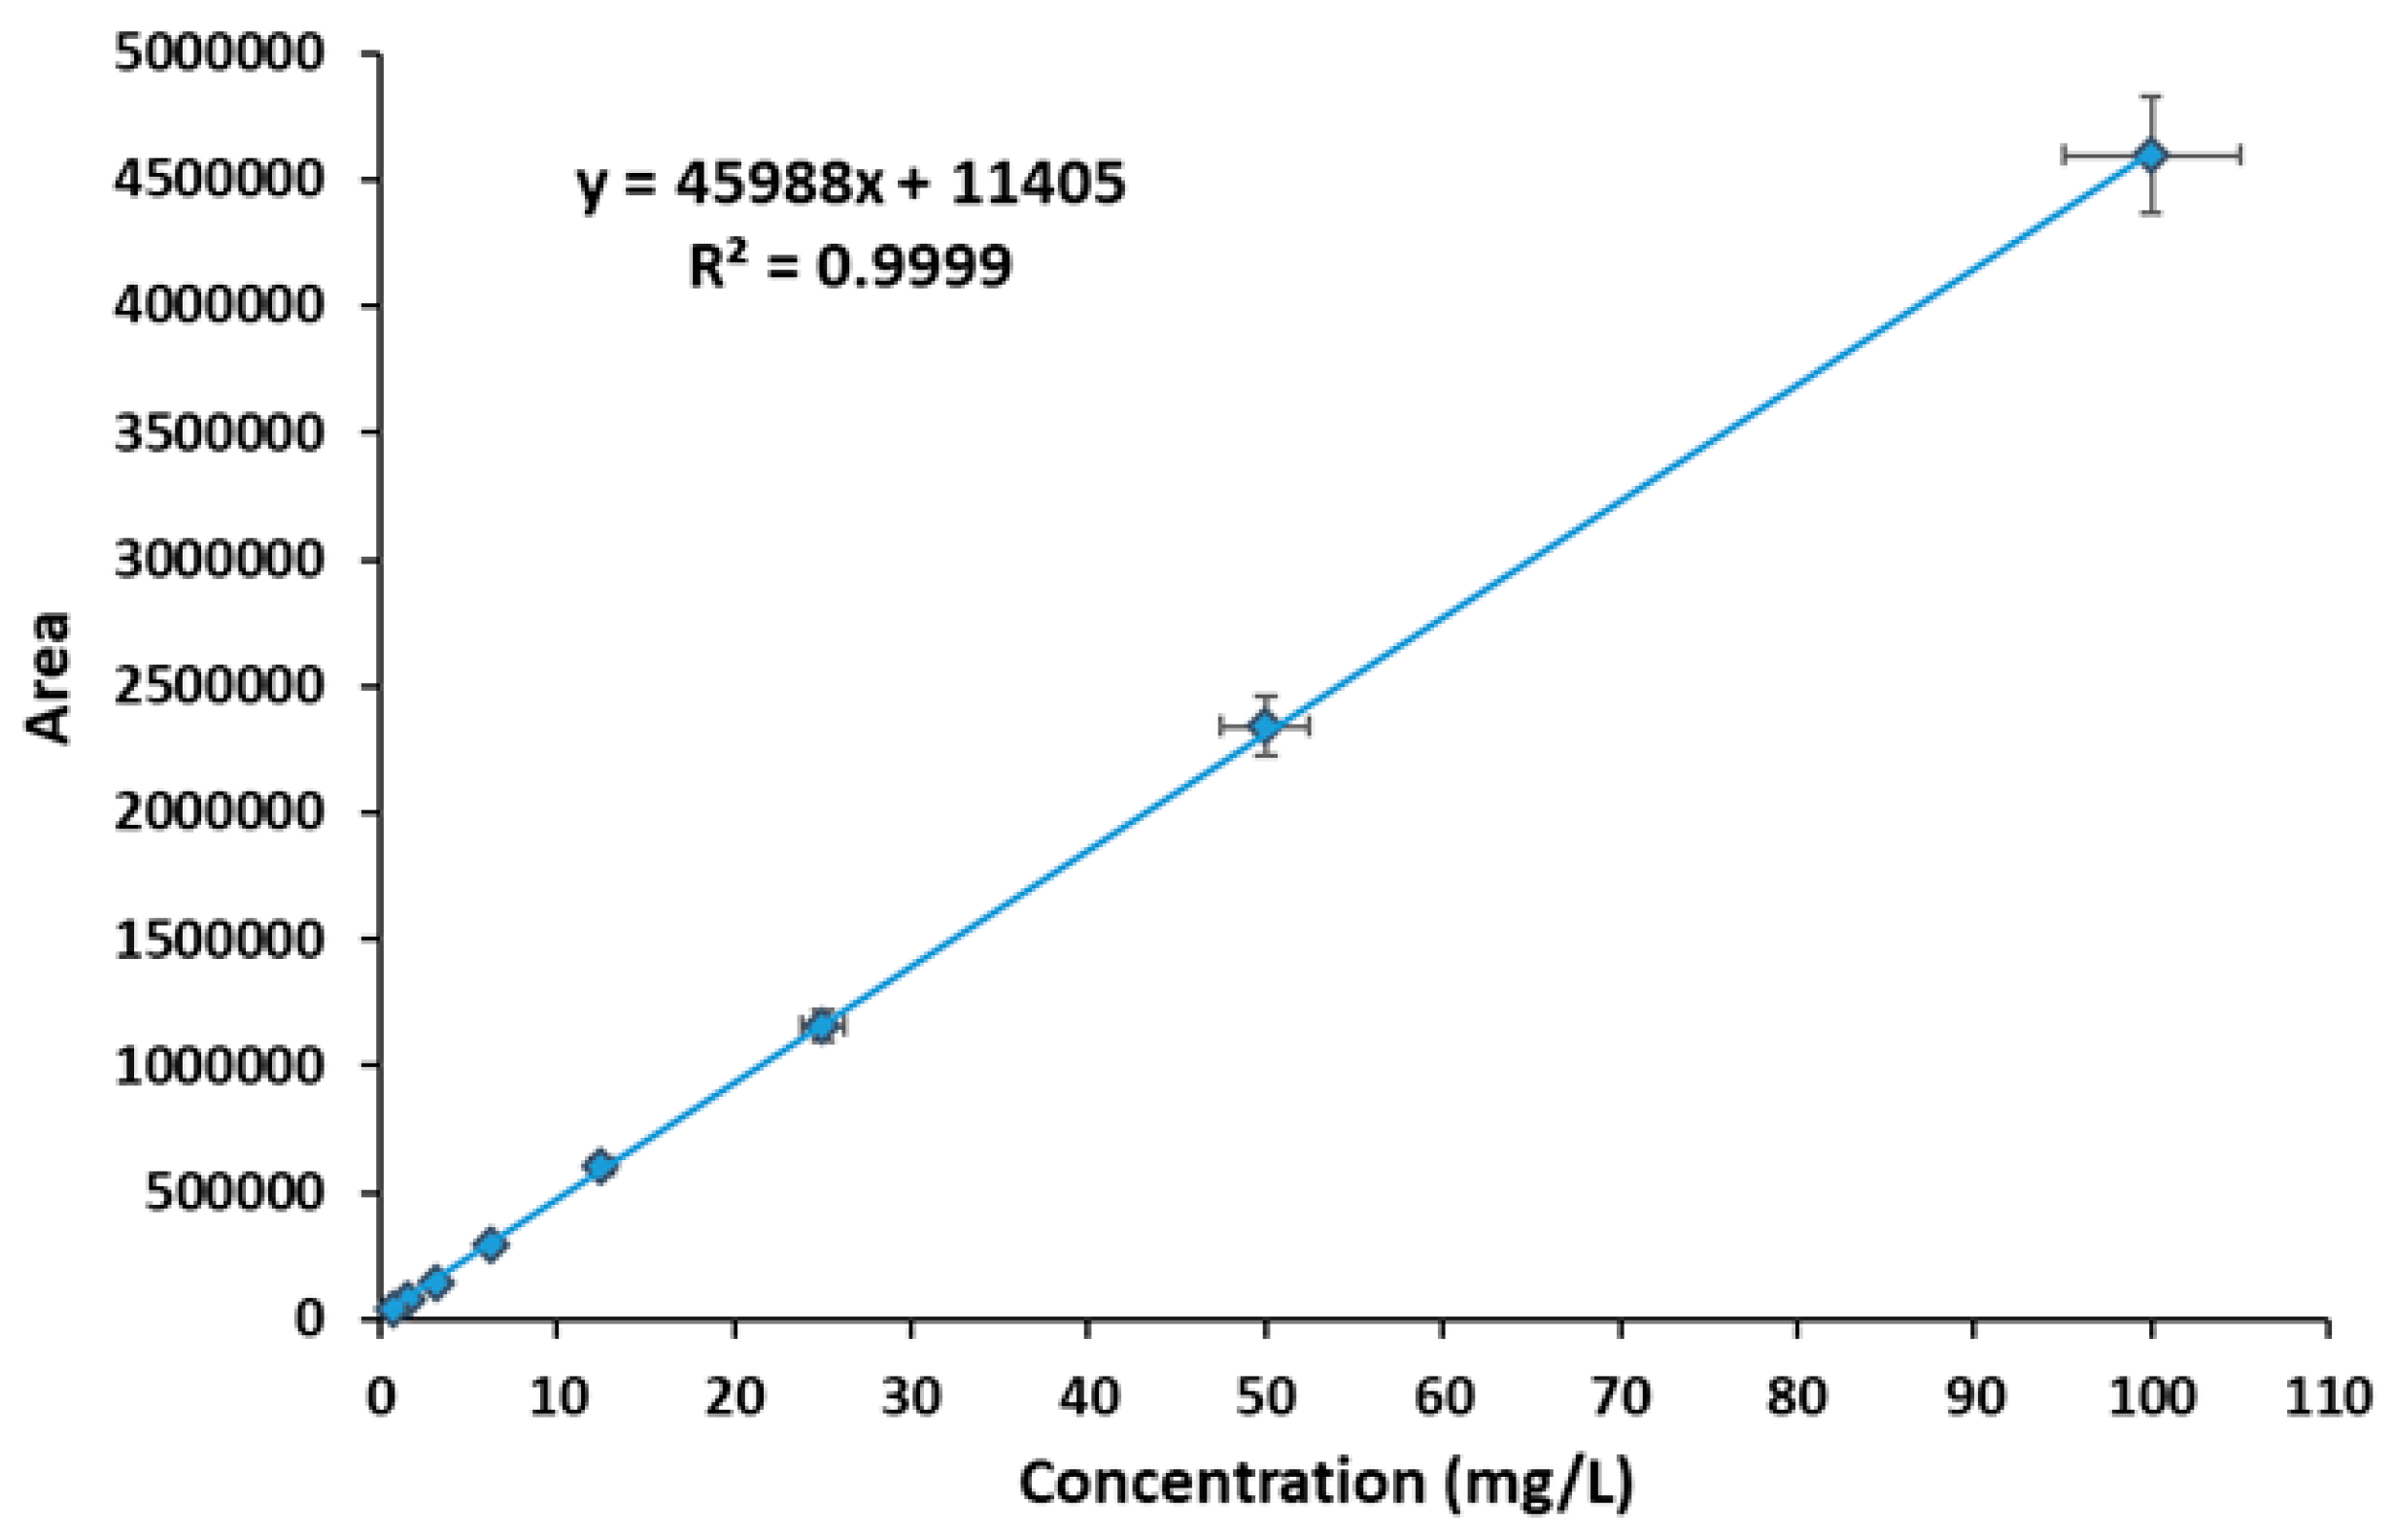
Figure 7.
DL capacity (a) and DEE% of hydrogels (b) (mean ± SD, n=3) (* p < 0.05).
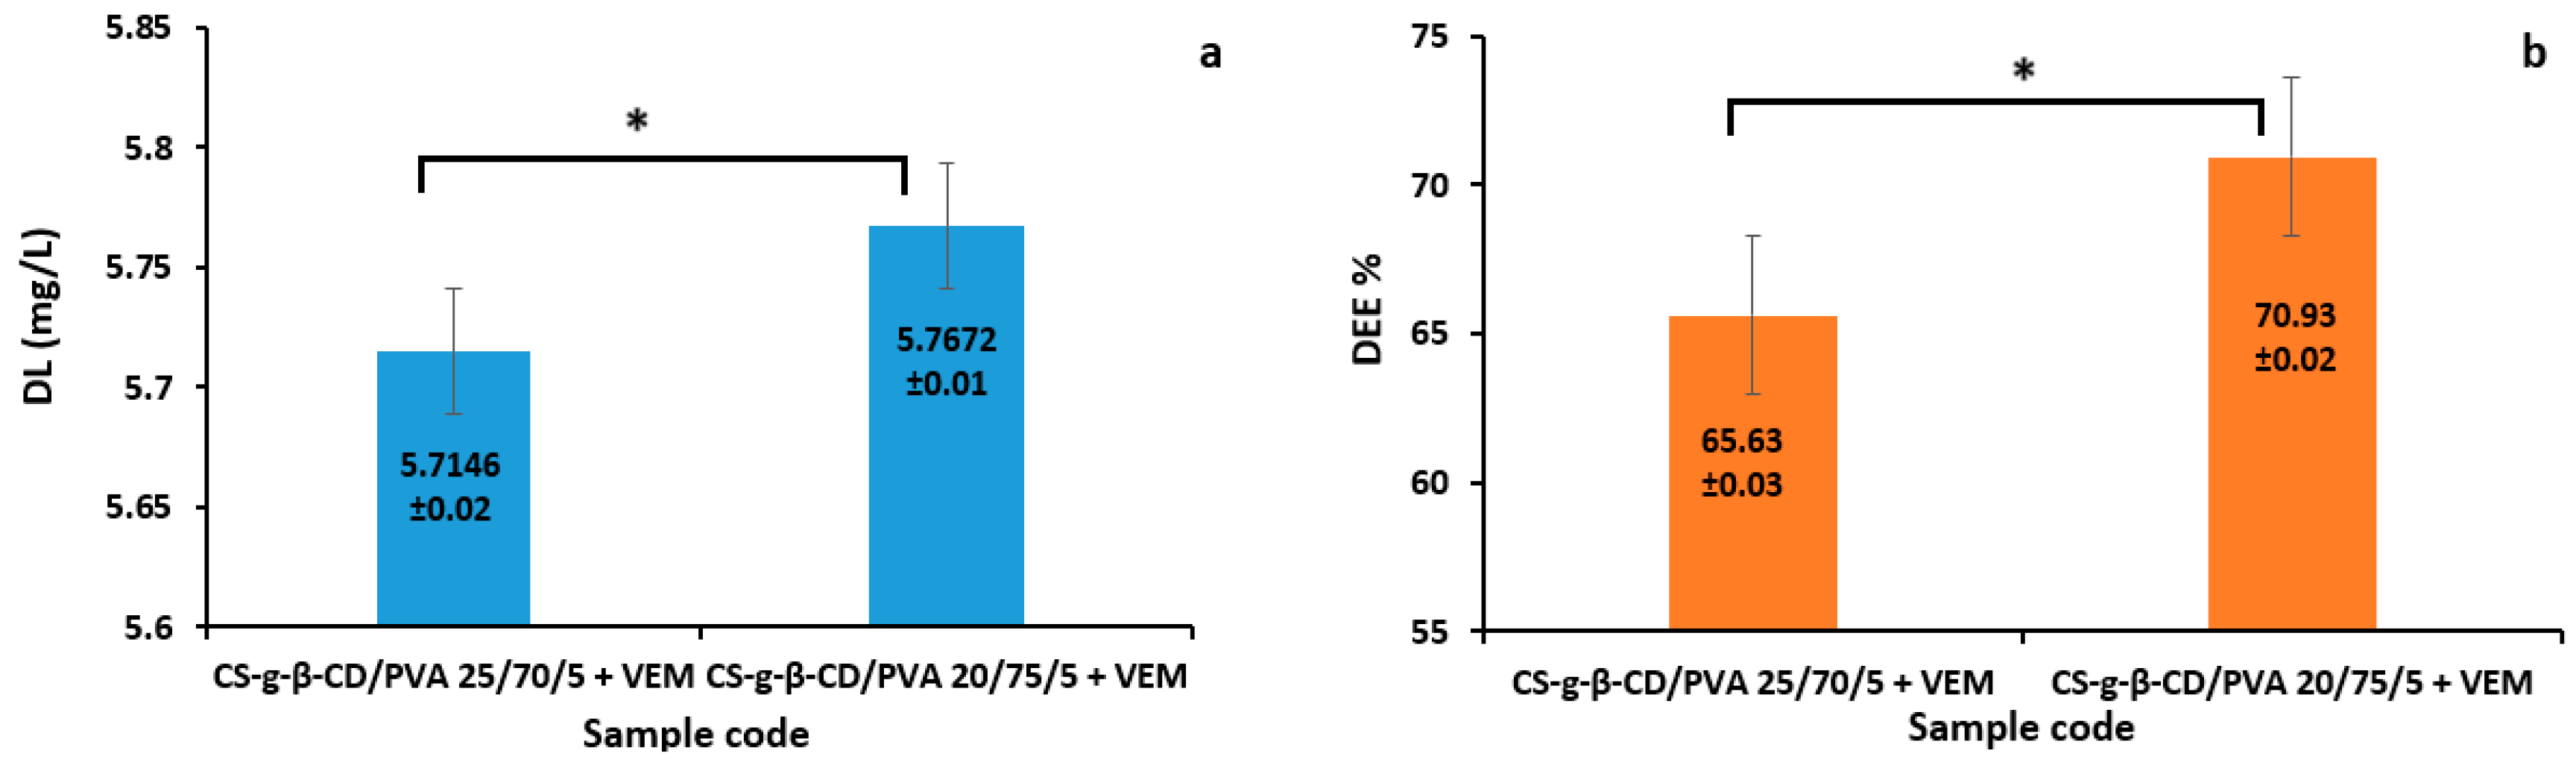
Figure 8.
Drug release of VEM. Data are mean ± SD within ±2 (n = 3).
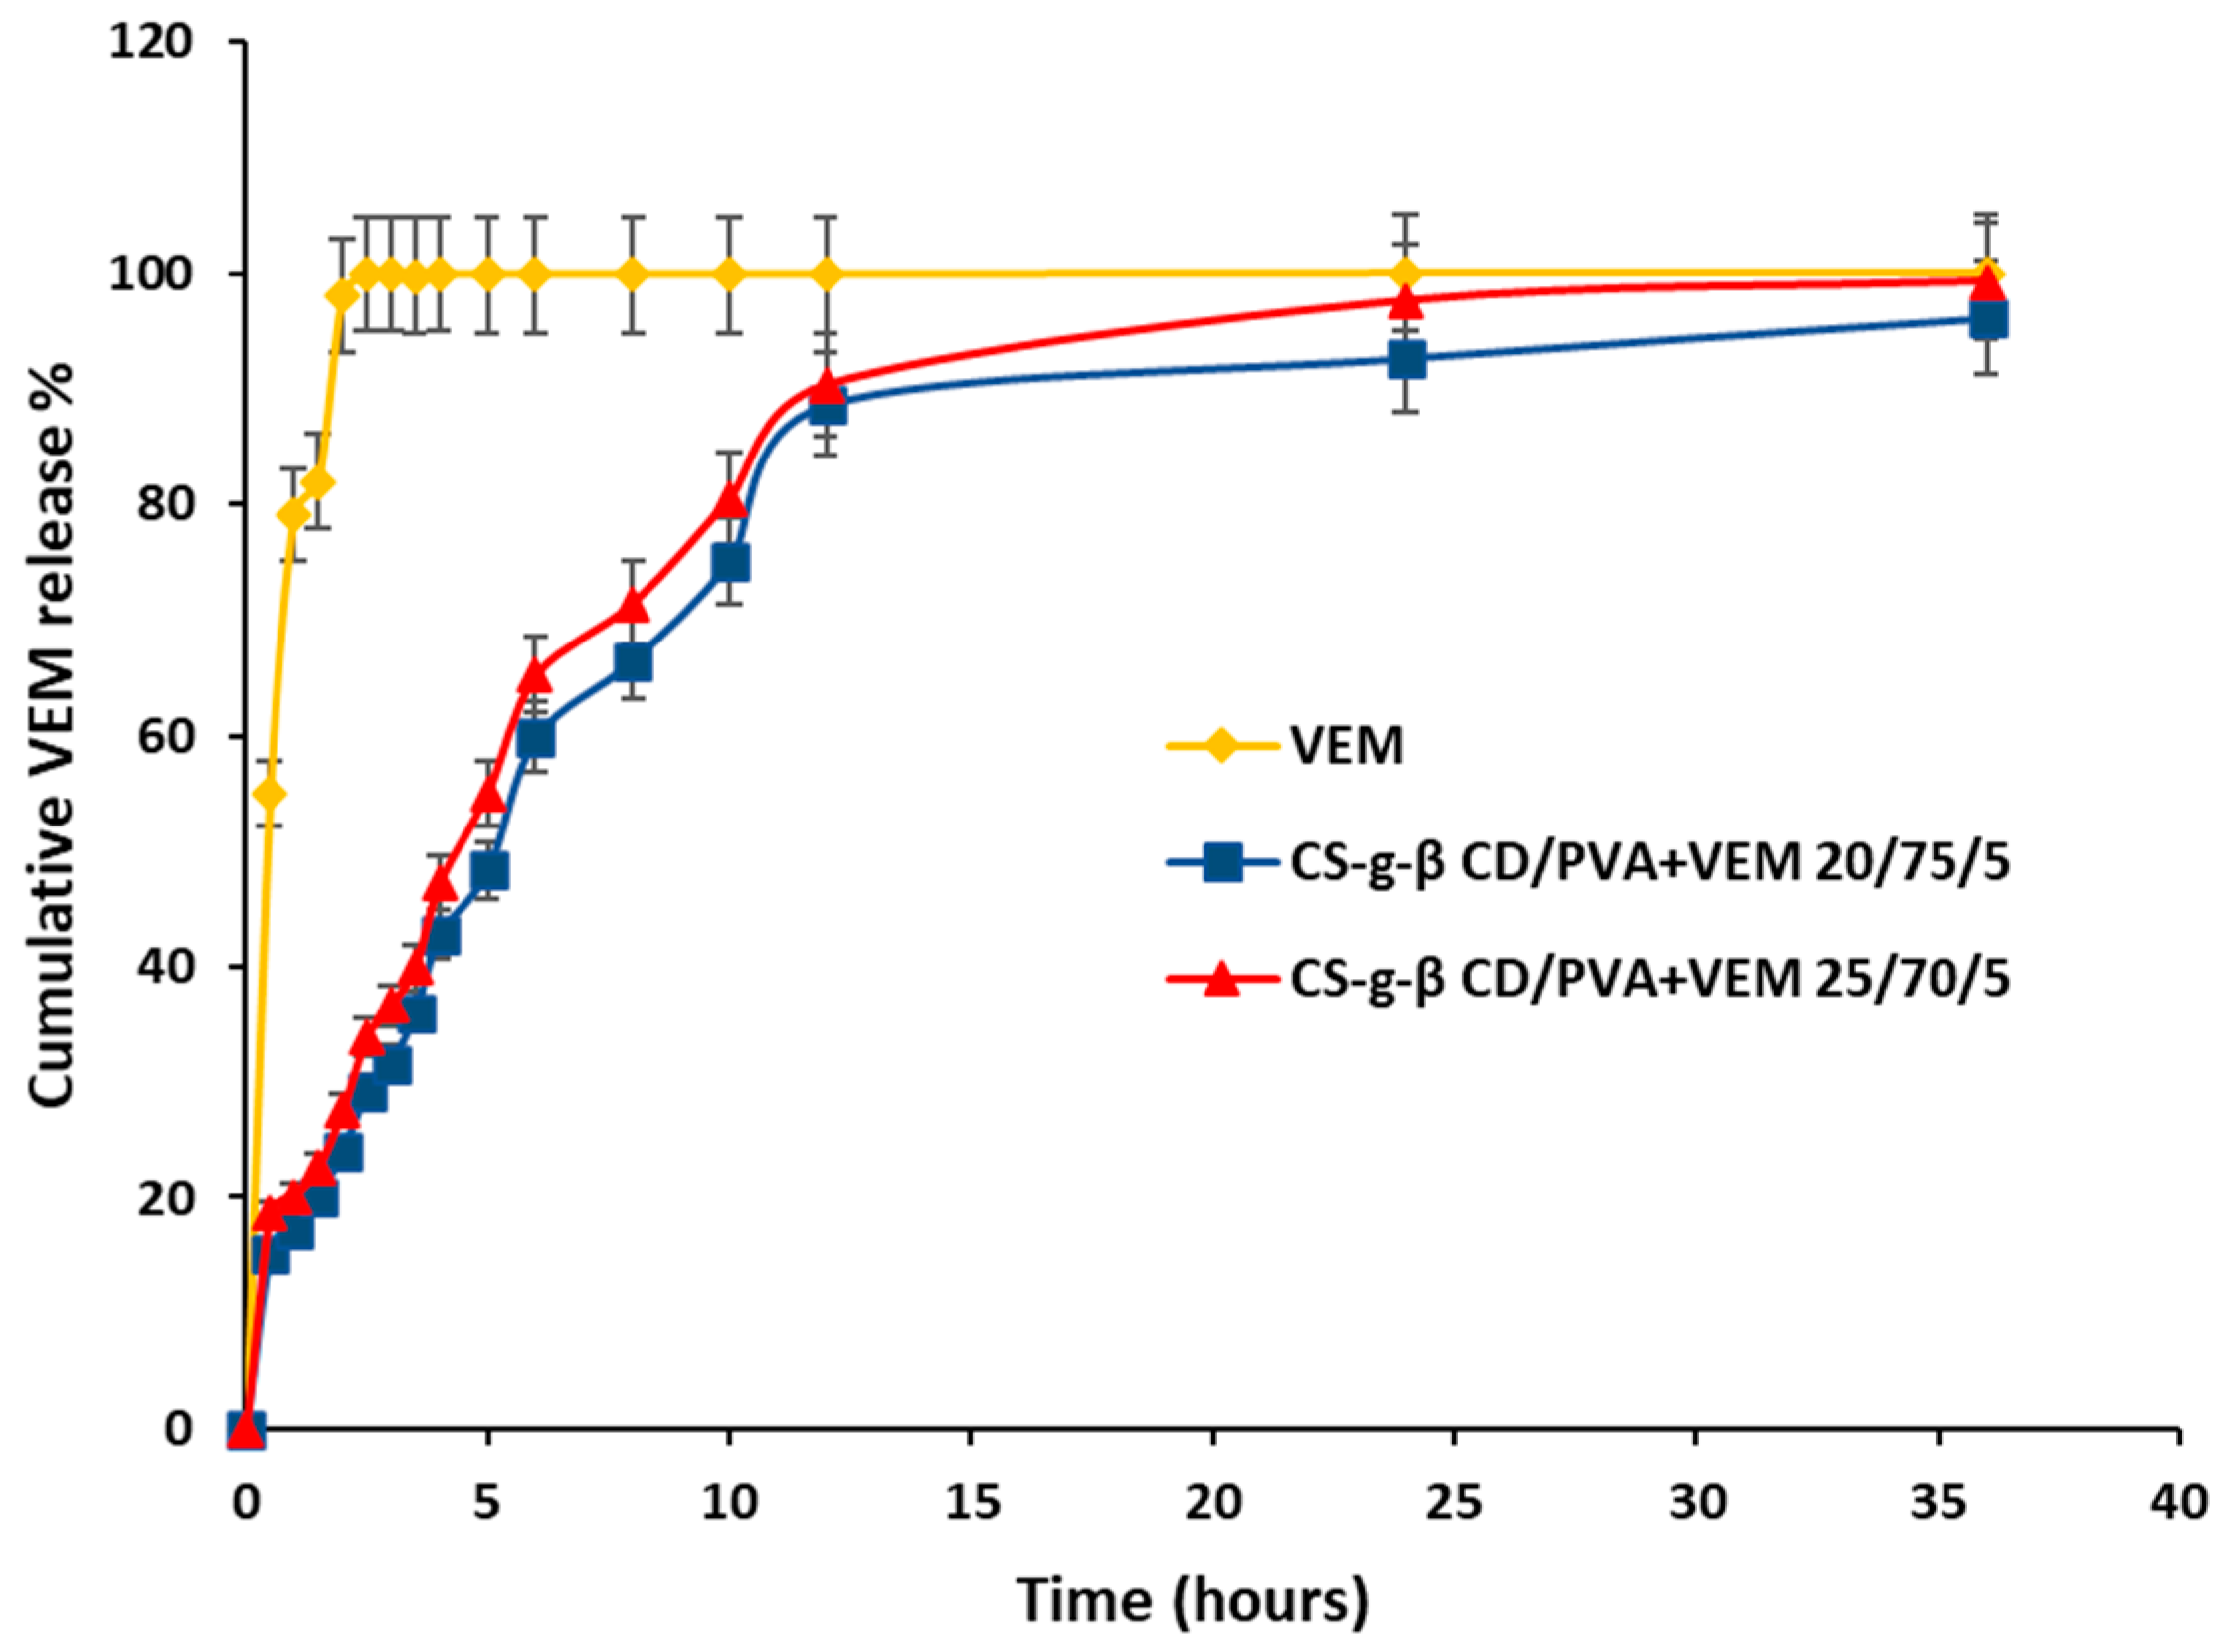

Table 1.
System suitability test for VEM.
|
System Suitability Parameter |
Acceptance Criteria |
Results |
| Injection Precision for Retention Time (Min) | RSD ≤ 1% | RSD = 0.97 |
| Injection Precision for Peak Area | RSD ≤ 1% | RSD = 0.91 |
| USP Tailing Factor (T) | T ≤ 2.0 | 1.15*±0.06 |
| Capacity Factor (K) | K ≥ 2.0 | 7.02*±0.15 |
| Theoretical Plates (N) | N ≥ 2000 | 5562*±0.02 |
*Mean of six determinations.
Table 2.
Calibration data for the range 0.78-100 mg/L VEM.
| No. |
VEM (mg/L) |
Area mean ± SD (n= 3) |
| 1. | 0.78 | 37776 |
| 2. | 1.5625 | 78257 |
| 3. | 3.125 | 146193 |
| 4. | 6.25 | 291083 |
| 5. | 12.5 | 606229 |
| 6. | 25 | 1158865 |
| 7. | 50 | 2339810 |
| 8. | 100 | 4594650 |
SD: Standard Deviation.
Table 3.
Precision and accuracy of VEM determination.
| Theoretical conc. of VEM (mg/L) | Accuracy | Precision | ||||
| Mean recovered conc. of VEM | Mean % recovery |
Intra-day | Inter-day | |||
| Mean*±SD | %RSD | Mean*±SD | %RSD | |||
| 40 | 39.78 | 99.45 | 40.98±0.3141 | 0.71 | 41.08±0.3401 | 0.68 |
| 50 | 50.05 | 100.10 | 50.12±0.2856 | 0.67 | 50.06±0.2536 | 0.63 |
| 75 | 75.01 | 100.01 | 75.08±0.3452 | 0.78 | 75.02±0.3452 | 0.73 |
*Each value is represented as a mean ± SD of observations; SD: Standard Deviation; RSD: Relative Standard Deviation.
Table 4.
Robustness results for VEM.
| Parameter | Variation | Retention time (min) | Theoretical Plates | Tailing Factor |
|
Flow Rate |
0.8 mL/min | 6.23 | 5492 | 1.08 |
| 1 mL/min | 6.01 | 5547 | 1.12 | |
| 1.2 mL/min | 5.98 | 5562 | 1.12 | |
|
Wavelength |
250 nm | 6.03 | 5649 | 1.11 |
| 252 nm | 6.01 | 5598 | 1.10 | |
| 254 nm | 5.99 | 5697 | 1.06 | |
|
Temperature |
38°C | 6.02 | 5789 | 1.13 |
| 40°C | 6.00 | 5856 | 1.02 | |
| 42°C | 6.02 | 5698 | 1.03 |
Table 5.
Stability data (recovery [%]; ± SD; n = 3) of vemurafenib.
| Conditions | High concentration | Low concentration |
| 24 h at ambient temperature | 101.5 ± 1.3 | 93.7 ± 0.6 |
| 3 free-thaw cycles | 105.3 ± 1.6 | 94.8 ± 2.3 |
| 3 month -30°C | 102.5 ± 1.8 | 97.3 ± 3.8 |
Table 6.
Comparison of the performed method with other HPLC methods.
| No. |
Stationary phase/ chromatographic column |
Mobile phase and flow rate |
Detection/ Tr |
Statistical parameters |
Practical application |
Ref. |
| 1 | Xterra® MS C8 (250 mm × 4.6 mm, 5 µm) |
glycine buffer (pH 9.0, 100 mM) : acetonitrile (45:55, v/v) 0.9 mL/min |
249 nm 6.3 min |
*DL = 1.25-100 mg/L LOQ = 1.25 mg/L r2 = 0.99 Recovery = 99,1% |
mouse plasma | [57] |
| 2 | X-Terra RP-18 (250 x 4.60 mm, ID 5 µm) | acetonitrile : water 60:40 (v/v) 1.0 mL/min |
249 nm 6.69 min |
DL = 2-10.0 mg/mL LOQ = 0.146 mg/L r2 = 0.9999 Recovery = 100.1- 102.33% |
human urine | [62] |
| 3 | Acquity UPLC® BEH C18 (30 mm × 2.1 mm, 1.7 µm) |
0.1% (v/v) formic acid in water (10%, v/v) : water (20%, v/v) : methanol (70%, v/v) 0.6 mL/min |
MS m/z 490.1→255.05 | DL = 0.1–100 mg/L LOQ = 0,1 mg/mL r2 = 0.9996 Recovery = 99-106% |
human and mouse plasma | [38] |
| 4 | Symmetry C18 (4.6 mm × 150 mm, 5 μm) |
methanol : water (45:55, v/v) 1.0 mL/min |
260 nm 2.379 min |
DL = 24-120 mg/L LOQ = 16.7 mg/mL r2 = 0.998 Recovery = 99.4-99.9% |
in pure form and dosage forms | [58] |
| 5 | Symmetry ODS C18 (4.6 x 250 mm, 5 μm) |
acetonitrile : methanol (80:20, v/v) 1.0 mL/min |
272 nm 3.15 min |
DL = 10-50 mg/L LOQ = 3.2 mg/L r2 = 0.999 Recovery = 98.0-102% |
in pure form and dosage forms | [63] |
| 6 | Acquity UPLC BEH C18 column (2.1 × 50 mm, 1.7 mm) |
10 mM ammonium acetate in water (A) and methanol (B) with applied phase gradient: 50–80% B (0.0–0.5 min), 80% B (0.5–2.5 min), 80–95% B (2.5–2.6 min), 95% B (2.6–3.6 min), 95–40% B (3.6–3.7 min), 50% B (3.7–7.0 min). 0.25 mL/min |
MS m/z 488.2 → 381.0 3.4 min |
DL = 1.0 -100.0 mg/L LOQ = 0.1mg/mL r2 = 0.9985 |
human plasma |
[41] |
| 7 | Waters CORTECS C18 column (2.1 × 100 mm, 2.7 μm) | water/formic acid - (99.9/0.1, v/v) : acetonitrile : methanol 40:55:5 (v/v/v) 1.0 mL/min |
252 nm 6 min |
DL = 0.78-100 mg/L LOQ = 0.75 mg/L Recovery = 99,45-100.0% r2 = 0.9999 |
hydrogels |
The propo- sed method |
*DL = linearity domain.
Table 7.
Data fitting results of in vitro VEM release profile from hydrogels.
| Kinetic Model | Parameters | Sample | |
| CS-g-β-CD/PVA 25/70/5 | CS-g-β-CD/PVA 20/75/5 | ||
| Zero order | K0 | 4.588 | 4.302 |
| r2 | 0.668 | 0.496 | |
| AIC | 148.420 | 144.043 | |
| First order | K | 0.155 | 0.156 |
| r2 | 0.895 | 0.839 | |
| AIC | 6.887 | 14.342 | |
| Higuchi | KH | 27.513 | 29.468 |
| r2 | 0.923 | 0.865 | |
| AIC | 125.549 | 134.365 | |
| Korsmeyer–Peppas | KP | 45.991 | 48.097 |
| n | 0.372 | 0.293 | |
| r2 | 0.958 | 0.897 | |
| AIC | 103.589 | 108.123 | |
K0 - constant of zero order release rate; K - constant of first order release rate; KH - constant of Higuchi model release rate; KP - constant of Korsmeyer–Peppas model release rate; n = diffusion exponent.
Disclaimer/Publisher’s Note: The statements, opinions and data contained in all publications are solely those of the individual author(s) and contributor(s) and not of MDPI and/or the editor(s). MDPI and/or the editor(s) disclaim responsibility for any injury to people or property resulting from any ideas, methods, instructions or products referred to in the content. |
© 2025 by the authors. Licensee MDPI, Basel, Switzerland. This article is an open access article distributed under the terms and conditions of the Creative Commons Attribution (CC BY) license (http://creativecommons.org/licenses/by/4.0/).
Copyright: This open access article is published under a Creative Commons CC BY 4.0 license, which permit the free download, distribution, and reuse, provided that the author and preprint are cited in any reuse.


