
Submitted:
17 February 2025
Posted:
18 February 2025
You are already at the latest version
Abstract
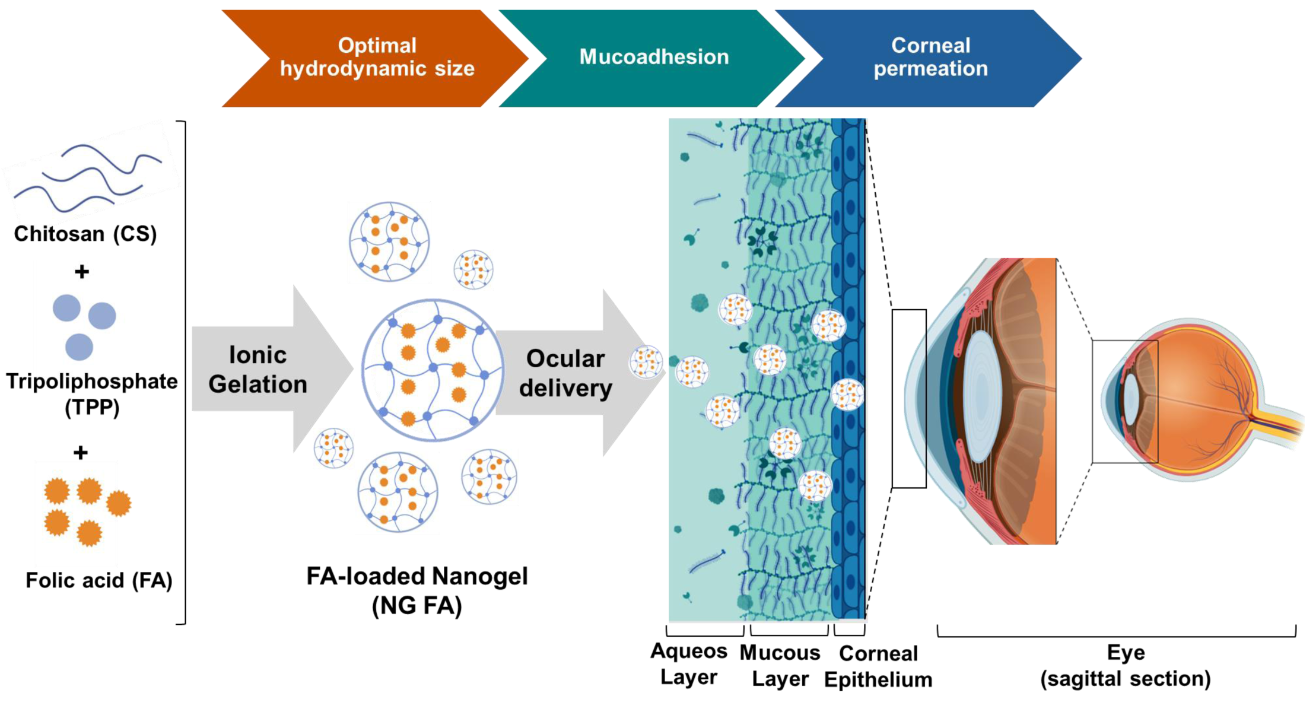
Folic acid (FA) is essential for cellular functions but has limited ocular bioavailability, which restricts its therapeutic effectiveness. This study developed chitosan-based nanogels (NG) as FA carriers, evaluating their mucoadhesion, drug release, and corneal permeation. Freshly prepared NGs had a hydrodynamic diameter of 312.4 ± 8.2 nm and a polydispersity index (PdI) of 0.28 ± 0.04, determined by Dynamic Light Scattering (DLS). FA encapsulation was confirmed through Fourier Transform Infrared (FTIR) spectros-copy, Differential Scanning Calorimetry (DSC), and Thermogravimetric Analysis (TGA). Scanning Electron Microscopy (SEM) revealed a uniform spherical morphology with minor variations in size and shape upon FA entrapment. Freeze-dried NG showed a 6.8% of size increase and PdI rise to 0.42, indicating aggregation within acceptable limits. In vitro drug release studies using a modified Franz diffusion cell demonstrated sustained FA release whose profile was fitted with Higuchi model. Mucoadhesion studies, carried out by ζ-potential measurements, revealed a decrease from +36.9 to +18.1 mV, confirming electrostatic interactions with mucin. Ex vivo corneal permeation in rabbits showed that encapsulated FA permeated 2.6 times slower than free FA, indi-cating sustained release. In conclusion, our findings demonstrate the potential of FA-loaded NG to enhance ocular drug delivery and bioavailability.
Keywords:
chitosan
; folic acid
; nanogels
; mucoadhesion
; corneal permeation
1. Introduction
Topical drug application to the eye is significantly hindered by the eye's protective physiological mechanisms, particularly in the cornea, leading to substantial drug loss [1]. Natural defence mechanisms, such as rapid nasolacrimal drainage, tearing, and lacrimation, efficiently remove foreign particles, preventing most of the drug from reaching the targeted ocular tissues. Consequently, less than 5% of the administered drug penetrates the cornea and reaches intraocular tissues [2]. To address these challenges, ocular drug delivery strategies have focused on enhancing bioavailability and prolonging the residence time of topically applied drugs in the eye [2,3].
Among the various strategies explored to enhance the residence time of drugs on the corneal surface and facilitate their permeation, mucoadhesive polymers, particularly in the form of nanoparticles (NPs), have emerged as promising options [4,5]. In this sense, chitosan (CS) is one of most notable polymeric candidates with those properties [6,7,8]. CS is a cationic polysaccharide that exhibits several favourable biological properties, such as biodegradability, non-toxicity, biocompatibility, and strong mucosal adhesion capabilities [9]. It has been suggested that the electrostatic interaction between the positively charged amino groups of CS and the negatively charged sialic acid residues in mucus, at the physiological pH values, is the primary mechanism behind its mucoadhesion. This unique combination of characteristics makes CS a highly versatile biopolymer, ideal for use in ocular medicine [10,11].
Building on these principles, CS-based NPs, such as nanomicelles, nanosuspensions, and nanogels (NG), offer key advantages, including rapid preparation under mild conditions and efficient incorporation of bioactive compounds [8,12,13]. CS-based NG can be spontaneously synthesized through the ionic gelation method by combining CS solution with tripolyphosphate (TPP), a polyanionic cross-linker. This interaction leads to the formation of both inter- and intramolecular bonds, resulting in a stable gel network. Specifically, TPP facilitates gelation via electrostatic interactions between the positively charged NH₃⁺ groups of CS and its negatively charged counterparts, including hydroxyl (OH⁻) and phosphate species (HP₃O₁₀⁴⁻ and P₃O₁₀⁵⁻), ensuring effective cross-linking and structural integrity [14].
Particularly, this report focuses on the encapsulation of folic acid (FA), the fully oxidized monoglutamic and synthetic form of folate (vitamin B9), which occurs naturally in vegetables, green leafy plants, citrus fruits, bananas, eggs, and liver. Also, it is commonly added to fortified foods and supplements [15]. FA (C₁₉H₁₉N₇O₆) plays a crucial role in DNA synthesis, cell division, homocysteine metabolism, and cell through its protection because of its antioxidant activities. For these reasons, FA is essential for health and the prevention of various diseases. Particularly, FA deficiency contributes to elevated homocysteine levels, which are detrimental to ocular health, especially in the retina. Elevated retinal homocysteine leads to neuronal death in the ganglion cell layer, altering the retinal structure and contributing to retinal diseases such as age-related macular degeneration, glaucoma, and diabetic retinopathy [16]. Moreover, FA deficiency is associated with an increased risk of cataracts as well as chronic conjunctivitis, causing inflammation and corneal damage [17]. Overall, maintaining adequate folate levels may serve as a preventive strategy for these ocular conditions, highlighting the importance of FA in supporting eye health [18,19].
In previous reports, we carefully optimized a NG formulation using the ionic gelation (IG) method, systematically adjusting the concentrations of CS and TPP to efficiently encapsulate bioactive compounds [14,20,21]. In this context, the present study investigates the potential of FA-loaded NGs to enhance precorneal residence time, incorporating comprehensive physicochemical and biopharmaceutical characterization to assess their efficacy.
2. Materials and Methods
2.1. Materials
Medium molecular weight (MW) CS (192 kDa) [21] was from Parafarm® (Saporiti S.A.C.I.F.I.A., Buenos Aires, Argentina; Ref. # 11017A). FA (99.2% of purity) was generously provided by Laboratorios Bagó S.A. [22]. TPP, phosphate-buffered saline (PBS), semi-permeable cellulose acetate membrane (MWCO of 12,000 Da) and mucin from porcine stomach type III bound sialic acid 0.5-1.5% were obtained from Sigma-Aldrich Co. (St. Louis, MO, USA). Ringer's solution (pH = 7.2) was prepared to carry out the in vitro release assays. The water employed was of Milli-Q standard (Merck Millipore, Darmstadt, Germany). All other chemicals and solvents used were of the highest purity available and were generally applied without further processing.
2.2. NG FA Preparation
NG FA were prepared as previously described by Silva Nieto et al. [20] by IG method [9]. TPP (Cf = 0.075% w/v; pH 9) was added dropwise to a CS solution (Cf = 0.225% w/v; pH 4.5) under magnetic stirring at room temperature (RT). FA (Cf = 300 or 500 µM; pH 7.4) was added together with the crosslinker, and the mixture was stirred for 30 min. Blank NG were prepared similarly, using Milli-Q water instead of FA. Samples were high intensity ultrasound (HIUS)-treated for 5 min at 750 W and 20 kHz frequency, with 20% of amplitude. The samples in glass test tubes were placed in a glycerine-jacketed cooling bath at 0.5 °C to prevent heat buildup. When it was necessary, NG suspensions were dispersed in sucrose at 3% w/v and frozen at -20°C for 24 h. Subsequently, the samples were lyophilized for 24 h using Labconco Freezone® 6 equipment (Labconco, Kansas City, MO, USA).
2.3. Characterization Techniques for NG FA
2.3.1. NG Size and Electrokinetic Potential
The particle’s hydrodynamic diameter (Ho), polydispersity index (PdI), and zeta potential (ζ-Pot) of the lyophilized and non-lyophilized NG were determined using photon correlation spectroscopy, also known as dynamic light scattering (DLS). For all measurements, a DLS Nano Zetasizer® ZS90 (Malvern Instruments S.A., UK) equipped with a diode laser operating at a wavelength of 632.8 nm and a detection angle of 173° was used. To obtain particle size distribution and PdI, samples were contained in disposable polystyrene cuvettes (DTS0012, Malvern Instruments, Worcestershire, UK). On the other hand, to determine the ζ-potential values, samples were placed in disposable capillary cells (DTS1060, Malvern Instruments, Worcestershire, UK). Measurements were performed at 25°C (n=3). The obtained data were analysed and interpreted according to previous reports [21,23].
2.3.2. Scanning Electron Microscopy (SEM)
SEM analysis was conducted using a Sigma FE SEM microscope (Carl Zeiss, Oberkochen, Germany). NG and NG FA-300 samples were placed on a copper sheet, dried at RT, and shielded from light before being coated with a gold-palladium layer (70:30 w/w) using a PELCO Model 3 spray coating device [24]. Size frequency distribution was calculated from representative SEM images by employing through Fiji imaging software (Fiji Is Just ImageJ) [20].
2.3.3. Fourier Transform Infrared (FT-IR) Spectroscopy
Infrared spectra were obtained by placing a lyophilized samples into the FT-IR spectrometer (Cary 630, Agilent Technologies, USA) and scanned from 4000 to 600 cm−1. Data were analysed using OMNIC software (Thermo® Fisher Scientific, USA). The position and intensity of the absorption bands in the FTIR spectra were used to analyse the functional groups according to libraries and bibliography [25].
2.3.4. Thermal Properties of Dehydrated Samples: Differential Scanning Calorimetry (DSC) and Thermogravimetric Analysis (TGA)
Thermal properties of the various samples were analysed using a DSC (TA Instruments, New Castle, DE, USA). Measurements were performed in a temperature range from 0 to 260 °C, under a dynamic atmosphere of N2 (50 mL/min) and with a heating rate of 10 °C/min, using non-hermetics aluminium pans. Pre-calibration was performed with indium according to the manufacturer’s recommended protocol.
For TGA, another 4 mg of each sample was placed in non-hermetics aluminium nanocapsules and subjected to a N2 flow of 50 mL/min; heating ramp of 10°C/min in a temperature range of 25 to 250°C. Pre-calibration of the equipment (TA Instruments, New Castle, DE, USA, Discovery model) of the temperature scale was performed with nickel according to the manufacturer’s recommended protocol. In both cases, TRIOS software (Version number 5.1.1, USA) was used for data processing [24].
2.4. Biopharmaceutical Evaluation
2.4.1. In Vitro Release Studies
FA release studies were conducted using a modified Franz diffusion cell, set at a temperature of 35.0 ± 0.5 °C. The diffusion cell, made of acrylic, was divided into two compartments: the donor compartment (1.0 mL) and the receptor compartment (4.0 mL) [26]. A semi-permeable cellulose acetate membrane separated the two compartments. In the donor compartment, 1 mL of NG suspension was introduced, while the receptor compartment was filled with PBS buffer, continuously aerated with a 95% O2 and 5% CO2 mixture to maintain constant agitation. At predetermined intervals, 1 mL samples were extracted from the receptor compartment and replaced with the same volume with fresh PBS. The FA concentration in the receptor compartment was quantified using UV-Vis spectroscopy at λ= 282 nm, with each measurement repeated three times [23,27].
In zero-order kinetics, the release is governed by the relaxation of polymer chains, while diffusion occurs at a constant rate, provided the system's geometry remains unchanged throughout the release process:
Where k is the release rate constant.
The Higuchi model describes drug release from a matrix system, where the release rate is proportional to the square root of time:
Where is the fraction of solute released at time and k is the release rate constant.
The Korsmeyer-Peppas model describe the drug release mechanism from polymeric systems with swelling capacity:
Where ft is the ratio of absolute cumulative amount of the drug released at time t and at t∞, a is the constant that incorporates structural and geometric characteristic of the carrier, and n is the release exponent indicative of drug release mechanism. Particularly, when n ≤ 0.45 indicates Fickian diffusion, 0.45 - 0.89 suggests non-Fickian kinetics, n = 0.89 corresponds to case II transport, and n > 0.89 signifies super case II transport.
2.4.2. NG Mucoadhesion Evaluation
These assays were performed according to the protocol of [30]. Briefly, the mucin solution was prepared in ultrapure water to a Cf: 2 mg/mL. Next, 1.0 mL of NG, NG FA-300, and NG FA-500 were each mixed with an equal volume of the free mucin solution.
The ζ-Pot values of mixed solution, NG + mucin (MC) were then measured at RT as described in section 2.3.1, at the initial time (t0h) and after one day (t24h).
2.4.3. Ex-Vivo Trans-Corneal Permeation Studies
New Zealand white female rabbits (2 - 2.5 kg) were housed individually with ad libitum access to food and water and under a 12/12-hour light/dark cycle. After anaesthesia with phenobarbital, they were euthanized with a 10% O2 and 90% CO2 mixture. Eyeballs were enucleated for retinal evaluation, as formerly described [23,26]. All the experiments were conducted in accordance with the procedures of the Association for Research in Vision and Ophthalmology (ARVO) resolution on the use of animals in research, the European Communities Council Directive (86/609/EEC), and the Institutional Care and Use Committee of the School of Medicine Sciences, National University of Cordoba (CICUAL) (Res.CE-2021-00338577-UNC-SCT#FCM). All efforts were made to reduce the number of animals used.
Ex-vivo trans-corneal permeation studies were carried out as previously described [26]. Briefly, rabbits were anesthetized with phenobarbital and euthanized using 10% O2 and 90% CO2. A modified Franz diffusion cell was employed, with the obtained cornea placed between donor and receptor compartments. The cornea’s endothelial side was in contact with PBS (4 mL), while the epithelial side faced the donor solution (1.0 mL). The chamber temperature was maintained at 35.0 ± 0.5°C. Free FA or NG-FA samples were taken at set intervals (15 - 120 min). Samples were measured at FA’s maximum absorption wavelength (λ= 282 nm) by employing a Thermo®-Evolution 300 UV-Vis spectrophotometer (Thermo Scientific™, England). The permeation area was 0.785 cm2.
A linear regression analysis of the obtained diffusion data allowed calculating the following parameters:
- (i)
- Steady-state flux (J): v/A (µg/min·cm2), where A is the effective available tissue surface area.
- (ii)
- Permeation rate (v): ∆Q/∆t (µg/min), where Q is the amount of FA diffuse through the cornea at time t.
- (iii)
- Apparent Permeability Coefficient (Papp): J/Ci, where Ci is the initial drug concentration of the donor medium.
2.5. Statistical Analysis
Experiments were conducted in triplicate unless otherwise stated. In vitro drug release assays were analysed using Kaleida Graph 4.0 (Williamstown, MA, USA). Results are presented as mean ± standard deviation (S.D.). When applicable, statistical analysis was performed using one- or two-way ANOVA, followed by Tukey’s post hoc test. Statistical significance was set at p < 0.05. All analyses were conducted using GraphPad Prism 8.3.0 (San Diego, CA, USA).
3. Results and Discussion
3.1. NG Size Distribution and ζ-Pot
NG constituted by 2.25 mg/mL of CS and 0.75 mg/mL of TPP were selected for further investigation, sharing encapsulation efficiencies of 80.8 ± 1.2% for 300 µM FA (NG FA-300) and 80.6 ± 0.3% for 500 µM FA (NG FA-500).
Ho and PdI profiles are key parameters for assessing the structural stability and functional performance of nanoformulations, especially when subjected to lyophilization and further rehydration processes. Maintaining these parameters within optimal ranged ensures that the formulation retains its integrity and efficacy, which was crucial as a lyophilized drug system. Figure 1A shows that particle size distribution, whether expressed in terms of intensity or volume, remained nearly identical between the original and rehydrated NG or NG FA-500 suspensions. Also, within NG or NG FA-500, the mean values of Ho and PdI, along with their corresponding standard deviations, do not show significant variations before and after FD (Figure 1B). Notably, the NG FA-300 sample exhibited bimodal distribution profiles in both the intensity and volume graphs after rehydration (Figure 1A), which could explain the increase in PdI value. However, despite the statistically significant difference observed (p = 0.0211, p < 0.05), this variation corresponds to only a 68 nm increase in Ho (Figure 1B). Nevertheless, both Ho and PdI values remain within optimal ranges, confirming that the formulation is suitable for it use as a carrier for ophthalmic active compounds. This observation is supported by bibliographic evidence suggesting that polymodal nanosystems with particles larger than 1 µm are less effective in ocular drug delivery [31]. Optimal particle sizes are typically between 200 - 300 nm [32], as particles around 200 nm are efficiently absorbed topically [33]. Larger particles struggle to penetrate ocular barriers, limiting their ability to reach deeper tissues and causing potential irritation, inflammation, or reduced bioavailability. They may also cause visual disturbances and agglomerate over time. Smaller particles, benefiting from increased surface area and mobility (Brownian motion), are more likely to interact with cell membranes, enhancing drug delivery [34]. Therefore, particle sizes near 400 nm present challenges for ocular penetration and effectiveness. Additionally, PdI quantifies the distribution of particle sizes within a sample. A low PdI signifies a narrow size distribution, while a high PdI indicates a broader range of sizes [35]. PdI <0.3 is considered optimum, while values < 0.5 are within acceptable limits according to Onugwu et al. [36], who developed solid lipid NP coated with chitosan and poly(2-ethyl-2-oxazoline) for ocular drug delivery. These parameters should be carefully considered when selecting an optimized formulation for pharmaceutical product development [35]. Therefore, based on the data obtained, NG FA-300 would be the preferred choice among the samples with encapsulated FA.
3.2. FTIR Analysis for Structural Characterization
The chemical groups involved in the chemical interactions contributing to NG formation were investigated through the analysis of their FTIR spectra. Firstly, to facilitate the analysis, two comparisons were made: single TPP and CS versus NG (Figure 2A), and free FA versus NG FA-300 (Figure 2B).
The FTIR spectrum of TPP reveals a distinct band at 1210 cm−1, which is linked to the stretching vibration of P=O. Another peak at 1130 cm−1 corresponds to the stretching vibrations of the O−P=O group [20,37]. The spectrum of CS molecule exhibits the typical O-H stretching vibrations appear at 3416 cm−1. The peaks at 1643 cm−1 and 1511 cm−1 are associated with the bending vibrations of -NH in the -NH2 group and C-H in the alkyl chain of the polysaccharide. The characteristic peaks for the stretching vibrations of C-O-C linkages and the glucopyranose ring in the CS structure are found at 1043 cm−1 and 860 cm−1, respectively [21]. In NG, shifts in the peaks at 3390, 2880, 1580, 1400, 1020, and 880 cm−1 were observed, likely due to ionic interactions between the CS and TPP [21].
The FTIR spectrum of FA exhibited several characteristic peaks (Figure 2B). De Matteo et al. [22] reported that FTIR signals for FA were sharp, more typical from a crystalline material than an amorphous one, corroborated by powder X-ray diffraction analysis. Similarly, we detected the range of 3300-3550 cm−1 corresponded to the stretching vibrations of -NH and -OH groups from the pterin and glutamic acid portions, respectively. A distinct stretching vibration of the carbonyl group was observed at 1692 cm−1, with an additional C=O stretching vibration observed at 1680 cm−1. The band at 1600-1605 cm−1 was attributed to the bending vibrations of the -NH groups, while the peak at 1472 cm−1, along with the absorption at 1508 cm−1, was linked to the C-C vibration of the pterin ring and the aromatic C=C bending of the phenyl ring, respectively. Also, it was detected a peak at 840 cm-1 corresponding to C=C and a small vibration at 810 cm-1 that suggest a C-H deformation.
The encapsulation of FA within the NG was demonstrated by the vibrational changes between the free molecule and its entrapped form. The FTIR spectrum of NG FA samples exhibited a significant increase in the intensity of the absorption peak at 3423 cm−1, attributed to the overlapping stretching vibrations of the -NH and -OH groups. Two additional bands at 1613 cm−1 and 1136 cm−1 were observed, corresponding to C-N stretching vibrations, indicating interactions of FA with CS chain, which would be primarily driven by the electrostatic forces between the cationic amino group of CS and the anionic carboxyl group of FA. Moreover, a decrease in the intensity of the FA carbonyl stretching vibration was noted, along with a slight shift in this peak. The CS’s amide band also shifted from 1643 cm−1 to 1637 cm−1, likely due to the overlapping with the newly formed C-N bond with the vitamin. The FA peak at 1508 cm-1, assigned as the absorption of the phenyl ring of the vitamin was reduced in NG FA. Also, the FA shoulder next to 1508 cm-1 visualized in its spectrum, turn into a well-defined low intensity peak at 1480 cm-1 in the NG FA spectrum. The peaks at 840 and 815 cm-1 associated with the FA C = C and C-H bending, respectively are absent in NG FA spectrum. Consequently, the identified changes in the FA demonstrate the effectiveness of using CS-based NG for encapsulation with possible polymeric structural modifications. Notably, the NG formulation developed by Obrownick Okamoto-Schalch et al. [38] appears to be like these systems.
3.1.3. SEM Analysis of Ultrastructural Features
Figure 3 shows SEM images of NG at a 200 nm scale, displaying a quasi-spherical shape, as observed by Obrownick Okamoto-Schalch et al. [38] and Silva Nieto et al. [20].
Encapsulation of FA-300 resulted in an increase in NG size, confirmed by the histogram in Figure 3B and DLS results (Figure 1). Notably, no aggregation nor adhesion were detected in both NG and NG FA-300 were detected. Moreover, FA encapsulation led to both spherical and rod-like shapes, with variations in size and morphology compared to control NG [36]. While Fathima et al. [39], reported spherical and smooth surfaces for NG FA, they did not mention the NG used as control (with no encapsulated bioactive compound), which was formed with 0.3% of CS and 0.2% of TPP. Therefore, it is not possible to determine whether the encapsulation had any effect on the ultrastructure.
3.3. Thermal Behaviour Characterization
DSC measures heat flow into or out of a sample can be related with thermal events like melting and phase transitions. TGA monitors weight changes as a sample is heated, revealing thermal stability and decomposition. Both techniques were used here to analyse the thermal properties of materials. They are commonly applied in materials science, chemistry, and pharmaceuticals [40].
Figure 4A show the DSC thermogram of FA in which a broad endothermic peak Tpeak_1 temperature of 141°C indicates the melting point of the compound, while another peak Tpeak_2 appears at 210°C confirming the loss of the amide and acid functionalities, which indicates the degradation of FA and its transformation from the crystalline to the amorphous form. This peak was determined at 177°C by Fathima et al., [39] meanwhile Obrownick Okamoto-Schalch et al. [38] reported that FA was completely degraded at around 195°C. In this sense, the degradation peak of FA in DSC can vary due to factors like heating rate, atmosphere, sample purity, and form (crystalline or amorphous). Differences in equipment calibration and environmental conditions also influence the observed temperature. These factors contribute to variations across studies [41]. Regarding CS, the characteristic peak observed at 75°C is absent, likely due to the complete drying of the polymer sample, which removed the mayor part of the moisture during the dehydration process. The TPP exhibited four endothermic peaks at 133°C, 151°C, 191°C, and 225°C, which may be associated with structural changes in its crystalline form. The DSC of NG exhibited an endothermic event at 144°C, confirming the formation of a new structure with distinct thermal properties as typical substances composed of several but miscible components. When compared with NG FA-300, slight modifications in the thermal events were observed, including an endothermic peak at 152°C, as well as the absence of the characteristic FA peaks, showing that FA is encapsulated in the NG.
Figure 4B shows the TGA analysis that indicate a loss of < 8% in all samples between 28 and 100°C. Then, NG and NG FA-300 present a significant mass loss above 150 °C may be related to the endothermic peak characteristic of NG formation at 140 - 150°C (Figure 4B). Comparatively, in a previous report, FA-loaded into both CS/TPP and CS/TPP/crystalline cellulose systems exhibited similar behaviour attributed to a water evaporation of 7.2% and 5.8%, respectively of total weight [36]. These authors suggested that the greater water absorption in the cellulose-based particles was due to the high concentration of -OH groups along the cellulose backbone, which increases the hydrophilicity of the sample.
In summary, the thermal behaviour characterization demonstrated enhanced preservation of vitamin B9's primary structure when encapsulated within the NG.
3.4. In Vitro FA Release from NG
Emerging methods off application in nanotechnology are increasingly being applied to biopharmacy [42]. Nanotechnology-based strategies enhanced adhesion, sustained release, targeted delivery, and stimulus-responsive release, are being developed for ocular disease management. These approaches enable the design of nanoformulations able to target intraocular structures while minimizing systemic exposure, reducing the need for repeated intravitreal injections to achieve effective therapeutic levels. Current market products demonstrate already the promising potential of nanotechnology in treating ocular diseases [8,33,43].
Franz cells are commonly used to evaluate the release kinetics of various pharmaceutical systems, particularly those designed for the controlled release of biologically active molecules [44]. Figure 5 shows that the slope of the curve (% of release versus time) of the free FA increases more sharply over time compared to its encapsulated form in NGs. Particularly, the percentage of FA release differed significantly between free FA and FA in NG form, from 60 min until the end of the measurement at 360 min. This means that the FA release process occurs in a slower and more sustained manner over time compared to the free form. To the best of our knowledge, the most comparable study on the release of FA from a nanosystem in a Franz cell is that of Kapoor et al., [45]. In this study, the authors employed liposomes as cosmetic platforms for the transdermal delivery of FA, aimed at fortification and treatment of micronutrient deficiencies.
To estimate the mechanism of FA release from NG, different mathematical models were tested. Mathematical modelling is essential for the development and optimization of drug delivery systems, allowing for the prediction of drug release kinetics and diffusion from NG while providing insights into the underlying transport mechanisms [46].
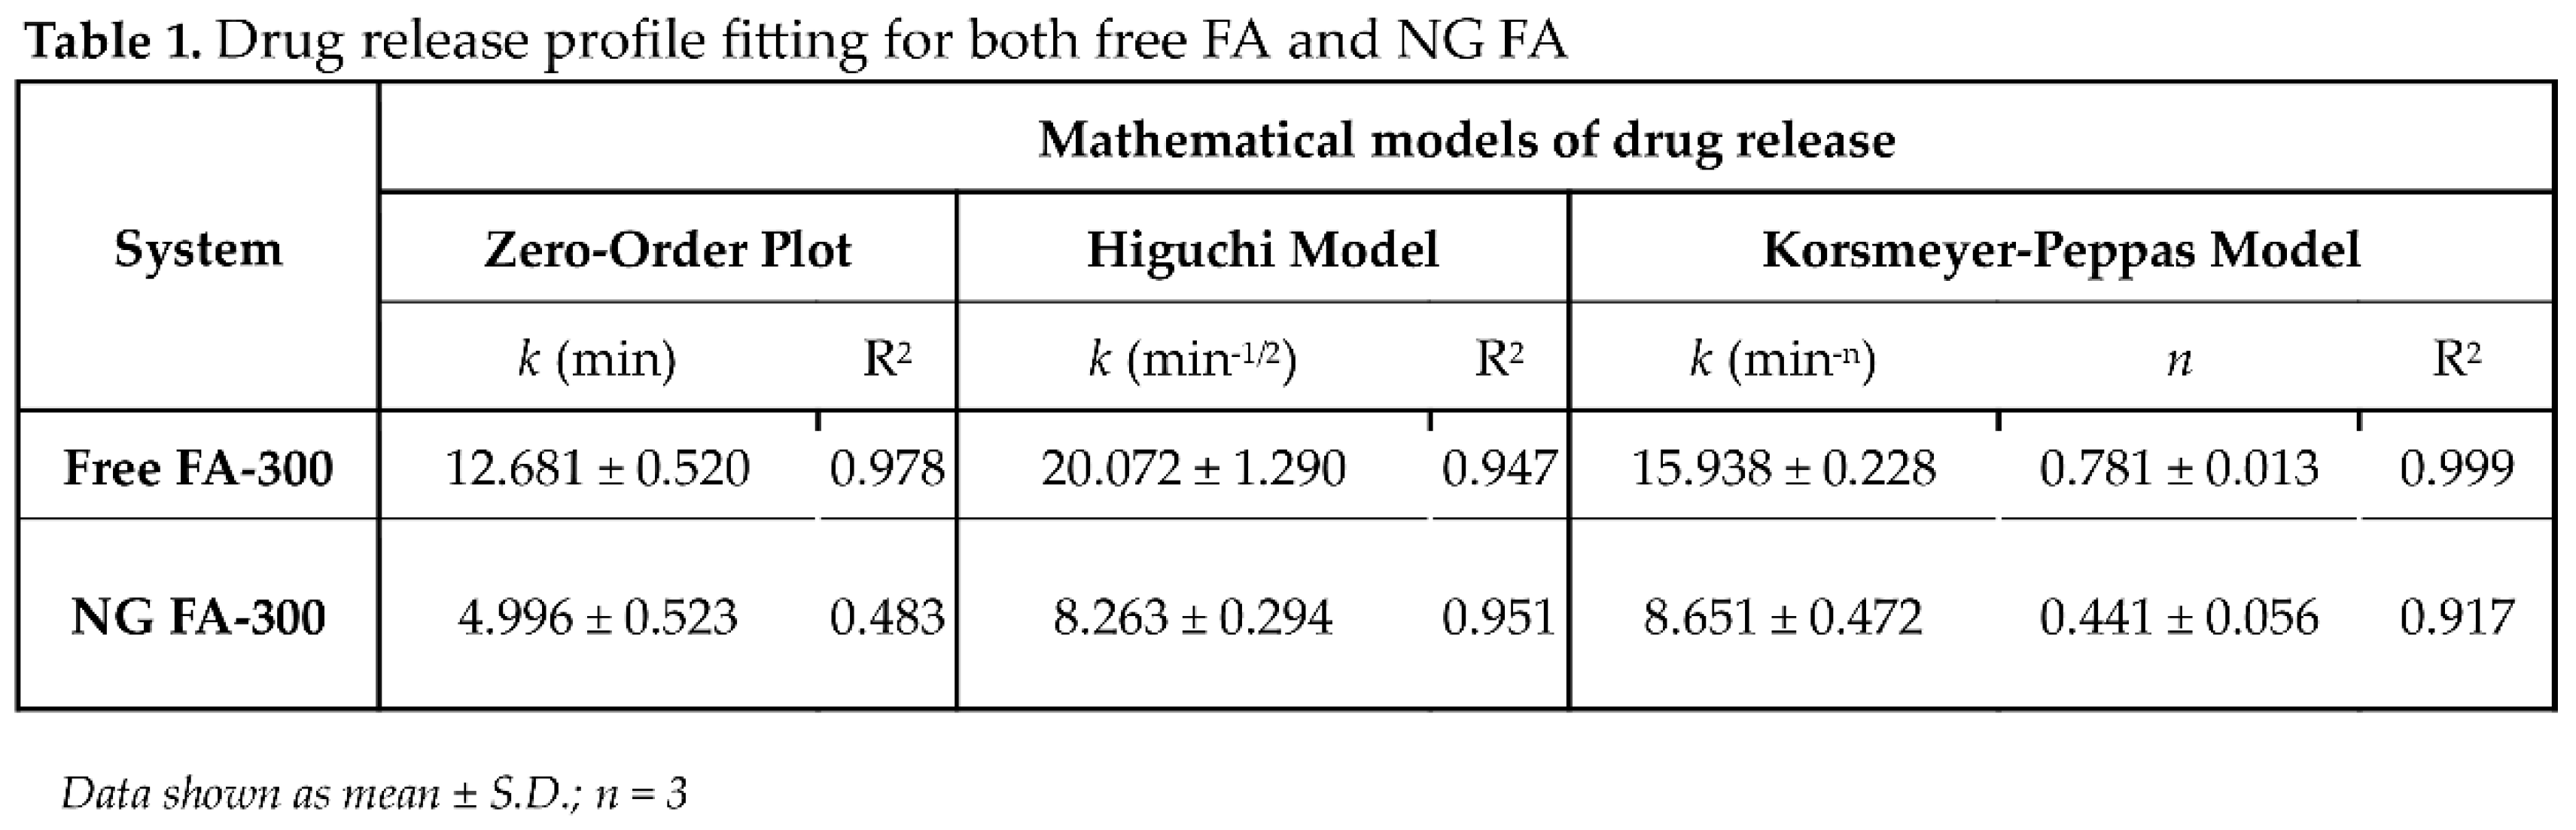
Following the application of in vitro release data to various kinetic models, the R2 (coefficient of determination) values are presented in Table 1. The correlation coefficient (R2) ranges from 0 to 1, where a value of 1 denotes a perfect predictive fit, while 0 indicates an absence of predictive power [47]. Mathematical analysis determined that FA release from NG follows the Higuchi model, as indicated by an R2 value of 0.951. This suggests that 95% of the variance in drug release is explained by this model, highlighting that the release of FA from NG is primarily governed by a diffusion-controlled mechanism. Specifically, the Higuchi model assumes that drug release occurs primarily via Fickian diffusion, whereby drug molecules migrate from regions of high concentration to lower concentration within the matrix. The high R2 value (0.951) further reinforces the strong predictive capacity of this model, indicating its reliability in forecasting drug release under similar experimental conditions. Notably, the Korsmeyer-Peppas model cannot be ruled out since R2 was 0.917. This model also suggests that the FA release mechanism is primarily diffusion controlled. Also, since n coefficient was ≤ 0.5 (0.441), a FA release was driven by concentration gradient, according to Fickian diffusion [29].
3.5. Mucoadhesive Properties of NG FA
Mucoadhesive materials are recognized for their ability to adhere to the mucosal surfaces found in systems such as the gastrointestinal, reproductive, tracheobronchial, and ocular regions [48]. The mucoadhesive properties of CS are well-researched and depend on various factors, including hydrogen bonding between its -OH and -NH2 groups and mucin, as well as electrostatic interactions between the positively charged amino groups of CS and the negatively charged sialic acid residues on mucin. In addition, the molecular structure and hydrophobic nature of CS also contribute to its ability to adhere to mucosal surfaces [10,49].
ζ-Pot measurements of mucin (MC) showed a reversal of charge upon cationic polymers addition, like CS. Maximum particle size and turbidity were observed at the net zero charge. These results highlight the cationic polymer's potential as a mucoadhesive and demonstrate the value of colloidal methods in early stage mucoadhesive development [50]. In the present report, the ζ-Pot of mucin, FA, NG, and NG FA were determined (Figure 6A). FA reduced the ζ-Pot of NGs from +36.9 mV to +24.9 mV (FA-300) and +18.1 mV (FA-500), matching previous studies [51]. Similar results were described by de Britto et al. [52] for vitamin B9 or B12-loaded NG. Also, FA-encapsulated CS-TPP/cellulose nanocrystals showed +25 mV [26]. Subsequently, NG FA samples were incubated with the mucin solution. The ζ-Pot values of the NG-MC mixed systems indicate the presence of interactions between the biopolymer and the heavily glycosylated protein. This phenomenon is substantiated by the less negative ζ-Pot values observed for the complexes, in contrast to those of mucin or each NG sample individually (Figure 6B). The formation of NG-MC had been detected was confirmed by the observed increase in hydrodynamic size (Ho) compared to each sample analysed individually (Figure 1A versus Figure 6B-C).
It was determined that there is a decrease in the electrophoretic potential of the NG when in contact with mucin, which persists for at least 24 h. Remarkably, as the FA concentration increases, the ζ-Pot of the NG-MC mixed system approaches to zero. However, as was mentioned above, initial ζ-Pot was lower in the presence of FA. The mucoadhesive capacity of NG is, in general, a relevant factor that prolongs residence time along with the sustained release of an active principle [53]. Therefore, it can be concluded that the generated NG exhibit these biopharmaceutical properties. Notably, this would be the first report providing strong evidence of the mucoadhesive properties of NGs for FA as a therapeutic agent. This finding marks a significant advancement in the pharmaceutical field, as it paves the way for more effective drug delivery systems, particularly for therapies that require prolonged retention at mucosal surfaces, such as ocular tissue.
3.6. Ex Vivo Assays: Trans-Corneal Permeation Studies
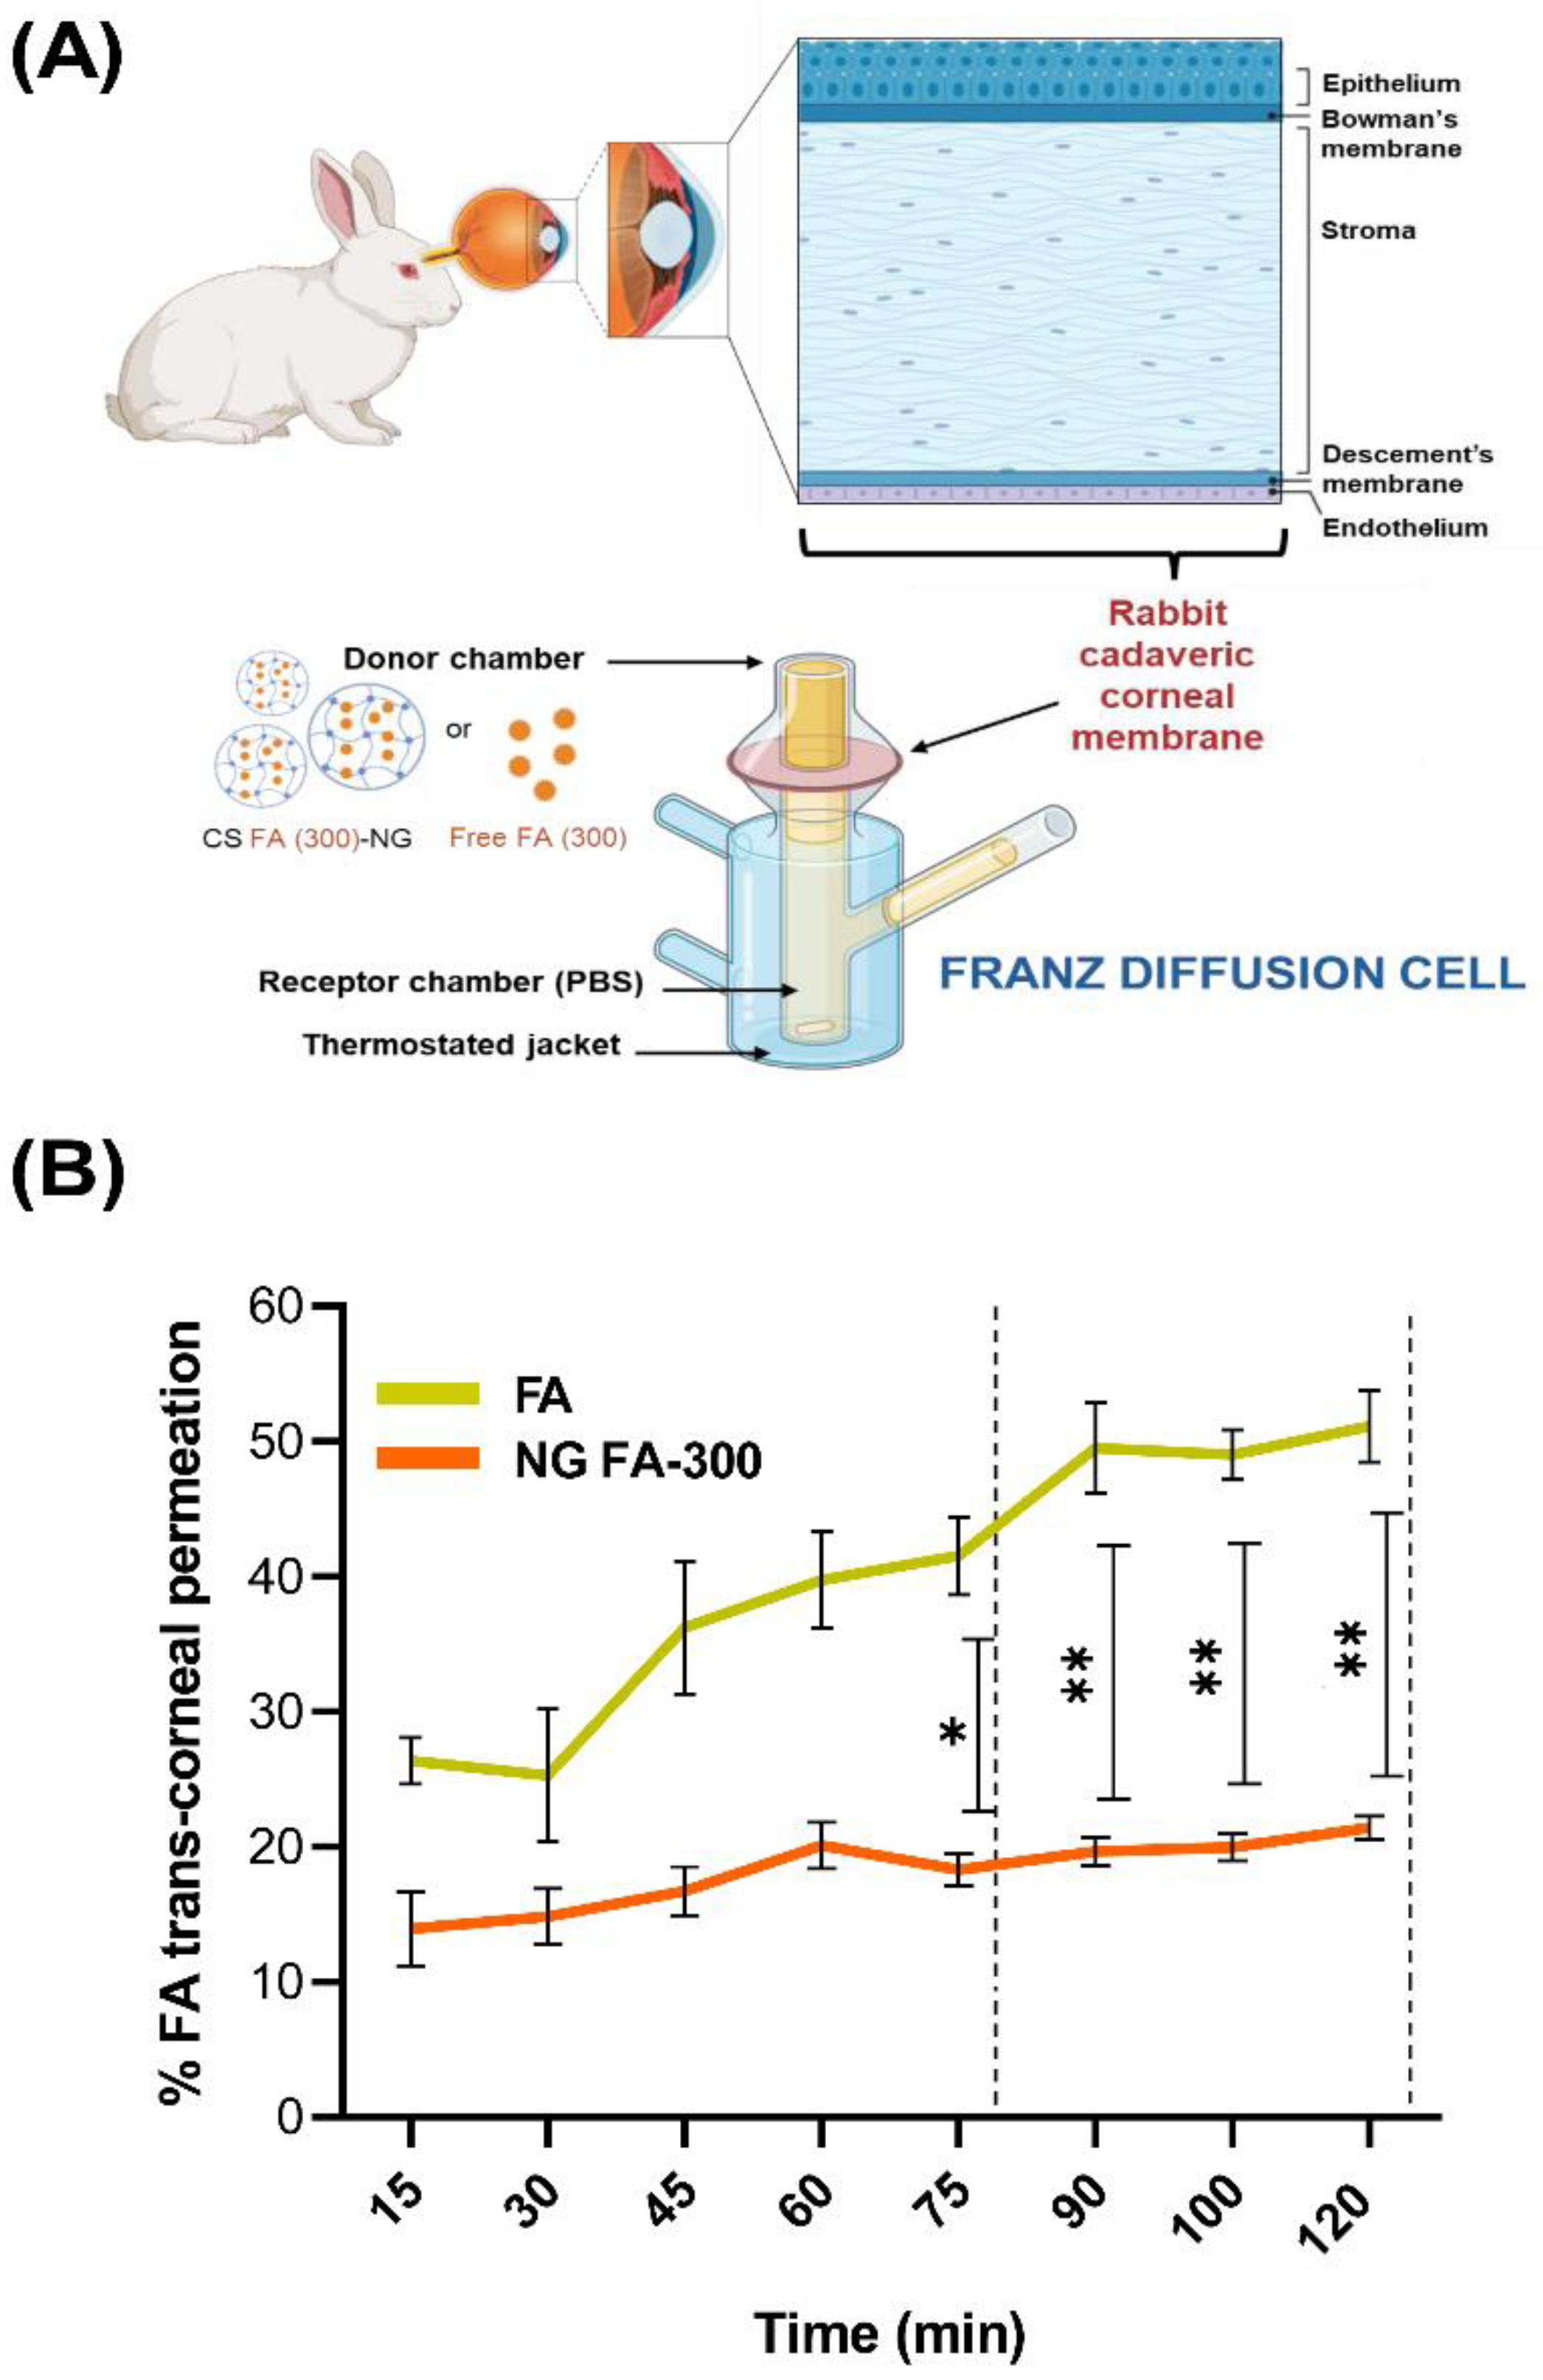
Figure 7A resents permeation assays for both free FA and NG FA-300, conducted using an adapted Franz bicompartmental chamber with corneal tissue extracted from New Zealand white female rabbits. The cornea is composed of several layers, including the epithelium, Bowman’s membrane, stroma, Descemet’s membrane, and endothelium. The epithelium serves as the primary barrier to drug penetration, consisting of tightly packed cells interconnected by tight junctions. These junctions form paracellular pores of approximately 2 nm in diameter, significantly limiting drug diffusion from the tear film into the anterior corneal segment. The drug's physicochemical properties, particularly its lipophilicity, play a crucial role in corneal permeability. While the epithelium and endothelium favour the passage of lipophilic molecules, the stroma is more permeable to hydrophilic substances and restricts hydrophobic compounds. Consequently, drugs with balanced lipophilicity achieve better corneal penetration. Additionally, molecular charge influences diffusion, with anionic species generally exhibiting higher permeability through the corneal layers [54,55].
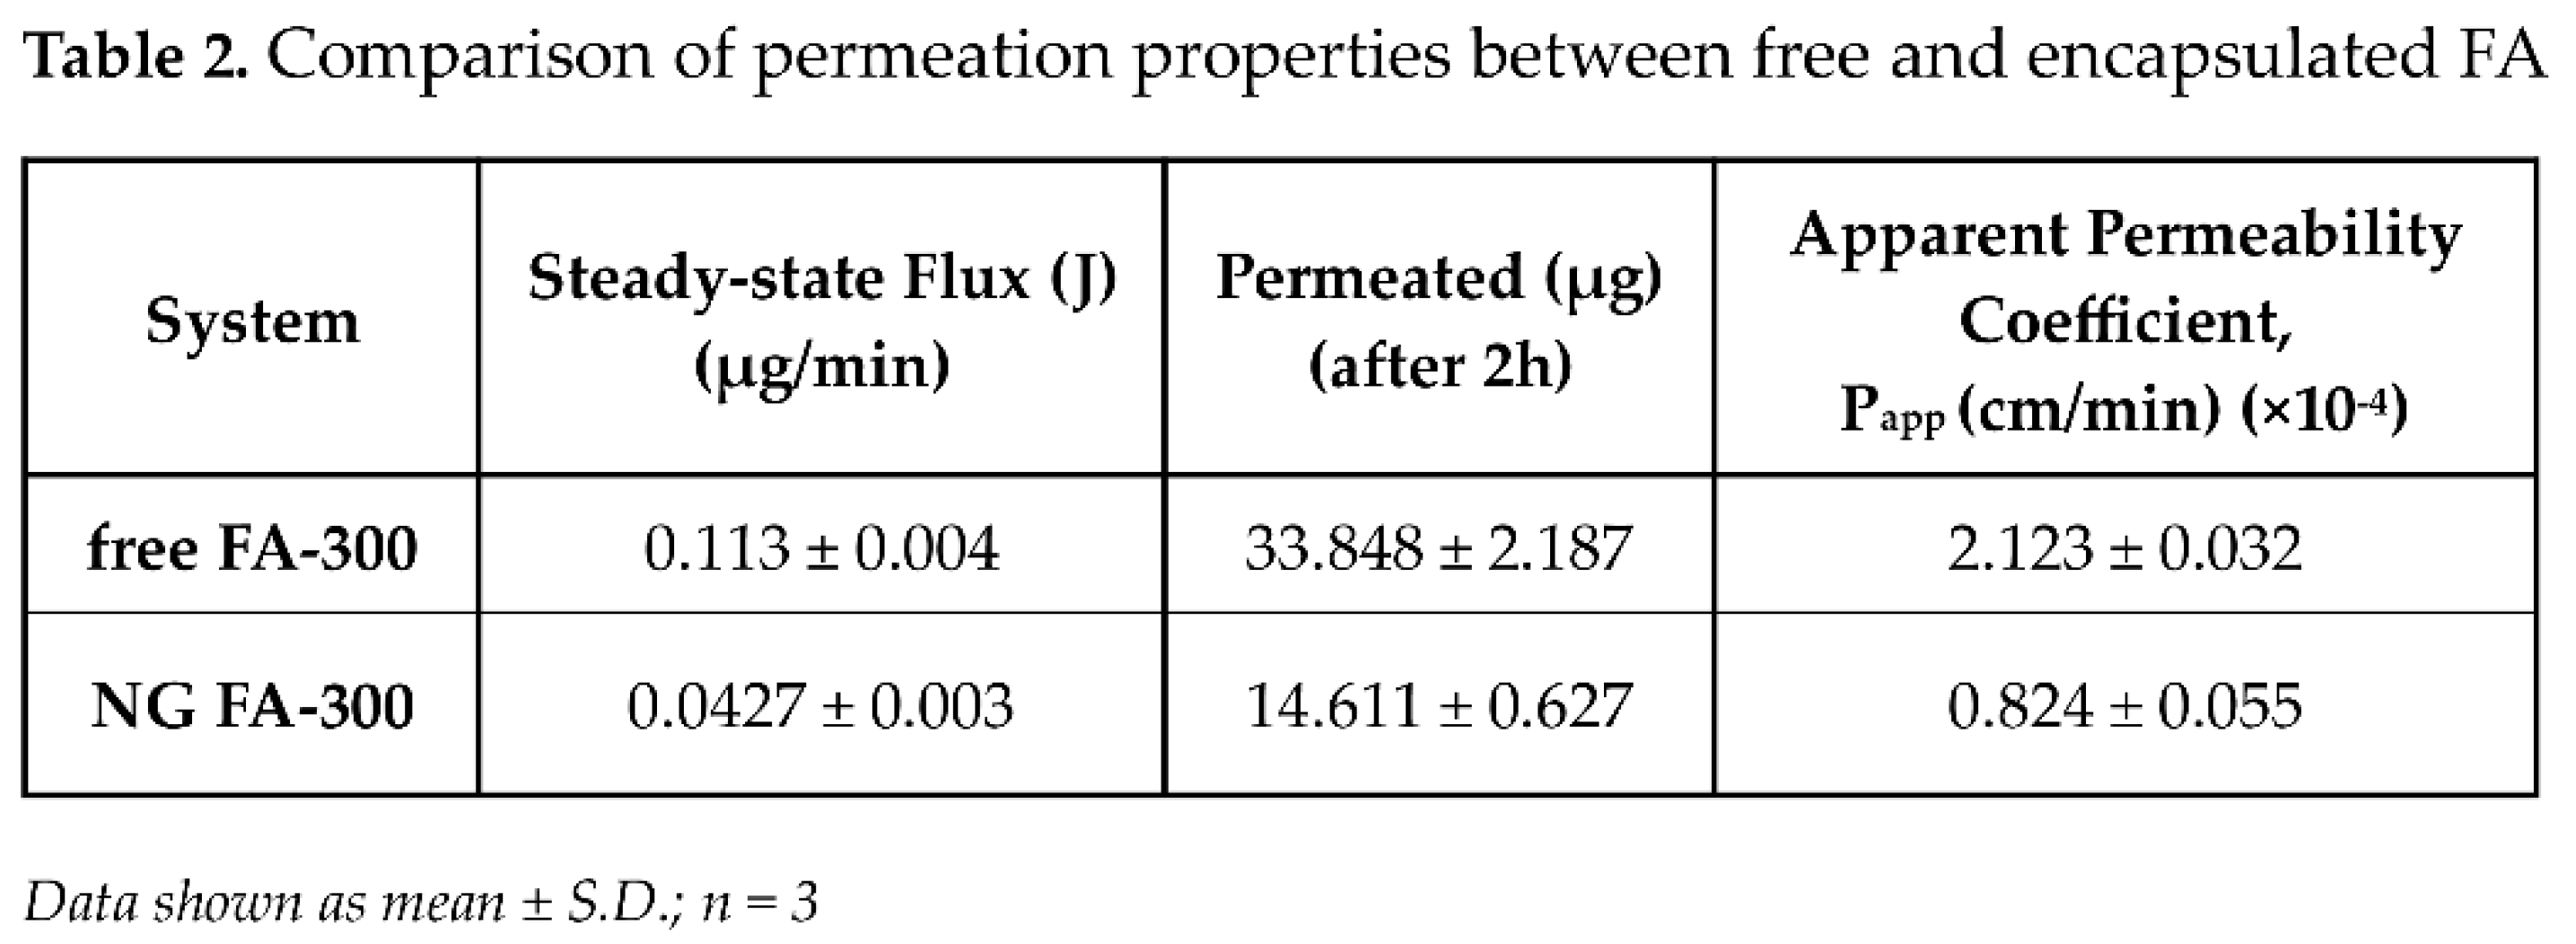
Figure 7B presents the results of the trans-corneal and permeation tests, meanwhile, Table 2 displays flux (J) and apparent permeability coefficient (Papp) parameters. Data obtained demonstrated that NG FA permeated through the cornea at a rate 2.6 times slower than the free FA solution. Notably, the higher permeation percentage of free FA compared to the form into NG exhibited a remarkable and a statistically significant difference from 75 min until the conclusion of the measurement at 120 min. In a similar study, Martínez et al. [23] reported the use of human serum albumin as a nanocarrier for melatonin delivery. Due to its low solubility, melatonin faces challenges in permeation. Using a Franz chamber and ex vivo corneal tissues, the authors found that melatonin-loaded albumin NP showed lower permeation compared to the free neurohormone. Kapoor et al., [45] studied the skin penetration of FA-loaded liposomes for cosmetic applications using a Franz diffusion chamber. Their results revealed that the liposomal nanocarriers exhibited an 8-fold higher penetration compared to the FA solution, which contrasts with the corneal findings. However, the difference in permeation between the cornea and skin can be attributed to their distinct structural and functional properties. The cornea presents a more selective and restrictive barrier, primarily due to its tightly packed epithelium, which limits diffusion [54,56,57]. On the other hand, mucoadhesion studies demonstrate favourable results, supporting the retention of CS in combination with mucin. The simplest explanation is that these biomaterials may adsorb onto the mucin layer, detach with mucus, or pass through the mucus layer to reach the cell surface. However, it is also possible that chitosan-containing systems become coated by mucins, which may hinder their function [58].
To sum up, FA encapsulated into NG exhibited a significantly lower even through more sustained permeation rate compared to the free vitamin. This formulation functioned as an effective reservoir system, that could allow the gradual and prolonged release of the drug. The controlled release profile facilitated by CS-based NG suggests that this nanosystem may contribute to maintaining therapeutic FA levels over an extended period, enhancing efficacy while reducing dosing frequency. Furthermore, this approach not only mitigates the initial burst release commonly observed in conventional drug solutions but also enhances drug stability and bioavailability [59].
4. Conclusions
The present report demonstrates that NG-FA hold great promise as an ophthalmic drug delivery system, offering several advantages for ocular therapy. NG-FA preserved their optimal size post-lyophilization, with only minor size variations that remain within acceptable limits for ocular drug delivery, thereby ensuring both safety and efficacy. Form a chemical point of view, the main chemical groups interacting in the CS-based NG and FA were detected by FTIR analysis, demonstrating effective interaction between the drug and carrier. Thermal analysis confirmed the successful encapsulation of FA during the NG formulation process.
In vitro release studies demonstrated that the NG formulation provided a slower and more sustained release of FA compared to the free drug, which could offer patients more consistent therapeutic effects over a longer period and reducing the frequency of administration. The mucoadhesive properties of NG indicated that NG FA possessed the ability to adhere to mucosal surfaces. This prolonged FA retention could enhance its efficacy by providing extended therapeutic action at the site of action, improving treatment outcomes for patients with slower but sustained permeation of FA.
FA-loaded NGs provide a size-stable mucoadhesivd, controlled-release drug delivery system, enhancing treatment effectiveness. This formulation ensures reliable performance and prolonged relief for ocular therapies. These findings underscore the potential of FA-loaded NGs as a promising strategy to optimize ocular drug delivery, improve bioavailability, and contribute to the development of novel therapies
Author Contributions
S.G.B.: Methodology, Investigation & Analysis. S.M.M.: Methodology, Investigation & Analysis; C.CG.: Methodology, Investigation & Analysis. D.A.Q.: Conceptualization, Supervision, Formal analysis, Funding acquisition, Resources; Review & Editing and Visualization. A.A.: Conceptualization, Formal analysis, Funding acquisition, Review & Editing, Visualization and Writing original draft. O.E.P.: Conceptualization, Project administration, Funding acquisition, Review & Editing, Resources, Visualization and Writing original draft. All authors have read and agreed to the published version of the manuscript.
Funding
PICT-2021-I-00347; PICT 2021-IA-01195 and PICT-2021-GRFTI-00096, UBACyT 20020190100297BA, PIP 00072CO and PIP 2022-2024-GI.
Institutional Review Board Statement
Not applicable.
Informed Consent Statement
Not applicable.
Data Availability Statement
Data will be made available on request.
Acknowledgments
The authors would like to acknowledge the support provided by the CONICET, the Universidad de Buenos Aires and the Universidad Nacional de Córdoba for granting the necessary resources and facilities for this research.
Conflicts of Interest
The authors declare no conflicts of interest.
Abbreviations
The following abbreviations are used in this manuscript:
| CS | chitosan |
| DD | degree of deacetylation |
| DLS | dynamic light scattering |
| DSC | differential scanning calorimetry |
| FA | folic acid |
| FT-IR | Fourier Transform - Infrared Spectroscopy |
| HIUS | high intensity ultrasound |
| IG | ionic gelation |
| Ho | hydrodynamic diameter |
| MC | mucin |
| MW | molecular weight |
| NG | CS-based nanogels |
| NG FA-300 | folic acid (300 µM)-loaded chitosan-based nanogels |
| NG FA-500 | folic acid (500 µM)-loaded chitosan-based nanogels |
| NP | nanoparticles |
| PdI | polydispersity index |
| RT | room temperature |
| SEM | scanning electron microscopy |
| TGA | thermogravimetric analysis |
| TPP | sodium tripolyphosphate |
| ζ -Pot | ζ-potential |
References
- Nettey, H.; Darko, Y.; Bamiro, O.A.; Addo, R.T. Ocular Barriers. In Ocular Drug Delivery: Advances, Challenges and Applications; Springer International Publishing, 2016; pp. 27–36. [Google Scholar] [CrossRef]
- Moiseev, R.V.; Morrison, P.W.J.; Steele, F.; Khutoryanskiy, V.V. Penetration enhancers in ocular drug delivery. Pharmaceutics 2019, 11, 321. [Google Scholar] [CrossRef]
- Giri, B.R.; Jakka, D.; Sandoval, M.A.; Kulkarni, V.R.; Bao, Q. Advancements in Ocular Therapy: A Review of Emerging Drug Delivery Approaches and Pharmaceutical Technologies. Pharmaceutics 2024, 16, 1325. [Google Scholar] [CrossRef]
- Tsai, C.H.; Wang, P.Y.; Lin, I.C.; Huang, H.; Liu, G.S.; Tseng, C.L. Ocular drug delivery: Role of degradable polymeric nanocarriers for ophthalmic application. Int J Mol Sci 2018, 19, 2830. [Google Scholar] [CrossRef]
- Swetledge, S.; Jung, J.P.; Carter, R.; Sabliov, C. Distribution of polymeric nanoparticles in the eye: implications in ocular disease therapy. J Nanobiotechnology 2021, 19, 1–19. [Google Scholar] [CrossRef]
- Zamboulis, A.; Nanaki, S.; Michailidou, G.; Koumentakou, I.; Lazaridou, M.; Ainali, N.M.; Xanthopoulou, E.; Bikiaris, D.N. Chitosan and its derivatives for ocular delivery formulations: Recent advances and developments. Polymers 2020, 12, 9–11. [Google Scholar] [CrossRef] [PubMed]
- Paolicelli, P.; De La Fuente, M.; Sánchez, A.; Seijo, B.; Alonso, M.J. Chitosan nanoparticles for drug delivery to the eye. Expert Opin Drug Deliv 2009, 6, 239–253. [Google Scholar] [CrossRef] [PubMed]
- Alaimo, A.; Pérez, O.E. Chitosan-based nanosuspensions for ocular diagnosis and therapy. Advanced Nanoformulations 2023, 13–41. [Google Scholar] [CrossRef]
- Di Santo, M.C.; D’Antoni, C.L.; Rubio, A.P.D.; Alaimo, A.; Pérez, O.E. Chitosan-tripolyphosphate nanoparticles designed to encapsulate polyphenolic compounds for biomedical and pharmaceutical applications - A Review. Biomed Pharmacother 2021, 142, 11970. [Google Scholar] [CrossRef]
- Sogias, I.A.; Williams, A.C.; Khutoryanskiy, V.V. Why is chitosan mucoadhesive? Biomacromolecules 2008, 9, 1837–42. [Google Scholar] [CrossRef]
- Leithner, K.; Bernkop-Schnürch, A. Chitosan and Derivatives for Biopharmaceutical Use: Mucoadhesive Properties, Chitosan-Based Systems for Biopharmaceuticals: Delivery. Targeting and Polymer Therapeutics 2012, 159–180. [Google Scholar] [CrossRef]
- Irimia, T.; Dinu-Pîrvu, C.E.; Ghica, M.V.; Lupuleasa, D.; Muntean, D.L.; Udeanu, D.I.; Popa, L. Chitosan-based in situ gels for ocular delivery of therapeutics: A state-of-the-art review. Mar Drugs 2018, 16, 373. [Google Scholar] [CrossRef] [PubMed]
- Silva, M.M.; Calado, R.; Marto, J.; Bettencourt, A.; Almeida, A.J.; Gonçalves, L.M.D. Chitosan nanoparticles as a mucoadhesive drug delivery system for ocular administration. Mar Drugs 2017, 15, 1–16. [Google Scholar] [CrossRef]
- Buosi, F.S.; Alaimo, A.; Di Santo, M.C.; Elías, F.; Liñares, G.G.; Acebedo, S.L.; Cataña, M.A.C.; Spagnuolo, C.C.; Lizarraga, L.; Martínez, K.D.; et al. Resveratrol encapsulation in high molecular weight chitosan-based nanogels for applications in ocular treatments : Impact on human ARPE-19 culture cells. Int J Biol Macromol 2020, 165, 804–821. [Google Scholar] [CrossRef] [PubMed]
- Shulpekova, Y.; Nechaev, V.; Kardasheva, S.; Sedova, A.; Kurbatova, A.; Bueverova, E.; Kopylov, A.; Malsagova, K.; Dlamini, J.C.; Ivashkin, V. The concept of folic acid in health and disease. Molecules 2021, 26, 3731. [Google Scholar] [CrossRef] [PubMed]
- Wright, A.D.; Martin, N.; Dodson, P.M. Homocysteine, folates, and the eye. Eye 2008, 22, 989–993. [Google Scholar] [CrossRef] [PubMed]
- Malm, E.; Ghosh, F. Chronic conjunctivitis in a patient with folic acid deficienc. Acta Ophthalmol Scand 2007, 85, 226. [Google Scholar] [CrossRef]
- Gu, J.; Lei, C.; Zhang, M. Folate and retinal vascular diseases. BMC Ophthalmol 2023, 23, 413. [Google Scholar] [CrossRef]
- Sijilmassi, O. Folic acid deficiency and vision: a review. Graefe’s Archive for Clinical and Experimental Ophthalmology 2019, 257, 1573–1580. [Google Scholar] [CrossRef]
- Nieto, R.S.; López, C.S.; Moretton, M.A.; Lizarraga, L.; Chiappetta, D.A.; Alaimo, A.; Pérez, O.E. Chitosan-Based Nanogels Designed for Betanin-Rich Beetroot Extract Transport: Physicochemical and Biological Aspects. Polymers 2023, 15, 3875. [Google Scholar] [CrossRef]
- López, E.R.; López, C.S.; Spagnuolo, C.C.; Berardino, B.G.; Alaimo, A.; Pérez, O.E. Chitosan-Tricarbocyanine-Based Nanogels Were Able to Cross the Blood–Brain Barrier Showing Its Potential as a Targeted Site Delivery Agent. Pharmaceutics 2024, 16, 964. [Google Scholar] [CrossRef]
- DeMatteo, R.; Rey, J.M.; Corfield, R.; Andrade, V.A.G.; Santagapita, P.R.; Di Salvo, F.; Pérez, O.E. Chitosan-inspired Matrices for Folic Acid. Insightful Structural Characterization and Ensured Bioaccessibility. Food Biophys 2024, 19, 412–424. [Google Scholar] [CrossRef]
- Martinez, S.M.; Inda, A.; Ríos, M.N.; del V, C.; Bossio, A.B.; Guido, M.E.; Pinto, J.D.L.; Allemandi, D.A.; Quinteros, D.A. Neuroprotective Effect of Melatonin Loaded in Human Serum Albumin Nanoparticles Applied Subconjunctivally in a Retinal Degeneration Animal Model. Pharmaceutics 2025, 17, 85. [Google Scholar] [CrossRef]
- Mora, M.J.; Tártara, L.I.; Onnainty, R.; Palma, S.D.; Longhi, M.R.; Granero, G.E. Characterization, dissolution and in vivo evaluation of solid acetazolamide complexes. Carbohydr Polym 2013, 98, 380–390. [Google Scholar] [CrossRef] [PubMed]
- Quinteros, D.A.; Manzo, R.H.; Allemandi, D.A. Interaction between Eudragit® E100 and anionic drugs: Addition of anionic polyelectrolytes and their influence on drug release performance. J Pharm Sci 2011, 100, 4664–4673. [Google Scholar] [CrossRef]
- Bessone, C.D.V.; Martinez, S.M.; Luna, J.D.; Marquez, M.A.; Ramírez, M.L.; Allemandi, D.A.; Carpentieri, Á.R.; Quinteros, D.A. Neuroprotective effect of melatonin loaded in ethylcellulose nanoparticles applied topically in a retinal degeneration model in rabbits. Exp Eye Res 2020, 200, 108222. [Google Scholar] [CrossRef] [PubMed]
- De Matteo R, P.O.; Corfield, R.; Schebor, C. Folic acid embedded in argentinian chitosan: antioxidant capacity and cytotoxic effect in human Caco-2 cell line. Symposium: Exploring the Frontiers of Chemistry; p. Abstract. 2019. [Google Scholar]
- Quinteros, D.A.; Tártara, L.I.; Palma, S.D.; Manzo, R.H.; Allemandi, D.A. Ocular delivery of flurbiprofen based on Eudragit® E-flurbiprofen complex dispersed in aqueous solution: Preparation, characterization, in vitro corneal penetration, and ocular irritation. J Pharm Sci 2014, 103, 3859–3868. [Google Scholar] [CrossRef]
- Bruschi, M.L. Mathematical models of drug release. In Strategies to Modify the Drug Release from Pharmaceutical Systems; 2015; pp. 63–86. [Google Scholar] [CrossRef]
- Silva, M.M.; Calado, R.; Marto, J.; Bettencourt, A.; Almeida, A.J.; Gonçalves, L.M.D. Chitosan nanoparticles as a mucoadhesive drug delivery system for ocular administration. Mar Drugs 2017, 15, 370. [Google Scholar] [CrossRef]
- Tsai, C.H.; Wang, P.Y.; Lin, I.C.; Huang, H.; Liu, G.S.; Tseng, C.L. Ocular Drug Delivery: Role of Degradable Polymeric Nanocarriers for Ophthalmic Application. Int J Mol Sci 2018, 19, 2830. [Google Scholar] [CrossRef]
- da Silva, S.B.; Amorim, M.; Fonte, P.; Madureira, R.; Ferreira, D.; Pintado, M.; Sarmento, B. Natural extracts into chitosan nanocarriers for rosmarinic acid drug delivery. Pharm Biol 2015, 53, 642–652. [Google Scholar] [CrossRef]
- Liu, L.C.; Chen, Y.H.; Lu, D.W. Overview of Recent Advances in Nano-Based Ocular Drug Delivery. Int J Mol Sci 2023, 24, 5352. [Google Scholar] [CrossRef]
- Kompella, U.B.; Amrite, A.C.; Ravi, R.P.; Durazo, S.A. Nanomedicines for back of the eye drug delivery, gene delivery, and imaging. Prog Retin Eye Res 2013, 36, 172–198. [Google Scholar] [CrossRef]
- Wu, L.; Zhang, J.; Watanabe, W. Physical and chemical stability of drug nanoparticles. Adv Drug Deliv Rev 2011, 63, 456–469. [Google Scholar] [CrossRef] [PubMed]
- Onugwu, A.L.; Attama, A.A.; Nnamani, P.O.; Onugwu, S.O.; Onuigbo, E.B.; Khutoryanskiy, V.V. Development and optimization of solid lipid nanoparticles coated with chitosan and poly(2-ethyl-2-oxazoline) for ocular drug delivery of ciprofloxacin. J Drug Deliv Sci Technol 2022, 74, 103527. [Google Scholar] [CrossRef]
- Jardim, K.V.; Siqueira, J.L.N.; Báo, S.N.; Parize, A.L. In vitro cytotoxic and antioxidant evaluation of quercetin loaded in ionic cross-linked chitosan nanoparticles. J Drug Deliv Sci Technol 2022, 74, 1–9. [Google Scholar] [CrossRef]
- Okamoto-Schalch, N.O.; Pinho, S.G.B.; de Barros-Alexandrino, T.T.; Dacanal, G.C.; Assis, O.B.G.; Martelli-Tosi, M. Production and characterization of chitosan-TPP/cellulose nanocrystal system for encapsulation: a case study using folic acid as active compound. Cellulose 2020, 27, 5855–5869. [Google Scholar] [CrossRef]
- Fathima, E.; Nallamuthu, I.; Anand, T.; Naika, M.; Khanum, F. Enhanced cellular uptake, transport and oral bioavailability of optimized folic acid-loaded chitosan nanoparticles. Int J Biol Macromol 2022, 208, 596–610. [Google Scholar] [CrossRef] [PubMed]
- Byrn, S.R.; Zografi, G.; Chen, X. Differential Scanning Calorimetry and Thermogravimetric Analysis. In Solid State Properties of Pharmaceutical Materials; Wiley, 2017; pp. 124–141. [Google Scholar] [CrossRef]
- Gazzali, A.M.; Lobry, M.; Colombeau, L.; Acherar, S.; Azaïs, H.; Mordon, S.; Arnoux, P.; Baros, F.; Vanderesse, R.; Frochot, C. Stability of folic acid under several parameters. Eur J Pharm Sci 2016, 93, 419–430. [Google Scholar] [CrossRef]
- Di Santo, M.C.; Antoni, C.L.D.; Rubio, A.P.D.; Alaimo, A.; Pérez, O.E. Chitosan-tripolyphosphate nanoparticles designed to encapsulate polyphenolic compounds for biomedical and pharmaceutical applications − A review. Biomedicine and Pharmacotherapy 2021, 142, 111970. [Google Scholar] [CrossRef]
- Akhter, M.H.; Ahmad, I.; Alshahrani, M.Y.; Al-Harbi, A.I.; Khalilullah, H.; Afzal, O.; Altamimi, A.S.A.; Ullah, S.N.M.N.; Ojha, A.; Karim, S. Drug Delivery Challenges and Current Progress in Nanocarrier-Based Ocular Therapeutic System. Gels 2022, 8, 82. [Google Scholar] [CrossRef]
- Nimmansophon, P.; Wanasathop, A.; Li, S.K. Lateral Transport During Membrane Permeation in Diffusion Cell: In Silico Study on Edge Effect and Membrane Blocking. J Pharm Sci 2023, 112, 1653–1663. [Google Scholar] [CrossRef]
- Kapoor, M.S.; D’Souza, A.; Aibani, N.; Nair, S.S.; Sandbhor, P.; Kumari, D.; Banerjee, R. Stable Liposome in Cosmetic Platforms for Transdermal Folic acid delivery for fortification and treatment of micronutrient deficiencies. Sci Rep 2018, 8, 16122. [Google Scholar] [CrossRef] [PubMed]
- Herdiana, Y.; Wathoni, N.; Shamsuddin, S.; Muchtaridi, M. Drug release study of the chitosan-based nanoparticles. Heliyon 2022, 8, e08674. [Google Scholar] [CrossRef]
- Wasserman, L. All of Statistics; Springer New York: New York, NY, 2004. [Google Scholar] [CrossRef]
- Khutoryanskiy, V.V. Advances in Mucoadhesive Polymers and Formulations for Transmucosal Drug Delivery; MDPI - Multidisciplinary Digital Publishing Institute, 2020. [Google Scholar] [CrossRef]
- Mendes, A.C.; Moreno, J.S.; Hanif, M.; Douglas, T.E.L.; Chen, M.; Chronakis, I.S. Morphological, Mechanical and Mucoadhesive Properties of Electrospun Chitosan/Phospholipid Hybrid Nanofibers. Int J Mol Sci 2018, 19, 2266. [Google Scholar] [CrossRef]
- Szilágyi, B.Á.; Mammadova, A.; Gyarmati, B.; Szilágyi, A. Mucoadhesive interactions between synthetic polyaspartamides and porcine gastric mucin on the colloid size scale. Colloids Surf B Biointerfaces 2020, 194, 111219. [Google Scholar] [CrossRef] [PubMed]
- Agrawal, A.K.; Urimi, D.; Harde, H.; Kushwah, V.; Jain, S. Folate appended chitosan nanoparticles augment the stability, bioavailability and efficacy of insulin in diabetic rats following oral administration. RSC Adv 2015, 5, 105179–105193. [Google Scholar] [CrossRef]
- de Britto, D.; de Moura, M.R.; Aouada, F.A.; Mattoso, L.H.C.; Assis, O.B.G. ; N,N,N-trimethyl chitosan nanoparticles as a vitamin carrier system. Food Hydrocoll 2012, 27, 487–493. [Google Scholar] [CrossRef]
- Bhatta, R.S.; Chandasana, H.; Chhonker, Y.S.; Rathi, C.; Kumar, D.; Mitra, K.; Shukla, P.K. Mucoadhesive nanoparticles for prolonged ocular delivery of natamycin: In vitro and pharmacokinetics studies. Int J Pharm 2012, 432, 105–112. [Google Scholar] [CrossRef]
- Alaimo, A.; Pérez, O. Advanced Nanoformulations : theranostic nanosystems; Volume 3, Chapter 2; Elsevier Academic Press, 2022. [Google Scholar]
- Alaimo, A.; Tettamanti, C.; Pérez, O.; Allemandi, D.; Quinteros, D. Chauhan, N., Sharma, V., Chauhan, N., Eds.; New Generation Nanocarriers for Ocular Delivery of Resveratrol. In DNovel Phytopharmaceutical for Management of Disorders; CRC Press, 2024; pp. 1–353. [Google Scholar] [CrossRef]
- Raghu, P.K.; Bansal, K.K.; Thakor, P.; Bhavana, V.; Madan, J.; Rosenholm, J.M.; Mehra, N.K. Evolution of Nanotechnology in Delivering Drugs to Eyes, Skin and Wounds via Topical Route. Pharmaceuticals 2020, 13, 167. [Google Scholar] [CrossRef]
- Alaimo, A.; López, C.S.; Di Santo, M.; Pérez, O. Nayak, A.H.S., Ed.; Gellan gum-based dermatological formulations. In Application of Gellan Gum as a Biomedical Polymer, 1st ed.; Academic Press, Elsevier, 2024; p. 457. ISBN 978-0-323-91815-2. [Google Scholar]
- Collado-González, M.; Espinosa, Y.G.; Goycoolea, F.M. Interaction between Chitosan and Mucin: Fundamentals and applications. Biomimetics 2019, 4, 32. [Google Scholar] [CrossRef]
- Adepu, S.; Ramakrishna, S.; Costa-Pinto, R.; Oliveira, A.L. Controlled Drug Delivery Systems: Current Status and Future Directions. Molecules 2021, 26, 5905. [Google Scholar] [CrossRef]
Figure 1.
Particle size distribution of NG, NG FA-300, and NG FA-500 samples. (A) Particle size distribution profiles represented by intensity or volume. (B) Numbers into bars indicated the mean value reached by Ho or PdI . *p<0.05 and **p<0.01; "ns" denotes non-significant differences. Grey lines/bars: original particle suspension; Red lines/bars: re-hydrated particle suspension.
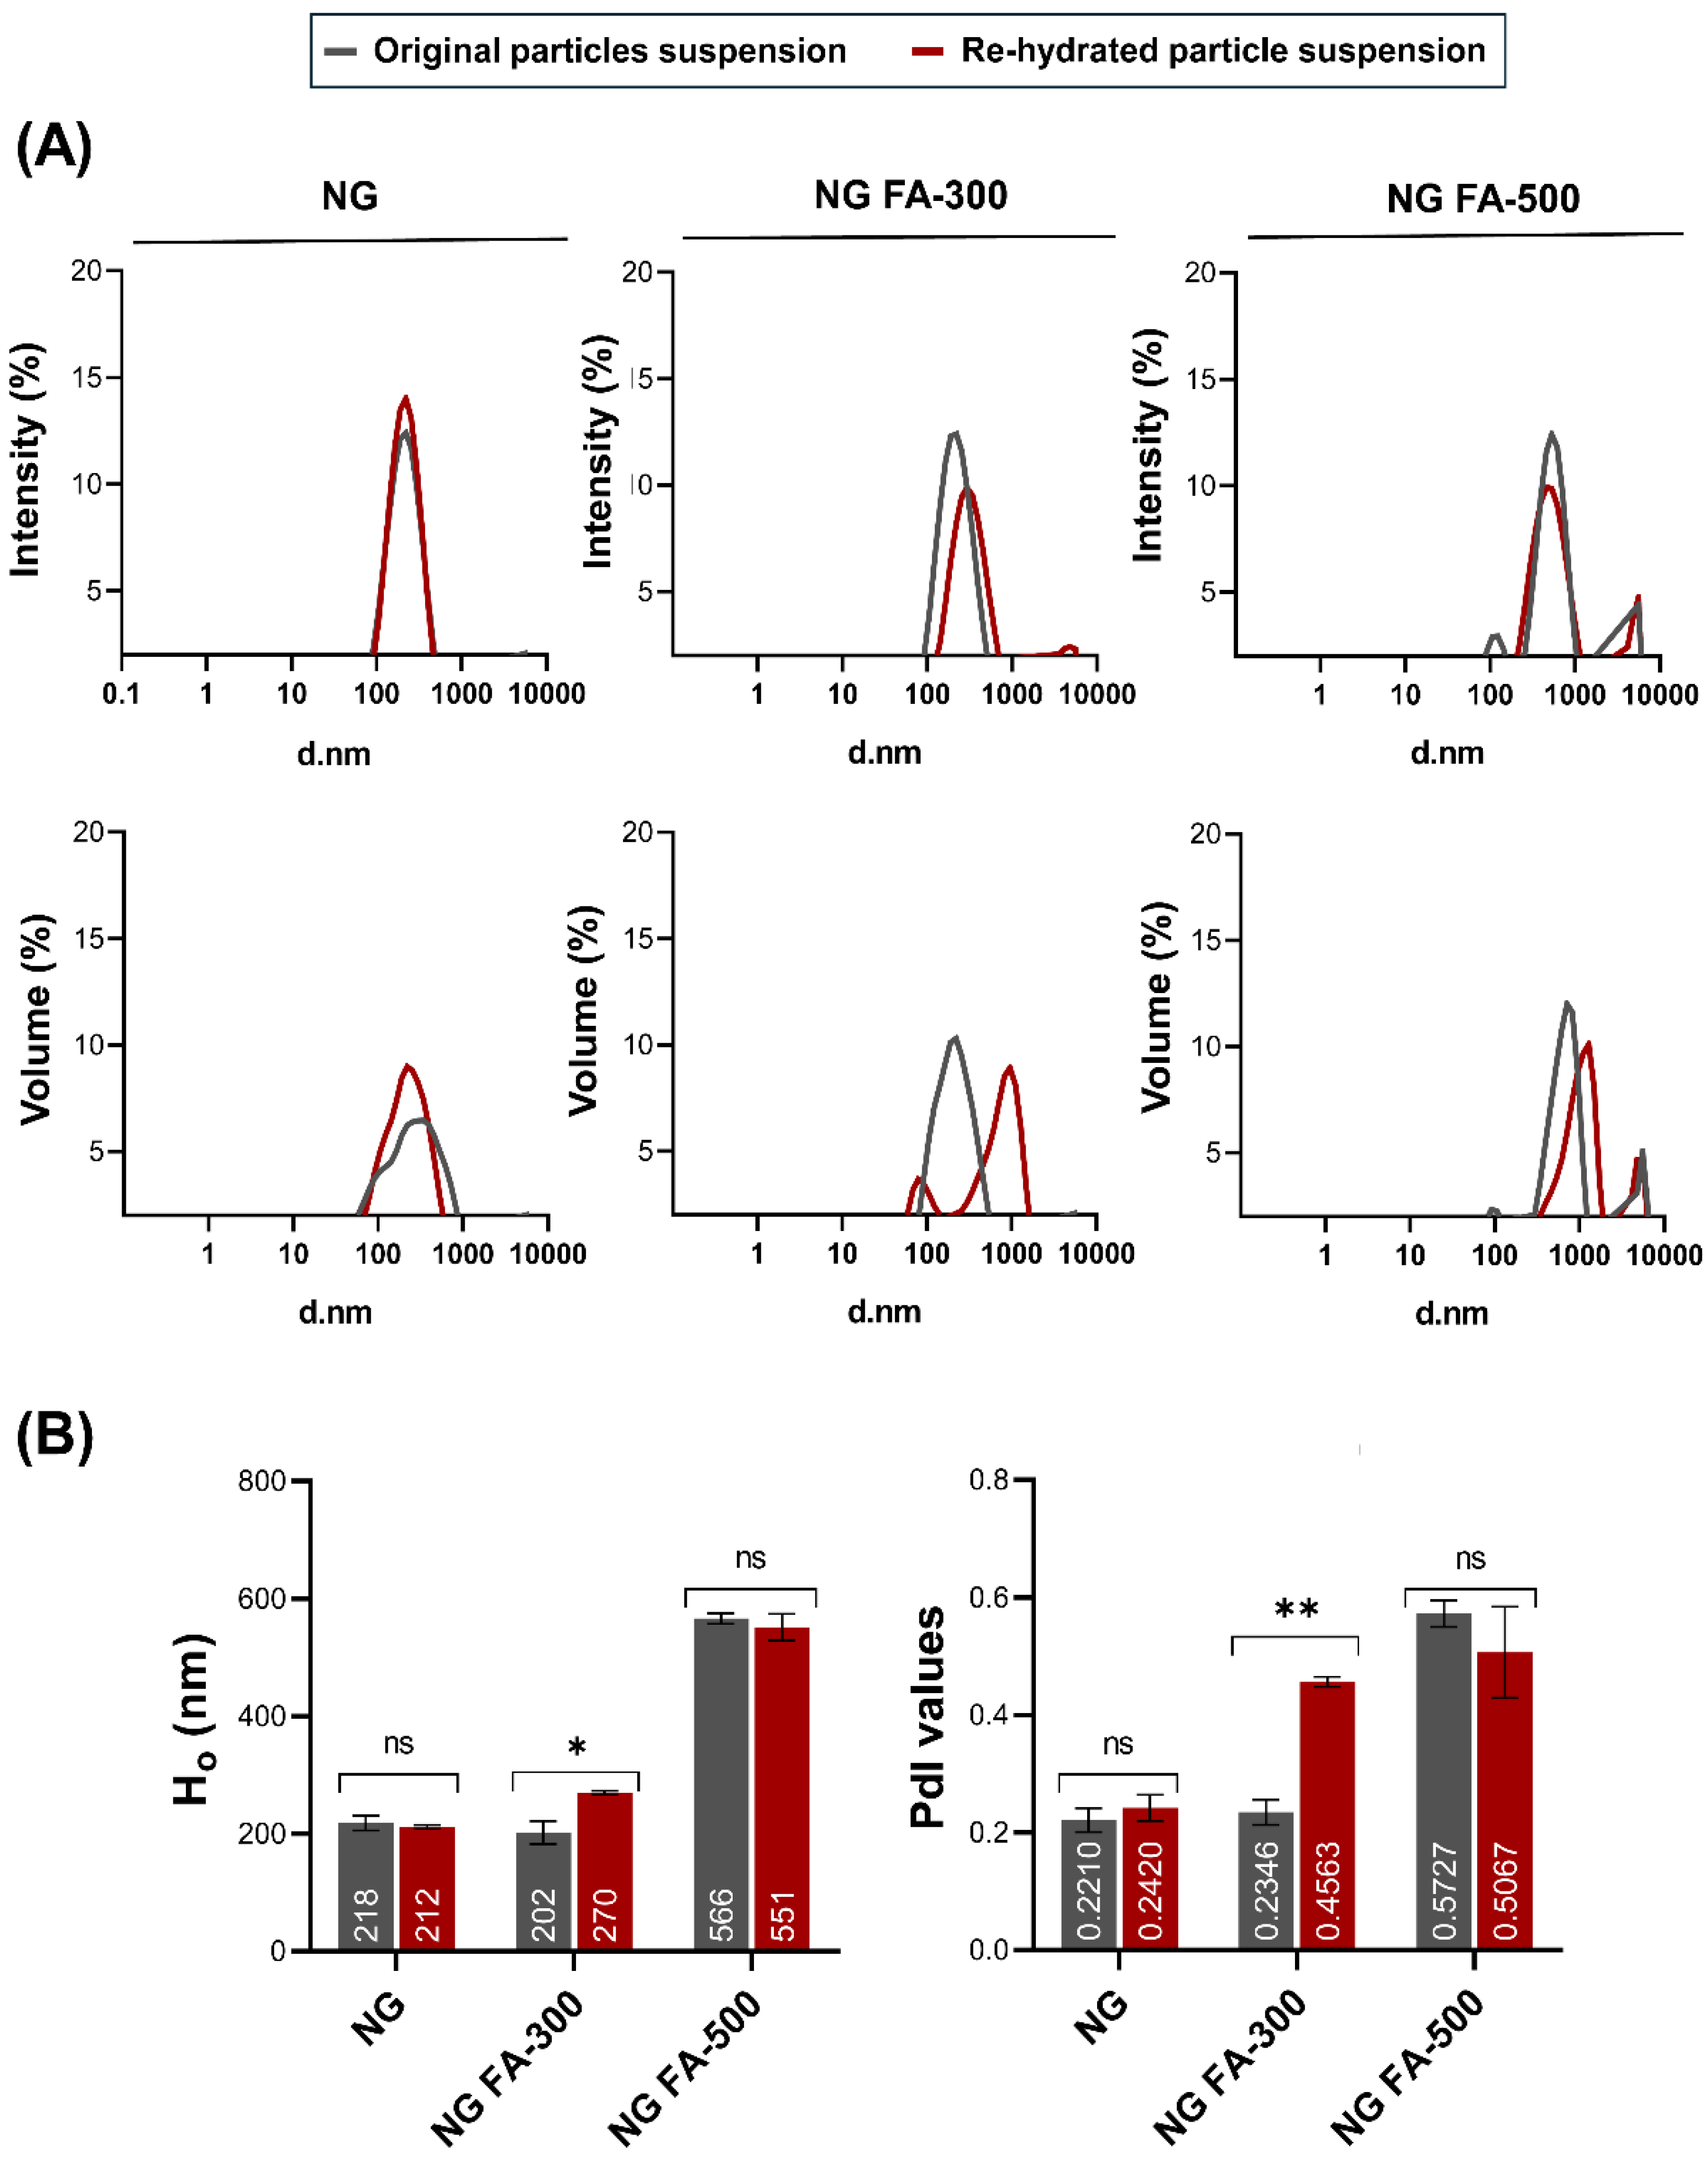
Figure 2.
FTIR analysis in terms of transmittance (%) vs wavenumbers (cm-1). (A) TPP, CS, and NG spectra. (B) free FA, NG and NG FA-300 spectra.
Figure 2.
FTIR analysis in terms of transmittance (%) vs wavenumbers (cm-1). (A) TPP, CS, and NG spectra. (B) free FA, NG and NG FA-300 spectra.
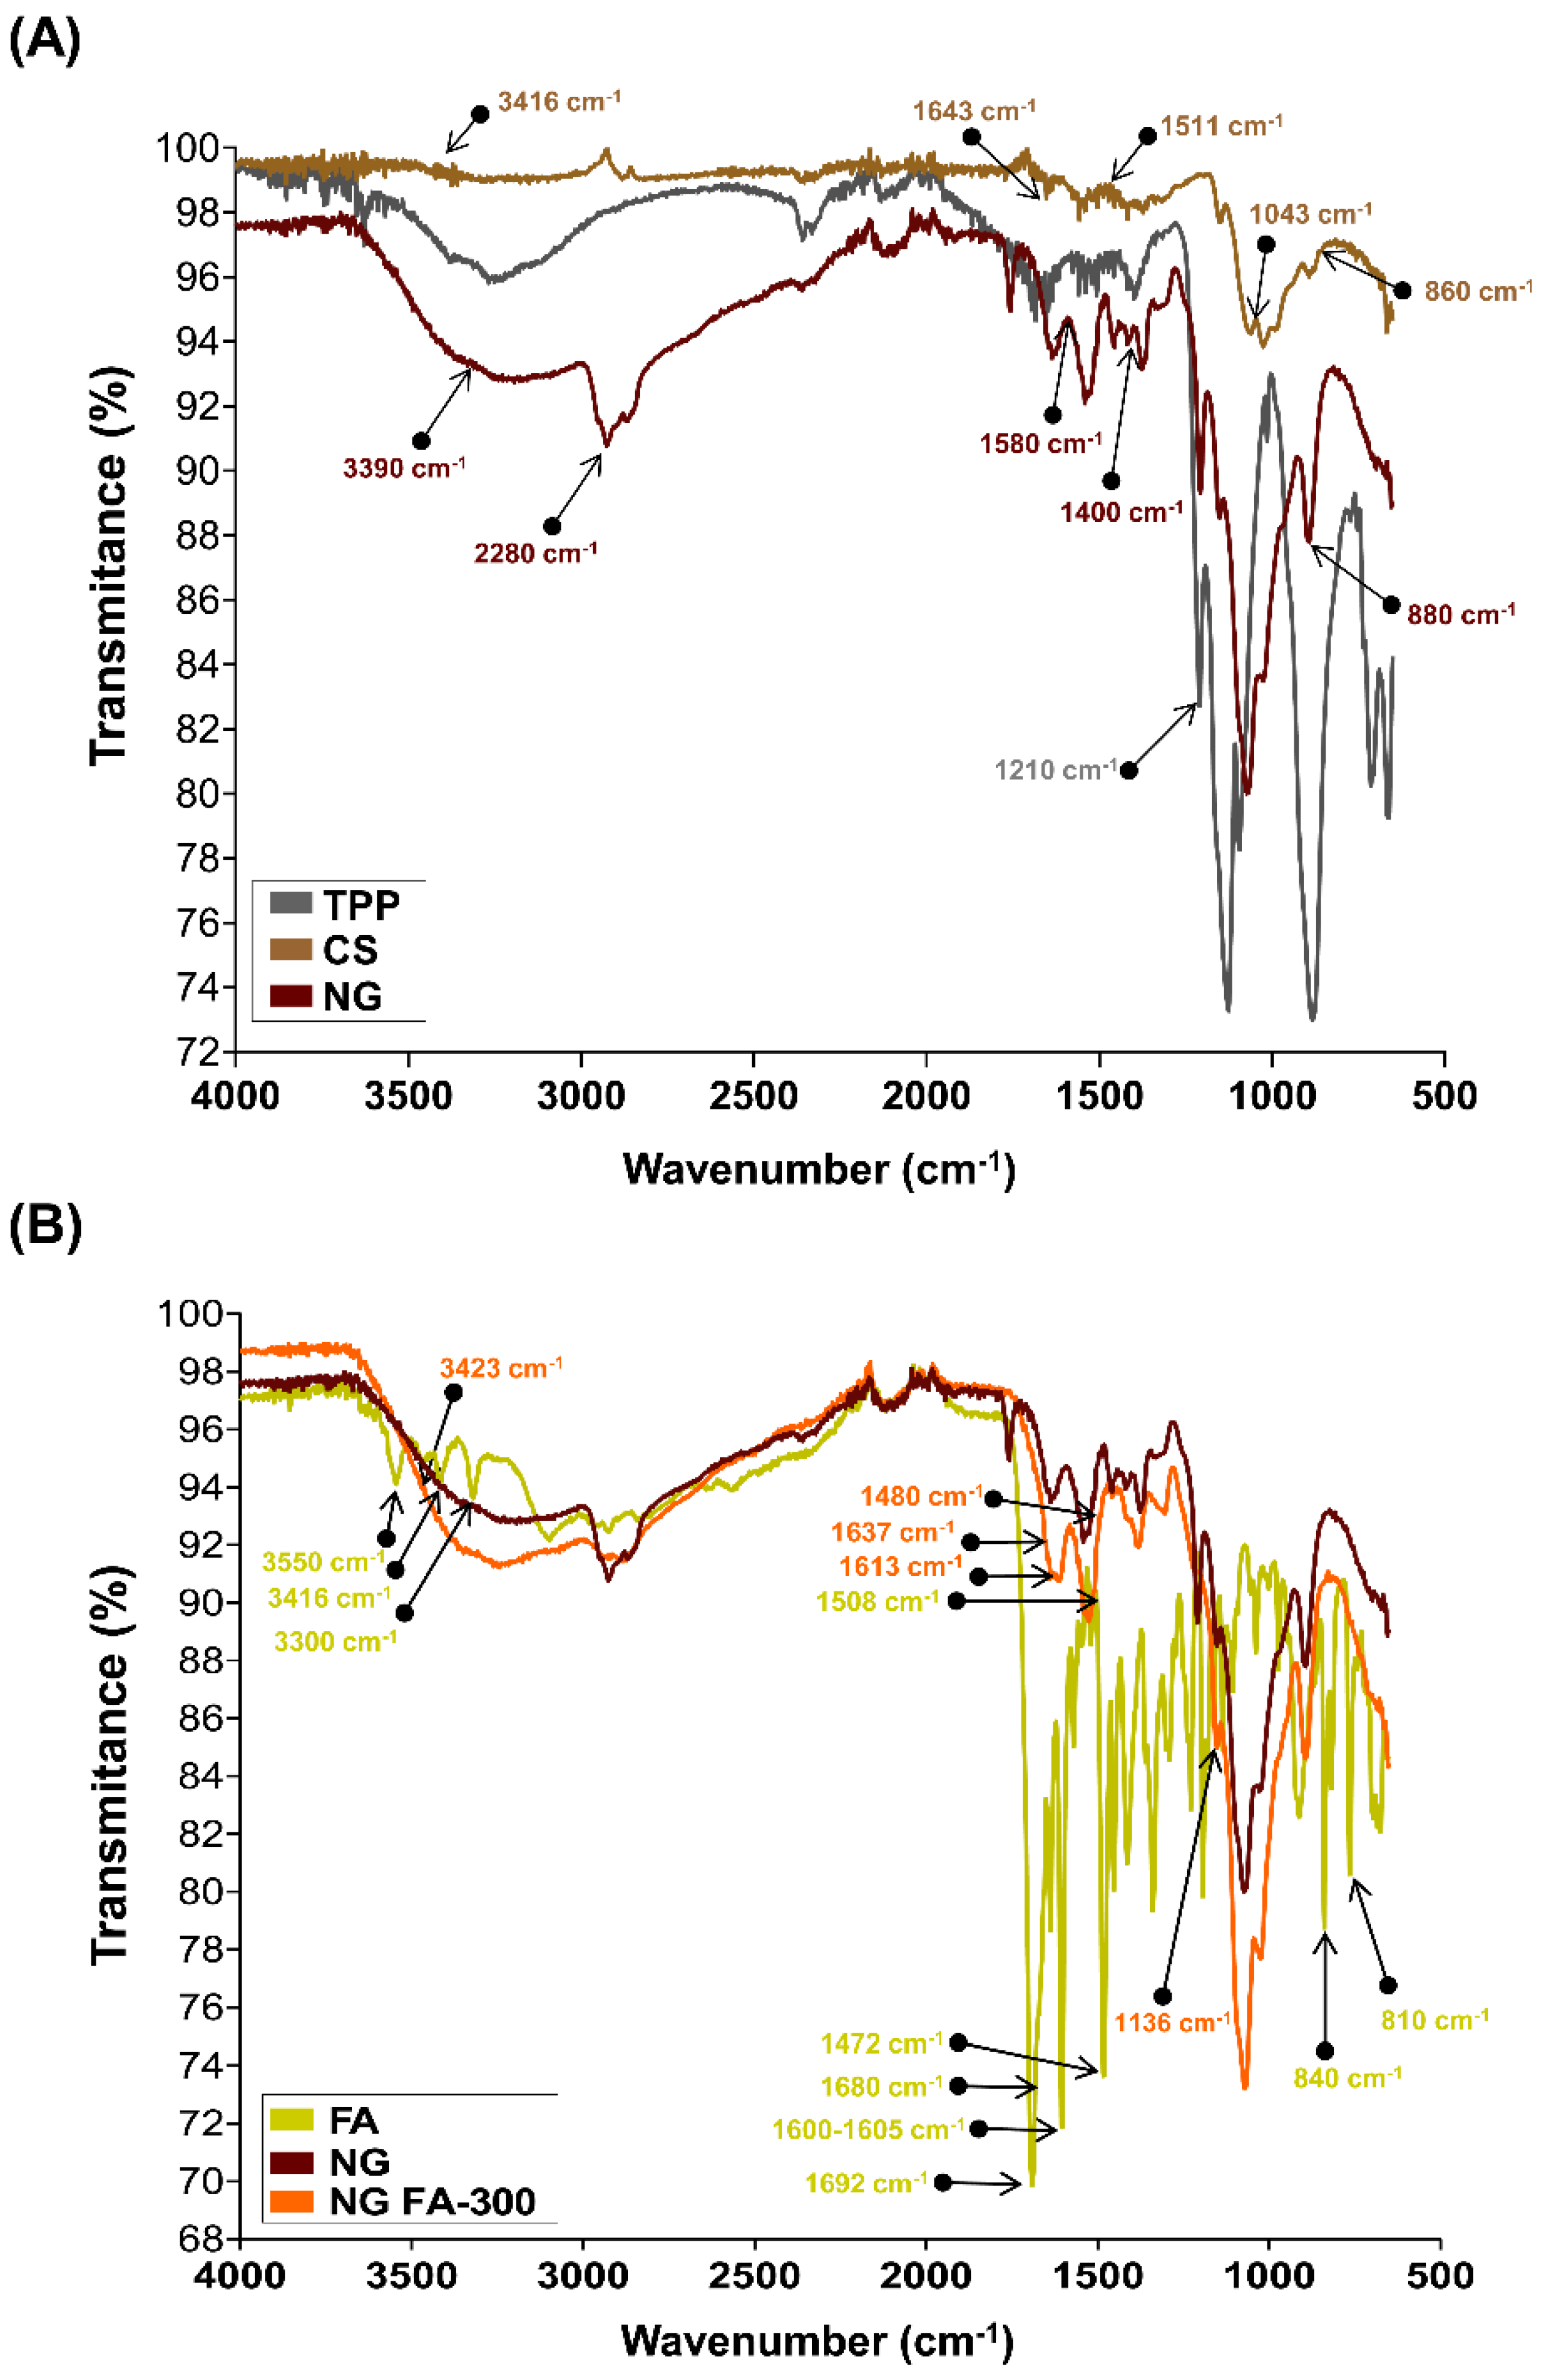
Figure 3.
(A) SEM images of NG and NG FA-300 at different magnifications, showing NG ultrastructure and size. (B) Histogram representing the size distribution of both NG and NG FA-300 nanoparticles, highlighting the average diameters. Red line corresponds to the Gaussian curve fitted to the data. Scale bar: 200 nm.
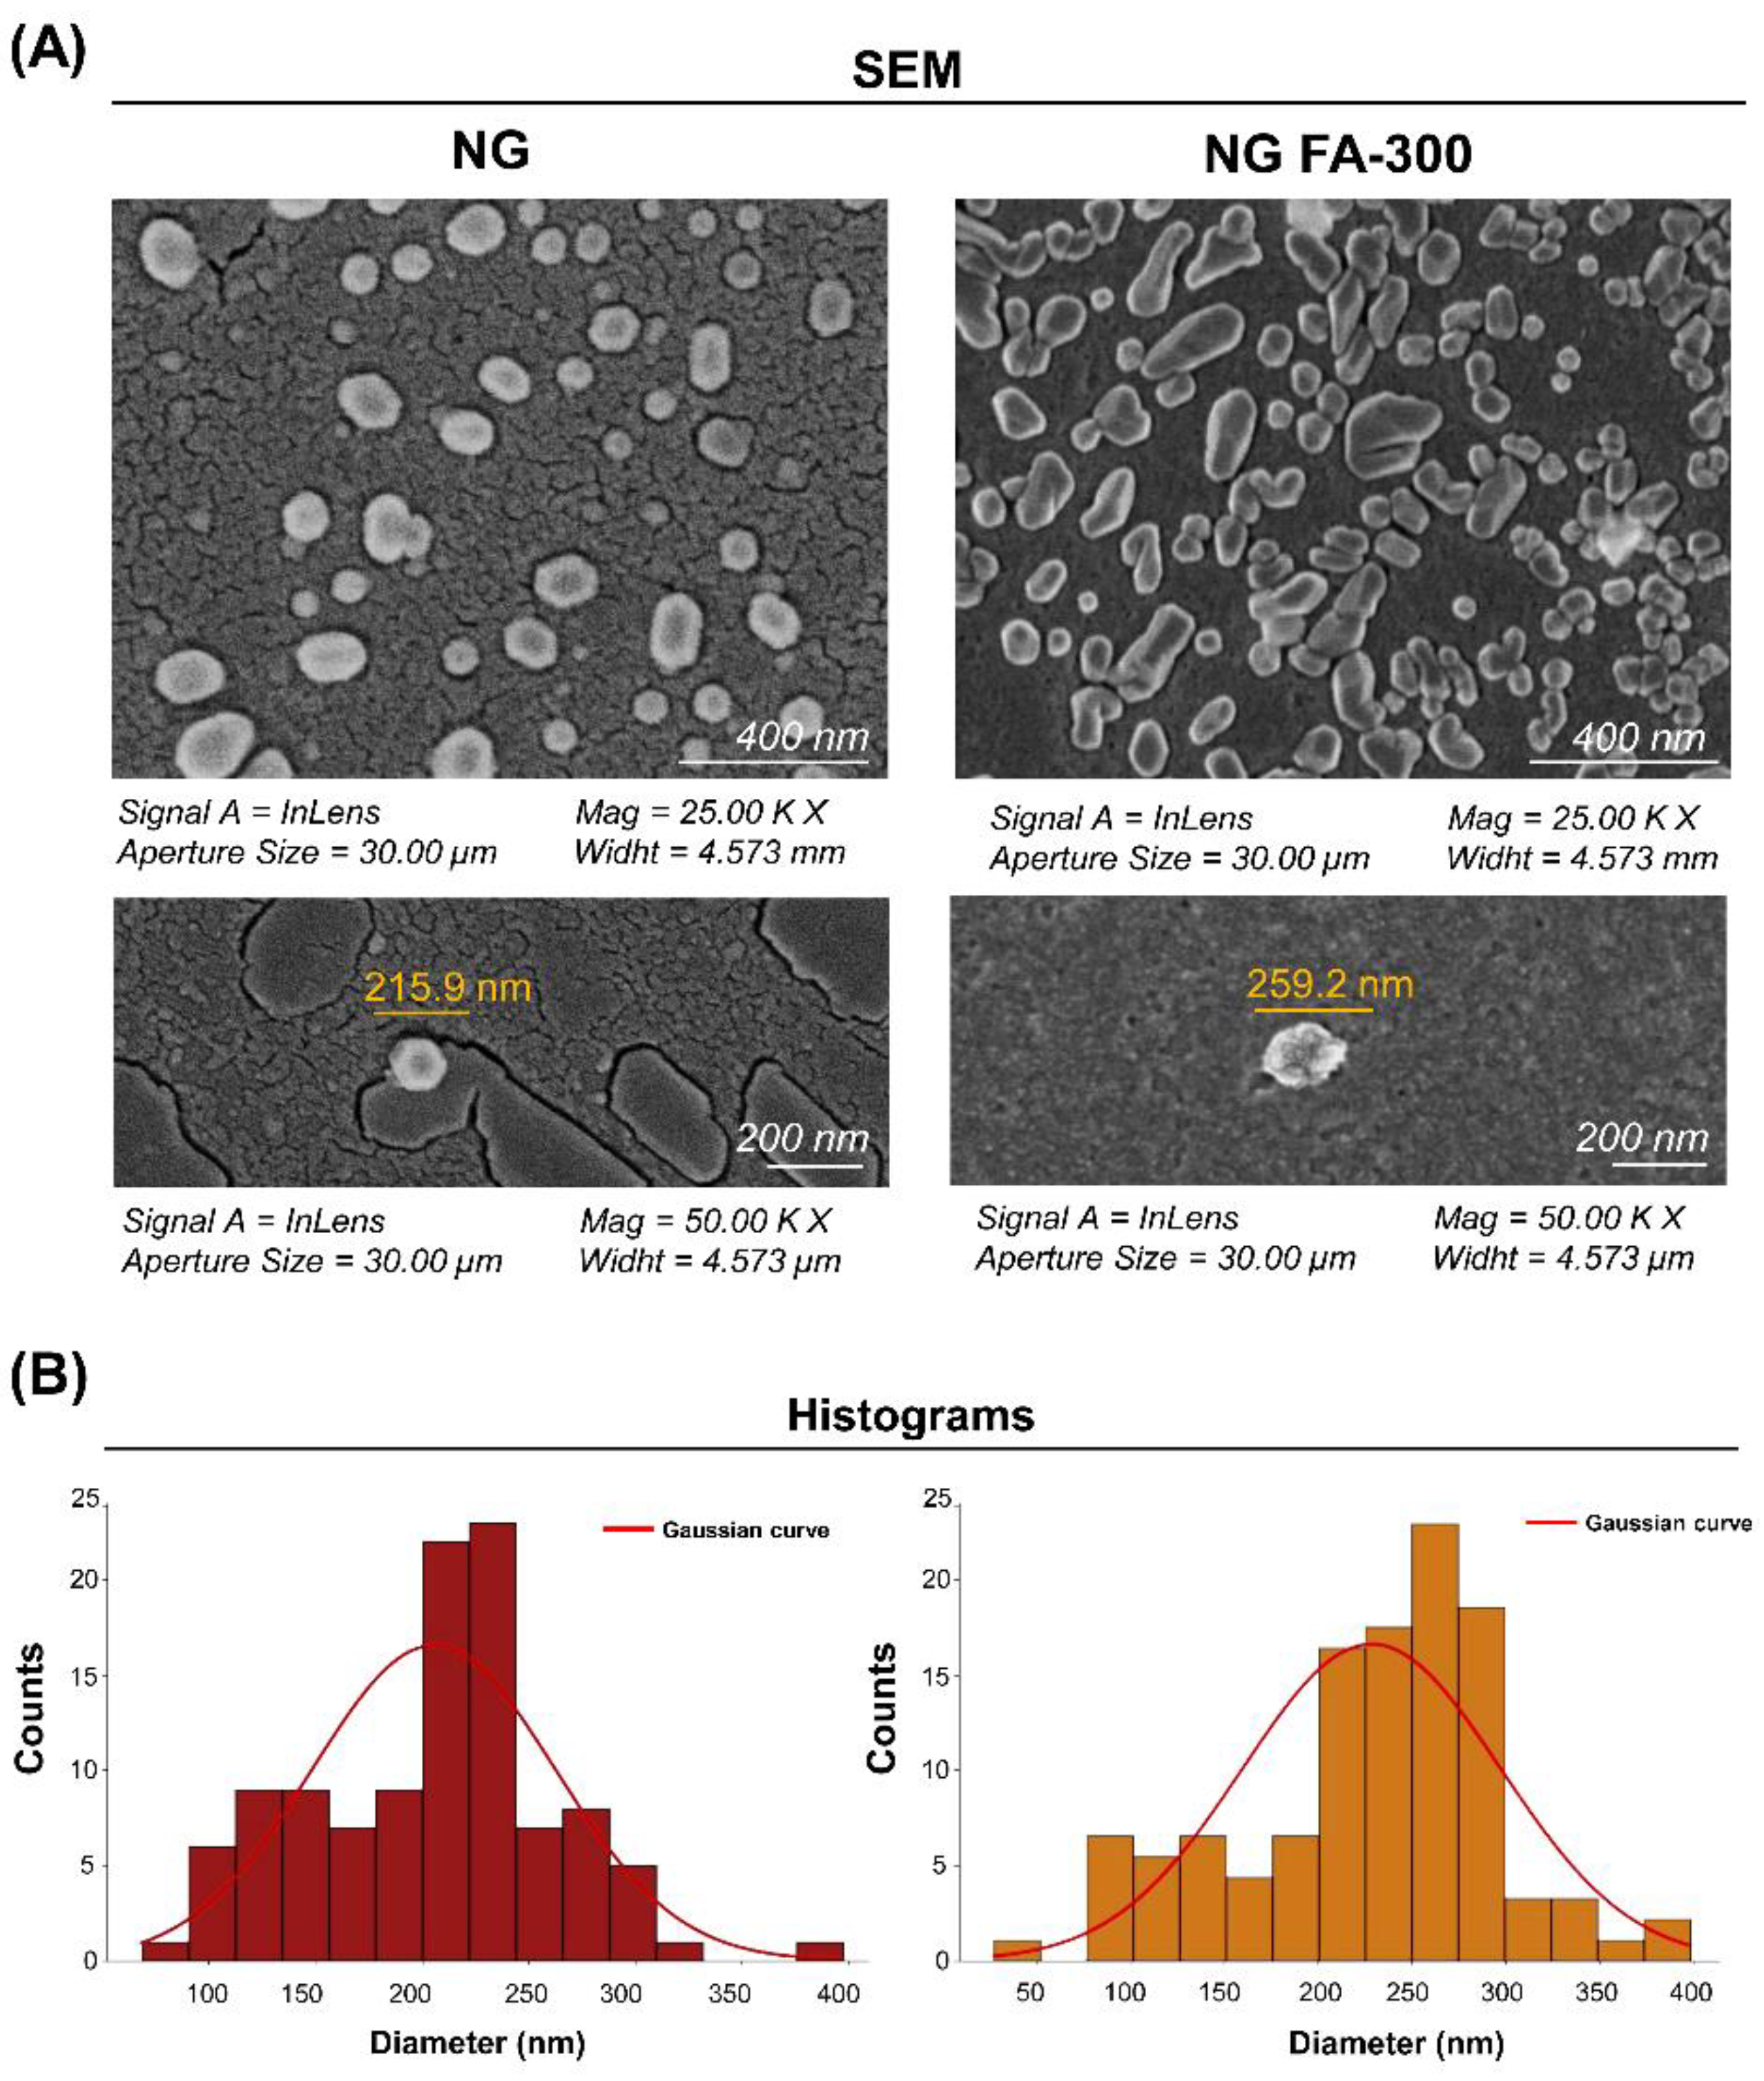
Figure 4.
(A) DSC thermograms showing the heat flow profiles of FA-300, TPP, CS, NG, and NG FA-300 samples, with key thermal events, enthalpy and transition temperature printed out by arrows. (B) TGA curves representing weight loss as a function of temperature, indicating thermal stability for the different analysed samples.
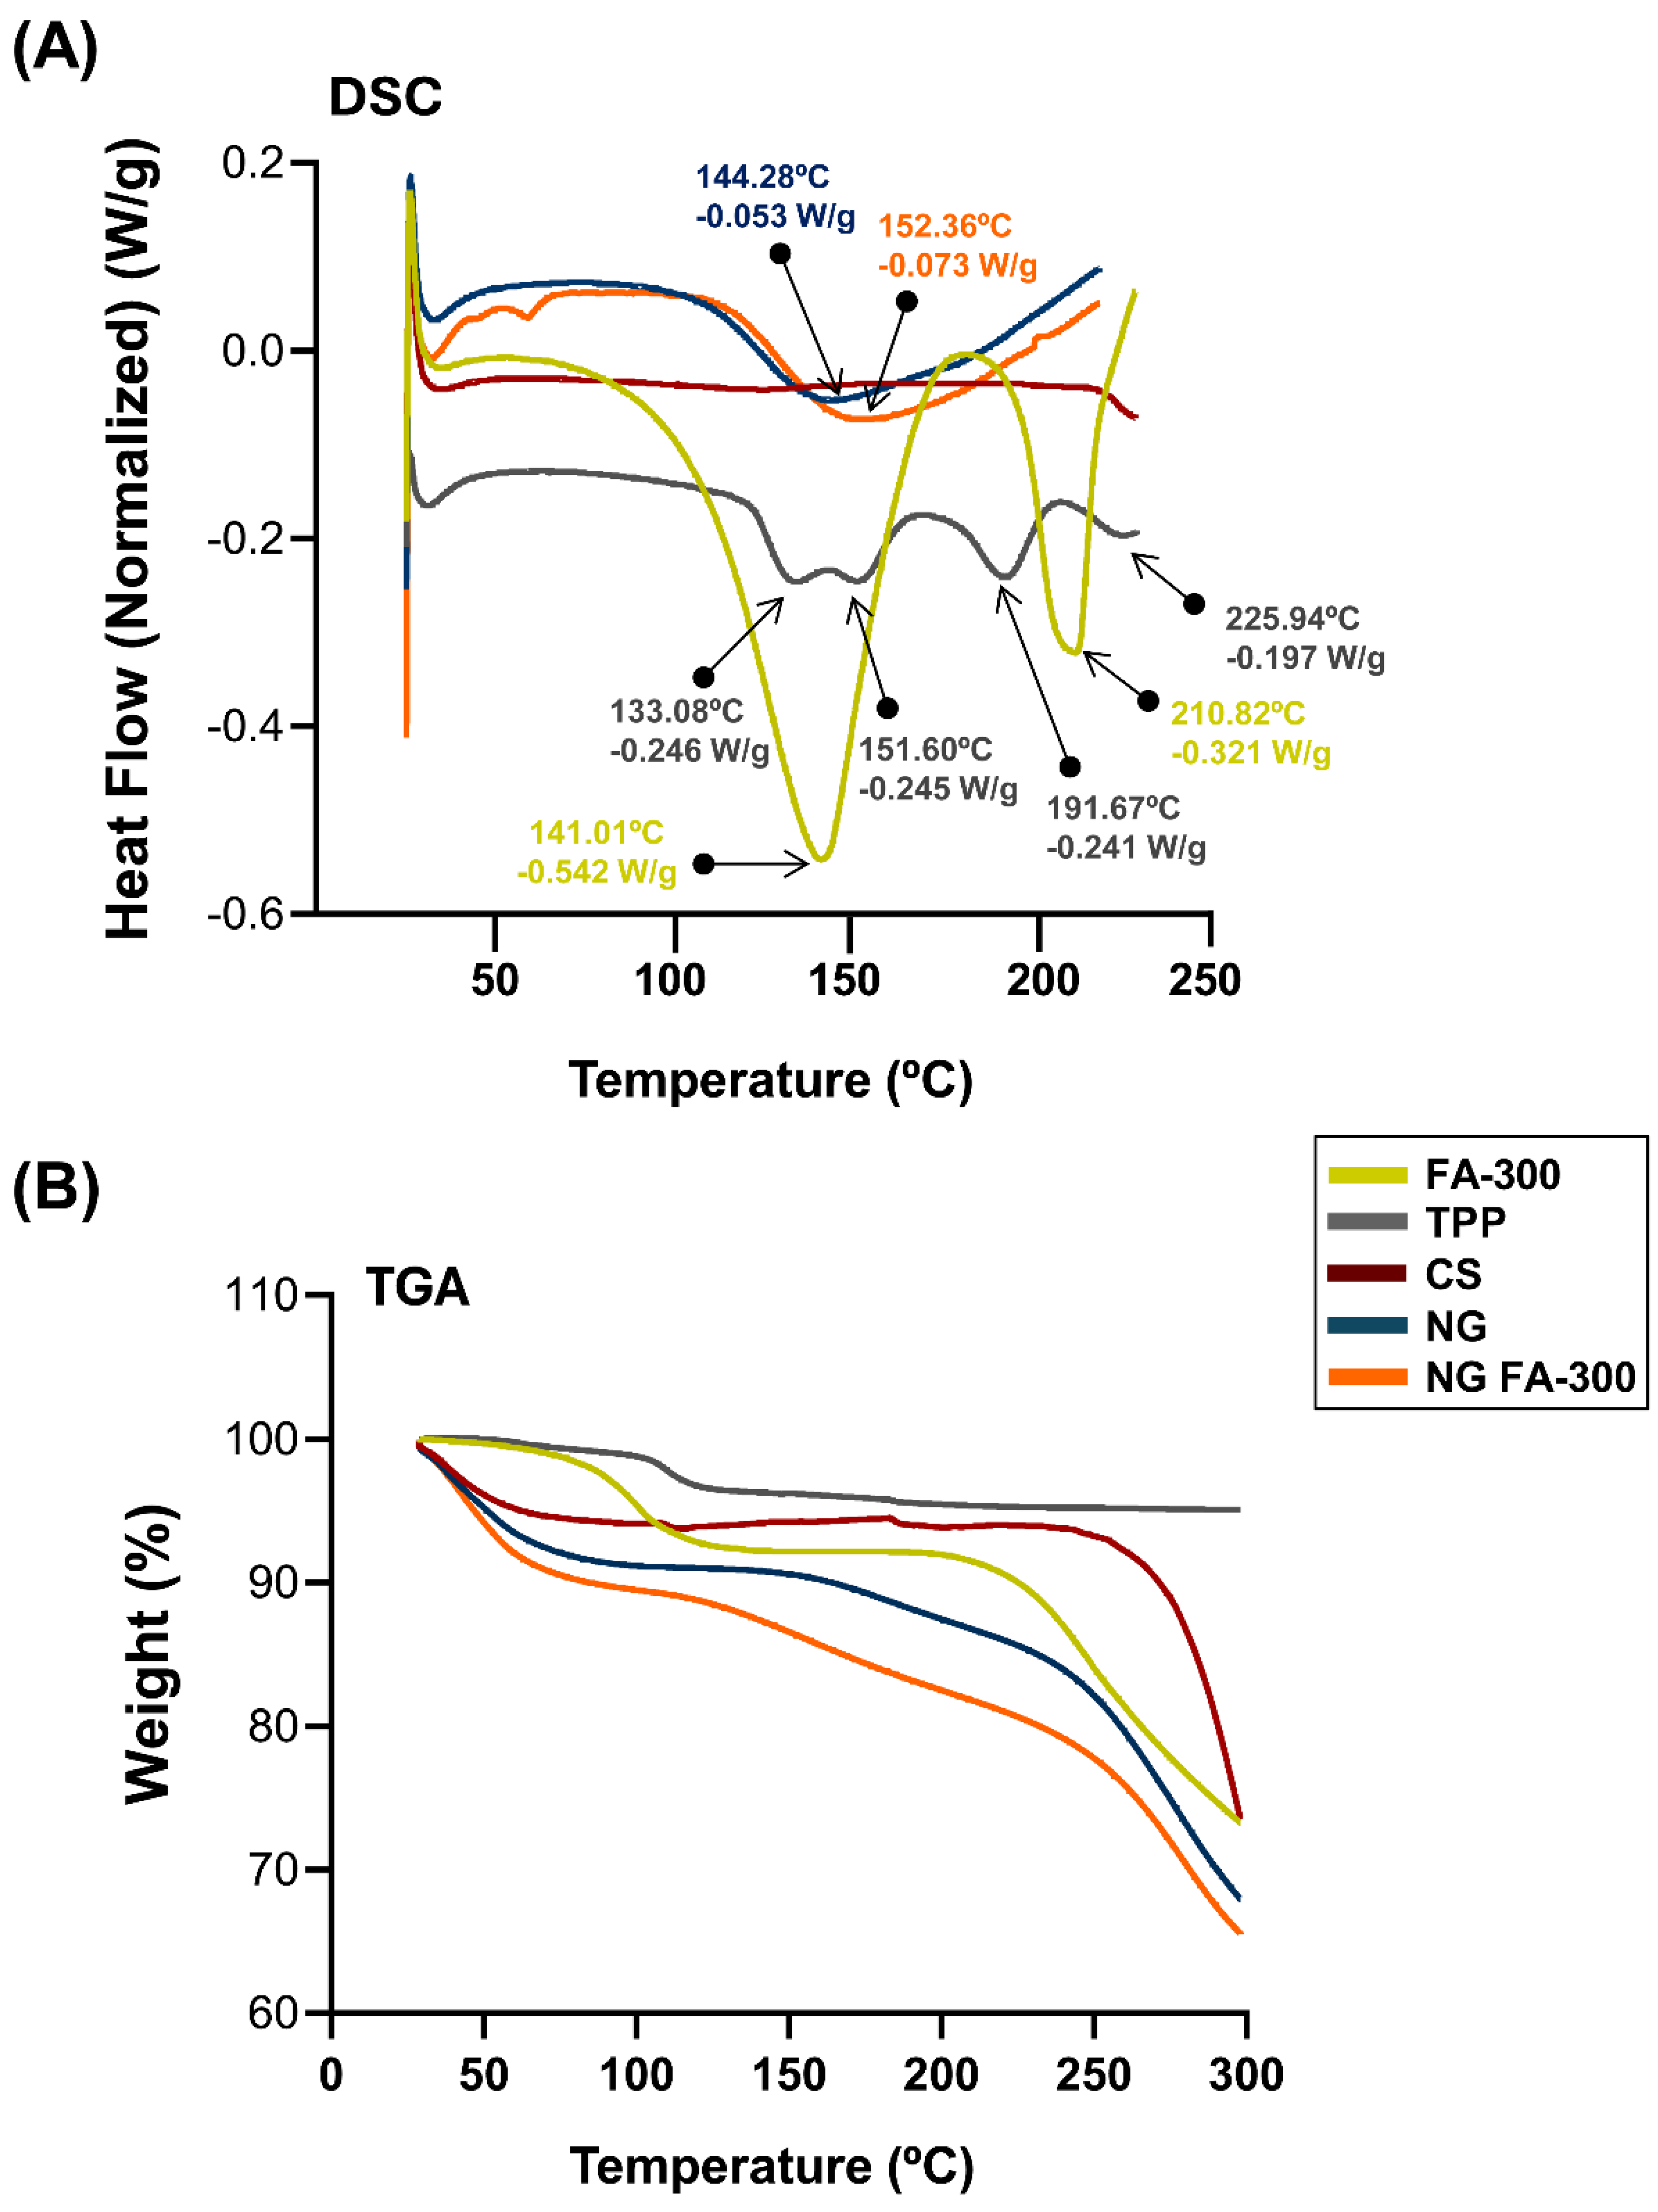
Figure 5.
The drug release profiles of both free FA and NG FA-300 were assessed over time using a modified Franz diffusion chamber with PBS (pH 7.4) at 37 ºC. Significant differences were observed from 60 min. ***p < 0.001.
Figure 5.
The drug release profiles of both free FA and NG FA-300 were assessed over time using a modified Franz diffusion chamber with PBS (pH 7.4) at 37 ºC. Significant differences were observed from 60 min. ***p < 0.001.
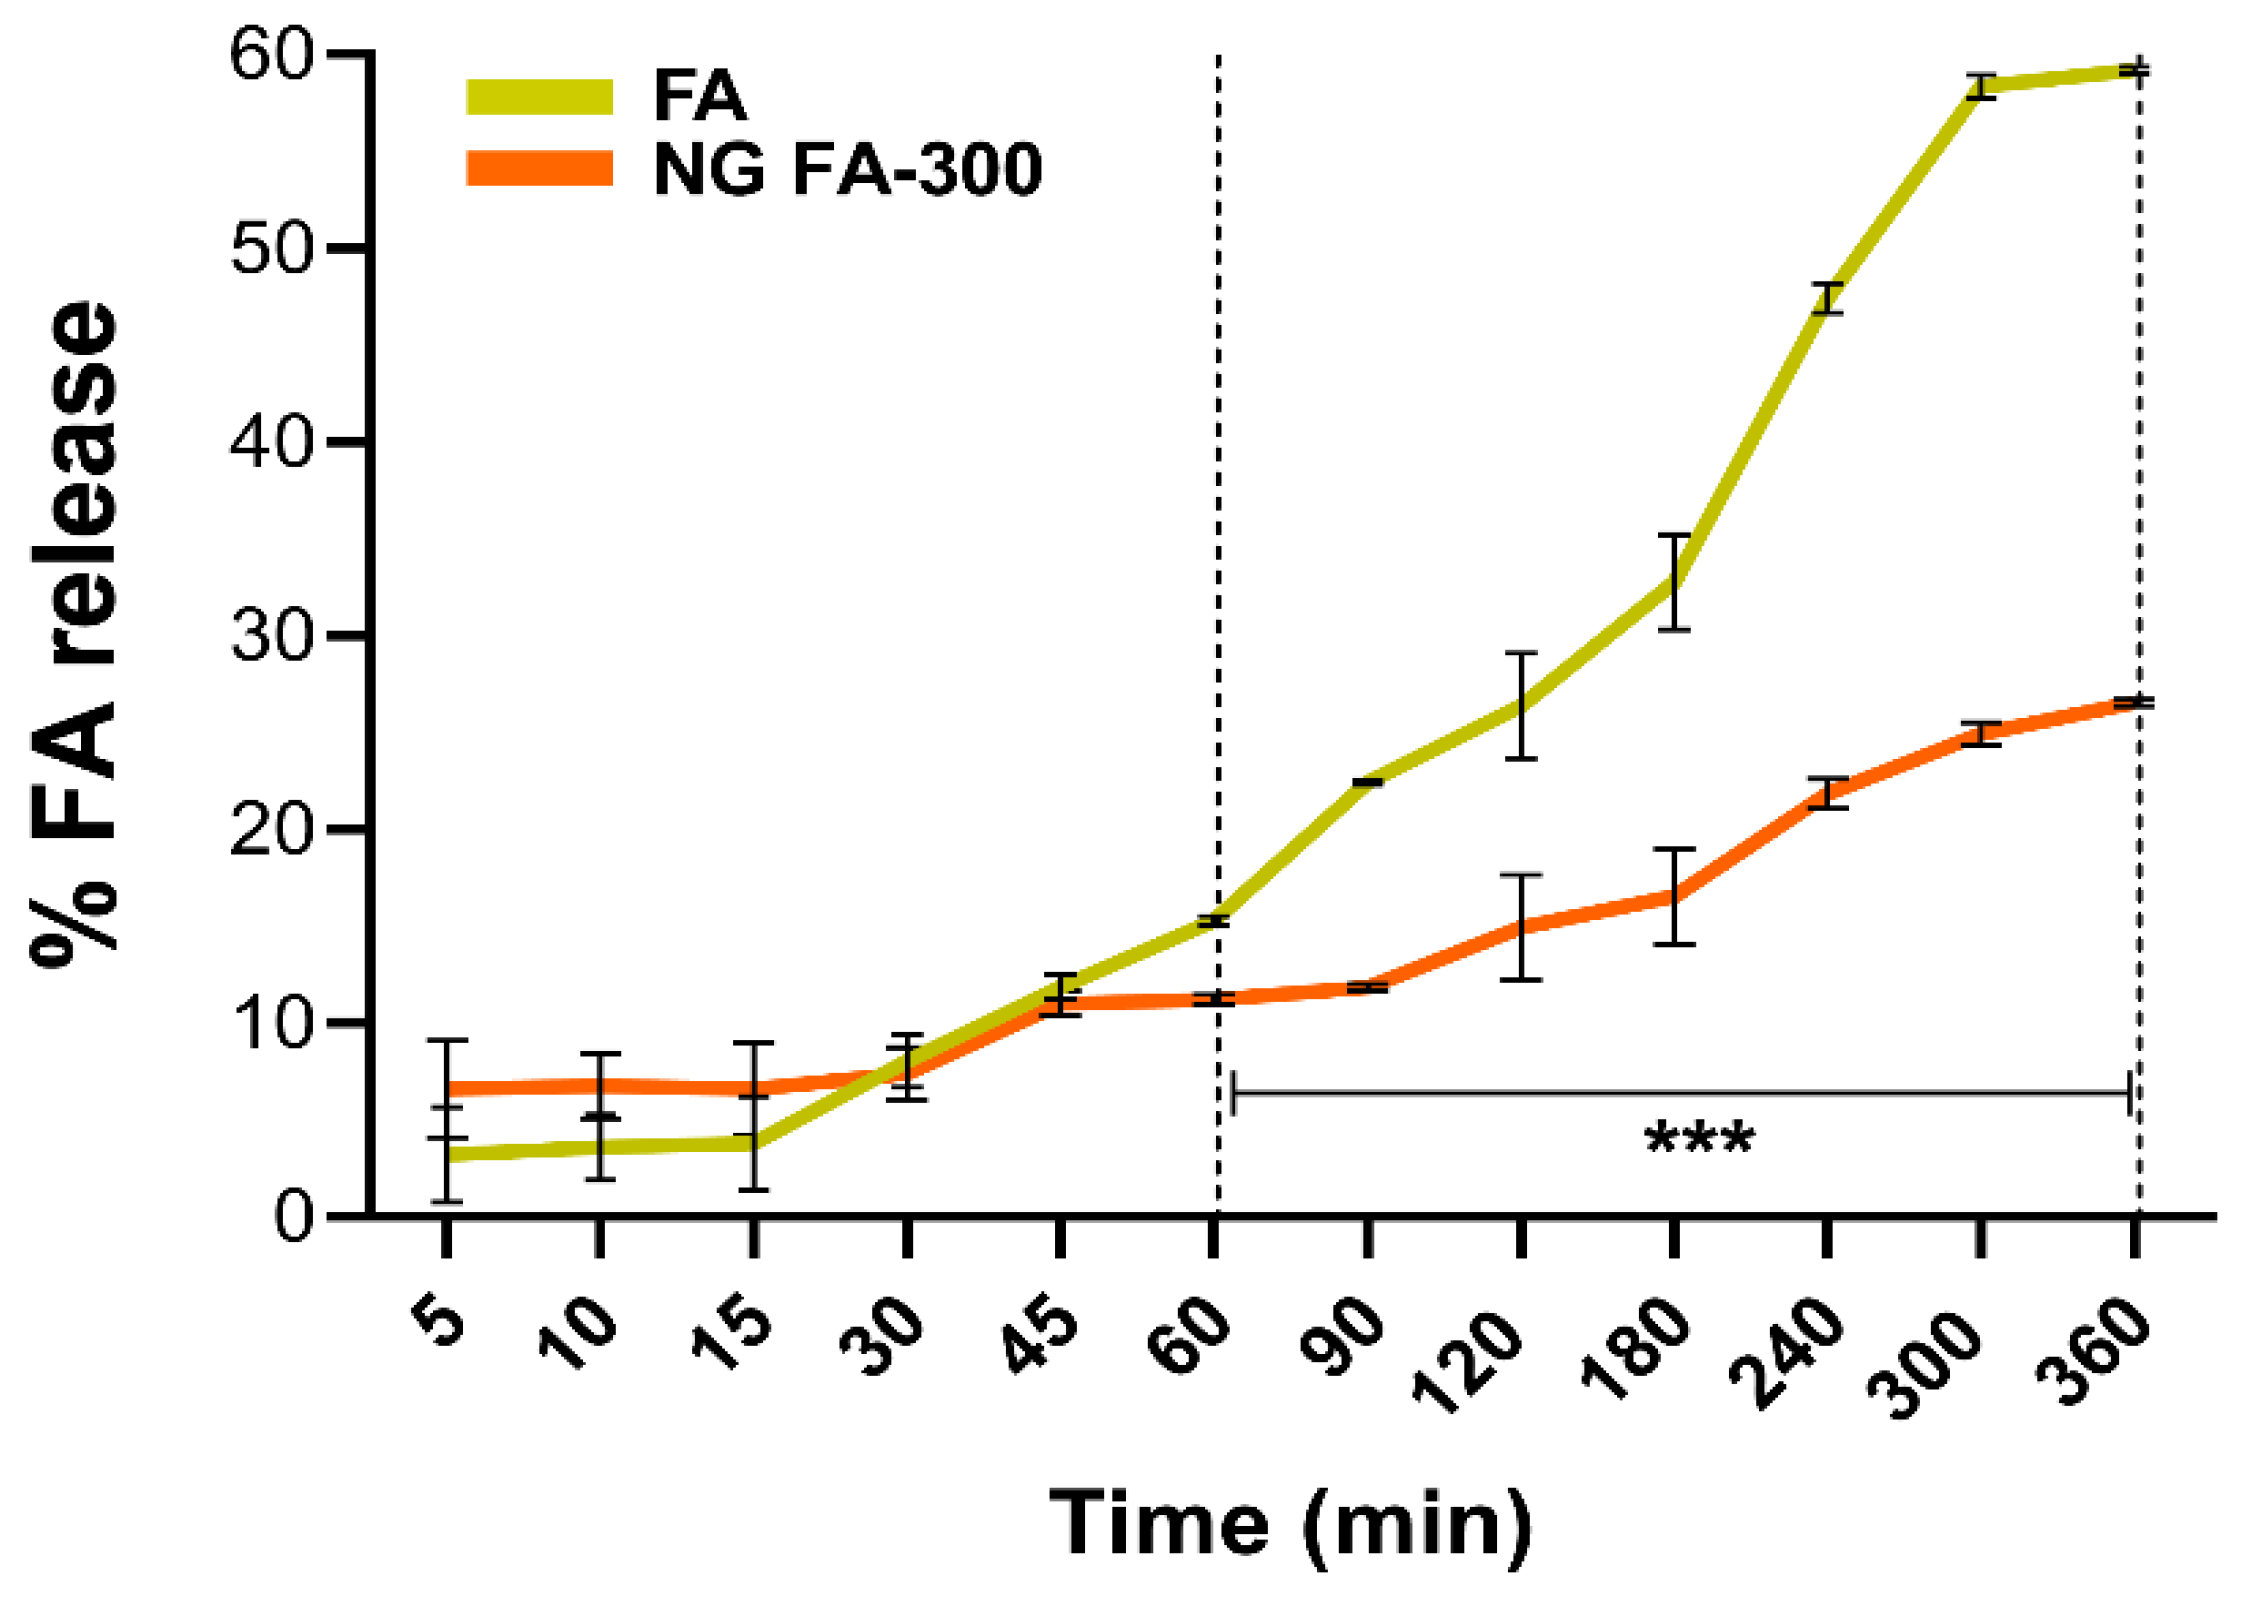
Figure 6.
(A) ζ-Pot of MC, FA, NG, NG FA-300, and NG FA-500. Significant differences are indicated: ***p < 0.001, **p < 0.01, ns = not significant. (B) ζ-Pot values used as an indicator of mucoadhesion between MC and NGs over 24 h. (C) Ho values of MC-NGs mixed system over 24 h. **p < 0.01, ***p < 0.01. "ns" denotes non-significant differences. Blue bars represent the ζ-Pot measured immediately after mixed system preparation, while red bars correspond to measurements taken 24 h later. The values within the bars correspond to mean values.
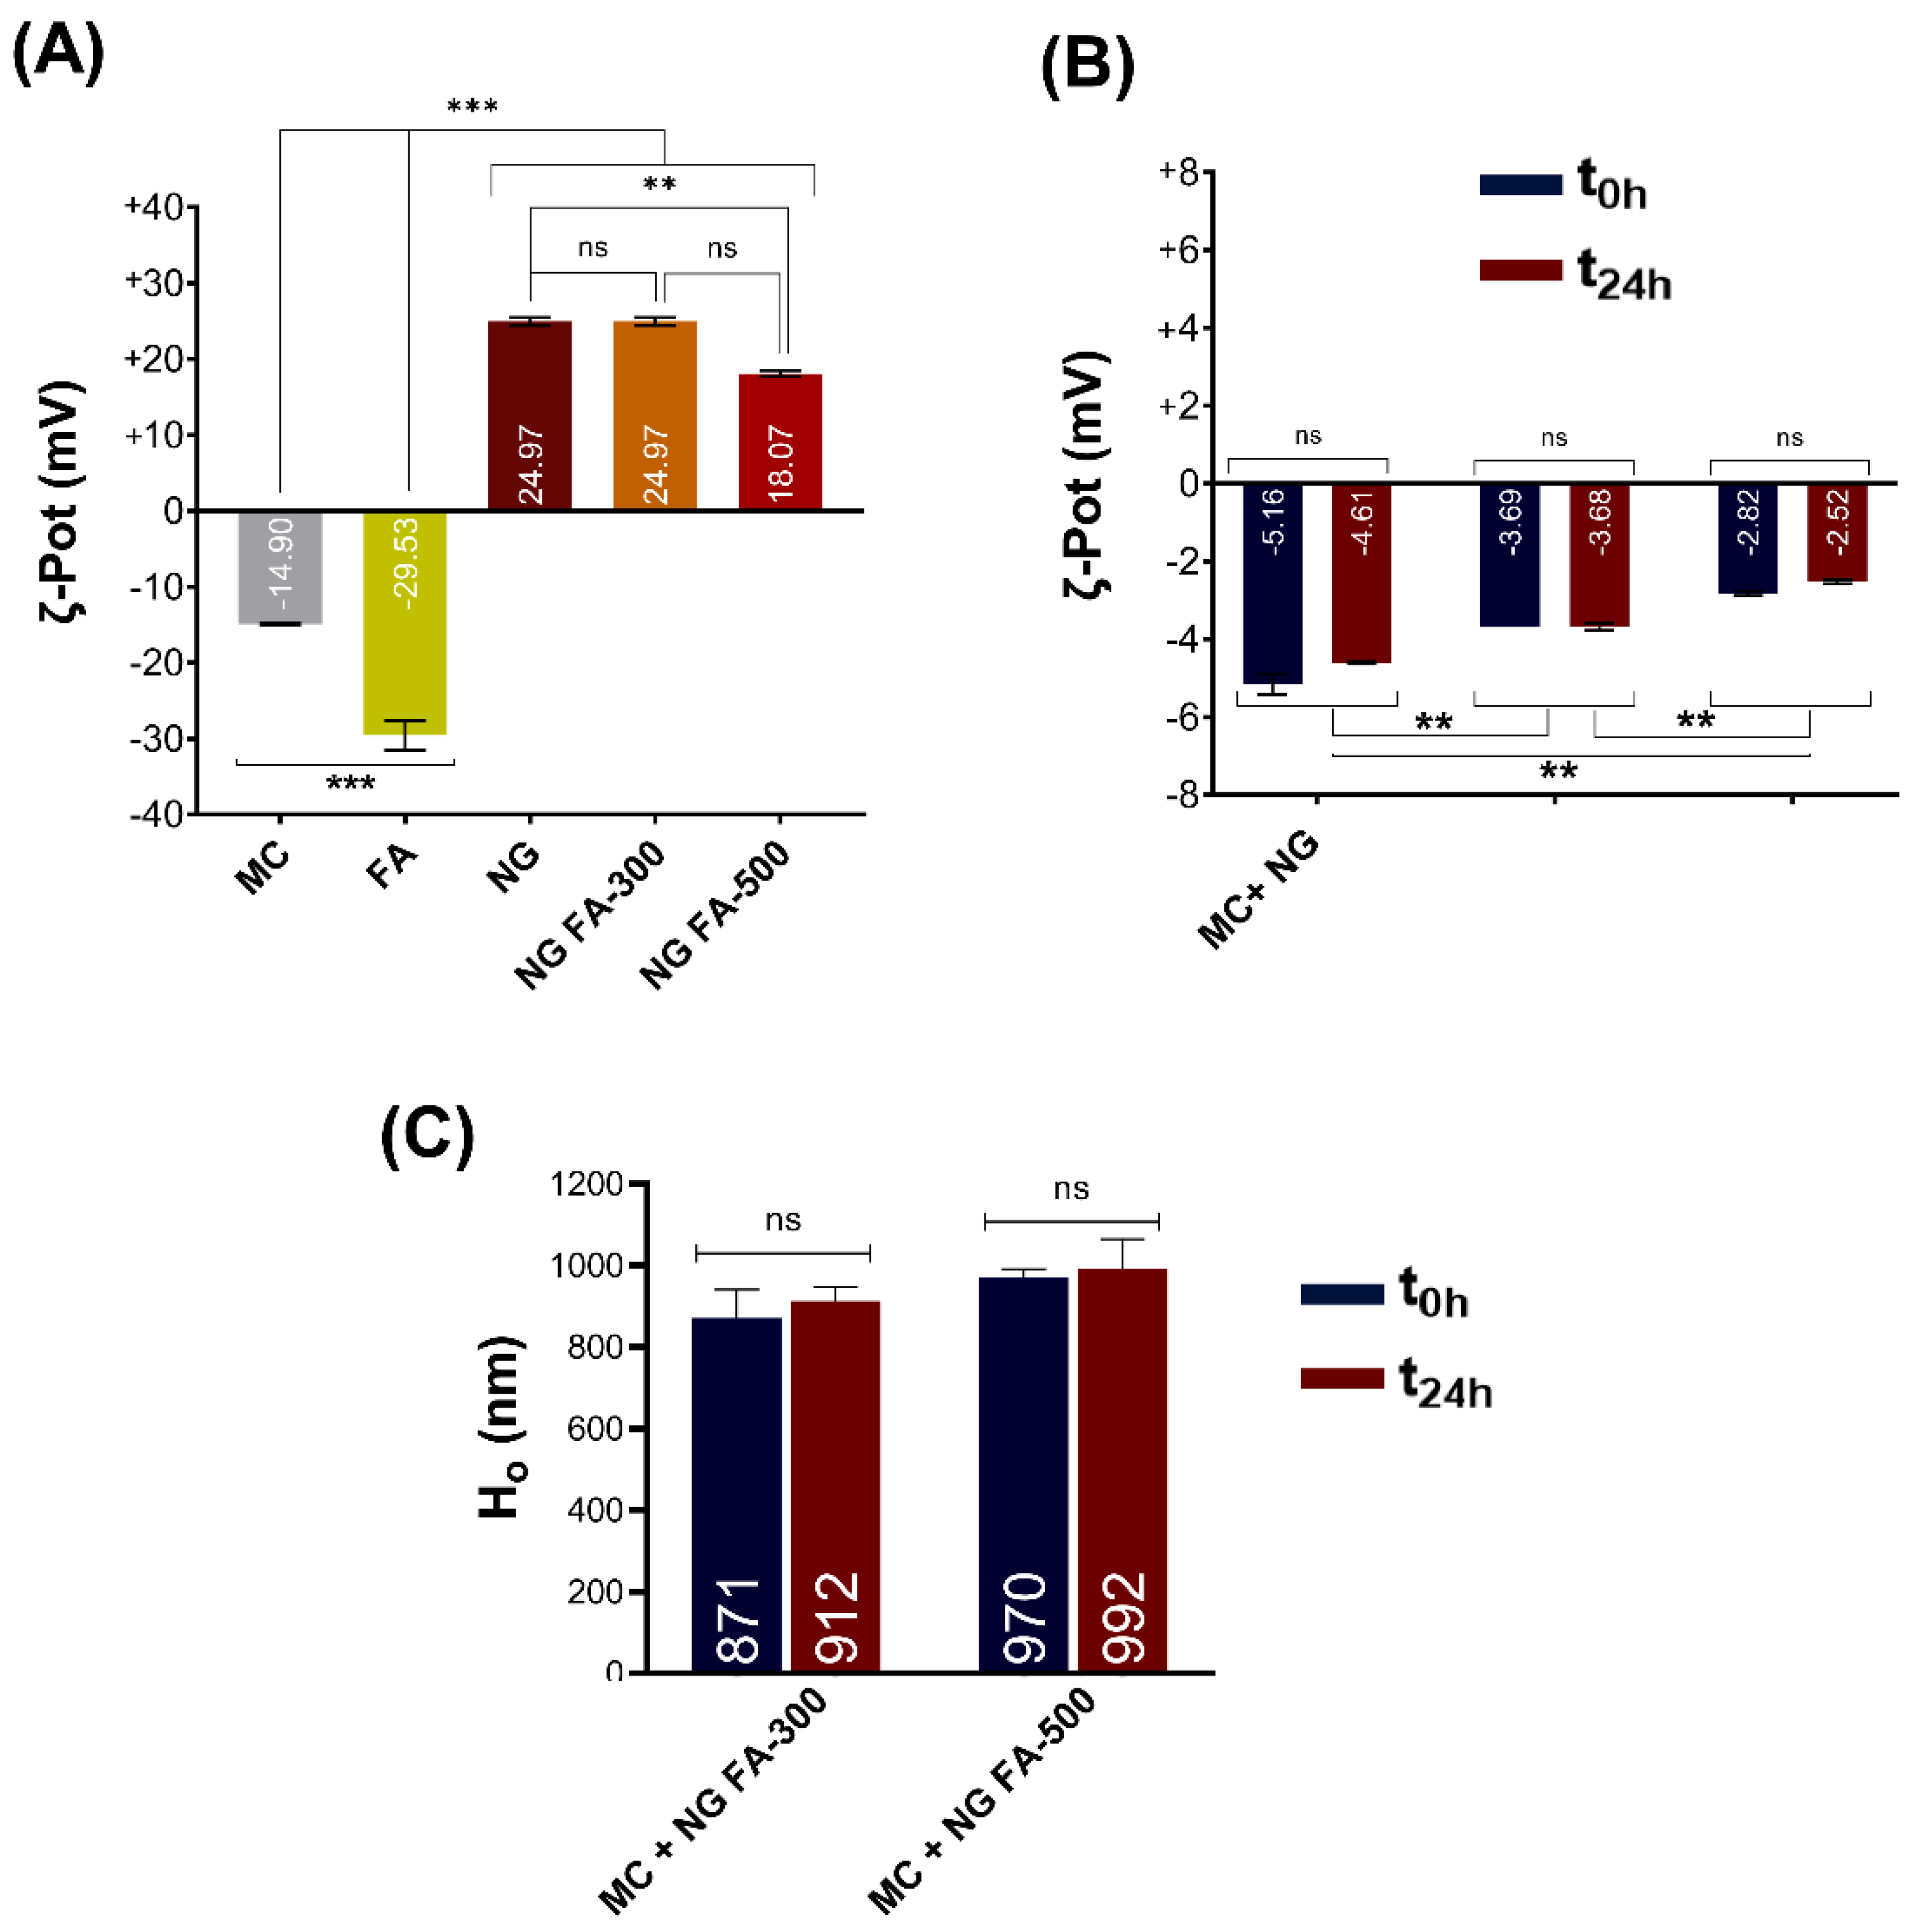
Figure 7.
(A) Illustration of the trans-corneal permeation setup in which rabbit cadaveric corneal membranes and a modified Franz diffusion chamber were employed. The experimental setup allows for testing the permeation of both free FA and NG FA-300. Illustration created using BioRender platform. (B) Trans-corneal permeability parameters for both free FA and NG FA-300 over time. *p < 0.05 and **p < 0.01.
Disclaimer/Publisher’s Note: The statements, opinions and data contained in all publications are solely those of the individual author(s) and contributor(s) and not of MDPI and/or the editor(s). MDPI and/or the editor(s) disclaim responsibility for any injury to people or property resulting from any ideas, methods, instructions or products referred to in the content. |
© 2025 by the authors. Licensee MDPI, Basel, Switzerland. This article is an open access article distributed under the terms and conditions of the Creative Commons Attribution (CC BY) license (http://creativecommons.org/licenses/by/4.0/).
Copyright: This open access article is published under a Creative Commons CC BY 4.0 license, which permit the free download, distribution, and reuse, provided that the author and preprint are cited in any reuse.


