Submitted:
03 May 2025
Posted:
06 May 2025
You are already at the latest version
Abstract
Accurately assessing the quality of a forested site is essential for sustainable forest management. In forest practices, assessment methods primarily rely on ground meas-urements, but these approaches face challenges such as high costs, low efficiency, and spatial and temporal limitations in data collection.
At present, a large number of studies have explored the application of UAV remote sensing technology in forest resource monitoring and have made significant progress in biomass estimation, forest structure analysis and carbon stock assessment. However, existing research still lacks a program to integrate traditional site quality assessment methods with UAV remote sensing data systems. To fill this gap, this paper takes UAV LiDAR acquisition of high-precision point cloud data as the core, and combines UAV data processing with the evaluation model based on potential productivity to realize the accurate extraction and quantitative assessment of stand factors. The study mainly includes three major steps: data acquisition and preprocessing, stand factor extraction, and quantitative assessment of stand quality, and the stand factors include elevation, slope direction, slope gradient, slope position, soil type, and depression.
This study was conducted at Chinese fir (Cunninghamia lanceolata) plantations in Guangdong, southern China. High-precision point cloud data were collected from 133 sample plots using drone LiDAR for experimental validation. In this study, the data of 133 sample plots are randomly divided into two groups, one group of 89 sample plots is used to train the model, and one group of 44 sample plots is used for model valida-tion.
In particular, the growth models constructed achieved determination coefficients of 0.6745 for stand height, 0.7460 for diameter at breast height, and 0.8071 for volume, indicating high model fitting and demonstrating the method’s good predictive capa-bility. And the validation results of the validation dataset for the model have R2 as low as 0.5634 and as high as 0.7856, with most of them around 0.7, which proves that the model has a fair prediction ability.
Keywords:
Site Quality Assessment
; Forest Resource Management
; Drones
; Ecological Monitoring
; Potential Productivity
1. Introduction
Site quality or site productivity refers to the ability of a particular site to sustain vegetation growth or productivity [1,2]. Accurately assessing the quality of a forested site is a key requirement for the sustainable management of forest resources, enabling appropriate decision-making on optimal rotation periods, thinning regimes, regeneration harvesting, selection of tree species for regeneration and afforestation, and sustainable yields [3,4]. The global environment faces multiple challenges, including forest degradation, increased incidence of forest fires, air pollution and loss of biodiversity, and forests are a key force in addressing these challenges [5,6]. Forests can absorb large amounts of carbon dioxide and provide substantial oxygen. Forest ecosystems absorb nearly one-third of the annual anthropogenic carbon dioxide emissions [7,8]. Global forest cover has been steadily increasing over the past decade, reflecting some success in efforts towards forest conservation and management. However, in recent years, significant disturbances such as the expansion of agricultural land, timber harvesting, and forest fires, along with an overall increase in other disturbances, present a severe challenge for forest management [9,10]. In this context, forest site quality evaluation has become increasingly important. Forest site quality evaluation refers to the assessment and prediction of its suitability for forestry or potential productivity based on the similarities and differences in vegetation growth outcomes and site conditions [11]. Conducting forest site quality evaluation is a fundamental task in forestry planning, production, and management [12]. It enables a deeper understanding of the forest vegetation's growing environment and helps study and grasp the impact of environmental factors on forest types and their productivity [13].
Traditional methods for assessing woodland quality have been in practice for a long time and include integrated assessments based on tree growth, soil quality, climate change impacts and machine learning [14]. Newton [15] simulated the effects of climate change on the productivity of black spruce and red pine under different site quality conditions by improving the site density management models (SSDMMs) and combining the tree height-age equation to provide a prediction model for future forest management under climatic conditions. The basal area increment (BAI) method proposed by Fu et al. [16] measures the site quality of multi-aged, multispecies forests by calculating the basal area potential productivity index (BAPP), which is applicable to structurally complex mixed forests. Peri et al. [17] proposed a carbon accumulation modeling method based on the integrated analysis of tree age, canopy class and stand quality class, and constructed dynamic equations of individual tree carbon accumulation and root-canopy ratio changes with age through field sample surveys of Nothofagus antarctica stands with different quality classes in Southern Patagonia, thus realizing the quantitative classification and evaluation of forest stand quality. Dong et al. [18] proposed a method to classify the stand quality of cedar plantation forests by integrating rough set theory and random forest algorithm. The method is based on ADA to construct a status index model for stand classification, and uses rough sets to screen out key factors such as slope direction, slope, and depression, and realizes high-precision classification through random forest modeling. Although these methods have made important advances in site quality evaluation, most of them rely on ground surveys [19]. Ground surveys have certain limitations; firstly, manual ground surveys are highly dependent on a large number of surveyors, constrained by the number of personnel and the level of professional skills, and have high survey costs. Secondly, because manual ground surveys usually adopt regular sampling methods, it is difficult to realize real-time monitoring of environmental changes, which may lead to failure to timely detect dynamic changes in the standing environment and its impact on site quality. Finally, manual ground surveys are susceptible to the experience, subjective judgment and operational errors of surveyors, leading to data bias and thus affecting the accuracy and reliability of evaluation results.
In contrast, the use of drones for forest resources monitoring has the following advantages: firstly, the cost-effectiveness of drone monitoring is high, drones can be used repeatedly in multiple regions after a one-time purchase, which reduces the equipment investment in long-term monitoring, thus reducing the overall monitoring cost; secondly, the persistence of drone monitoring is strong, drones can realize long time and multi-frequency monitoring, and through reasonable deployment, the information on the forest land can be realized Through rational deployment, it can realize high-frequency updating of forest land information and even reach the accuracy of daily updating, thus enhancing the timeliness of monitoring; lastly, the drone monitoring data is objective, the drone can collect the data according to the established norms after presetting the parameters, avoiding the interference of human subjective factors, ensuring the stability and consistency of the data, and making the monitoring results more scientific and comparable.
In recent years, in order to improve the precision and efficiency of forest resource monitoring, many scholars have proposed the use of unmanned aerial vehicles (UAVs) and their combination with satellite remote sensing to carry out forest monitoring, and important progress has been made in the estimation of biomass, assessment of carbon stock, and analysis of forest structure. For example, Sanaa Fadil et al [20] spatially modeled the biomass and carbon stock of cork oak forest in Maamora, Morocco, using UAV LiDAR-UAV combined with forest inventory data.Yunhong Xie et al [21] used UAV RGB imagery and Canopy Height Models (CHMs) combined with the Mask R- CNN deep learning model to realize single-tree canopy segmentation and stand mapping in a pure forest of cedar. Despite UAV remote sensing technology has made significant advancements in forestry research, a comprehensive framework encompassing the entire process of UAV LiDAR-based data acquisition, data processing, and site quality evaluation has yet to be fully developed. However, existing studies still lack a site quality evaluation system that systematically combines traditional forest site quality evaluation methods with UAV remote sensing data.
In this paper, a UAV-based forest site quality evaluation framework is constructed on the basis of the traditional site quality evaluation program and the latest application of UAV remote sensing technology in forestry. The scheme adopts the potential productivity-based site quality evaluation method proposed earlier by our team, selects six key stand factors, namely, elevation, slope direction, slope gradient, slope position, soil type, and canopy density, and utilizes UAV remote sensing data as the main data source in order to enhance the efficiency and accuracy of data acquisition. In addition, in order to verify the effectiveness of the method, this study selected the Guangdong region of China as the study area, and utilized UAVs to acquire high-resolution remote sensing images and point cloud data, and combined them with ground sample data for experimental verification.
2. Materials and Methods
2.1. Information Collection and Processing
2.1.1. Data Collection
Data collection constitutes a pivotal link in the process of forest site quality assessment, directly influencing the accuracy of subsequent analysis and modeling. The acquisition of high-quality data enhances the reliability of studies and provides scientific foundations for precise forestry management. The advent of UAV technology has ushered in a new era of efficiency and diversification in forest management data collection. This technological advancement encompasses a plethora of methodologies, including remote sensing imagery, LiDAR, thermal imaging, and 3D modeling, among others. These methodologies have been seamlessly integrated with ground control, data fusion, and intelligent analysis, thereby enhancing the precision and efficiency of forest resource monitoring.
In order to ensure the accuracy and completeness of the data, the collection of UAV data is usually carried out according to the following steps: first, the study area is determined and objectives are set. This process entails several key steps. First, the geographic location, area, and ecological characteristics of the study area must be clarified. Second, the specific objectives of data collection must be set, including but not limited to forest structure analysis, single wood segmentation, biomass estimation, and so forth. Third, the required data types must be determined, such as remotely sensed imagery, LiDAR point cloud, multispectral data, or thermal imaging data. Fourth, the appropriate UAV platform and sensor must be selected. According to the research needs, fixed-wing or multi-rotor UAVs can be selected. Fixed-wing UAVs are well-suited for large forest areas, offering long endurance and efficient wide-area data acquisition. Conversely, multi-rotor UAVs are particularly adept at fine monitoring, such as canopy structure extraction at the single-tree level. The selection of suitable sensors is paramount to ensure the accuracy and applicability of the data, and must be tailored to the specific requirements of each application. Subsequent to this, mission planning and route design are initiated. The route should be reasonably planned according to the size of the study area, terrain characteristics, and sensor resolution to ensure data coverage and collection accuracy. The route design should consider the overlap rate between heading and side direction, flight altitude, and environmental factors to maximize data quality. Subsequently, data acquisition is executed and real-time monitoring is performed. During the flight of the UAV according to the planned route, real-time monitoring of the flight status and sensor operation is required to ensure the stability and integrity of data collection. In the event of unexpected situations, the flight parameters can be adjusted according to the actual situation in order to optimize the effect of data acquisition. Finally, data storage and backup. After data acquisition is completed, the original data should be stored immediately and a data backup should be established to avoid data loss. Concurrently, data validation tools are employed to assess the data integrity, ensuring the absence of any missing or aberrant data, thereby safeguarding the accuracy and reliability of subsequent analyses. The present study utilizes a multi-rotor UAV equipped with LiDAR (laser radar) to acquire data. This configuration boasts high flexibility and accuracy, enabling stable operation in complex terrain and dense forest environments, and producing high-resolution 3D point cloud data.
The data were acquired by a BB4 UAV equipped with an AS-1300HL LiDAR system. The laser scanner model was Riegl VUX-1LR, with a wavelength of 1550 nm, a pulse length of 3.5 ns, a laser beam divergence angle of 0.5 mrad, a pulse repetition frequency of 50 kHz, a maximum scanning angle of 30°, and a scanning frequency of 49 Hz. The UAV flew on a tic-tac-toe course, with a 50% overlap in the sideways direction of the point cloud, and an average flight speed of 10 m/s. The average point cloud density of the sample plot was 10 m/s, and the average point cloud density of the sample plot was 10 m/s, with the average point cloud density of the sample plot of 10 m/s. The average point cloud density of the sample site was 110 pts/m².
2.1.2. Data Pre-Processing
This paper mainly adopts the following methods for data preprocessing: first, data normalization. Since the data range of different features may have large differences, in order to eliminate the influence of the scale and improve the comparability of data, it is necessary to normalize the data, i.e., to adjust the data to a uniform scale, in order to improve the stability of the model and the computational efficiency. Second, noise cleaning. In order to improve data quality, noise and outliers in the data need to be further removed. Especially in the case of large data volume, deep learning methods can be used to effectively identify and remove noise to optimize data availability and accuracy. In this paper, we use a previously developed method of deep learning, which can be found in Lu et al [22].
The processing of noise should be determined based on the actual situation and optimized by combining different methods. In the denoising process of UAV LiDAR point cloud data, commonly used traditional algorithms include multi-scale surface filtering algorithms, slope filtering algorithms, and the Classified Surface Filtering (CSF) algorithm. These algorithms, after long-term application, have shown excellent performance in both efficiency and accuracy, becoming essential tools for point cloud data denoising. By selecting and applying these algorithms appropriately, errors and redundant information in the data can be effectively reduced, providing higher-quality input data for subsequent analysis.
2.1.3. Data Processing
The data processing in this paper utilizes self-developed software that first reads the processed point cloud data and performs data preprocessing and cleaning as needed to remove noise and outliers and ensure data quality. Subsequently, the software utilizes an advanced point cloud segmentation algorithm to cut the data and divide the large-scale forest point cloud data into single-tree scales. The system extracts the point cloud data of a single tree through a series of precise analysis steps based on the spatial distribution characteristics of the tree, point cloud density, crown contour, and other key information to achieve data separation at the single-tree level. Subsequently, for each tree, the software carries out morphological analysis and parameter calculation, including the extraction of key features such as stand height and crown width, to ensure the accurate portrayal of the stand structure. Consequently, all processing results are converted into standardized cutting data for subsequent analysis and site quality assessment. Currently, several mature software packages have been developed in the market that can provide comprehensive support for the entire data processing process, encompassing various aspects from data reading, point cloud processing, single-tree segmentation to feature extraction. In contrast, the self-developed software utilized in this study has been optimized in data cleaning, automated segmentation, and parameter calculation, allowing for more precise and efficient adaptation to the requirements of forest site quality assessment.
2.2. Evaluation Methodology
This study used the concept of the potential growth of forest stands to evaluate the quality of forest stand. This method clarifies the potential productivity of forest stands and provides a scientific basis for forestry managers to formulate more precise management and restoration measures for different stand conditions. Potential productivity refers to the maximum annual growth (e.g., volume, fracture area, biomass, etc.) that can be achieved by a forest stand under optimal density and structure conditions for a given stand type and stand growth conditions[23]. In contrast, realistic productivity refers to the amount of stand growth in the actual environment, which is usually lower than potential productivity due to factors such as stand density, competition, and disturbance. Therefore, by assessing potential productivity, the gap between real productivity and optimal growth can be quantified, so that forestry management measures can be optimized to improve forest productivity[24]. Lei et al. have developed a site quality assessment method based on potential growth of forest stands, including the calculation models of potential and real productivity, the selection of influencing factors, and the method of grading stand quality[25]. Therefore, this paper only briefly introduces the method and analyzes the validation with practical application.
2.2.1. Stand Growth Modeling
For a given stand growth type (stand growth typeand stand subclass ), three models can be developed for stand height (), break area () and stocking growth ().
The stand height model ((), which predicts the average tree height of a stand from the growth patterns of the trees:
Break-area growth model () for predicting break-area growth of a stand:
Accumulation growth model () for predicting the amount of accumulation growth in a stand:
where is stand age, is stand class, is stand growth type, is a function of stand height growth, is stand density, is stand age, is a function of fractional area growth, and is a function of stocking growth.
2.2.2. Potential productivity estimates
Let the “density/structure” of the stand at age be , and the “density/structure” of the stand at age one year later be , and the annual growth of the stand volume from to be:
When and are fixed, the annual stocking growth is a function of and . Fixing an age , the stocking growth depends only on . Therefore, there should be an optimal “density/structure” to maximize the stocking growth (potential productivity) of the stand at age :
Using equation (5) to model stand growth based on actual survey data, potential productivity can be derived theoretically.
For a certain stand growth type group, Eqs. (2) and (3) were utilized to establish the growth model of break area and volume of storage for each stand class. The form of whole forest holistic model proposed by Shouzheng Tang (1991a) was chosen[10]:
where denotes the standingia class.
Under the condition that the growth type of the stand, the current age and the Lidia class are known, a is found from the given stand density index to maximize the objective function, and the corresponding is called the potential productivity of the stocking, and the density of the stand at this time is the optimal density:
Where are the parameter vectors corresponding to the growth models of stand height, break area and stocking, respectively. It should be noted that the maximum annual growth of different stand classes of the same stand at the same age is not the same, and the corresponding densities are not the same, and the maximum annual growth at different ages forms a potential productivity curve. Therefore, for any stand growth type, the maximum annual growth at different ages (including the potential productivity at the base age), the corresponding stand density, stand break area and stock volume will be output.
2.2.3. Stand Growth Type and Stand Classification
The first step is to perform stand growth type classification. The purpose of stand growth type classification is to ensure consistency in the growth process of stands within the same stand growth type, particularly in terms of stand height, basal area, and volume growth. Therefore, stand growth types are classified based on similarities in tree species composition, structure, and growth patterns. These stand growth types can be divided into stands with the same species composition, origin, similar stand conditions, and similar growth processes. Using the cluster analysis method, the closest stands are first aggregated, gradually refined, and finally formed into stand growth type groups. To improve the accuracy of the classification, it is also necessary to carefully classify "stand elements", i.e. sample plots with similar species composition and growth processes. The finer the subdivision of stand elements, the higher the precision of the growth type subdivision, but it is also limited by the number of sample plots.
The classification of stand classes was based on the stand factors affecting the growth process of the forest stand, with the aim of classifying different stand classes by determining the effects of different stand conditions on the growth of the forest stand. The study selected stand factors that influence stand growth, including qualitative factors (e.g., slope direction, slope position) and quantitative factors (e.g., elevation, slope, soil type, humus layer thickness, etc.). These factors were then categorized into several classes based on their range of values and treated according to the qualitative factors. The classification of stand classes not only considered the combination of qualitative and quantitative factors, but was also refined by a stand height growth model. This model utilized the fitting of growth curves so that the effects of different stand factors were fully considered.
Subsequent to the acquisition of potential productivity at varying ages, the stand density, stand basal area, and volume under m stand classes were determined. Consequently, stand quality can be evaluated for any small group or plot in the forest management unit.
2.3. Elevation Quality Evaluation Process Using UAV LiDAR
` The process of stand quality evaluation using UAV LIDAR is illustrated in Figure 1. In the initial step, UAV LIDAR is employed to collect data from sample plots. In the subsequent step, UAV LIDAR data undergoes pre-processing, which can be categorized into noise reduction, normalization, data fusion, and other relevant procedures, according to the specific requirements. data; in the third step, UAV LIDAR data is divided into single logs; in the fourth step, each type of data is extracted from sample plots; in the fifth step, stand quality evaluation is carried out, and the specific evaluation process of stand quality can be set according to the demand, and the specific process can be seen in the paper mentioned above. In the fifth step, the stand quality evaluation is carried out, and the specific evaluation process of stand quality can be set according to the demand. This paper adopts the stand quality evaluation method based on the potential growth of forest stand, and the specific process can be found in the above mentioned paper.
3. Case Studies
3.1. Data
This paper takes the pure Cunninghamia lanceolata forests in Guangdong Province as an example. The data used includes data from 133 sample plots in Guangdong Province. The actual sample plot size is 80×80m, with a total of 26,768 tree observation values. The main surveyed factors include the geographical coordinates of the plot, topography, slope, aspect, altitude, soil type, soil thickness, age, height, and individual tree measurements (species, diameter at breast height, tree type, and measurement type). Detailed statistical information of the sample plots is shown in Table 1. We randomly divided the data into two groups according to the region where the sample plots are located, one containing 89 sample plots as a training group for training the model, and one containing 44 sample plots for validating the model accuracy.
3.2. Landform Elements and Landform Classification
In this paper, the factors related to stand in the dataset include geomorphology, elevation, slope, slope position, slope direction, soil type, soil thickness, and degree of depression, and each factor is graded, and the grading criteria are shown in Table 1, and the combination of these factors gives us the stand elements of each sample plot. Richard model was chosen.
where and are the mean height (m) and mean age (a) of the stand, respectively; is the parameter corresponding to the ith stand subclass; and is the error term.

Table 2.
Standards of site factor grouping.
| No. | Factor | Classification standard |
|---|---|---|
| 1 | Elevation | Class width is 300 m |
| 2 | Slope | Class width is 10° |
| 3 | Aspect | 1.North;2.Northeast;3.East;4.Southeast;5.South;6.Southwest;7.West;8.Northwest;9.No aspect |
| 4 | Slope position | 1.Ridge;2.Upper;3.Middle;4.Lower;5.Valley;6.Flat |
| 5 | Soil depth | 1.heavy;2.middle;3.thick |
| 6 | canopy | Class is 0.2 |
Through the screening of stand factors affecting the average tall growth curve of the stand, six stand factors, namely elevation, slope direction, slope gradient, slope position, soil type, and degree of depression, were finalized, and the stand (tall growth) was classified into three subclasses, with class 1 being the highest and class 3 being the lowest.
3.3. Growth Modeling
The broken-area growth model in the holistic whole-forest model proposed by Tang Shouzheng et al. [26] was selected.
Where is the stand basal area ; is the stand density index ; T is the mean age of the stand (a); is the model parameter, where is related to the stand class (); is the error term.
The volume model was chosen to be identical to the fracture area model, where is the stand volume.
Estimates of stand mean height, basal area and volume growth model parameters and fitting statistics for the three sub-establishment classes of cedar pure stands are given in Table 3. It can be seen that models (8)-(10) all have good fitting accuracy with coefficients of determination of 0.6745, 0.7460 and 0.8071, respectively.
According to the calculation requirements of accumulation potential productivity, the corresponding known conditions in this paper are as follows: 1. 3 sub-standing classes are divided, which are represented by , respectively; 2. the corresponding stand mean height, basal area and accumulation growth models in this paper, and the parameter estimates are shown in Table 3; 3. the baseline age of the stand is assumed to be 30 years; 4. the searching interval for the Stand Density Index, , is (30, 2500). Accordingly, the accumulation potential growth at different ages of the three substandard classes can be obtained. The degree of difference between the accumulation potential productivity and the real productivity can be effectively evaluated for the real forest stand, so as to quantitatively grasp the enhancement space of this forest stand.
3.4. Model Accuracy Verification
In order to provide further evidence regarding the feasibility of the proposed methodology, a partitioned validation dataset is utilised for the purpose of validating the existing model. The ultimate outcomes of this process are presented in Table 5, while the model's scatter plot is illustrated in Figure 2.
Table 4.
Validation dataset refit three model results.
| Subsite class | Model(8) | Model(9) | Model(10) |
|---|---|---|---|
| 1 | 0.6132 | 0.7132 | 0.5634 |
| 2 | 0.5816 | 0.7246 | 0.7856 |
| 3 | 0.6898 | 0.7093 | 0.7447 |
As shown in Table 5, Models 8, 9 and 10 generally exhibited acceptable R² values across all subgroups. Despite the presence of variability in performance among the sub-sites, the models demonstrated a consistent level of predictive accuracy, indicating a degree of adaptation to the diverse conditions present at each site.
As can be seen from the table, although there is some variability between the different subcategories, overall the three models show a more satisfactory predictive ability under all types of soil conditions. In particular, the Broken-area model (model 9) and the Volume model (model 10) showed high R² values in most subcategories, above and below 0.7, indicating good explanatory power. Among these, subclass 2 performed particularly well in the accumulation model, with an R² as high as 0.7856, indicating a better model fit and more reliable predictions under this class of soil conditions.
In contrast, the tree height model (model 8) was slightly less predictive in some subclasses, e.g. only 0.6132 in subclass 1, suggesting that predicting tree heights in areas with limited height or high diversity is still challenging. This discrepancy may be due to the accumulation of errors in the UAV data for tree height extraction under complex canopy structure, or the heterogeneous growth characteristics of tree species under different microtopographies.
The scatter distributions of measured values and model predictions are shown in Figure 2, with an overall linear correlation trend, further indicating that the model has strong consistency and stability. Although there were some discrete points, these could be influenced by abrupt terrain changes, stand structure anomalies or sensor errors and were acceptable in the overall analysis.
Further analysis showed that the model performed better in areas with good terrain consistency and stable environmental factors (e.g. subclasses 2 and 3), while fluctuating slightly in areas with complex terrain or land class boundaries. This suggests that the model fits better in relatively homogeneous stand conditions and has slightly weaker predictive power in highly heterogeneous samples.
In summary, the three stand growth models constructed in this study had good predictive power, and showed high utility especially in the prediction of break area and volume. Although there is still room for improvement in the prediction of tree height in some subclasses, the overall model performance is stable and can be effectively used for the evaluation of stand quality in a wide range of woodlands.
4. Discussion
The study proposes a comprehensive forest site quality evaluation method based on UAV LiDAR technology. By integrating UAV LiDAR data with a site quality evaluation system based on the potential growth capacity of the stand, the method precisely calculates the maximum growth (including volume, diameter at breast height, or biomass) of specific stand types under the same site conditions (stand growth type) and given stand average age. The results show that the study not only significantly improves the accuracy of site quality evaluation but also enhances data acquisition efficiency while reducing the costs of manual surveys. Compared to traditional evaluation methods, the study fully utilizes the high-precision point cloud data from LiDAR technology, providing richer stand structure information and making the site quality evaluation more scientific and precise. It offers important technical support for forest management and ecological assessment.
The study uses UAVs equipped with high-precision LiDAR sensors to collect point cloud data for forest sample plots. Combining key steps such as data preprocessing, individual tree segmentation, site factor extraction, site classification, and growth model calculation, the study establishes a highly efficient and precise site quality evaluation system. Compared to traditional manual survey methods, UAV LiDAR technology shows significant advantages. UAVs can cover large forest areas in a short time, greatly improving data collection efficiency, especially in complex terrains or forest environments that are difficult to access. In addition, LiDAR technology has strong penetration capabilities, allowing it to directly capture fine forest structure data, such as individual tree height, crown width, and stand density, which are difficult to measure accurately with traditional manual surveys. The study uses advanced point cloud data processing algorithms to achieve automatic information extraction at the individual tree level, combined with growth models to assess site quality, reducing human error and improving the objectivity and consistency of the evaluation. The study provides a scientific and efficient technical approach for forest resource monitoring and management and has strong potential for broader application.
The study adopts a site quality evaluation method based on the potential growth capacity of the stand and establishes growth models for stands, including stand height growth models, diameter growth models, and volume growth models. These models are parameterized based on a large amount of observational data, with coefficients of determination () of 0.6745, 0.7460, and 0.8071, respectively. The results show high fitting accuracy and are able to reflect the growth characteristics of stands under different site classes. In order to assess the robustness and applicability of the established stand growth model, this paper conducts a group validation analysis based on an independent validation dataset. The results show that the model has some predictive ability in general, but the performance varies under different stand conditions. After clustering and grouping the validation plots by ecological factors, the model showed higher fitting accuracy in some groups. For example, in site class 2, the R² of the fracture area model reached 0.72, and the R² of the volume model reached 0.78, indicating that the model has good explanatory power and applicability under more homogeneous environmental conditions. However, the model predictions in other groups were relatively weak and showed some instability, especially in the prediction of tree height, and the R² of some subgroups was low. This suggests that the current modeling framework still has limitations in coping with more heterogeneous stand conditions. Nevertheless, the results of group validation further demonstrate the potential of the model to be generalized in a certain range. Currently, the study selects six site factors—altitude, aspect, slope, slope position, soil type, and canopy density—but forest growth is also affected by climatic conditions (precipitation, temperature) and soil physical and chemical properties. Future work could consider incorporating more environmental variables into the model to improve prediction accuracy. Although UAV LiDAR technology can efficiently acquire the data needed for forest site quality evaluation, there are still some limitations. For example, the technology is not yet fully capable of acquiring key site factors such as soil cover, soil moisture, and soil composition, and it is difficult to fully reflect the effects of the sub-surface environment on tree growth. Moreover, the detailed information of the understory vegetation may be limited by the LiDAR penetration capability, particularly in dense stands or complex terrain environments. Therefore, future work should focus on optimizing and selecting UAV sensor types, such as integrating multispectral, thermal imaging, and hyperspectral remote sensing technologies to obtain more comprehensive site factor data. Furthermore, data fusion methods, combining UAV LiDAR data with ground-based measurements and satellite remote sensing data, will further enhance the precision and reliability of site quality evaluations. The overall model used in the study performs well in practical applications, but it may have some applicability limitations for different stand types or growth stages. Future research could integrate deep learning or Bayesian statistical methods to further improve the model’s generalization ability.
The study provides an efficient, information-based approach for forest site quality evaluation, aligning with the current global trends in forest information technology and laying a solid foundation for intelligent forest management. In the future, the study technology can be widely applied in various fields of forestry information technology. By regularly conducting UAV LiDAR scanning, a dynamic spatiotemporal monitoring system for forest site quality can be established, providing scientific decision support for precision forestry management. For example, this method can be used to identify poorly growing areas and develop targeted fertilization, thinning, or selection cutting strategies for different site conditions. Additionally, combining UAV LiDAR with thermal imaging technology can enable real-time monitoring of environmental stressors such as forest pests, diseases, and drought, offering fine monitoring methods and early warning mechanisms for forest health management. Meanwhile, this method has significant application value in ecological restoration project evaluations, forest carbon stock assessments, and carbon neutral policy implementation, providing reliable data support for forest ecosystem service evaluations. With the continued development of UAV remote sensing technology, artificial intelligence, and big data analytics, the results of the study are expected to further advance forest resource monitoring and precision management towards more intelligent and efficient directions.
5. Conclusions
The site quality evaluation method based on UAV LiDAR proposed in the study has been validated in pure Cunninghamia lanceolata forest sample plots. The results show that this method has significant advantages in terms of accuracy, efficiency, and applicability. It provides an efficient and precise information-based approach for forest resource surveys and monitoring, aligning with the current global trends in forestry informatization. In the future, this technology can be widely applied in various fields, including precision forestry management, ecological restoration, and forest health assessment. For example, by regularly conducting UAV LiDAR scanning, a dynamic spatiotemporal monitoring system for forest site quality can be established, providing decision support for precise fertilization, tending management, and selective cutting optimization. In addition, combining UAV LiDAR with thermal imaging, multispectral remote sensing, and other technologies can enable real-time monitoring of environmental risks such as forest pests, diseases, and drought stress, offering scientific evidence for forest ecological safety. With the continued development of UAV remote sensing technology, artificial intelligence, and big data analytics, the results of the study are expected to further advance forest resource monitoring and precision management towards smarter and more efficient directions, providing strong technical support for sustainable forest management and ecological conservation.
6. Patents
Author Contributions
XL: Writing – review & editing, Conceptualization, Data curation, Formal Analysis, Methodology, Project administration, Resources, Software, Supervision, Validation, Visualization, Writing – original draft. LF: Writing – original draft, Investigation, Methodology, Project administration, Resources. RS: Writing – review & editing. HY: Writing – original draft. XZ: Writing – review & editing, Funding acquisition, Investigation.
Funding
The author(s) declare that financial support was received for the research, authorship, and/or publication of this article. This study is supported by the Fundamental Research Funds of Chinese Academy of Forestry: Theoretical Framework and Method for Accurate Estimation of the Full Life-Cycle Carbon Sink Potential in Masson Pine Artificial Monoculture Forests (CAFYBB2023MB019); The Fundamental Research Funds of Chinese Academy of Forestry: Precision Estimation Study of Carbon Sink Potential in Deciduous Forests in the Yellow River Basin (CAFYBB2023PA006-02); An airborne LiDAR-based model for estimating stand volume and aboveground biomass of major tree species in Guangdong Province (2021KJCX001).
Data Availability Statement
Data supporting the findings are available from the corresponding author upon reasonable request.
Acknowledgments
We thank the State Forestry and Grassland Administration of China for its support and the Guangdong Forestry Planning Institute for data support.
Conflicts of Interest
The authors declare that the research was conducted in the absence of any commercial or financial relationships that could be construed as a potential conflict of interest.
Abbreviations
The following abbreviations are used in this manuscript:
| UAV | Unmanned Aerial Vehicle |
| LiDAR | Light Detection And Ranging |
References
- González, J., et al., Metodología para la construcción de curvas de calidad de estación. Cuadernos de la Sociedad Española de Ciencias Forestales, ISSN 1575-2410, Nº. 18, 2004 (Ejemplar dedicado a: Actas de la I Reunión de Palencia de Modelización Forestal), pags. 303-309, 2004.
- Skovsgaard, J.P. and J.K. Vanclay, Forest site productivity: a review of the evolution of dendrometric concepts for even-aged stands. Forestry: An International Journal of Forest Research, 2007. 81(1): p. 13-31.
- Aguirre, A., et al., Mapping forest site quality at national level. Forest Ecology and Management, 2022. 508: p. 120043. [CrossRef]
- Vanclay, J.K., Assessing site productivity in tropical moist forests: a review. Forest Ecology and Management, 1992. 54(1): p. 257-287. [CrossRef]
- Handegard, E., et al., How important is Forest Age in explaining the species composition of Near-natural Spruce Forests? Forest Ecology and Management, 2024. 569: p. 122170.
- Food and N. Agriculture Organization of the United, Global Forest Resources Assessment 2020. 2020, FAO: Rome.
- Harris, N.L., et al., Global maps of twenty-first century forest carbon fluxes. Nature Climate Change, 2021. 11(3): p. 234-240. [CrossRef]
- Pan, Y., et al., A Large and Persistent Carbon Sink in the World’s Forests. Science, 2011. 333(6045): p. 988-993.
- Ma, J., et al., Global forest fragmentation change from 2000 to 2020. Nature Communications, 2023. 14(1): p. 3752. [CrossRef]
- Curtis, P.G., et al., Classifying drivers of global forest loss. Science, 2018. 361(6407): p. 1108-1111.
- WuFei, Summarize Of Forest Site Classification And Quality Appraisement. Forestry Science and Technology Information, 2010. 42(01): p. 12+14.
- Pretzsch, H., Strategic Planning of Sustainable Development on the Estate Level – Contributions from Forest Growth and Yield Science. European Journal of Forest Research, 2003. 122(4): p. 231-249. [CrossRef]
- Guo, K., B. Wang, and X. Niu, A Review of Research on Forest Ecosystem Quality Assessment and Prediction Methods. Forests, 2023. 14(2): p. 317. [CrossRef]
- Nex, F., et al., UAV in the advent of the twenties: Where we stand and what is next. ISPRS Journal of Photogrammetry and Remote Sensing, 2022. 184: p. 215-242. [CrossRef]
- Newton, P.F., Simulating the Potential Effects of a Changing Climate on Black Spruce and Jack Pine Plantation Productivity by Site Quality and Locale through Model Adaptation. Forests, 2016. 7(10): p. 223. [CrossRef]
- Fu, L., et al., A Basal Area Increment-Based Approach of Site Productivity Evaluation for Multi-Aged and Mixed Forests. Forests, 2017. 8(4): p. 119. [CrossRef]
- Peri, P.L., et al., Carbon accumulation along a stand development sequence of Nothofagus antarctica forests across a gradient in site quality in Southern Patagonia. Forest Ecology and Management, 2010. 260(2): p. 229-237. [CrossRef]
- Dong, C., et al., Site Quality Classification Models of Cunninghamia Lanceolata Plantations Using Rough Set and Random Forest West of Zhejiang Province, China. Forests, 2022. 13(8): p. 1312. [CrossRef]
- Iglhaut, J., et al., Structure from Motion Photogrammetry in Forestry: a Review. Current Forestry Reports, 2019. 5(3): p. 155-168.
- Fadil, S., et al., Modeling and spatialization of biomass and carbon stock using unmanned Aerial Vehicle Lidar (Lidar-UAV) metrics and forest inventory in cork oak forest of Maamora. Regional Science Policy & Practice, 2024. 16(11): p. 100127. [CrossRef]
- Xie, Y., et al., Instance segmentation and stand-scale forest mapping based on UAV images derived RGB and CHM. Computers and Electronics in Agriculture, 2024. 220: p. 108878. [CrossRef]
- Lu, X., et al., LiDAR point cloud denoising for individual tree extraction based on the Noise4Denoise. Frontiers in Plant Science, 2025. 15. [CrossRef]
- Duan, G., Classification of forest stand types and estimation of potential productivity in Jilin Province based on growth processes. PhD thesis, 2018: p. 221.
- Fu, L., et al., Comparing height–age and height–diameter modelling approaches for estimating site productivity of natural uneven-aged forests. Forestry: An International Journal of Forest Research, 2018. 91(4): p. 419-433. [CrossRef]
- Xiangdong, L., et al., Methodology and Applications of Site Quality Assessment Based on.
- Potential Mean Annual Increment. SCIENTIA SILVAE SINICAE, 2018. 54(12): p. 116-126.
- Tang Shouzheng and Li Xifei, Precision Analysis on Growth Rates Estimated by Integrated Whole Stand Growth and Yield Model. Forest Research, 1995. 8(5): p. 471-476.
Figure 1.
UAV land-use quality assessment process.
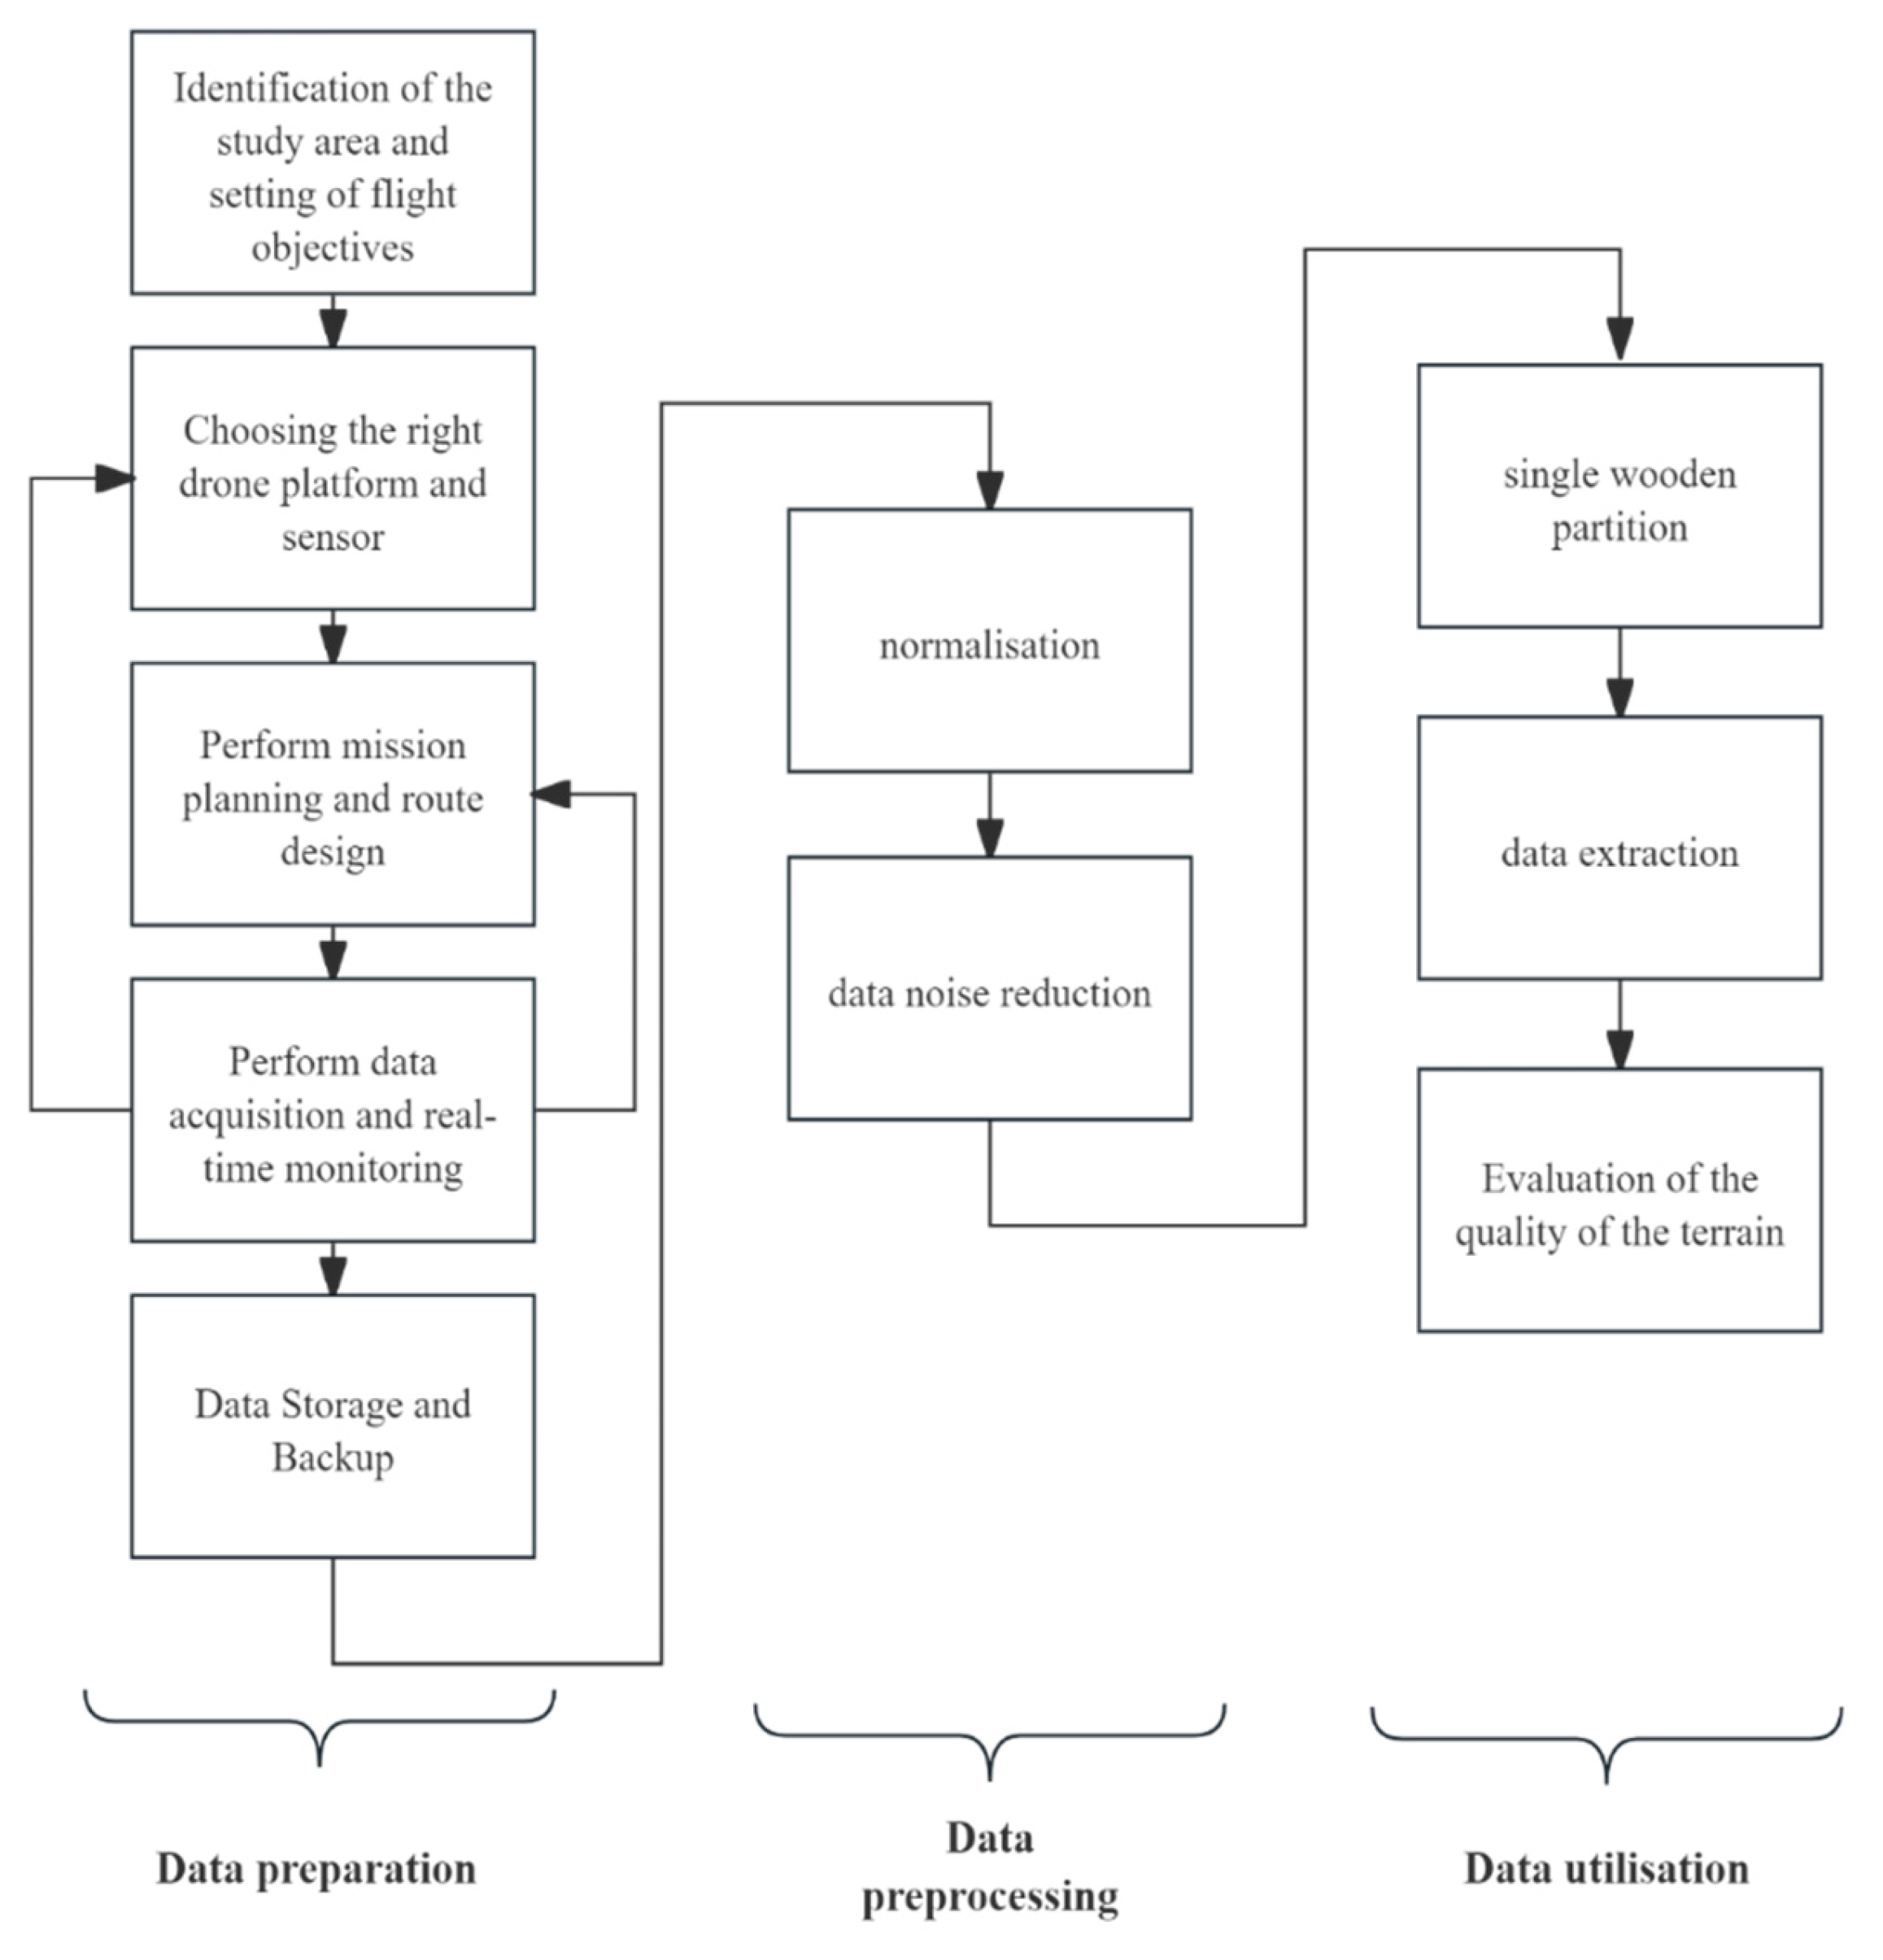
Figure 2.
Scatterplot of validation dataset vs. model trend.
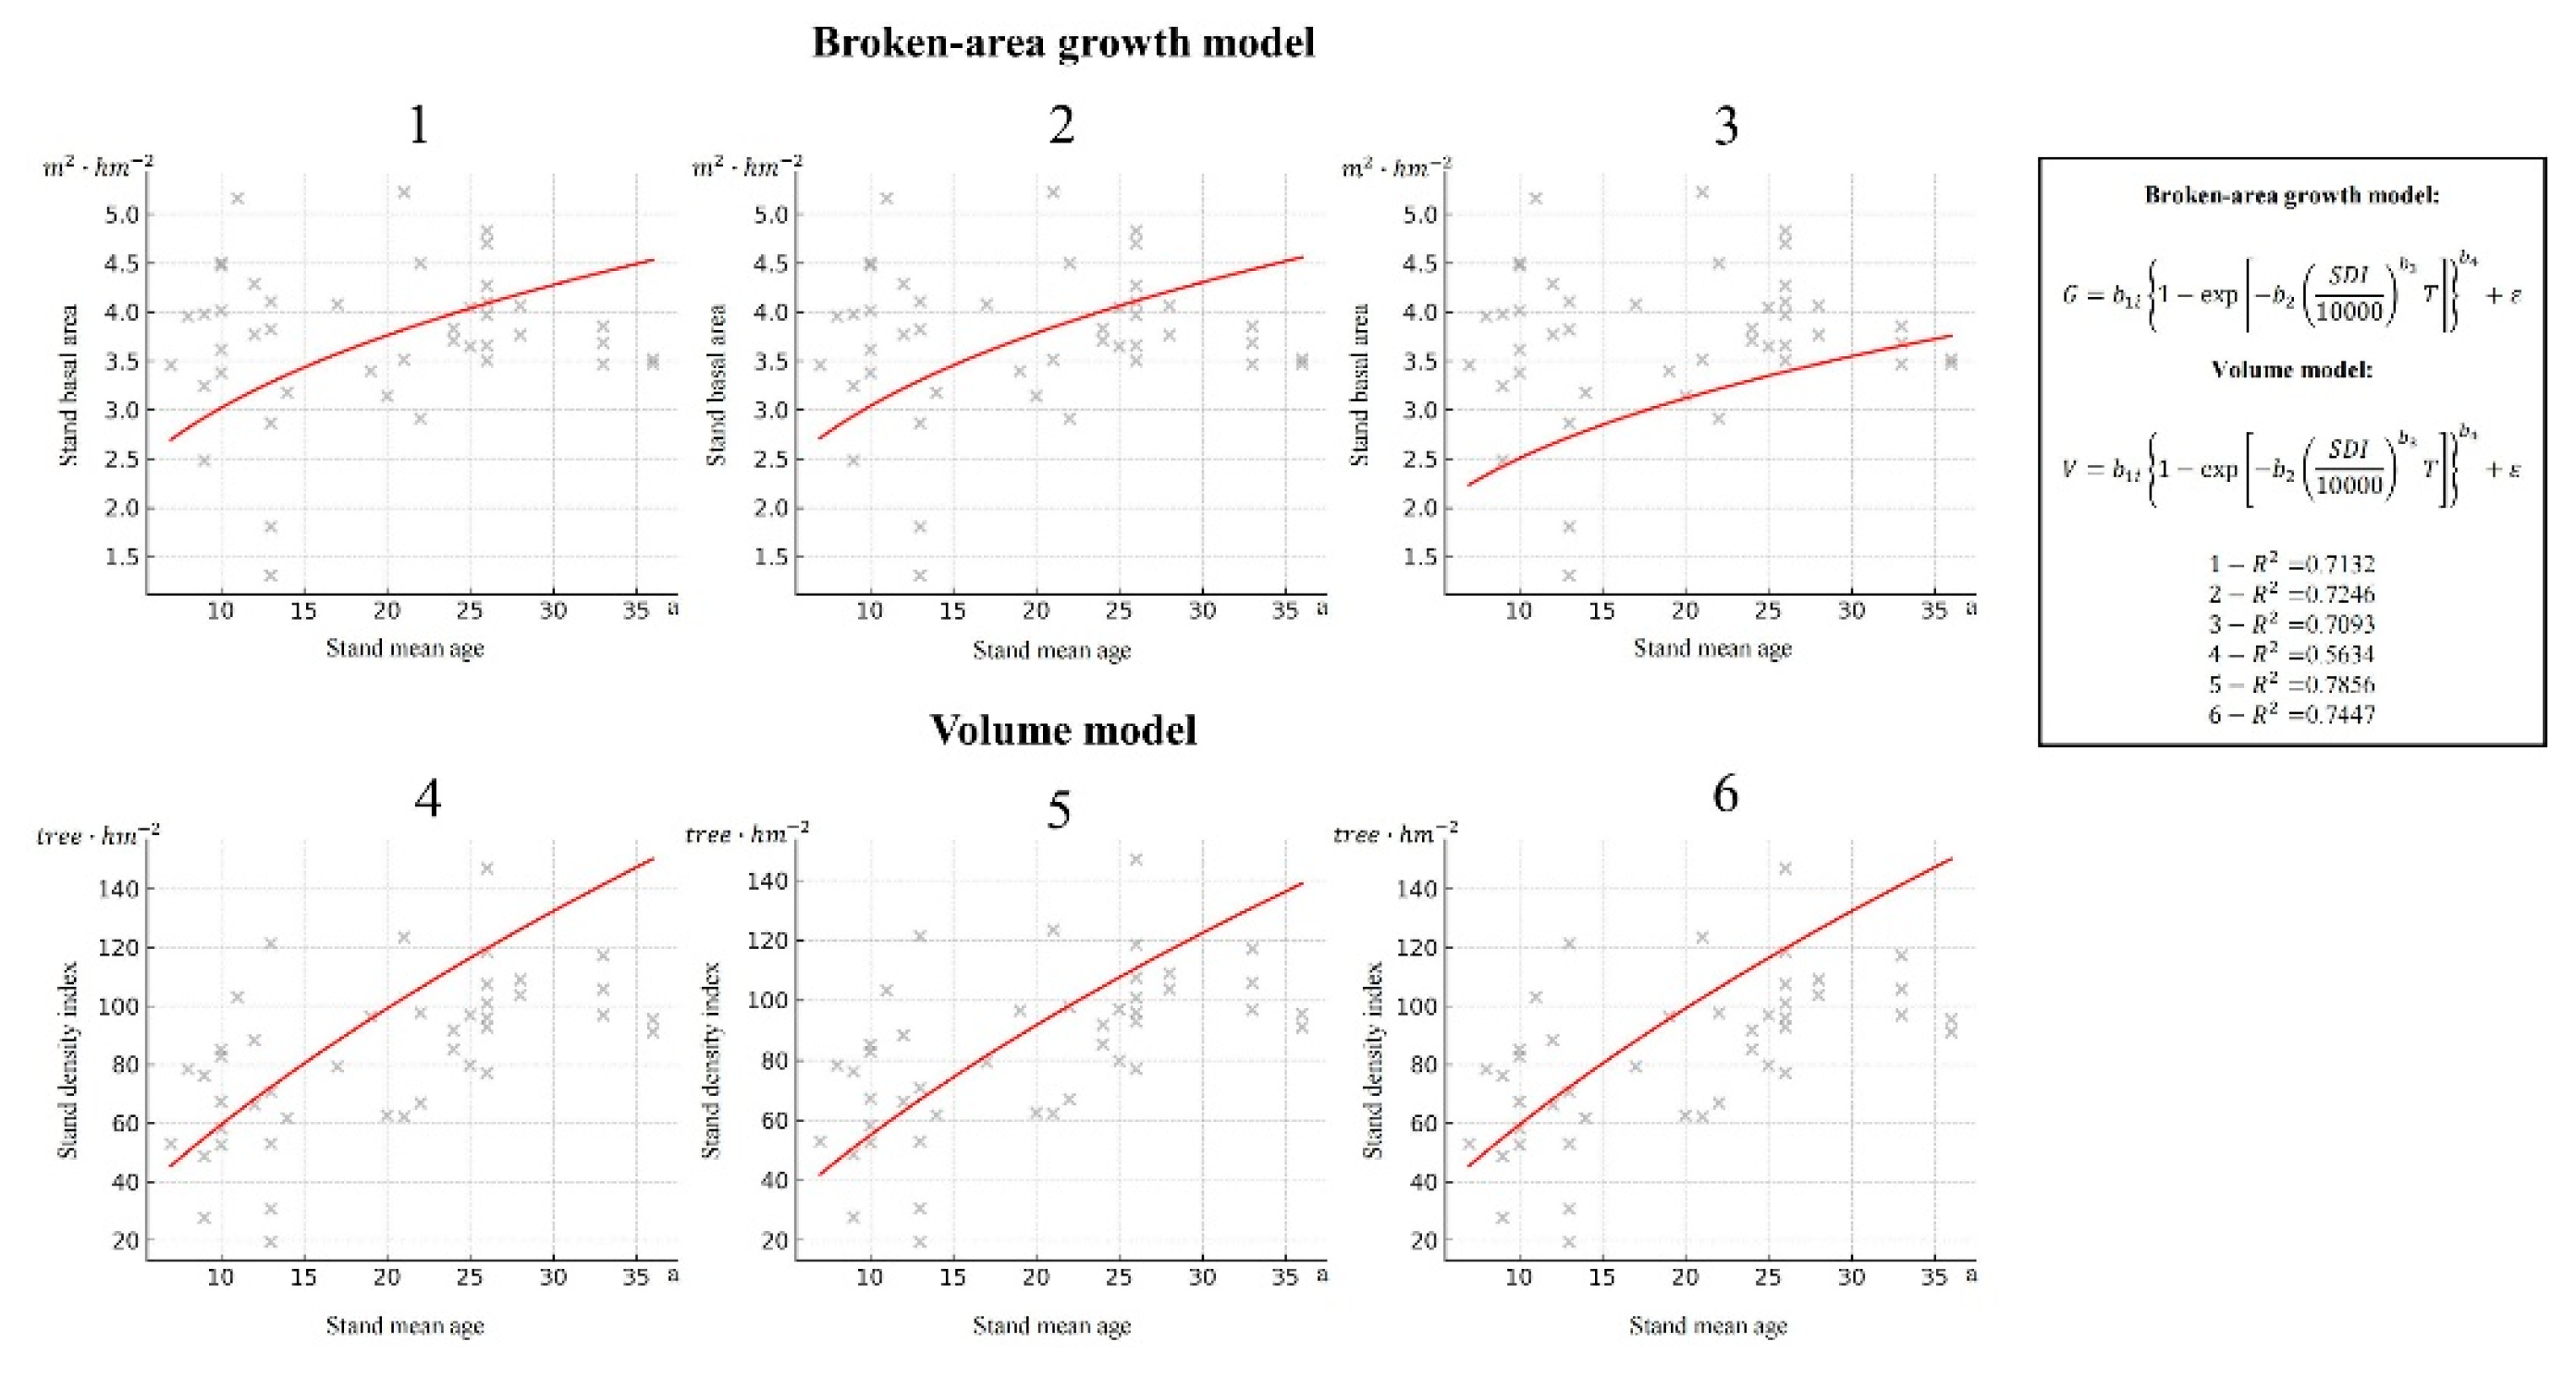
Table 1.
Summary statistics of stand variables of sample plots.
| Stand variables | Max. | Min. | Mean | Standard deviation |
|---|---|---|---|---|
| Elevation /m | 964 | 180 | 367.21 | 208.69 |
| Slope /( °) | 40 | 0 | 24.61 | 9.32 |
| Stand density index /( tree) | 181.2 | 45.82 | 115.83 | 28.11 |
| Stand basal area /() | 6.19 | 1.09 | 3.59 | 0.94 |
| Stand mean height /m | 21.4 | 5.029 | 12.18 | 3.37 |
| Stand mean age /a | 40 | 6 | 21.23 | 10.5 |
| canopy | 0.32 | 0.95 | 0.7 | 0.15 |
Table 3.
Estimates of stand mean height, fracture area and stocking growth model parameters and fit statistics for different sub-stratum classes of fir pure stands.
Table 3.
Estimates of stand mean height, fracture area and stocking growth model parameters and fit statistics for different sub-stratum classes of fir pure stands.
| Subsite class | Model(8) | Model(9) | Model(10) | ||||||||
|---|---|---|---|---|---|---|---|---|---|---|---|
| 1 | 20.0024 | 0.9981 | 100.5939 | 501.4326 | |||||||
| 2 | 21.7958 | 0.0281 | 0.5926 | 101.2163 | 0.0107 | 2.0133 | 0.3172 | 462.3624 | 1.9689 | 1.2949 | 0.7750 |
| 3 | 18.2033 | 0.8457 | 83.4166 | 500.3564 | |||||||
| 0.6745 | 0.7460 | 0.8071 | |||||||||
Disclaimer/Publisher’s Note: The statements, opinions and data contained in all publications are solely those of the individual author(s) and contributor(s) and not of MDPI and/or the editor(s). MDPI and/or the editor(s) disclaim responsibility for any injury to people or property resulting from any ideas, methods, instructions or products referred to in the content. |
© 2025 by the authors. Licensee MDPI, Basel, Switzerland. This article is an open access article distributed under the terms and conditions of the Creative Commons Attribution (CC BY) license (http://creativecommons.org/licenses/by/4.0/).
Copyright: This open access article is published under a Creative Commons CC BY 4.0 license, which permit the free download, distribution, and reuse, provided that the author and preprint are cited in any reuse.


