
Submitted:
01 May 2025
Posted:
05 May 2025
You are already at the latest version
Abstract
Based on the Theory of Planned Behavior, this study explores the impact mechanism of green product information disclosure on consumers' green consumption intention, focusing on new energy vehicle consumers. Through the analysis of 527 valid questionnaires collected from new energy vehicle exhibitions in Beijing, it was found that environmental information disclosure has a significant positive impact on green consumption intention, while the direct influence of information communication channels is not significant. The study further reveals the mediating roles of green consumption attitude, subjective norms, and environmental concern between environmental information disclosure and green consumption intention, indicating that personal attitudes, social pressure, and environmental awareness are key factors influencing green consumption decisions. These findings not only enrich the theoretical research on green consumption behavior but also provide practical guidance for companies in formulating green marketing strategies. The study suggests that companies should focus on building a strong ecological brand reputation, adopt a multidimensional information dissemination strategy, and fully consider factors such as consumers' environmental concern, perception of social norms, and personal attitudes when conveying green product information, thereby more effectively promoting the development of green consumption.
Keywords:
Green Information Disclosure
; Green Consumption Intention
; Theory of Planned Behavior (TPB)
; Mediating Mechanism
; New Energy Vehicles (NEVs)
; Environmental Attitudes
1. Introduction
1.1. Research Background
Against the backdrop of increasingly severe global environmental issues, green consumption has become a focal point for both academia and the public. The concept of "green consumption" was first introduced by Elkington and Hailes in 1987, emphasizing the avoidance of products harmful to both health and the environment. According to data released by the World Bank, global temperatures in 2021 were approximately 1.1°C higher than pre-industrial levels, underscoring the urgency of developing a green economy.
The International Energy Agency's (IEA) World Energy Investment Report 2022 showed that global investment in clean energy reached $755 billion in 2021, a 2% increase compared to 2020. Meanwhile, data from the United Nations Environment Programme (UNEP) indicated that new global renewable energy installations reached a record-high capacity of 290 gigawatts in 2021.
Consumer environmental awareness is also on the rise. According to the Global Risks Report 2022 by the World Economic Forum (WEF), "failure to take climate action" is considered the most severe global risk for the next decade.
1.2. Literature Review
As environmental issues become increasingly prominent, global scholars have shown a trend of diversification in the study of green consumption. Chan and Lau (2002), based on data from U.S. consumers, demonstrated that environmental knowledge and environmental emotions significantly influence green purchasing behavior. Kim and Choi (2005), in their research on the Korean market, found that consumers' collectivist values impact green purchasing decisions through environmental concern. Lee (2017) emphasized the unique influence of "face" culture on consumers' green purchasing intentions. These cross-cultural studies provide valuable insights into understanding green consumption behavior across different regions.
Jain et al. (2020) studied the green consumption intentions of Indian millennials and found that subjective norms, perceived behavioral control, perceived value, and attitudes are key antecedents influencing purchasing intentions. Shukla (2019) used an extended Theory of Planned Behavior (TPB) model to highlight the roles of environmental concern and cognitive factors in shaping the green product purchasing intentions of Indian millennials. Mamun et al. (2020) investigated Malaysian consumers' purchasing intentions and behaviors toward green skincare products, considering factors such as environmental concern, attitudes, subjective norms, perceived behavioral control, and availability. Paul et al. (2016) also used the Theory of Planned Behavior and the Theory of Reasoned Action to predict green product consumption behavior.
Previous studies have primarily focused on corporate environmental information disclosure, with relatively little attention paid to green information at the product level. In the study of green consumption intentions, communication factors in the external context are considered a key area. Information asymmetry between consumers and companies is seen as one of the main reasons for the slow growth of green consumption. To address information asymmetry in the green product market, scholars have proposed two main solutions: Duan et al. (2010) found that the genuine disclosure of corporate environmental information helps reduce information asymmetry in the green product market. Young et al. (2014) suggested that methods such as eco-certifications and labels provide consumers with detailed product characteristic information, thereby reducing information asymmetry to some extent.
The conceptual connotation of green product information disclosure can be divided into two main categories: on one hand, Young et al. (2014) indicated that sustainable information disclosure includes official sustainable information, such as eco-labels and product certifications. On the other hand, from a marketing perspective, De Pelsmacker et al. (2011) defined product information as "a description of specific product characteristics," which includes product features, pricing, packaging, and scent marketing, used to assess the degree of green information disclosure. Most scholars have evaluated green product information disclosure through eco-labels or marketing approaches (Jaiswal et al., 2020; Gong et al., 2020). However, with the continuous development of green products, these traditional forms of information disclosure are no longer fully applicable.
This study explores green information disclosure from the dimensions of environmental information disclosure and communication channels. The aim is to investigate how green product information disclosure influences consumers' green consumption intentions and to provide theoretical insights and practical guidance for companies on how to effectively present green information, thereby enhancing consumers' green consumption intentions.
1.3. Research Objectives
Against the backdrop of global sustainable environmental development, green consumption has become a focal point for both academia and businesses. However, information asymmetry between companies and consumers severely hinders the development of green consumption, and traditional eco-labels and marketing approaches are no longer sufficient to meet the needs of modern consumers. This study aims to explore the formation mechanism of green product consumption behavior, with a particular focus on the roles of environmental information disclosure, subjective norms, and environmental concern. Based on the Theory of Planned Behavior, the study constructs a dual-dimensional research framework involving environmental information disclosure and communication channels to analyze how the effective disclosure of green product information influences consumers' trust in brands, thereby shaping green consumption intentions. By addressing these issues, this study aims to identify the key factors and mechanisms underlying the formation of green consumption intentions, providing theoretical support for companies in formulating green marketing strategies, enhancing consumer environmental awareness, and promoting sustainable consumption.
2. Research Hypothesis
Current research by domestic and international scholars on the formation of green consumption intentions can be divided into three perspectives: environmental, economic, and social. Studies show that consumers often cannot fully assess the lifecycle cost of green products and tend to focus only on immediate benefits. They frequently choose non-green products that offer obvious short-term returns but lower levels of environmental friendliness (Wang et al., 2021). Some scholars argue that consumers' misconceptions about green consumption are mainly due to information asymmetry between companies and consumers, which can be addressed through more comprehensive environmental information disclosure.
Existing scholars have preliminarily demonstrated the relationship between environmental information and green consumption intentions. Research shows that eco-labels have a positive impact on green consumption intentions. Energy-saving information for energy-efficient appliances and eco-labels for eco-tourism projects both have a positive impact on green consumption intentions, representing different forms of green information expression (Chi et al., 2021).
H1a: Environmental information disclosure has a positive effect on consumers' green consumption intentions.
H1b: Communication channels have a positive effect on consumers' green consumption intentions.
Zepeda et al. (2009) pointed out that consumers with green knowledge often exhibit strong information-seeking behaviors, through which they establish their own knowledge systems and values, further strengthening their green attitudes. Regarding environmental information disclosure, Nittala et al. (2014) argued that compared to consumers who lack green education, those with extensive green knowledge often require more environmental information to reduce their skepticism about corporate green products. Robinson et al. (2002) suggested that providing environmental information about the potential value and long-term benefits of green products to consumers who lack green knowledge can gradually improve their perceptions of green products.
H2a: Perceived behavioral control mediates the relationship between environmental information disclosure and green consumption intention.
H2b: Perceived behavioral control mediates the relationship between communication channels and green consumption intention.
According to the Theory of Planned Behavior, subjective norms are another decisive factor influencing behavioral intention, primarily reflecting the social pressure that consumers perceive from others. Numerous studies have explored the relationship between subjective norms and behavioral intention. For example, Teng et al. (2015) combined altruism with the Theory of Planned Behavior to predict green hotel consumption intentions, finding that subjective norms have a positive impact on green hotel consumption intentions. Jie et al. argued that reference groups are an important source of consumption information, and when these groups convey positive product information, they can effectively promote green consumption. Yang et al. (2021) suggested that maintaining friendships on social networks partly depends on the exchange of valuable product information, and subjective norms on social media are reflected in maintaining these friendships. It can be inferred that exchanging valuable environmental information about green products can influence subjective norms on social media.
Zhang et al. (2023), in their study on the impact of haze pollution on green consumption behavior, proposed that government promotional activities and effective corporate green marketing strategies can create social pressure on consumers, thereby increasing their attention to green products. From the above analysis, it can be seen that effective communication channels can, to some extent, create a positive social environmental atmosphere, thereby positively influencing subjective norms.
H3a: Green consumption attitude mediates the relationship between environmental information disclosure and green consumption intention.
H3b: Green consumption attitude mediates the relationship between communication channels and green consumption intention.
From the perspective of environmental information disclosure, Han et al. (2010) found that green marketers should actively showcase the green attributes of products to enhance consumers' environmental concern, thereby providing the necessary foundation for forming positive green consumption intentions. Hong et al. (2023) argued that, in situations of information asymmetry, consumers can only effectively change their attitudes and values towards green products if they obtain product information through reliable marketing channels. Additionally, considering the concept of environmental concern, consumers' attitudes, values, and sense of responsibility towards environmental protection are specific manifestations of environmental concern.
Hypothesis H4a: Subjective norms mediate the relationship between environmental information disclosure and green consumption intention.Hypothesis H4b: Subjective norms mediate the relationship between communication channels and green consumption intention.
Brand reputation refers to consumers' overall perception of the quality and service of a brand's products, directly influencing their level of trust in the brand and, subsequently, the value and significance of the brand in their minds. High brand reputation typically indicates that consumers have a high level of trust in the brand and therefore acknowledge the brand's values and quality. Environmental information disclosure enhances consumers' green consumption intention by providing information about the product's sustainability throughout its lifecycle, but this effect depends on the level of trust consumers have in the brand. When trust is high, consumers are likely to hold a positive attitude towards the brand's environmental information disclosure, thus being more inclined to green consumption. Conversely, if trust is lacking, it is difficult to win their trust through information disclosure, ultimately weakening their green consumption intentions.
H5a: Environmental concern mediates the relationship between environmental information disclosure and green consumption intention.
H5b: Environmental concern mediates the relationship between communication channels and green consumption intention.
There is a positive relationship between green brand image, green satisfaction, and green trust with green brand equity, and green satisfaction and green trust mediate the relationship between green brand image and brand equity (Saeed et al., 2023). Therefore, investing resources to enhance these green characteristics helps improve brand equity. Nguyen et al. (2019) found that brand reputation can enhance the role of communication channels in increasing consumers' green awareness and attitudes. High brand reputation means that consumers already have a strong foundation of trust in the brand, making the environmental information conveyed through marketing channels more easily accepted and converted into green consumption intentions. Additionally, Jain et al. (2020) emphasized that the synergy between brand reputation and communication channels significantly affects consumers' perceived quality of environmental information, thereby increasing their purchase intentions. The effectiveness of communication channels depends on brand reputation. Hong et al. (2018) pointed out that when the channels are reliable and highly consistent with the brand's reputation, consumers are more likely to trust the brand's environmental information. Brand reputation acts as a "trust amplifier," moderating the relationship between communication channels and green consumption intention. Zhang et al. (2020) further demonstrated that when brand reputation is high, consumers' trust in environmental information provided by social media and brand official websites significantly increases, making the influence of communication channels on green consumption intention more profound. Conversely, when brand reputation is low, consumers tend to be skeptical of information from these channels, hindering the formation of green consumption intentions.
H6a: Brand reputation positively moderates the relationship between environmental information disclosure and green consumption intention.
H6b: Brand reputation positively moderates the relationship between communication channels and green consumption intention.
In summary, the research model of this paper is shown in Figure 1.
3. Research Object and Data Collection
The study selects new energy vehicles (NEVs), a type of green product, as the focus for research on green information disclosure. The primary reasons for this choice are as follows: the premium issue of most green products on the market is currently quite severe, particularly among everyday green consumer goods. This leads to a relatively low level of green product consumption domestically, largely concentrated among high-income individuals, resulting in a small target sample group that is not convenient for conducting research. Compared to traditional fuel-powered vehicles, the overall market share of NEVs remains relatively low. However, since automobiles are a product of rigid demand, the consumer base for NEVs is broader and thus more representative than that for general green consumer goods. Additionally, the study targets consumers who have had driving experience with NEVs. This is because the research involves specific details about NEVs, and respondents without systematic perception of these vehicles might provide random answers, leading to distortions in the research results.
This research collects data via a questionnaire survey. The primary locations for distributing the questionnaire were new energy vehicle exhibitions in Beijing. The survey utilized an on-site approach, distributing, completing, collecting, and providing immediate feedback on the spot. During this phase, 863 questionnaires were distributed, and after excluding responses that were sequentially answered, incomplete, or from individuals without NEV driving experience, 527 valid questionnaires were obtained.
In the process of data collection, measures were taken to ensure the reliability and ethical standards of the survey. The content of the research was thoroughly explained at the beginning of the questionnaire. A total of 863 questionnaires were distributed, of which 527 were valid, resulting in an effective recovery rate of 61%. As shown in Table 1, Regarding the demographics of the respondents, 55.20% were male, and 44.80% were female. In terms of age, students who plan to purchase cars after entering the workforce were also included in the survey, given that their understanding of NEVs is influenced by the media and their families. To ensure comprehensiveness, younger individuals aged 20 years and below were included, comprising 25% of the sample. Respondents aged 21 to 30 years made up 29.00%, those aged 31 to 40 years accounted for 32.40%, those aged 41 to 50 years constituted 10.10%, and those aged 51 years and above represented 3.40%.
The educational level of the respondents was mainly undergraduate, making up 41.20% of the sample. Respondents with middle school education or below and those with high school education each accounted for 25.40% and 5.70%, respectively. Meanwhile, 18.60% held a master's degree, and 9.10% held a doctoral degree.
Regarding monthly income, 41.00% earned less than 6,000 RMB, 19.00% earned between 6,000 and 10,000 RMB, 18.40% earned between 10,000 and 14,000 RMB, 9.50% earned between 14,000 and 18,000 RMB, 7.00% earned between 18,000 and 22,000 RMB, 2.70% earned between 22,000 and 26,000 RMB, 1.70% earned between 26,000 and 30,000 RMB, and 0.80% earned more than 30,000 RMB.
The questionnaire design for this study consists of two parts: the first part focuses on the basic demographic information of the respondents. Existing research has identified that factors such as an individual's gender, age, education level, and monthly income all influence their willingness to engage in green consumption. The survey on the influence mechanism of green product information disclosure on green consumption intentions used question items derived from established scales, with appropriate adjustments made to align with the specific research focus of this study without altering the original meaning. The measurement of variables adopted the Likert 5-point scale, where 1 represents "strongly disagree" and 5 represents "strongly agree."
The green information disclosure variables centered on two aspects: environmental information disclosure indicators and information communication channel indicators. The study utilized seven items from the research conducted by Shao et al. and another seven from the research by Cerri et al. Environmental concern and subjective norms were measured using items from the research by Paul et al. Green consumption intention employed six items from the research by Shao et al., while green consumption attitude was measured using three items from the research by Lin and Shi. Perceived behavioral control utilized seven items from the research by Ajzen et al., and brand reputation was measured using five items from the research by Agmeka et al.
Data Analysis and Results
4.1. Control of Common Method Bias
To address the issue of common method bias, this study adopted both procedural and statistical control methods. For procedural control, an anonymous questionnaire was used to minimize the respondents' defensive psychology when filling out the survey, thereby ensuring high-quality responses. For statistical control, Harman's single-factor test was conducted on all the measurement items. The results indicated that the first factor did not explain the majority of the variance. Therefore, it can be concluded that common method bias did not have a significant impact on this study.
4.2. Reliability and Validity Test
This study used SPSS 29.0 and AMOS 29.0 to test the reliability and validity of the scales. During the testing process, Cronbach's α coefficient was employed to evaluate the reliability of the scales. When the coefficient is greater than 0.7, it indicates a high level of internal consistency among the data. As shown in Table 2, the Cronbach's α coefficients for environmental information disclosure and information communication channels were 0.892 and 0.890, respectively. The Cronbach's α coefficients for green consumption attitude, subjective norms, and environmental concern were 0.781, 0.831, and 0.892, respectively. The Cronbach's α coefficient for perceived behavioral control was 0.974, brand reputation was 0.967, and green consumption intention was 0.867. Since all variables, except for green consumption attitude, had Cronbach's α coefficients greater than 0.8, and green consumption attitude had a coefficient of 0.781, which is above the acceptable threshold of 0.7, it can be concluded that the scales used in this study have good reliability.
It is important to emphasize that each dimension in this study uses an existing, well-established scale, with only appropriate adjustments made based on the specific research subjects. Therefore, content validity can be largely ensured. Furthermore, the composite reliability (CR) coefficients of all variables are greater than 0.8, and the average variance extracted (AVE) values are all greater than 0.6, indicating that the scales for each dimension in this study have good convergent validity.
It is also evident that the square roots of the AVE values for variables such as environmental information disclosure and information communication channels are greater than the correlation coefficients of their respective rows and columns with other latent variables. This indicates good discriminant validity among the various dimensions.
4.3. Model Matching Degree Test
AMOS 29.0 was used to test the model's fit. Based on the model fit results presented in Table 3, it can be seen that the CMIN/DF (Chi-square divided by degrees of freedom) is 1.307, which falls within the acceptable range of 1 to 3. The RMSEA (Root Mean Square Error of Approximation) is 0.038, which is within the excellent range of <0.05. Additionally, the indices IFI (Incremental Fit Index), TLI (Tucker-Lewis Index), and CFI (Comparative Fit Index) all achieved excellent levels above 0.9. Therefore, the comprehensive analysis results indicate that the CFA (Confirmatory Factor Analysis) model has good fit.
4.4. Main Effect Test
This study used AMOS 29.0 to test the research hypotheses related to environmental information disclosure, information communication channels, green consumption attitude, subjective norms, environmental concern, perceived behavioral control, and green consumption intention for new energy vehicles. The test results can be found in the Figure 2.
The direct effect of environmental information disclosure on green consumption intention was found to be significant (β = 0.13, p < 0.001), thus supporting Hypothesis 1a. However, the direct effect of information communication channels on green consumption intention was not significant (β = 0.652, p > 0.05), indicating that Hypothesis 1b is not supported. According to existing literature, some experts and scholars have also concluded that information communication channels do not have a significant impact on green consumption intention. For instance, in Chi's study on the influence of eco-labels, eco-brands, and social media on green consumption intention, it was found that social media did not directly influence consumer intention, which was attributed to the lack of credibility of eco-brands, leading to a loss of trust in social media. In light of this, the present study suggests that when a company's eco-brand reputation fails to convince consumers, the green information communicated through information channels will not effectively influence consumers' green consumption intention.
Furthermore, since the information communication channel does not have a direct effect on green consumption intention, subsequent tests on mediation and moderation effects related to it lose their theoretical significance.
4.5. Intermediate Effect Test
For testing the three mediating variables, this study used the SPSS PROCESS macro and the Bootstrap confidence interval method, setting Bootstrap sampling to 5000 iterations. The test evaluated whether the absolute ratio of the point estimate to the SE value (Z value) was greater than 1.96 and whether the Bias-corrected and Percentile confidence intervals at a 95% confidence level (Confidence Interval, CI) included zero, to determine the existence of mediation effects.
As shown in the Table 4, the Z value of the direct effect is 3.201 > 1.96, with a Bias-corrected 95% CI range of [0.0531, 0.2220] that does not include zero, and a Percentile 95% CI range of [0.0531, 0.2220] that also does not include zero. These data indicate that the direct effect of environmental information disclosure on green consumption intention exists, making further mediation effect testing feasible.
According to the table, the influence of environmental information disclosure on green consumption intention is achieved through three paths: “Environmental Information Disclosure — Green Attitude — Green Consumption Intention,” “Environmental Information Disclosure — Subjective Norms — Green Consumption Intention,” and “Environmental Information Disclosure — Environmental Concern — Green Consumption Intention.” The Z values for these three paths are 2.5997, 4.8420, and 2.8874, respectively (all greater than 1.96). Meanwhile, the Bias-corrected 95% CI ranges for these three mediating paths are [0.0096, 0.0874], [0.0337, 0.1019], and [0.0098, 0.0732], all of which do not include zero. Similarly, the Percentile 95% CI ranges are [0.0096, 0.0874], [0.0337, 0.1019], and [0.0098, 0.0732], none of which include zero. These data indicate that all three variables have a significant mediating effect.
Additionally, the ratio of the estimated values of indirect effects to the total effect are 31%, 43%, and 26%, respectively, indicating that subjective norms have the strongest mediating effect, followed by green attitude and then environmental concern. In conclusion, green attitude, subjective norms, and environmental concern all play mediating roles between environmental information disclosure and green consumption intention, supporting Hypotheses 2a, 3a, and 4a.
From the main effect analysis above, it can be concluded that the direct effect of information communication channels on green consumption intention is not significant. Thus, it is inferred that the corresponding mediating effects do not exist, and Hypotheses 2b, 3b, and 4b are not supported.
4.6. Adjustment Effect Test
For the moderation effect test, this study used the SPSS PROCESS macro to conduct regression analysis. To avoid potential multicollinearity issues, the independent variable and the moderator variable were first mean-centered before calculating the interaction term. According to Table 3, after mean-centering, the maximum VIF (Variance Inflation Factor) values for each regression model did not exceed 2, indicating that there were no multicollinearity issues.
In this study, green consumption intention was used as the outcome variable, with control variables such as gender and age being introduced sequentially , followed by the independent variable of environmental information disclosure and the moderator variable of brand reputation, and finally, the interaction term of mean-centered environmental information disclosure and brand reputation . The results, as shown in Table 3 , indicate that the interaction term between environmental information disclosure and brand reputation has a significant positive effect on green consumption intention (β = 0.1209, p < 0.01), suggesting that brand reputation positively moderates the relationship between environmental information disclosure and green consumption intention. Therefore, Hypothesis 5a is supported.
Based on the previous analysis, since the direct effect of information communication channels on green consumption intention is not significant, it is inferred that the moderation effect also does not exist. Thus, Hypothesis 5b is not supported.
Conclusion
Based on an empirical study of new energy vehicle consumers, this paper draws the following conclusions: Environmental information disclosure has a significant positive impact on green consumption intention (β = 0.13, p < 0.001), verifying the hypothesis that environmental information disclosure can directly promote consumers' green consumption intention. However, the direct effect of information communication channels on green consumption intention is not significant (β = 0.652, p > 0.05), which may be due to the insufficient ecological brand reputation limiting the effectiveness of information dissemination through channels like social media.
The study also found that environmental information disclosure indirectly influences green consumption intention through three factors: green consumption attitude, subjective norms, and environmental concern. This indicates that consumers' personal attitudes, social pressure, and environmental awareness play critical mediating roles between environmental information and consumption decisions.
These findings have important implications for corporate practice: companies should focus on effective environmental information disclosure, establish a strong ecological brand reputation before engaging in communication efforts, and emphasize factors such as consumers' environmental concern, social norm perception, and personal attitudes. A multidimensional approach to information dissemination, rather than relying on a single channel, is essential. This approach is particularly valuable for promoting green consumption and driving the development of the new energy vehicle market.
References
- Al Mamun, A.; Nawi, N.C.; Hayat, N.; Zainol, N.R.B. Predicting the purchase intention and behaviour towards green skincare products among Malaysian consumers. Sustainability 2020, 12, 6604.
- Chan, R.Y.; Lau, L.B. Explaining green purchasing behavior: A cross-cultural study on American and Chinese consumers. J. Int. Consum. Mark. 2002, 14, 9–40.
- De Pelsmacker, P.; Driesen, L.; Rayp, G. Do consumers care about ethics? Willingness to pay for fair-trade coffee. J. Consum. Aff. 2005, 39, 363–385.
- Duan, C.R.; Wang, L.J.; Zhou, X.X.; et al. Environmental information disclosure and information asymmetry in green product market: Mechanism and empirical test. J. Stat. Inf. 2022, 37, 66–77.
- Gong, J.H.; Sun, J. Empirical analysis on influencing effects of green information in green purchasing behavior—Based on the survey data from 538 families in Wuhan, Jinan and Chengdu. J. Huazhong Agric. Univ. (Soc. Sci. Ed.) 2012,11–16.
- Han, H.; Hsu, L.T.J.; Sheu, C. Application of the Theory of Planned Behavior to green hotel choice: Testing the effect of environmental friendly activities. Tour. Manag. 2010, 31, 325–334.
- Hong, Y.; Hu, J.T.; Chen, M.Y.; et al. Motives and antecedents affecting green purchase intention: Implications for green economic recovery. Econ. Anal. Policy 2023, 77, 523–538.
- Jain, V.K.; Gupta, A.; Verma, H. Millennials green consumption behavior and its linkage to firms' marketing competitiveness: Findings from select study in Uttarakhand. J. Asia-Pac. Bus. 2020, 21, 63–84.
- Jaiswal, D.; Kaushal, V.; Singh, P.K.; Biswas, A. Green market segmentation and consumer profiling: A cluster approach to an emerging consumer market. Benchmarking 2020, 27, 2071–2096.
- Kim, Y.; Choi, S.M. Antecedents of green purchase behavior: An examination of collectivism, environmental concern, and PCE. Adv. Consum. Res. 2005, 32, 592–599.
- Lee, K. Face consciousness and green consumerism: A study of Chinese consumers. Consum. Cult. Theory 2017, 18, 187–199.
- Paul, J.; Modi, A.G.; Patel, J.D. Predicting green product consumption using theory of planned behavior and reasoned action. J. Retail. Consum. Serv. 2016, 29, 123–134.
- Robinson, R.; Smith, C. Psychosocial and demographic variables associated with consumer intention to purchase sustainably produced foods as defined by the Midwest Food Alliance. J. Nutr. Educ. Behav. 2002, 34, 316–325.
- Shukla, S. A study on millennial purchase intention of green products in India: Applying extended theory of planned behavior model. J. Asia-Pac. Bus. 2019, 20, 322–338.
- Teng, Y.M.; Wu, K.S.; Liu, H.H. Integrating altruism and the theory of planned behavior to predict patronage intention of a green hotel. J. Hosp. Tour. Res. 2015, 39, 299–315.
- Wang, B.; Deng, N.N.; Liu, X.X.; et al. Effect of energy efficiency labels on household appliance choice in China: Sustainable consumption or irrational intertemporal choice? Resour. Conserv. Recycl. 2021, 169, 105458.
- Young, W.; Hwang, K.; McDonald, S.; et al. Sustainable consumption: Green consumer behaviour when purchasing products. Sustain. Dev. 2010, 18, 20–31.
- Zepeda, L.; Deal, D. Organic and local food consumer behaviour: Alphabet Theory. Int. J. Consum. Stud. 2009, 33, 697–705.
- Zhang, M.; Guo, S.; Bai, C.Y.; et al. Study on the impact of haze pollution on residents' green consumption behavior: The case of Shandong Province. J. Clean. Prod. 2019, 219, 11–19.
Figure 1.
Research model.
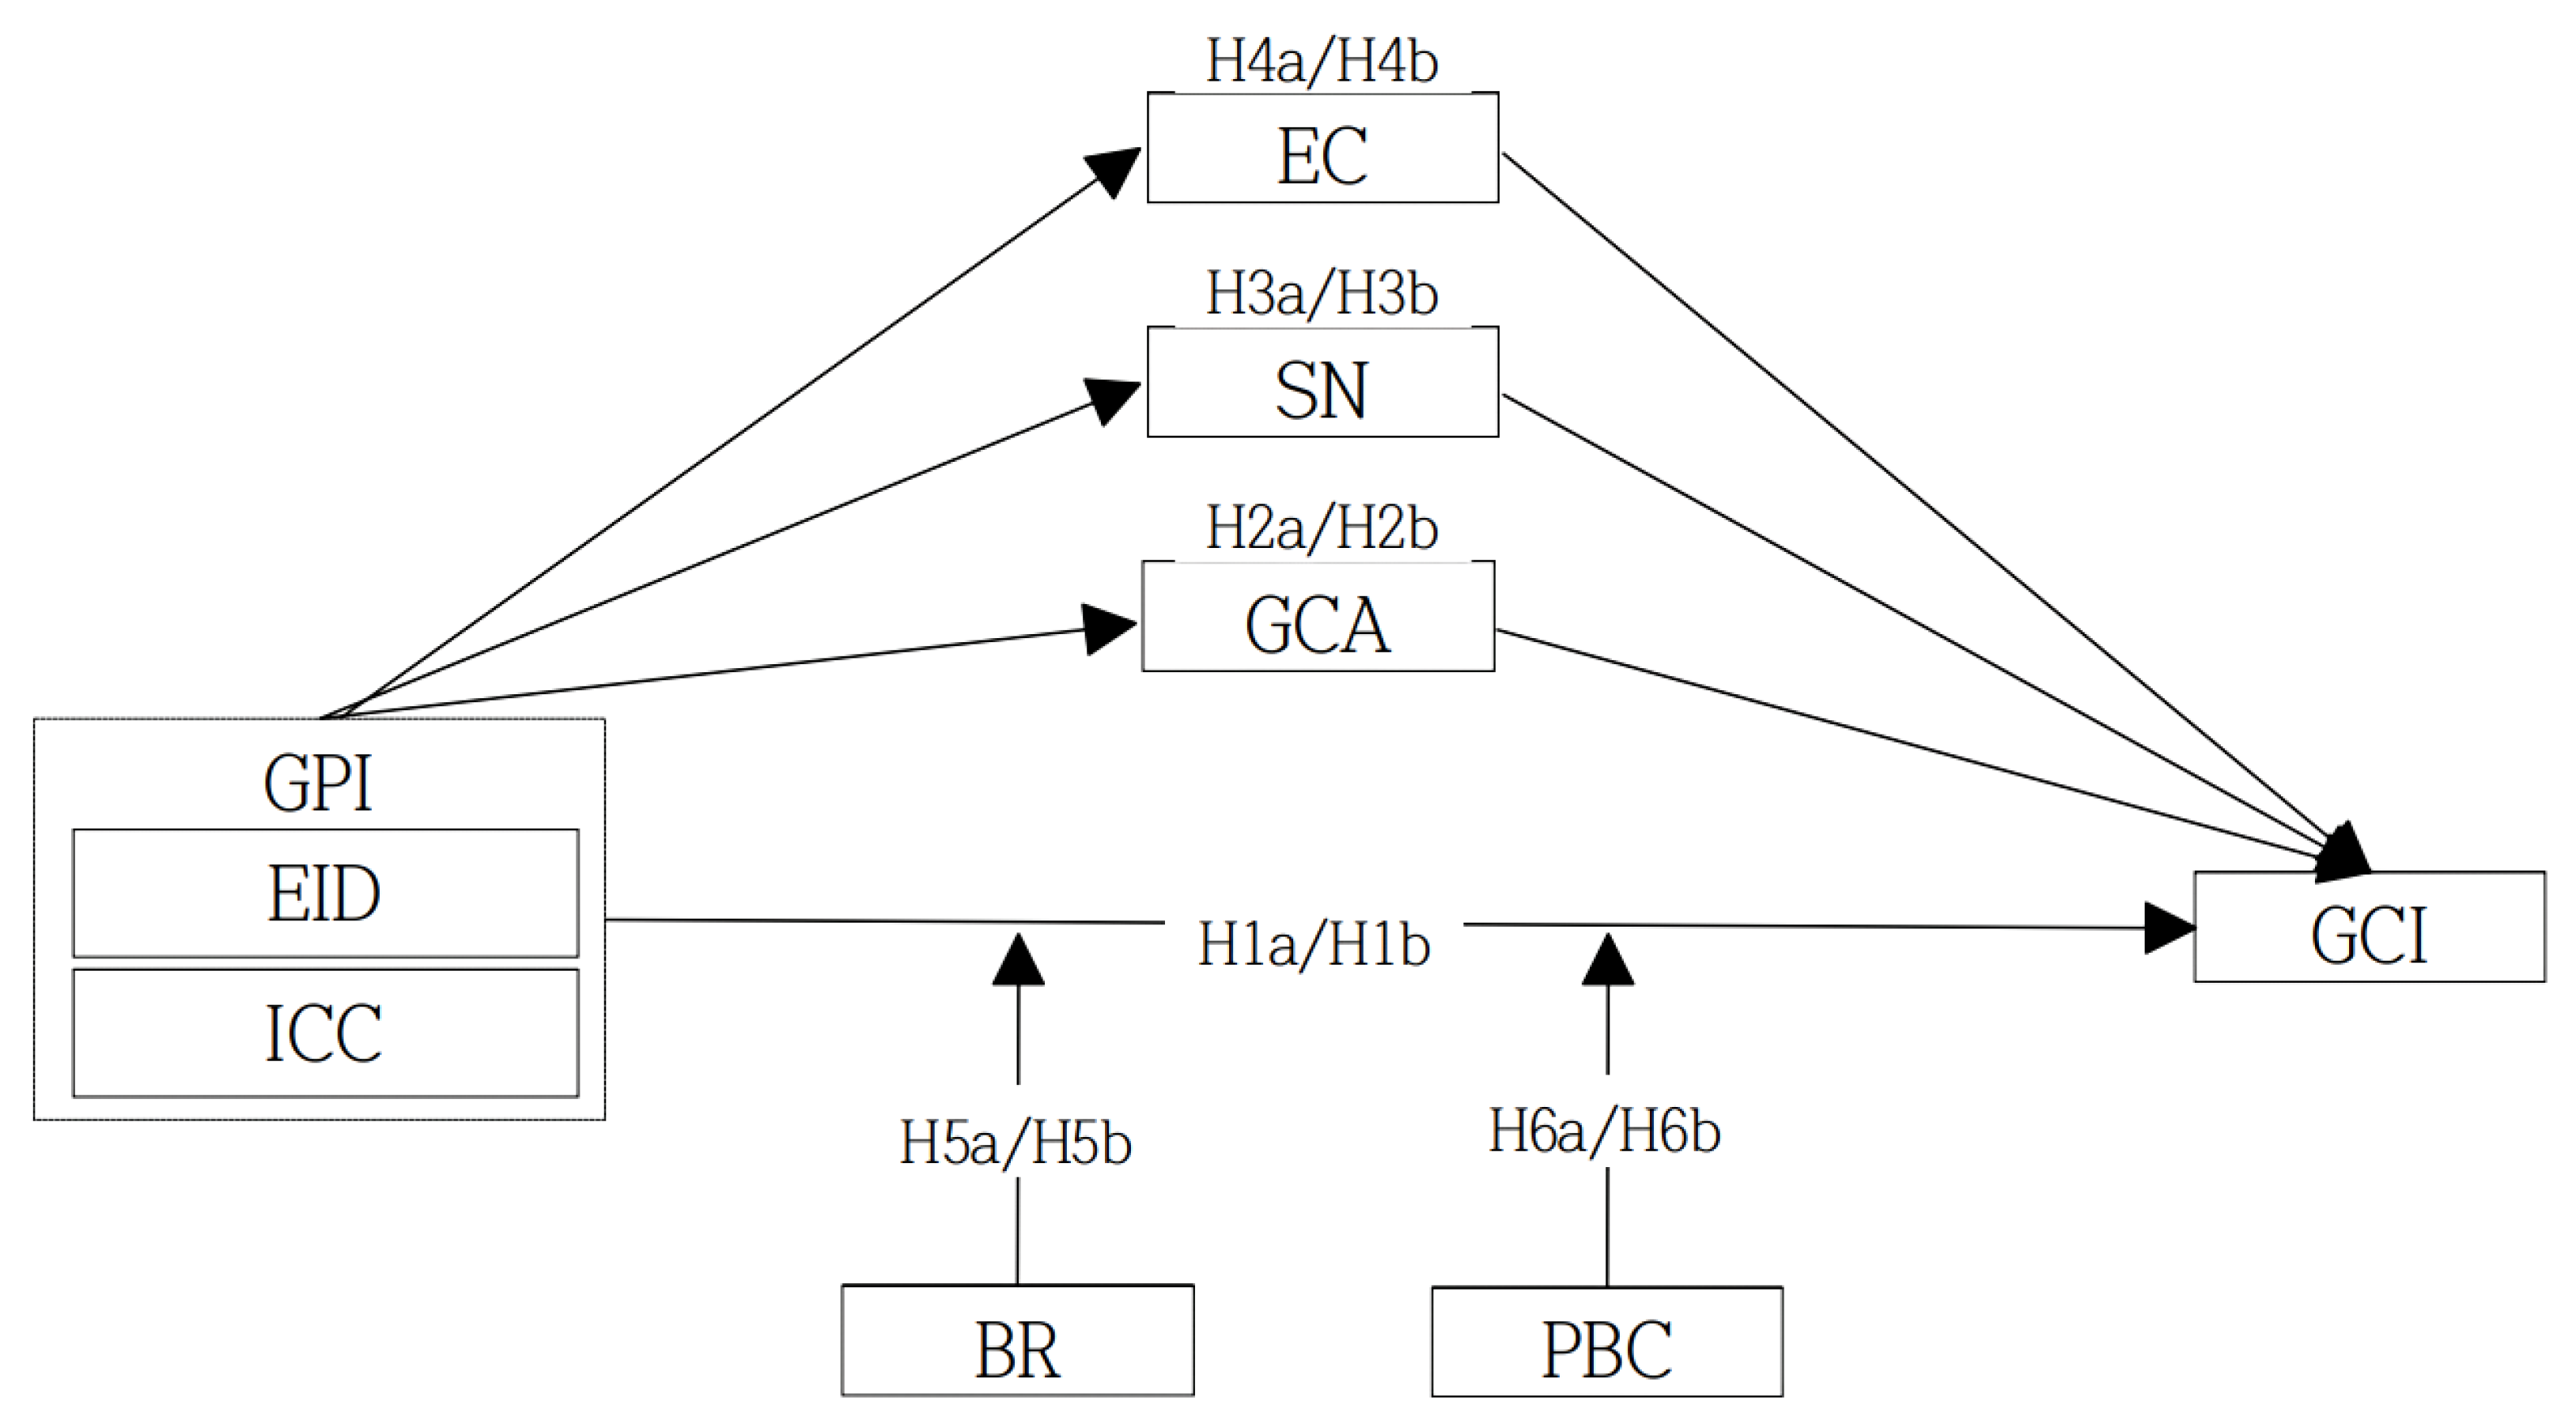
Figure 2.
Path verification of the model.
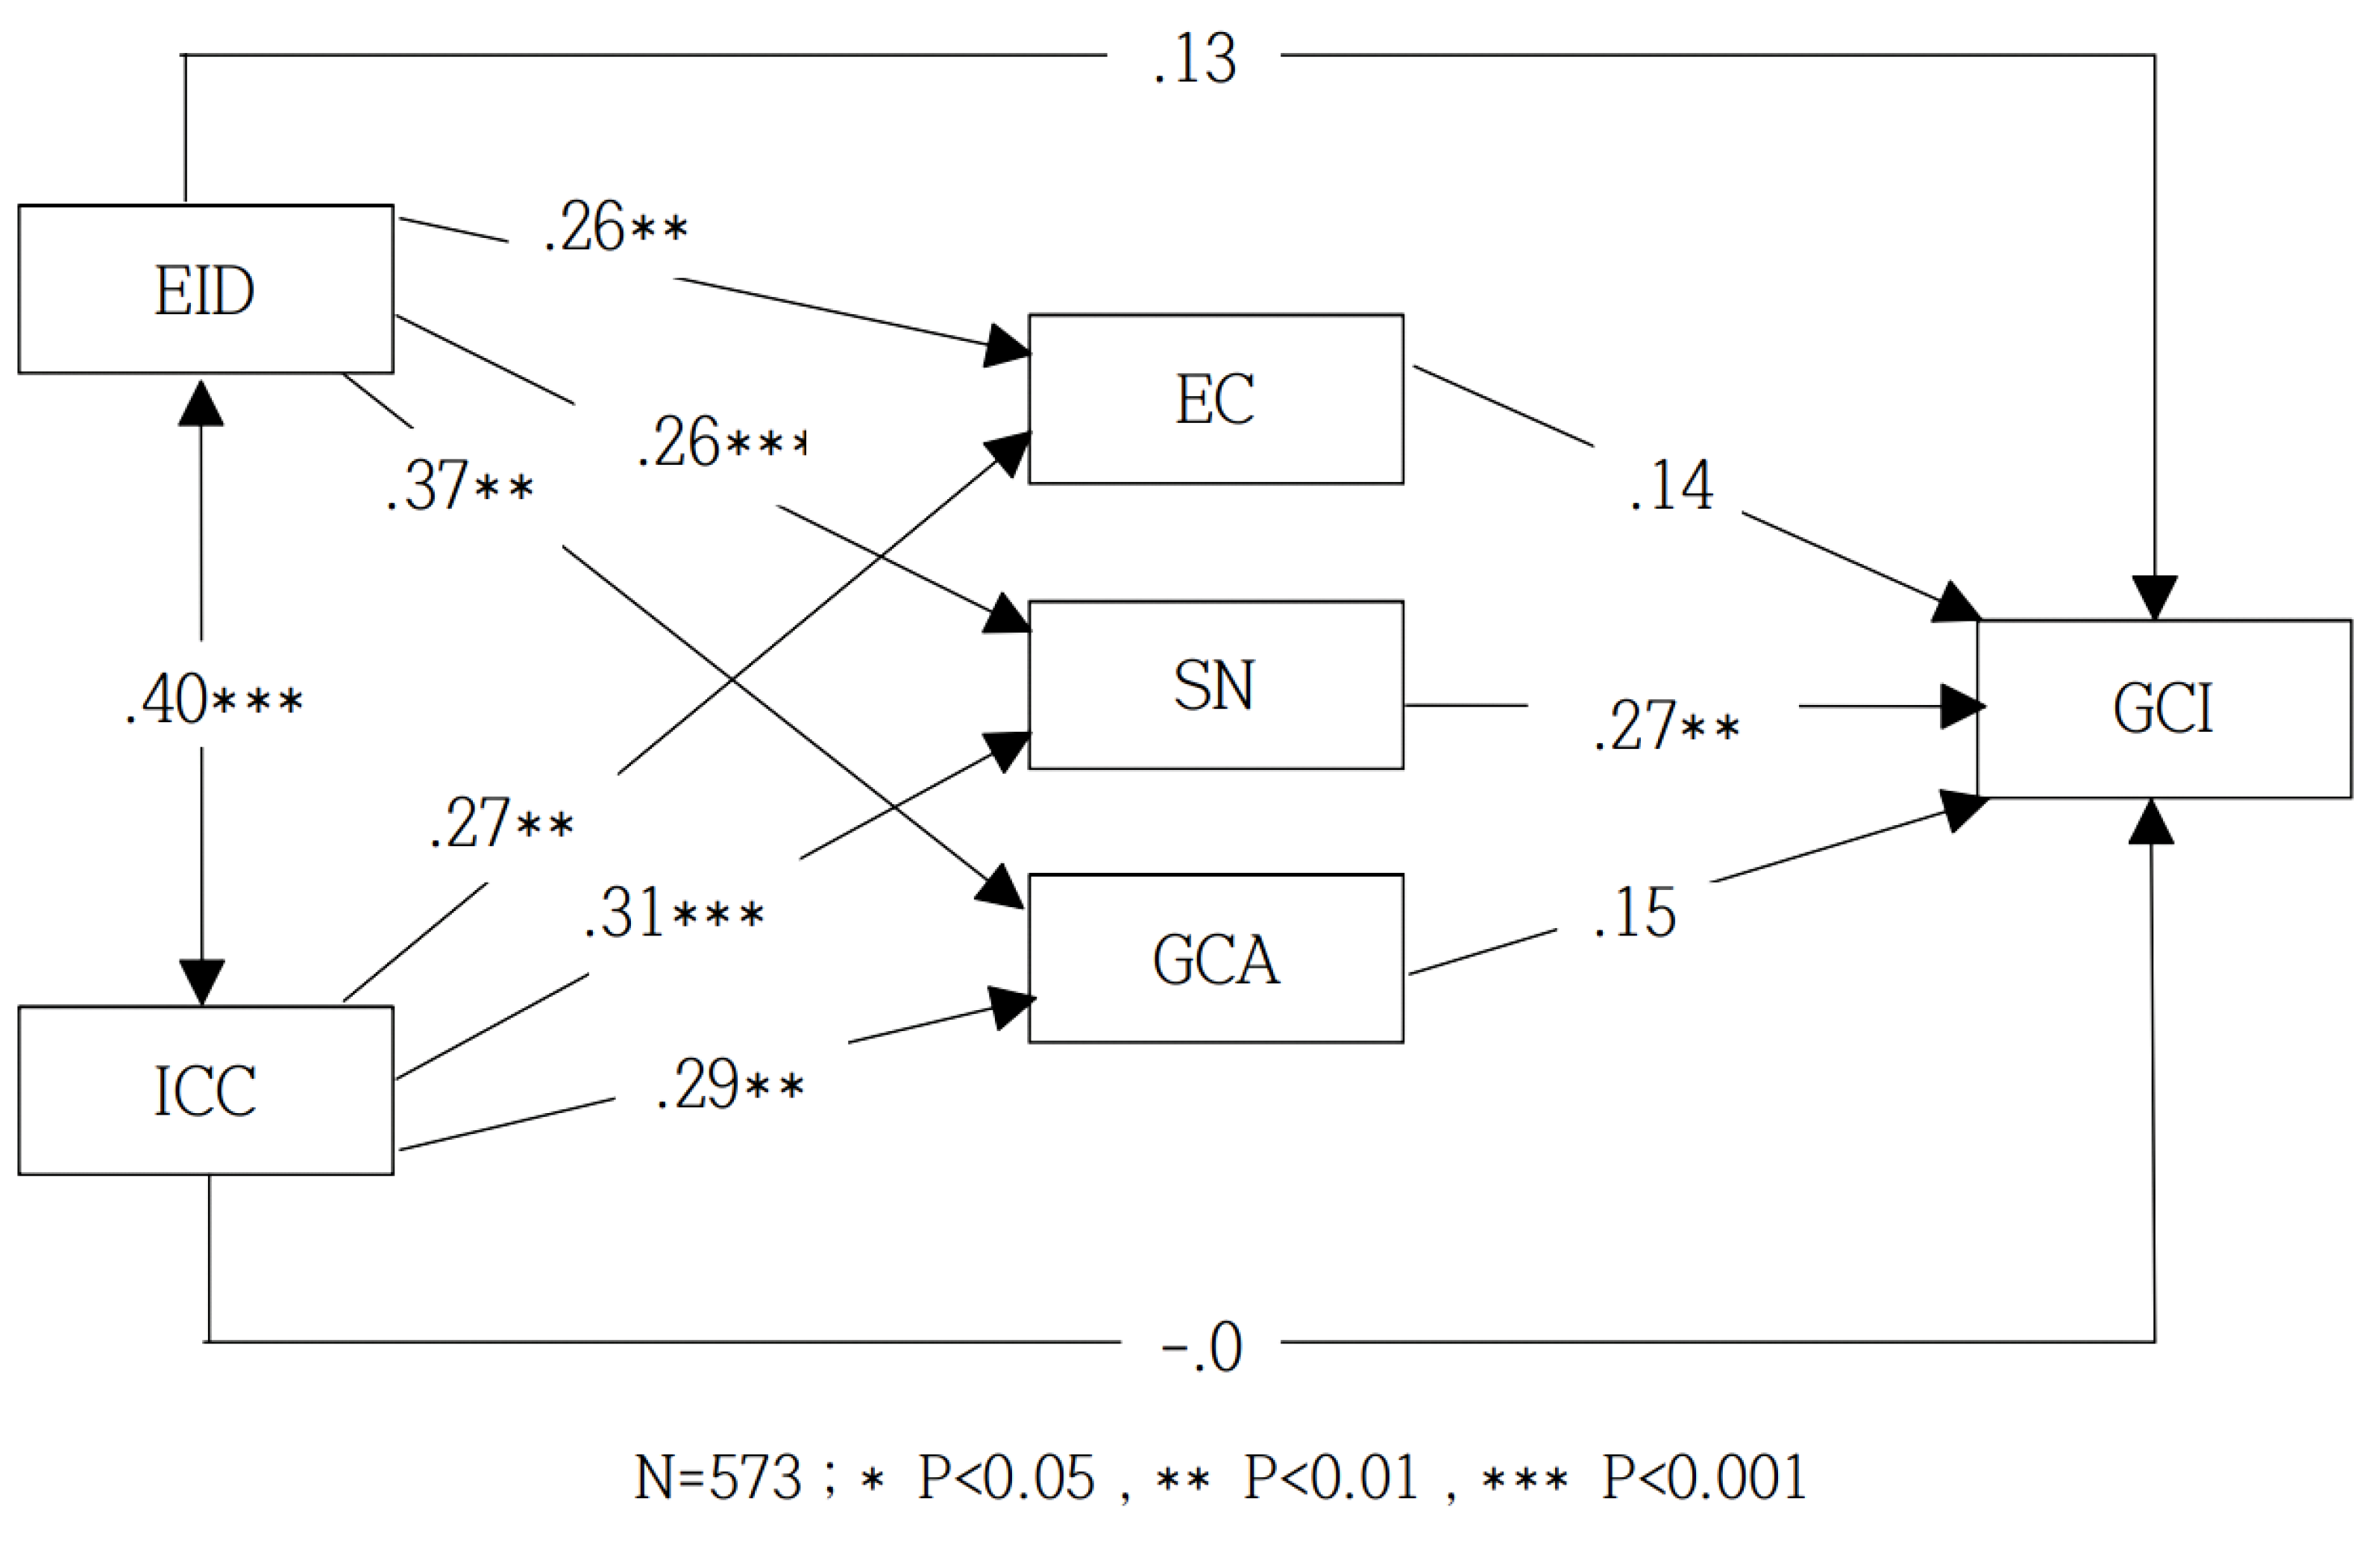

Table 1.
Distribution Description of Sample Characteristics.
| Variable | Option | Frequency | Percentage |
|---|---|---|---|
| Gender | Male | 291 | 55.20% |
| GenderFemale | 236 | 44.80% | |
| Age | ≤20years | 132 | 25.00% |
| Age21 to 30 years | 153 | 29.00% | |
| Age31 to 40 years | 171 | 32.40% | |
| Age41 to 50 years | 53 | 10.10% | |
| Age≥51 years | 18 | 3.40% | |
| Marital Status | Single | 294 | 55.80% |
| Marital Status Married | 187 | 35.50% | |
| Marital Status Divorced | 46 | 8.70% | |
| Education Level | Middle school or below | 30 | 5.70% |
| Education Level High school | 134 | 25.40% | |
| Education Level Bachelor's degree | 217 | 41.20% | |
| Education Level Master's degree | 98 | 18.60% | |
| Education Level Doctoral degree | 48 | 9.10% | |
| Monthly Income Level | ≤6000RMB | 216 | 41.00% |
| Monthly Income Level 6000-10000RMB | 100 | 19.00% | |
| Monthly Income Level 10000-14000RMB | 97 | 18.40% | |
| Monthly Income Level 14000-18000RMB | 50 | 9.50% | |
| Monthly Income Level 18000-22000RMB | 37 | 7.00% | |
| Monthly Income Level 22000-26000RMB | 14 | 2.70% | |
| Monthly Income Level 26000-30000RMB | 9 | 1.70% | |
| Monthly Income Level ≥30000RMB | 4 | 0.80% |
Table 2.
Reliability Analysis of Scales.
| Variable | Cronbach's α | Number of Items |
|---|---|---|
| Environmental Information Disclosure Indicator | 0.892 | 7 |
| Information Communication Channel Indicator | 0.89 | 7 |
| Subjective Norms | 0.831 | 4 |
| Environmental Concern | 0.892 | 5 |
| Green Consumption Attitude | 0.781 | 3 |
| Perceived Behavioral Control | 0.974 | 7 |
| Brand Reputation | 0.967 | 5 |
| Green Consumption Intention | 0.867 | 6 |
| Overall | 0.899 | 44 |
Table 3.
Model Fit Evaluation.
| Index | Reference Standard | Actual Result |
|---|---|---|
| CMIN/DF | 1-3 indicates excellent, 3-5 indicates good | 1.307 |
| RMSEA | <0.05 indicates excellent, <0.08 indicates good | 0.024 |
| IFI | >0.9 indicates excellent, >0.8 indicates good | 0.982 |
| TLI | >0.9 indicates excellent, >0.8 indicates good | 0.981 |
| CPI | >0.9 indicates excellent, >0.8 indicates good | 0.982 |
Table 4.
Model Fit Evaluation.
| Path (Latent Variable) | Point Estimate (Effect) | Standard Error (SE) | t Value (t) | p Value (p) | Bias-corrected 95% CI Lower Limit (LLCI) | Bias-corrected 95% CI Upper Limit (ULCI) | Percentile 95% CI Lower Limit (BootLLCI) | Percentile 95% CI Upper Limit (BootULCI) |
|---|---|---|---|---|---|---|---|---|
| Total Effect | 0.2872 | 0.0404 | 7.106 | 0 | 0.2078 | 0.3666 | ||
| (HB -> YY) | ||||||||
| Direct Effect (HB -> YY) | 0.1376 | 0.043 | 3.201 | 0.0015 | 0.0531 | 0.222 | ||
| Indirect Effect (HB -> TD -> YY) | 0.0463 | 0.0198 | 0.0096 | 0.0874 | ||||
| Indirect Effect (HB -> ZG -> YY) | 0.0648 | 0.0178 | 0.0337 | 0.1019 | ||||
| Indirect Effect (HB -> HJ -> YY) | 0.0385 | 0.0163 | 0.0098 | 0.0732 | ||||
| Total Indirect Effect | 0.1497 | 0.0278 | 0.0983 | 0.209 |
Disclaimer/Publisher’s Note: The statements, opinions and data contained in all publications are solely those of the individual author(s) and contributor(s) and not of MDPI and/or the editor(s). MDPI and/or the editor(s) disclaim responsibility for any injury to people or property resulting from any ideas, methods, instructions or products referred to in the content. |
© 2025 by the authors. Licensee MDPI, Basel, Switzerland. This article is an open access article distributed under the terms and conditions of the Creative Commons Attribution (CC BY) license (http://creativecommons.org/licenses/by/4.0/).
Copyright: This open access article is published under a Creative Commons CC BY 4.0 license, which permit the free download, distribution, and reuse, provided that the author and preprint are cited in any reuse.


